Greenhouse Gas Mitigation Opportunities in California
29
NICHOLAS INSTITUTE REPORT NICHOLAS INSTITUTE FOR ENVIRONMENTAL POLICY SOLUTIONS NI GGMOCA R 1 Greenhouse Gas Mitigation Opportunities in California Agriculture Science and Economics Summary February 2014 Tibor Vegh Lydia Olander Brian Murray Nicholas Institute for Environmental Policy Solutions, Duke University
Transcript of Greenhouse Gas Mitigation Opportunities in California

NICHOLAS INSTITUTE REPORT
NICHOLAS INSTITUTEFOR ENVIRONMENTAL POLICY SOLUTIONS NI GGMOCA R 1
Greenhouse Gas Mitigation Opportunities in California Agriculture
Science and Economics Summary
February 2014
Tibor VeghLydia Olander Brian Murray
Nicholas Institute for Environmental Policy Solutions, Duke University


Nicholas Institute for Environmental Policy SolutionsReport
NI GGMOCA R 1February 2014
Greenhouse Gas Mitigation Opportunities in California Agriculture
Science and Economics Summary
Tibor VeghLydia OlanderBrian Murray
Acknowledgments Support for this report series was provided by the David and Lucile Packard Foundation.
How to cite this reportTibor Vegh, Lydia Olander, and Brian Murray. 2014. Greenhouse Gas Mitigation Opportunities in
California Agriculture: Science and Economics Summary. NI GGMOCA R 1. Durham, NC: Duke University.
Nicholas Institute for Environmental Policy Solutions, Duke University

REPORTS IN THE SERIES Greenhouse Gas Mitigation Opportunities in California Agriculture: Science and Economics Summary NI GGMOCA R 1 Greenhouse Gas Mitigation Opportunities in California Agriculture: Outlook for California Agriculture to 2030 NI GGMOCA R 2 Greenhouse Gas Mitigation Opportunities in California Agriculture: Review of California Cropland Emissions and Mitigation Potential NI GGMOCA R 3 Greenhouse Gas Mitigation Opportunities in California Agriculture: Review of California Rangeland Emissions and Mitigation Potential NI GGMOCA R 4 Greenhouse Gas Mitigation Opportunities in California Agriculture: Minimizing Diet Costs and Enteric Methane Emissions from Dairy Cows NI GGMOCA R 5
Greenhouse Gas Mitigation Opportunities in California Agriculture: Review of Emissions and Mitigation Potential of Animal Manure Management and Land Application of Manure NI GGMOCA R 6 Greenhouse Gas Mitigation Opportunities in California Agriculture: Review of the Economics NI GGMOCA R 7

3
ABSTRACT California Assembly Bill 32 (AB32) requires effective statewide greenhouse gas (GHG) reduction strategies, for which the California Air Resources Board is developing an implementation scoping plan. To inform that plan, this report summarizes the results of six studies that review the latest science and economics of GHG mitigation opportunities in California’s agricultural sector. Specifically, the report examines the potential for annual GHG reductions in cropland, rangeland, and manure management systems and through emissions-targeted optimization of feed for dairy animals. Among the examined practices, dairy manure management appears to provide the largest emissions reduction opportunity at the lowest cost per ton, but economic, regulatory, and institutional hurdles must be overcome to realize it. Other mitigation activities, for example, specialty crop management, could yield relatively large per-acre emissions reductions, but the acreage on which they can be implemented is relatively small. Yet other activities, for example, rangeland management, could be more widely implemented, but their potential effectiveness is relatively uncertain. To take advantage of GHG mitigation opportunities within California agriculture, policy makers will need more data on the GHG reduction potential and costs of management practices and a better understanding of adoption barriers.
Acknowledgments
The authors thank Melissa Edeburn, Emily Schieffer, and Wenjing Shi for their help in preparing this report series for publication.

4
CONTENTS
INTRODUCTION ...................................................................................................................... 5
STATE OF CALIFORNIA AGRICULTURE, WITH AN OUTLOOK TO 2030 ....................................... 6 Current Profile of California Agriculture .................................................................................................. 6 Broad Trends in California Agriculture ..................................................................................................... 8 Projections for the California Dairy Sector ............................................................................................... 8
GHG EMISSIONS FROM CALIFORNIA AGRICULTURE .............................................................. 10
GHG MITIGATION OPTIONS IN CALIFORNIA AGRICULTURE ................................................... 11 Improved Manure Management ........................................................................................................... 11 Dairy Enteric Emissions Reduction ......................................................................................................... 12 Cropping Systems ................................................................................................................................... 14 Rangeland Systems ................................................................................................................................ 17
ECONOMICS OF MITIGATION OPTIONS ................................................................................. 18
CONCLUSIONS ...................................................................................................................... 22

5
INTRODUCTION This report summarizes the main findings of a series of six reports on greenhouse gas (GHG) mitigation options for agricultural systems in California. The reports were developed to provide updated reviews of the science and economics of mitigation options to support the Scoping Plan Update of the California Air Resources Board (CARB 2013). One report provides alternative scenarios for California agriculture by 2030; four reports investigate mitigation opportunities in croplands, rangelands, livestock enteric emissions, and manure management, respectively. The final report presents data on the costs and economic adoption factors for some of these GHG mitigation options. Table 1 lists agricultural systems and management activities reviewed in the reports and which together represent more than 90% of California’s agricultural emissions (CARB 2011). The Scoping Plan Update reviews systems in other sectors, including replacement of fossil energy with bioenergy crops and fuel and energy use by the agricultural sector. Table 1. Greenhouse Gases Managed in California Agricultural Sectors and Relevant Management Activities Agricultural sector / source GHG managed / mitigated Management activity
Cropping systems
N2O and CO2 Expansion of perennial crops
N2O Nitrogen fertilizer application rate
N2O Nitrogen fertilizer source selection
N2O Nitrogen fertilizer placement
N2O Nitrogen fertilizer timing
N2O Nitrogen fertilizer efficiency enhancer use
CO2, N2O Irrigation
CO2, N2O Conservation tillage and no-‐till systems
CO2, N2O Cover crops and organic amendments
CH4, N2O Rice management
Land use change CH4, N2O, CO2 Farmland preservation
Rangeland systems
CO2 Grazing management
CO2, CH4, N2O Fire management
CO2, N2O Soil amendments
CO2 Mowing
CO2, N2O Aeration and tillage
CO2, N2O Irrigation
CO2, N2O Plant community composition
Dairy enteric CH4 emissions CH4 Diet management
Manure management CH4, N2O Emplacement of natural or induced crust
CH4, N2O Sealed containment with gas flaring (simple anaerobic digestion)

6
CH4, N2O Advanced aerobic digestion with biogas collection for energy production
CH4, N2O Reduction of manure volume in liquid storage systems
CH4, N2O Use of manure instead of synthetic fertilizer STATE OF CALIFORNIA AGRICULTURE, WITH AN OUTLOOK TO 2030 Report 2 of this series—Sumner (2014)—presents the current profile of and broad trends in California agriculture as well as projections for the state’s dairy industry. Current Profile of California Agriculture Any policies affecting agriculture’s role in California’s GHG mitigation strategy must acknowledge the sector’s economic importance to California. Approximately, 6.7% of the private sector labor force is employed in agricultural industries, and one-quarter of the state’s landmass is used for agriculture (UC AIC 2012). California is the largest dairy producer in the United States and grows more than 200 crop varieties, many of which are specialty crops. California has a well-developed infrastructure of irrigation and other input delivery systems as well as processing and other marketing services. California farms and ranches draw from the state’s great variety of natural and climate resources to produce a wide range of major crop and livestock commodities that are consumed within the state and exported throughout the world (see Figure 1). Changes in the production of commodities reflect changes in markets, environmental conditions (including water scarcity and pests), competition for land from urban and developed uses, and public policies and regulations. Figure 1. California Livestock and Agriculture Cash Receipts, 2010–2012
Source: USDA Economic Research Service, Farm Income and Wealth Statistics.
Livestock 28%
Fruit 23%
Vegetables and Melons 18%
Nuts 15%
Greenhouse and Nursery 8% Field Crops
8%

7
Livestock commodities contribute 28% of the value of California agricultural output, which averaged about $41 billion annually from 2010 to 2012. The dairy industry, which produces milk and cream, contributes more than 60% of that value. All crop categories contribute significantly to total cash receipts, but field crops, which dominate in most other major farm states, are the smallest category in California. Grapes, almonds, and greenhouse and nursery crops are important sources of revenue in California. Like perennial crops, individual annual crops such as strawberries and lettuce are also major sources of revenue. Dairy accounts for about 20% of California’s agricultural revenue and half the state’s agricultural GHG emissions (CARB 2011). The largest component of the state’s agricultural gross revenue, dairy has the largest GHG impact due to its close connection to forage production and the rest of the cropping industry as well as to direct emissions from dairy cows and the manure they produce. A change in key dairy industry indicators such as number of cows, milk production per cow, and forage acreage would have direct and indirect effects on GHG emissions. Alfalfa and corn silage, most of which is used for dairy cows, account for nearly one-quarter of California’s irrigated cropland and use large amounts of water per acre. No single crop or set of rotation crops dominates in land area (Table 2). When relative prices and profitability among crops change, crop acreages respond accordingly. The exceptions are small acreage crops such as strawberries or avocadoes, which use a large share of the locally suitable land, and the cow-calf industry, which uses rangeland with little or no other commercial use, limiting substitution. Assuming that acreages are flexible in the long run, forecasts must assess the main demand-side drivers and the likely drivers of changes in relative cost conditions across commodities. Table 2. Crop Acreage and Acreage Shares for Major California Crops Product 2008 2009 2010 Share in 2010
1,000 acres
Hay, Alfalfa 1,030 1,000 930 12.9
Almonds 680 720 740 10.3
Rice 517 556 553 7.7
Hay, Others 580 540 550 7.6
Grapes, Wine 482 489 489 6.8
Wheat 545 500 455 6.3
Corn, Silage 495 385 425 5.9
Cotton 268 186 303 4.2
Tomatoes, Proc. 279 308 270 3.8
Walnuts 223 227 227 3.2
Grapes, Raisin 221 216 216 3.0
Lettuce, All 220 204 203 2.8
Oranges, All 188 186 183 2.5
Corn, Grain 170 160 180 2.5
Pistachios 118 126 137 1.9
Broccoli 116 117 123 1.7
Grapes, Table 83 84 84 1.2
Barley 60 55 75 1.0

8
Dry Beans 52 69 63 0.9
Plums, Dried 64 64 63 0.9
Avocados 66 65 58 0.8
Carrots 64 62 57 0.8
Peaches 56 53 50 0.7
Lemons 47 47 46 0.6
Onions 45 44 42 0.6 Source: USDA-‐NASS (2013). Note: These 25 crops represent all crops accounting for more than 0.5% of acreage in 2010. Not in this table are several high-‐value-‐per-‐acre crops, such as strawberries and some vegetables. Exports play an increasingly important role in California agriculture. Major export commodities are dairy and other livestock products, almonds, fruits, and field crops. Vegetables remain mostly in the U.S. market, with the exception of shipments to Canada. The Mexican economy has emerged as the fifth largest export market for California agriculture. California products are starting to penetrate high-growth developing countries, such as China and India, which may become major markets for California farm exports by 2030. The most important economic issue facing California agriculture is future changes in the competitiveness of the California dairy industry relative to producers in the rest of the United States and in other countries. Broad Trends in California Agriculture The land used for crops has declined despite high commodity prices (USDA-NASS 2013) due to a combination of increased productivity and competition from alternative land uses driven by urbanization and environmental concerns. Irrigation water has been under intense supply pressure, which is expected to increase with climate change. Future water use is expected to decrease, resulting in reductions in low-value crops (such as corn), forage, and alfalfa, which use more water per acre than other crops (Howitt, MacEwan, Medellín-Azuara, and Lund 2010; Sumner 2014). Even if agricultural water demands are met, water scarcity and operating costs could rise, and decreased local water delivery could fall as well, with significant economic impacts (Medellin-Azuara et al. 2008). Federal farm subsidies, hired-farm-labor regulations, dairy price regulations, and air and water quality regulations all affect California agriculture by modifying revenues and cost streams in the sector (UC AIC 2009). Potentially more important factors are labor and environmental regulations that affect processing costs and, by extension, the price of and demand for farm commodities. Any cost increases specific to California producers may be difficult to pass on to consumers, who can switch to other producers if California producers raise prices. California producers are also subject to developments in national and global markets, such as the emergence of new producing regions (e.g., in South America and Africa) or surges in demand for certain commodities, such as certain feedstocks used to meet biofuel demands in the United States and Europe. Projections for the California Dairy Sector Sumner (2014) provides formal econometric projections of trends to 2030 in the economically important and GHG-emissions-significant dairy sector. In California agriculture as a whole, short-term trends reflect current constraints and account for acreage already planted to perennial crops. Expectations about long-term forecasts of commodity production affect current payoffs to agricultural and GHG mitigation investments. Annual weather shocks, pest outbreaks, and demand fluctuations can dominate trends but are generally difficult to predict. Longer-term forces affect the economic, regulatory and resource landscape both domestically and globally. Time
9
series models incorporate past trends into forecasts that assume continuation of commodity trends and patterns. These forecasts must reflect typical crop rotations and economic relationships such as the link between forage crops and dairy production. More informal considerations of supply, demand, relative costs, regulations, and resource constraints should be coupled with formal forecasts. According to Sumner’s econometric baseline projection for the dairy sector through 2030, milk production per cow and cow numbers will remain steady or decrease slightly. Alfalfa acreage will increase for a few years, then stabilize at about one million acres. Consistent with recent trends and with the projected increase in cow numbers, silage acreage increases by more than 10,000 acres per year to nearly 750,000 acres. All key dairy sector variables also increase. For example, milk per cow rises by about 15%, and number of cows rises by about 25%. Total forage increases and then flattens just below 1.5 million acres. On the basis of these formal model forecasts reflecting a continuation of key trends, Sumner develops three plausible alternative scenarios—slow growth, no growth, and trend growth—for the dairy industry and consequent changes in forage production (Table 3).
• A no-growth scenario is consistent with challenges in establishing or expanding dairies due to environmental regulation (see, e.g., CEPA-CVRWQCB 2013) or other limiting factors such as water availability. As milk production per cow increases at about 1% per year, cow numbers fall by about 20% by 2030, resulting in a decrease of GHG emissions by about 3.25 million metric tons CO2e per year. Also as a result of the decline in cow numbers, alfalfa hay, silage, and other hay acreages fall by 15%, 20%, and 10%, respectively. Alfalfa acreage is likely to be replaced by other crops. With a one ton per acre difference in emissions,1 the 20% decrease in alfalfa acreage increases GHG emissions by about 0.18 million metric tons CO2e.
• A slow-growth scenario is consistent with a slightly declining dairy cow herd in recent years (CDFA 2013). In this scenario, cow numbers decrease by about 0.5% per year, but as milk production per cow continues to increase, so does total milk production. A slight decrease in forage acreage increases perennial crop acreage. With a 10% reduction in dairy cow numbers, GHG emissions fall by about 1.6 million metric tons CO2e per year. With 15% of alfalfa acreage replaced by other crops, GHG emissions increase by about 0.13 million metric tons CO2e.
• A trend-growth scenario increases cow numbers by about 50%, resulting in a 40% increase in dairy GHG emissions to 8 million metric tons CO2e, roughly equivalent to California’s total annual crop emissions. A necessary 5% increase in forage acreage results in an emissions decrease of 0.04 million metric tons CO2e. Expansion of forage acreage also results in crop mix changes and in water and land use changes in general.
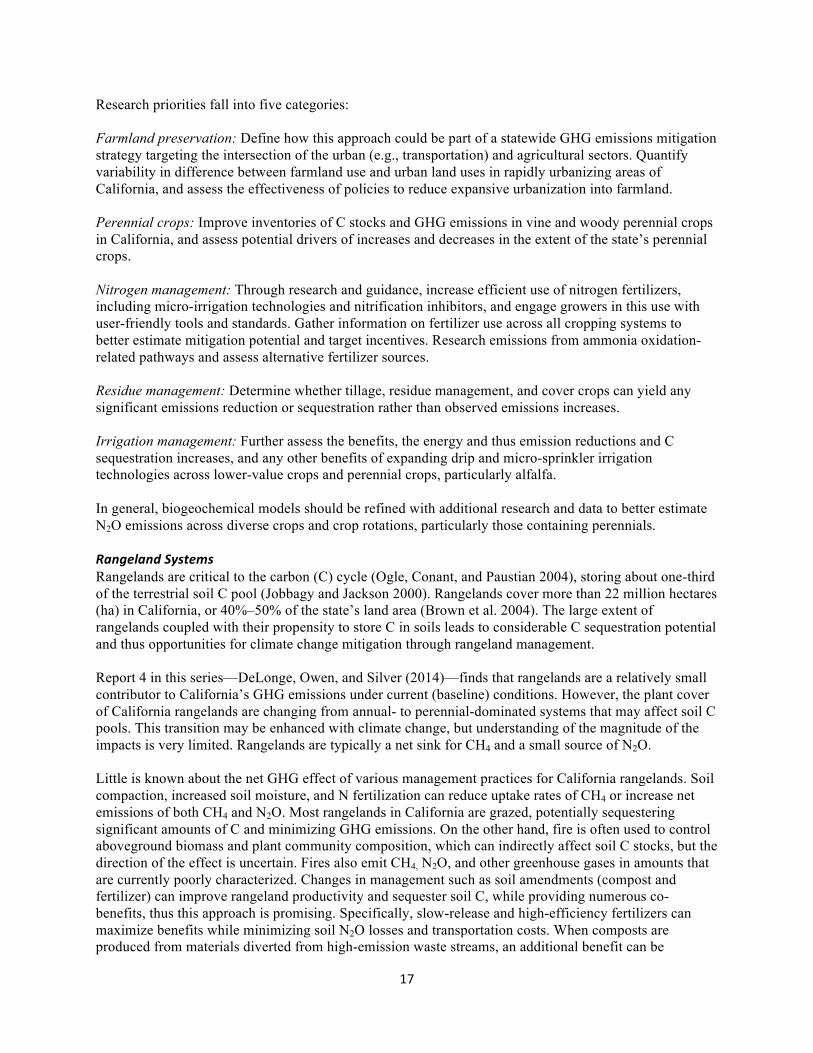
In summary, under the no-growth scenario, total GHG emissions from dairy fall to 13 Tg (teragrams, or million metric tons), a decline of more than 3 Tg compared with 2009 levels. Under the slow-growth scenario, these emissions fall by 10% to 14.70 Tg. Under the high-growth scenario, they increase to 24.38 Tg, or about 25% of the total GHG emissions from California agriculture in 2009. Table 3. Projections for California Dairy GHG Emissions under Three Scenarios Current Dairy projection to 2030 2009 No
growth Slow growth
Trend growth (20-‐year trend)
Percent change in cow numbers -‐ -‐20% -‐10% 40% Implied number of cows (millions) 1.80 1.44 1.6 2.5 Implied total GHG from dairy (MMT) 16.25 13.0 14.6 22.6
1 Calculated as the average per-‐acre GHG emissions attributed to California crop residue burning and nitrogen fertilization, according to CARB (2011) as summarized by Lee and Sumner (2014).

10
GHG EMISSIONS FROM CALIFORNIA AGRICULTURE Because California regulates GHG emissions across multiple sectors of its economy, it is a testing ground for how certain forms of GHG mitigation could play out elsewhere in the United States—for example, through state-level action required by the federal Clean Air Act (Monast et al. 2012)—and across the world. Its cap-and-trade program instituted under the AB 32 legislation places a cap on emissions from major stationary sources such as power plants and factories, and its low-carbon fuel standard controls emissions from transportation fuels. Although emissions from agriculture are not directly regulated by an emissions cap, farmers can provide mitigation through voluntary offsets,2 which can be sold through an emissions trading system to directly regulated sources in California, helping the latter meet their emissions reduction requirements at lower cost than they could achieve within their own operations. Alternatively, agricultural emissions could be reduced through other financial incentives not directly tied to an emissions trading program. Either way, farmers and policy makers need reliable information on the mitigation potential and cost of various GHG mitigation options within the larger context of sectoral and fundamental trends, including climate change. In 2009, California emitted a total of 457 Tg CO2e across all economic sectors (CARB 2011). Of this total, the agriculture sector emitted 32.1 Tg CO2e, or 7% of the state’s total. The distribution of various greenhouse gases from California agriculture differs substantially from that of the state’s total emissions. For example, nitrous oxide (N2O) emissions only made up 3% of total emissions across all sectors, but 33% of emissions from the agricultural sector (Table 4), largely through nitrogen-based fertilizer use and manure management. Similarly, carbon dioxide (CO2) accounts for a smaller proportion of emissions in agriculture (9%) than it does across all the state’s economic sectors (86%). Finally, methane (CH4) accounts for 58% of agricultural emissions and around 10% of overall emissions. Table 4. California Agricultural GHG Emissions by Gas in 2009 and the 10-‐Year Average 2009 2000–2009 Average Greenhouse Gas Tg CO2e (% of Total) Tg CO2e CH4 18.7 (58%) 17.1 CO2 2.8 (9%) 4.3 N2O 10.6 (33%) 10.4 Total 32.1 31.8 Source: CARB (2011). Three sources account for nearly 90% of total GHG emissions from California agriculture (Table 5Error! Reference source not found.): manure management (32%), largely from confined animal operations; enteric fermentation (fermentation that takes place in the digestive system of animals) (28.9%); and agricultural soil management (the practice of using fertilizers, soil amendments, and irrigation to optimize crop production) (28.1%). These sources plus energy use from agricultural activities (8.2%) make up more than 97% of emissions from agriculture (CARB 2011).
2 Offsets from cap-‐and-‐trade policies or the California Environmental Quality Act (CEQA) requirements.

11
Table 5. California Agricultural Emissions by Source in 2009 Agricultural Source 2009 Emissions (Tg CO2e) Percentage of Total
Manure management 10.34 32.2
Enteric fermentation 9.28 28.9
Soil management 9.02 28.1
Energy use 2.63 8.2
Rice cultivationa 0.58 1.8
Histosol cultivationb 0.16 0.5
Residue burning 0.06 0.2 Source: CARB (2011). a Primarily methane emissions. b Primarily N2O emissions combined with loss of soil C as CO2.
GHG MITIGATION OPTIONS IN CALIFORNIA AGRICULTURE A comprehensive GHG mitigation strategy requires consideration of the relative mitigation potential and cost-effectiveness of GHG mitigation opportunities related to manure management, enteric methane emissions from dairy cows, and cropland and rangeland systems. Improved Manure Management Emissions from livestock manure are estimated to be the greatest contributor to California’s agricultural GHG emissions, accounting for 32.3% of the total (Error! Reference source not found.Table 5; CARB 2011). Dairy manure emissions account for more than 97% of the methane produced (Table 6; CARB 2011). Report 6 in this series—Owen, Kebreab, and Silver (2014)—assesses GHG emissions associated with on-farm manure management and those associated with manure application to agricultural fields and rangelands. Table 6. Estimated GHG Emissions for 2010 from Manure Management in Different Livestock Industries in California
Methane Emissions (Tg CO2e) Nitrous Oxide Emissions (Tg CO2e)
Dairy cattle 8.40037 1.12594 Beef cattle 0.02571 0.28108 Poultry 0.10508 0.04967 Swine 0.03588 0.00284 Goats 0.00008 0.00121 Horses 0.00398 0.02399 Sheep 0.00281 0.02354 Total 8.57392 1.50826 Source: CARB (2011). GHG emissions models for dairies in states other than California have been developed, but how accurately they represent California dairies is unclear. If results from other states are applicable, emissions reductions from liquid manure management systems, particularly CH4 from anaerobic lagoons, represent a promising opportunity (Owen, Kebreab, and Silver 2014). Several options are available for CH4 reduction from anaerobic lagoons and slurry systems (Gerber et al. 2013). Manure emissions could be decreased by more than an estimated 90% if lagoons are capped and their methane emissions are flared

12
or farms transition to anaerobic digesters. These digesters capture biogas produced through anaerobic decomposition of organic material. Land application of manure instead of synthetic fertilizer can potentially eliminate the need for inorganic fertilizer and increase soil carbon (C). Most livestock manure is eventually applied to agricultural fields, but application on rangelands may be a climate change mitigation strategy. Rates of manure application to agricultural fields on dairies are now limited by estimates of plant nutrient demand to avoid losses of excess nutrients. Thus, application to rangelands may be a viable alternative with the co-benefits of increasing forage production and soil carbon sequestration (DeLonge, Owen, and Silver 2014). Sequestration of C in the soil also decreases the emission of CO2 and CH4 associated with manure decomposition. However, using manure rather than inorganic fertilizers also has challenges. One of the greatest is that a large portion of the nitrogen (N) in manure is in organic form and is released more slowly and less predictably to the soil through decomposition compared to inorganic fertilization (Van Kessel and Reeves 2002). Modeling tools that can estimate GHG emissions from land application of manure are being refined and parameterized for California. Early results suggest that using manure rather than synthetic fertilizer could result in a decrease of 0.5-4 Mg CO2e ha-1 y-1. However, this estimate doesn’t take into account possible emissions from the application practice. No study has measured or modeled GHG emissions from the most common land application practice on California dairies: furrow irrigation with diluted lagoon effluent, which may promote increased emissions of both CH4 and N2O. The costs and benefits of different application strategies need further evaluation. Lagoon covering and methane flaring represent a low-cost mitigation opportunity per unit of methane emissions (Lee and Sumner 2014). Compared with anaerobic digesters, this strategy presents lower costs and complexity. But lack of feasibility studies and uncertainty about air and water quality regulation and about co-benefits (e.g., odor reduction) have limited its adoption. The viability of digester projects depends on accurate estimates of their future costs and benefits as well as on site-specific factors. In California, anaerobic digesters generally present a large GHG mitigation opportunity, given the large quantity of emissions from manure management. But regulatory constraints will affect their economic feasibility. Surveys of manure management practices are needed for all of California’s major dairy regions to identify baseline trends in manure management and the current emissions from common management practices. California-specific measurements of GHG fluxes from alternative manure management practices are critical, particularly measurements from anaerobic lagoons on dairies, anaerobic digesters, fields with furrow irrigation and fertilization, and land application of manure and anaerobic digester effluent. These data are needed to improve GHG emissions estimates and to identify best management practices for mitigation. They are also needed to improve estimates from mitigation process-based models, which must be parameterized for the range of manure management practices, crops, and irrigation systems found in California. Dairy Enteric Emissions Reduction In California, enteric CH4 emissions represent about 47% of livestock-related emissions (CARB 2011). Report 5 in this series—Moraes, Fadel, Castillo, and Kebreab (2014)—reviews the literature on GHG mitigation options from enteric emissions reduction. Gerber et al. (2013) showed that dietary manipulation has a potential to mitigate CH4 emissions from livestock. Some of the options relevant to California are improving feed digestibility and use of highly digestible concentrates, dietary lipid supplementation, and use of ionophores such as monensin and tannins (possibly from grape pomace).
13
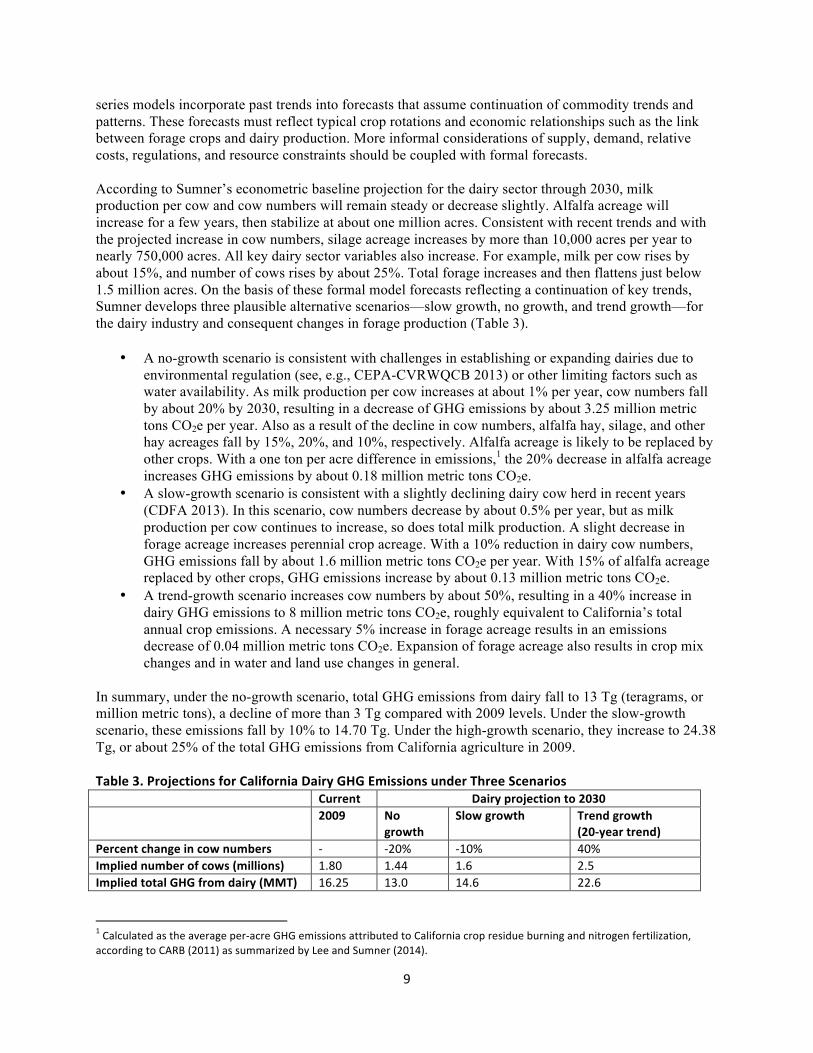
A report of the Economic and Technology Advancement Advisory Committee (ETAAC 2008) to the California Air Resources Board suggested that feeding to National Research Council (NRC) guidelines can reduce enteric CH4 emissions by up to 16%. To assess the potential of dietary changes to reduce emissions and to predict what these dietary changes might look like in terms of dietary composition and dry matter intake, Moraes et al. (2013) developed two linear and goal programming (LP) models. They compared an LP scenario that minimized diet costs while meeting NRC feeding guidelines and one that minimized CH4 emissions to a baseline scenario based on data from Castillo, St-Pierre, Silva del Rio, and Weiss (2013). This baseline scenario provided a point of comparison for a goal programming model that jointly minimized the potentially conflicting targets. The researchers found that total CH4 emissions are only 1% higher in the least-cost scenario than under current practices (the baseline scenario), suggesting that farmers are already feeding according to the NRC guidelines. Total CH4 emissions decreased by 23.6% from the baseline scenario in the minimum CH4 scenario and by 24.3% compared with the least-cost diet scenario, but total diet costs increased 35.5% compared with the least-cost diet scenario. Figure 2 illustrates the trade-offs between reducing dietary costs and CH4 emissions, showing that higher levels of emissions mitigation incur higher per-ton marginal costs. Figure 2. Total Methane Mitigated in Least-‐Cost Diet and Minimum CH4 Scenarios Compared with the Baseline Scenario
Linear programming models can be improved by including a random sampling of dairy farms and more complete feed analysis and accurate diet costs. Future studies should take a holistic approach, which includes analysis of feed, manure (volume and content), and level of production (milk or meat), to examine synergy/antagonism among mitigating agents. Regarding animal diets, the CH4 mitigating effects of ionophores should be studied by including the benefits of increasing the efficiency of converting dietary energy into products. This way the true cost of ionophore (e.g., monensin) supplementation can be assessed. Dietary interventions such as lipid and concentrate supplementation must be carefully balanced against their potentially negative impact on fiber digestibility, feed intake, and animal productivity. Because types of lipid supplementation may affect emissions, studies are needed to examine saturated versus unsaturated fat supplementation as well as mode of action.
$4.50
$5.00
$5.50
$6.00
$6.50
$7.00
0 1 2 3 4 5 6
Diet cost p
er day
Methane emissions mi`gated (MJ/d)

14
In California, grape pomace could be used as cattle feed. Grape pomace contains tannins that have been shown to reduce enteric CH4 production. However, in high quantities, tannins impair nitrogen metabolism. Therefore, in vivo experiments should be conducted in California to investigate the level of tannin that should be supplemented to cattle to optimize production and reduce emissions. Cropping Systems Assessing strategies for agricultural GHG mitigation in California croplands is complicated by the large variety of crops produced. Many of these crops are specialty crops about which peer-reviewed research and publically available data on mitigation opportunities is quite limited (Olander et al. 2011). However, the university research community and some commodity groups in the state are beginning to generate California-specific data. Report 3 in this series—Culman et al. (2014)—bases estimates of GHG mitigation potential in cropland systems on field and modeled studies of various management practices conducted within California and published in peer-reviewed literature (Table 7). It also reviews studies from similar climates in areas outside California. Where possible, the authors calculated minimum, mean, and maximum biophysical mitigation potential values for each activity (Table 8Table 8). Because a biophysical mitigation potential was not quantifiable for all management activities, they developed a more subjective scale—relative mitigation potential—to rate the impact that a particular activity might have on emissions reduction on annualized per-unit-area basis relative to other activities. They found that two activities, preservation of farmland and expansion of perennial crops, hold the most potential for mitigating GHG emissions. Average GHG emissions from urban land uses are orders of magnitude higher than those from California croplands (Haden et al. in press), thus farmland preservation could significantly reduce emissions. But emissions avoided by this approach do not come from reductions in the agricultural sector; they come from avoided emissions from urban activities such as transportation and residential and commercial energy use. Because many emissions categories in urban systems are covered under the California emissions cap, any effort to achieve mitigation through farmland preservation would need to consider how the state accounts for emissions reductions. Any growth strategy that preserved cropland would clearly need to be part of a comprehensive statewide strategy and would likely not work as an offset mechanism. Moreover, farmland preservation would have to be combined with policies to increase urban density, otherwise it would simply displace people to other “green field” locations and lead to emissions there. Conversion of annual crop to perennial systems can mitigate a relatively large amount of GHG emissions, but the magnitude of the reductions is highly uncertain. With 34% of California cropland devoted to annual crops, 2.9 million acres of annual cropland could theoretically be available for conversion to perennial agriculture, offering a large but unrealistic scenario for mitigation. The rate of conversion from annual to perennial acreages has leveled off in recent years (Sumner 2014). Improved management of nitrogen fertilization, improved irrigation practices, and conservation tillage practices may result in low to medium per-acre reductions in N2O emissions in California croplands. The effect of cover crop use and organic amendment on agricultural GHG emissions in California is not well understood. These practices offer opportunities to reduce synthetic N inputs and increase internal nutrient cycling efficiencies, but they may also increase direct N2O emissions. Improved irrigation practices could reduce N2O emissions, but over what acreage improved methods can be used in an economically and technically feasible manner is unclear. Emissions from California rice cultivation are approximately 0.01% of total statewide emissions, so although they are high per acre, the overall scope for their reduction is relatively low.

15
Table 7. GHG Emissions Studies Conducted in California Croplands for Various Management Activities
Management Activity Number
of Studies
Uncertainty about
Extrapolating Outside Studies to Californiaa
References
Farmland preservationb 2 Low – Medium Haden et al. (in press); Wheeler, Tomuta, Haden, and
Jackson (in press)
Expansion of perennial crops
5 Medium – High
Alfalfa (Burger and Horwath 2012); Almond (Smart, Suddick, and Pritchard 2006; Schellenberg et al. 2012;
Alsina, Fanton-‐Borges, and Smart 2013); Grape (Garland et al. 2011)
N fertilizer rate 2 Low Almond (Smart, Suddick, and Pritchard 2006);
Lettuce, Tomato, and Wheat (Burger and Horwath 2012)
N fertilizer source 1 Low – Medium Almond (Schellenberg et al. 2012) N fertilizer timing and placement 0 Low -‐-‐
N fertilizer efficiency enhancersc
0 Low -‐-‐
Irrigation practices 3 Medium Almond (Alsina, Fanton-‐Borges, and Smart 2013); Tomato (Kallenbach, Rolston, and Horwath 2010;
Kennedy 2012)
Conservation till or no tillage 7 High
Maize, Sunflower, Chickpea (Lee et al. 2009; Kong, Fonte, Kessel, and Six 2009); Tomato (Kallenbach,
Rolston, and Horwath 2010; Kennedy 2012); Grape (Steenwerth and Belina 2010; Garland et al.
2011); 9 modeled crops (De Gryze, Catala, and Howitt 2009)
Cover crops and organic amend.
6 Medium
Tomato (Burger et al. 2005; Kallenbach et al. 2010; Kennedy 2012; Smukler, O’Geen, and Jackson 2012); Grape (Steenwerth and Belina 2008); 9 modeled crops
(De Gryze, Catala, and Howitt 2009)
Rice management 5 Medium
Rice (Bossio, Horwath, Mutters, and Kessel 1999; Fitzgerald, Scow, and Hill 2000; Linquist, Kessel, and Hill 2010; Burger and Horwath (2012); Pittelkow et al. (in
review) a This uncertainty is intended reflect the relative confidence with which the study findings are applied to California croplands. The low-‐medium-‐high ratings are based on a variety of relevant factors associated with each management activity. b Farmland preservation is not viewed as an agricultural management activity, because GHG mitigation from farmland preservation is not from the agricultural sector. c These enhancers include polymer-‐coated fertilizers, nitrification inhibitors, and urease inhibitors.

16
Table 8. Summary of Biophysical Mitigation Potential for Various Management Activities on California Croplands
Biophysical Mitigation Potentiala
(t CO2e ha-‐1 yr-‐1)
Management Activity Predominant
Gases Involved
Min Mean Max Relative Mitigation
Potentialb
Farmland preservationc CO2, N2O,
CH4 -‐-‐ -‐-‐ -‐-‐ High
Expansion of perennial crops
CO2 N2O -‐-‐ -‐-‐ -‐-‐ Medium
N fertilizer rate N2O -‐-‐ -‐-‐ -‐-‐ Medium N fertilizer source N2O -‐0.16 0.33 1.85 Low – Medium N fertilizer timing and placement N2O -‐-‐ -‐-‐ -‐-‐ Low – Medium
N fertilizer efficiency enhancersd N2O -‐-‐ -‐-‐ -‐-‐ Low – Medium
Irrigation practices N2O 0.31 0.78 1.26 Low – Medium Conservation tillage or no tillage
N2O -‐0.69 0.04 0.65 Low
Cover crops and organic Amend. N2O -‐1.69 0.03 0.89 Low
Rice management CH4, N2O -‐0.13 1.49 2.52 Low – Medium a Biophysical mitigation potential values were calculated as the minimum, mean, and maximum of all values reported in the tables above with respect to management activity. Management activities without a value (-‐-‐) could not be calculated as a result of inability to reasonably constrain complexity to reasonably constrain (farmland preservation, expansion of perennial crops), inability to base measurements on a discrete rather than a continuous scale (N fertilizer source), lack of data for California (N fertilizer timing and placement, N fertilizer efficiency enhancers), or some combination of these three factors. b Relative mitigation potential reflects the impact that a particular management practice could have on emissions reduction on annualized per-‐unit-‐area basis relative to other management activities. Each category is defined as follows: low (<1 t CO2e ha
-‐1 yr-‐1), medium (1-‐5 t CO2e ha
-‐1 yr-‐1), high (>5 t CO2e ha-‐1 yr-‐1).
c Farmland preservation is not viewed as an agricultural management activity, because GHG mitigation from farmland preservation is not from the agricultural sector. d These enhancers include polymer-‐coated fertilizers, nitrification inhibitors, and urease inhibitors.
17
Research priorities fall into five categories: Farmland preservation: Define how this approach could be part of a statewide GHG emissions mitigation strategy targeting the intersection of the urban (e.g., transportation) and agricultural sectors. Quantify variability in difference between farmland use and urban land uses in rapidly urbanizing areas of California, and assess the effectiveness of policies to reduce expansive urbanization into farmland. Perennial crops: Improve inventories of C stocks and GHG emissions in vine and woody perennial crops in California, and assess potential drivers of increases and decreases in the extent of the state’s perennial crops. Nitrogen management: Through research and guidance, increase efficient use of nitrogen fertilizers, including micro-irrigation technologies and nitrification inhibitors, and engage growers in this use with user-friendly tools and standards. Gather information on fertilizer use across all cropping systems to better estimate mitigation potential and target incentives. Research emissions from ammonia oxidation-related pathways and assess alternative fertilizer sources. Residue management: Determine whether tillage, residue management, and cover crops can yield any significant emissions reduction or sequestration rather than observed emissions increases. Irrigation management: Further assess the benefits, the energy and thus emission reductions and C sequestration increases, and any other benefits of expanding drip and micro-sprinkler irrigation technologies across lower-value crops and perennial crops, particularly alfalfa. In general, biogeochemical models should be refined with additional research and data to better estimate N2O emissions across diverse crops and crop rotations, particularly those containing perennials. Rangeland Systems Rangelands are critical to the carbon (C) cycle (Ogle, Conant, and Paustian 2004), storing about one-third of the terrestrial soil C pool (Jobbagy and Jackson 2000). Rangelands cover more than 22 million hectares (ha) in California, or 40%–50% of the state’s land area (Brown et al. 2004). The large extent of rangelands coupled with their propensity to store C in soils leads to considerable C sequestration potential and thus opportunities for climate change mitigation through rangeland management. Report 4 in this series—DeLonge, Owen, and Silver (2014)—finds that rangelands are a relatively small contributor to California’s GHG emissions under current (baseline) conditions. However, the plant cover of California rangelands are changing from annual- to perennial-dominated systems that may affect soil C pools. This transition may be enhanced with climate change, but understanding of the magnitude of the impacts is very limited. Rangelands are typically a net sink for CH4 and a small source of N2O. Little is known about the net GHG effect of various management practices for California rangelands. Soil compaction, increased soil moisture, and N fertilization can reduce uptake rates of CH4 or increase net emissions of both CH4 and N2O. Most rangelands in California are grazed, potentially sequestering significant amounts of C and minimizing GHG emissions. On the other hand, fire is often used to control aboveground biomass and plant community composition, which can indirectly affect soil C stocks, but the direction of the effect is uncertain. Fires also emit CH4, N2O, and other greenhouse gases in amounts that are currently poorly characterized. Changes in management such as soil amendments (compost and fertilizer) can improve rangeland productivity and sequester soil C, while providing numerous co-benefits, thus this approach is promising. Specifically, slow-release and high-efficiency fertilizers can maximize benefits while minimizing soil N2O losses and transportation costs. When composts are produced from materials diverted from high-emission waste streams, an additional benefit can be

18
reductions in waste sector emissions. However, the full life-cycle implications of this approach have not been assessed. Other opportunities include reducing mowing, aeration, and tillage that disturb rangeland soils, typically leading to soil C losses. Although it can increase productivity and therefore soil C, irrigation is limited by water shortages. All of these approaches also require significant energy use, minimizing their net mitigation potential. Research priorities fall into two categories: Baseline: Research is needed to understand the current status of and trends in soil C stocks, net ecosystem exchange, and GHG (CH4 and N2O) fluxes across the full range of California rangeland cover types and to predict trends under climate change. In addition, information needs to be collected on the extent and location (soil type) of current management activities and shifts in plant communities. Knowing the magnitude of and drivers for rangeland emissions or sequestration is critical to assess what state policies or incentive programs can change.
Management changes: Research is needed to assess the mitigation potential and life-cycle implications of potentially beneficial management practices. These practices include grazing practices that rehabilitate degraded soils and increase soil C storage, use of organic matter amendments, plant composition shifts to enhance sequestration, and best management practices for the combined use of grazing and fire management. This research should specifically consider the social and economic implications of changes in management and assess how climate change can affect the performance of these various options.
Remote sensing, in combination with unmanned aerial vehicles, shows tremendous promise as a relatively low-cost way to monitor rangeland conditions and plant communities. Research is needed to develop algorithms linking remotely sensed data to rangeland soil C and GHG dynamics. Remote sensing should also be used to identify optimal locations for long-term study sites and to implement management strategies. ECONOMICS OF MITIGATION OPTIONS Some GHG emissions reduction methods are more economically feasible than others as measured in cost per ton of emissions reduction. Data on the cost-effectiveness of various mitigation options are useful when strategizing the options’ adoption. Report 7 in this series—Lee and Sumner (2014)—summarizes the costs and mitigation potential of those options relevant to California on the basis of studies with different methods and sample populations. The results in Table 9 suggest that California’s largest agricultural GHG emissions source—dairy manure management—has the best mitigation potential in terms of percent reductions achieved at relatively low per-ton costs, primarily through the use of anaerobic digesters. However, reductions from the next largest emissions source—livestock enteric fermentation—appear to be very expensive and relatively small. Changes in crop/fertilizer management have fairly limited cost-effectiveness as a N2O mitigation strategy: they achieve relatively low reductions at a relatively high per-metric-ton cost. Economic and behavioral factors other than cost-effectiveness should be reflected in the design of GHG mitigation incentives. For example, although manure management is a cost-effective option, adoption of anaerobic digesters faces economic regulatory and institutional barriers. Air and water quality requirements increase these projects’ construction and operating costs and entail a lengthy approval process that likely lowers adoption rates (ETAAC 2008).

19
Table 9. Cost of Mitigation Options and Policy Instruments and Corresponding Mitigation Potentials
Mitigation Option or Policy Instrument (tax or credit)
Agricultural Sector
Marginal Cost of Mitigation or Incentive Price ($/MTCO2e)
GHG Mitigation Potential (MTCO2e)
% of Total Ag GHG Emissions (2009)a
% of GHG Emissions from Appropriate Agricultural Sector (2009)a Source
C-‐emission tax or credit
Crops -‐ California (Central Valley) $ 5
1,400,000 4.4% 15.5%
Garnache et al. (2013)
C-‐emission tax or credit
Crops -‐ California (Central Valley) $ 10
1,900,000 5.9% 21.1%
Garnache et al. (2013)
C-‐emission tax or credit
Crops -‐ California (Central Valley) $ 20
2,600,000 8.1% 28.8%
Garnache et al. (2013)
C-‐emission tax or credit
Crops -‐ California (Central Valley) $ 30
3,100,000 9.7% 34.4%
Garnache et al. (2013)
Anaerobic digestion -‐ dairy
Manure management -‐ US National $ 0
770,000 0.2% 2.4% Gloy (2011)
Anaerobic digestion -‐ dairy
Manure management -‐ US National $ 5
2,590,000 0.6% 8.2% Gloy (2011)
Anaerobic digestion -‐ dairy
Manure management -‐ US National $ 10
7,910,000 1.7% 25.0% Gloy (2011)
Anaerobic digestion -‐ dairy
Manure management -‐ US National $ 15
11,590,000 2.5% 36.6% Gloy (2011)
Anaerobic digestion -‐ dairy
Manure management -‐ US National $ 20
13,340,000 2.9% 42.1% Gloy (2011)
Anaerobic digestion -‐ dairy
Manure management -‐ US National $ 25
15,570,000 3.4% 49.1% Gloy (2011)
Anaerobic digestion -‐ dairy
Manure management -‐ US National $ 30
16,800,000 3.7% 53.0% Gloy (2011)
Anaerobic digestion -‐ dairy
Manure management -‐ US National $ 35
18,030,000 3.9% 56.9% Gloy (2011)
Anaerobic digestion -‐ dairy
Manure management -‐ US National $ 40
18,650,000 4.1% 58.8% Gloy (2011)
Anaerobic digestion -‐ dairy
Manure management -‐ US National $ 45
19,000,000 4.1% 59.9% Gloy (2011)
Anaerobic digestion -‐ dairy
Manure management -‐ US National $ 50
19,220,000 4.2% 60.6% Gloy (2011)
Anaerobic Manure $ 100 4.6% 66.9% Gloy (2011)

20
digestion -‐ dairy
management -‐ US National
21,210,000
Anaerobic digestion -‐ dairy
Manure management -‐ US National $ 150
22,120,000 4.8% 69.8% Gloy (2011)
Anaerobic digestion -‐ dairy
Manure management -‐ US National $ 200
22,160,000 4.8% 69.9% Gloy (2011)
Wheat -‐ N fertilizer reduction (10%) Crops -‐ California $ 2
very insignificant
very insignificant
very insignificant
ICF International (2013)
Corn -‐ reduced till to no till Crops -‐ California $ 16
39,000 0.1% 0.4%
ICF International (2013)
Corn -‐ conventional till to no till Crops -‐ California $ 20
39,000 0.1% 0.4%
ICF International (2013)
Wheat -‐ reduced till to no till Crops -‐ California $ 63
40,860 0.1% 0.5%
ICF International (2013)
Wheat -‐ conventional till to no till Crops -‐ California $ 106
36,320 0.1% 0.4%
ICF International (2013)
Cotton -‐ reduced till to no till Crops -‐ California $ 542
48,060 0.1% 0.5%
ICF International (2013)
Cotton -‐ conventional till to no till Crops -‐ California
$ 1,178
42,720 0.1% 0.5%
ICF International (2013)
Covering anaerobic lagoons (>2500 cows)b
Manure management -‐ California $ 6
2,500,000 7.8% 24.2%
ICF International (2013)
Covering anaerobic lagoons (>1000 cows)b
Manure management -‐ California $ 6.5
4,800,000 15.0% 46.4%
ICF International (2013)
Covering anaerobic lagoons (>500 cows)b
Manure management -‐ California $ 8
6,100,000 19.0% 59.0%
ICF International (2013)
Covering anaerobic lagoons (>200 cows)b
Manure management -‐ California $ 9
6,700,000 20.9% 64.8%
ICF International (2013)
N fertilizer reduction -‐ 4c N-‐tax
Crops -‐ Yolo County, California
$ 9 -‐ 46
2,791 1.9%c 1.9%
Merel et al. (2013)
N fertilizer reduction -‐ 8c N-‐tax
Crops -‐ Yolo County, California
$ 17 -‐ 91
4,903 3.3%c 3.3%
Merel et al. (2013)

21
N fertilizer reduction -‐ 12c N-‐tax
Crops -‐ Yolo county, California $ 26-‐137
6,706 4.5%c 4.5%
Merel et al. (2013)
N fertilizer reduction -‐ 16c N-‐tax
Crops -‐ Yolo county, California $ 34-‐182
8,481 5.7%c 5.7%
Merel et al. (2013)
Enteric emission reduction-‐dairy
Enteric fermentation -‐ California $ 244
198,000 0.6% 2.1%
Moraes, Fadel, Castillo, and Kebreab (2014)
Enteric emission reduction-‐dairy
Enteric fermentation -‐ California $ 544
1,320,000 4.1% 14.2%
Moraes, Fadel, Castillo, and Kebreab (2014)
Enteric emission reduction-‐dairy
Enteric fermentation -‐ California $ 2,270
1,584,000 4.9% 17.1%
Moraes, Fadel, Castillo, and Kebreab (2014)
Note: Agricultural GHG emissions data were obtained from U.S. EPA (2011) for the United States and CARB (2011) for California. For the nitrogen (N) fertilizer reduction option, a range is presented because a MTCO2e-‐based tax equivalent to the (per lb) N tax depends on the emissions factors (both direct and indirect) used in the conversion calculation. a For California, Yolo County, or the United States, depending on the study. b Dairies with the number of cows greater than indicated c Given that Yolo County has insignificant livestock farming, zero emissions from the livestock sector are assumed.

22
CONCLUSIONS California’s economically important dairy industry has by far the highest GHG emissions of all the state’s agricultural production systems. Examination of three scenarios of the industry’s potential growth trajectory—no growth, slow growth, trend growth—suggest that baseline dairy emissions could decline by as much as 20% or rise by as much as 40% (almost one-quarter of the entire agricultural sector’s current emissions). This variation in baseline emissions projections may be as large as or larger than the dairy industry’s emissions mitigation potential. Thus, policy makers and the industry would do well to adjust mitigation strategies as growth trends unfold. The latest relevant research suggests that California’s most cost-effective opportunity for emissions reductions at dairies is manure management. However, anaerobic digester projects face uncertain and potentially cost-prohibitive permitting requirements that impede their adoption. Efforts to overcome these barriers must continue if dairy manure management is to become a viable GHG emissions mitigation option in California. Other management options hold promise for emissions reductions, but the total acreage to which they are applicable, their per-unit-area mitigation potential, and their cost-effectiveness remain unclear. For example, application of manure to rangelands may be a promising option due to the large area available for this practice. However, mitigation potential data per unit area is not available. Data on the biophysical mitigation potential of croplands exist, but data on cost-effectiveness and estimates of the area of potential application are not. Given that 34% of California cropland is devoted to annual crops, conversion of more of this land to perennial agriculture could offer a mitigation option, but how realistic such conversion would be remains unclear. Improved irrigation practices could reduce N2O emissions, but over what acreage they can be used in an economically and technically feasible manner is uncertain. Information needed to estimate baseline emissions is unavailable for many key agricultural production systems. The lacking data include background emissions and sequestration rates for agricultural lands and rangelands as well as changes in these rates in response to variable climate conditions and water availability. Also lacking is information on current management practices—what they are, how widespread their use is, where they are implemented, and what their emissions impact is. Another gap is information for assessing the GHG reduction potential and costs of new practices. Ideally, research funding would be prioritized on the basis of the mitigation potential of California agriculture’s different production systems and management activities.

23
REFERENCES Alsina, M.M., A.C. Fanton-Borges, and D.R. Smart. 2013. “Spatiotemporal Variation of Event Related N2O and CH4 Emissions during Fertigation in a California Almond Orchard.” Ecosphere 4: 1–21. Bossio, D.A., W.R. Horwath, R.G. Mutters, and C. van Kessel. 1999. “Methane Pool and Flux Dynamics in a Rice Field following Straw Incorporation.” Soil Biology and Biochemistry 31: 1313–1322. Brown, S., A. Dushku, T. Pearson, D. Pearson, J. Winsten, S. Sweet, and J. Kadyszewski. 2004. Carbon Supply from Changes in Management of Forest, Range, and Agricultural Lands of California. No. 144. Winrock International for California Energy Commission. Burger, M., and W.R. Horwath. 2012. Assessment of Baseline Nitrous Oxide Emissions in California Cropping Systems. Sacramento, CA: California Air Resources Board,. Burger, M., L.E. Jackson, E.J. Lundquist, D.T. Louie, R.L. Miller, D.E. Rolston, and K.M. Scow. 2005. “Microbial Responses and Nitrous Oxide Emissions during Wetting and Drying of Organically and Conventionally Managed Soil under Tomatoes.” Biology and Fertility of Soils 42: 109–118. CARB (California Air Resources Board). 2011. California Greenhouse Gas Emissions Inventory: 2000–2009. Sacramento, CA: California Air Resources Board. http://www.arb.ca.gov/cc/inventory/pubs/reports/ghg_inventory_00-09_report.pdf. CARB (California Air Resources Board). AB 32 Scoping Plan. http://www.arb.ca.gov/cc/scopingplan/scopingplan.htm. CDFA (California Department of Food and Agriculture). 2013. Dairy Information Bulletin. Sacramento, CA: California Department of Food and Agriculture. http://www.cdfa.ca.gov/dairy/uploader/postings/infobulletin/Default.aspx. CEPA-CVRWQCB (California Environmental Protection Agency Central Valley Regional Water Quality Control Board). 2013.Dairy Program Regulations and Requirements. http://www.swrcb.ca.gov/rwqcb5/water_issues/dairies/dairy_program_regs_requirements/index.shtml. Castillo, A.R., N.R. St-Pierre, N. Silva del Rio, and W.P. Weiss. 2013. “Mineral Concentrations in Diets, Water, and Milk and Their Value in Estimating On-Farm Excretion of Manure Minerals in Lactating Dairy Cows.” J. Dairy Sci. 96:3388–3398. Culman, S.W., V.R. Haden, T. Maxwell, H. Waterhouse, and W. Horwath. 2014. Greenhouse Gas Mitigation Opportunities in California Agriculture: Review of California Cropland Emissions and Mitigation Potential. NI GGMOCA R 3. Durham, NC: Duke University. De Gryze, S., R. Catala, and R. Howitt. 2009. Assessment of Greenhouse Gas Mitigation in California Agricultural Soils. California Energy Commission Public Interest Energy Research Program, University of California, Davis. DeLonge, M.S., J.J. Owen, and W.L. Silver. 2014. Greenhouse Gas Mitigation Opportunities in California Agriculture: Review of California Rangeland Emissions and Mitigation Potential. NI GGMOCA R 4. Durham, NC: Duke University.

24
ETAAC (Economic and Technological Advisory Committee). 2008. Recommendations of the Economic and Technology Advancement Advisory Committee (ETAAC) Final Report: Technologies and Policies to Consider for Reducing Greenhouse Gas Emissions in California. Report to the California Air Resources Board. http://www.arb.ca.gov/cc/etaac/etaacfinalreport2-11-08.pdf. Fitzgerald, G.J., K.M. Scow, and J.E. Hill. 2000. “Fallow Season Straw and Water Management Effects on Methane Emissions in California rice.” Global Biogeochemical Cycles 14: 767–776. Garland, G.M., E. Suddick, M. Burger, W.R. Horwath, and J. Six. 2011. “Direct N2O Emissions Following Transition from Conventional Till to No-Till in a Cover Cropped Mediterranean Vineyard (Vitis vinifera).” Agriculture, Ecosystems & Environment 144: 423–428. Gerber, P.J., A.N. Hristov, B. Henderson, H. Makkar, J. Makkar, C. Lee, R. Meinen, F. Montes, T. Ott, J. Firkins, A. Rotz, C. Dell, A.T. Adesogan, W.Z. Yang, J.M. Tricarico, E. Kebreab, G. Waghorn, J. Dijkstra, and S. Oosting. 2013. “Technical Options for the Mitigation of Direct Methane and Nitrous Oxide Emissions from Livestock: A Review.” Animal 7(2): 220–234. Gloy, B.A. 2011. “The Potential Supply of Carbon Dioxide Offsets from the Anaerobic Digestion of Dairy Waste in the United States.” Applied Economic Perspectives and Policy, 33(1): 59-78. Haden, V.R., M. Dempsey, S. Wheeler, W. Salas, and L.E. Jackson. In press. “Use of Local Greenhouse Gas Inventories to Prioritize Opportunities for Climate Action Planning and Voluntary Mitigation by Agricultural Stakeholders in California.” Journal of Environmental Planning and Management. Howitt, R.E., D. MacEwan, J. Medellín-Azuara, and J.R. Lund. 2010. Economic Modeling of Agriculture and Water in California Using the Statewide Agricultural Production Model. Report for the California Department of Water Resources by the University of California–Davis. http://www.waterplan.water.ca.gov/docs/cwpu2009/0310final/v4c04a02_cwp2009.pdf. ICF International. 2013. Greenhouse Gas Mitigation Options and Costs for Agricultural Land and Animal Production within the United States. ICF International. Jobbágy, E.G., and R.B. Jackson. 2000. “The Vertical Distribution of Soil Organic Carbon and Its Relation to Climate and Vegetation.” Ecological Applications 10(2): 423–436. Kallenbach, C.M., D.E. Rolston, and W.R. Horwath. 2010. “Cover Cropping Affects Soil N2O and CO2 Emissions Differently Depending on Type of Irrigation.” Agriculture, Ecosystems & Environment 137: 251–260. Kennedy, T.L. 2012. “Nitrous Oxide Emissions from California Tomato Cropping Systems under Conventional and Alternative Management.” Masters thesis. University of California Davis. Kong, A.Y.Y., S.J. Fonte, C. van Kessel, and J. Six. 2009. “Transitioning from Standard to Minimum Tillage: Trade-offs between Soil Organic Matter Stabilization, Nitrous Oxide Emissions, and N Availability in Irrigated Cropping Systems.” Soil and Tillage Research 104: 256–262. Lee, H., and D.A. Sumner. 2014. Greenhouse Gas Mitigation Opportunities in California Agriculture: Review of the Economics. NI GGMOCA R 7. Durham, NC: Duke University.

25
Lee, J., J.W. Hopmans, C. van Kessel, A.P. King, K.J. Evatt, D. Louie, D.E. Rolston, and J. Six. 2009. “Tillage and Seasonal Emissions of CO2, N2O and NO across a Seed Bed and at the Field Scale in a Mediterranean Climate.” Agriculture, Ecosystems & Environment 129: 378–390. Linquist, B., C. van Kessel, and J. Hill. 2010. Annual Report on Comprehensive Research on Rice: Improving Fertilizer Guidlines for California’s Changing Rice Climate. California Rice Research Board, Yuba City, CA. Medellin-Azuara, J., J.J. Harou, M.A. Olivares, K. Madani, J.R. Lund, R.E. Howitt, S.K. Tanaka, M.W. Jenkins, and T. Zhu. 2008. “Adaptability and Adaptations of California’s Water Supply System to Dry Climate Warming.” Climatic Change 87 (Suppl 1): S75–S90. Mérel, P., F. Yi, J. Lee, and J. Six. 2013. “A Regional Bio-economic Model of Nitrogen Use in Cropping.” American Journal of Agricultural Economics, forthcoming. Monast, J, T. Profeta, B.R. Pearson, and J. Doyle. 2012. “Regulating Greenhouse Gas Emissions from Existing Sources: Section 111(d) and State Equivalency.” 42 Environmental Law Reporter 10206. Moraes, L., J. Fadel, A. Castillo, and E. Kebreab. 2014. Greenhouse Gas Mitigation Opportunities in California Agriculture: Minimizing Diet Costs and Enteric Methane Emissions from Dairy Cows. NI GGMOCA R 5. Durham, NC: Duke University. Moraes, L.E, A.B. Strathe, J.G. Fadel, D.P. Casper, and E. Kebreab. 2013. “Prediction of Enteric Methane Emissions from Cattle.” Global Change Biology. DOI: 10.1111/gcb.12471. Murray, B.C., B.L. Sohngen, and M.T. Ross. 2007. “Economic Consequences of Consideration of Permanence, Leakage and Additionality for Soil Carbon Sequestration Projects.” Climatic Change 80: 127–143. Ogle, S.M., R.T. Conant, and K. Paustian. 2004. “Deriving Grassland Management Factors for a Carbon Accounting Method Developed by the Intergovernmental Panel on Climate Change.” Environmental Management 33(4): 474–484. Olander, L.P., K. Haugen-Kozyra, S. Del Grosso, D. Malin, K. Paustian, and W. Salas. 2011. Using Biogeochemical Process Models to Quantify Greenhouse Gas Mitigation from Agricultural Management Projects. NI R 11-03. Durham, NC: Duke University. Owen, J.J., E. Kebreab, and W. Silver. 2014. Greenhouse Gas Mitigation Opportunities in California Agriculture: Review of Emissions and Mitigation Potential of Animal Manure Management and Land Application of Manure. NI GGMOCA R 6. Durham, NC: Duke University. Pittelkow, C., M.A. Adviento-Borbe, J. Hill, J. Six, C. Van Kessel, and B. Linquist. In Review. “Yield-Scaled Global Warming Potential of Annual Nitrous Oxide and Methane Emissions from Continuously Flooded Rice Systems in Response to Nitrogen Input.” Schellenberg, D.L., M.M. Alsina, S. Muhammad, C.M. Stockert, M.W. Wolff, B.L. Sanden, P.H. Brown, and D.R. Smart. 2012. “Yield-Scaled Global Warming Potential from N2O Emissions and CH4 Oxidation for Almond (Prunus dulcis) Irrigated with Nitrogen Fertilizers on Arid Land.” Agriculture, Ecosystems & Environment 155: 7–15.

26
Smart, D.R., E. Suddick, and T. Pritchard. 2006. “Control of Greenhouse Gas emissions from California Vineyards by Soil Carbon and Water and Its Policy Implications.” Final report, Kearney Foundation of Soil Science. Smukler, S.M., A.T. O’Geen, and L.E. Jackson. 2012. “Assessment of Best Management Practices for Nutrient Cycling: A Case Study on an Organic Farm in a Mediterranean-type Climate.” Journal of Soil and Water Conservation 67: 16–31. State of California (accessed July 2012). http://www.netstate.com/economy/ca_economy.htm. Steenwerth, K., and K.M. Belina. 2008. “Cover Crops and Cultivation: Impacts on Soil N Dynamics and Microbiological Function in a Mediterranean Vineyard Agroecosystem.” Applied Soil Ecology 40: 370–380. Steenwerth, K.L., and K.M. Belina. 2010. “Vineyard Weed Management Practices Influence Nitrate Leaching and Nitrous Oxide Emissions.” Agriculture, Ecosystems & Environment 138: 127–131. Sumner, D.A. 2014. Greenhouse Gas Mitigation Opportunities in California Agriculture: Outlook to 2030. NI GGMOCA R 2. Durham, NC: Duke University. UC AIC (University of California Agricultural Issues Center). 2012. 2011 California Agricultural Export Data. http://aic.ucdavis.edu/pub/exports.html. ———. 2009. Water Supply and Demand. http://aic.ucdavis.edu/publications/whitepapers/index.htm. USDA-NASS (U.S. Department of Agriculture National Agricultural Statistics Service). 2013. Acreage, 1960–2013. http://usda.mannlib.cornell.edu/MannUsda/viewDocumentInfo.do?documentID=1000. U.S. EPA (U.S. Environmental Protection Agency). 2011. Inventory of U.S. Greenhouse Gas Emissions and Sinks: 1990–2009. EPA 430-R-11-005. Washington, D.C.: EPA. http://www.epa.gov/climatechange/ghgemissions/usinventoryreport/archive.html. Van Kessel, J.S., and J.B., Reeves III. 2002. “Nitrogen Mineralization Potential of Dairy Manures and Its Relationship to Composition.” Biology and Fertility of Soils 36 118–123. Wheeler, S.M., M. Tomuta, V.R. Haden, and L.E. Jackson. In press. “The Impacts of Alternative Patterns of Urbanization on Greenhouse Gas Emissions in an Agricultural County.” Journal of Urbanization.

The Nicholas Institute for Environmental Policy Solutions
The Nicholas Institute for Environmental Policy Solutions at Duke University is a nonpartisan institute founded in 2005 to help decision makers in government, the private sector, and the nonprofit community address critical environmental challenges. The Nichols Institute responds to the demand for high-quality and timely data and acts as an “hon-est broker” in policy debates by convening and fostering open, ongoing dialogue between stakeholders on all sides of the issues and provid-ing policy-relevant analysis based on academic research. The Nicholas Institute’s leadership and staff leverage the broad expertise of Duke University as well as public and private partners worldwide. Since its inception, the Nicholas Institute has earned a distinguished reputation for its innovative approach to developing multilateral, nonpartisan, and economically viable solutions to pressing environmental challenges.
For more information, please contact:
Nicholas Institute for Environmental Policy SolutionsDuke UniversityBox 90335Durham, North Carolina 27708919.613.8709919.613.8712 [email protected]
copyright © 2014 Nicholas Institute for Environmental Policy Solutions