GreaterVancouverGatewayCouncil ... · mcts Greater Vancouver Gateway Council Economic Impact...
98
mcts MAJOR COMMERCIAL TRANSPORTATION SYSTEM Economic Impact Analysis Of Investment In A Major Commercial Transportation System For The Greater Vancouver Region Greater Vancouver Gateway Council: PreparedBy: JULY2003 SW1040
Transcript of GreaterVancouverGatewayCouncil ... · mcts Greater Vancouver Gateway Council Economic Impact...

mctsM A J O R C O M M E R C I A L T R A N S P O R T A T I O N S Y S T E M
Economic Impact Analysis Of Investment InA Major Commercial Transportation System
For The Greater Vancouver Region
Greater Vancouver Gateway Council:
PreparedBy:
JULY2003SW1040

mctsG r e a t e r V a n c o u v e r G a t e w a y C o u n c i l
Economic Impact Analysis of the Major Commercial Transportation SystemEconomic Impact Analysis of the Major Commercial Transportation System
July 2003 - SW1040 i
TABLE OF CONTENTS ACKNOWLEDGEMENTS
EXECUTIVE SUMMARY REPORT SYNOPSIS 1. INTRODUCTION ..................................................................................... 1
1.1 Defining the Major Commercial Transportation System .................. 1
1.2 Study Objective, Motivation and Approach..................................... 3 1.3 Organization of the Report............................................................ 6
Economic Role of the Greater Vancouver Gateway 2. WHAT DISTINGUISHES BC’S ECONOMY ............................................... 8
2.1 Dependence on International Trade .............................................. 8 2.2 Transportation Role in Provincial Economies ................................. 11 3. HOW DOES THE GREATER VANCOUVER GATEWAY SERVE
THE FLOW OF GOODS?......................................................................... 16 3.1 Commodity Mix of Goods Movement ............................................. 17
3.2 Origin-Destination and Mode of Goods Movement ......................... 18 3.3 Performance of Gateway Marine and Air Ports .............................. 21
4. THE ECONOMIC IMPORTANCE OF GATEWAY FACILITIES.................... 23 4.1 Direct Effects: Gateway Facilities and Services ............................. 24 4.2 Indirect and Induced Effects on the Economy ................................ 28
Investment Needs 5. EXPECTED CHANGES IN TRANSPORT NEEDS ..................................... 31 5.1 Overall Growth of Transportation Demand..................................... 31
5.2 Differences by Transport Mode ..................................................... 33 5.3 Composition of Cargo .................................................................. 34
5.4 Origin and Destination Patterns .................................................... 36

mctsG r e a t e r V a n c o u v e r G a t e w a y C o u n c i l
Economic Impact Analysis of the Major Commercial Transportation SystemEconomic Impact Analysis of the Major Commercial Transportation System
July 2003 - SW1040 ii
6. INFRASTRUCTURE NEEDS.................................................................... 38
6.1 Facility Investment Objectives....................................................... 38 6.2 Transportation Infrastructure Projects............................................ 39 6.3 The Cost of Improving the Major Commercial
Transportation System ................................................................. 53 6.4 Transportation Impacts of Building These Projects......................... 57
Findings: Economic Impacts of Investment Decisions 7. IMPACTS OF INVESTING IN THE MCTS ................................................. 64 7.1 Types of Economic Costs and Growth Constraints......................... 64 7.2 Value of Direct Impacts ................................................................ 66 7.3 Estimation of Economic Impacts ................................................... 69
7.4 Sensitivity Analysis ...................................................................... 74 8. SUMMARY STATEMENTS ...................................................................... 78 MEMBERSHIPS
APPENDICES (Under Separate Cover)
APPENDIX 1 MAJOR & MINOR ROAD IMPROVEMENTS
APPENDIX 2 COST ESTIMATES OF IMPROVEMENTS
APPENDIX 3 RANKING OF MAJOR, MINOR & RAILWAY IMPROVEMENTS
APPENDIX 4 DEVELOPMENT OF TRAVEL BENEFITS
APPENDIX 5 PROFILE OF GATEWAY TRANSPORT & PORT FACILITY ACTIVITY
mctsG r e a t e r V a n c o u v e r G a t e w a y C o u n c i l
Economic Impact Analysis of the Major Commercial Transportation SystemEconomic Impact Analysis of the Major Commercial Transportation System
July 2003 - SW1040 A-1
ACKNOWLEDGEMENTS This report summarizes the analysis and findings of a study to assess the
economic impacts associated with investing in a proposed set of projects identified as comprising the Major Commercial Transportation System for the Greater Vancouver Region. Western Economic Diversification Canada (WD), a Department of the Government of Canada, provided a contribution to the Greater Vancouver Gateway Council to assist in the completion of this study. The Greater Vancouver Gateway Council is an organization comprised of
senior executives from industry and government who are concerned about maintaining the position and function of Greater Vancouver as a commercial gateway for North America1. Throughout this project, major guidance was provided through the tireless efforts of an advisory group, which worked with the consultant team to help in
maintaining the study direction. This advisory group was led by Bob Wilds (Greater Vancouver Gateway Council), with Keith McPherson (Greater Vancouver Gateway Council), Jon Conquist (BC Ministry of Transportation), Steve Jones (Western Economic Diversification Canada), William Waters (Univ. of BC), Martin Kobayakawa (Greater Vancouver Transportation Authority), Mike Lai (Greater Vancouver Transportation Authority), Dennis Bickel (Vancouver
Port Authority), Phil Davies (Transport Canada) and John Mills (Transport Canada). The study was carried out by staff of Delcan and Economic Development Research Group. The staff benefited from substantial data provided by the Greater Vancouver Transportation Authority, BC Ministry of Transportation,
BC Stats, Transport Canada and Statistics Canada, as well as from information provided by the Vancouver International Airport Authority, Vancouver Port Authority, Fraser River Port Authority, North Fraser Port Authority and the Gateway railway companies. However, any errors or omissions in the data collection, analysis, presentation and/or interpretation of findings are solely the responsibility of the consultant team.
1 A complete list of members of the Greater Vancouver Gateway Council can be found at the end of this document.

mctsG r e a t e r V a n c o u v e r G a t e w a y C o u n c i l
Economic Impact Analysis of the Major Commercial Transportation SystemEconomic Impact Analysis of the Major Commercial Transportation System
July 2003 - SW1040 E-1
EXECUTIVE SUMMARY
Overview This report examines three related issues:
• The current role of Greater Vancouver’s gateway transportation facilities in supporting the economies of British Columbia and the Western Canadian Provinces.
• The nature of expected future demands on those gateway facilities, and the need to improve as well as implement elements of the Major Commercial Transportation System (MCTS) that supports them.
• The economic stakes of investing vs. failing to invest in MCTS improvements to support future economic growth.
Greater Vancouver Gateways The Greater Vancouver region serves as an important gateway between Canada and both Asia and the US. Gateway facilities in Greater Vancouver include – a variety of marine ports, an international airport, several border crossings, and a large number of truck and rail connectors serving them. Due
to its position as a gateway to Asia Pacific economies, Greater Vancouver and its gateway transportation facilities serve a critical role in supporting the economies of this large region as well as the economies of the other western provinces. More than 75,000 people work directly at Greater Vancouver Gateway facilities
and supporting transportation services. Overall, in excess of 145,000 jobs in the four western provinces are directly or indirectly dependent on the Greater Vancouver Gateway transportation system. This does not include the thousands of jobs at the many businesses that rely on Vancouver’s international gateway and supporting ground transportation system for their international exports.
Major Commercial Transportation System The Greater Vancouver Gateway Council defined the concept of a Major Commercial Transportation System (MCTS) as a multi-modal system that would maximize the use of existing infrastructure and provide a blue print for

mctsG r e a t e r V a n c o u v e r G a t e w a y C o u n c i l
Economic Impact Analysis of the Major Commercial Transportation SystemEconomic Impact Analysis of the Major Commercial Transportation System
July 2003 - SW1040 E-2
investments in new infrastructure for the movement of goods, services, and people. It is intended to be an efficient, environmentally sustainable, and safe
system of routes linking Gateway facilities and industrial areas to the nation’s major trade routes by sea, air, road, and rail. In defining the MCTS, it was clear that the current transportation system, in all its modes, has been facing the burden of continuing growth in travel demand that has resulted in increasing traffic congestion. The Gateway Council
identified that a lack of new investment in the functioning of the transportation system would lead to further increases in congestion. For that reason, it was determined that new investment in the MCTS is required to reverse past trends and support the growth, functionality, and efficiency of the nationally important gateway located in the region.
As this study focused on the Major Commercial Transportation System, the economic analysis provided here represents just one part of the total justification for addressing the costs of traffic congestion. There are additional environmental, land use, and personal quality of life implications of congestion reduction and transportation system improvements that are not addressed here.
Proposed Projects In order to provide an efficient and internationally competitive commercial transportation system for the Gateway, several system objectives were identified:
• Provi de a continuous network for efficient commercial vehicle operations;
• Utilize multi-modal solutions (road, rail, and water courses) to alleviate
traffic congestion;
• Accommodate future growth in goods and passenger movements (local and international);
• Enable 24-hour unrestricted commercial vehicles and rail traffic use;
• Provide rail movements free of road intersection constraints;
• Enhance connectivity to north-south and east-west trade corridors; and
• Provide cost-effective solutions to specific bottlenecks.

mctsG r e a t e r V a n c o u v e r G a t e w a y C o u n c i l
Economic Impact Analysis of the Major Commercial Transportation SystemEconomic Impact Analysis of the Major Commercial Transportation System
July 2003 - SW1040 E-3
A previous study by the Gateway Council identified projects required to address these transportation objectives. The result was a “Current and Planned
Infrastructure List" that recommended 18 major new investments, comprising major highway upgrades, new or improved rail links and river crossings, and a new rapid transit line. Improvements to an additional 34 existing roadway segments, rail facilities, and rail/road crossings were identified as requiring some level of enhancement for the movement of goods and to mitigate high levels of traffic congestion.
The cost of completing all of these projects is significant -- likely to exceed $6 billion (in year 2002 dollars). However, the stakes are also high. Failure to invest in the projects will have a significant long-term cost for not only the Region but all of Western Canada.
Transportation System Impacts A transportation network simulation model was used to forecast and analyze future changes in roadway network demand and performance. A separate analysis examined rail facility demand, supply, and performance issues. Overall, forecasts for continued population and economic growth in the Greater
Vancouver area show increasing pressure on the region’s ground transportation system. The growth of road and rail traffic is expected to be particularly strong for commercial movements, which serve freight cargo moving to and from airport, marine ports, industrial parks, and international border crossing facilities. Future congestion delays and capacity constraints will therefore hit commercial traffic particularly hard.
Projected road and rail demand indicate that demand will surpass the capacity of significant elements of the current transportation system. Severe impacts on future travel times and travel costs are expected unless there is significant investment made to upgrade and expand many aspects of the region’s transportation facilities.
Economic Impacts Failure to invest in upgrading the performance and capacity of the region’s transportation facilities and services will lead to significant losses of business activity as travel times and costs for commercial shipping are increased. By the year 2021, a loss of Gross Domestic Product in excess of 475 million/year is

mctsG r e a t e r V a n c o u v e r G a t e w a y C o u n c i l
Economic Impact Analysis of the Major Commercial Transportation SystemEconomic Impact Analysis of the Major Commercial Transportation System
July 2003 - SW1040 E-4
predicted (with an expected range of $414 million to $1.1 billion). That translates to a loss of over 7,000 jobs (with an expected range of up to 16,000
jobs at stake). Investing in the MCTS will avoid these losses. The full social benefit of investing in the MCTS is the sum of the economic (GDP) impacts and the additional value of time savings not included in GDP calculations. This larger benefit measure is calculated to be $1.1 billion / year by the year 2021 (range of $806 million to 1.5 billion / year).
To maintain the BC and other western provincial economies, careful attention must be taken to ensure necessary investments are made so that the costs of doing business in this region do not become prohibitive, and western Canada remains competitive for exports within North American and to international markets.
Policy Implications There are high costs but also significant economic benefit of investing in the Major Commercial Transportation System. Failure to address the critical investment needs will have impacts on the economy of Western Canada.
Public officials must give serious attention to raising funds to maintain the Region’s ground transportation facilities and services. This should include a well-balanced set of investments serving public transportation, personal car travel, and commercial goods movement. The high value and economic stakes associated with serving commercial goods movements should be recognized in these funding and investment decisions. Consideration must also be given to
the potential tax revenue losses that would occur if the economy is hurt by a failure to maintain adequate transportation infrastructure. There is a long time lag in planning, obtaining funds, and constructing major infrastructure facilities. Therefore, there is a need to promptly address and resolve emerging issues concerning the region’s ability to pay for such projects,
as well as options for additional sources of public funds, tolls, and private investment as part of a realistic financing package. Finally, the private sector – air, marine, rail, trucking, and tourism interests – will have to cooperate with each other and with public agencies to ensure that investments are made in a balanced manner. This report focused specifically
on ground transport access, and noted that insufficient rail and highway access could adversely affect the competitiveness of local marine ports. This report
mctsG r e a t e r V a n c o u v e r G a t e w a y C o u n c i l
Economic Impact Analysis of the Major Commercial Transportation SystemEconomic Impact Analysis of the Major Commercial Transportation System
July 2003 - SW1040 E-5
did not address the need for railways and port operators to make private investments to ensure that their elements of the transportation system have
adequate capacity to effectively serve future demand.

mctsG r e a t e r V a n c o u v e r G a t e w a y C o u n c i l
Economic Impact Analysis of the Major Commercial Transportation SystemEconomic Impact Analysis of the Major Commercial Transportation System
July 2003 - SW1040 R-1
REPORT SYNOPSIS The Greater Vancouver Region is a key strategic link in the logistics chain between the North American and Asia Pacific economies. As a consequence,
the state and performance of the Greater Vancouver Region’s transportation system are critical to the economic future of British Columbia and Western Canada and have serious implications for the competitiveness of Canada’s international trade and tourism as a whole. Presently, over 200 million tonnes of cargo, over 15 million air passengers, and
one million cruise ship passengers move through the Region each year. Transporting these vast quantities of goods, services, and people generates economic activity and jobs. In Western Canada, 145,000 jobs are dependent on the Gateway. Gateway business generates 75,000 direct jobs in the Greater Vancouver Region, pays $3.6 billion in wages, and contributes $10 billion in business output per year, making the Gateway transportation
industry one of the largest employers in British Columbia. These are good, permanent jobs that provide above average wages for families in the Region. Traffic congestion is significantly raising costs for the transportation sector. These costs are increasing every year as congestion worsens. Looking to the future year 2021, it is expected that this cost will exceed $800 million per year.
As congestion in the Region increases and rail capacity limits are stretched, the volumes of goods, services and people moving through the Gateway will decline as shippers find other, less costly routes, and businesses seek other bases from which to operate. The Greater Vancouver Gateway Council is an industry led organization of
Gateway service providers. In response to concerns about growing congestion and capacity constraints on the Greater Vancouver Region road and rail systems, the Council has proposed a Major Commercial Transportation System (MCTS) in order to address the economic and environmental consequences of increasing traffic congestion and rail system capacity constraints. This proposed MCTS was designed to make best use of existing municipal and
provincial roads and bridges. A number of new infrastructure investments were also identified. The MCTS is intended to help maximize the Region’s potential to generate jobs and wealth from expanding North American and Asian trade.
mctsG r e a t e r V a n c o u v e r G a t e w a y C o u n c i l
Economic Impact Analysis of the Major Commercial Transportation SystemEconomic Impact Analysis of the Major Commercial Transportation System
July 2003 - SW1040 R-2
MCTS – A Designated Multi-Modal System to Move Goods, Services and People The MCTS is envisioned as a practical, cost effective, system of road, rail and
water routes for the movements of goods, services and people among seaports, airport, and major industrial, warehousing and business centres in the Region. The MCTS would be a designated, multi-modal network carrying the majority of local, inter-provincial and international freight movements in the Lower Mainland of British Columbia. It is intended to:
• Provide a continuous network for efficient commercial vehicle operations;
• Use road, rail, and water routes to alleviate traffic congestion;
• Accommodate future growth in goods, services, and passenger movements;
• Enable 24 hour per day unrestricted use for commercial operators;
• Provide rail movements free of road intersection constraints;
• Enhance connectivity to the major East-West and North-South trade routes;
• Provide cost-effective solutions to identified “bottlenecks”. In order to implement the MCTS, a $6.2 to $6.9 billion, twenty year, investment plan is required for 18 major and 34 minor road and rail infrastructure improvements in the Greater Vancouver Region. It is noteworthy that a number
of the proposed MCTS investments are included in existing plans and commitments, such as improvements to Highways 10 and 15 and a new Fraser River Crossing in the Langley area. While there are other considerations, such as safety and environmental concerns, the proposed MCTS was only evaluated on the economic benefits of
proceeding with the proposed investments versus the consequences of inaction for the Regional and Western Canadian economies. To confirm concerns about growing congestion, projections for growth in population and the implications for the transportation system were examined. The population of the Region is projected to grow from 2.2 million in 1999 to 3.1
million by 2021; a 42% increase. This would increase the number of vehicle trips on the road system during the morning peak each day from 320,000 in 1999 to 445,000 in 2021, a 39% increase. While included in those numbers,
mctsG r e a t e r V a n c o u v e r G a t e w a y C o u n c i l
Economic Impact Analysis of the Major Commercial Transportation SystemEconomic Impact Analysis of the Major Commercial Transportation System
July 2003 - SW1040 R-3
truck trips are projected to grow from 14,900 in 1999 to 23,200 in 2021, a 56% increase.
Key arterial rout es such as Highway 1 (Trans -Canada) and Highway 99 South to the Canada / US border are already at capacity for much of the day. Major improvements on these two routes, new capacity along the planned South Fraser Perimeter Road (SFPR), connecting Highway 99 to Highway #1, and the planned new Fraser Crossing are essential to ease gridlock on two of Canada’s
more important trade corridors. For the transit system, connections between Vancouver International Airport, Downtown Vancouver and Cruise Ship terminals are increasingly hampered by gridlock on the Oak Street and Arthur Laing bridges. A new rapid transit line is an essential component of the Airport’s and Cruise industry’s growth and of
Vancouver’s future as a major international destination. On the rail system, an aging New Westminster Rail Bridge causes significant delays to rail cargo movements serving the Port of Vancouver and hamstrings efforts to increase North-South passenger rail services due to speed and capacity restrictions. Rail improvements proposed for the MCTS will foster new
freight and passenger services and potentially help ease traffic congestion on the roads (the study indicates an increased capacity of 11 more trains per day which translates into as many as 1,100 rail cars – the equivalent of about 2200 heavy trucks and many times more automobiles). The MCTS also includes minor improvements involving coordinated traffic
signals, left turn bays, grade crossings and dedicated high occupancy or high priority vehicle lanes on the other 34 road and rail lines identified in this report. In addition, a number of locations have been identified as potential water route connections to road and / or rail networks (short sea shipping routes). These short sea routes could potentially provide additional capacity for the MCTS and help alleviate congestion.
Taken together, these transportation investments are intended to provide a continuous, connected, multi-modal system linking business and industrial centres in the Region. The MCTS has been designed in such a way as to provide alternate commercial routes in the event of road or rail closures and so ensure the smooth flow of commerce in and through the Region.

mctsG r e a t e r V a n c o u v e r G a t e w a y C o u n c i l
Economic Impact Analysis of the Major Commercial Transportation SystemEconomic Impact Analysis of the Major Commercial Transportation System
July 2003 - SW1040 R-4
MCTS – Economic Benefits and the Consequences on Inaction A detailed computer analysis of traffic flows to 2021 was carried out, with and
without the MCTS (EMME2 travel demand model). It utilized generally agreed forecasts of population growth, vehicle, and public transit usage for the Region. Forecasts for 2021 yielded the following results: Action: $6 billion MCTS program commencing in 2003 would provide:
• More efficient movement of goods, services and people in the Region: - Travel time savings of 40 million hours / year by 2021.
• An overall increase in economic activity in the Gateway and Western Canada: - $1.5 billion / year in business output - 7,300 new jobs
- $475 million / year in Gross Domestic Product … as a result of improved transportation competitiveness.
• Over 50,000 person-years of work due to the investment in additional construction of roads, rapid transit, and rail improvements.
Consequences of Inaction: failure to invest in MCTS improvements would make Greater Vancouver a less attractive place to do business and would slow the pace of economic growth. The Region’s economy would lose the above-cited growth in jobs and economic activity to others. In addition, there would be a ripple effect through the economy as suppliers and travellers cut back on transportation spending.
These results have significant policy implications for both the public and private sectors. Given the role of transportation in a rapidly globalizing economy, the consequences of congestion and the need for investment affect all levels of government. Integrated planning followed by investment is required to address longer-term strategic infrastructure priorities. The private sector must also play
a major role in providing and efficiently utilizing transportation infrastructure.

mctsG r e a t e r V a n c o u v e r G a t e w a y C o u n c i l
Economic Impact Analysis of the Major Commercial Transportation SystemEconomic Impact Analysis of the Major Commercial Transportation System
July 2003 - SW1040 R-5
In Conclusion Greater Vancouver has developed an important role in the global economy as a
key link in the logistics chain between North America and Asia. The gateway is an important component of the British Columbia economy and is vital to Western Canada and beyond. However, the Greater Vancouver Gateway faces increasing competition for its services. As integration of the North American economies proceeds and North America /
Asia trade expands, the volume and value of trade and tourism flowing through the Greater Vancouver Gateway will increase. This will create opportunities for increased economic activity and jobs. The MCTS can provide the Greater Vancouver Gateway with a competitive edge over other West Coast US gateways in capturing these opportunities and
at the same time provide a safer and more sustainable future for the citizens of the Region.

mctsG r e a t e r V a n c o u v e r G a t e w a y C o u n c i l
Economic Impact Analysis of the Major Commercial Transportation SystemEconomic Impact Analysis of the Major Commercial Transportation System
July 2003 - SW1040 1
INTRODUCTION This chapter defines the Major Commercial Transportation System, summarizes the objectives of this study and outlines the organization of the rest
of the report.
1.1 Defining the Major Commercial Transportation System The Greater Vancouver Gateway Council defined the concept of a Major Commercial Transportation System (MCTS) as an efficient and international competitive regional commercial transportation system. It includes the portion
of the overall transportation network in the Greater Vancouver Region in which the majority of the commercial traffic travels. As such, the Major Commercial Transportation System is comprised of key facilities and routes that connect the region to the major north / south and east / west trade corridors and provides connectivity to the major commercial activity centres. The key facilities serving commercial goods movement are listed in Table 1-1.
The MCTS, as a commercial transportation network connecting and serving these key facilities, requires critical improvements to sustain the economical and efficient movement of goods through one of North America's major gateways. The objectives of the MCTS are to:
§ Provide a continuous network for efficient commercial vehicle operations;
§ Utilize multi-modal solutions (road, rail, and water courses) to alleviate traffic congestion;
§ Accommodate future growth in goods and passenger movements (local and international);
§ Enable 24-hour unrestricted commercial vehicles and rail traffic use;
§ Provide rail movements free of road intersection constraints;
§ Enhance connectivity to north-south and east-west trade corridors; and
§ Provide cost-effective solutions to specific bottlenecks.

mctsG r e a t e r V a n c o u v e r G a t e w a y C o u n c i l
Economic Impact Analysis of the Major Commercial Transportation SystemEconomic Impact Analysis of the Major Commercial Transportation System
July 2003 - SW1040 2
Table 1-1 Gateway Facilities and Supporting Facilities in the
Lower Mainland (Greater Vancouver Region) International Airport 1. Vancouver International Airport
Marine Terminals 1. Cruise Terminals Canada Place
2. Centerm
3. Ballantyne (freight and cruise)
4. Burlington Northern Terminal
5. B.C. Sugar
6. United Grain Growers
7. Vanterm
8. West Coast Reduction
9. Pacific Elevators Ltd.
10. Cascadia
11. Chevron Canada
12. Shellburn Terminal
13. Westridge Terminal
14. Pacific Coast Terminal
15. Esso Petroleum Canada
16. CXY Chemicals
17. Dow Chemical Canada Ltd.
18. Lynnterm
19. Seaboard International Terminal
20. Neptune Bulk Terminal
21. Saskatchewan Wheat Pool
22. JRI
23. Fibreco Export Co.
24. Vancouver Wharves Ltd.
25. Seaspan Intermodal
26. Fraser Wharves
27. Annacis Terminal
28. Fraser Surrey Docks
29. Westshore Terminal
30. Deltaport Container Terminal
Lower Mainland Canada - US Border Crossings
1. Pacific Border Crossing - Blaine, WA (Hwy 15 in BC, I-5 in WA)
2. Douglas, BC - Blaine, WA (Peace Arch) (Hwy 99 in BC, I-5 in WA)
3. Aldergrove, BC - Lynden, WA (Hwys: 13 in BC, 539 in WA)
4. Huntingdon, BC - Sumas, WA (Hwys: 11 in BC, 9 in WA)
5. Rail – Douglas and Huntingdon
6. Tsawwassen, BC - Point Roberts, WA (local roads)
Principal Rail Yards
1. Thornton (81 tracks)
2. Tilbury (5 tracks)
3. New Westminster (7 tracks)
4. Mile 7 (8 tracks)
5. Glen Drive (14 tracks)
6. Waterfront (19 tracks)
7. Main (36 tracks)
8. Lynn Creek (31 tracks)
9. Coquitlam (94 tracks)
10. New Westminster (9 tracks)
11. K Yard (10 tracks)
12. L Yard (3 tracks)
13. M Yard (4 tracks)
14. N Yard (19 tracks)
15. O Yard (6 tracks)
16. North Vancouver (18 tracks)
17 Main (22 tracks)
18. Waterfront (8 tracks)
19. South (3 tracks)
20. New Yard –Sapperton (9 tracks)
21. New Westminster (27 tracks)
22. Pitt Meadows (14 tracks)
mctsG r e a t e r V a n c o u v e r G a t e w a y C o u n c i l
Economic Impact Analysis of the Major Commercial Transportation SystemEconomic Impact Analysis of the Major Commercial Transportation System
July 2003 - SW1040 3
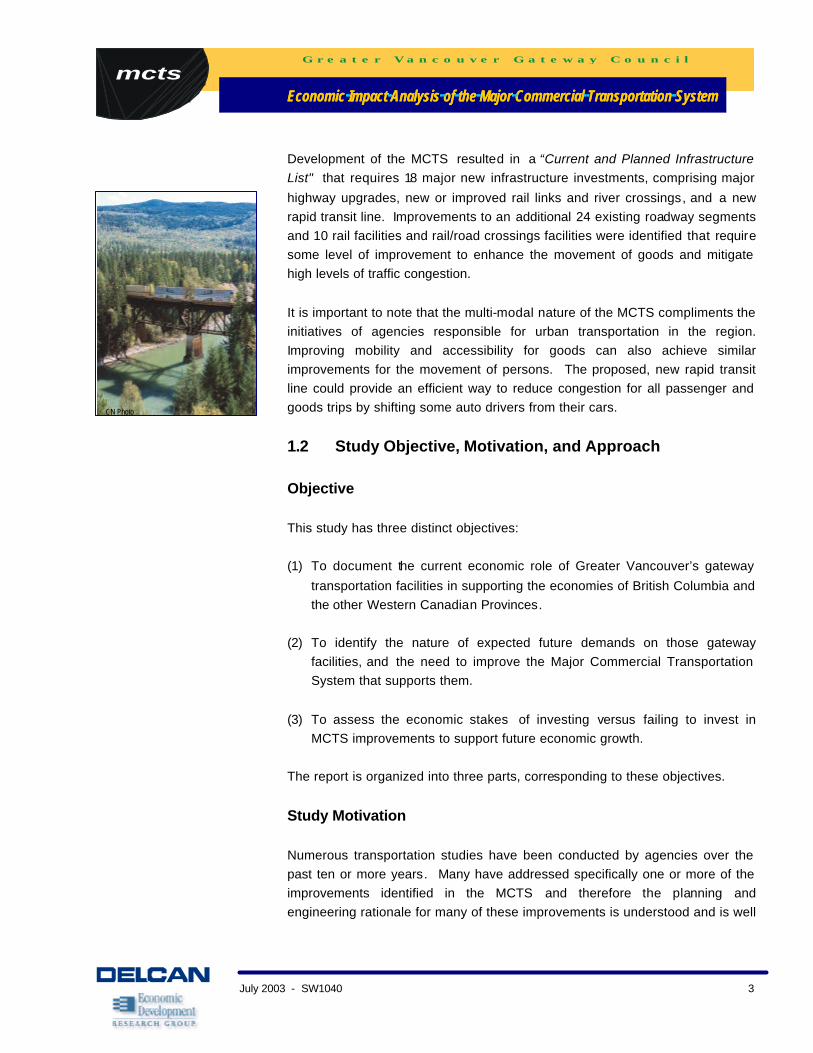
Development of the MCTS resulted in a “Current and Planned Infrastructure List" that requires 18 major new infrastructure investments, comprising major
highway upgrades, new or improved rail links and river crossings, and a new rapid transit line. Improvements to an additional 24 existing roadway segments and 10 rail facilities and rail/road crossings facilities were identified that require some level of improvement to enhance the movement of goods and mitigate high levels of traffic congestion.
It is important to note that the multi-modal nature of the MCTS compliments the initiatives of agencies responsible for urban transportation in the region. Improving mobility and accessibility for goods can also achieve similar improvements for the movement of persons. The proposed, new rapid transit line could provide an efficient way to reduce congestion for all passenger and goods trips by shifting some auto drivers from their cars.
1.2 Study Objective, Motivation, and Approach
Objective This study has three distinct objectives: (1) To document the current economic role of Greater Vancouver’s gateway
transportation facilities in supporting the economies of British Columbia and the other Western Canadian Provinces.
(2) To identify the nature of expected future demands on those gateway
facilities, and the need to improve the Major Commercial Transportation System that supports them.
(3) To assess the economic stakes of investing versus failing to invest in
MCTS improvements to support future economic growth. The report is organized into three parts, corresponding to these objectives.
Study Motivation Numerous transportation studies have been conducted by agencies over the past ten or more years. Many have addressed specifically one or more of the improvements identified in the MCTS and therefore the planning and engineering rationale for many of these improvements is understood and is well
CN Photo

mctsG r e a t e r V a n c o u v e r G a t e w a y C o u n c i l
Economic Impact Analysis of the Major Commercial Transportation SystemEconomic Impact Analysis of the Major Commercial Transportation System
July 2003 - SW1040 4
documented. Since the initiation of this study, a number of the identified projects have been approved.
However, no analysis has been produced to demonstrate the overall economic rationale for these projects as a system. There have been various reports that discussed the economic importance of the Vancouver International Airport, the Port of Vancouver, Fraser Port, and railways.2 These reports varied in terms of the time period covered, definitions of on-site and off-site activities that are
included, and the methodology for presenting overall impacts. When combined, the past studies still leave gaps in our understanding of the importance of the transportation system supporting the Greater Vancouver Gateway. They do not provide us with an understanding of the future consequences of investing, or failing to invest in upgrading of the regional transportation system.
It is clear that the current transportation system, in all its modes, has been facing the burden of continuing growth in volumes of travel activity which has resulted in increased traffic congestion. Looking to the future, a lack of new investment in the transportation system can only lead to further increases in congestion. Investment in the Greater Vancouver Region's transportation
network is required to reverse the past trends and to provide a transportation system that supports this nationally important gateway located in the region. Many members of the Gateway Council fear that if the current trend continues, the transportation system in the region will erode to the point that the Greater Vancouver Gateway loses its competitive edge along the west coast of North America. This would have a significant negative impact on the regional
economy and on everyday travel conditions in the region. Impacts would also be incurred across the Western Canadian economy.
Methodological Approach The general approach of this study is to assess the economic rationale for making improvements to the commercial transportation network. This
economic perspective builds upon existing planning perspectives and supports the Gateway Council's initiative to move these projects forward. It is designed to complement existing planning perspectives and various regional, municipal, and other urban transportation plans.
2 Economic Impact Overview (Greater Vancouver Gateway Council, 1996); Port Vancouver Economic Impact Study (Intervistas Consulting,
2001); The 2000 Economic Impact of the Vancouver International Airport (Intervistas Consulting, 2001); Fraser Port Economic Impact Study (Intervistas Consulting, 2002); Trucking in Canada 2000 (Statistics Canada, 2002.

mctsG r e a t e r V a n c o u v e r G a t e w a y C o u n c i l
Economic Impact Analysis of the Major Commercial Transportation SystemEconomic Impact Analysis of the Major Commercial Transportation System
July 2003 - SW1040 5
The study is based on two types of data analysis and modelling: (1) analysis of traffic data and forecasts, along with (2) analysis of economic data and
forecasts. The findings are ultimately expressed in terms of economic consequences that can have meaning to the public, potential investors and political decision makers. To complete this analysis, the study included efforts to:
• Examine the economies of British Columbia and all of Western Canada in terms of transportation and determine the importance of gateway facilities
(airport, seaports, others) to these economies.
• Quantify transportation benefits and costs of the various transportation infrastructure investments and network improvements.
• Connect benefits and costs of the new investments/improvements to the current and future economies.
• Confirm the economic importance of implementing new investments/ improvements over the next 20 year planning horizon versus the consequences of failing to invest.
Complementarity with Other Planning Efforts This study links the Gateway Council's MCTS with the existing transportation planning and priority process in the Lower Mainland. The use of an economic development rationale to advance urban transportation infrastructure goes a
step beyond the traditional urban decision making process. This is a welcome step, for several reasons:
• The MCTS complements existing transportation plans in the Lower Mainland. The economic rationale serves as a means to bring consensus on transportation priorities, in addition to the stated objective of being used to persuade all levels of government of the urgency to invest in transportation infrastructure.
• Achieving a sustainable community, such as that envisioned in the Liveable Region Strategy, requires the achievement of a sustainable economy. The two must work hand in hand in order to achieve the objectives of each.
• The economic influences that shape urban development are considered in urban plans in Vancouver and elsewhere, but usually indirectly (e.g., in determining growth in population or jobs). In part, this is because it is difficult to translate national or global economic influences into the very fine

mctsG r e a t e r V a n c o u v e r G a t e w a y C o u n c i l
Economic Impact Analysis of the Major Commercial Transportation SystemEconomic Impact Analysis of the Major Commercial Transportation System
July 2003 - SW1040 6
and detailed scale required for local urban planning. This study provides a unique opportunity to translate these broader economic and other local
planning influences into terms that are meaningful for all stakeholders.
The economic basis of the rationale provides a common denominator for project evaluation and assessment. Importantly, this adds another perspective to the multiple objectives that are essential in urban planning decisions, and strengthens the economic aspect of evaluation tools such as the Province's
Multiple Account Evaluation. As this report focuses on the Major Commercial Transportation System for goods movement, the analysis and economic justifications provided here only represent part of the total justification for addressing the costs of traffic congestion and the need to address it. It is also important to recognize that
economic development, urban planning and quality of life objectives are not incompatible. There is growing recognition that a region's transportation system must serve many "markets", and that the provision of choices can help encourage travellers to use the transportation system most efficiently. These choices, within the context of a balanced transportation system, can require a range of actions including travel demand management techniques, rail and
transit facilities and services, pedestrian and bicycling facilities, and road system improvements. To promote choice, they must be provided in a seamless, integrated manner.
1.3 Organization of the Report The remainder of the report is organized into three key parts:
• The first part (Chapters 2-4) provides updated information on the nature of activities at Greater Vancouver Gateway facilities and their role in the broader regional economy. It examines factors that distinguish the BC and Western Canada economies and identifies how these economies are dependent on freight transportation through the Greater Vancouver Gateway. The information presented here is critical in establishing the basis for subsequent analysis of the impacts of proposed future
transportation investments that support these facilities.
• The second part (Chapters 5-6) looks to the future to identify the nature of economic change and associated infrastructure investment required. It identifies specific projects needed to maintain the Major Commercial

mctsG r e a t e r V a n c o u v e r G a t e w a y C o u n c i l
Economic Impact Analysis of the Major Commercial Transportation SystemEconomic Impact Analysis of the Major Commercial Transportation System
July 2003 - SW1040 7
Transportation System, their cost and expected impacts on transportation system performance.
• The third part (Chapters 7-8) assesses direct and overall economic consequences of investing or failing to invest in regional commercial transportation infrastructure facilities needed to maintain the region’s economy. It builds directly on findings from the first two parts.
mctsG r e a t e r V a n c o u v e r G a t e w a y C o u n c i l
Economic Impact Analysis of the Major Commercial Transportation SystemEconomic Impact Analysis of the Major Commercial Transportation System
July 2003 - SW1040 8
Economic Role of the Greater Vancouver Gateway
2. WHAT DISTINGUISHES BC’S ECONOMY
This chapter examines how the unique and evolving nature of British Columbia’s economy and its cargo transportation system are inter-dependent. The nature of this relationship is critical as the economy of BC is particularly dependent on Gateway Transportation. As a result, the state and performance of the region’s transportation system will have important consequences for the economic future of British Columbia and other western provinces. As this
chapter focuses on regional economies, all elements of shipping and exports are discussed and presented in terms of their dollar value. Data on tonnes of commodity flows are discussed in the next chapter.
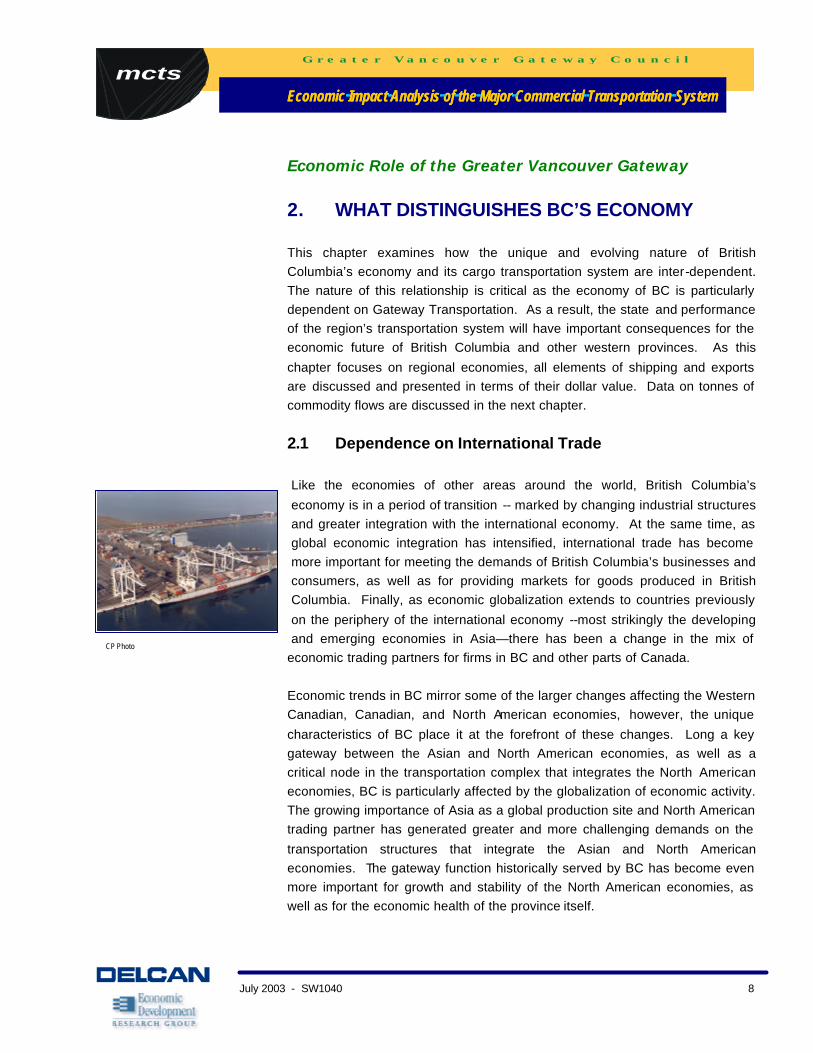
2.1 Dependence on International Trade Like the economies of other areas around the world, British Columbia’s
economy is in a period of transition -- marked by changing industrial structures and greater integration with the international economy. At the same time, as global economic integration has intensified, international trade has become more important for meeting the demands of British Columbia’s businesses and consumers, as well as for providing markets for goods produced in British Columbia. Finally, as economic globalization extends to countries previously
on the periphery of the international economy --most strikingly the developing and emerging economies in Asia—there has been a change in the mix of
economic trading partners for firms in BC and other parts of Canada. Economic trends in BC mirror some of the larger changes affecting the Western Canadian, Canadian, and North American economies, however, the unique
characteristics of BC place it at the forefront of these changes. Long a key gateway between the Asian and North American economies, as well as a critical node in the transportation complex that integrates the North American economies, BC is particularly affected by the globalization of economic activity. The growing importance of Asia as a global production site and North American trading partner has generated greater and more challenging demands on the
transportation structures that integrate the Asian and North American economies. The gateway function historically served by BC has become even more important for growth and stability of the North American economies, as well as for the economic health of the province itself.
CP Photo

mctsG r e a t e r V a n c o u v e r G a t e w a y C o u n c i l
Economic Impact Analysis of the Major Commercial Transportation SystemEconomic Impact Analysis of the Major Commercial Transportation System
July 2003 - SW1040 9
The gateway function played by British Columbia is evident in two key indicators. The first, illustrated in Figure 2-1, shows the importance of Asian
trade to the BC economy and the transportation complex centered around the Region. While trade with Asia accounts for less than 10% of all Canadian trade, it accounts for approximately 35% of British Columbia’s trade, 55% of cargo movements through the Port of Vancouver, and 95% of container movements through the port.
Figure 2-1
Asian Percentage of Total Trade by Dollar Value: Canada, British Columbia and Vancouver, 2002
Source: Comprised from Statistics Canada, International Trade Data, and Vancouver ports . Note: Shipments to Asia also occur from other ports in the region, although they did not have destination statistics available on a comparable basis for this graph. The role of BC as the key gateway between the Canadian and Asian
economies is illustrated as well in the importance of BC in handling Asian imports for the entire Canadian economy. Imports can be measured in terms of weight or in terms of dollar value to the economy. As shown in Figure 2-2, the proportion of Asian imports coming through BC has been rising since 1995, when just over 20% of the dollar value of all imports from Asia cleared Canadian customs through BC. By 2002, over 30% of the dollar value of Asian
imports were cleared through BC. Most of the remainder of Asian imports come into Canada through the US or directly to international airports throughout Canada.
% of All Canadian % of All British % of All % of Vancouver Trade Columbia Trade Vancouver Containers
100%
90%
80%
70%
60%
50%
40%
30%
20%
10%
0%

mctsG r e a t e r V a n c o u v e r G a t e w a y C o u n c i l
Economic Impact Analysis of the Major Commercial Transportation SystemEconomic Impact Analysis of the Major Commercial Transportation System
July 2003 - SW1040 10
Figure 2-2 Portion of Total Value of All Canadian Imports Entering through British
Columbia, Growth 1993-2002
0%
5%
10%
15%
20%
25%
30%
35%
40%
1993 1994 1995 1996 1997 1998 1999 2000 2001 2002
% of Imports from Asia % of Imports from Rest of World
Note: This graph shows BC’s share of Canadian imports in terms of dollar value; it is important to note that BC’s share by weight are much higher. Source: Statistics Canada (International Trade Data) and Vancouver ports.
These trends will be magnified in the coming years, as developing and emerging economies in Asia become more central to global production and trade. Although the proportion of BC total exports destined for Asia fell during the 1990s when Japan’s economic problems slowed its consumption of
imports, the decade saw the rise of two new important Asian trading partners. China and Korea emerged as the third and fourth largest destinations for BC’s exports. Given the favourable long-term growth prospects for these and other Asian economies, North American trade with Asia is likely to grow for the foreseeable future, a situation that BC is uniquely situated to exploit.
This puts BC in an unusual and enviable position -- as local economies around the world struggle to find their niche in the global economy, British Columbia can capitalize on and expand its existing role as a logistical, economic, and cultural link between North America and Asia; as well as its role within North America as a critical transportation link between the Canadian and US markets. The ability of BC to create transportation and economic structures to keep pace
with these changes will have a profound effect on the long-term economic health and employment structures within the province, a consideration of great

mctsG r e a t e r V a n c o u v e r G a t e w a y C o u n c i l
Economic Impact Analysis of the Major Commercial Transportation SystemEconomic Impact Analysis of the Major Commercial Transportation System
July 2003 - SW1040 11
importance given BC’s slow Gross Domestic Product (GDP) growth relative to the rest of Canada in the 1990s.3
2.2 Transportation Role in Provincial Economies
Economy of British Columbia. BC’s role as a gateway also shapes its economic and employment structures; structures that exhibit higher dependence on transportation-related jobs than other parts of Canada. BC’s gateway function also has important implications for the local and regional
economies. Recent economic trends in BC illustrate how the industrial and geographic transformations that have marked local and national economies over the past decades co-exist with the basic structures of the “old economy,” which still accounts for a large number of jobs and continues to account for a significant portion of the area’s Gross Domestic Product (GDP).
Evidence of the “new economy,” with its emphasis on services provision as the key driver for economic growth, can be found in changing employment structures in British Columbia. As the data in Table 2-1 show, provincial employment in service-producing sectors grew faster than in other sectors of the provincial economy between 1992 and 2002. However, employment in goods-producing sectors has still continued to grow -- by 27,000 over that time
period. Employment in agriculture and other primary sectors experienced absolute employment declines during the decade. However, BC’s economy still remains strongly dependent on primary goods relative to the rest of Canada: more than half of manufacturing GRP is from forest and mineral products, a proportion two times greater than for the rest of Canada. 4
3 Gross Domestic Product (GDP) represents the size of the economy, measured by the market value of goods and services produced within the
borders of the province or nation. It effectively represents the “value added” portion of total business sales, since it does not count the value of raw materials and intermediate goods that are purchased and resold. GDP in BC grew slower than the Canadian average during the 1990s. Of greater concern, growth in per capita GDP in the province lagged considerably behind the national average/trend and since 1996, per capita GDP levels have been below the national average. BC STATS: Business Indicators, Issue 01-11, November, 2001; Ministry of Management Services (www.bcstats.gov.bc.ca/pubs/bcbi/bcbi0111.pdf ).
4 Source: BC Stats (www.bcstats.gov.bc.ca/pubs/bcbi/bcbi9811.pdf)
mctsG r e a t e r V a n c o u v e r G a t e w a y C o u n c i l
Economic Impact Analysis of the Major Commercial Transportation SystemEconomic Impact Analysis of the Major Commercial Transportation System
July 2003 - SW1040 12
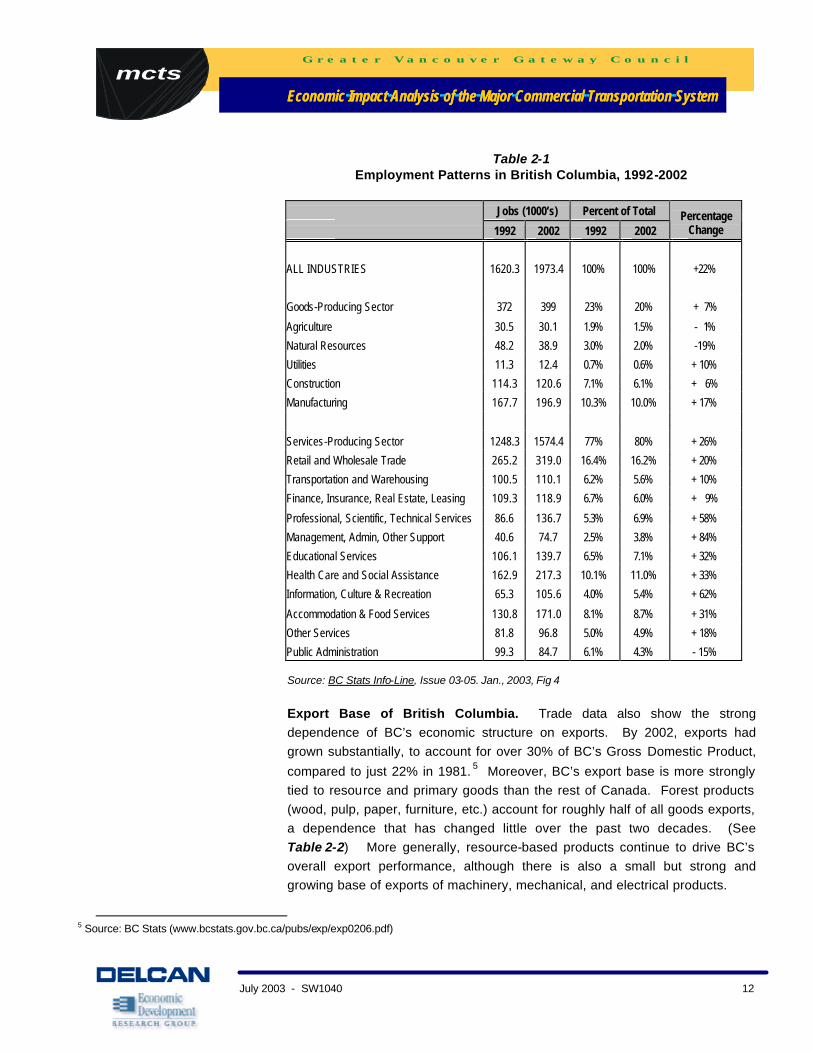
Table 2-1 Employment Patterns in British Columbia, 1992-2002
Jobs (1000’s) Percent of Total
1992 2002 1992 2002 Percentage
Change
ALL INDUSTRIES 1620.3 1973.4 100% 100% +22%
Goods-Producing Sector 372 399 23% 20% + 7%
Agriculture 30.5 30.1 1.9% 1.5% - 1%
Natural Resources 48.2 38.9 3.0% 2.0% -19%
Utilities 11.3 12.4 0.7% 0.6% + 10%
Construction 114.3 120.6 7.1% 6.1% + 6%
Manufacturing 167.7 196.9 10.3% 10.0% + 17%
Services-Producing Sector 1248.3 1574.4 77% 80% + 26%
Retail and Wholesale Trade 265.2 319.0 16.4% 16.2% + 20%
Transportation and Warehousing 100.5 110.1 6.2% 5.6% + 10%
Finance, Insurance, Real Estate, Leasing 109.3 118.9 6.7% 6.0% + 9%
Professional, Scientific, Technical Services 86.6 136.7 5.3% 6.9% + 58%
Management, Admin, Other Support 40.6 74.7 2.5% 3.8% + 84%
Educational Services 106.1 139.7 6.5% 7.1% + 32%
Health Care and Social Assistance 162.9 217.3 10.1% 11.0% + 33%
Information, Culture & Recreation 65.3 105.6 4.0% 5.4% + 62%
Accommodation & Food Services 130.8 171.0 8.1% 8.7% + 31%
Other Services 81.8 96.8 5.0% 4.9% + 18%
Public Administration 99.3 84.7 6.1% 4.3% - 15% Source: BC Stats Info-Line, Issue 03-05. Jan., 2003, Fig 4 Export Base of British Columbia. Trade data also show the strong dependence of BC’s economic structure on exports. By 2002, exports had grown substantially, to account for over 30% of BC’s Gross Domestic Product,
compared to just 22% in 1981. 5 Moreover, BC’s export base is more strongly tied to resource and primary goods than the rest of Canada. Forest products (wood, pulp, paper, furniture, etc.) account for roughly half of all goods exports, a dependence that has changed little over the past two decades. (See Table 2-2) More generally, resource-based products continue to drive BC’s overall export performance, although there is also a small but strong and growing base of exports of machinery, mechanical, and electrical products.
5 Source: BC Stats (www.bcstats.gov.bc.ca/pubs/exp/exp0206.pdf)

mctsG r e a t e r V a n c o u v e r G a t e w a y C o u n c i l
Economic Impact Analysis of the Major Commercial Transportation SystemEconomic Impact Analysis of the Major Commercial Transportation System
July 2003 - SW1040 13
The importance of resource-based products to the local economy also means that economic health is closely tied to availability and efficiency of local
transportation services. Unlike other manufacturing products, for which transportation represents a relatively small portion of total costs, total costs of resource-based products tend to be highly dependent on transportation costs. For example, transportation costs as a percent of total costs are estimated at 45% for coal, 30% for forest products, 29% for non-metallic minerals, 28% for grains, and 18% for lumber products 18%.6
Table 2-2
Exports from BC, 1992-2002 (Values in $1000’s)
1992 2002
Growth: 1992-2002
Percent Change
% Change Adj for Inflation
Wood 5,643,384 8,939,854 + 3,296,470 + 58% 22% Mineral Products 1,820,851 3,504,361 + 1,683,510 + 92% 49% Pulp 2,421,767 2,737,733 + 315,966 + 13% - 13% Paper 1,489,980 2,221,908 + 731,928 + 49% 15% Mechanical Equip 533,589 1,302,453 + 768,864 + 144% 89% Seafood 609,904 986,760 + 376,856 + 62% 25% Electrical Machinery 221,370 939,064 + 717,694 + 324% 228% Motor Vehicles 198,996 856,651 + 657,655 + 330% 233% Aluminium 447,952 604,316 + 156,364 + 35% 4% Ores 784,538 577,428 - 207,110 - 26% - 43% Plastics 55,074 509,202 + 454,128 + 825% 615% Furniture 75,864 504,544 + 428,680 + 565% 414% Instruments 103,188 469,504 + 366,316 + 355% 252% Iron & Steel Products 119,121 424,466 + 305,345 + 256% 175% Organic Chemicals 149,419 324,487 + 175,068 + 117% 68% Subtotal Top 15 14,674,997 24,902,731 +10,227,734 + 70% 31% All Others 2,255,746 4,973,168 + 2,717,422 + 87%
70%
Total (All Products) 16,930,743 29,875,899 +12,945,156 + 76% 36% Source: Statistics Canada. Changes are shown in nominal (current year terms) and adjusted for inflation on the basis of Canadian manufacturing price index. Export Base – Other Provinces in Western Canada. The economies of
Manitoba, Alberta, and Saskatchewan also rely heavily on exports. In 2001, the ratio of exports to total GDP (an indicator, though not a precise measure of export dependence) was 28% for Manitoba, 35% for Saskatchewan, and 38% for Alberta, compared to 25% for BC. 7 Thus, these provinces are at least as
6 See Greater Vancouver Gateway Council Newsletter
7 Percentages calculated based on 2001 GDP and export numbers from Statistics Canada.
mctsG r e a t e r V a n c o u v e r G a t e w a y C o u n c i l
Economic Impact Analysis of the Major Commercial Transportation SystemEconomic Impact Analysis of the Major Commercial Transportation System
July 2003 - SW1040 14
dependent as BC on efficient and reliable international transportation structures for economic growth and well-being.
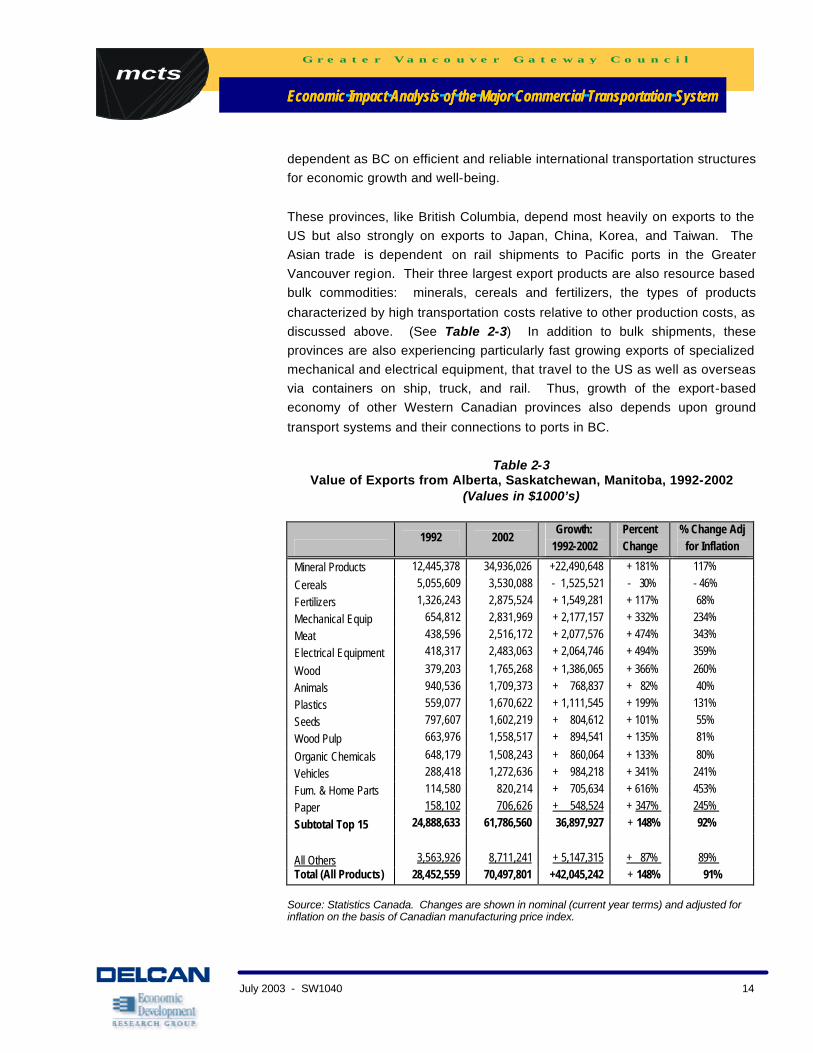
These provinces, like British Columbia, depend most heavily on exports to the US but also strongly on exports to Japan, China, Korea, and Taiwan. The Asian trade is dependent on rail shipments to Pacific ports in the Greater Vancouver region. Their three largest export products are also resource based bulk commodities: minerals, cereals and fertilizers, the types of products
characterized by high transportation costs relative to other production costs, as discussed above. (See Table 2-3) In addition to bulk shipments, these provinces are also experiencing particularly fast growing exports of specialized mechanical and electrical equipment, that travel to the US as well as overseas via containers on ship, truck, and rail. Thus, growth of the export-based economy of other Western Canadian provinces also depends upon ground
transport systems and their connections to ports in BC.
Table 2-3 Value of Exports from Alberta, Saskatchewan, Manitoba, 1992-2002
(Values in $1000’s)
1992 2002
Growth: 1992-2002
Percent Change
% Change Adj for Inflation
Mineral Products 12,445,378 34,936,026 +22,490,648 + 181% 117%
Cereals 5,055,609 3,530,088 - 1,525,521 - 30% - 46%
Fertilizers 1,326,243 2,875,524 + 1,549,281 + 117% 68%
Mechanical Equip 654,812 2,831,969 + 2,177,157 + 332% 234%
Meat 438,596 2,516,172 + 2,077,576 + 474% 343%
Electrical Equipment 418,317 2,483,063 + 2,064,746 + 494% 359%
Wood 379,203 1,765,268 + 1,386,065 + 366% 260%
Animals 940,536 1,709,373 + 768,837 + 82% 40%
Plastics 559,077 1,670,622 + 1,111,545 + 199% 131%
Seeds 797,607 1,602,219 + 804,612 + 101% 55%
Wood Pulp 663,976 1,558,517 + 894,541 + 135% 81%
Organic Chemicals 648,179 1,508,243 + 860,064 + 133% 80%
Vehicles 288,418 1,272,636 + 984,218 + 341% 241%
Furn. & Home Parts 114,580 820,214 + 705,634 + 616% 453%
Paper 158,102 706,626 + 548,524 + 347% 245%
Subtotal Top 15 24,888,633 61,786,560 36,897,927 + 148% 92%
All Others 3,563,926 8,711,241 + 5,147,315 + 87%
89% Total (All Products) 28,452,559 70,497,801 +42,045,242 + 148% 91%
Source: Statistics Canada. Changes are shown in nominal (current year terms) and adjusted for inflation on the basis of Canadian manufacturing price index.
mctsG r e a t e r V a n c o u v e r G a t e w a y C o u n c i l
Economic Impact Analysis of the Major Commercial Transportation SystemEconomic Impact Analysis of the Major Commercial Transportation System
July 2003 - SW1040 15
Importance of the Transportation and Warehousing Sector. Due to its role as an international gateway, BC’s economy is more concentrated in
transportation and warehousing activities than the Canadian average. As shown earlier in Table 2-1, BC employment in this sector grew by 10% over the past decade and in 2002, accounted for over 110,000 jobs in BC. This only represents the number of jobs in transportation and warehousing companies. It does not count additional jobs associated with in-house transportation and warehousing functions, or other support services that are also part of the larger
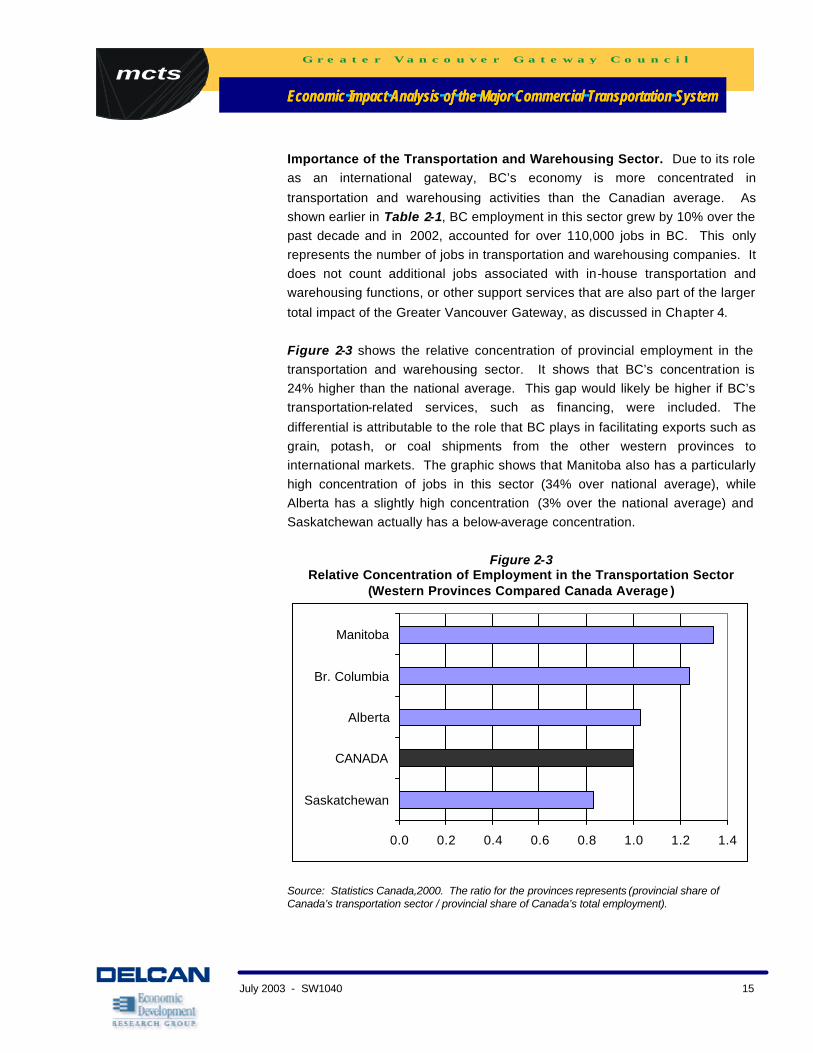
total impact of the Greater Vancouver Gateway, as discussed in Chapter 4. Figure 2-3 shows the relative concentration of provincial employment in the transportation and warehousing sector. It shows that BC’s concentration is 24% higher than the national average. This gap would likely be higher if BC’s transportation-related services, such as financing, were included. The
differential is attributable to the role that BC plays in facilitating exports such as grain, potash, or coal shipments from the other western provinces to international markets. The graphic shows that Manitoba also has a particularly high concentration of jobs in this sector (34% over national average), while Alberta has a slightly high concentration (3% over the national average) and Saskatchewan actually has a below-average concentration.
Figure 2-3
Relative Concentration of Employment in the Transportation Sector (Western Provinces Compared Canada Average )
0.0 0.2 0.4 0.6 0.8 1.0 1.2 1.4
Saskatchewan
CANADA
Alberta
Br. Columbia
Manitoba
Source: Statistics Canada,2000. The ratio for the provinces represents (provincial share of Canada’s transportation sector / provincial share of Canada’s total employment).

mctsG r e a t e r V a n c o u v e r G a t e w a y C o u n c i l
Economic Impact Analysis of the Major Commercial Transportation SystemEconomic Impact Analysis of the Major Commercial Transportation System
July 2003 - SW1040 16
Implications for the Future. This overview illustrates two defining characteristics of the BC economy:
• The traditional resource-based elements of the economy and the “new” technology-oriented manufacturing elements of the economy continue to co-exist and create unique demands on local transportation and economic
structures. While exports of manufactured goods is increasing, resource-based industries and the transportation structures that support them remain central to the economic health of the province, as well as the health of the other western provinces that rely on BC’s transportation networks to move their goods to international markets.
• The Greater Vancouver Region’s role and status as a continental and international gateway is of national strategic interest. It creates and demands a more extensive transportation-related sector within the BC economy than would otherwise be the case. As the international economy becomes ever more integrated, especially with rapidly-growing developing
and emerging economies in Asia, port cities up and down the west coast of North America will face new challenges, as well as new opportunities for growth. Because of these strong economic connections, the response towards meeting these future needs in the Greater Vancouver region can be a notable factor in the health of the economies of BC and other western Canadian provinces.
3. HOW DOES THE GREATER VANCOUVER GATEWAY SERVE THE FLOW OF GOODS?
While the previous chapter summarized the economic (dollar) value of exports and trade flows, that is only part of the story. This chapter profiles the actual level of freight cargo (in terms of tonnes and volume of various products) moving into, out-of and through the Greater Vancouver region. This includes imports and exports of products to and from BC, as well as
trans-shipment of products that pass through BC as part of their movement between Asia and the US, between Asia and elsewhere in Canada, or between the Western US and elsewhere in Canada.
CN Photo
mctsG r e a t e r V a n c o u v e r G a t e w a y C o u n c i l
Economic Impact Analysis of the Major Commercial Transportation SystemEconomic Impact Analysis of the Major Commercial Transportation System
July 2003 - SW1040 17
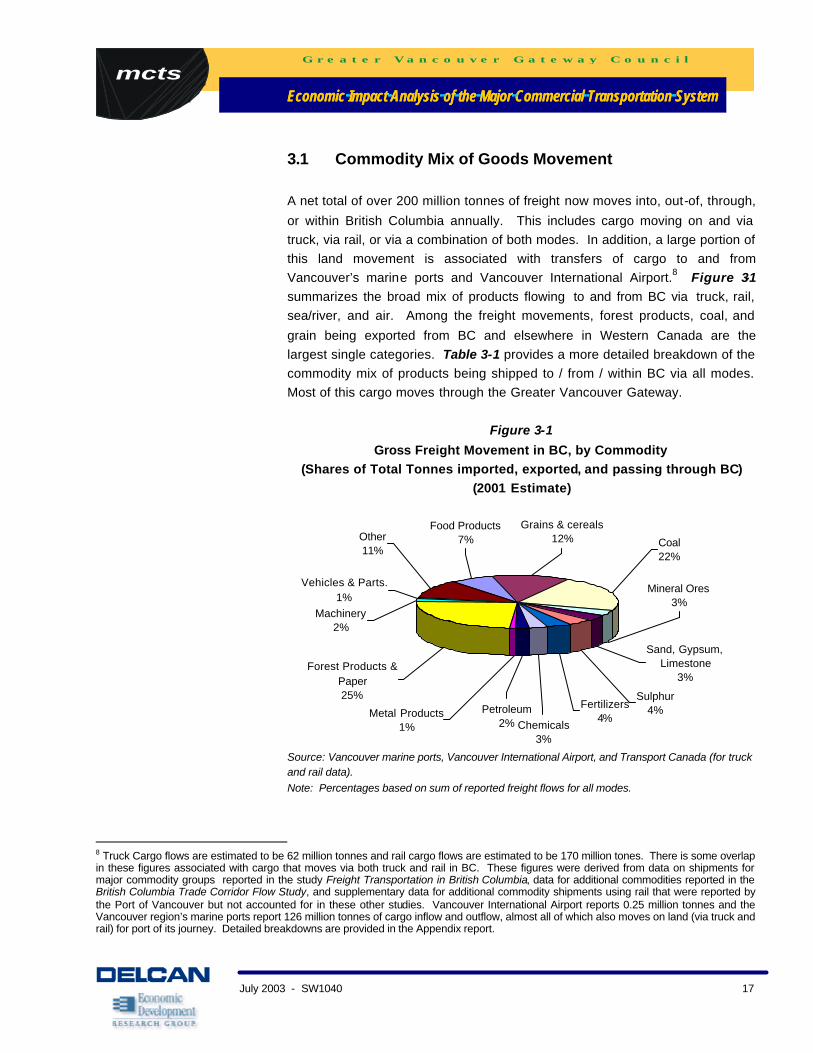
3.1 Commodity Mix of Goods Movement A net total of over 200 million tonnes of freight now moves into, out-of, through,
or within British Columbia annually. This includes cargo moving on and via truck, via rail, or via a combination of both modes. In addition, a large portion of this land movement is associated with transfers of cargo to and from Vancouver’s marine ports and Vancouver International Airport.8 Figure 3-1 summarizes the broad mix of products flowing to and from BC via truck, rail, sea/river, and air. Among the freight movements, forest products, coal, and
grain being exported from BC and elsewhere in Western Canada are the largest single categories. Table 3-1 provides a more detailed breakdown of the commodity mix of products being shipped to / from / within BC via all modes. Most of this cargo moves through the Greater Vancouver Gateway.
Figure 3-1
Gross Freight Movement in BC, by Commodity (Shares of Total Tonnes imported, exported, and passing through BC)
(2001 Estimate)
Food Products7%
Grains & cereals12% Coal
22%
Sand, Gypsum, Limestone
3%
Mineral Ores3%
Sulphur4%
Other 11%
Vehicles & Parts.1%
Machinery2%
Chemicals3%
Fertilizers4%
Forest Products & Paper25%
Petroleum2%
Metal Products1%
Source: Vancouver marine ports, Vancouver International Airport, and Transport Canada (for truck and rail data). Note: Percentages based on sum of reported freight flows for all modes.
8 Truck Cargo flows are estimated to be 62 million tonnes and rail cargo flows are estimated to be 170 million tones. There is some overlap in these figures associated with cargo that moves via both truck and rail in BC. These figures were derived from data on shipments for major commodity groups reported in the study Freight Transportation in British Columbia, data for additional commodities reported in the British Columbia Trade Corridor Flow Study, and supplementary data for additional commodity shipments using rail that were reported by the Port of Vancouver but not accounted for in these other studies. Vancouver International Airport reports 0.25 million tonnes and the Vancouver region’s marine ports report 126 million tonnes of cargo inflow and outflow, almost all of which also moves on land (via truck and rail) for port of its journey. Detailed breakdowns are provided in the Appendix report.

mctsG r e a t e r V a n c o u v e r G a t e w a y C o u n c i l
Economic Impact Analysis of the Major Commercial Transportation SystemEconomic Impact Analysis of the Major Commercial Transportation System
July 2003 - SW1040 18
Table 3-1 Gross Freight Movement in BC, by Commodity
(Tonnes imported, exported, and passing through BC) (2001 estimate)
Commodity Annual Tonnes
Forest Products & Paper 87,041,271 Coal 79,641,312
Grains & cereals 44,560,065
Mixed Container, etc. 38,803,746
Food Products 25,740,732
Sulphur 15,476,331
Fertilizers 15,081,350
Mineral Ores 12,277,300
Sand, Gypsum, Limestone 10,508,060
Chemicals 9,830,611
Petroleum 7,925,411
Machinery 7,057,104
Vehicles & Parts. 3,364,418
Metal Products 2,783,946
Source: Based on date from Vancouver marine ports, Vancouver International Airport, and Transport Canada (Freight Transportation in British Columbia and supplemented by the Trade Corridor Flow Study) updated to a consistent 2001 basis. Note: Values represent gross sum of reported freight flows for all modes and hence include some double counting of freight that travels via multiple modes. Due to multiple sources, there is no accurate correction to show the breakdown of net total flows.
3.2 Origin-Destination and Mode of Goods Movement
Origin-Destination Pattern. Freight moving in BC is split among domestic and international movements. As shown in Figure 3-2, freight moving wholly within BC accounts for only 38% of all freight on the road in BC. The rest (62%) are movements of freight to or from the US, overseas and elsewhere in Canada. This underscores the importance of BC’s transportation infrastructure as a conduit for international and trans-Canadian cargo flows.

mctsG r e a t e r V a n c o u v e r G a t e w a y C o u n c i l
Economic Impact Analysis of the Major Commercial Transportation SystemEconomic Impact Analysis of the Major Commercial Transportation System
July 2003 - SW1040 19
Figure 3-2 Freight Movement in BC, by Origin/Destination
(portion of total freight tonnes, 2001 estimate)
US7% OVERSEAS
35%
BC38%
REST OF CANADA
20%
Source: Estimate based on combined data from Vancouver marine ports, Vancouver International Airport and Transport Canada (Freight Transportation in British Columbia, supplemented by the British Columbia Trade Corridor Flow Study), Note: Current data sources track truck and rail cargo movements separately from airport and marine port cargo activity, and there is no linkage between these sources. As a result, cargo that is travels via rail or truck from BC ports to destinations in BC are reported as “BC to BC” movements” even if the cargo actually originated overseas. The figures shown here combine the land, marine and air cargo movements.
Mode of Transport. There is a strong and obvious connection between freight origin-destination patterns and modes of transport. As shown in Figure 3-3, freight moving to/from overseas locations is essentially all by sea (when measured in terms of tonnes of weight). Movement of freight to/from elsewhere in Canada is predominantly (over 80%) by rail, which reflects the emphasis on movement of bulk commodities. On the other hand, 60% of the freight movement to/from the US is via truck through the US
border with Washington State. It should be noted that data on freight flows include some overlap across transport modes, because any given commodity shipment may use two or more modes of transport to reach its destination. For example, cargo may be trucked to a rail terminal, loaded onto railcars, and finally transferred to ships for delivery to a foreign destination.
Statistics for each mode record handling the same commodity as it moves from mode to mode. There is also some overlap among origin/destination categories, as 5% of BC exports to the US were imported from overseas and then immediately re-exported to the US. Of course, the inexactness of tracking multi-modal freight flows also makes it

mctsG r e a t e r V a n c o u v e r G a t e w a y C o u n c i l
Economic Impact Analysis of the Major Commercial Transportation SystemEconomic Impact Analysis of the Major Commercial Transportation System
July 2003 - SW1040 20
difficult to identify the exact share of freight traffic that relies on Greater Vancouver Gateway facilities. However, these measurement difficulties do not materially affect the
key conclusions to be drawn about how different modes of transport in BC fundamentally serve different types of origin-destination flows and carry different types of products.
Figure 3-3
BC Freight Movement by Mode and Origin/Destination
(portion of total freight tonnes, 2001 est.)
0%
20%
40%
60%
80%
100%
USA Overseas BritishColumbia
Rest ofCanada
Air Cargo
Truck
Rail
Maritime
Source: Estimate based on combined data from Vancouver marine ports, Vancouver International Airport and Transport Canada (for truck and rail data)
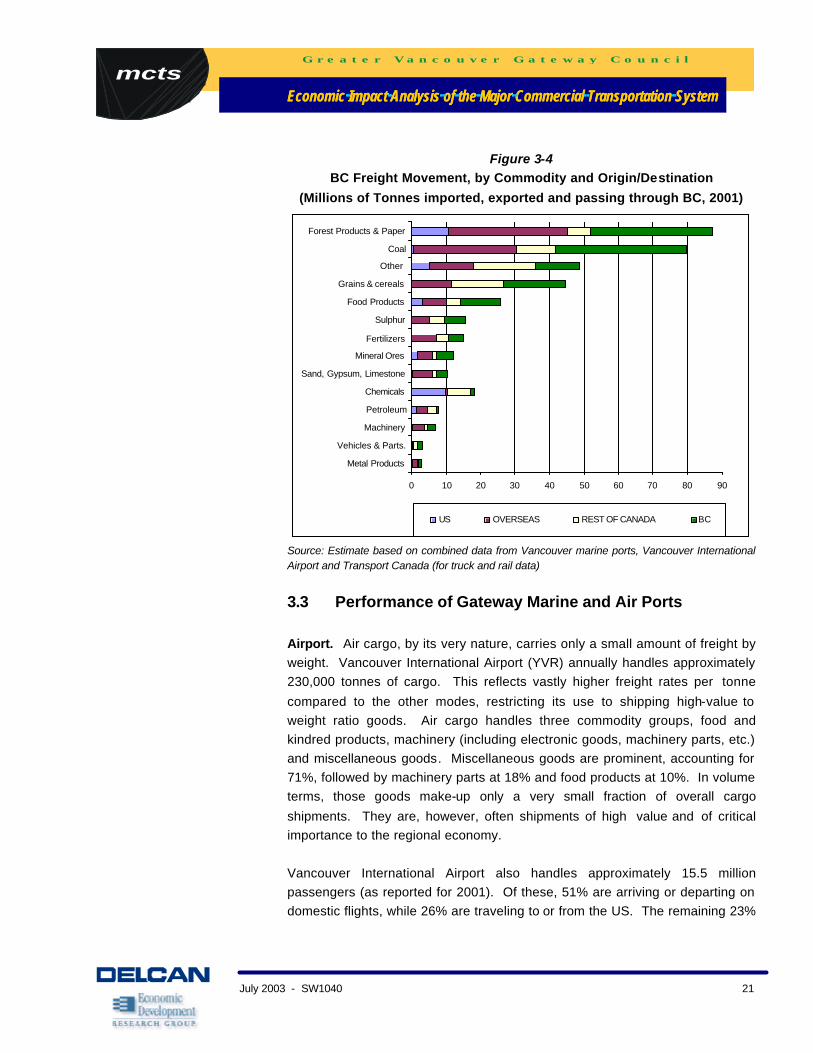
The nature of freight transportation needs for the Vancouver Region is determined largely by the mix of products flowing through the region and their ultimate origin/destination patterns. Figure 3-4 shows that the US is a major
market for the flow of forest products, chemicals, and mixed container (“other”) movements. Overseas markets account for a large share of the forest products, coal, grain/cereal, fertilizer and machinery movements. (The value of these exports is shown earlier, in Table 2.2) Shipments to/from the rest of Canada are dominated by mixed container, grain and coal shipments. Shipments within BC are predominantly forest products, grains and coal; these
include some commodities that are processed in BC and then shipped elsewhere, as well as some shipments that are transferred to other modes within BC and then reshipped to final destinations elsewhere.
mctsG r e a t e r V a n c o u v e r G a t e w a y C o u n c i l
Economic Impact Analysis of the Major Commercial Transportation SystemEconomic Impact Analysis of the Major Commercial Transportation System
July 2003 - SW1040 21
Figure 3-4 BC Freight Movement, by Commodity and Origin/Destination
(Millions of Tonnes imported, exported and passing through BC, 2001)
0 10 20 30 40 50 60 70 80 90
Metal Products
Vehicles & Parts.
Machinery
Petroleum
Chemicals
Sand, Gypsum, Limestone
Mineral Ores
Fertilizers
Sulphur
Food Products
Grains & cereals
Other
Coal
Forest Products & Paper
US OVERSEAS REST OF CANADA BC
Source: Estimate based on combined data from Vancouver marine ports, Vancouver International Airport and Transport Canada (for truck and rail data)
3.3 Performance of Gateway Marine and Air Ports Airport. Air cargo, by its very nature, carries only a small amount of freight by weight. Vancouver International Airport (YVR) annually handles approximately 230,000 tonnes of cargo. This reflects vastly higher freight rates per tonne
compared to the other modes, restricting its use to shipping high-value to weight ratio goods. Air cargo handles three commodity groups, food and kindred products, machinery (including electronic goods, machinery parts, etc.) and miscellaneous goods. Miscellaneous goods are prominent, accounting for 71%, followed by machinery parts at 18% and food products at 10%. In volume terms, those goods make-up only a very small fraction of overall cargo
shipments. They are, however, often shipments of high value and of critical importance to the regional economy. Vancouver International Airport also handles approximately 15.5 million passengers (as reported for 2001). Of these, 51% are arriving or departing on domestic flights, while 26% are traveling to or from the US. The remaining 23%

mctsG r e a t e r V a n c o u v e r G a t e w a y C o u n c i l
Economic Impact Analysis of the Major Commercial Transportation SystemEconomic Impact Analysis of the Major Commercial Transportation System
July 2003 - SW1040 22
are international passengers. Vancouver’s share of Canadian air passengers is roughly proportional to the Vancouver region’s share of Canadian population,
about 11% of the total. Marine Ports. In recent years, the Vancouver Gateway marine ports annually handle about 70,000,000 metric tonnes of cargo, (including both bulk and containers). This includes over 1.5 million TEUs (twenty-foot equivalent units) of containers. Over the past decade, the ports in British Columbia have
become increasingly important to the North American maritime system. Although bulk cargo accounts for the greatest portion of freight by weight--around 80% in recent years--maritime container trade has driven much of the gateway’s recent growth. In the 1991-2001 period, container traffic at Greater Vancouver Gateway ports grew much more rapidly than at other North American ports, as shown in Figure 3-5.
Figure 3-5
Growth in Sea Shipping of Container Traffic (TEUs)
0%10%20%30%40%50%60%70%80%90%
100%
North Canada West Coast Vancouver
1991-1996 1996-2001
Source: American Association of Port Authorities
North Canada West Coast Vancouver America (US & Canada) Gateway

mctsG r e a t e r V a n c o u v e r G a t e w a y C o u n c i l
Economic Impact Analysis of the Major Commercial Transportation SystemEconomic Impact Analysis of the Major Commercial Transportation System
July 2003 - SW1040 23
During this 10 year period, containers passing through Greater Vancouver Gateway ports grew by 200% (reflecting an average of nearly 20% per year).
This is over double the growth rate over the same period for all West Coast ports and for all North American ports. In 2001, ports in Greater Vancouver handled 6.7% of all containers--roughly one of every sixteen containers-- shipped through Canadian and American west coast ports, compared with just 4.4% in 1991. Most of this growth, however, came in the years preceding 1999, when Greater Vancouver ports handled 7.0% of all west coast container
traffic.
Most recently, activity at Greater Vancouver ports has performed less well. During the 1999-2001 period, when container growth rates slowed dramatically across North America, growth of Vancouver ports was only 7%, which lagged behind the 12% growth at other west coast ports as well as 9% overall growth
in North American container traffic over the same time period. Some of this growth lag at Vancouver has been attributed in the press to port and ground access congestion. 9 In any case, if there is continued investment to keep costs of moving cargo at competitive levels, the Greater Vancouver ports can be well positioned to gain their earlier momentum once the international economy picks up.
4. THE ECONOMIC IMPORTANCE OF GATEWAY FACILITIES
This chapter documents the magnitude of jobs and business activity that are directly associated with Greater Vancouver’s transportation facilities and services. It then presents estimates of the additional jobs and business activity that are located elsewhere in British Columbia and other western provinces, that depend on the gateway transportation facilities
and services for their business activity. This chapter is important in that it provides a current and consistent presentation of the economic role of all elements of the Greater Vancouver Gateway. It fills in gaps and updates findings from prior studies to provide a consistent definition of Gateway
transportation and its economic role. This information is of interest in its own right and is also a basis for calculating future impacts associated with investing
in Major Commercial Transportation System improvements.
9 See, for example, “Box crescendo bucks global trade trend at Vancouver,” Lloyd’s List (Section: Pacific Northwest) August 28, 2002, p.13; and
“Subaru Joins Nissan in Shipping through Newport News, Va.,” Virginian-Pilot , August 24, 2002.
CN Photo

mctsG r e a t e r V a n c o u v e r G a t e w a y C o u n c i l
Economic Impact Analysis of the Major Commercial Transportation SystemEconomic Impact Analysis of the Major Commercial Transportation System
July 2003 - SW1040 24
4.1 Direct Effects: Gateway Facilities and Services
Gateway Facilities and Services The direct economic impact of the Greater Vancouver Gateway is the jobs, income, and output of the businesses that operate these facilities or those that support the operation of these facilities and services – spanning air, water, rail, and roadway transport. This can include transportation and warehousing
companies, maintenance and repair services, and other on-site providers of products and services that cater to the workers or support the operation of these transportation functions. Table 4-1 summarizes the number of jobs, the total business output that is directly associated with Gateway facilities, the personal income paid to workers,
and Gross Domestic Product (value added). These findings indicate that, counting only direct impacts, the Greater Vancouver Gateway activities account for more than 75,000 jobs and $10 billion of business output – representing approximately 5% of the total BC economy.10 It is also notable that the average annual wage per job is approximately $48,000, indicating that Gateway transportation activities provide higher paying jobs than the provincial average
(approximately $35,000 per year according to BC Stats).
Table 4-1 Direct Economic Impact of Greater Vancouver Gateway Transportation
Activity, 2002 Maritime
TransportAir
Transport Truck
Transport Rail
Transport Total
Transport
Total Direct Jobs 33,527 23,385 14,214 4,064 75,190
Wages ($, mil./yr.) $1,946 $935 $510 $241 $3,632
GDP ($, mil./yr.) * $1,942 $1,484 $851 $329 $4,606
Output ($, mil./yr.) $5,399 $2,394 $1,903 $713 $10,409 Sources: "Economic Impact Overview "(Greater Vancouver Gateway Council, 1996); "Port Vancouver Economic Impact Study" (Intervistas Consulting, 2001); "The 2000 Economic Impact of the Vancouver International Airport" (Intervistas Consulting, 2001); "Fraser Port Economic Impact Study" (Intervistas Consulting, 2002); "Trucking in Canada 2000" (Statistics Canada, 2002); and update estimates to recast all of the studies into a common definition of direct effects, by Economic Development Research Group (see Appendix document for further explanation). Note: GDP (Gross Domestic Product) represents the Value Added portion of total business sales volume (output).
10 The personal income, GDP and business output values cannot be added together since personal income and GDP are both subsets of total
business output.

mctsG r e a t e r V a n c o u v e r G a t e w a y C o u n c i l
Economic Impact Analysis of the Major Commercial Transportation SystemEconomic Impact Analysis of the Major Commercial Transportation System
July 2003 - SW1040 25
It is also important to note that these measures of total economic impact have been adjusted downward to eliminate double counting. For instance, prior
studies of employment at marine ports and the airport have counted some on-site trucking and/or rail jobs, while these same jobs have also been counted by the railroads and trucking companies. Those jobs are legitimately part of the marine port and airport activities. However, to develop appropriate measures of the overall magnitude of total Gateway jobs and economic activities, it is necessary to adjust the measures of direct impacts to avoid double-counting. It
is also important to note that these figures only represent the direct effects of activity at the Gateway facilities; there are additional economic activities that support and depend upon the Gateway activities, which are discussed later in this chapter. The specific definitions of direct economic impacts of Gateway transportation
facilities and services are as follows: Maritime transport employment figures are based on extensive surveys of port and related businesses. They are defined to include shipping company and cruise-line employees who work at the port (roughly 7,000), as well as those in ship repair and port construction, off-site supporting businesses and
other port located businesses. This latter group serves both port employees and tourists. Total maritime employment is estimated to be approximately 33,000 jobs -- the single most important generator of direct employment. This figure builds upon and updates results of earlier studies for the Port of Vancouver in 2000 and Fraser River Port Authority in 2001, 11 as well as an earlier 1989 study of the North Fraser port authority. To be consistent with
prior studies, this broad definition also includes some port -dependent manufacturing and service jobs located on the premises of the North Fraser Port. Besides adjusting all figures to exclude rail and trucking activity that is also counted elsewhere, all figures have been updated to 2002 on the basis of changes in port activity levels in recent years.
Air transport employment is estimated at approximately 23,000 jobs, the second largest mode in the gateway region. This number includes employees of the airport authority, airport contractors, airlines, air cargo services, aviation support services (including repair, fuelling, food services, etc.), and airport tenants (providing retail sales and services to passengers), as well as government agencies (involved in airport and control tower operation and
11 "Port Vancouver Economic Impact Study" (Intervistas Consulting, 2001) and "Fraser Port Economic Impact Study" (Intervistas Consulting,
2002)

mctsG r e a t e r V a n c o u v e r G a t e w a y C o u n c i l
Economic Impact Analysis of the Major Commercial Transportation SystemEconomic Impact Analysis of the Major Commercial Transportation System
July 2003 - SW1040 26
regulation of international passenger and freight movements). These estimates are updated from an earlier economic impact study prepared for the Vancouver
International Airport.12 All figures have been adjusted to 2002 estimates on the basis of changes in airport activity levels in recent years. Trucking transportation employment associated with Gateway operations (i.e., long-distance and export-based cargo movements) is estimated to be approximately 14,000. This figure represents roughly half of total trucking
industry employment in BC. Estimates for value of output and wages are taken from the latest truck transport data for 2000 compiled by Statistics Canada for for-hire trucking. 13 The Greater Vancouver Gateway portion of observed BC employment was identified on the basis of freight movement and industry employment data. To derive Gateway trucking employment, analysis was conducted to identify the portion of truck shipment volumes (tonnage) that could
be linked to port activity and Canada-US border traffic, to estimate the share of jobs and income attributable to the Gateway function. Trucking activity that is associated with local delivery movements in the Vancouver region, rather than trips to/from Gateway facilities, has not been counted here as part of the Gateway, but some of it is captured later as activity
that is indirectly dependent upon Gateway activity. Finally, an adjustment has been made to reflect the fact that many businesses own and operate their own in-house truck fleet rather than contract with for-hire trucking firms. This activity is not measured in standard economic accounts. Of the total trucking jobs linked to Gateway activities, 4,000 are identified as
being within the air and seaport themselves, with the balance made of up trucking associated with Gateway import/export activity. Rail transport employment which is directly part of the Vancouver Gateway activity is estimated to be approximately 4,000 jobs, representing approximately 2/3 of all railroad industry jobs in BC. The Port of Vancouver and Fraser River
Port Authority studies had together identified nearly 7,700 rail transportation jobs supported by those port activities, but that also included rail jobs located elsewhere in BC and in other western provinces..
12 "The 2000 Economic Impact of the Vancouver International Airport" (Intervistas Consulting, 2001) 13 "Trucking in Canada 2000." (Statistics Canada, 2002)

mctsG r e a t e r V a n c o u v e r G a t e w a y C o u n c i l
Economic Impact Analysis of the Major Commercial Transportation SystemEconomic Impact Analysis of the Major Commercial Transportation System
July 2003 - SW1040 27
Comparison with Provincial Employment Data
Overall, the Greater Vancouver Gateway Transportation facilities and services directly account for approximately 75,000 jobs. This is roughly of the same magnitude as the BC Stats figure that there are approximately 71,000 jobs in transportation industries in British Columbia (as shown in Table 4-2). However, these two measures actually differ in important ways.
• The BC Stats measure is defined broader than the direct impact of Gateway transportation facilities and services in two ways: (1) The BC
Stats figure includes employment in local public transit and rail passenger services, as well as local urban delivery services. These services are not counted as part of the direct impact of Gateway transportation facilities and services, since much of their use is for travel by local residents and short -distance deliveries entirely within British Columbia. (2) The BC Stats figure also includes employment at facilities and companies located in northern
BC, most of which are outside of the Greater Vancouver region and not associated with Greater Vancouver Gateway transportation.
• On the other hand, the BC Stats measure is also narrower than the direct impact of Gateway transportation facilities and services, in that it does not include employment within supporting service industries, related government agencies, in-house trucking and shipping departments (of manufacturers) and other related industrial and office activities on the
premises of air and marine ports. All of those services are counted as part of the direct impact of Gateway transportation facilities and services.
Table 4-2
Transportation Employment in British Columbia, by Industry, 2002
Category Jobs
Air Transport 13,900 Rail Transport 6,500
Water Transport 6,500 Truck Transport 28,200
Transit & Ground Pass. Transport 16,300 Subtotal: Transportation Sectors* 71,600
Scenic & Sightseeing 19,300 Postal Service 7,400
Couriers 6,700
Total: Transport & Related Sectors* 105,100 Source: BC Stats; all values rounded to multiples of one hundred *totals differ slightly from the sum of individual lines due to rounding
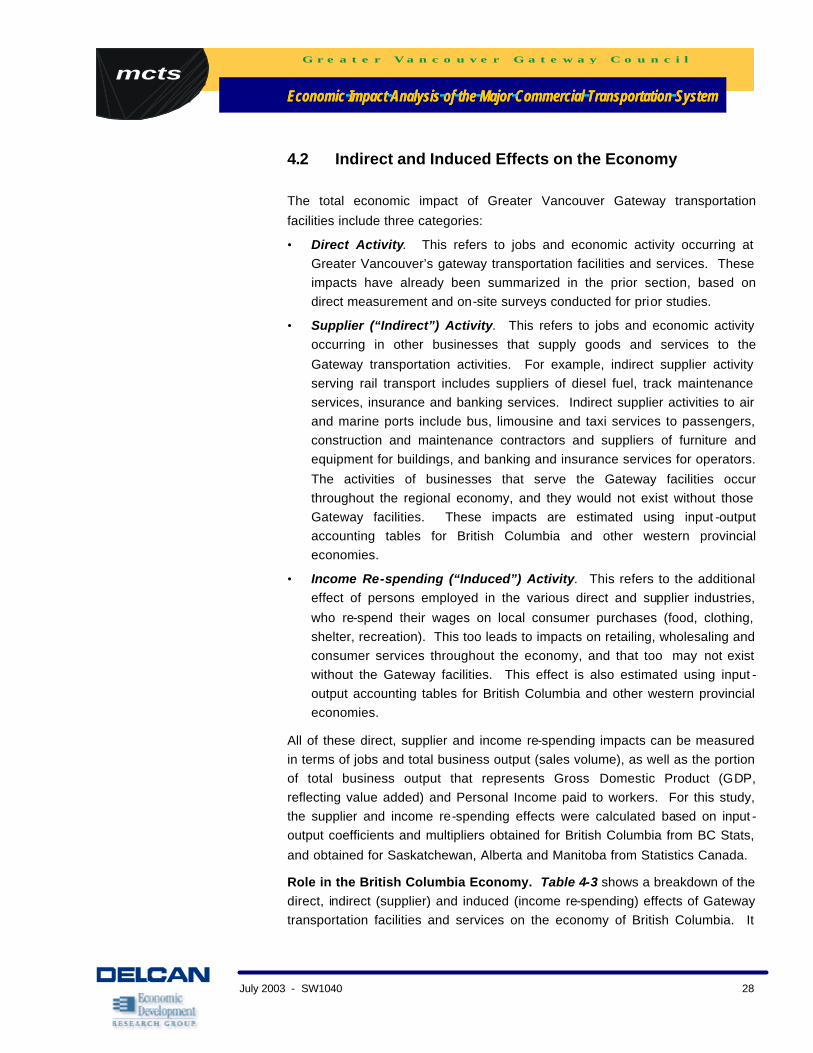
mctsG r e a t e r V a n c o u v e r G a t e w a y C o u n c i l
Economic Impact Analysis of the Major Commercial Transportation SystemEconomic Impact Analysis of the Major Commercial Transportation System
July 2003 - SW1040 28
4.2 Indirect and Induced Effects on the Economy The total economic impact of Greater Vancouver Gateway transportation
facilities include three categories:
• Direct Activity. This refers to jobs and economic activity occurring at Greater Vancouver’s gateway transportation facilities and services. These impacts have already been summarized in the prior section, based on direct measurement and on-site surveys conducted for prior studies.
• Supplier (“Indirect”) Activity. This refers to jobs and economic activity occurring in other businesses that supply goods and services to the
Gateway transportation activities. For example, indirect supplier activity serving rail transport includes suppliers of diesel fuel, track maintenance services, insurance and banking services. Indirect supplier activities to air and marine ports include bus, limousine and taxi services to passengers, construction and maintenance contractors and suppliers of furniture and equipment for buildings, and banking and insurance services for operators.
The activities of businesses that serve the Gateway facilities occur throughout the regional economy, and they would not exist without those Gateway facilities. These impacts are estimated using input -output accounting tables for British Columbia and other western provincial economies.
• Income Re-spending (“Induced”) Activity. This refers to the additional effect of persons employed in the various direct and supplier industries,
who re-spend their wages on local consumer purchases (food, clothing, shelter, recreation). This too leads to impacts on retailing, wholesaling and consumer services throughout the economy, and that too may not exist without the Gateway facilities. This effect is also estimated using input -output accounting tables for British Columbia and other western provincial economies.
All of these direct, supplier and income re-spending impacts can be measured in terms of jobs and total business output (sales volume), as well as the portion of total business output that represents Gross Domestic Product (GDP, reflecting value added) and Personal Income paid to workers. For this study, the supplier and income re-spending effects were calculated based on input -output coefficients and multipliers obtained for British Columbia from BC Stats,
and obtained for Saskatchewan, Alberta and Manitoba from Statistics Canada.
Role in the British Columbia Economy. Table 4-3 shows a breakdown of the direct, indirect (supplier) and induced (income re-spending) effects of Gateway transportation facilities and services on the economy of British Columbia. It
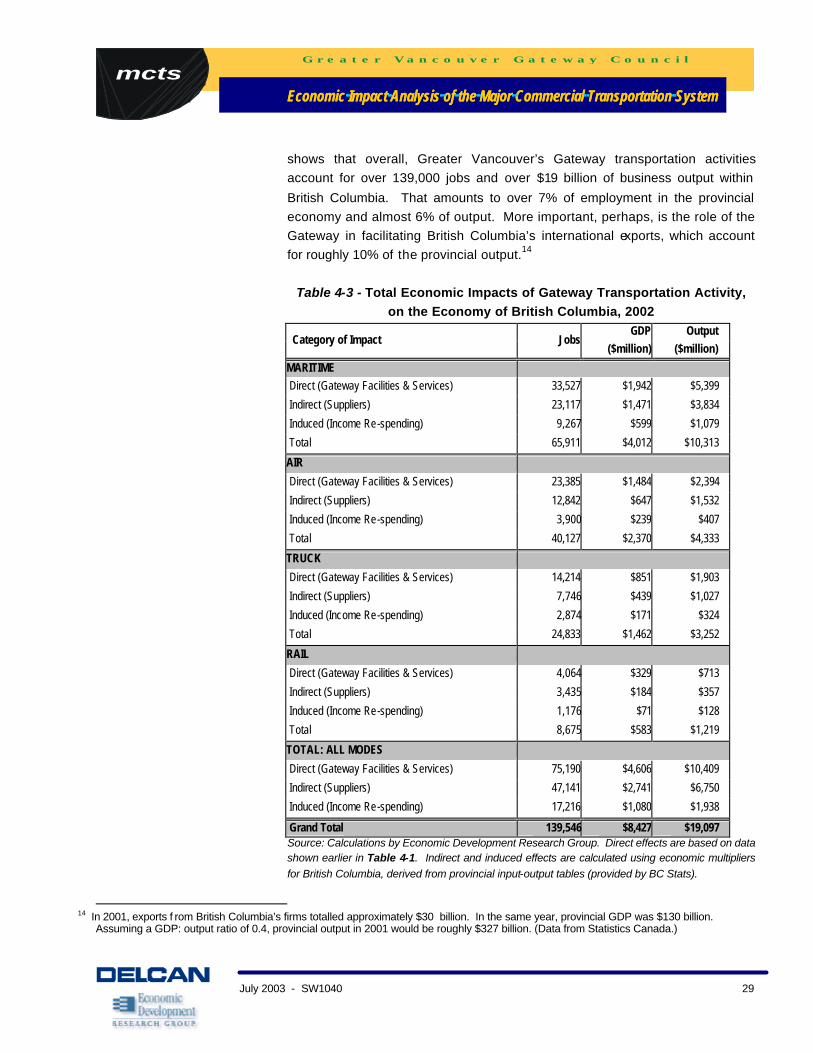
mctsG r e a t e r V a n c o u v e r G a t e w a y C o u n c i l
Economic Impact Analysis of the Major Commercial Transportation SystemEconomic Impact Analysis of the Major Commercial Transportation System
July 2003 - SW1040 29
shows that overall, Greater Vancouver’s Gateway transportation activities account for over 139,000 jobs and over $19 billion of business output within
British Columbia. That amounts to over 7% of employment in the provincial economy and almost 6% of output. More important, perhaps, is the role of the Gateway in facilitating British Columbia’s international exports, which account for roughly 10% of the provincial output.14
Table 4-3 - Total Economic Impacts of Gateway Transportation Activity,
on the Economy of British Columbia, 2002 GDP Output
Category of Impact Jobs($million) ($million)
MARITIME Direct (Gateway Facilities & Services) 33,527 $1,942 $5,399
Indirect (Suppliers) 23,117 $1,471 $3,834
Induced (Income Re-spending) 9,267 $599 $1,079
Total 65,911 $4,012 $10,313
AIR
Direct (Gateway Facilities & Services) 23,385 $1,484 $2,394
Indirect (Suppliers) 12,842 $647 $1,532
Induced (Income Re-spending) 3,900 $239 $407
Total 40,127 $2,370 $4,333
TRUCK
Direct (Gateway Facilities & Services) 14,214 $851 $1,903
Indirect (Suppliers) 7,746 $439 $1,027
Induced (Income Re-spending) 2,874 $171 $324
Total 24,833 $1,462 $3,252
RAIL
Direct (Gateway Facilities & Services) 4,064 $329 $713
Indirect (Suppliers) 3,435 $184 $357
Induced (Income Re-spending) 1,176 $71 $128
Total 8,675 $583 $1,219
TOTAL: ALL MODES
Direct (Gateway Facilities & Services) 75,190 $4,606 $10,409
Indirect (Suppliers) 47,141 $2,741 $6,750
Induced (Income Re-spending) 17,216 $1,080 $1,938
Grand Total 139,546 $8,427 $19,097 Source: Calculations by Economic Development Research Group. Direct effects are based on data shown earlier in Table 4-1. Indirect and induced effects are calculated using economic multipliers for British Columbia, derived from provincial input-output tables (provided by BC Stats).
14 In 2001, exports f rom British Columbia’s firms totalled approximately $30 billion. In the same year, provincial GDP was $130 billion.
Assuming a GDP: output ratio of 0.4, provincial output in 2001 would be roughly $327 billion. (Data from Statistics Canada.)

mctsG r e a t e r V a n c o u v e r G a t e w a y C o u n c i l
Economic Impact Analysis of the Major Commercial Transportation SystemEconomic Impact Analysis of the Major Commercial Transportation System
July 2003 - SW1040 30
Role in the Rest of the Western Canadian Economy. The Gateway also has a significant effect on the economies of the other western provinces, Alberta,
Manitoba, and Saskatchewan. In its role in shipping goods from these provinces to international, especially Asian, markets, the Gateway indirectly supports local mining, agricultural, and manufacturing interests. In addition, the shipment of goods from these provinces to the Gateway directly generates jobs, GDP and output in the trucking and rail sectors. Within the other western provinces, it is estimated that the transportation functions that service
shipments to the Greater Vancouver Gateway directly generate another 4,400 direct jobs, $175 million in GDP, and $250 million in output. The total direct, indirect, and induced impact on the economies of these western provinces includes almost 6,500 jobs, $250 in GDP, and $375 million in output.15 (See Table 4-4)
Table 4-4 Total Economic Impacts of Gateway Transportation Activity
Alberta, Manitoba, and Saskatchewan, 2002
Category of Impact Jobs GDP
($ 000s) Output
($ 000s)
TRUCK Direct (Rail and Trucking) 3,491 126 172
Indirect and Induced 1,448 54 89
Total 4,940 179 261
RAIL
Direct (Rail and Trucking) 933 49 79
Indirect and Induced 586 24 38
Total 1,519 73 116
TOTAL: TRUCK AND RAIL
Direct (Rail and Trucking) 4,424 175 251
Indirect and Induced 2,034 78 127
Grand Total 6,459 252 377 Source: Calculations by Economic Development Research Group. Direct effects are based on data shown earlier in Table 4-1. Indirect and induced effects are calculated using economic multipliers for Alberta, Manitoba, and Saskatchewan, derived from provincial input-output tables (provided by BC Stats).
15 These estimates are based on the proportion of total provincial output that can be attributed to exports to Asia--shipments that are likely to
utilize Gateway facilities—and provincial input-output multipliers for truck and rail.

mctsG r e a t e r V a n c o u v e r G a t e w a y C o u n c i l
Economic Impact Analysis of the Major Commercial Transportation SystemEconomic Impact Analysis of the Major Commercial Transportation System
July 2003 - SW1040 31
Investment Needs
5. EXPECTED CHANGES IN TRANSPORTION NEEDS
This chapter discusses the nature of expected changes in domestic and
international economies and trade patterns that will increase pressure on the Greater Vancouver region’s transportation system. The forecasts presented in this chapter indicate that demand for freight transportation in British Columbia is likely to expand in the future. This means that Greater Vancouver’s role as an international gateway for Canada will continue to grow, and the province will also become an increasingly important transportation hub for the movement of
goods between Canadian provinces, the United States, and Asia. In this way, the fate of the economy of BC and other western provinces will be increasingly tied to the costs and efficiency of Greater Vancouver’s transportation facilities.
5.1 Overall Growth of Transportation Demand Over 360 million tonnes of cargo move to/from or within British Columbia annually.16 Table 5-1 shows current magnitude of shipments and future growth of cargo shipments in British Columbia for the 2001 to 2021 period. This includes shipments to BC from outside, from BC to outside, and shipments within BC. (Urban delivery movements are excluded.) It shows that, assuming adequate infrastructure to accommodate freight growth, total cargo shipments
will continue to grow, with an average annual growth rate of 2.1% over the 2001 to 2021 period. Thus, the historic importance of transportation-related activities to the British Columbia economy discussed in earlier chapters is expected to be a continuing source of growth and employment for the province. These forecasts were developed by using information on recent trends in
shipping demand at Greater Vancouver ports and adjusting them to reflect forecasts of expected long-run changes in economic and transportation conditions. Specifically, in sectors for which actual forecasts were available (usually from government sources), including coal and agricultural products, these forecasts were used. In the absence of such forecast data, growth in export levels for each product were estimated based on recent BC and
Canadian export trends.
16 Transport Canada, Freight Transportation in British Columbia, March 2002.

mctsG r e a t e r V a n c o u v e r G a t e w a y C o u n c i l
Economic Impact Analysis of the Major Commercial Transportation SystemEconomic Impact Analysis of the Major Commercial Transportation System
July 2003 - SW1040 32
These forecasts were then adjusted to reflect recent trends in vessel usage in international trade and growth in the popularity of container shipments for
freight movements. Finally, an adjustment was made to account for potential uncertainty in US-Canadian currency exchange rates. (A detailed description of the forecast methodology is presented in Appendix 5.) To be prudent and conservative, the forecasts of BC and rest of Canada economic growth were adjusted downward to reflect the likelihood that the
favourable Canadian-US exchange rate in evidence over the past decade might reverse itself in future years, a trend already in evidence in the first half of 2003. An increase in the value of the Canadian dollar relative to the US dollar increases the costs of operations at Canadian ports relative to those in the US, and amplifies the importance of other competitive conditions at Greater Vancouver’s ports.
Table 5-1
Cargo Shipments in BC, by Mode (tonnes) 2001 Estimate and 2021 Forecast
Category 2001 2021Percent Change
Maritime Cargo 126,441,478 176,259,144 39% Rail Cargo 170,649,441 290,286,764 70% Truck Cargo 62,772,066 74,831,276 19% Air Cargo 228, 672 429,368 88%
Total Cargo 360,091,657 541,806,553 50% Source: Air and maritime cargo data were reported by Vancouver International Airport Authority, Vancouver Port Authority, Fraser River Port Authority and North Fraser Port Authority. Truck and rail cargo flows were derived from data on shipments for major commodity groups reported in the study “Freight Transportation in British Columbia,” data for additional commodities reported in the “British Columbia Trade Corridor Flow Study” and supplementary data for additional rail shipments reported by the Port of Vancouver. All values were adjusted to represent common 2001 year levels. Forecasts for 2021 were calculated by Economic Development Research Group, based on a combination of port and provincial economic trends and forecasts, with further adjustment for future exchange rate uncertainty. (Detailed methodology is presented in Appendix 5.)

mctsG r e a t e r V a n c o u v e r G a t e w a y C o u n c i l
Economic Impact Analysis of the Major Commercial Transportation SystemEconomic Impact Analysis of the Major Commercial Transportation System
July 2003 - SW1040 33
5.2 Differences by Transport Mode Future growth rates are expected to vary significantly across modes,, as shown
in Table 5-1 above. Air cargo is forecast to be growing most rapidly in percentage terms, though it also represents the smallest portion of freight tonnage. In terms of tonnage growth, the largest growth is forecast to occur in maritime and rail movements. However, it is important to note that the truck numbers shown in Table 5-1 include only long-distance motor freight. In fact, rail and maritime shipments also generate local truck deliveries at origin and
destination ends. As a result, total trucking within Greater Vancouver (notably, for local shipments, but also including inter-urban and cross-border trips and trips to and from the ports, airport and rail terminals) is expected to grow over 50% by 2021. This issue is addressed in more detail in Chapter 6, Section 6.4. It is estimated that by 2021, almost 75 million tonnes of product will be
transported by truck within the province on an annual basis. Rail tonnage is also expected to grow steadily during the forecast period, with a cumulative increase of 60%. By 2021, almost 300 million tonnes of freight are expected to move by rail through British Columbia. Maritime freight movements are also expected to grow significantly by 2021,
resulting in a cumulative percentage increase of 39%. Much of this growth will take place at Port of Vancouver, and will be driven by container shipment growth, especially imports, while cargo exports (Vancouver's largest category by volume) will be relatively slow-growing. Air cargo, which currently accounts for only a small portion of freight movements within British Columbia, is expected to grow rapidly in percentage terms in the forecast period, but will
remain a small part of overall freight movement. Expected trends in cargo movements by mode are illustrated in Figure 5-1.

mctsG r e a t e r V a n c o u v e r G a t e w a y C o u n c i l
Economic Impact Analysis of the Major Commercial Transportation SystemEconomic Impact Analysis of the Major Commercial Transportation System
July 2003 - SW1040 34
Figure 5-1 Cargo Shipments in BC by Mode,
(millions of tones, 2001 Actual and 2021 Forecast)
0
100
200
300
400
500
600
2001 2021
Air Cargo
Truck Cargo
Rail Cargo
Maritime Cargo
5.3 Composition of Cargo
The composition of freight movements is also expected to change over the forecast period. As shown in Table 5-2, movements of all bulk commodities are expected to grow in volume. The growth of the more mature commodity groups (such as coal, sand & gravel, forest products and paper) are expected to grow slower than the overall average and thus account for a smaller proportion of total freight movement in 2021. The largest proportionate change
is expected to come from growth in shipments of machinery and equipment that move via container shipment. Changes in product composition affect not only the overall economic impact and the particular sectors affected (as will be discussed in later chapters) but also modal trends. There are two reasons for this. First,
product and industry characteristics shape the choice of mode used. For example, as just-in-time production becomes more common in the textile and apparel industry, air shipments have gained in importance relative to maritime shipments of goods. (See Figure 5-2) Second, industry and
product characteristics shape the type of maritime freight movements. Thus, slow forecast growth in bulk cargo products (such as grains) and rapid growth
in products moved in containers (such as machinery) contribute to more rapid growth in maritime container shipments—as well as truck and rail demand for
Source: See Table 5-1
CP Photo

mctsG r e a t e r V a n c o u v e r G a t e w a y C o u n c i l
Economic Impact Analysis of the Major Commercial Transportation SystemEconomic Impact Analysis of the Major Commercial Transportation System
July 2003 - SW1040 35
container shipments in and out of the port. They also lead to slower growth in maritime bulk cargo and the rail services used to transport bulk goods to and
from ports.
Table 5-2 Breakdown of Cargo Tonnes Shipped in BC, by Product,
2001 Estimate and 2021 Forecast
COMMODITY 2001 2021
Food and kindred products 7.1% 5.8% Grains, cereals 12.4% 12.6% Coal 22.1% 21.1% Non-metallic and metallic mineral ore 3.4% 4.6% Sand, gravel, gypsum, limestone, aggregates 2.9% 2.0% Sulphur 4.3% 4.4% Fertilizers 4.2% 4.3% Portland cement 0.4% 1.2% Chemicals 2.7% 2.6% Petroleum 2.2% 2.1% Salt 0.2% 0.1% Metal products (ferrous and nonferrous) 0.8% 2.0% Forest products and paper 24.2% 22.1% Machinery 2.0% 3.9% Vehicles and parts 0.9% 0.8% Mixed, miscellaneous, other non-classified 10.2% 10.4%
TOTAL 100.0% 100.0% Note: Percentages based on tonnes of cargo Source: See Table 5-1
mctsG r e a t e r V a n c o u v e r G a t e w a y C o u n c i l
Economic Impact Analysis of the Major Commercial Transportation SystemEconomic Impact Analysis of the Major Commercial Transportation System
July 2003 - SW1040 36
Figure 5-2 Shifts in Mode Mix: Share of Pacific Coast Exports to Asia Shipped by
Water, 1997 and 2001
78%
37%41%
53%54%
27%
63%60%
0%
10%
20%
30%
40%
50%
60%
70%
80%
90%
1997 2001
Note: Percentages based on tonnes of cargo shipped. While this is based on US data for Pacific coast exports, the same patterns and trends apply for Canada exports to Asia. Source: Calculations by Economic Development Research Group, based on data from US Census Bureau and US international trade statistics (MISER Trade Database)
5.4 Origin and Destination Patterns Another trend relates to the origins and final destinations of freight that passes through British Columbia. As the data in Table 5-3 indicate, there are expected
to be minor geographic shifts in freight movements in the 2001 to 2021 period, towards a slightly larger share of BC goods movement occurring within Canada. These forecasts reinforce the finding that growth and employment in British Columbia will continue to be strongly affected by the economic health of other Canadian provinces.
Textile Mill Apparel and Fabricated Metal Leather & Related Products Accessories Products Products

mctsG r e a t e r V a n c o u v e r G a t e w a y C o u n c i l
Economic Impact Analysis of the Major Commercial Transportation SystemEconomic Impact Analysis of the Major Commercial Transportation System
July 2003 - SW1040 37
Table 5-3 Breakdown of Cargo Tonnes Shipped in BC, by Origin/Destination
2001Estimate and 2021 Forecast
Current (2001) Future (2021)
To/From Overseas 35% 33% To/From US 7% 7% To/From Rest of Canada 20% 21% To/From BC 38% 39%
Total 100% 100% Source: Transport Canada, Freight Transportation in British Columbia, March 2002 and calculations by Economic Development Research Group, based on port and provincial economic trends and forecasts.

mctsG r e a t e r V a n c o u v e r G a t e w a y C o u n c i l
Economic Impact Analysis of the Major Commercial Transportation SystemEconomic Impact Analysis of the Major Commercial Transportation System
July 2003 - SW1040 38
6. INFRASTRUCTURE NEEDS This chapter defines the specific road and rail projects that have been proposed to address current and future commercial transportation needs in the Greater
Vancouver Region. The associated costs and traffic impacts are discussed.
6.1 Facility Investment Objectives The previous chapters described the nature of British Columbia’s economy, how it is expected to grow and change over time, and how future demand generally will impact the use of British Columbia’s different goods movement
modes. This chapter now focuses upon their implications to Greater Vancouver’s transportation infrastructure; specifically, to the road, transit and rail networks that constitute the Major Commercial Transportation System.17 The greatest overall impact, in terms of scale and pervasiveness, will be on Greater Vancouver’s road system; that is, by trucks delivering goods within, to,
from and through the region: the anticipated growth in goods movements must be superimposed upon the increased demands for passenger movement generated by the expected growth in Greater Vancouver’s population. In particular, growth in private auto trips is expected to increase rapidly, with the single-occupant auto trip continuing to dominate. This will result in continued competition for road space among autos, trucks, transit vehicles and other
travellers. To meet both the current and future demand in an effective manner, improvements to the Major Commercial Transportation System are required. These improvements to the existing transportation infrastructure will permit the Major Commercial Transportation System to provide improved connectivity
between the Gateway and major commercial activity centres through an efficient system of roadways, railways, and waterways.
17 Implications for individual border crossings, ports, the airport or rail terminals are beyond the scope of this analysis and thus are not
considered here.
mctsG r e a t e r V a n c o u v e r G a t e w a y C o u n c i l
Economic Impact Analysis of the Major Commercial Transportation SystemEconomic Impact Analysis of the Major Commercial Transportation System
July 2003 - SW1040 39
Several objectives were defined for the Major Commercial Transportation System, and include the following: 18
• Provide a continuous network for efficient commercial vehicle operations;
• Utilize multi-modal solutions (road, rail, and water courses) to alleviate traffic congestion;
• Accommodate future growth in goods, services, and local and international passenger movements;
• Enable 24-hour unrestricted commercial vehicles and rail traffic use;
• Provide rail movements free of road int ersection constraints;
• Enhance connectivity to north-south & east-west trade corridors;
• Provide for cost-effective solutions to specific bottlenecks.
The current analysis of the transportation network in the Greater Vancouver Region suggests that the t ransportation system is incomplete. Accordingly, a series of transportation infrastructure projects has been identified to achieve these objectives. These transportation infrastructure projects are introduced and briefly described below. In addition, the basic transportation impacts that are addressed through the implementation of these transportation projects are
described. Finally, the resultant traffic conditions are discussed after these transportation infrastructure improvements are in place.
6.2 Transportation Infrastructure Projects Traffic congestion on the key segments of the road network within the Greater Vancouver Region is a recurring condition which in turn, negatively affects the
movement of goods. The frequency and magnitude of the recurring congestion results from lack of capacity to meet peak period demands placed on the road network. The rail network also experiences significant capacity issues which, like the road network, occur during peak periods and thus result in significant delays and operating costs to the rail companies. The various transportation infrastructure improvement projects identified by
members of the Greater Vancouver Gateway Council address many of these congestion issues on the road (and, by implication, transit) and rail networks.
18 Major Commercial Transportation System. Rail Capacity and Regional Planning – Issues Overview. Draft 2, February 2003.

mctsG r e a t e r V a n c o u v e r G a t e w a y C o u n c i l
Economic Impact Analysis of the Major Commercial Transportation SystemEconomic Impact Analysis of the Major Commercial Transportation System
July 2003 - SW1040 40
Primarily, the needs addressed by the various road based and transit transportation infrastructure projects are:
• Relieve congestion on the major highway and arterial routes within the Greater Vancouver Region, either by increasing capacity or by diverting auto drivers to transit;
• Provide a bypass or give priority to commercial vehicles on congested routes;
• Provide more direct connections to and from both major Gateway and commercial activity centres.
It is important to note that many of the road and transit projects identified in the Major Commercial Transportation System have also been identified by the Greater Vancouver Transportation Authority and others to meet commuter needs. Thus, the needs and objectives for both goods movement and passenger movement are often shared.
The needs addressed by the various rail based infrastructure projects are:
• Provide capacity to the rail network through additional tracks, connectors, sidings and replacement or upgrading of bridges;
• Reduce conflicts between rail and road based traffic. It is important to note that the road-based and transit-based projects must be considered separately from the rail-based projects since transit projects can be
used to relieve road congestion. Evidence from several studies elsewhere in Canada, however suggests that there is limited opportunity to divert truck traffic onto rail of sufficient volume to defer or avoid the need for road investments. Therefore, the benefits of the road-based and rail-based projects are largely independent of each other.
In addition, it should be noted that it is sometimes not cost effective to add capacity to relieve congestion that occurs only during a small portion of the day. The various improvements were therefore developed recognizing cost effectiveness, and as such, either included the addition of capacity where congestion was prevalent for many hours of the day or only provided priority to commercial vehicles where congestion is prevalent for a limited portion of the
day.
mctsG r e a t e r V a n c o u v e r G a t e w a y C o u n c i l
Economic Impact Analysis of the Major Commercial Transportation SystemEconomic Impact Analysis of the Major Commercial Transportation System
July 2003 - SW1040 41
In addition, to ensure compatibility with other transportation planning initiatives, the initial list of infrastructure improvements has been thoroughly reviewed and
refined in accordance with objectives of the major transportation agencies, including the British Columbia Ministry of Transportation and the Greater Vancouver Transportation Authority. To better describe the various transportation network improvements being considered, the refined list was divided into two categories: Road and Rapid
Transit Infrastructure Investments and Rail Infrastructure Investments. The proposed infrastructure improvement projects included in each category are described in the following sections along with the issues that were addressed.
Infrastructure Investments A series of road improvements were identified by members of the Greater
Vancouver Gateway Council to maintain the efficient movement of goods through the Greater Vancouver Region over the next 20 years.19 These road network improvements were divided into two categories depending upon the scale of the improvement or the location of the improvement; namely Major New Investments and Minor Improvements to the Major Road Network. A rapid transit improvement was included with the Major New Investments.
A summary of the Major New Investment projects and the traffic issues addressed by each is provided in Table 6-1 and graphically illustrated on Exhibit 6-1.
19 As noted, many of the improvements also were identified by the GVTA to address commuter peak demands. In addition, it should be
noted that the 1999 Lower Mainland Truck Freight Study (TransLink et al.) identified Highways 1, 91 and 99 as high-density truck corridors (cited in the Freight Transportation in British Columbia: Technical Supplement [Transport Canada, 2002; p. 5-23 ff.]. The Transport Canada report also lists several other important truck corridors, namely: Marine/Stewardson/Front/Brunette, Grandview Highway, Lougheed Highway/Mary Hill Bypass, North Fraser Corridor, Boundary Road, Highway 17, Deltaport Way, River Road, Highway 10, Highway 15, Highway 13 and Highway 11.)


mctsG r e a t e r V a n c o u v e r G a t e w a y C o u n c i l
Economic Impact Analysis of the Major Commercial Transportation SystemEconomic Impact Analysis of the Major Commercial Transportation System
July 2003 - SW1040 42
Table 6-1 Major New Road and Rapid Transit Investments
Major Road and Transit Investment
Description
1 Highway 1 - Vancouver to Langley
Additional capacity on Highway 1 from Grandview Highway to 200th Street. Includes twinning of the Port Mann Bridge, upgrades to the various interchanges, and extension of the HOV lanes to 200th Street.
This project will address several areas along the corridor in which capacity constraints result in significant congestion and delays. These areas include the Port Mann Bridge, Cape Horn interchange, and other interchanges along the corridor.
2 South Fraser Perimeter Road –
Highway 1 to Highway 91
Extension to Highway 99 and East Ladner Bypass
New connection between Highway 1 at 176th Street and Highway 91 at River Road. Involves sections of new arterial construction and improvements to segments of the existing road network.
Extension from Highway 91 to Highway 99 along portions of River Road. Further extension past Highway 99 to Highway 17 at Deltaport Way. Involves new interchange on Highway 99 south of Highway 17.
These improvements will provide improved connectivity between major corridors and commercial activity centres. The existing route between Highway 1 and Highway 91 as well as Highway 99 is circuitous and limited in terms of capacity.
3 Fraser River Crossing New river crossing between Maple Ridge / Pitt Meadows and Surrey / Langley. Connection at approximately 200th Street
This new connection provides a much needed access improvement for the unmet demand between the communities of Pitt Meadows / Maple Ridge and Surrey / Langley. This project is committed and is planned to be constructed by 2007
4 Rapid Transit - Richmond / Airport Vancouver
New rapid transit line from Richmond and Vancouver International Airport to downtown Vancouver. Actual technology undefined. Cambie Street corridor selected.
This corridor has high transit demand that can be expanded with the improvement of service. This project has been funded and is planned to be constructed by 2009.

mctsG r e a t e r V a n c o u v e r G a t e w a y C o u n c i l
Economic Impact Analysis of the Major Commercial Transportation SystemEconomic Impact Analysis of the Major Commercial Transportation System
July 2003 - SW1040 43
Major Road and Transit Investment
Description
5 North Fraser Perimeter Road
Improvements and additions to existing road corridors between the Mary Hill Bypass and Queensborough Bridge. Consists of segments of United Boulevard, Brunette Avenue, Columbia Street, Front Street, and Stewardson Way.
Predominantly in existence, upgrades to this major goods movement route will provide much need efficiencies as there exists major congestion at the areas being addressed.
6 New Westminster Rail Bridge (complete with road tunnel to replace Pattullo Bridge)
Road tunnel to parallel proposed rail tunnel under portions of New Westminster and Fraser River. Road tunnel to connect between McBride Boulevard and South Fraser Perimeter Road.
Combined with the rail tunnel, this road corridor will provide improved capacity across the Fraser River as compared to the Pattullo Bridge which experiences significant congestion.
7 Massey Tunnel (Highway 99)
Improvements to the Highway 99 corridor at the river crossing. Includes two new lanes under river, extension of HOV lanes from King George Highway to Westminster Highway.
This river crossing experiences significant congestion in both directions as the counter-flow system only partially addresses the demand in the peak direction.
8 Oak Street Bridge (Highway 99)
Widening of the Oak Street Bridge from four lanes to six lanes. Two additional lanes to be designated as HOV lanes. This project will tie into the improvements on Highway 99 associated with the Massey Tunnel.
The bridge experiences significant congestion in the AM peak period which can be mitigated with the inclusion of an HOV lane that gives priority to carpools to bypass the congested area.
9 Highway 15 –
Highway 1 to US Border
Improvements to the Highway 15 corridor between Highway 1 and the US Border. Improvements consist primarily of increasing capacity from two to four lanes.
The two lane cross section and various signalized intersections limits mobility along this route. Additional capacity is required to relieve congestion. This project is currently being undertaken with implementation by 2008.

mctsG r e a t e r V a n c o u v e r G a t e w a y C o u n c i l
Economic Impact Analysis of the Major Commercial Transportation SystemEconomic Impact Analysis of the Major Commercial Transportation System
July 2003 - SW1040 44
Major Road and Transit Investment
Description
10 Highway 10 –
Highway 91 to Highway 1
Improv ements to the Highway 10 corridor between Highway 1 and Highway 91. Improvements consist primarily of increasing capacity in the two lane sections to four lanes.
The two lane cross section and various signalized intersections limits mobility along this route. Additional capacity is required to relieve congestion. This project is currently being undertaken with implementation by 2008.
11 Access to Pacific Border Crossing – Highway 99
Widening of 8th Avenue between Highway 99 and Highway 15 along with interchange improvements at Highway 99. This project is currently being undertaken with implementation by 2004 / 2005.
Access to the truck crossing at Highway 15 is limited, and as such needs to be upgraded to protect the level of service.
Source: Greater Vancouver Gateway Council
In contrast, the Minor Improvements to the Major Road Network generally are localized, both in the scale of the improvement (notably, improved intersections,
improved signal coordination and designation of Priority Vehicle lanes) and in their impact (notably, improving the throughput but not changing route or modal choice significantly). The Minor Improvements can be expected to improve the circulation of traffic, which in turn should improve air quality and contribute to the reduction of greenhouse gas emissions. These minor improvements are focused on the existing arterial road network that is primarily under municipal
jurisdiction. Their implementation costs likely would be of a considerably lower value and impact than those of the Major New Investments, and could be implemented sooner and more quickly. A summary of the Minor Improvements to the Major Road Network is provided in Table 6-2 and graphically illustrated in Exhibit 6-1.
Table 6-2
Minor Road Investments Minor Road Investment Description
1 Marine Drive – Granville Street to Boundary Road
Signal Coordination
Convert an existing lane to a High Priority Vehicle (HPV) lane in both directions
Relieve some congestion due to inefficient traffic progression between the various signalized intersections. Provide priority to trucks and transit vehicles in a restricted lane that bypasses various areas of congestion.

mctsG r e a t e r V a n c o u v e r G a t e w a y C o u n c i l
Economic Impact Analysis of the Major Commercial Transportation SystemEconomic Impact Analysis of the Major Commercial Transportation System
July 2003 - SW1040 45
Minor Road Investment Description
2 Port Road – Heatley Street to McGill Street
Restrict South Shore roadway to Port traffic only.
Commuter traffic to and from downtown Vancouver commonly use this corridor to avoid congestion on city streets. This added traffic volume reduces the level of service for Port related traffic.
3 Hastings Street – Clark Rd. to Cassiar St.
Powell St. and Dundas St. – between Clark St. and Nanaimo St.
Signal Coordination
Convert parking to High Priority Vehicle (HPV) lanes in both directions
Congestion due to limited capacity on these streets. Restricted lane for trucks and transit vehicles will increase mobility by bypassing areas of congestion.
4 Granville Street – Granville Bridge to Marine Drive
Signal Coordination
Convert parking to General Purpose (GP) lanes in both directions
Relieve some congestion due to inefficient traffic progression between the various signalized intersections. Provide additional capacity for all vehicles with the elimination of parking during peak periods.
5 Cambie Street – Cambie Bridge to Marine Drive
Signal Coordination
Convert parking to High Priority Vehicle (HPV) lanes in both directions
Relieve some congestion due to inefficient traffic progression between the various signalized intersections. Provide priority to trucks and transit vehicles in a restricted lane that bypasses various areas of congestion.
6 Knight Street – Powell Street to Highway 91
Provision of left turn lanes at key intersections
Convert parking to High Priority Vehicle (HPV) lanes in both directions
Relieve congestion due to inefficient use of the median though lane as this lane is shared with the left turn movements at various intersections. Provide priority to trucks and transit vehicles in a restricted lane that bypasses various areas of congestion.
7 Boundary Road – Highway 1 to Marine Drive
Intersection improvements
Provide additional capacity at various intersections.
8 Russ Baker Way – Authur Laing Bridge to No. 2 Road Bridge
Extend existing High Occupancy Vehicle (HOV) lane and convert to High Priority Vehicle (HPV)
Provide priority to trucks and transit vehicles in a restricted lane that by passes congestion prevalent on the south side of the Authur Laing Bridge (northbound).

mctsG r e a t e r V a n c o u v e r G a t e w a y C o u n c i l
Economic Impact Analysis of the Major Commercial Transportation SystemEconomic Impact Analysis of the Major Commercial Transportation System
July 2003 - SW1040 46
Minor Road Investment Description
9 Westminster Highway – No. 2 Road Bridge to Highway 91
Signal Coordination
Relieve some congestion due to inefficient traffic progression between the various signalized intersections.
10 Alderbridge Way – Dinsmore Bridge to Highway 91
Signal Coordination
Relieve some congestion due to inefficient traffic progression between the various signalized intersections.
11 Highway 91/91A - Highway 99 to Queensborough Bridge
Replace intersection at Ewen Street / Boyd Avenue with grade separation.
This intersection currently experiences significant congestion on the Highway 91 approaches during both the AM and PM peak periods.
12 Sea Island Connector Improvements to the existing swing bridge to improve reliability
Swing bridge movements to allow marine vessels to pass through the bridge create reliability problems for this key access route from the airport.
13 Highway 17 – Ferry Terminal to Highway 99
Signal coordination between intersections at 56th Avenue and 52nd Avenue in Tsawwassen area
Relieve some congestion due to inefficient traffic progression between the two signalized intersections.
14 Deltaport Way – Roberts Bank to Highway 17
Preserve corridor with access management
Corridor is a major truck route and thus, the level of service needs to be protected.
15 Hwy 91 – Hwy 99 to Alex Fraser Bridge
Replace at grade intersection at 72nd Avenue with grade separation.
The intersection currently experiences significant congestion on the Highway 91 approaches during both the AM and PM peak periods.
16 88th Avenue and Nordel Way – Highway 15 to Highway 91
Signal coordination
Increase capacity with consistent four lane cross section.
Relieve some congestion due to inefficient traffic progression between the various signalized intersections in four lane section. Provide additional capacity to relieve congestion in two lane section.
17 16th Avenue – 200th Street to Highway 15
Spot treatments: Improve intersection capacity at 184th Street and at Highway 15
Increase level of service and reduce delays due to capacity issues.

mctsG r e a t e r V a n c o u v e r G a t e w a y C o u n c i l
Economic Impact Analysis of the Major Commercial Transportation SystemEconomic Impact Analysis of the Major Commercial Transportation System
July 2003 - SW1040 47
Minor Road Investment Description
18 Colebrook Road at 152nd Street
Improve unsignalized intersection – install traffic signal
Unsignalized intersection causes some delays for truck traffic that avoids the King George Highway / Highway 10 intersection.
19 200th Street – 16th Avenue to 92nd Avenue
Spot treatments: Improve intersection capacity at problem intersections.
Increase level of service and reduce delays due to capacity issues at the various intersections.
20 Highway 13 – Highway 1 to US Border
Spot treatments: Improve intersection capacity at Fraser Highway and at 16th Avenue
Increase level of service and reduce delays due to the capacity issues at these two intersections.
21 Barnet Highway – Ioco Road to Pinetree Way
Spot treatments: Improve intersection capacity at problem intersections
Increase level of service and reduce delays due to the capacity issues at the various intersections.
22 Lougheed Highway – Laity Street to Mission Bypass
Widen highway to four lanes from two
Spot treatments: Improve intersection capacity at problem intersections
Relieve traffic delays along two lane section of highway. Increase level of service and reduce delays due to the capacity issues at the various intersections along the four lane sections.
23 Canada Way – Boundary Road to 10th Avenue
Spot treatments: Improve intersection capacity at problem intersections
Increase the level of service and reduce delays due to the capacity issues at the various intersections.
24 Marine Way – Boundary to Queensborough Bridge
Signal Coordination
Implement High Priority Vehicle (HPV) lane in both directions through the construction of two additional lanes
Relieve some congestion due to inefficient traffic progression between the various signalized intersections. Provide priority to trucks and transit vehicles in a restricted lane that bypasses various areas of congestion.
Source: Greater Vancouver Gateway Council

mctsG r e a t e r V a n c o u v e r G a t e w a y C o u n c i l
Economic Impact Analysis of the Major Commercial Transportation SystemEconomic Impact Analysis of the Major Commercial Transportation System
July 2003 - SW1040 48
Rail Infrastructure Investments
Greater Vancouver’s railway system is composed of approximately 500 km of rail lines, yards, and related facilities. The railway system moves nearly 60 million tonnes of cargo per year. To put this into perspective, this amount represents approximately 60% of the freight moved within and through British Columbia. The existing rail network within the Greater Vancouver Region is operated by
five different rail companies. These are the Canadian Pacific Railway, Canadian National Railway, Burlington Northern Santa Fe Railway, Southern Railway, and BC Rail. This rail network serves primarily the major seaports, as well as several local activity centres. As such, lines extend from the province’s interior and the US Border to the port facilities within Burrard Inlet, Roberts Bank, and various ports along the Fraser River, as well as to many industrial
customers in the region. The geography of the region and later, urban development, have determined the location of much of the rail network in Greater Vancouver. However, as development progressed over time, this existing rail network has experienced increased conflict with the regional road network, especially as traffic volumes
continue to increase. In addition, the existing rail network is nearing capacity in several locations where capacity increases are difficult to implement due to the constraints imposed by the expanding urban development of the region In order to maintain the existing railway system and to provide much need capacity expansion of the railway network, a series of infrastructure
improvement projects were also identified for this mode by members of the Greater Vancouver Gateway Council. The various rail improvement projects were divided into First and Second Priorities according to the consensus reached by the MCTS Rail Committee of key stakeholders. The two sets of rail priorities are listed and described in Tables 6-3 and 6-4, respectively, and are illustrated in Exhibit 6-2.

mctsG r e a t e r V a n c o u v e r G a t e w a y C o u n c i l
Economic Impact Analysis of the Major Commercial Transportation SystemEconomic Impact Analysis of the Major Commercial Transportation System
July 2003 - SW1040 49
Table 6-3 Rail Network Improvements – First Priority
Rail Investment Description
1 New Westminster Rail Bridge
Replacement of the existing (100 year old) rail bridge with two track tunnel. Tunnel preferred as this will avoid conflict with marine traffic.
Capacity of existing bridge causes significant delays to all users. Capacity will become an increasing issue in the future. Currently, there is approximately 46 trains per day using this river crossing.
2 Pitt River Rail Bridge Short-term upgrade and long-term replacement of existing two track bridge. To be replaced with similar structure with more efficient swing bridge mechanism.
Swing bridge openings for marine traffic cause significant delays to CP Rail. Swing bridge mechanism is slow and adds to the delay. Currently, there is approximately 45 trains per day using this river crossing.
3 Roberts Bank - 41B Grade Separation
Construct an overpass at 41B Avenue in Delta to provide a separation between the rail line to Roberts Bank.
To permit unrestricted switching of trains and to permit longer trains at Roberts Bank. Increases operational efficiency. Approximately 22 trains per day use this section of the rail network.
4 Mud Bay Area – West Leg of the Wye
Construct a connection between the BNSF line and the BC Rail Line to Roberts Bank to permit the movement of southbound to west / eastbound to north.
Relieve congestion on Roberts Bank route – shorter route for southbound trains Approximately 13 trains per day use this section of the rail network.
5 BN New Yard to Spruce Street – Double Track
Provide two tracks between the New Westminster Rail Bridge and the BNSF yard.
To provide support for new Fraser River rail crossing as approach track has limited capacity. Approximately 46 trains per day use this section of the rail network.
6 Siding - Colebrook North and South
Construct new siding on the BNSF line north of east-west BC Rail line.
Increases capacity on BNSF line from US Border to NWRB - necessary for any increase in Amtrak usage. Approximately 12 trains per day use this section of the rail network.

mctsG r e a t e r V a n c o u v e r G a t e w a y C o u n c i l
Economic Impact Analysis of the Major Commercial Transportation SystemEconomic Impact Analysis of the Major Commercial Transportation System
July 2003 - SW1040 50
Rail Investment Description
7 Siding and Grade Separation - Colebrook East and West
(Note: Boundary Bay siding could be alternative)
Extend siding on the BC Rail line east of the north section of BNSF line.
Increases capacity on Roberts Bank route. Approximately 22 trains per day use this section of the rail network.
New siding on BC Rail line west of the north section of the BNSF line.
Source: Greater Vancouver Gateway Council
Table 6-4 Rail Network Improvements – Second Priority
Rail Investment Description
1 Grade Separation - Westwood Street
Construct an overpass at Westwood Street in Port Coquitlam to provide a separation between the road and CP Rail line.
Safety improvement – operational improvement. Approximately 60 to 80 trains per day pass through this crossing.
2 Grade Separation - Harris Road
Construct an overpass at Harris Road in Pitt Meadows to provide a separation between the road and CP Rail line.
Safety improvement – operational improvement. Approximately 45 trains per day pass through this crossing.
3 Grade Separation - King Edward Avenue
Construct an overpass at King Edward Avenue in Coquitlam to provide a separation between the road and the Sapperton Interchange rail lines.
Safety improvement – operational improv ement. Approximately 16 trains per day pass through this crossing.
4 Grade Separation - Pemberton Avenue
Construct an overpass at Pemberton Avenue to provide a separation between the road and the various BC Rail lines.
Safety improvement – operational improvement. Approximately 17 trains per day pass through this crossing.
5 Rail Crossing Upgrade – Victoria Drive
Implement four quadrant gates at rail crossing. Safety improvement. Approximately 45 trains per day pass through this crossing.
(May not be necessary as Port of Vancouver is considering closure of the Victoria Street rail crossing)
6 Queensborough Bridge – Widening
Widen existing swing bridge for marine carriers.
Approximately 14 trains per day cross this bridge.

mctsG r e a t e r V a n c o u v e r G a t e w a y C o u n c i l
Economic Impact Analysis of the Major Commercial Transportation SystemEconomic Impact Analysis of the Major Commercial Transportation System
July 2003 - SW1040 51
Rail Investment Description
7 Grade Separation - Front Street
Construct grade separations at several locations along Front Street (Begbie Street, 6th Street, and Front Street itself).
Safety and operational improvement. Approximately 40 trains per day pass through this crossing.
8 Double Track / Grade Separation - BNSF Burrard Inlet Line at Powell St.
Construct additional track and grade separation
To increase access capacity and improve safety. Currently, 19 trains per day use this section of the rail network.
9 Siding - BNSF Line / CN Junction
Cons truct new siding
To keep double track clear and protect added capacity. Currently, 19 trains per day use this section of the rail network.
10 Grade Separation – Chilliwack to Yale
Various grade separations along this segment of CN Rail line.
Safety and operational improvements. Approximately 35 trains per day pass through these crossings.
Source: Greater Vancouver Gateway Council
Greater Vancouver’s rail network mainly carries freight. However, other rail operators also use portions of the rail net work to move passengers; these operators are Amtrak, VIA Rail, Rocky Mountaineer Rail Tours and WestCoast Express. All provide intercity service, except for WestCoast Express, which serves commuters on a route between downtown Vancouver and Mission. Due to current pressures placed on the rail network to move freight, there is limited
opportunity, and in some sections, no more capacity for new trains or services for moving passengers. However, the noted improvements to the rail network would provide additional capacity such that new or improved rail based passenger service (intercity and commuter rail) could be implemented. Additional movement of passengers by
rail, especially in the urban area of Greater Vancouver, may in turn improve local conditions on the road network by diverting commuters from their autos and consequently contributing to a reduction in greenhouse gas emissions.
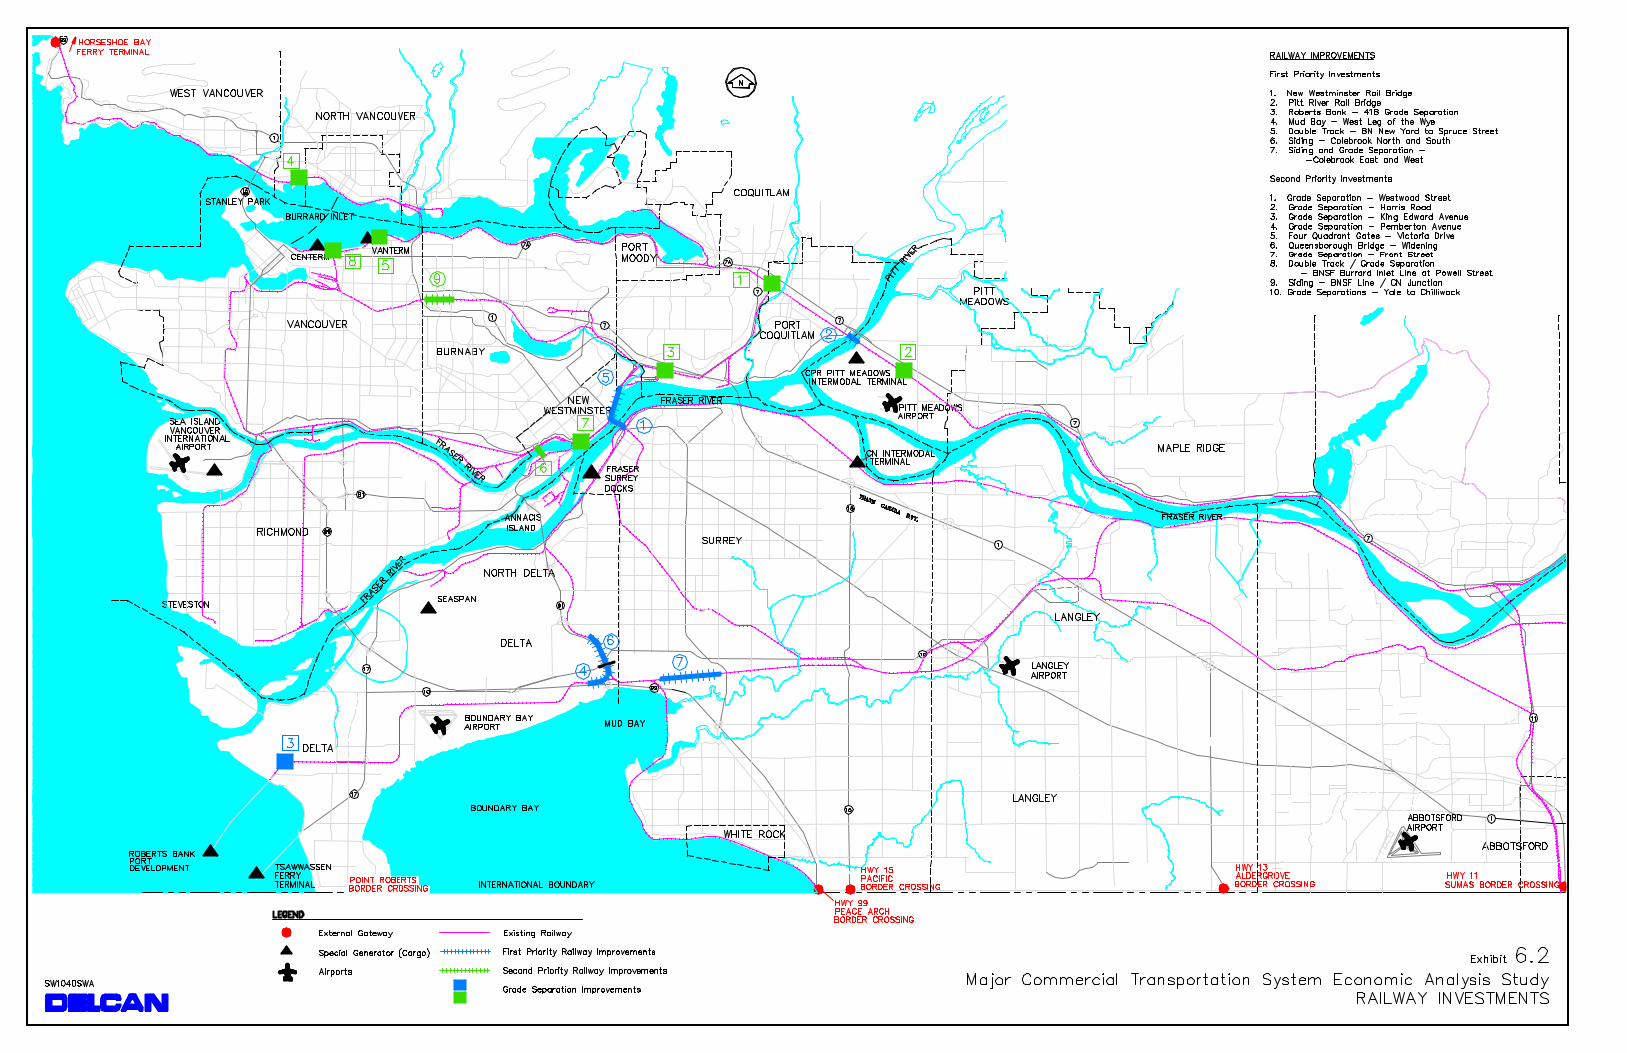

mctsG r e a t e r V a n c o u v e r G a t e w a y C o u n c i l
Economic Impact Analysis of the Major Commercial Transportation SystemEconomic Impact Analysis of the Major Commercial Transportation System
July 2003 - SW1040 52
Water Transportation
While the Major Commercial Transportation System is a ground transport system, water transportation also plays a significant role in the movement of goods to, from, and within Greater Vancouver. The primary water transportation route is the Fraser River (North, Middle, and Main Arms) which
opens to the Georgia Strait and provides water access to points beyond. Historically the Fraser River has been a “working river” acting as a major mode of transportation. Today, much of the cargo shipped through the
various water routes is bulk goods, notably logs, wood chips, and construction materials. Given the strategic nature and historic use of the Fraser River and the various water connections, this water transportation route has the potential to continue to operate as an efficient mode of transportation for the
movement of specific bulk cargos. However, with the growing congestion on the road network, and the capacity constraints on portions of the rail network, there may be an increasing role for the movement of goods and passengers via water transportation. Protection of the significant waterfront locations should be considered if this
mode of transportation is to become a more important mode in the movement of goods and passengers in the Greater Vancouver Region now and into the future. It is important to avoid any negative impact due to new crossings of major water transportation routes and to preserve and maintain facilities to ensure that there is strategic integration with the land based transportation modes.
Seaspan Photo

mctsG r e a t e r V a n c o u v e r G a t e w a y C o u n c i l
Economic Impact Analysis of the Major Commercial Transportation SystemEconomic Impact Analysis of the Major Commercial Transportation System
July 2003 - SW1040 53
The identified improvements, in addition to the existing road network, form
part of the Major Commercial Transportation System. A graphical representation of the Major Commercial Transportation System with the new improvements is presented in Exhibit 6-3. As mentioned previously, the MCTS is anticipated to:
• Provide a continuous network for efficient commercial vehicle operations;
• Utilize multi-modal solutions (road, rail, and water courses) to alleviate traffic congestion;
• Accommodate future growth in goods, services, and local and international passenger movements;
• Enable 24-hour unrestricted commercial vehicles and rail traffic use;
• Provide rail movements free of road intersection constraints;
• Enhance connectivity to north-south & east-west trade corridors;
• Provide for cost-effective solutions to specific bottlenecks.
6.3 The Cost of Improving the Major Commercial Transportation System
Improving the transportation network and specifically that part of the network identified as the Major Commercial Transportation System comes with a price.
Given the scope of some of the various transportation infrastructure improvement projects, this price is significant. However, it should be recognized that the cost of not implementing these improvements is much higher (as discussed later in this report). The cost of the identified improvements to the Major Commercial Transportation System is estimated at approximately $6.2 to $6.9 billion. The
road and rapid transit improvements represent approximately $5.0 to $5.4 billion whereas the railway projects would cost approximately $1.2 to $1.5 billion to implement. A breakdown of these figures is presented below:

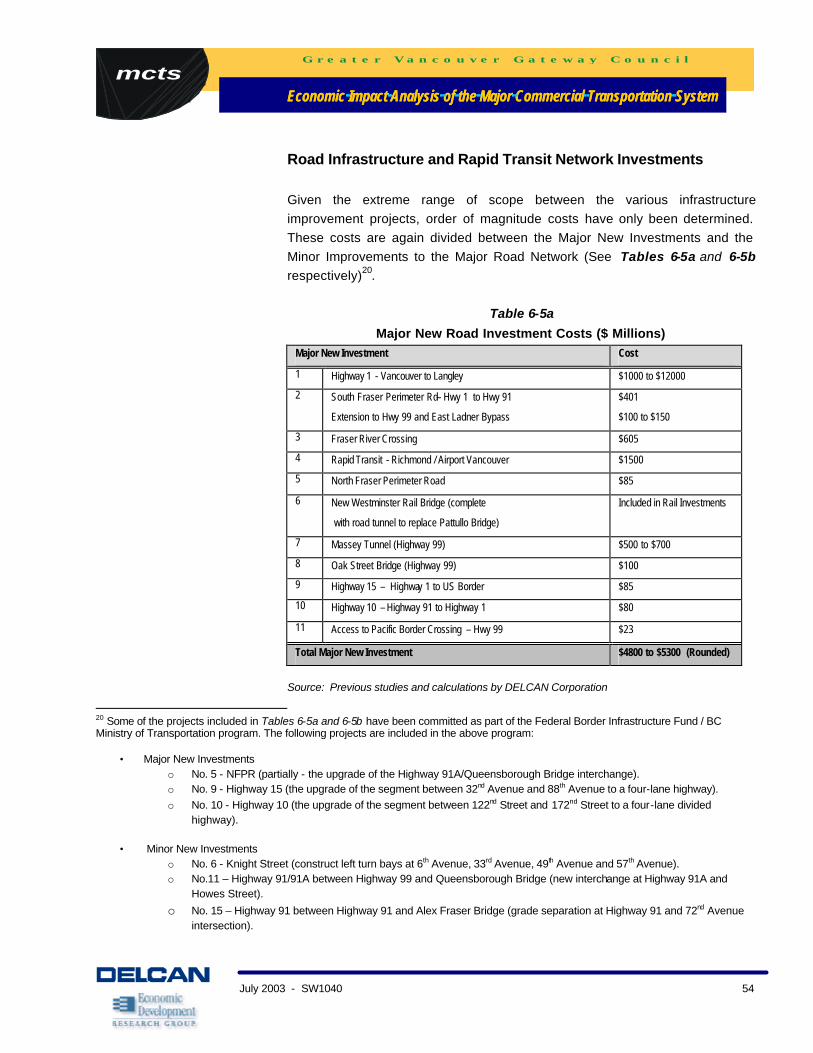
mctsG r e a t e r V a n c o u v e r G a t e w a y C o u n c i l
Economic Impact Analysis of the Major Commercial Transportation SystemEconomic Impact Analysis of the Major Commercial Transportation System
July 2003 - SW1040 54
Road Infrastructure and Rapid Transit Network Investments
Given the extreme range of scope between the various infrastructure improvement projects, order of magnitude costs have only been determined. These costs are again divided between the Major New Investments and the Minor Improvements to the Major Road Network (See Tables 6-5a and 6-5b respectively)20.
Table 6-5a
Major New Road Investment Costs ($ Millions) Major New Investment Cost
1 Highway 1 - Vancouver to Langley $1000 to $12000
2 South Fraser Perimeter Rd– Hwy 1 to Hwy 91
Extension to Hwy 99 and East Ladner Bypass
$401
$100 to $150
3 Fraser River Crossing $605
4 Rapid Transit - Richmond / Airport Vancouver $1500
5 North Fraser Perimeter Road $85
6 New Westminster Rail Bridge (complete
with road tunnel to replace Pattullo Bridge)
Included in Rail Investments
7 Massey Tunnel (Highway 99) $500 to $700
8 Oak Street Bridge (Highway 99) $100
9 Highway 15 – Highway 1 to US Border $85
10 Highway 10 – Highway 91 to Highway 1 $80
11 Access to Pacific Border Crossing – Hwy 99 $23
Total Major New Investment $4800 to $5300 (Rounded)
Source: Previous studies and calculations by DELCAN Corporation
20 Some of the projects included in Tables 6-5a and 6-5b have been committed as part of the Federal Border Infrastructure Fund / BC Ministry of Transportation program. The following projects are included in the above program:
• Major New Investments o No. 5 - NFPR (partially - the upgrade of the Highway 91A/Queensborough Bridge interchange). o No. 9 - Highway 15 (the upgrade of the segment between 32nd Avenue and 88th Avenue to a four-lane highway). o No. 10 - Highway 10 (the upgrade of the segment between 122nd Street and 172nd Street to a four-lane divided
highway).
• Minor New Investments o No. 6 - Knight Street (construct left turn bays at 6th Avenue, 33rd Avenue, 49th Avenue and 57th Avenue). o No.11 – Highway 91/91A between Highway 99 and Queensborough Bridge (new interchange at Highway 91A and
Howes Street).
o No. 15 – Highway 91 between Highway 91 and Alex Fraser Bridge (grade separation at Highway 91 and 72nd Avenue intersection).
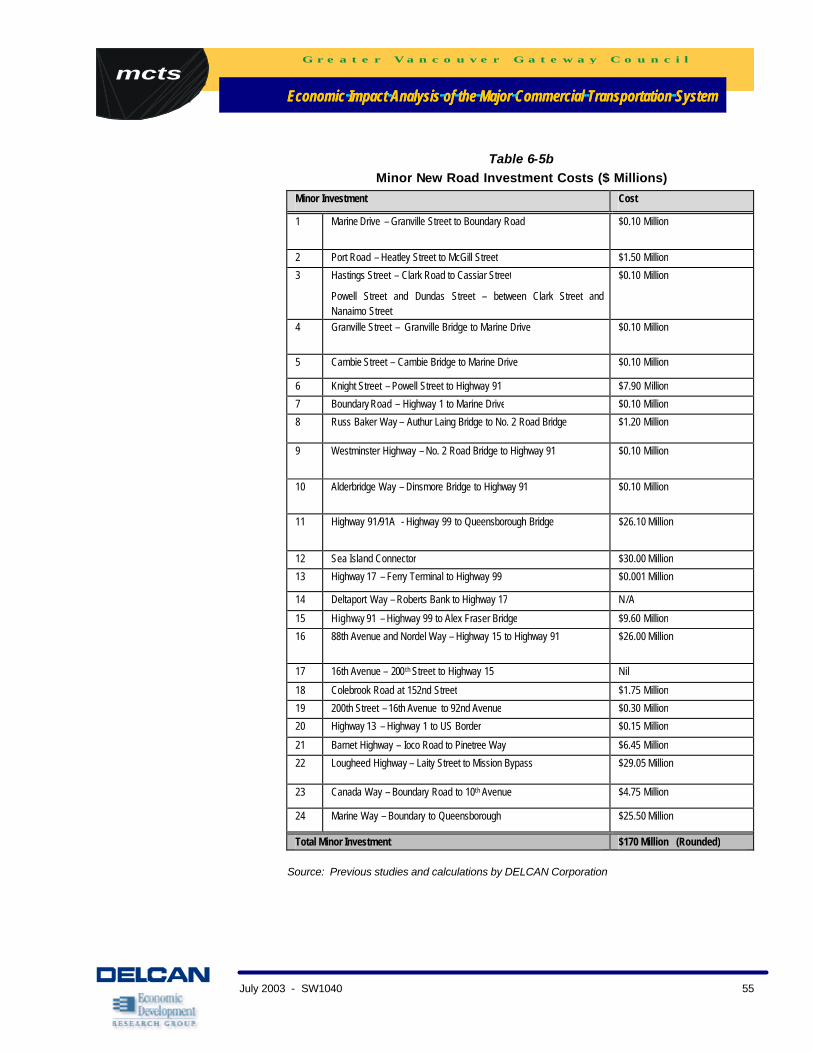
mctsG r e a t e r V a n c o u v e r G a t e w a y C o u n c i l
Economic Impact Analysis of the Major Commercial Transportation SystemEconomic Impact Analysis of the Major Commercial Transportation System
July 2003 - SW1040 55
Table 6-5b Minor New Road Investment Costs ($ Millions)
Minor Investment Cost
1 Marine Drive – Granville Street to Boundary Road $0.10 Million
2 Port Road – Heatley Street to McGill Street $1.50 Million
3 Hastings Street – Clark Road to Cassiar Street
Powell Street and Dundas Street – between Clark Street and Nanaimo Street
$0.10 Million
4 Granville Street – Granville Bridge to Marine Drive $0.10 Million
5 Cambie Street – Cambie Bridge to Marine Drive $0.10 Million
6 Knight Street – Powell Street to Highway 91 $7.90 Million
7 Boundary Road – Highway 1 to Marine Drive $0.10 Million
8 Russ Baker Way – Authur Laing Bridge to No. 2 Road Bridge $1.20 Million
9 Westminster Highway – No. 2 Road Bridge to Highway 91 $0.10 Million
10 Alderbridge Way – Dinsmore Bridge to Highway 91 $0.10 Million
11 Highway 91/91A - Highway 99 to Queensborough Bridge $26.10 Million
12 Sea Island Connector $30.00 Million
13 Highway 17 – Ferry Terminal to Highway 99 $0.001 Million
14 Deltaport Way – Roberts Bank to Highway 17 N/A
15 Highway 91 – Highway 99 to Alex Fraser Bridge $9.60 Million
16 88th Avenue and Nordel Way – Highway 15 to Highway 91 $26.00 Million
17 16th Avenue – 200th Street to Highway 15 Nil
18 Colebrook Road at 152nd Street $1.75 Million
19 200th Street – 16th Avenue to 92nd Avenue $0.30 Million
20 Highway 13 – Highway 1 to US Border $0.15 Million
21 Barnet Highway – Ioco Road to Pinetree Way $6.45 Million
22 Lougheed Highway – Laity Street to Mission Bypass $29.05 Million
23 Canada Way – Boundary Road to 10th Avenue $4.75 Million
24 Marine Way – Boundary to Queensborough $25.50 Million
Total Minor Investment $170 Million (Rounded) Source: Previous studies and calculations by DELCAN Corporation

mctsG r e a t e r V a n c o u v e r G a t e w a y C o u n c i l
Economic Impact Analysis of the Major Commercial Transportation SystemEconomic Impact Analysis of the Major Commercial Transportation System
July 2003 - SW1040 56
Rail Network Investments
Similar to the road network investments, the extreme range of scope between the various rail infrastructure improvement projects dictates that only order of magnitude costs be identified. These costs are identified for the First Priority and the Second Priority Rail Improvements in Tables 6-6a and 6-6b, respectively.
Table 6-6.a
Rail Network Improvement Costs – First Priority No. Major New Investment Cost
1 New Westminster Rail Bridge $750 to 1000 Million
2 Pitt River Rail Bridge $250 Million
3 Roberts Bank - 41B Grade Separation $15 to $20 Million
4 Mud Bay Area – West Leg of the Wye $15 Million
5 BN New Yard to Spruce Street – Double Track $1 Million
6 Siding - Colebrook North and South $10 Million
7 Siding and Grade Separation - Colebrook East and West
(Note: Boundary Bay siding could be constructed as an alternate)
$3 Million
Total First Priority Investment $1050 to $1300 Million (Rounded)
Source: Calculations by DELCAN Corporation
Table 6-6b
Rail Network Improvements – Second Priority No. Minor Investment Cost
1 Grade Separation - Westwood Street $10 to 15 Million
2 Grade Separation - Harris Road $10 to 15 Million
3 Grade Separation - King Edward Avenue $15 to 20 Million
4 Grade Separation – Pemberton Avenue $10 to 15 Million
5 Rail Crossing Upgrade – Victoria Drive N/A
6 Queensborough Bridge – Widening $10 Million
7 Grade Separation - Front Street $25 to 30 Million
8 Double Track / Grade Separation - BNSF Burrard Inlet Line at Powell Street
$20 to 25 Million
9 Siding – BNSF Line / CN Junction $2 Million
10 Grade Separation – Chilliwack to Yale $25 to 35 Million
Total Second Priority Investment $130 to $170 Million (Rounded)
Source: Calculations by DELCAN Corporation

mctsG r e a t e r V a n c o u v e r G a t e w a y C o u n c i l
Economic Impact Analysis of the Major Commercial Transportation SystemEconomic Impact Analysis of the Major Commercial Transportation System
July 2003 - SW1040 57
6.4 Transportation Impacts of Building These Projects
Types of Impacts and Method of Analysis The transportation impacts of road and transit projects were analyzed using the regional transportation planning model (Vancouver Port Authority version of the
EMME/2 model) and other appropriate traffic operational analysis software. As discussed below, the impacts were measured in two ways: changes in trip time and changes in trip distance that would accrue to users of the road and transit networks. As discussed in Chapter 7, both can be expressed in monetary values: travellers value their time, and changes in trip distance impact vehicle operating costs.
In contrast, the transportation impacts of rail network improvement projects were analyzed in terms of operational or safety improvements. However, in the absence of detailed information from the rail companies, it was not possible to estimate accurately the operational and safety impacts that would be generated by these improvements. As such, several generalized assumptions were
required to determine order-of-magnitude benefits for each rail network improvement.
Impacts of the Road and Rapid Transit Infrastructure Projects Using the regional EMME/2 transportation planning model and a traffic operational model, the travel time and distance impacts of the major and minor
road and rapid transit improvements were assessed. As in most urban areas, the available models focus on the time of the maximum peak hour loading on the road and transit systems: in Greater Vancouver’s case, this is the AM commuter peak hour. (In contrast, truck volumes are at their highest in mid- to late-morning, although at any time of day autos are always the dominant mode. It should be noted that the temporal basis of this analysis [i.e., the AM
commuter peak hour] is a function of the available forecasting tools, even though that is not the peak time for truck traffic. However, addressing capacity problems during the AM peak hour should address problems in the off-peak as well; recognizing also that drivers may be willing to tolerate congestion during the peak but will have less tolerance for delays during the off-peak. Moreover, the model does not reflect the possibility of encouraging some peak period
travellers to defer their trip to the off-peak hours, although the number of people who can do this is relatively small). Also, there are indications that although the AM peak hour may be sharper and more intense, the PM peak may have a

mctsG r e a t e r V a n c o u v e r G a t e w a y C o u n c i l
Economic Impact Analysis of the Major Commercial Transportation SystemEconomic Impact Analysis of the Major Commercial Transportation System
July 2003 - SW1040 58
longer duration (hence benefits could be higher than those estimated in this report).
The model was used to estimate AM peak hour travel for 1999 and for a horizon year (2021). 21 For the purposes of the economic analysis (Chapter 7), travel time and distance typically are measured as vehicle-hours travelled (VHT) and vehicle-kilometres travelled (VKT), respectively. VHT and VKT represent the multiple of vehicle-trips and the travel time for each trip, and the
multiple of vehicle-trips and the distance for each trip, respectively. These are summed by vehicle type (SOV, HOV, light truck and heavy truck) over the entire region. Comparisons then can be made between conditions in 2021 and in 1999, and again between 2021 with and without the improvements in place. The former comparison recognizes that travel will grow as a function of demographic and economic growth (as represented by the Greater Vancouver
Regional District’s Livable Region Strategy); and the latter comparison demonstrates how this growth in travel is impacted by the proposed improvements. Truck trips are expected to grow as a function both of the population (that is, to serve the population’s needs), but also as the freight moving through the ports, airport, rail terminals, border crossings and internal gateways (i.e., to the rest of BC and Canada) grows (see Chapter 5). 22 Finally,
for the purposes of the economic analysis, it was assumed that all improvements would be implemented at the same time; and that these would be implemented in the short-term.23 The results of the analysis are presented below.24 Further details are provided in a separate technical report.
Greater Vancouver’s population is expected to grow by 42% between 1999 and 2021 (from 2.2 million to 3.1 million people), and jobs by 45% (from 1.1 million to 1.6 million jobs). Between 1999 and 2021, AM peak hour traffic on a ‘typical’ weekday (all
vehicles) is expected to grow by 39%, from 320,000 vehicle-trips in 1999 to
21 The use of 1999 as the reference year reflects the most recent year for which population, employment and travel data were all available.
Similarly, 2021 is the horizon year for TransLink’s plans and policies. 22 As part of this analysis, the Consultant reviewed the factors that influenced truck trips, and revised the truck trips forecasts ac cordingly. 23 In other words, the purpose of this exercise was to compare the situation with and without – and not among - the improvements in place. 24 These results represent AM peak hour conditions, in accordance with the models. As described below, the results subsequently were
expanded to represent daily [24 hour] and annual volumes, for input to the economic analysis.

mctsG r e a t e r V a n c o u v e r G a t e w a y C o u n c i l
Economic Impact Analysis of the Major Commercial Transportation SystemEconomic Impact Analysis of the Major Commercial Transportation System
July 2003 - SW1040 59
445,000 vehicle-trips. In 1999, trucks represented 4.6% of all traffic on the roads during the AM peak hour; by 2021, this will have increased to 5.2%.
Although traffic in the morning peak hour will not grow as fast as the population (or jobs), in 2021 (without the MCTS improvements in place):
• Truck traffic is expected grow by 56% (from 14,900 truck trips in 1999 to 23,200 truck trips in 2021), with heavy truck traffic growing by 63% (5,200 truck trips in 1999 to 8,500 truck trips in 2021). Despite their relatively small numbers, trucks will have proportionately a slightly greater impact on
capacity (because they are slower and occupy more road space than autos).
• Single-occupant vehicle (SOV) trips will continue to dominate, comprising 73% throughout the planning period. High-occupancy vehicle (HOV) trips will comprise 21% of all trips, HOV trips will grow by 27%, but SOV trips will grow even faster, at 40%.
• The total number of passenger trips in the AM peak hour (person-trips by auto and transit) will grow by 35%. Transit trips will grow at the same rate, which means that the transit modal share will remain stable, at 16.3% of all passenger trips. It also means that expected growth in passenger travel will be at a slightly lower pace than the growth in population, all of which will be much lower than the growth in jobs. However, because the forecasts are based more closely upon population growth than employment growth
(meaning that commercial or on-the-job activity is not well represented in the model), the travel forecasts may be low.
• SOV trips will grow faster than transit and all passenger trips, at 40%, at the expense of HOV trips (which will grow only by 27%). Thus, the SOV share will continue to dominate, at 82% of all peak hour passenger trips.25.
• VKT will increase by 32%, from 3.7 million vehicle-kilometres travelled during the AM peak hour in 1999, to 4.9 million vehicle-kilometres travelled
in 2021. VHT will increase faster, at 54%, from 95,000 vehicle-hours travelled in 1999 to 146,000 vehicle-hours travelled in 2021.
As a result, the average driver is projected to spend 10% more time travelling due to slower speeds and longer delays – even though the average trip distance is expected to be 5% shorter (a reflection of the expected denser mix
of jobs, homes, schools and shopping activities [i.e., people will not have to
25 All the figures cited here include only motorized travel, by auto, transit or bus. Walking and cycling trips are not included. Although
important, their impact generally is localized.

mctsG r e a t e r V a n c o u v e r G a t e w a y C o u n c i l
Economic Impact Analysis of the Major Commercial Transportation SystemEconomic Impact Analysis of the Major Commercial Transportation System
July 2003 - SW1040 60
travel as far to access jobs, stores, etc.]). In sum, all of these factors indicate increased future congestion.
This would occur in the absence of the proposed or any other major projects. The proposed projects can be expected to impact travel in Greater Vancouver in several ways:
• Divert some drivers to transit or to ridesharing; that is, through improvements to the transit system and HOV networks respectively.
Transit trips would grow slightly (1% over the situation without the MCTS projects, for an overall growth of 36% over 1999)26, as would HOV trips (2% over the base situation, and 29% overall). However, SOV trips would still dominate, with the transit share unchanged.
• Reduce the time spent in congestion, by increasing capacity and throughput with new roads, additional lanes, intersection improvements and
improved signal coordination. With the proposed improvements, there will still be some peak period traffic congestion but each driver will spend, on average, 6-10% less time travelling. This is a benefit in traveller saving time and in time-related operating costs for vehicles, though the vehicle impact is offset by average trip distance that is 1-3% longer than it is today. In other words, although congestion will still be high, each driver’s trip, on
average, will be more ‘efficient’ than it would be without the proposed projects in place. (The projected small increase in trip lengths is due to the fact that the increased capacity afforded by the proposed projects provides drivers with more ways to get around congested bottlenecks.)
• Improve accessibility within Greater Vancouver, by increasing connectivi ty and eliminating circuitry. As described in previous sections, projects such as the Fraser River Crossing would eliminate circuitous travel and, over the
long term, would encourage people to change their jobs or workplace to take advantage of the new connections.
Because the benefits must be measured in annual increments, the AM peak hour VKT and VHT were first expanded to daily totals, then to annual totals. Tables 6-7 and 6-8 summarize the differences in VKT and VHT, respectively,
with the following results:
• There is a benefit of 7% overall in reduced travel time (VHT), although travel distance increases slightly, by 0.2% (VKT). In other words, as noted,

mctsG r e a t e r V a n c o u v e r G a t e w a y C o u n c i l
Economic Impact Analysis of the Major Commercial Transportation SystemEconomic Impact Analysis of the Major Commercial Transportation System
July 2003 - SW1040 61
the MCTS improvements allow people to travel slightly greater distances to get around congestion, but their overall trip will be faster. Congestion
would decrease with the MCTS improvements in place.
• The travel time benefit is proportionately greatest for light and heavy trucks, which experience reductions of 9% and 11%, respectively, in VHT. This is despite proportionately greater distances travelled by trucks, compared with auto traffic (0.6% and 0.7% increases in VKT, for light and heavy trucks, respectively), although the increases are still small.
Table 6-7 Differences in Travel Distance (VKT) Without and With the MCTS Improvements (2021)*
Vehicle Type 2021 VKT - no MCTS 2021 VKT - with MCTS % Change Daily Difference Annual Difference
24 hour VKT SOV 52,471,764 52,567,164 0.18% 95,399 29,764,639
24 hour VKT HOV 12,893,564 12,922,391 0.22% 28,827 8,993,906
24 hour VKT Light Trucks 2,050,751 2,062,433 0.57% 11,682 3,644,883
24 hour VKT Heavy Trucks 3,168,929 3,189,840 0.66% 20,911 6,524,106
Total 24hr VKT 70,585,009 70,741,828 0.22% 156,819 48,927,534
Table 6-8
Differences in Travel Time (VHT) Without and With the MCTS Improvements (2021)*
Vehicle Type 2021 VHT - no MCTS 2021 VHT - with MCTS % Change Daily Difference Annual Difference
24 hour VHT SOV 1,429,498 1,331,522 -6.85% -97,976 -30,568,620
24 hour VHT HOV 332,119 310,603 -6.48% -21,516 -6,712,970
24 hour VHT Light Trucks 47,874 43,552 -9.03% -4,323 -1,348,700
24 hour VHT Heavy Trucks 60,906 54,234 -10.95% -6,672 -2,081,658
Total 24hr VHT 1,870,398 1,739,911 -6.98% -130,487 -40,711,949
* As described in the accompanying technical appendix, the main assumptions underlying these forecasts are:
• The model forecasts were based upon the GVRD Liveable Region Strategy’s Growth Management Scenario of future population and employment.
• Truck trip forecasts were revised, based upon the Consultant’s review of the factors that influence growth in truck trips.
• All MCTS investments were analyzed together. • VKT and VHT impacts were calculated for the Major MCTS investments, reflecting their distributive
impacts. Because the Minor investments would not change the distribution of trips but would improve trip times, only VHT impacts were calculated for these.
• VKT is calculated as link length (in kilometres) times link volume (in vehicles), summed for all links (i.e., for all road sections in the model). Similarly, VHT is the multiple of link length and the actual (modelled) travel time on that link.
26 It should be noted that the expected increase in regional transit share somewhat masks the likely sub-regional increase in transit share
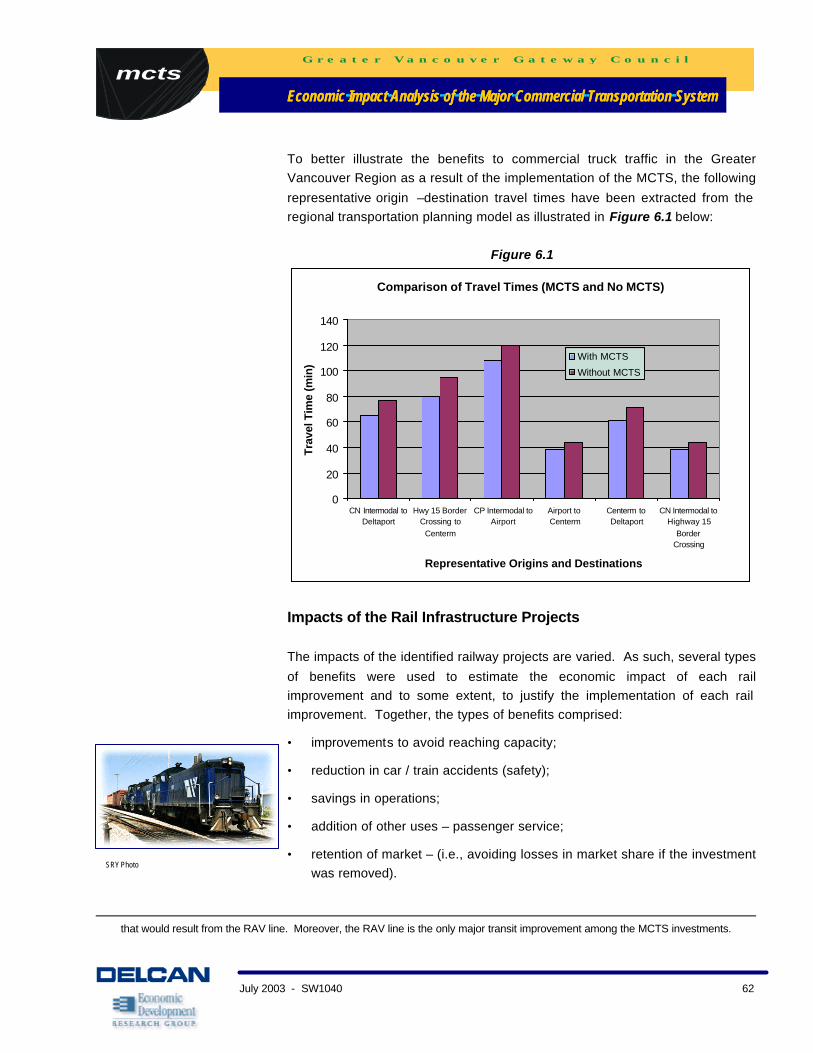
mctsG r e a t e r V a n c o u v e r G a t e w a y C o u n c i l
Economic Impact Analysis of the Major Commercial Transportation SystemEconomic Impact Analysis of the Major Commercial Transportation System
July 2003 - SW1040 62
To better illustrate the benefits to commercial truck traffic in the Greater Vancouver Region as a result of the implementation of the MCTS, the following
representative origin –destination travel times have been extracted from the regional transportation planning model as illustrated in Figure 6.1 below:
Figure 6.1
Comparison of Travel Times (MCTS and No MCTS)
0
20
40
60
80
100
120
140
CN Intermodal toDeltaport
Hwy 15 BorderCrossing to
Centerm
CP Intermodal toAirport
Airport toCenterm
Centerm toDeltaport
CN Intermodal toHighway 15
BorderCrossing
Representative Origins and Destinations
Trav
el T
ime
(min
)
With MCTS
Without MCTS
Impacts of the Rail Infrastructure Projects The impacts of the identified railway projects are varied. As such, several types
of benefits were used to estimate the economic impact of each rail improvement and to some extent, to justify the implementation of each rail improvement. Together, the types of benefits comprised:
• improvements to avoid reaching capacity;
• reduction in car / train accidents (safety);
• savings in operations;
• addition of other uses – passenger service;
• retention of market – (i.e., avoiding losses in market share if the investment was removed).
that would result from the RAV line. Moreover, the RAV line is the only major transit improvement among the MCTS investments.
SRY Photo

mctsG r e a t e r V a n c o u v e r G a t e w a y C o u n c i l
Economic Impact Analysis of the Major Commercial Transportation SystemEconomic Impact Analysis of the Major Commercial Transportation System
July 2003 - SW1040 63
One of the main findings in the analysis of the rail network improvements, especially the major new investments, is that retention of market may be the
primary benefit to justify the expenditure. In other words, the economic importance of these elements is paramount as their continued use affects several other related industries in the transportation chain. If one or more of these elements became unavailable, the impact to the local, regional, and national economies would be noticed immediately.
mctsG r e a t e r V a n c o u v e r G a t e w a y C o u n c i l
Economic Impact Analysis of the Major Commercial Transportation SystemEconomic Impact Analysis of the Major Commercial Transportation System
July 2003 - SW1040 64
Findings: Economic Impacts of Investment Decisions
7. IMPACTS OF INVESTING IN THE MCTS
This chapter discusses the economic impact of investing in the proposed set of new projects for the Major Commercial Transportation System. It first describes the behavioural process by which transportation capacity constraints and congestion delays lead to economic consequences for the economies of BC and the other western provinces. It then summarizes the economic analysis process and finally presents economic findings, which build directly
upon the transportation findings described in Chapter 6.
7.1 Types of Economic Costs and Growth Constraints The previous chapter described how failure to invest in the proposed set of regional surface transportation projects could lead to greater road traffic congestion and slowdowns in the future, as well as constraints on the volume of
rail movements. That transportation analysis provided estimates of the additional travel times associated with congestion delays and the additional changes in travel distances forecast for the year 2021. While planners and businesses can make some adjustments to mitigate such impacts in the future, the bottom line is that a road network with increasing congestion and rail facilities with capacity constraints will effectively raise costs of transporting
goods via highway or rail within BC, and via marine ports and/or airports to/from BC. In some cases, facilities with capacity constraints can eventually also limit growth of activities that rely on them. Additional transportation costs and growth constraints can lead to negative economic consequences for the region. Some cargo transportation companies
are likely to face higher operating costs. Depending on the nature of competitive alternatives, they may: (a) absorb those costs as a loss of net income, (b) pass those costs on to customers, or (c) some combination of the two. In any case, transportation companies and shippers may also seek to reduce these extra transportation costs by shifting to use other transportation facilities and ports outside of BC. Depending on the type of cargo and mode of
travel, business responses may be of the following types:
• For transport of goods over the highway network within BC, the changes in travel time and distance together translate into a higher overall cost of transporting goods, which can also be viewed as a higher cost of
mctsG r e a t e r V a n c o u v e r G a t e w a y C o u n c i l
Economic Impact Analysis of the Major Commercial Transportation SystemEconomic Impact Analysis of the Major Commercial Transportation System
July 2003 - SW1040 65
doing business in BC. Businesses can absorb and/or pass those costs on to their customers (other businesses and households) in the form of higher
prices. Some businesses may also respond by shifting their shipment routing or port destination to avoid the higher cost in the Vancouver region. In any case, the additional operating costs will mean loss of business competitiveness in serving distant markets.
• For transport of goods over the rail network within BC, constraints on capacity growth will effectively cap growth of rail shipments to/from various marine ports after the year 2015. Prices for rail shipment on these routes
are likely to rise to balance demand with supply limitations. Some of the future growth of rail shipments will shift to truck or more likely, use alternative rail routes that avoid the Vancouver region and its ports. Either way, the result is a higher cost for shippers from BC and elsewhere in Canada.
• For products coming in and going out of BC via marine ports, there is
often a choice of ports and so these additional ground (highway and rail) transport costs will increase the total cost of using Greater Vancouver area ports. Businesses may absorb these higher costs or shift to use other ports (as previously discussed in the first two bullet items). The end result is a potential reduction in Greater Vancouver’s ability to capture a share of Pacific trade (compared to competing ports located elsewhere).
• For products coming in and going out of BC via air transport, it is assumed that the choice of airport is based primarily on convenience for local delivery rather than ground transport costs. Thus, businesses dependent on road access to/from the Vancouver International Airport will effectively absorb the higher costs of future road delay (as discussed in the first bullet item).
The bottom line result is that long-term changes in transportation conditions can have broad impacts on a region’s business base and economic growth that go far beyond the direct impacts on travel times, vehicle operating costs and distances. Specifically, failure to invest in the identified ground transport infrastructure will raise business costs, diminish effective worker productivity, reduce competitiveness and lead to some loss of economic activity in BC and
other provinces that ship overseas via BC ports. On the other hand, full investment in the identified ground transport infrastructure will merely allow the Vancouver Gateway to remain cost competitive for shippers and thus achieve its current forecast levels of economic growth. The benefit of making the
mctsG r e a t e r V a n c o u v e r G a t e w a y C o u n c i l
Economic Impact Analysis of the Major Commercial Transportation SystemEconomic Impact Analysis of the Major Commercial Transportation System
July 2003 - SW1040 66
needed transport infrastructure investment is to avoid these losses in economic activity from occurring.
Thus, the remainder of this chapter examines the negative economic consequences of a “no build” scenario and then represents the positive benefits of investing in the MCTS as the avoidance of those negative impacts.
7.2 Value of Direct Impacts The direct economic impacts of the MCTS are expressed as (a) the avoided costs of congestion delay associated with completing the set of MCTS road and transit system investments by the year 2021, plus (b) the avoided shortfall in year 2021 cargo throughput associated with completing the MCTS set of major rail projects. All values are shown in year 2002 constant dollars.
Road Traffic Delay The road traffic analysis in Section 6.4 showed results for a year 2021 scenario in which truck and car traffic continues to grow with population and economic growth, while there is no major improvement in surface transportation system capacity. The result was an effective increase in travel times (with a very small
decrease in travel distances due to a presumed higher density urban growth pattern). To calculate the dollar value of these impacts, we distinguished three classes of travel:
• Car traffic (non-work) –– We estimate a personal value of time of $7.90/hr. for single occupant cars and $15.80/hr. for multiple occupant vehicles.27 The operating cost difference affects disposable income.
However, we assume that this value of time savings for personal travel is a “social benefit” that affects the quality of life and personal productivity, but does not affect the flow of dollars in the economy.
• Car traffic (work trip) – We use a value of time of $18.90/hour for single occupant cars and $37.80/hour for multiple occupant vehicles, which reflects both vehicle operating cost savings and the value of time savings for “on-the-clock” business travel.25 Both components represents a real
dollar cost savings to businesses. We assume that businesses also end up absorbing half of this value of time for commuting trips, based on prior studies showing that employers end up paying higher labour-related costs
27 T. Partridge & Associates, TransLink Transportation Evaluation Guidelines , October 1999.
mctsG r e a t e r V a n c o u v e r G a t e w a y C o u n c i l
Economic Impact Analysis of the Major Commercial Transportation SystemEconomic Impact Analysis of the Major Commercial Transportation System
July 2003 - SW1040 67
as a consequence of longer worker delays and higher worker travel times.28 (Changes in the cost of additional vehicle-km of car travel are further
calculated at $0.49/km.)
• Commercial truck traffic – We use a value of time delay for truck vehicle operation and driver time at $36/hour for light trucks and $45 /hour for heavy trucks; Added logistics, scheduling and productivity impacts for shippers and receivers increase the total value of time delay for full trucks to $77/hour for light trucks and $95/hour for heavy trucks.29 (Further changes in vehicle-km of truck travel are calculated at $2.15/km.)
These economic values were applied to the year 2021 scenarios representing road traffic conditions with and without development of MCTS investments (as shown earlier in Table 6-8). The results of these calculations are shown in Table 7-1. They indicate that, without the MCTS improvements, the money cost of additional travel time delay by year 2021 (net of changes in travel
distance) will grow to $414 million/year – including $280 million for truck delays and $134 million for business-related car travel delays. These are real money costs that are borne by the transportation sector in BC and by businesses dependent on these flows of cargo and workers. If we also count the social valuation of travel delay for personal travel, which is a very real impact although it does not directly affect the flow of dollars in the economy, then the total
impact rises to $806 million/year.
28 See Zax, JS, “Compensation for Commutes in Labor and Housing Markets” Journal of Urban Economics, v.30, 1991; also Weisbrod, G et al:
Economic Implications of Congestion, National Cooperative Highway Research Program Report 463, Transportation Research Board, 2001.
29 Scheduling and warehousing costs can be particularly important for high volumes of cargo associated with international port shipments, and scheduling costs are also important for local delivery of goods and services in major urban areas. Both of these conditions apply here. These values could actually be conservative, as a US study of freight carriers found a value of avoided delay for heavy trucks (including logistics, scheduling and manufacturing process cost savings) to be in the range of US $ 144-!93/hr, with savings in late schedule delivery delays at US$ 271/hr. (Source: National Cooperative Highway Research Project 2-18, Transportation Research Board, 1995. A 2003 study of the US Federal Highway Administration on Freight Productivity is finding evidence of even larger impacts. These factors are also discussed in Waters, WG II et al: “The Value of Commercial Vehicle Time Savings for the Evaluation of Highway Investments: A Resource Saving Approach,” Journal of the Transportation Research Forum, v.35, n.1, 1995.

mctsG r e a t e r V a n c o u v e r G a t e w a y C o u n c i l
Economic Impact Analysis of the Major Commercial Transportation SystemEconomic Impact Analysis of the Major Commercial Transportation System
July 2003 - SW1040 68
Table 7-1 Value of Travel Cost Savings from MCTS
Traffic Congestion Reduction Improvements, Year 2021 (values shown in millions of 2002 constant dollars)
Value of Time
Savings (VHT)
Value of Change
in Distance (VKT)
Total Value of
All Changes
Social Value Econ Impact Social Value Econ Impact Social Value Econ Impact
Single Occupant Car $389.3 $116.8 -$14.6 -$14.6 $ 374.7 $102.2
High Occupant Car/Bus $171.0 $51.3 -$19.3 -$19.3 $151.60 $ 32.0
Light Truck $103.8 $103.8 -$7.8 -$7.8 $ 96.0 $ 96.0
Heavy Truck $197.8 $197.8 -$14.0 -$14.0 $ 183.7 $183.7
Total $861.9 $469.7 -$55.8 -$55.8 $ 806.1 $413.9
Source: Results of EMME2 transportation model simulation (Table 6-8) with value of time and distance as shown in text. Sixty percent of peak traffic is assigned to commuters, and 50% of the cost of commuting is allocated as business costs . All calculations by Economic Development Research Group.
Calculation of Direct Rail Cost Constraint The railroad impact analysis in Section 6.4 showed results for a year 2021 scenario in which rail traffic continues to grow with population and economic growth, while there is no major improvement in the performance of rail lines or
the capacity of rail bridges and other potential bottlenecks. The result was a finding of efficiency, safety and capacity impacts that could be addressed by the completion of proposed MCTS rail projects. To calculate the direct impact on the economy, we distinguished two elements of these impacts:
• Analysis of rail operations efficiencies and safety improvements showed that the proposed MCTS projects can save $1.8 million/year in rail operating costs. These rail costs are in addition to the impact of rail
capacity constraints, which are discussed next.
• Analysis of rail capacity constraints identified “bottlenecks” potentially limiting future growth of train volumes passing through the New Westminster Bridge (route to downtown ports) and the Colebrook East-West facility (route to Roberts Bank). Together these facilities are currently operating at an average level of 69 trains/day, which is well within their
estimated combined operating capacity of 82 trains/day. However, projections for future growth of rail traffic to/from the marine ports indicates that they there will be full usage of all capacity at these bottlenecks by the

mctsG r e a t e r V a n c o u v e r G a t e w a y C o u n c i l
Economic Impact Analysis of the Major Commercial Transportation SystemEconomic Impact Analysis of the Major Commercial Transportation System
July 2003 - SW1040 69
year 2015.30 Without further investment to increase capacity at bridge facilities, there will be an effective demand exceeding the capacity at these
facilities after that point in time. By the year 2021, the rail capacity shortfall, which represents an effective loss of potential growth in commodity flows, will be the equivalent of 11 trains/day to or from the marine ports. This translates into as many as 1,100 rail cars – the equivalent of about 2,200 heavy trucks per day.
7.3 Estimation of Economic Impacts Classification of Impacts and Methodology for Analysis The full economic impacts are estimated by first calculating the negative economic consequences of failing to invest in the proposed set of MCTS improvements, and then expressing the value of MCTS benefits as the positive
value of avoiding those consequences. Together, the direct costs of commercial traffic delay and the additional capacity constraints on rail cargo movements lead to a series of economic consequences, which occur in various forms. We can trace these economic consequences through four steps:
1) Transportation Impacts: Cost of Doing Business – The truck shipping costs
and rail capacity constraints (from failing to invest in the MCTS) affect transportation companies and shippers in a variety of industries within BC and elsewhere in western Canada, by adding to their cost of doing business. These impacts are estimated by applying information on freight
flows, forecasts and cost impacts provided in Chapters 3 – 6, together with technical tables of transportation reliance (referred to as “Transportation Satellite Accounts”).
2) Direct Economic Impacts: Industry Competitiveness and Growth – The
added costs of doing business for various industries directly affect their
relative cost-competitiveness and subsequently their growth within BC and elsewhere in western Canada. The result is a contraction of business activity or business growth if MCTS investments are not made. These impacts on cost-competitiveness and business growth/decline are
30 The capacity constraint calculations assumed that the number of trains traveling along the various railway segments presented the same annual growth rate of the rail cargo shipments (Table 3.2b in Appendix 5). The growth rate of the number of trains was combined with the information on the railway segment capacity before and after the improvement implementation as provided by the GVGC to determine the year in which the demand would meet the capacity of the railway segment.

mctsG r e a t e r V a n c o u v e r G a t e w a y C o u n c i l
Economic Impact Analysis of the Major Commercial Transportation SystemEconomic Impact Analysis of the Major Commercial Transportation System
July 2003 - SW1040 70
estimated through use of factors derived from studies of economic adjustments and regional economic forecasting models.
3) Indirect and Induced Economic Impacts -- Changes in the growth/decline of
directly affected industries also affect the growth/decline of additional industries throughout the economy, which supply goods and services to those (directly affected) industries and their workers. These additional effects are traced through provincial input -output economic accounting
tables.
4) Net Economic Impact -- The total gross economic impact is the sum of steps #2 and #3. However, in the long run, there can be some economic adjustment to reduce the severity of those impacts. The impacts of alternative assumptions concerning long-term business and workforce
adjustment are estimated through sensitivity analysis.
Findings on Direct Economic Impacts The direct economic impacts of completing the MCTS is the realization of additional business growth that would otherwise be lost due to the high costs of rising congestion. In the high impact scenario, we assume that the full cost of
congestion is absorbed by businesses (as a loss of income and hence value added or GDP), which in turn respond by contracting and shedding employment proportionately. In that case, the direct economic impacts for year 2021 would reflect $414 million of additional road-related business cost/year incurred in the absence of MCTS investments (as previously indicated in Table 7-1), plus additional rail-related impacts which would raise the total direct
impact on the economy (Gross Domestic Product or value added) to $510 million (Table 7-2). The consequences would be a direct contraction of over 8,500 jobs. Alternatively, we could recognize that some businesses can take action to mitigate impacts of increased congestion-related costs in the absence of MCTS
investments, thus leading to more modest contractions in the economy. For instance, some businesses can find ways to reduce (though not completely eliminate) their own cost impacts by: (a) relocating their business outside of the Greater Vancouver Gateway region, or (b) shifting their truck or rail shipments to use other, less congested routes and gateway facilities outside of the Greater Vancouver region. However, both types of business adjustments can
actually lead to additional impacts that can potentially have even more severe negative consequences for the regional economy.

mctsG r e a t e r V a n c o u v e r G a t e w a y C o u n c i l
Economic Impact Analysis of the Major Commercial Transportation SystemEconomic Impact Analysis of the Major Commercial Transportation System
July 2003 - SW1040 71
For instance, business relocations away from the region can mean the loss of their total activity rather than just its contraction within the region. In addition,
shifting the flow of their shipments to bypass the region can also cause additional losses of Greater Vancouver Gateway jobs. Workers and capital resources that are shed due to business contractions can also lead to a variety of results: (a) relocation to be employed outside of the region, (b) remaining unemployed, and (c) shifting to new jobs and activities in
other industries that subsequently move in or expand in the area. The net effect is still a loss of aggregate personal income and total Gross Domestic Product, but that loss is reduced to the extent that some workers and resources remain and are redirected to alternative activities (category “c”). Studies of economic adjustments and regional economic simulation models
lead us to estimate that business and workforce adjustments could potentially reduce the net economic impact down to as low as 45% of the high impact scenario. In that case, the direct economic impact would amount to $230 million/year of GDP and 3,800 jobs. However, that smaller level of economic shrinkage does not account for remaining congestion costs that are still absorbed by businesses that do not contract.
These results for the high impact and low impact scenarios are shown in Table 7-2. It is important to note that neither of these scenarios accounts for indirect economic consequences or other social costs, such as personal time losses incurred by residents.

mctsG r e a t e r V a n c o u v e r G a t e w a y C o u n c i l
Economic Impact Analysis of the Major Commercial Transportation SystemEconomic Impact Analysis of the Major Commercial Transportation System
July 2003 - SW1040 72
Table 7-2 Direct Change in Economic Activity in BC Due to Travel Cost Savings
Associated with MCTS Improvements (2021)
Millions of Constant 2001 Dollars Impact on BC Economy Attributable to:
Jobs
Annual Business Output (Sales)
Gross Domestic Product
High Impact: Assuming that Businesses Absorb all Costs
Business Auto Avoided Cost 2,900 $237.7 $134.2
Truck Avoided Cost 3,892 $1,898.6 $279.7
Rail Capacity Avoided Cost 1,770 $194.4 $96.6
Total 8,562 $2,330.7 $511.5
Alternative: Impact Allowing for Economic Adjustment*
Business Auto Avoided Cost 1,305 $107.0 $60.4
Truck Avoided Cost 1,752 $854.6 $126.9
Rail Capacity Impact 804 $88.3 $43.9
Total 3,861 $1049.9 $230.2
* Remaining business cost not recognized in the Alternative Scenario are assumed to be incurred but do not lead to additional economic contraction. Note: These figures are results of economic cost impacts shown in Table 7-1. They also do not include the additional “social value” represented by $392.2 million of personal time benefit as indicated in that table.
Findings on Indirect, Induced, and Total Economic Impacts Direct contractions in the level of economic activity in British Columbia also lead to indirect (supplier) impacts and induced (wage re-spending) impacts which
can affect the economies of all of the western provinces. To calculate these downstream effects, the economic input-output models for the provincial economies of British Columbia, Manitoba, Saskatchewan, and Alberta were applied. These models yielded estimates of the overall impact on the economies of the four provinces, as shown in Table 7-3. Results are shown under the two alternative assumptions of direct impact:
• In the high impact scenario, the total impact on the economy of the four provinces (by year 2021) is nearly $3.5 billion of annual business sales, including over $1 billion of Gross Domestic Product and over 16,000 affected jobs.

mctsG r e a t e r V a n c o u v e r G a t e w a y C o u n c i l
Economic Impact Analysis of the Major Commercial Transportation SystemEconomic Impact Analysis of the Major Commercial Transportation System
July 2003 - SW1040 73
• In the more realistic alternative scenario, only a portion of the direct congestion impact occurs in the form of economic contraction. That, in turn, leads to a total impact on the economy of the four provinces (by
year 2021) amounting to over $1.5 billion of annual business sales, including over $475 million of Gross Domestic Product and over 7,300 affected jobs. This does not count the $281 million of remaining congestion costs that represent a net loss of income but are not assumed to lead to any additional contraction of the economy.
In all cases, it is important to note that these are recurring annual impacts, which phase in over the 2003 to 2021 time period. The economic benefit of completing the MCTS is that these total overall losses of GDP in the economy, due to rising congestion over time, are avoided. (The total social benefit of the MCTS, which is addressed in the later discussion of total benefits and costs, includes this GDP impact plus the value of further business congestion cost
savings and personal travel time savings that were not considered in the calculation of GDP impacts.)
Table 7-3
Overall Economic Impacts of Investing in MCTS in Year 2021
Millions of Constant 2001 Dollars Total Impact on Combined
Economy of BC and Other Provinces of Western Canada
Jobs Annual Business
Output (Sales) Gross Domestic
Product
High Impact: Assuming that Businesses Contract in Proportion to Cost Increase
Direct Economic Contraction 8,562 $2,330.7 $511.5
Indirect Impact 3,346 $574.7 $260.4
Induced Impact 4,356 $577.8 $282.9
Total Overall Impact 16,292 $3,487.7 $1,055.2
Alternative: Allowing for Economic Adjustment
Direct Economic Contraction 3,861 $1,049.9 $230.2
Indirect Impact 1,506 $258.7 $117.2
Induced Impact 1,979 $262.5 $128.5
Total Overall Impact 7,347 $1,571.1 $475.8

mctsG r e a t e r V a n c o u v e r G a t e w a y C o u n c i l
Economic Impact Analysis of the Major Commercial Transportation SystemEconomic Impact Analysis of the Major Commercial Transportation System
July 2003 - SW1040 74
Findings on Construction Impacts
Besides having long-term recurring benefits, investing in the MCTS will also generate jobs associated with the additional construction activity. The spending of $6.2 to $6.9 billion (expressed in constant year 2002 dollars) on highway, rail and bridge/tunnel projects will directly support between 29,000 and 32,000 person-years of employment over a two-decade period of construction. If this is an infusion of additional spending that does not displace other economic activity, then it could also support suppliers (indirect impacts)
and generate further income re-spending of the additional wages (induced impacts) – raising the overall impact by approximately 54,000 to 59,000 person-years of employment over the period of construction. These are non-recurring impacts associated with the one-time spending on construction. They can be very real impacts, but they are considered to be a consequence of the spending rather than a benefit of completing the MCTS projects.
7.4 Sensitivity Analysis The results shown here are based on a series of assumptions related to expected rates of economic adjustment to change, market competition and exchange rates. By examining these factors, we can identify upside and downside values for the benefit measures presented in this report.
Maximum Impact Estimate: Even the high impact scenario shown in Table 7-3 is not a worst case for failure to invest in the MCTS. In a worst case, a significant share of Canadian businesses that depend on the Greater Vancouver Gateway for international exports could find that they are no longer cost competitive in world markets and could close up or move out entirely. That
possibility becomes less remote if international exchange rates, and especially US-Canadian currency exchange rates, do not remain advantageous for Canadian businesses. The magnitude of exports flowing through the Greater Vancouver Gateway is massive; there is approximately $30 billion of annual BC exports, not even counting exports from other western provinces that depend on BC gateways. Those exports alone support well over 150,000 jobs in
production industries, so a loss of even 10% of the exports would double the magnitude of the “high impact” scenario. Finally, it may be noted that the projected impacts for year 2021 depend on assumptions regarding growth in business output and employment. If economic growth exceeds these forecasts, then road congestion levels and rail

mctsG r e a t e r V a n c o u v e r G a t e w a y C o u n c i l
Economic Impact Analysis of the Major Commercial Transportation SystemEconomic Impact Analysis of the Major Commercial Transportation System
July 2003 - SW1040 75
capacity constraints could be even higher, and economic benefits of completing the MCTS would also be higher. This study is based on what we regard as
reasonable assumptions of growth in transportation demand, which range from 19% for trucks to 88% for air cargo (Table 5-1). However, those projections for trucks and air are actually conservative compared to U.S. projections of growth over nearly the same period (US Dept. of Transportation, Federal Highway Administration, Freight Analysis Framework, projections for 1998-2020).
Minimum Impact Calculation: The estimates of direct, indirect, and induced economic impacts assume that a loss of business activity in British Columbia and other Western provinces leaves some workers and capital resources (buildings, equipment and money) idle as a result of business contraction. Without a full study of unemployment and wage rates in various labour markets, and a study of the mobility of labour in BC and other western provinces, we
cannot be sure of the extent to which workers in affected industries are likely to adjust by finding alternative jobs in other industries or locations. However, it is reasonable to assume that not all workers and resources are fully mobile. The presence of chronically higher unemployment in some communities and regions of Canada suggests that some people are not fully
mobile to move to wherever there are jobs. Economic theory would also suggest that the minimum impact on the provincial GDP would still reflect a productivity loss equal to the direct transportation cost impact on businesses. So, we recognize the downside estimate of benefit to be the values of direct traveler impact shown in Table 7-1 – a total social impact of $806 million /year, including a business income (GDP) impact of $414 million/year. That would
imply a loss of approximately 6,400 jobs.
Comparison of Benefits and Costs Public Costs: It is estimated that the cost of completing the identified MCTS infrastructure improvements is in the range of $6.2 billion to $6.9 billion, expressed in year 2002 dollars. That cost would be incurred over a period of
time, most likely spread out over two decades. To represent the timing of public costs (necessary for benefit-cost calculations), it is necessary to establish a schedule for construction and completion of the identified projects. It is also important to establish a scenario for raising funds, including assumptions about potential streams of revenues and operating costs associated with implementation of any toll facilities, changes in taxes or fees,
and issuance of public bonds.

mctsG r e a t e r V a n c o u v e r G a t e w a y C o u n c i l
Economic Impact Analysis of the Major Commercial Transportation SystemEconomic Impact Analysis of the Major Commercial Transportation System
July 2003 - SW1040 76
Benefits to Society: The economic impacts addressed in this report represent the net impact of transportation cost and capacity changes on the Gross
Domestic Product of the economy of the four western provinces. The full social or societal benefit includes the value of this economic (GDP) impact plus the value of other business cost and personal travel time impacts that were not taken into account in the calculation of GDP impacts. The calculation of total social benefit is shown in Table 7-4. It shows that the
high impact estimates would place this social benefit at over $1.4 billion/year, while the alternative estimate would reduce this benefit slightly -- to $1.1 billion/year. The minimum estimate of social impact is the straight value of the direct user cost change, which is $806 million/year.
Table 7-4 Estimates of Total Social Benefit of Investing in the MCTS, Year 2021
(all values in millions of constant year 2001 dollars)
Social Benefit Element High Impact Alternative Low Impact
Economic Growth Impact: Change in Gross Domestic Product [1]
$1055 $475 $414
Additional Business Congestion Cost Savings (not affecting GDP) [2] $0 $281 $0
Additional Personal Time Cost Savings (not affecting GDP) [3] $392 $392 $392
Total Social Benefit $1447 $1149 $806
[1] For the High Impact and Alternative scenarios, the change in total GDP is shown in Table 7-3. For the Low Impact scenario, it is shown as the total economic impact in Table 7-1.
[2] For the High Impact and Low Impact scenarios, all business congestion cos ts are already included in the GDP impact line. For the Alternative scenario, the additional business congestion cost is the difference between the total direct GDP impact shown for the High Impact Scenario in Table 7-2 and the corresponding total direct GDP impact shown for the Alternative Scenario.
[3] For all scenarios, the additional personal time impact is the difference between the social and economic benefit totals shown in Table 7-1.
These incremental benefits (over the no-build scenario) are phased in over time. If all MCTS infrastructure improvements are completed immediately, then the benefits can be phased in starting now, reaching the estimated benefit level in year 2021 and growing further in later years. However, if the projects are
mctsG r e a t e r V a n c o u v e r G a t e w a y C o u n c i l
Economic Impact Analysis of the Major Commercial Transportation SystemEconomic Impact Analysis of the Major Commercial Transportation System
July 2003 - SW1040 77
completed over a period of one or two decades, then benefits are phased in as corresponding elements of the MCTS plan are completed.
Benefit-Cost Analysis. Costs and benefits occur at different points in time. In addition, construction costs are represented as a one-time total, while benefits are represented as a recurring annual amount. To compare them on a consistent basis, it is necessary to represent them both, the future costs and the future benefits, in terms of their net present value in today’s dollars. This
analysis can also incorporate additional relevant factors, such as opportunity costs of raising capital, expenses for ongoing operation and maintenance, toll revenues and residual value of property at the end of the observation time period. There are also likely to be substantial additional jobs and income generated by project construction activity, which is a very relevant interest for the public although it is usually not counted in benefit-
cost calculations (since similar benefits can also come from spending on alternative uses of the money).
At this point in time, there are many unresolved issues about timing and funding that could affect a benefit-cost analysis. However, it appears clear that a potential recurring social benefit of roughly $1.1 billion/year (range of $806
million to $1.5 billion) compares reasonably well to a one-time cost of roughly $6.2 to $6.9 billion.
Port of Vancouver Photo

mctsG r e a t e r V a n c o u v e r G a t e w a y C o u n c i l
Economic Impact Analysis of the Major Commercial Transportation SystemEconomic Impact Analysis of the Major Commercial Transportation System
July 2003 - SW1040 78
8. SUMMARY STATEMENTS
• Over 75,000 people work directly at Greater Vancouver Gateway facilities and supporting transportation services. Overall, more than 145,000 jobs in the four western provinces are directly or indirectly dependent on the
Greater Vancouver Gateway transportation system. This does not even count jobs at the many businesses that rely on the Vancouver’s international gateways and supporting ground transportation system for their international exports.
• Forecasts for continued population and economic growth in the Greater Vancouver area will lead to increasing pressure on the region’s ground
transportation system. The growth of road and rail traffic is expected to be particularly strong for commercial movements, which serve freight cargo moving to and from the airport, marine ports, industrial parks and international border crossing facilities. As a result, future congestion delays and future capacity constraints will hit commercial traffic particularly hard.
• Projections of future road and rail demand indicate that this demand will surpass the current capacity of significant elements of the current
transportation system. As a result, severe impacts on future travel times and travel costs are expected unless there is a significant investment made to upgrade and expand many aspects of the region’s transportation facilities. The magnitude of these travel impacts represent very large dollar values.
• Transportation forecasts for the year 2021 indicate that building the identified MCTS improvements will save over $800 million/year in excess
travel delays. (All values expressed in constant in 2002 dollars.) However, there are even larger stakes for the economies of BC and other western provinces, all of which depend on the region’s ports as a gateway to Asia.
• Without investments made to upgrade the performance and capacity of the region’s transportation facilities and services, there will be significant losses of business activity as travel times and costs for commercial shipping are
increased. This impact will grow every year, and by the year 2021, it is calculated to represent a loss of Gross Domestic Product exceeding $475 million/year (with an expected range of $414 million to $1.1 billion). That translates to a loss of over 7,000 jobs (with an expected range of up to 16,000 jobs at stake). Investing in the MCTS will avoid those losses.
mctsG r e a t e r V a n c o u v e r G a t e w a y C o u n c i l
Economic Impact Analysis of the Major Commercial Transportation SystemEconomic Impact Analysis of the Major Commercial Transportation System
July 2003 - SW1040 79
• The full social benefit of investing in the MCTS is the sum of the economic (GDP) impacts and the additional value of time savings not included in GDP calculations. This larger benefit measure is calculated to be
$1.1 billion/year by the year 2021 (range of $806 million to $1.5 billion/year).
• The BC and Western Provincial economies depend significantly on international exports and hence the movement of goods and services to international gateway facilities. Due to its position as a gateway to Asia, Vancouver and its gateway transportation facilities serve a critical role in
supporting the economies of this large region. The future economic performance of BC and other western provinces will depend on maintaining and improving the performance of the Greater Vancouver region’s Major Commercial Transportation System.
• To maintain the economy of BC and other western provinces, there will therefore need to be careful attention to making investments necessary so that costs of doing business in this region do not become prohibitive, and
western Canada remains competitive for exports in North American and international markets.
There are essentially three types of policy implications:
• Public officials will have to give serious attention to raising funds necessary
to maintain the functionality of the region’s ground transportation facilities and services. This should include a well-balanced set of investments serving public transportation, personal car travel and commercial freight travel. The particularly high value and high economic stakes associated with serving freight movements should be recognized in these funding and investment decisions. Consideration should also be given to the potential
tax revenue losses that could occur if the economy is hurt by a failure to maintain adequate transportation infrastructure.
• There is a long time lag in planning, obtaining funds, and constructing major infrastructure facilities. Therefore, there is a need to promptly address and resolve emerging issues concerning the region’s ability to pay for such projects, as well as options for additional sources of public funds, tolls and private investment as part of a realistic financing package.
• The private sector – air, marine, rail, trucking and tourism – will have to cooperate with each other and with public agencies to ensure that balanced investments are made. For instance, this report focused specifically on ground transport access, and noted that insufficient rail and highway

mctsG r e a t e r V a n c o u v e r G a t e w a y C o u n c i l
Economic Impact Analysis of the Major Commercial Transportation SystemEconomic Impact Analysis of the Major Commercial Transportation System
July 2003 - SW1040 80
access could adversely affect the competitiveness of local marine ports. However, this report did not address the fact that railroads and port
operators will also have to make private investments to ensure that their elements of the transportation system also have adequate capacity to effectively serve future demand.

mctsG r e a t e r V a n c o u v e r G a t e w a y C o u n c i l
Economic Impact Analysis of the Major Commercial Transportation SystemEconomic Impact Analysis of the Major Commercial Transportation System
July 2003 - SW1040 81
MEMBERSHIPS
Voting Members: BC Ferry Corporation
BC Maritime Employers Association BC Rail BC Wharf Operators Association Burlington Northern & Sante Fe Railway Co. Canadian National Rialways Canadian Pacific Railway
Fraser River Port Authority Greater Vancouver Transportation Authority North Fraser Port Authority Southern Railway of BC Railway Association of Canada Vancouver International Airport Authority
Vancouver Port Authority
Resource Members: Asian Pacific Foundation of Canada Business Council of British Columbia Greater Vancouver Regional District
Province of Alberta Province of British Columbia Province of Manitoba Province of Saskatchewan Regional Chambers of Commerce (GVRD) Transport Canada
University of BC – Dept. of Commerce Vancouver Board of Trade WESTAC Western Economic Diversification Canada Honorary Chair:
Minister of Transport, Government of Canada