GRB Classification using Self Organizing Map (SOM) Praveen Boinee Ph.D student Udine university.
37
GRB Classification using Self Organizing Map (SOM) Praveen Boinee Ph.D student Udine university
-
Upload
dwain-cole -
Category
Documents
-
view
229 -
download
0
Transcript of GRB Classification using Self Organizing Map (SOM) Praveen Boinee Ph.D student Udine university.

GRB Classification using Self Organizing Map (SOM)
Praveen Boinee Ph.D student
Udine university

Presentation outline GRB classification Neural networks Self organizing Map
Operations How it is used in the classification
Visualization Techniques with SOM Experimenting with data Research Plan References

GRB Data Analysis Importance of analysis
can be useful in understanding the physics of the gamma ray sources
can be helpful in finding the GRB sources But …
GRB data is one of the complex astronomical data sets High dimensionality
Analysis Techniques Statistical Artificial Neural Networks can be efficiently used in
data classification

GRB Classes
Two GRB classes are known to exist Burst class properties are indistinct Difficult to assign individual GRB’s to a class
because of attribute overlap More complexity has been added by
instrumental bias in the data

GRB subclasses
Pre-Processed GRB Data
Classified data
Scientific and
Logical Assessment
GRB classification process
DataBase
Data Mining VisualizationData
Preparation
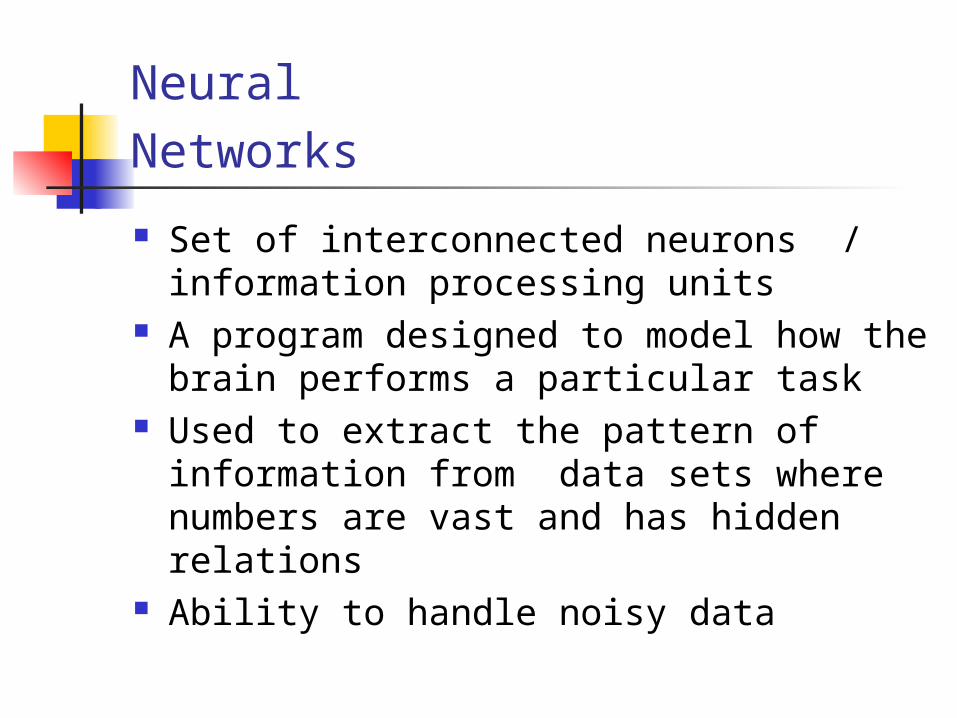
Neural Networks Set of interconnected neurons / information
processing units A program designed to model how the brain
performs a particular task Used to extract the pattern of information from
data sets where numbers are vast and has hidden relations
Ability to handle noisy data
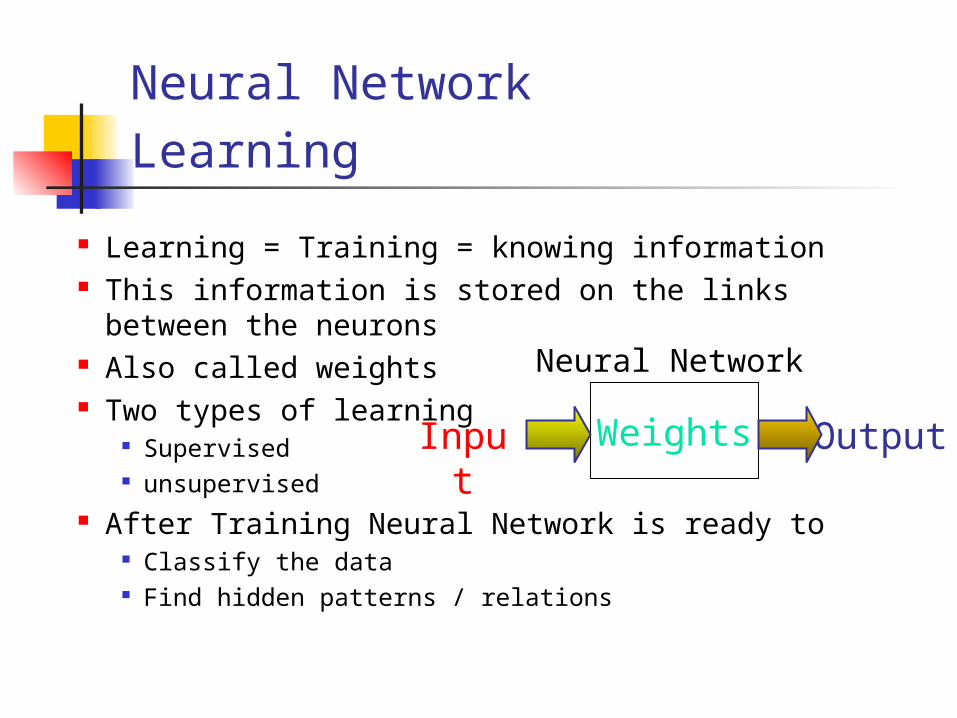
Neural Network Learning
Learning = Training = knowing information This information is stored on the links between the
neurons Also called weights Two types of learning
Supervised unsupervised
After Training Neural Network is ready to Classify the data Find hidden patterns / relations
Weights
Neural Network
OutputInput

Supervised vs. Unsupervised Learning
Imagine an organism or machine which experiences a series of sensory inputs:x1, x2, x3, x4, . . .
Supervised learning: The machine is also given desired outputs y1, y2, . . ., and its goal is to learn to produce the correct output given a new input.
Unsupervised learning: The goal of the machine is to build representations of x that can be used for reasoning, decision making, predicting things, communicating etc.

Goals of Unsupervised Learning
To find useful representations of the data, for example: finding clusters dimensionality reduction finding the hidden causes or sources of the data modelling the data density
Uses of Unsupervised Learning data compression outlier detection classification make other learning tasks easier a theory of human learning and perception
Self-Organisation
The brain cells are self organizing themselves in groups, according to incoming information.
This incoming information is not only received by a single neural cell, but also influences other cells in its neighbourhood. This organisation results in some kind of map, where Neural cells with similar functions are arranged close together.
SOM mechanism is also based on this principle

SOM working SOM produces the similarity
graph of the input data Converts non-linear
relationships between high dimensional data into simple geometric relationships
Illustration of the SOM model with a 7 X
7architecture
Input pattern
Weight
Updated Weight
Input space
Output space

SOM – Self organizing Map
Valuable tool in data mining and KDD Neural network algorithm for Data Mining Based on Unsupervised learning Vector quantisation + vector projection Used in clustering and visualization of high
dimensional data sets Very effective in information visualizations Introduced by Teuvo Kohonen in 1984 Used in many fields
But little done in astronomy area!!

SOM Architecture Set of neurons / cluster units Each neuron is assigned with a prototype vector that is taken from the
input data set The neurons of the map can be arranged either on a rectangular or a
hexagonal lattice Every neuron has a neighborhood as shown in the figure
Hexagonal Rectangular

SOM in Classification
Initialization Training Visualization

Initialization
Consider an n-dimensional dataset Each row in the data set is treated as a n-dimensional
vector For each neuron /classifier unit in the map assign a a
prototype vector from the data set Prototype vectors are initialized
Randomly Linearly
After training Prototype vectors serves as an exemplar for all the vector that associated with the neuron

Training – Best matching procedure
Let be a neuron in grid be the prototype vector associated to
be a arbitrary vector Now our task is to map this x to any one of
the neuron For each neuron compute the distance
Better statistic:
neuron satisfying the above statistic is the winner and denoted by b
iim
i nn
nRx
imxmin
iiD
ii
i mxmaxD
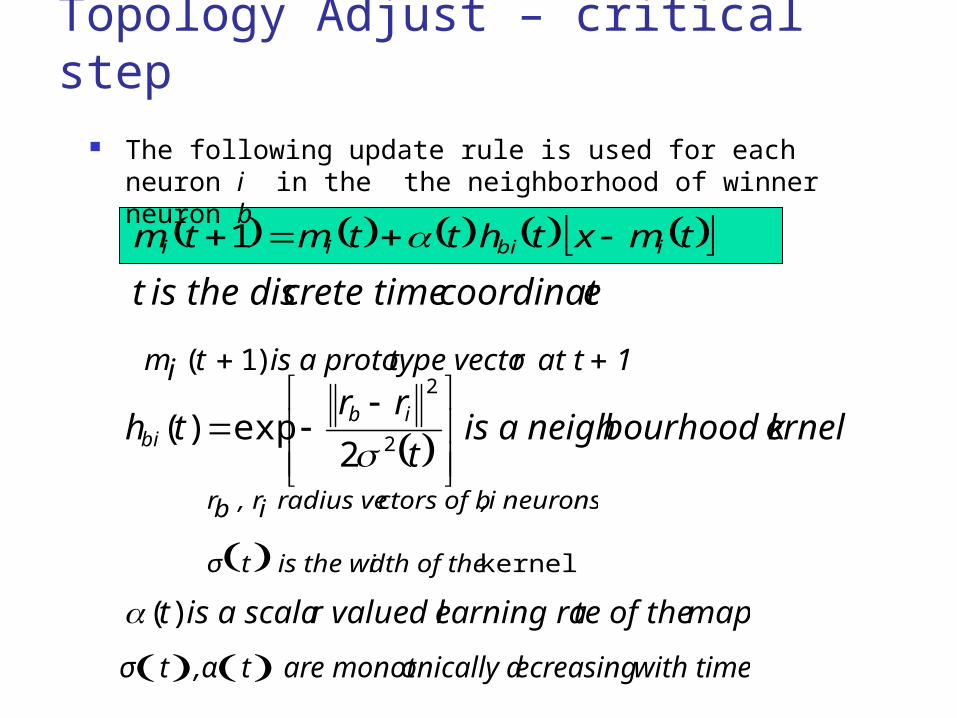
Topology Adjust – critical step The following update rule is used for each neuron i in
the the neighborhood of winner neuron b
tmxthttmtm ibiii 1
1at trtype vectois a prototim )1(
mapte of the earning rar valued lis a scalat )(
ernelbourhood kis a neight
rrth ib
bi 2
exp)(2
2
e coordinatcrete timeis the dist
kernel dth of the is the witσ
,i neuronsctors of b radius vei , rbr
with timeecreasing onically d are monott,αtσ

Training – Topology Training and Topology
adjustments are made iteratively until a sufficiently accurate map is obtained
After training the prototype vectors contain the cluster means for the classification
Neurons can be labeled with the cluster means or classes of the associated prototype vectors

Data visualization techniques using the SOM can be divided to
three categories based on their goal:
1. visualization of clusters and shape of the data:
projections, U-matrices and other distance matrices
2. visualization of components / variables:
component planes, scatter plots
3. visualization of data projections:
hit histograms, response surfaces
Data Visualization using SOM

Data Visualization using SOM
Representation forms
Component planes representation (Graphs,
scatter plots, ..)
Data distribution
Mesh visualizations SOM grid
Surface plot of distance matrix
Cell visualizations (Distances matrices e.g.
U-matrix, similarity coloring, map unit size) Clusters
(data structure)
Shape of clusters
Relationships
Shape
Color
Position
View (2D/3D
Object identifiers
(icons)
Connection lines
Coordinates control
Surface reflectance
Derived information
User interactions
Visual properties
Lighting
Transparency
The idea is to visually present many variables together offering a degree of control over a number of different visual properties
High dimensionality of data set and visual properties such as color, size can be added to the position property for proper visualization purposes.
Multiple views can be used by linking all separate views together when the use of these properties makes it difficult.
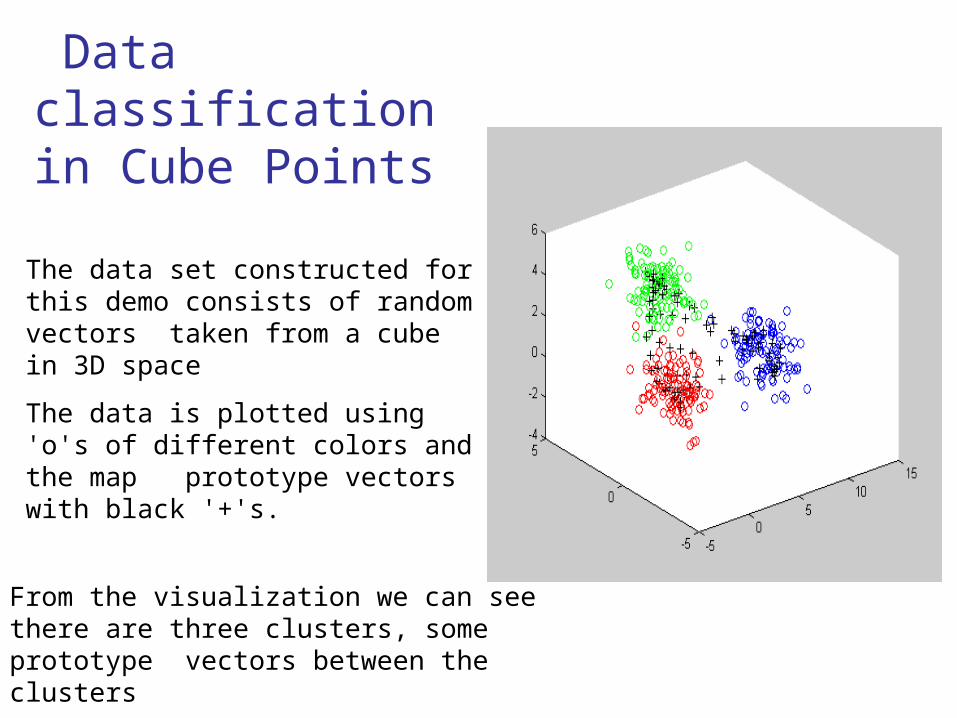
The data set constructed for this demo consists of random vectors taken from a cube in 3D space
The data is plotted using 'o's of different colors and the map prototype vectors with black '+'s.
From the visualization we can see there are three clusters, some prototype vectors between the clusters
Data classification in Cube Points

3 – xy points
2 – yz points
1 – zx points
Similar vectors are coded with same color
Clusters are coded with different colors

in interpolated form

XY plane points YZ plane points
ZX plane points
Data distributions for each vector component

World Poverty Map
PhD research seminar (Qualifying phase) - September 19, 2001- Etien Luc Koua
Data set has 39 indicators describing various quality-of-life factors, such as state of health, nutrition, educational services, etc,)

WEB SOM
SOM analysis technique to map thousands of articles posted on Usenet newsgroups
Lagus et al. (1996); Honkela et al. (1998) - HUT NN Research Centre)

GRB classification - Choice of Parameters
Three variables have been identified by Bagoly study on Batse 3B catalog using principle components and factor analysis
Burst duration Parameter (T90 ): Time it takes for 90% of the total burst flux to arrive, taken from duration table of BATSE catalog
Total flux in the channels : The rate of flow of particles or energy through a given surface
Weighted fluence : the sum of the energies of the photons passing through a unit area.
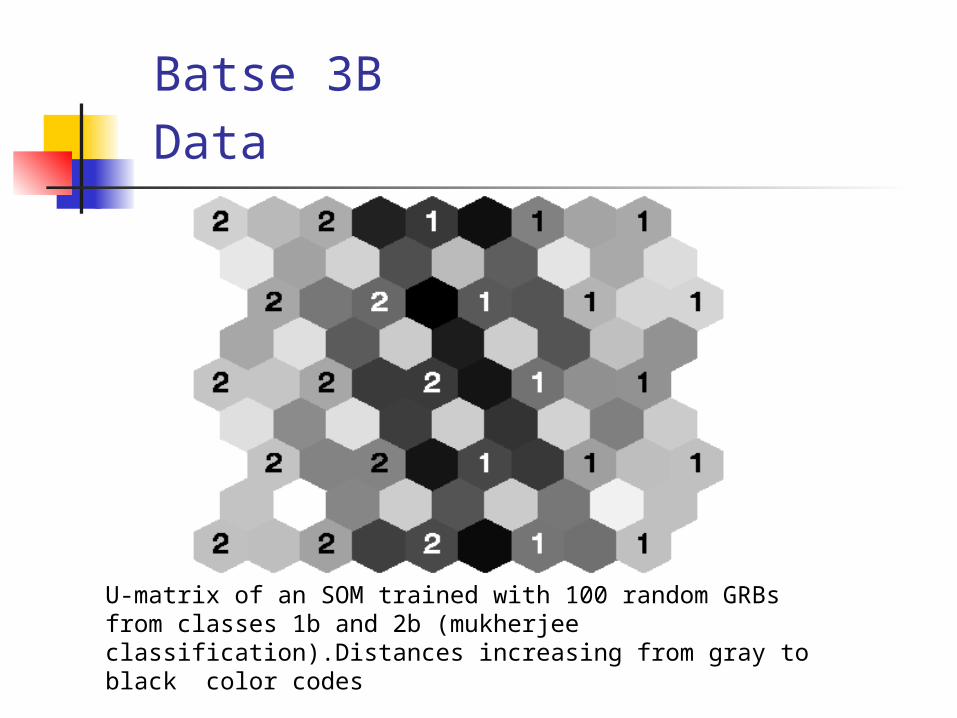
Batse 3B Data
U-matrix of an SOM trained with 100 random GRBs from classes 1b and 2b (mukherjee classification).Distances increasing from gray to black color codes
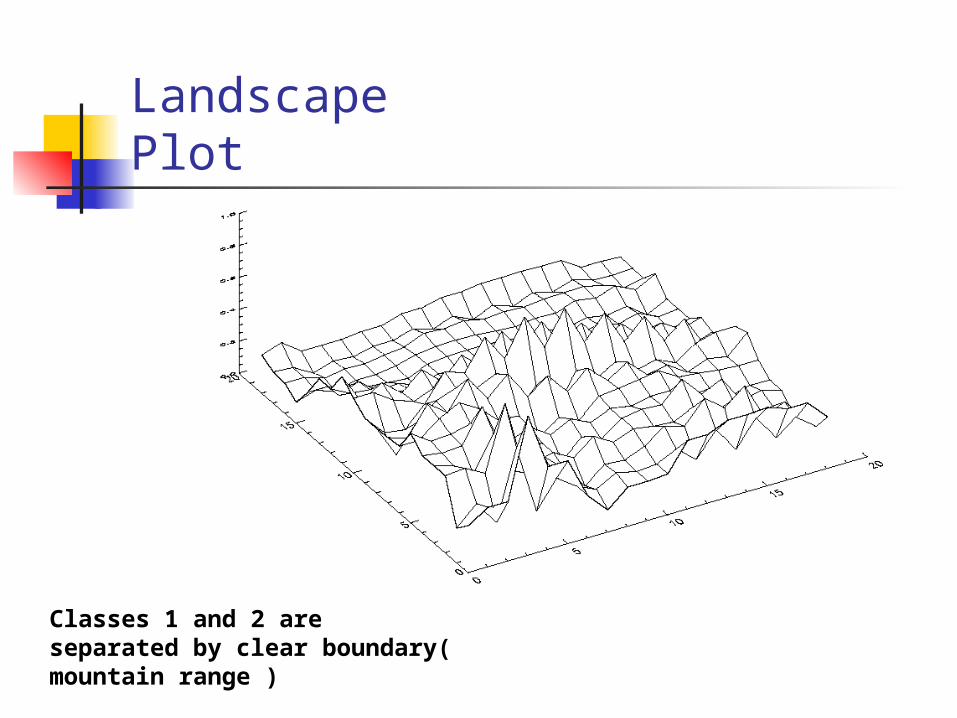
Landscape Plot
Classes 1 and 2 are separated by clear boundary( mountain range )


Software Packages
SOM_PAK MS-DOS / UNIX Free, from the website. The "official" SOM implementation.
SOM Toolbox Matlab 5 Free, from the website.
Software
Geo-vista an open software development environment Java Bean component technology http://www.geovista.psu.edu/software/
software.jsp
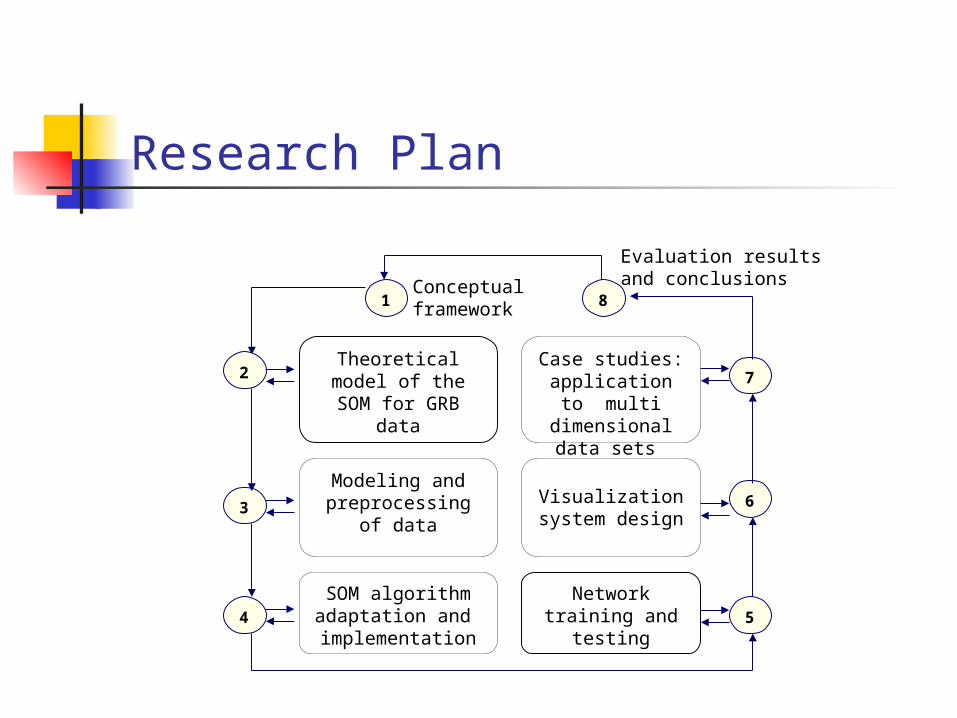
Research Plan
Case studies: application to
multi dimensional data sets
Theoretical model of the SOM for
GRB data
Network training and
testing
Visualization system design
Modeling and preprocessing of
data
SOM algorithm adaptation and implementation
1
2
3
4 5
6
7
8
Evaluation results and conclusionsConceptual
framework

References T. Kohonen :Self – organizing Maps (second edition) H.J Rajaneimi , P.Mahonen : Classifying GRB using SOM ,APJ566:202-209
2002 February 10 J.Hakkila ,A.Meegan : AI Gamma-Ray Burst Classification:
Methodology/Preliminary Results arXiv:astro-ph/9712077 4 Dec 1997 Juha Vesanto :SOM-Based Data visualization Methods in Intelligent Data
Analysis journal, 1999: S.Kaski:Data exploration using SOM ,Espoo 1997 : T.Kohonen : Exploration of very large data bases by SOM , ICNN’97
Piscataway,NJ S.Mukherjee : Three types of Gamma Ray Bursts ,APJ 508:314-327,1998 M.Koskela , J. Laaksonen : Self Organizing Image retrieval with MPEG-7
Descriptors http://www.batse.msfc.nasa.gov/batse/grb/