GRAPHICS CALCULATORS AND ASSESSMENT*kissane/papers/icme8.pdf(such as the differences between Texas...
22
1 Kissane, Kemp & Bradley GRAPHICS CALCULATORS AND ASSESSMENT* Barry Kissane, School of Education Marian Kemp, Academic Services Unit Jen Bradley, School of Physical Sciences, Engineering and Technology Murdoch University Western Australia ABSTRACT: Graphics calculators are powerful tools for learning mathematics and we want our students to learn to use them effectively. The use of these hand held personal computers provides opportunities for learning in interactive and dynamic ways. However, it is not until their use is totally integrated into all aspects of the curriculum that students regard them with due importance. This includes their use in all kinds of assessment tasks such as assignments, tests and examinations as well as in activities and explorations aimed at developing students’ understanding. The in- corporation of graphics calculators into assessment tasks requires careful construction of these tasks. In this paper, discuss issues of equity relating to calculator models, levels of calculator use and the purpose and design of appropriate tasks. We also describe a typology we have developed to assist in the design and wording of assessment tasks which encourage appropriate use of graphics calculators, but which do not compromise important course objectives. INTRODUCTION The educational significance of graphics calculators is closely related to the likelihood that they will be accessible to students in many situations: in classrooms, studying at home and, critically for this paper, in assessment situations. The size, ready portability and rapidly affordable cost of graphics calculators together make it necessary to reconsider assessment of students’ mathematical capabilities under the assumption that they will be permitted to make use of a graphics calculator. This paper provides an overview and analysis of the relationships between graphics calculators and assessment, and identifies a number of important issues. Over recent years, we have worked as a team to gradually incorporate graphics calculators into an undergraduate mathematics course at Murdoch University in Western Australia. (Bradley, Kemp & Kissane 1994). Our principal motivation for including graphics calculators into the fabric of the course was (and still is) the improvement of both teaching and learning mathematics. However, as others in similar circumstances have found, issues of assessment arose naturally and needed attention. Although some of the issues are amenable to analysis, most of them have required practical work in teaching and curriculum development. The course concerned mainly comprises work in pre-calculus, algebra and trigonometry, although it also includes some work with the idea of a derivative function. However, our curriculum development work in this course has allowed us to see the wider implications of graphics calculators for assessment in other educational contexts.
Transcript of GRAPHICS CALCULATORS AND ASSESSMENT*kissane/papers/icme8.pdf(such as the differences between Texas...

1 Kissane, Kemp & Bradley
GRAPHICS CALCULATORSAND ASSESSMENT*
Barry Kissane, School of EducationMarian Kemp, Academic Services Unit
Jen Bradley, School of Physical Sciences, Engineering and Technology
Murdoch UniversityWestern Australia
ABSTRACT: Graphics calculators are powerful tools for learningmathematics and we want our students to learn to use them effectively. Theuse of these hand held personal computers provides opportunities forlearning in interactive and dynamic ways. However, it is not until their useis totally integrated into all aspects of the curriculum that students regardthem with due importance. This includes their use in all kinds of assessmenttasks such as assignments, tests and examinations as well as in activities andexplorations aimed at developing students’ understanding. The in-corporation of graphics calculators into assessment tasks requires carefulconstruction of these tasks. In this paper, discuss issues of equity relating tocalculator models, levels of calculator use and the purpose and design ofappropriate tasks. We also describe a typology we have developed to assistin the design and wording of assessment tasks which encourage appropriateuse of graphics calculators, but which do not compromise important courseobjectives.
INTRODUCTION
The educational significance of graphics calculators is closely related to the likelihood thatthey will be accessible to students in many situations: in classrooms, studying at home and,critically for this paper, in assessment situations. The size, ready portability and rapidly affordablecost of graphics calculators together make it necessary to reconsider assessment of students’mathematical capabilities under the assumption that they will be permitted to make use of agraphics calculator. This paper provides an overview and analysis of the relationships betweengraphics calculators and assessment, and identifies a number of important issues.
Over recent years, we have worked as a team to gradually incorporate graphics calculatorsinto an undergraduate mathematics course at Murdoch University in Western Australia. (Bradley,Kemp & Kissane 1994). Our principal motivation for including graphics calculators into the fabricof the course was (and still is) the improvement of both teaching and learning mathematics.However, as others in similar circumstances have found, issues of assessment arose naturally andneeded attention. Although some of the issues are amenable to analysis, most of them have requiredpractical work in teaching and curriculum development. The course concerned mainly compriseswork in pre-calculus, algebra and trigonometry, although it also includes some work with the ideaof a derivative function. However, our curriculum development work in this course has allowed usto see the wider implications of graphics calculators for assessment in other educational contexts.
ICME-8 Topic Group 18 2
Our work has been supported in part by a national grant from CAUT, the Committee for theAdvancement of University Teaching, an initiative of the Australian Government to supportinnovative work of this kind.
There seems to have been surprisingly little written about assessment issues related tographics calculators yet. (For example, none of the papers in Andrews & Kissane (1994) dealt withthe matter.) It is also interesting to note that, despite the apparent availability of microcomputers formathematics education for a considerable time now, issues of assessment seem not to have beencarefully analysed in the literature and have not been prominent in thinking about the relationshipsbetween technology and mathematics education. The explanation for these phenomena is that it hasnot been necessary to grapple with the issues, since in most practical situations, students have nothad enough access to the technology to demand that we contemplate its use in assessment. Thedevelopment of the personal technology of graphics calculators has changed this, and thus providesthe imperative for this paper.
WHAT IS ASSESSMENT?
Assessment in mathematics education is concerned with finding out what students know,understand and can do, with a view to making use of this information in some way. Assessmenttakes many forms. Recognisable around the world are formal examinations, which are sometimesexternal to the school, and less formal versions such as class tests and quizzes, usually of shorterduration and generally local to a particular classroom. Much formal assessment is timed andsupervised. While there are many kinds of questions asked, they can often be classified into twobroad groups; short answer questions, such as multiple choice questions, which require students tothink about and analyse some situation, and then select the best of the responses offered; extendedresponse questions, which require student to structure a response by themselves, and generallydemand that students give some evidence of their thinking, not only their conclusion. Ourexperience and interest is mainly with the latter category, although much of this paper hasimplications for short answer questions as well.
Formal assessment sometimes has a ‘high stakes’ character, such as an external examinationused to determine in part whether a student will be admitted to a particular institution orprogramme, or whether a student will be permitted to graduate. In nationally competitive situations,the stakes can become very high, and issues of assessment and graphics calculators can becomeissues in the public domain, not only practical issues for the classroom teacher of mathematics.
As well as formal assessment, much useful information can be gleaned from students work inless formal settings, including weekly assignments, projects and investigations, which may becompleted by students working in collaboration, or with substantial help from resources such astextbooks, and within much less tightly defined time constraints. In our experience, the use ofgraphics calculators in such situations is very important for both learning and assessment. Inaddition, there is much informal assessment in classrooms, relying on observation, interview andconversation. Although such formative assessment might arguably even be more important, in fact,than formal assessment, it is not the subject of this paper.
WHY IS THE USE OF GRAPHICS CALCULATORSIN ASSESSMENT IMPORTANT?
The central reasons for coming to terms with assessment issues related to the use of graphicscalculators are related to the integration of technology into the curriculum. (Kemp, Kissane &Bradley 1995). The coherence of assessment and learning environments is critical. Graphicscalculators enjoy a significant advantage over other computers in terms of accessibility; students arepotentially able to use calculators in many settings, such as in the classroom, at home when working

3 Kissane, Kemp & Bradley
on homework or assignments, and in formal assessment situations. Although graphics calculatorsprovide important new learning opportunities, and access to new ways of dealing with mathematicalsituations, in our experience some students are inclined to undervalue both of these if thecalculators are not integrated into the assessment program as well as the rest of the curriculum.(Bradley, Kissane & Kemp 1996) This is especially important in the case of ‘high-stakes’assessment.
A different kind of change is that an important new course outcome might be expected,concerned with the extent to which students can use technology well; this involves deciding whento use a graphics calculator and when not to do so, using it efficiently, interpreting the resultsobtained and describing them in appropriate mathematical language. Such an important courseoutcome needs to be assessed, which involves changing the traditional style of assessment.
Regarding student opinion on the use of graphics calculators, we have elsewhere reported datasuggesting that there is a discernible positive shift associated with use in all areas of assessment.(Kissane, Kemp & Bradley, 1995). In the table below, the mean attitudes of successive groups ofour undergraduate students to various aspects of calculator use are summarised, augmented by 1996results. The 1994 group used calculators in class and one class test, but not in assignments or thefinal exam, while the latter two groups used graphics calculators in all phases of assessment. Themean scores are constrained to fall between 1 and 4, with a higher mean score associated with amore positive attitude, and a score of 2.5 representing ambivalence.
1994 1995 1996Using the graphics calculators helped me to understand graphs ofpolynomial and rational functions.
3.15 3.19 3.33
Using the graphics calculators helped me to understand graphs oftrigonometric functions.
3.10 3.13 3.23
It was a good idea to be able to use the graphics calculators in the test. 3.01 3.22 3.39Using the graphics calculator helped me to understand the relationshipbetween graphs and solutions to equations and inequalities.
2.96 3.20 3.35
Using the graphics calculators helped me to understand matrices andtheir uses to solve systems of equations.
2.88 3.09 3.33
Overall I enjoyed using the graphics calculators. 2.83 3.03 3.30Some assignment questions should require the use of graphicscalculators.
2.76 3.13 3.23
I think that we should be allowed to use graphics calculators in thefinal examination.
2.71 3.35 3.53
Table 1: Mean scores on selected Likert items
This table illustrates clear shifts in successive cohorts of student opinion regarding graphicscalculators. While the shift in view on items regarding assessment is quite predictable, the shifts notdirectly related to assessment support the argument for integration of graphics calculators intoassessment, to take advantage of the consequences of wider student use. Further details of ourexperiences, the course concerned and other aspects of student reactions are given in Kissane,Kemp & Bradley (1995).
GRAPHICS CALCULATOR CAPABILITIES
In considering the relationship between assessment and graphics calculators, the mathematicalcapabilities of the calculators themselves need to be taken into account. Two issues quickly emerge.In the first place, despite the way in which they are described, graphics calculators are quitepowerful computers and provide access to many mathematical capabilities that are not essentiallygraphical in nature. Secondly, there are considerable differences between the capabilities ofdifferent models. The pairs of calculator screens in Figures 1, 2 and 3 illustrate these two points.

ICME-8 Topic Group 18 4
Figure 1: A chi-squared hypothesis test on a Texas Instruments TI-83
Figure 2: The solution of a system of linear equations on a Casio fx-9700

5 Kissane, Kemp & Bradley
Figure 3: A Taylor polynomial on a Hewlett Packard HP-38G
Other examples might readily have been chosen for which the main mathematical supportprovided by the calculator is not essentially graphical (although it may have a graphical element,such as in the example of the hypothesis test above). Graphics calculators can be used directly tofind successive terms of a recursively defined sequence, construct confidence intervals performmatrix arithmetic, approximate definite integrals, operate with complex numbers, and so on. Somerecent calculators have very powerful symbolic capabilities, raising significant concerns for bothcurriculum and assessment. Some illustrative examples are shown in Figure 4, containing screensfrom a Texas Instruments TI-92 graphics calculator, the best available example of a hand-heldcomputer algebra system.
Figure 4: Symbolic manipulation on a Texas Instruments TI-92
A complication when considering assessment with graphics calculators, especially assessmentbeyond the local level, where there may be a reasonable expectation that most students have thesame model calculator, is that not all graphics calculators have precisely the same capabilities. Themore sophisticated capabilities of some calculators are not always available on other models. Insome cases, this is a consequence of variations among capabilities of the same brands of calculators(such as the differences between Texas Instruments TI-81 and TI-83 calculators), whilst in othercases, the differences reflect different manufacturer’s views of what is important at different levels.

ICME-8 Topic Group 18 6
In many cases, differences can be minimised by either skilful calculator use or through the use ofshort programs. For example, neither the Texas Instruments TI-81 nor the Casio fx-7700 has anautomatic root-finding routine, unlike more powerful models. The short programs in Figure 5 allowstudents to upgrade their calculators to achieve the same end, albeit a little less conveniently, oncethey have drawn a graph and decided approximately where the roots are located. Students can beprovided with such a program by their teacher, and do not need to know about programming or theNewton-Raphson procedure to use the program, any more than do students who use the inbuiltversions of routines like these on a more sophisticated calculator.
Figure 5: Short programs for a Texas Instruments TI-81 and a Casio fx-7700
Similar programs can be written to reduce other differences, such as to generate successiveterms of a sequence for a calculator without recursive function capabilities or to evaluate definiteintegrals numerically.
Unlike the preceding examples, some calculator capabilities are more difficult to replace, andare thus potentially of greater concern when assessment is taken into account. Some examples ofthese include graphing in polar coordinates, arithmetic with complex numbers, automatic solutionof systems of linear equations, generation of terms of Taylor series, statistical hypothesis testingand symbolic manipulation generally.
EQUITY ISSUES ASSOCIATED WITH DIFFERENT MODELS
Understandable concerns have been raised about the possibility that more affluent studentsmight be advantaged during formal assessment merely because they can afford more sophisticatedgraphics calculators, which generally cost more to purchase than less sophisticated models. While itmay be possible (to a limited extent) to resolve such problems at the local level by a process ofencouraging, or even insisting, that all students use the same graphics calculator, such a strategy initself is iniquitous and ultimately unmanageable. In any event, such ‘solutions’ are not possible forthe wider level, outside the domain of a single class, school, district or state.
Experience has already begun to accumulate indicating that most students in practice arelikely to use the least sophisticated parts of their calculator most well, and to be less confident of themore sophisticated capabilities Frequently, more sophisticated calculator operations are onlyvaluable to a more sophisticated and experienced user. Our informal observations at MurdochUniversity are consistent with this claim. It needs also to be acknowledged that someone who hasspent a lot of time using a more powerful calculator will most likely be better able to handle manymathematical situations than someone else; in fact, they almost certainly know more aboutmathematics as a result of the time spent using their powerful calculator! In other words, it is notonly the calculator that has more capabilities; it is also the person operating the calculator.
Nonetheless, the equity issue is a real one, and needs to be considered in the context ofassessment, particularly high-stakes assessment such as Advanced Placement examinations in the

7 Kissane, Kemp & Bradley
USA, A-level examinations in the UK, and tertiary entrance examinations in Australia andelsewhere. (Kissane, Bradley & Kemp, 1994).
One partial solution to the problem is the specification and publication of minimumcapabilities needed for courses or exams (as happens for the Advanced Placement Examinations inCalculus in USA). This places the onus on those responsible for the examinations to ensure thatquestions are not rendered easier to those with more sophisticated calculators, and at the same timemakes clear to students, their parents and their teachers what capabilities they should ensure areaccessible. In the case of students with less expensive, or merely older, calculator models, smallprograms, such as those shown in the previous section, should be made available long enough inadvance for students to be comfortable with their fluent operation.
The use of programs in this way means that students need to have access to calculatormemories, and suggests that it would be quite inequitable to insist that calculator batteries areremoved or memories cleared before an examination. In turn, this position raises a fresh issuerelated to text storage in some graphics calculator models. Although limited forms of text storageare possible in any graphics calculator model (by merely writing a program consisting of words, forexample), some calculators actually have a facility to write, store and retrieve notes. Students withsuch a calculator, in an assessment situation in which memories are not required to be cleared inadvance, might be able to take advantage of this. While on the surface this might seem to be ofconcern, in fact it is not conceptually different from allowing students access to sheets of notes,table books containing mathematical formulas and even open-book exams. At Murdoch University,we have routinely allowed students to take a page or two of notes into examinations with them forsome time now, to reinforce the emphasis that mathematical thinking is not mainly a question ofremembering things, but of choosing suitable mathematical formulations of problems, interpretingsolutions sensibly, expressing mathematical arguments, and so on. It may be, however, that thecontinued use of graphics calculators may be a vehicle to encourage mathematics educators toconsider more carefully what are the really important features of mathematical work.
As well as minimum capabilities, graphics calculators have already progressed to the pointwhere it is necessary to acknowledge that some capabilities are so powerful that no amount ofskilful use or programming of much less sophisticated machines will overcome the equityproblems. The most obvious example of this is the extraordinary Texas Instruments TI-92, somescreens from which were shown previously. At present, although local inequity may be reduced inthe obvious way (by ensuring that all students have similar access to the same calculator), thereseems no alternative in wider assessment contexts to restricting access to such calculators,especially those capable of extensive symbolic manipulation. An essential problem is that it is toohard to tell the difference between the responses in an examination of someone who knows a lotabout mathematics from someone who knows only how to use their calculator. This is even aproblem when all students have access to the same calculator, incidentally. Of course, the ‘solution’of banning the use of the technology in assessment is not an appropriate long-term solution, and wehave much to think about in adjusting our curricula and their assessment to the next generation ofgraphics calculators. This issue is discussed in more depth by Bradley (1995).
Some problems of inequity can be reduced or even eliminated by careful design of assessmenttasks, as a later section of this paper shows. For example, if students are asked to find roots of afunction accurate to only one decimal place, rather than to several decimal places, the advantagenormally afforded by automatic root finders over a process of tracing and zooming disappears. Infact, in many practical situations, neither exact answers nor approximate answers to many decimalplaces are important; what matters are the number and nature of solutions and their approximatesize. In any event, even if more accuracy is warranted in practice, it doesn’t mean that we need toask for it in a formal assessment situation.

ICME-8 Topic Group 18 8
LEVELS OF CALCULATOR USE IN ASSESSMENT
There are essentially three options for dealing with graphics calculators in assessmentsituations. Calculators may be used without any restriction except for limitations on which modelsand capabilities will be permitted. They may be completely barred from assessment, which isalready the case in many mathematics education settings around the world, or there may be somecombination of these two (such as when a section of an examination is required to be done withoutaccess to calculators).
Unrestricted calculator access
The most persuasive argument for allowing unrestricted graphics calculator access is that thisis most like the normal classroom teaching and learning situations. If we are to integrate technologyinto our curricula, it is prudent to reduce the differences between assessment conditions and typicalclassroom conditions. Hence, we have a strong preference for this strategy of calculator use. Withunrestricted access to a graphics calculator, students are generally expected to choose forthemselves when and how to use a calculator, although some advice may be offered for particularquestions. It is also possible to devise questions that allow us to find out directly how well studentshave learned to use their graphics calculator capabilities in the service of dealing with mathematicalsituations.
Calculator-neutral assessment
When graphics calculators are permitted in assessment, it has been suggested by some thatemphasis should be placed on ‘calculator-neutral’ questions, for which there is no advantage tostudents with a graphics calculator over those who do not have access to one. This seems to us be amost unwise strategy, and not a sensible approach to the equity issues it is attempting to resolve. Inthe first place, questions that are regarded as calculator-neutral very often are not, particularly forskilled users of graphics calculators. Such students can often check their answers using the graphicscalculator and actually obtain some comparative advantage over those without a graphics calculator.As another example, students using a calculator that can graph integral functions would beadvantaged over others without access to such help, when trying to determine an indefinite integral.
One way of rendering assessment tasks calculator-neutral, perhaps the main way in fact, is touse symbolic expressions rather than numbers. Although this probably is effective in neutralisingthe influence of the graphics calculator (in many, but certainly not all, situations at least, asindicated by the integration example), it can easily have the quite undesirable consequence ofmaking the test questions a good deal harder than intended, or really necessary. (See Bradley(1995)for a discussion of this).
However, of even more significance is the fact that this kind of assessment practice runsperilously close to sending the wrong message that calculators and their intelligent use are not reallyuseful. Graphics calculators have the potential to prove a powerful ally to students learningmathematics, to teachers teaching mathematics and to curriculum developers trying to bring aboutcurriculum change that acknowledges, and makes mathematical advantage of, the invention of themicroprocessor. It would be a tragedy if we sent the community the message that graphicscalculators are not really useful devices after all.
Calculator-free assessment
The final way to address the issues of calculator use is to refuse to allow students to use themat all. This certainly solves one problem, but at the expense of other problems. When graphicscalculators are removed from use in even one part of assessment, we lose our capacity to determinewhether or not students have learned to make intelligent use of the technology. When teachers,
9 Kissane, Kemp & Bradley
textbook authors and test constructors control when and how students will make use of theirgraphics calculators, any opportunity or incentive for students to learn to make such decisions bythemselves disappear. Calculator-free assessment prevents students from developing suchdiscrimination skills, a crucial aspect of intelligent use of any kinds of machine. Rather thanencouraging students to use graphics calculators to help them think about mathematics, this kind ofpractice encourages them to only do so when they are told to.
An additional problem comes with tests that permit graphics calculators to be used for part ofthe time, but not used for other parts of the time, since this may inadvertently make a course hardertoo. It is possible that one consequence of this practice is that calculators add to the content of acourse, since students have to know both the old ways and the new ways of doing a particular pieceof mathematics. Thus, while inverting a 2 x 2 matrix is easy enough to be completed by hand,possibly using a scientific calculator, the same is not true for matrices with dimensions 3 x 3 orhigher. So, rather than regarding numerical algorithms for the inversion of a 3 x 3 matrix as acurious historical anachronism, if students are expected to do this by hand, as well as sometimes usetheir calculator to do such things (arguably a much more sensible use of their time), the nett effect isthat the calculator has actually created more work for the students, which would indeed be an ironicconsequence of making use of a labour-saving device. The argument that students will ‘understand’better what they do if they develop fluency with long-hand ways of doing things like this is verydifficult to defend, although sometimes attempts are made. To argue using an analogy, very fewstudents, if any, developed a better feel for the nature of a square root by finding them by using thetedious, complicated and ancient algorithm that was still taught in schools only 30 years ago, thanby using a table book or a scientific calculator.
Some important mathematical tasks are already calculator-free, of course. These includenotions of proof, translation from words into symbols, analysis of real situations, symbolicmanipulation, mathematical modelling, and most aspects of advanced mathematics; some examplesappear in the next section of this paper. Such tasks can be readily included on tests that permitgraphics calculators.
DESIGNING ASSESSMENT TASKS TOINTEGRATE GRAPHICS CALCULATORS
When students are permitted to use graphics calculators in assessment situations, it is essentialthat the assessment tasks are carefully designed with this in mind. This requires a clear view ofexactly what we intend to find out with a particular assessment task, and a good understanding ofwhat graphics calculators might have to do with what we are trying to find out. Integration ofgraphics calculators into assessment involves more attention to detail than merely sanctioning theiruse on existing assessment instruments, and in this section of the paper we propose and exemplifyan analysis of the relationships between assessment tasks and graphics calculators.
The first aspect of design occurs before any assessment tasks are planned. As the precedingsection of this paper indicates, different levels of calculator use can be adopted, and a decisionneeds to be made about this and communicated adequately to students. In practical terms, assumingthat assessment is not to be calculator-free, the essential choice to be made is between ‘allowing’and ‘requiring’ graphics calculators to be used. These two choices conjure up different images forthe task of the designer. In the case of ‘allowing’ graphics calculator use, there is an implicit tone ofreluctance and forbearance, rather than encouragement. There is also an implicit suggestion thatsome students might prefer to not take up the offer to use a graphics calculator, or might not be ableto take up the offer, because they do not have access to appropriate equipment. Consequently,attention may well focus on how to ensure that no disadvantage is associated with this.
The messages associated with ‘requiring’ calculator use are quite different from this. Thegraphics calculator is assumed to be part of the ‘tools of the trade’ for students, and they areexpected to demonstrate that they are capable of using it efficiently and autonomously in

ICME-8 Topic Group 18 10
appropriate circumstances, when dealing with mathematical tasks. They are also expected to realisethat sometimes it is not appropriate to use a graphics calculator, or that the use must be supportedand augmented in various ways by careful mathematical analysis. In short, when graphicscalculators are integrated into the fabric of a course, they will be required for use in assessment,rather than merely tolerated.
As a result of our experience with integrating graphics calculators into courses, we havedeveloped a typology, shown in Table 2, of the possible relationships between the tasks given tostudents in examinations and our intentions regarding graphics calculator use.
Graphics calculators are expected to be used1 Students are explicitly advised or even told to use graphics calculators2 Alternatives to graphics calculator use are very inefficient3 Graphics calculators are used as scientific calculators only
Graphics calculators are expected to be usedby some students but not by others
4 Use and non-use of graphics calculators are both suitable
Graphics calculators are not expected to be used5 Exact answers are required6 Symbolic answers are required7 Written explanations of reasoning are required8 Task involves extracting the mathemat ics f rom a s i tua t ion or represen t ing asituation mathematically9 Graphics calculator use is inefficient10 Task requires that a representation of a graphics calculator screen will be interpreted
Table 2: Expected usage of graphics calculators and examinations(From Kemp, Kissane & Bradley 1996)
This typology is described at some length in Kemp, Kissane & Bradley (1996). There is spacehere only to describe and illustrate briefly the various types of intended relationships. The nextsection of this paper also provides a number of examples.
Graphics calculator use is expected
There are a number of reasons why we might design assessment task for which we expectgraphics calculators to be used. The most compelling of these is that sometimes there is noalternative for the student to using a graphics calculator to solve a problem. At other times, theremay be alternatives, but they are inefficient because they take too long, or are too complicated. Inour typology, we have identified separately the situation in which students are explicitly advised touse a graphics calculator for a particular task, rather than being expected to decide this forthemselves. For example, consider the following examination questions:
(a) Sketch a graph of the functionf(x) = 2x sin x + cos x for -π ≤ x ≤ π,showing any critical features.
(b) Use the graph to solve 2x sin x + cos x ≥ 2 on this interval.

11 Kissane, Kemp & Bradley
There are time-honoured procedures, using the calculus, to identify the important features of afunction and hence to sketch a graph of the function on an interval. However, students who have notyet studied the calculus (or even those who have studied calculus, but want only an approximatesolution rather than an exact one) will find a graphics calculator a useful aid in situations like this.But it is often not a trivial matter to make intelligent use of graphics calculators for sketchingcurves. The calculator screens shown in Figure 6 give examples of some of the ways in whichstudents might use the calculator to aid their thinking.
Figure 6: Using a Casio fx-9700 to graph a function
The first screen shows what will happen if a student uses the default axis settings, even if thecalculator is set to radians (which, of course is not always the case). Producing a graph like thatshown in the second screen requires the students to undertake some mathematical analysis,including thinking about what features of a graph are ‘critical’.

ICME-8 Topic Group 18 12
Figure 7: Using a Casio fx-9700 to examine an inequality
As suggested by Figure 7, the solution of the inequality in part (b) might involve students inshading (in fact, or in their mind) above y = 2, and it may involve tracing or use of automaticprocedures for finding points of intersection. In each case, substantial mathematical thinking isinvolved. For less experienced or sophisticated students, we may prefer to advise them explicitly touse their graphics calculator (a Type 1 question, in terms of our typology) and we may even suggesthow they should do so. However, addressing this question without the use of a graphics calculatorwould not be appropriate for most students, so that we can expect that it will allow us to asses wellsome important aspects of mathematics achievement.
As noted earlier, the case for graphics calculator use in mathematics is not restricted todrawing and analysing graphs of functions. The example below illustrates another context in whicha graphics calculator would be expected to be used
A study into adult health compared the average number of hours aweek spent exercising (x) with a measure of how fit people were (y)for a small sample. The data are shown below.
x 5.3 19.2 9.1 11.3 2.1 8.1 4.5 9.0 6.2 5.8 19.2 14.0 15.5 16.2 10.9 14.1y 2.6 12.9 6.1 5.9 2.4 5.8 5.3 8.0 3.7 14.8 12.9 9.8 10.3 13.1 8.0 12.3
(To check that you have entered the data correctly, note that the meansof x and y are 10.65625 and 8.36875 respectively.)
(a) Find the line of best fit for these data. In a sentence or two, describe how well the data can be modelled with a line.
(b) One of these observations appears to be an outlier. Which one?Explain how you can use the scatterplot to detect outliers.(c) Remove the most obvious outlier, identified in part (b), and
find the line of best fit for the reduced data set.(d) Describe two ways, one graphical and one numerical, in whichyou can tell that the line in (c) is a better fit to the data than that in(a).(e) Use the line in (c) to predict the fitness level of someone who
exercises for 12 hours per week on average.
A significant advantage of graphics calculators over scientific calculators is that they providean opportunity for data analysis of the kind suggested here. Once data are stored in a calculator,they can be analysed in different ways, outliers can be removed to determine their effects directly,and students expected to use some initiative in deciding how to address important questions.Assessment of these kinds of activities is more likely to be congruent with the objectives of the

13 Kissane, Kemp & Bradley
course concerned, with the classroom teaching used and with good statistical practice than is moreconventional assessment without graphics calculator use.
Graphics calculator use is expected by some students only
Whether or not a particular student chooses to make use of a graphics calculator for aparticular task will often depend on both the student and the task. We think that it is appropriate forsome variation to occur, and expect that students will need some help in learning to make gooddecisions about whether, and how, to use their graphics calculator. As an illustration, consider theexample below.
A microbiologist is studying the growth of a virus, which grows veryrapidly. She estimates that a specimen contains 14 thousand virus cellswith the number of cells increasing by 6% every hour.
(a) How many cells will the virus have after 15 hours?(b) How long will it take before the specimen has 20 thousand
cells?
There are many ways in which students might respond to part (a). For example, asophisticated student may simply calculate 14(1.06)15 on a scientific calculator. A less sophisticatedstudent may construct a recursive sequence like that shown in Figure 8, where a new term isgenerated each time the command Ans*1.06 is entered by pressing the ‘Enter’ key.
Figure 8: Using a Texas Instruments TI-81 to generate a recursively-defined sequence
Other students may use recursive function capabilities of their graphics calculator andconstruct a table of values, or a graph of discrete values which can be traced. Similarly, whenresponding to part (b) of the question, some students will make use of various graphics calculatorcapabilities (such as finding points of intersection of y = 14(1.06)x and y = 20, using a ‘solve’command, scrolling a table of values, etc.). Some students who know about logarithms may preferto solve the equation 14(1.06)x = 20 by first taking the logarithm of each side. Regardless of themethod chosen, students will need to deal with issues of accuracy and interpretation of their answer.
Graphics calculator use is not expected
There are a number of assessment situations for which graphics calculator use would not beappropriate, and the typology outlines what these are. The following question provides an examplefrom an elementary calculus course:

ICME-8 Topic Group 18 14
Find the exact value of
sin x1+ cos x0
p3Ú dx .
Asking for the exact value requires that the answer be expressed as ln (4/3) after the integralhas been performed symbolically. If a graphics calculator (without considerable symbolicmanipulation capabilities) were used by students, a numerical integral could be obtained, whichmay be a useful check on the symbolic manipulation involved. However, this would not be regardedas an appropriate response to a question in its present form.
DESIGNED USE OF GRAPHICS CALCULATORS
In this section, we use the typology to illustrate how assessment tasks might be designed andadapted for presentation to students to reflect various appropriate uses of graphics calculators. Wehave chosen to take a particular context, concerned with understanding the relationships betweenfunctions and their graphs, in order to show how the typology might help to consider the design ofsuitable assessment tasks. Other contexts can be considered in a similar way. For the context wehave chosen, each of the various types is relevant, while this might not always be the case for allcontexts.
Each of the illustrative questions is related to a particular cubic function f(x) = x3 – x + 4. Forthe convenience of the reader, a graph of this function is shown in Figure 9, drawn on a TexasInstruments TI-92 screen with -5 ≤ x ≤ 5 and -4 ≤ y ≤ 6. The graph is the same shape as a graph ofg(x) = x3 – x = x(x – 1)(x + 1) moved up 4 units.
Figure 9: Graph of f(x) = x3 – x + 4 on a Texas Instruments TI-92
The ten assessment tasks given here have been chosen to show how different aspects ofstudent thinking and mathematical behaviour can be addressed by asking questions in differentways. For convenience, we refer below to the typology by number. The questions should not all beregarded as mere alternatives to each other; they deal with a number of different aspects of thisfunction and its graph. Similarly, it is unlikely that students would be asked to respond to several ofthese questions in the same test or assignment. The purpose of providing these examples is toillustrate the kinds of thinking needed when designing assessment tasks with the possible use ofgraphics calculators in mind.
Type 1Use your graphics calculator to find solutions to x3 – x + 4 = 0, correctto two decimal places.
Inexperienced students may need advice about when and even how to use their graphicscalculator. A task like this can be used to determine whether or not students can use a process of

15 Kissane, Kemp & Bradley
numerical refinement and understand the concept of a solution to an equation. Figure 10 showssome possible successive iterations on a Texas Instruments TI-82. The first screen may helpstudents realise that there is likely to be only one solution, located somewhere between x = -2 and x= -1; the second screen verifies that there is in fact only one solution on this interval; the thirdscreen allows an approximation to the solution to the specified accuracy to be obtained.
Figure 10: Using tables on a Texas Instruments TI-82 to solve an equation
This task also assesses whether or not students understand the meaning of ‘correct to threedecimal places’. More sophisticated or experienced students who have found out how to use theautomatic solve features of their calculator (if they have them) may prefer to use those instead ofthe tabular iteration.
Type 2Solve correct to two decimal places x3 – x + 4 = 0.
With no direction at all, students must here decide for themselves what procedure isappropriate. On many graphics calculators, there may be several choices. For example, Figure 11and Figure 12 show a graphical method on a Texas Instruments TI-82 and the use of an automaticsolver on a HP-38G.
Figure 11: Using an automatic root finder on a Texas Instruments TI-82
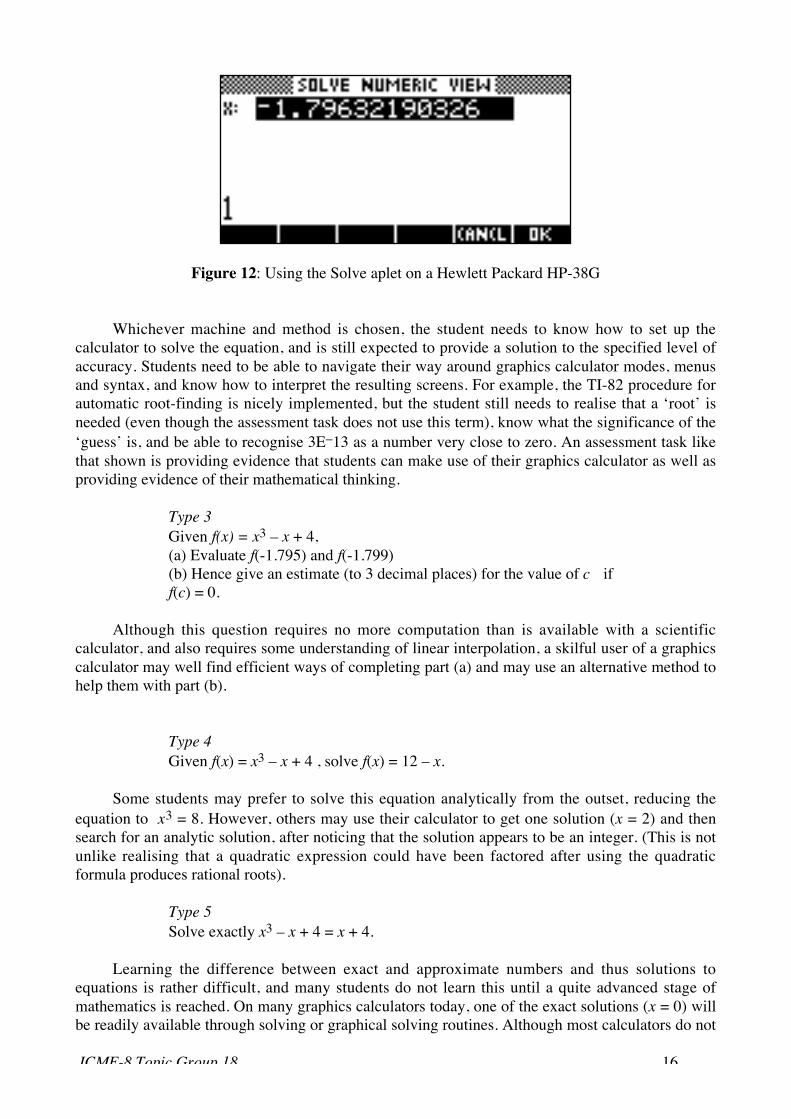
ICME-8 Topic Group 18 16
Figure 12: Using the Solve aplet on a Hewlett Packard HP-38G
Whichever machine and method is chosen, the student needs to know how to set up thecalculator to solve the equation, and is still expected to provide a solution to the specified level ofaccuracy. Students need to be able to navigate their way around graphics calculator modes, menusand syntax, and know how to interpret the resulting screens. For example, the TI-82 procedure forautomatic root-finding is nicely implemented, but the student still needs to realise that a ‘root’ isneeded (even though the assessment task does not use this term), know what the significance of the‘guess’ is, and be able to recognise 3E–13 as a number very close to zero. An assessment task likethat shown is providing evidence that students can make use of their graphics calculator as well asproviding evidence of their mathematical thinking.
Type 3Given f(x) = x3 – x + 4,(a) Evaluate f(-1.795) and f(-1.799)(b) Hence give an estimate (to 3 decimal places) for the value of c iff(c) = 0.
Although this question requires no more computation than is available with a scientificcalculator, and also requires some understanding of linear interpolation, a skilful user of a graphicscalculator may well find efficient ways of completing part (a) and may use an alternative method tohelp them with part (b).
Type 4Given f(x) = x3 – x + 4 , solve f(x) = 12 – x.
Some students may prefer to solve this equation analytically from the outset, reducing theequation to x3 = 8. However, others may use their calculator to get one solution (x = 2) and thensearch for an analytic solution, after noticing that the solution appears to be an integer. (This is notunlike realising that a quadratic expression could have been factored after using the quadraticformula produces rational roots).
Type 5Solve exactly x3 – x + 4 = x + 4.
Learning the difference between exact and approximate numbers and thus solutions toequations is rather difficult, and many students do not learn this until a quite advanced stage ofmathematics is reached. On many graphics calculators today, one of the exact solutions (x = 0) willbe readily available through solving or graphical solving routines. Although most calculators do not

17 Kissane, Kemp & Bradley
in fact give an integer for the result, they appear to do so, since there is no decimal point after thezero, which has been rounded to the accuracy of the calculator. Thus, a student using a Casio fx-9700 may produce the screens shown in Figure 13 after rearranging the equation into the form x3 –2x = 0:
Figure 13: Approximate solutions to a cubic equation on a Casio fx-9700
However, the other solutions are given as decimals (e.g., 1.41421356237). Although somestudents would recognise the solutions as ±\r(2), many would not; in addition, many students usinga calculator here that required initial guesses to be made for solutions may miss the third solution(or even the second). Only an analytical solution will be a mathematically adequate response to aquestion of this kind, and it is expected that the student should realise that the command ‘solveexactly’ has this meaning. Although the solution presented by a student in response to this questionmay not refer to the calculator at all, the students thinking may be aided by the calculator, or thenumerical solutions provided by the calculator may be used to reassure them that their analyticalsolution is correct.
Type 6Solve for x: x3 – x + 4 = (a – 1)x + 4.
Unlike the illustration of Type 5, only an analytic solution is feasible here; students who enterthe equation directly into an automatic solve area of the calculator may find that the calculatorappears to offer an incorrect solution. In fact, the calculator will regard the variable a as a constant,use its present numeric value (entered previously) and then proceed to ‘solve’ the equation.
Type 7Use the fact that the solutions to x3 – x = 0 are x = -1, 0 and 1 toexplain why h(x) = x2(x2 – 2) has turning points at (-1,-1), (0,0) and(1,-1).
ICME-8 Topic Group 18 18
This question demands that students write an explanation, based on their understanding of thelinks between the two graphs. Although it may be helpful to graph the two functions to fullyunderstand the question, the response to this question should rely on observing that one function isthe derivative of the other.
Type 8A container for liquid is shaped like a rectangular box with a smallcylindrical neck in the centre and on top of the box. The neck can hold4 cc of liquid. The dimensions of the box are such that the length ofone of the sides of the base is 1 cm less than its height and the lengthof the other side is 1 cm more. Express the volume of the container asa function of its height.
Clearly, questions like the Type 8 example are unaffected by the availability of graphicscalculators.
Type 9The solution to x3 – x + 4 = 0 is -1.796 (to 3 decimal places).Find the solution(s) to (x – 1)3 – (x – 1) + 4 = 0.
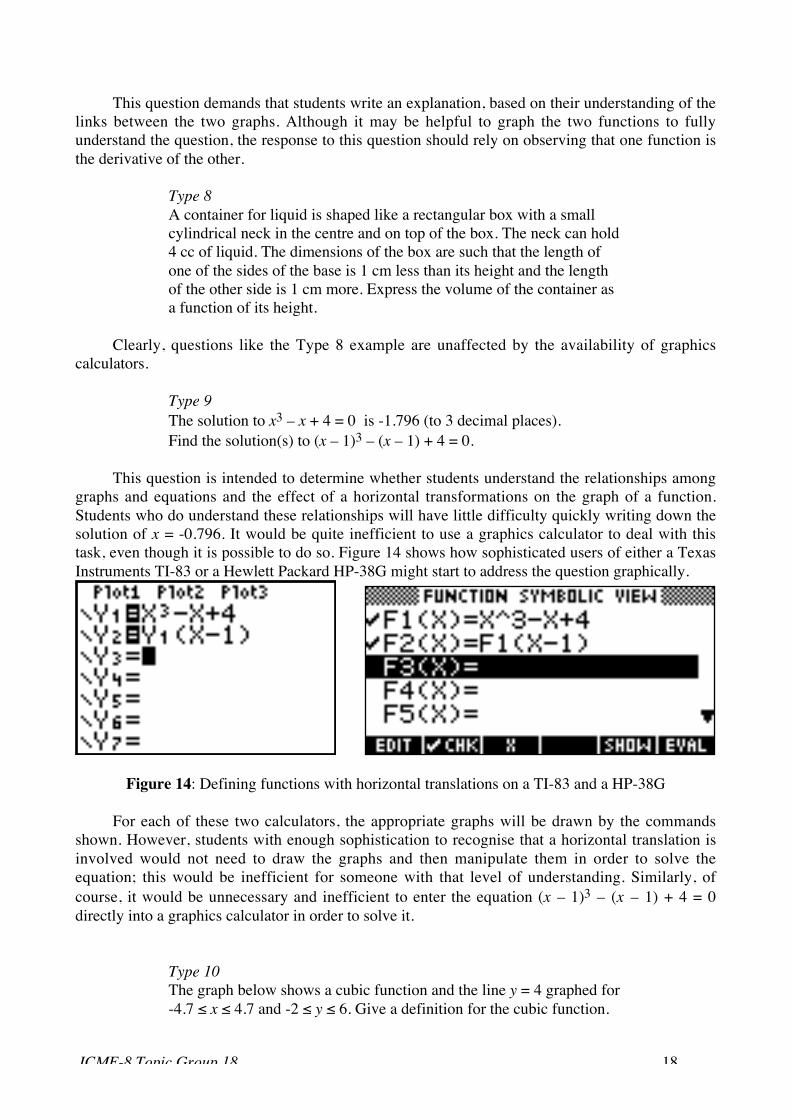
This question is intended to determine whether students understand the relationships amonggraphs and equations and the effect of a horizontal transformations on the graph of a function.Students who do understand these relationships will have little difficulty quickly writing down thesolution of x = -0.796. It would be quite inefficient to use a graphics calculator to deal with thistask, even though it is possible to do so. Figure 14 shows how sophisticated users of either a TexasInstruments TI-83 or a Hewlett Packard HP-38G might start to address the question graphically.
Figure 14: Defining functions with horizontal translations on a TI-83 and a HP-38G
For each of these two calculators, the appropriate graphs will be drawn by the commandsshown. However, students with enough sophistication to recognise that a horizontal translation isinvolved would not need to draw the graphs and then manipulate them in order to solve theequation; this would be inefficient for someone with that level of understanding. Similarly, ofcourse, it would be unnecessary and inefficient to enter the equation (x – 1)3 – (x – 1) + 4 = 0directly into a graphics calculator in order to solve it.
Type 10The graph below shows a cubic function and the line y = 4 graphed for-4.7 ≤ x ≤ 4.7 and -2 ≤ y ≤ 6. Give a definition for the cubic function.

19 Kissane, Kemp & Bradley
Figure 15: Texas Instruments TI-82 screen to be interpreted
Questions of Type 10 serve a very useful purpose, and can be quite revealing about studentmisconceptions, although care must be exercised that the answer is unambiguous (or the scoringmethod is tolerant of a range of correct responses). The traced point (1,4) in Figure 15 is included toallow students to check their answers efficiently. The intention of this question is that students willreason from their knowledge of the shape of the graph, roots and vertical transformations that thefunction graphed is a vertical translation of 4 units of a function with roots at -1, 0 and 1(apparently so, at least, from the graph). So a likely choice for the function is y = x(x – 1)(x + 1) +4. Many students would like to reassure themselves that their reasoning was correct by graphing thefunction on their graphics calculator.
The above ten illustrations of designing assessment tasks suggest that there is no easyalternative to careful consideration of likely student thinking and response to assessment tasks at thedesign stage, which of course is also the case for more familiar kinds of assessment than thoseinvolving graphics calculators. The likely responses of students to tasks depends on the levels ofsophistication of the students, both in terms of mathematical thinking and also in terms of calculatorfluency.
Several of the illustrated questions above for which it is expected that a graphics calculator isnot expected to be used may well be attempted by students with the aid of their calculators, if theyhave ready access to them. When assessing student responses to tasks, the only evidence usuallyavailable to us is what they write down; as shown above, there are many opportunities for astudent’s mathematical thinking to be supported, challenged and influenced by disciplined use of agraphics calculator. It is precisely for this reason that graphics calculators are potentially so usefulto both teachers and learners of mathematics, in fact. Even though student responses to a questiondo not necessarily show these effects explicitly, it is necessary to contemplate them at the designstage.
IMPLICATIONS OF THE USE OF GRAPHICS CALCULATORSIN ASSESSMENT
As suggested earlier, the use of graphics calculators in assessment is an important steptowards integrating the technology into the curriculum. Before this step is taken, there are not likelyto be substantial effects on the curriculum, since the graphics calculator is likely to be regardedmerely as an optional extra, albeit a desirable one. After the step is taken, however, curriculumdevelopers, teachers and their students are likely to see the mathematics curriculum through freshlenses. Especially for high stakes assessment, the use of graphics calculators for assessment is likelyto have the flow-on effect of sanctioning and encouraging calculator ownership and use.
One likely effect is that the availability of graphics calculators may seem to trivialise somemathematical procedures that presently take a long time. A good example is the solution of systemsof linear equations. Many students (probably too many, in fact) learn this as a rather complicated

ICME-8 Topic Group 18 20
procedure, especially for systems with more than two equations. It takes students a good deal oftime to learn such procedures, and a good deal of extra time is spent developing fluency, andmaintaining it. Yet few would argue that this time is well spent, in terms of students developing anunderstanding of the nature of systems of linear equations. Little insight for anything is added bylearning how and when to use Gauss-Jordan elimination or Cramer’s Rule, and many teachersregard the time spent as a necessary evil, rather than intellectually productive. In fact, it takes solong to develop expertise with solving the systems that many of us have had too little time left todevote attention to the more important task of constructing such systems; consequently, we haveoften taught students well how to solve a system that someone else has constructed, but been verymuch less successful at teaching them how to construct such systems for themselves. Perhaps wewill be able to redress the balance a little if students can use a graphics calculator to handle theroutine procedures. The use of the graphics calculator will possibly allow us to recognise betterwhich aspects of mathematics are worth the most attention and which are less worthy of the all tooscarce time available for teaching and learning.
A second kind of effect of using graphics calculators in assessment relates to the potential forstudents to develop mathematical insight. An example concerns drawing graphs of elementaryfunctions. Prior to the use of graphics calculators, students were expected to learn to draw graphs offunctions, and often spent a fair deal of time doing so. However, the actual experience of thestudents was often concerned with the mechanics of drawing the graph, and much more rarelyconcerned with what a graph actually was, what it was for, and why anyone would want to drawone, except for the obvious reason that the textbook, teacher or examiner had directed that it bedone. When drawing graphs by hand, students frequently plot many more points than they need, ormany less than they need, because they have developed too little intuition for what a graph shouldlook like. Neither of these is efficient. It is indeed ironic that, before the availability of graphicscalculators, so few students seemed to draw a graph of their own volition, as if they did not reallybelieve that they are useful for anything. If many of the mechanical details can be left to a machine,however, students can focus attention more carefully on using a graph for some purpose. and thereis some prospect that they will come to see that some kinds of questions lend themselves well tographical support. If time is freed up to work with graphs rather than work at producing them, wecan be more optimistic that our students will see the connections between graphs and equations, orwill see that the graphs of continuous functions look like straight lines if you look at them closelyenough, or that the gradient of a curve changes from negative to positive at a local minimum point,and so on. Graphs have much to tell us, but it seems that students have been too busy drawing themto listen. Using graphics calculators in assessment, and thus integrating them into a course, mayraise levels of mathematical insight significantly.
A third kind of implication is that we may take the opportunity provided by the graphicscalculator to augment the curriculum. A good example of this occurs with data analysis. Prior to theuse of graphics calculators in assessment, it was unreasonable to expect students to engage in dataanalysis and when it was included in assessment, data sets were always very small (or given insummary form). Frequently, the emphasis was on computation of numerical statistics, with littleattention given to relationships among variables and with appropriate inferences from data. Onlyleast squares linear regression was involved, since all else was too complicated. However, ifstudents have a graphics calculator with a number of regression models, as all graphics calculatorsdo at present, it makes sense for the curriculum to be changed slightly to examine data with a viewto finding, understanding and using relationships, even though they might not be linear in form.Although the relevant mathematical statistics is too sophisticated for a high school audience, theidea that data may be modelled with various kinds of functions, of which linear is only one, is quiteaccessible to the great majority.
From the perspective of curriculum development, an implication of the use of graphicscalculators in assessment is that learning to choose and use technology might be contemplated as anexplicit goal. For example, in recent revisions to senior high school courses in Western Australia totake advantage of the graphics calculator, a new general objective was added: “Students will select

21 Kissane, Kemp & Bradley
and make use of appropriate technology”. With such an objective made explicit, we might expectthat classroom time and energy will be spent trying to help students attain the objective, and thatsome assessment of the extent to which students are inclined and able to use the graphics calculatorsensibly will become normal.
A concern for equity has often been voiced in Australia, regarding the availability of graphicscalculators to be used for assessment tasks. Some people have been quite concerned aboutimplications for less affluent communities, less able to afford sophisticated technology. In fact,however, the inclusion of graphics calculators into assessment structures, especially high-stakesassessment structures, provides a powerful argument that the technology is not a frill, but anecessary part of the curriculum. This in turn may make it easier than would otherwise have beenthe case for school boards to provide funds to reduce the inequities.
A final implication was illustrated in some of the examples in the preceding section. Whengraphics calculators are available to students for assessment, a multiplicity of methods may beencouraged, rather than the traditional focus on doing mathematics the ‘right’ way. An extensiveexample of this, in the context of equations, is provided by Kissane (1995). While it could beargued that it is intrinsically better for students to learn several ways of dealing with mathematicalproblems rather than just one, the main argument for this multiplicity of approaches is that seemslikely to strengthen conceptual development to have multiple perspectives accessible to students.
CONCLUSION
All assessment requires careful thought, if we are to ensure that we are getting useful, reliableinformation about student achievements and difficulties. The use of graphics calculators inassessment presents some new challenges, which require a good knowledge of the capabilities ofthe technology and the educational outcomes we seek. Although there are many issues related to theuse of graphics calculators in assessment, none of them presents insurmountable obstacles tointelligent calculator use in assessment at all levels. Although some of the issues are related tounfamiliarity with the technology, and the fact that it is not yet universally accessible to students,other issues are more fundamental and less transient. But much is to be gained by integratinggraphics calculators into assessment structures. In particular, mathematics education might finallybe able to take advantage of the many new opportunities offered by personal technology. The effortto come to terms with the problems can reasonably be expected to reap substantial benefits.
REFERENCES
Andrews, T. & Kissane, B. (Eds.) (1994). Graphics calculators in the classroom. Adelaide: TheAustralian Association of Mathematics Teachers.
Bradley, J., Kissane, B. & Kemp, M. (1996). Graphics calculators in the mathematics curriculum:Integration or differentiation? In J. Abbott & L. Wilcoxson (Eds.). Teaching and learning withinand across disciplines: Teaching and Learning Forum, (pp 21-26). Academic Services Unit,Murdoch University.
Bradley, J., Kemp, M. & Kissane, B. (1994). Graphics calculators: A (brief) case of technology.Australian Senior Mathematics Journal, 8(2), 23-30.
Bradley, J. (1995). Technology and assessment – An international experience. Paper presented atthe 5th Annual Australian Bridging Mathematics Network Conference, Batchelor, NT.
Kemp, M., & Kissane, B. (1995). Integrating technology into undergraduate mathematics. In L.Summers (Ed.) A focus on learning: Teaching and Learning Forum, (pp 130-134), Joondalup.
Kemp, M., Kissane, B., & Bradley, J. (1996). Graphics calculator use in examinations: accident ordesign? Australian Senior Mathematics Journal, 10(1), 33-50.

ICME-8 Topic Group 18 22
Kemp, M., Kissane, B., & Bradley, J. (1995). Graphics calculators and assessment. In A. Richards(Ed.), FLAIR: Forging links and integrating resources (pp 235-241). Darwin: AustralianAssociation of Mathematics Teachers.
Kissane, B. (1995) How to solve an equation. Australian Mathematics Teacher. 51(3), 38-41.Kissane, B., Bradley, J., & Kemp, M. (1994). Graphics calculators, equity and assessment.
Australian Senior Mathematics Journal, 8(2), 31-43.Kissane, B., Kemp, M., & Bradley, J. (1995). Student reactions to the use of graphics calculators. In
S. Flavel & I. Isaacs (Eds.). Proceedings of the Mathematics Education Research Group ofAustralasia 18th Annual Conference (pp 235-241). Darwin, NT.
[email protected]@[email protected]
Murdoch UniversityMurdochWestern AustraliaAustralia 6150
July 1996
*This paper was presented to Topic Group 18: Calculators in Mathematics Education at the EighthICME, Sevilla, Spain, July 1996.
A copy is available at http://wwwstaff.murdoch.edu.au/~kissane/papers/1cme8.pdf