Adaptability and stability analysis of the juice yield of ... · Adaptability and stability...
16
©FUNPEC-RP www.funpecrp.com.br Genetics and Molecular Research 13 (3): 6512-6527 (2014) Adaptability and stability analysis of the juice yield of yellow passion fruit varieties E.J. Oliveira 1 , J.P.X. Freitas 2 and O.N. Jesus 1 1 Embrapa Mandioca e Fruticultura, Cruz das Almas, BA, Brasil 2 Universidade Federal do Recôncavo da Bahia, Cruz das Almas, BA, Brasil Corresponding author: E.J. Oliveira E-mail: [email protected] Genet. Mol. Res. 13 (3): 6512-6527 (2014) Received September 11, 2013 Accepted February 7, 2014 Published August 26, 2014 DOI http://dx.doi.org/10.4238/2014.August.26.2 ABSTRACT. This study analyzed the genotype x environment interaction (GE) for the juice productivity (JuProd) of 12 yellow passion fruit varieties (Passiflora edulis Sims. f. flavicarpa Deg.) using additive main effects and multiplicative interaction (AMMI) model and auxiliary parameters. The experiments were conducted in eight environments of Bahia State, Brazil, using a randomized block design with three replications. Analysis of variance showed significant effects (P ≤ 0.01) for environments, genotypes, and GE interaction. The first two interaction principal component axes (IPCAs) explained 81.00% of the sum of squares of the GE interaction. The AMMI1 and AMMI2 models showed that varieties 09 and 11 were the most stable. Other parameters, namely, the AMMI stability value (ASV), yield stability (YSI), sustainability, and stability index (StI), indicated that other varieties were more stable. These varying results were certainly a consequence of methodological differences. In contrast, the ranking of varieties for each of the stability parameters showed significant positive correlations (P ≤ 0.05) between IPCA1 x (ASV, YSI), JuProd x (StI, YSI), YSI x ASV, and StI x YSI. Cluster analysis based on the genotypic profile of the effects of the GE interaction identified three
Transcript of Adaptability and stability analysis of the juice yield of ... · Adaptability and stability...

©FUNPEC-RP www.funpecrp.com.brGenetics and Molecular Research 13 (3): 6512-6527 (2014)
Adaptability and stability analysis of the juice yield of yellow passion fruit varieties
E.J. Oliveira1, J.P.X. Freitas2 and O.N. Jesus1
1Embrapa Mandioca e Fruticultura, Cruz das Almas, BA, Brasil2Universidade Federal do Recôncavo da Bahia, Cruz das Almas, BA, Brasil
Corresponding author: E.J. OliveiraE-mail: [email protected]
Genet. Mol. Res. 13 (3): 6512-6527 (2014)Received September 11, 2013Accepted February 7, 2014Published August 26, 2014DOI http://dx.doi.org/10.4238/2014.August.26.2
ABSTRACT. This study analyzed the genotype x environment interaction (GE) for the juice productivity (JuProd) of 12 yellow passion fruit varieties (Passiflora edulis Sims. f. flavicarpa Deg.) using additive main effects and multiplicative interaction (AMMI) model and auxiliary parameters. The experiments were conducted in eight environments of Bahia State, Brazil, using a randomized block design with three replications. Analysis of variance showed significant effects (P ≤ 0.01) for environments, genotypes, and GE interaction. The first two interaction principal component axes (IPCAs) explained 81.00% of the sum of squares of the GE interaction. The AMMI1 and AMMI2 models showed that varieties 09 and 11 were the most stable. Other parameters, namely, the AMMI stability value (ASV), yield stability (YSI), sustainability, and stability index (StI), indicated that other varieties were more stable. These varying results were certainly a consequence of methodological differences. In contrast, the ranking of varieties for each of the stability parameters showed significant positive correlations (P ≤ 0.05) between IPCA1 x (ASV, YSI), JuProd x (StI, YSI), YSI x ASV, and StI x YSI. Cluster analysis based on the genotypic profile of the effects of the GE interaction identified three
6513
©FUNPEC-RP www.funpecrp.com.brGenetics and Molecular Research 13 (3): 6512-6527 (2014)
AMMI analysis of passion fruit
groups that correlated with the distribution of varieties in the AMMI1 biplot. However, the classification of stable genotypes was limited because the association with the productivity was not included in the analysis. Variety 08 showed the most stable and productive behavior, ranking above average in half of the environments, and it should be recommended for use.
Key words: Passiflora; Breeding; Multivariate analysis;Genotype x environment interaction
INTRODUCTION
Several studies have shown that fruit production and processing are important eco-nomic activities because they yield a higher income per acre and create more jobs than other agricultural activities. On average, one hectare of fruits can generate two to six direct jobs, whereas the use of one hectare to grow grain can generate only 0.5 direct jobs. In Brazil, the cultivation of passion fruit is economically significant because the product is marketed as fresh fruit in wholesale and retail markets. Passion fruit is especially important for the juice process-ing and derivatives industry in almost the entire country (CPT, 2013).
The genus Passiflora is highly species-rich (Yockteng et al., 2011). In Latin America, P. edulis Sims f. flavicarpa Deg. (purple and yellow skin) and P. alata (sweet passion fruit) are important market fruits. However, the yellow passion fruit is the most widely cultivated member of the genus in Brazil, which is currently the largest producer and consumer of pas-sion fruit in the world. The prominent position of Brazil as the largest producer has resulted from the development of passion fruit cultivation in the past three decades (Gonçalves and Souza, 2006).
Despite the prominent position of Brazil as a producer of passion fruit, the average productivity (approximately 14 ton/ha) is very low relative to the potential productivity, which is more than 48 ton/ha (Freitas et al., 2011). An additional problem is that there are few variet-ies of passion fruit that have been developed and recommended for different soil and climatic conditions in the country and that offer high productivity, uniformity, fruit quality, and resis-tance to major pests. Another problem that contributes to the low productivity is the limited extent of adoption of production technologies, which is often due to a lack of knowledge and specific technical training.
Nevertheless, the expansion of the industry is evident in certain regions. In other re-gions, the crop has migrated to other areas not traditionally used for its cultivation to escape various diseases that cause crop damage, particularly viral diseases and soil fungi. However, the exploration of new areas has been conducted without adequate study of productive behav-ior and production stability. This lack of study can surely compromise crop yield and, there-fore, the profitability of the business. In addition, given the great importance of passion fruit juice in Brazil (in terms of production, passion fruit juice ranks third in the country’s fruit in-dustry, exceeded only by orange and cashew juice), little attention has been devoted to breed-ing programs to develop varieties that can maximize the production of passion fruit juice.
The trait of juice productivity is closely related to fruit and juice yield. However, it is common to observe genotypes with high fruit yield but low juice yield and vice versa.
6514
©FUNPEC-RP www.funpecrp.com.brGenetics and Molecular Research 13 (3): 6512-6527 (2014)
E.J. Oliveira et al.
Therefore, given that the principal focus of the industry is the amount of juice produced per unit area, juice productivity has gained importance in considerations of the development of new varieties for this market. In this context, new yellow passion fruit varieties have recently been developed by Embrapa Mandioca e Fruticultura, whose agronomic evaluations were conducted in several production regions in Bahia State.
Similar to any other quantitative trait, juice productivity has genetic and environ-mental contributions, in which the genotype-by-environment interaction (GE) reduces the as-sociation between the genotypic and phenotypic components. Therefore, the variation in the performance-of-varieties effect related to the GE interaction hinders the selection of geno-types that can maximize juice productivity and simultaneously withstand small variations due to a changing environment.
The GE interaction has long been one of the main themes of plant breeding because it helps plant breeders in one of the most critical steps in this process, namely, the definition of the varieties that should be recommended for cultivation. Several methods are available to analyze multisite trials in an attempt to interpret the GE interaction and thus predict the degree of phenotypic stability and explain the information contained in the GE interaction. In general, however, most stability indices exhibit a univariate response (Gauch, 1988; Crossa, 1990). Therefore, the principal problem is that these methods do not provide an accurate and complete response pattern of the varieties in terms of the interaction (Holhs, 1995), primarily because the response of a genotype to environmental variation is considered multivariate (Lin et al., 1986).
In contrast, the additive main effects and multiplicative interaction (AMMI) model includes an analysis of variance (ANOVA) and a principal component analysis (PCA) in a unified approach that can be used to analyze multiple trials (Zobel et al., 1988; Crossa et al., 1990; Gauch and Zobel, 1996). AMMI uses an ANOVA to study the main effects of genotypes and environments and a PCA for the residual multiplicative interaction between genotypes and environments. It determines the sum of squares of the GE interaction and ensures a minimum number of degrees of freedom. Because an ANOVA and a PCA are part of the AMMI model, this model is expected to be more appropriate than each individual model to understand the GE interaction (Zobel et al., 1988).
The objectives of this study were (i) to analyze the GE interactions for juice produc-tivity from 12 experimental varieties of yellow passion fruit using univariate and multivariate methods, (ii) to evaluate the stability and adaptability of the varieties in different environments of production, and (iii) to assess the interrelationships between the statistical parameters ana-lyzed.
MATERIAL AND METHODS
Yield trials
The experiments for this study were conducted in eight agronomic production areas of the State of Bahia (Table 1). Planting was completed in 2011/2012 during the rainy season for each region. The spacing was 2.6 m between rows and 3.7 m between plants. A vertical arrangement was used for the canopy, with a single strand of galvanized wire (14 gauge) 2 m above the ground. Twelve new varieties of yellow passion fruit from the breeding program at Embrapa Mandioca e Fruticultura were evaluated.
6515
©FUNPEC-RP www.funpecrp.com.brGenetics and Molecular Research 13 (3): 6512-6527 (2014)
AMMI analysis of passion fruit
Experimental design
Experiments were conducted in a randomized block design with three replicates and 10 plants per plot. All recommended cultivation practices for passion fruit were followed. The data on fruit yield per plot were acquired over the first year of production (between 7 and 20 months after planting) and reported in ton/ha. A sample of 30 fruits per plot was used to estimate the juice productivity. The juice productivity was obtained by multiplying fruit yield (converted to ton/ha) by juice yield.
AMMI analysis
An initial ANOVA was performed for each environment to verify the existence of differences between varieties. After these analyses, the homogeneity of the residual variances was determined, and a joint analysis of variance was used to test the genotype and environ-ment effects and the magnitude of the GE interaction. An AMMI analysis was used to adjust the main or additive genotype and environmental effects with an ANOVA and to adjust the multiplicative effects for the GE interaction with a PCA. The AMMI model was as follows:
Table 1. Classification of study environments for the agronomic evaluation of yellow passion fruit varieties in the State of Bahia.
Environment City Soil classification Climate conditions Altitude (m)
CPa Cabaçeiras do Paraguaçú Una latosol Semi-arid 210DBa Dom Basílio Red-yellow latosol Tropical climate with a dry season 462Ibi Ibicoara Dark-red latosol High-altitude tropical climate 1027LNS-RA Livramento de Nossa Senhora-Rio Acima Red-yellow latosol Semi-arid 500LNS-Mo Livramento de Nossa Senhora-Monte Oliveira Red-yellow podzolic Semi-arid 500MSo Marcionílio Souza Dystrophic latosol Tropical climate with a dry season 299Val Valença Red-yellow latosol Humid tropical climate 39WG Wenceslau Guimarães Vertisol Equatorial climate 146
(Equation 1)
where ijY is the fruit yield of the ith variety in the jth environment; μ is the overall mean; ig and je are the fixed varietal effects and environmental deviations, respectively; λk is a singular value of the K axis in the PCA; γik and δjk are genotype and environmental factors, respectively, of the singular vectors associated with λk from the interaction matrix; N is the number of prin-cipal components retained in the model; ρij is the residual GE interaction; and εij is the average error (with the assumption of independence), εij ~ Ν (0, σ2).
The GE interaction sum of squares was divided into a singular axis or interaction prin-cipal component axis (IPCA), which reflected the standard portion in which each axis corre-sponded to one AMMI model. The selection of a model that best describes the GE interaction was based on the FR test as proposed by Cornelius et al. (1992).
Once the AMMI model was selected, we investigated adaptability and phenotypic stability using biplot graphs. The interpretation of the biplot graph is based on the variation
6516
©FUNPEC-RP www.funpecrp.com.brGenetics and Molecular Research 13 (3): 6512-6527 (2014)
E.J. Oliveira et al.
of the additive main effects (genotype and environment) and the multiplier effect of the GE interaction. The abscissa represents the main effects (average of varieties evaluated), and the ordinate represents the interaction among the axes (IPCA). In this case, the lower the IPCA value (absolute value), the lower the contribution of the GE interaction and the greater the genotype stability. An ideal genotype is the one with a high yield and IPCA values close to zero. An undesirable genotype is one with low stability, which is associated with low yields. The average predictions were estimated according to the selected AMMI model. All statistical analyses were performed using the agricolae package (de Mendiburu, 2010) in R (R Develop-ment Core Team, 2011).
Grouping of genotypes
The genotypic profile of the estimates of the GE interaction was used to describe the behavior pattern of the yellow passion fruit varieties for juice productivity, grouping similar genotypes according to this pattern. Therefore, the estimates of the GE interaction from the AMMI model were used to classify the varieties using clustering models. The Bayesian infor-mation content (BIC) criterion, defined by:
(Equation 2)
where L is the log-likelihood function, θ* is the set of parameters that maximize the likeli-hood, and m is the number of observations or samples that was used to define the model to represent the similarity of the varieties for the pattern of the GE interaction. Hierarchical clustering was performed based on the Ward method. The definition of the number of clusters was based on the mclust package (Fraley and Raftery, 2007), and the cluster analysis was performed in the cluster package (Maechler et al., 2013), both in the R software (R Develop-ment Core Team, 2011).
AMMI stability value (ASV)
The ASV was calculated as previously described by Purchase et al. (2000):
(Equation 3)
where IPCA1SQ / IPCA2SQ is the weight resulting from dividing the sum of IPCA1 squares by the sum of IPCA2 squares. The larger the absolute value of IPCA, the greater the adaptability of a specific variety for a certain environment. Conversely, lower ASV values indicate greater stability in different environments.
Sustainability index (SuI)
The SuI was calculated as previously described by Babarmanzoor et al. (2009):
6517
©FUNPEC-RP www.funpecrp.com.brGenetics and Molecular Research 13 (3): 6512-6527 (2014)
AMMI analysis of passion fruit
where Y is the average performance of a specific variety, nσ is the standard deviation, and YM is the value of the best genotype in any environment. The SuI values were arbitrarily divided into three stability groups as follows: low (up to 35%), medium (36 to 70%), and high (71 to 100%).
Stability index (StI)
The StI was derived from the non-parametric stability analysis technique of Rao et al. (2004) and was calculated as follows:
(Equation 4
(Equation 5)
where .iy is the average yield of the ith variety, ..y is the overall mean, 2iσ is the variance in the
ith stable variety (Shukla, 1972), and n is the number of environments.
Yield stability index (YSI)
The YSI was calculated using the following formula:
(Equation 6)
where RASV is the ranking of the AMMI stability value and RP is the ranking of yellow pas-sion fruit yields in all environments. A Spearman correlation was used to assess the associa-tions between the rankings of genotypes based on different parameters of stability.
RESULTS AND DISCUSSION
Analysis of juice productivity in different environments
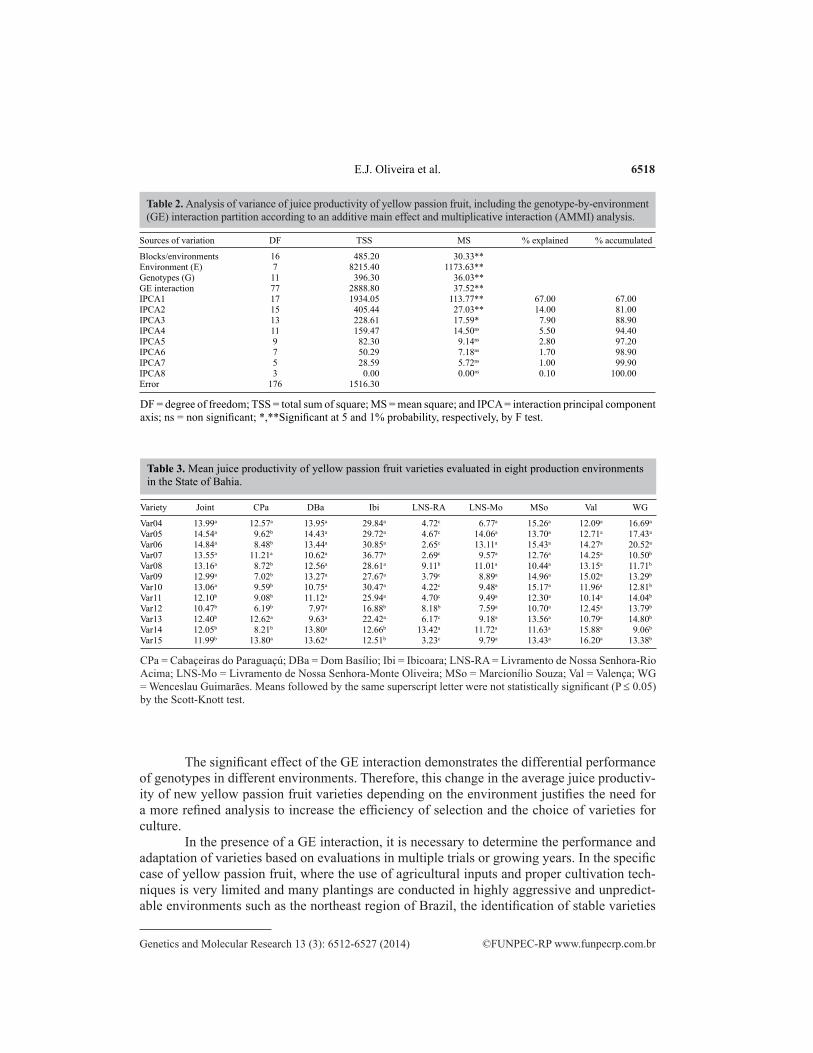
The joint ANOVA showed significant differences (P ≤ 0.01) for environments, geno-types, and the GE interaction (Table 2). The experimental coefficient of variation of the joint analysis was of medium magnitude (22.70%), indicating good experimental precision for a trait strongly influenced by the environment. The juice productivity in different environments ranged from 10.46 to 14.84 ton/ha, although this variation was much greater for the individual environments, with 5.63 ton/ha for the LNS-RA environment and 25.36 ton/ha for the Ibi environment (Table 3).
6518
©FUNPEC-RP www.funpecrp.com.brGenetics and Molecular Research 13 (3): 6512-6527 (2014)
E.J. Oliveira et al.
The significant effect of the GE interaction demonstrates the differential performance of genotypes in different environments. Therefore, this change in the average juice productiv-ity of new yellow passion fruit varieties depending on the environment justifies the need for a more refined analysis to increase the efficiency of selection and the choice of varieties for culture.
In the presence of a GE interaction, it is necessary to determine the performance and adaptation of varieties based on evaluations in multiple trials or growing years. In the specific case of yellow passion fruit, where the use of agricultural inputs and proper cultivation tech-niques is very limited and many plantings are conducted in highly aggressive and unpredict-able environments such as the northeast region of Brazil, the identification of stable varieties
Table 2. Analysis of variance of juice productivity of yellow passion fruit, including the genotype-by-environment (GE) interaction partition according to an additive main effect and multiplicative interaction (AMMI) analysis.
Sources of variation DF TSS MS % explained % accumulated
Blocks/environments 16 485.20 30.33** Environment (E) 7 8215.40 1173.63** Genotypes (G) 11 396.30 36.03** GE interaction 77 2888.80 37.52** IPCA1 17 1934.05 113.77** 67.00 67.00IPCA2 15 405.44 27.03** 14.00 81.00IPCA3 13 228.61 17.59* 7.90 88.90IPCA4 11 159.47 14.50ns 5.50 94.40IPCA5 9 82.30 9.14ns 2.80 97.20IPCA6 7 50.29 7.18ns 1.70 98.90IPCA7 5 28.59 5.72ns 1.00 99.90IPCA8 3 0.00 0.00ns 0.10 100.00Error 176 1516.30
DF = degree of freedom; TSS = total sum of square; MS = mean square; and IPCA = interaction principal component axis; ns = non significant; *,**Significant at 5 and 1% probability, respectively, by F test.
Table 3. Mean juice productivity of yellow passion fruit varieties evaluated in eight production environments in the State of Bahia.
Variety Joint CPa DBa Ibi LNS-RA LNS-Mo MSo Val WG
Var04 13.99a 12.57a 13.95a 29.84a 4.72c 6.77a 15.26a 12.09a 16.69a
Var05 14.54a 9.62b 14.43a 29.72a 4.67c 14.06a 13.70a 12.71a 17.43a
Var06 14.84a 8.48b 13.44a 30.85a 2.65c 13.11a 15.43a 14.27a 20.52a
Var07 13.55a 11.21a 10.62a 36.77a 2.69c 9.57a 12.76a 14.25a 10.50b
Var08 13.16a 8.72b 12.56a 28.61a 9.11b 11.01a 10.44a 13.15a 11.71b
Var09 12.99a 7.02b 13.27a 27.67a 3.79c 8.89a 14.96a 15.02a 13.29b
Var10 13.06a 9.59b 10.75a 30.47a 4.22c 9.48a 15.17a 11.96a 12.81b
Var11 12.10b 9.08b 11.12a 25.94a 4.70c 9.49a 12.30a 10.14a 14.04b
Var12 10.47b 6.19b 7.97a 16.88b 8.18b 7.59a 10.70a 12.45a 13.79b
Var13 12.40b 12.62a 9.63a 22.42a 6.17c 9.18a 13.56a 10.79a 14.80b
Var14 12.05b 8.21b 13.80a 12.66b 13.42a 11.72a 11.63a 15.88a 9.06b
Var15 11.99b 13.80a 13.62a 12.51b 3.23c 9.79a 13.43a 16.20a 13.38b
CPa = Cabaçeiras do Paraguaçú; DBa = Dom Basílio; Ibi = Ibicoara; LNS-RA = Livramento de Nossa Senhora-Rio Acima; LNS-Mo = Livramento de Nossa Senhora-Monte Oliveira; MSo = Marcionílio Souza; Val = Valença; WG = Wenceslau Guimarães. Means followed by the same superscript letter were not statistically significant (P ≤ 0.05) by the Scott-Knott test.
6519
©FUNPEC-RP www.funpecrp.com.brGenetics and Molecular Research 13 (3): 6512-6527 (2014)
AMMI analysis of passion fruit
is a critical step in breeding programs. Reducing the GE interaction involves the selection of genotypes with greater stability in a wide range of environments to better predict their behav-ior. In this sense, the AMMI analysis is an important tool to obtain an understanding of the factors involved in the shaping of the GE interaction.
AMMI analysis of GE interaction
The AMMI analysis of juice productivity in new yellow passion fruit varieties that was performed in eight environments in Bahia State showed that 71.44% of the sum of squares was due to the effect of the environment, whereas 3.45% and 25.12% were attributed to the effects of the genotypes and the GE interaction, respectively (Table 2). This greater percent-age of the sum of squares related to environmental effects identified significant differences between the environmental averages. These differences caused most of the variation in juice productivity. Similar results were obtained for other crops. These results, in which most of the variation is explained by environmental effects and GE interaction, demonstrate that the selec-tion of the best genotypes is not straightforward (Oliveira and Godoy, 2006; Mohammadi and Amri, 2009; Silveira et al, 2013).
On the basis of the FR Cornelius test, only the effects of IPCA1 and IPCA2 (P ≤ 0.01) and IPCA3 (P ≤ 0.05) were significant (Table 2). These results guide the selection of the AMMI3 model to explain the effect of the GE interaction. In all, 88.90% of the sum of squares of the GE interaction could be explained by the AMMI3 model, with 67.00, 14.00, and 7.90% explained by IPCA1, IPCA2, and IPCA3, respectively. The values explained by these models were greater than those previously observed in other crops (Oliveira and Godoy, 2006; Paderewski et al., 2011; Silveira et al., 2013). By providing more degrees of freedom than the main effects of genotype and environment, the GE interaction absorbs most of the noise component corresponding to unpredictable and uninterpretable responses of the model, which are caused by experimental error. However, the first major components of interaction (IPCA1) capture most of the sum of squares (SQGE), which determines the GE interaction, termed the standard portion (the genotype and environment effects), compared with the highest level components (Gauch, 1988). Therefore, because IPCA3 captured only 7.90% of the interaction sum of squares, we analyzed only IPCA1 and IPCA2.
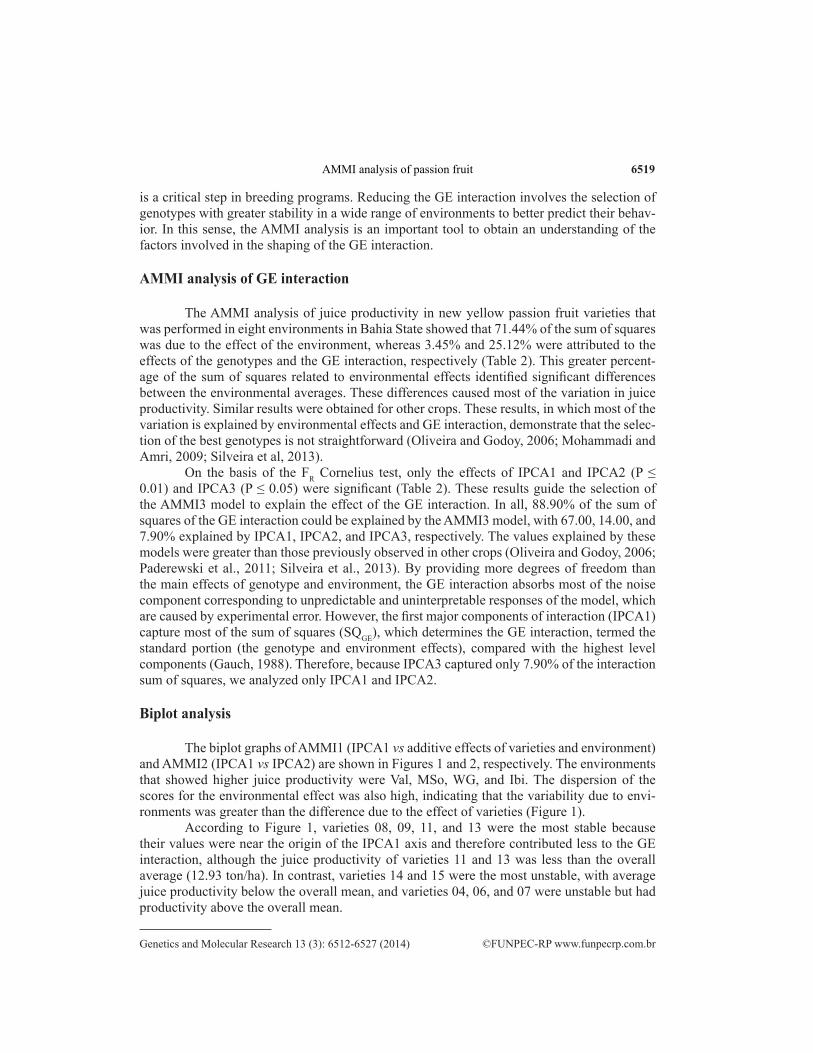
Biplot analysis
The biplot graphs of AMMI1 (IPCA1 vs additive effects of varieties and environment) and AMMI2 (IPCA1 vs IPCA2) are shown in Figures 1 and 2, respectively. The environments that showed higher juice productivity were Val, MSo, WG, and Ibi. The dispersion of the scores for the environmental effect was also high, indicating that the variability due to envi-ronments was greater than the difference due to the effect of varieties (Figure 1).
According to Figure 1, varieties 08, 09, 11, and 13 were the most stable because their values were near the origin of the IPCA1 axis and therefore contributed less to the GE interaction, although the juice productivity of varieties 11 and 13 was less than the overall average (12.93 ton/ha). In contrast, varieties 14 and 15 were the most unstable, with average juice productivity below the overall mean, and varieties 04, 06, and 07 were unstable but had productivity above the overall mean.
6520
©FUNPEC-RP www.funpecrp.com.brGenetics and Molecular Research 13 (3): 6512-6527 (2014)
E.J. Oliveira et al.
Other varieties, e.g., varieties 04, 05, 06, and 10, occupied a position of intermedi-ate stability. Moreover, variety 07 showed good average juice productivity but higher IPCA score values and was found to show high adaptability to the Ibi environment. According to Murakami et al. (2004), knowledge about the performance and/or adaptability of genotypes in specific environments is very important for estimating the agronomic value of varieties and allowing recommendations for specific environments.
The analysis of the environments showed that WG and MSo made the smallest contri-
Figure 1. Additive main effects and multiplicative interaction 1 (AMMI1) biplot for additive effects vs interaction principal component axis 1 (IPCA1) in 12 varieties of yellow passion fruit from eight environments in the State of Bahia for juice productivity (JuProd). The environmental codes are described in Table 1.
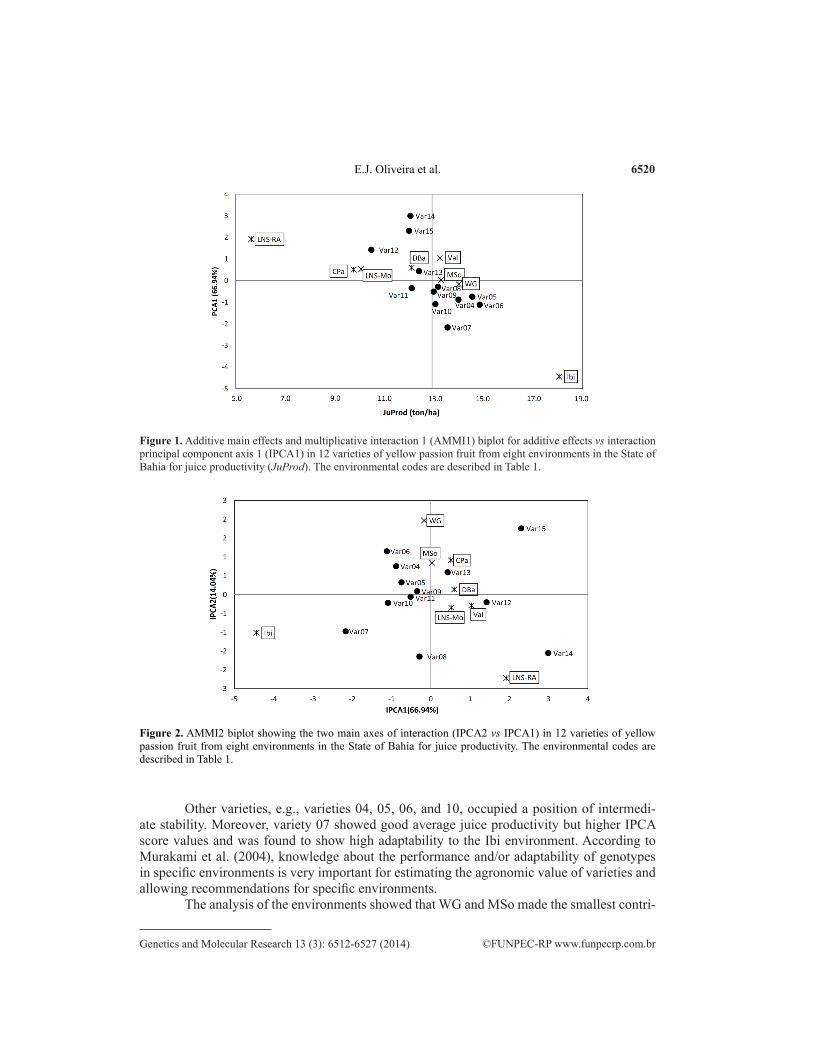
Figure 2. AMMI2 biplot showing the two main axes of interaction (IPCA2 vs IPCA1) in 12 varieties of yellow passion fruit from eight environments in the State of Bahia for juice productivity. The environmental codes are described in Table 1.
6521
©FUNPEC-RP www.funpecrp.com.brGenetics and Molecular Research 13 (3): 6512-6527 (2014)
AMMI analysis of passion fruit
butions to the GE interaction. Other environments showed an intermediate contribution (CPa, DBa, Val, and LNS-Mo) or a high contribution to the GE interaction (LNS-RA and Ibi) (Figure 1). According to Rocha et al. (2007), environmental stability is important to evaluate the reli-ability of the ranking of the genotypes in a given environment relative to the overall average of the environments. Furthermore, Oliveira and Godoy (2006) suggest that environments with low IPCA scores (high stability) are of interest as sites to investigate the selection of genotypes in the early stages of improvement, during which the amount of seed or propagation material limits the extension of the tests to multiple environments.
For yellow passion fruit, the average juice productivity was higher than the overall mean, 12.93 ton/ha, only in the Val, MSo, WG, and Ibi environments. This result indicated that these environments were the most favorable for high juice production. The principal rea-sons for the high value of juice productivity in these environments are the greater availability and distribution of rainfall in these sites or the use of irrigation during periods when the crop requires watering, which occurred in Ibi and Mso in the initial phase of establishment and flowering.
The IPCA1 x IPCA2 (AMMI2) biplot graph compares the relative magnitude and sign of the GE interaction for each genotype and environment. Genotypes with high IPCA1 or IPCA2 or both have a greater GE interaction, whereas genotypes with IPCA1 or IPCA2 near zero have GE interactions of low magnitude. Accordingly, on the basis of the AMMI2 analy-sis, varieties 09 and 11 were the most stable (Figure 2). However, varieties 08 and 13, which were considered stable according to the AMMI1 analysis, were found to be highly unstable according to the AMMI2 analysis. Inversions of behavior relative to the classification of geno-types in the AMMI1 and AMMI2 biplots were also observed in cowpea (Rocha et al., 2007). Furthermore, the classification of varieties 04 and 06 was changed from intermediate stability, based on the AMMI1 model, to poor stability, based on the AMMI2 model. In addition to the previously mentioned varieties (04, 06, 08, and 13), varieties 07, 14, and 15 were considered to be highly unstable because of their distance from the origin of the biplot graph.
Moreover, the DBa, Val, and LNS-Mo environments were the principal contributors to the phenotypic stability of the varieties (Figure 2), and no significant differences among varieties were observed for juice productivity (Table 3). In contrast, the Ibi, LNS-RA, and WG environments showed a high contribution to the GE interaction because they were positioned away from the origin of the AMMI2 biplot. In general, genotypes and environments that oc-cupy adjacent positions in the biplot graph display positive associations. This information clearly facilitates the identification of similar zones of agronomic performance. For example, variety 14 was very near the LNS-RA environment on the biplot graph (Figure 2).
ASV
The ASV parameter is used to quantify and classify the genotypes according to the stability of their productivity. In this analysis, ASV is represented by the distance of the variet-ies from the zero point of the IPCA1 vs IPCA2 scatter diagram. The varieties with low scores and thus considered more stable according to this criterion were 11, 08, 13, and 09 (Table 4). This result was consistent with the AMMI1 model but had only varieties 09 and 11 in common with the AMMI2 model. The ASV parameter was used as an auxiliary criterion to define stable genotypes in other crops such as wheat (Farshadfar et al., 2011) and rice (Das et al., 2010).
6522
©FUNPEC-RP www.funpecrp.com.brGenetics and Molecular Research 13 (3): 6512-6527 (2014)
E.J. Oliveira et al.
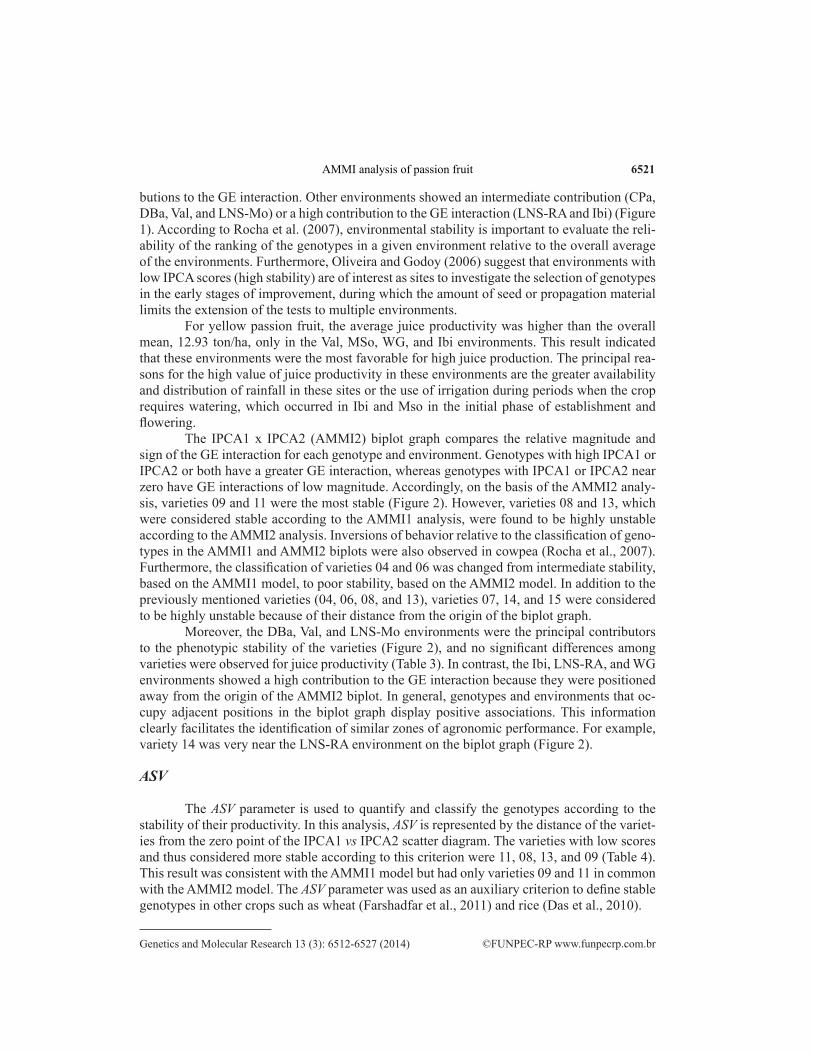
YSI
The YSI parameter incorporates both productivity and stability in a single index, de-creasing the problems caused by using productivity stability as the sole criterion to select vari-eties for recommendation. This parameter is relevant in light of the finding that the most stable genotypes do not always have the best production performance (Oliveira and Godoy, 2006). According to this index, varieties 04, 05, 06, and 08 were the most stable (Table 4).
The YSI parameter is used to classify genotypes according to the ASV parameter, which incorporates IPCA1 and IPCA2, and ranks the varieties according to juice productivity. This method was successfully used for other crops, such as wheat (Farshadfar, 2008), and this criterion shows good correspondence with the biplot analysis.
SuI
Variety 07 showed a lower value of sustainability (27.59%), whereas most of the yellow passion fruit varieties were classified as having medium sustainability (ranging from 40.20 to 69.97%). In contrast, variety 14 showed high sustainability (73.79%) (Table 4). The increase in the SuI values agreed with the highest value of juice productivity. This result could reflect the most productive characteristics of the variety rather than the productive stability itself. In wheat, however, this index was not effective at discriminating stable genotypes for high grain yield (Mladenov et al., 2012). Similar results were obtained for wheat (Farshadfar et al., 2011), where SuI were greater than 91% for certain genotypes.
StI
The yellow passion fruit varieties were ranked by decreasing order of StI values. Twelve varieties were quite similar, although varieties 05 and 06 had StI values that were greater than 16.00 (Table 4). The stability of these varieties was classified as intermediate in the AMMI1 and AMMI2 analyses (except 06). According to Bajpai and Prabhakaran (2000), using StI can remedy several of the disadvantages of methods based on genotype rankings. These disadvantages result from the bias that occurs in the selection of the most productive
Variety IPCA1 IPCA2 JuProd ASV SuI (%) StI YSI
Var04 -0.882 0.752 13.99 4.28 49.45 15.82 9Var05 -0.745 0.324 14.54 3.57 56.65 16.79 7Var06 -1.116 1.150 14.85 5.45 50.57 16.48 9Var07 -2.167 -0.977 13.55 10.38 27.59 14.84 14Var08 -0.287 -1.647 13.16 2.14 52.08 15.13 7Var09 -0.515 -0.060 12.99 2.46 44.94 15.54 11Var10 -1.089 -0.221 13.06 5.20 41.28 15.04 13Var11 -0.347 0.090 12.10 1.66 45.50 13.44 10Var12 1.423 -0.206 10.47 6.79 52.59 11.74 21Var13 0.432 0.592 12.40 2.14 58.10 14.69 11Var14 2.991 -1.556 12.05 14.35 73.79 13.14 22Var15 2.302 1.758 11.99 11.12 62.17 13.12 22
Table 4. First and second interaction principal component axes (IPCAs), average juice productivity (JuProd) of yellow passion fruit, and other stability parameters: AMMI stability value (ASV), sustainability index (SuI), stability index (StI), and yield stability index (YSI).
6523
©FUNPEC-RP www.funpecrp.com.brGenetics and Molecular Research 13 (3): 6512-6527 (2014)
AMMI analysis of passion fruit
materials. In the approach based on StI values, the productivity and stability of genotypes are measured according to individual performance relative to the average of the set of genotypes. This characteristic was observed in this study, and varieties 05 and 06, which were classified as more stable according to the StI parameter, also showed high juice productivity.
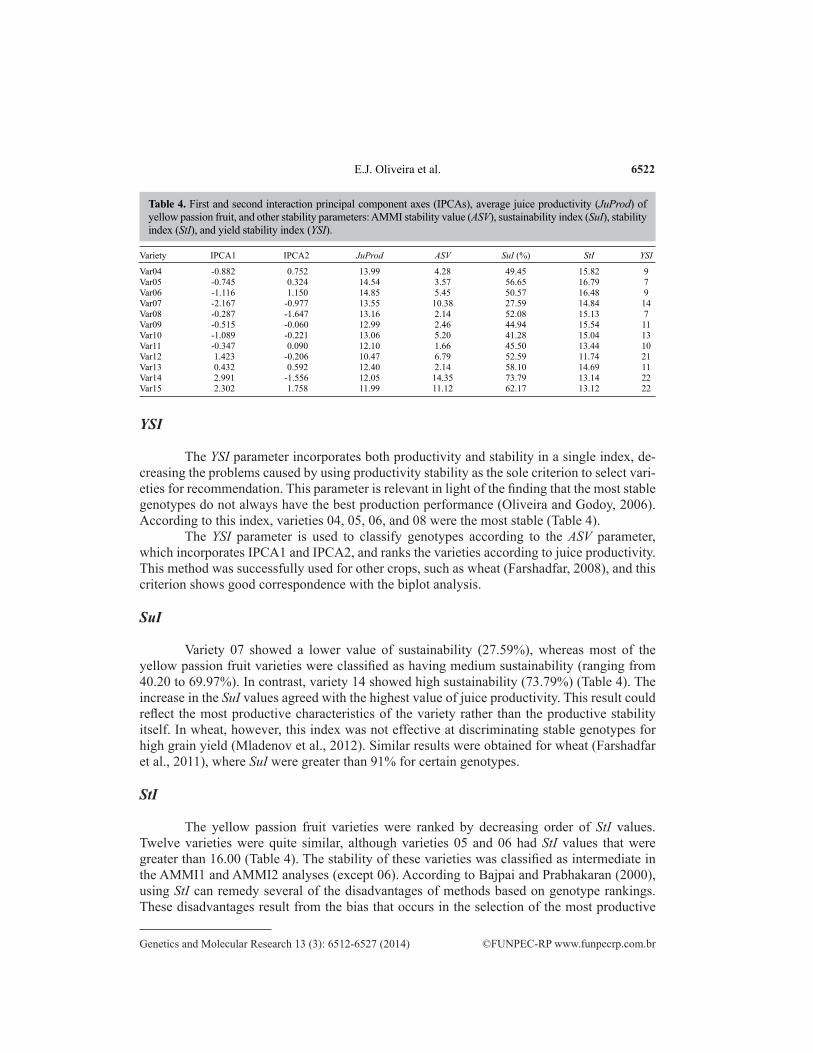
Cluster analysis of the GE interaction of varieties of passion fruit
The genotypic profile of the estimates of the GE interaction effects for the AMMI2 model was used to describe the response pattern of the juice productivity of the yellow passion fruit varieties. The results of the cluster analysis using the BIC scores (maximum peak) indi-cated three groups of similarities for GE interaction (Figure 3). Using real and simulated data to evaluate the performance of clustering algorithms, Lee et al. (2009) showed that the BIC crite-rion was the best algorithm for predicting the number of groups in real data. For simulated data, however, the number of groups inferred from the BIC criterion was very close to that obtained from similar models, such as the algorithm from the Structure software (Pritchard et al., 2000).
Figure 3. Bayesian information criterion (BIC) of the genotype-by-environment (GE) interaction matrix from the AMMI2 model related to the evaluation of 12 yellow passion fruit varieties for juice productivity in eight environments in Bahia State, Brazil. The vertical axis shows the maximized BIC values. EII, VII, EEI, VEI, EVI, VVI, EEE, EEV, VEV, and VVV are identifiers used for the parameterizations of covariance matrix k currently available in mclust package for hierarchical clustering.
The three groups formed were homogeneous in their pattern of GE interaction (Figure 4). In addition, except varieties 07 and 11, the grouping of the other varieties was consistent with the Scott-Knott test (P ≤ 0.05) for the joint analysis of all trials (Table 3). Furthermore, the grouping of varieties based on the genotypic profile of the estimates of the GE interaction was consistent with the distribution of varieties in the quadrants of the AMMI1 analysis (Figure 1) except for variety 11. This variety clearly remained in Group 2 (Figure 4) because of its low GE interaction scores, but it showed a low average productivity.

6524
©FUNPEC-RP www.funpecrp.com.brGenetics and Molecular Research 13 (3): 6512-6527 (2014)
E.J. Oliveira et al.
Nevertheless, this strategy had several limitations as a method to classify genotypes for juice stability relative to other methods analyzed. It is possible that one of these limitations resulted from the omission of the association with the average productivity of the varieties.
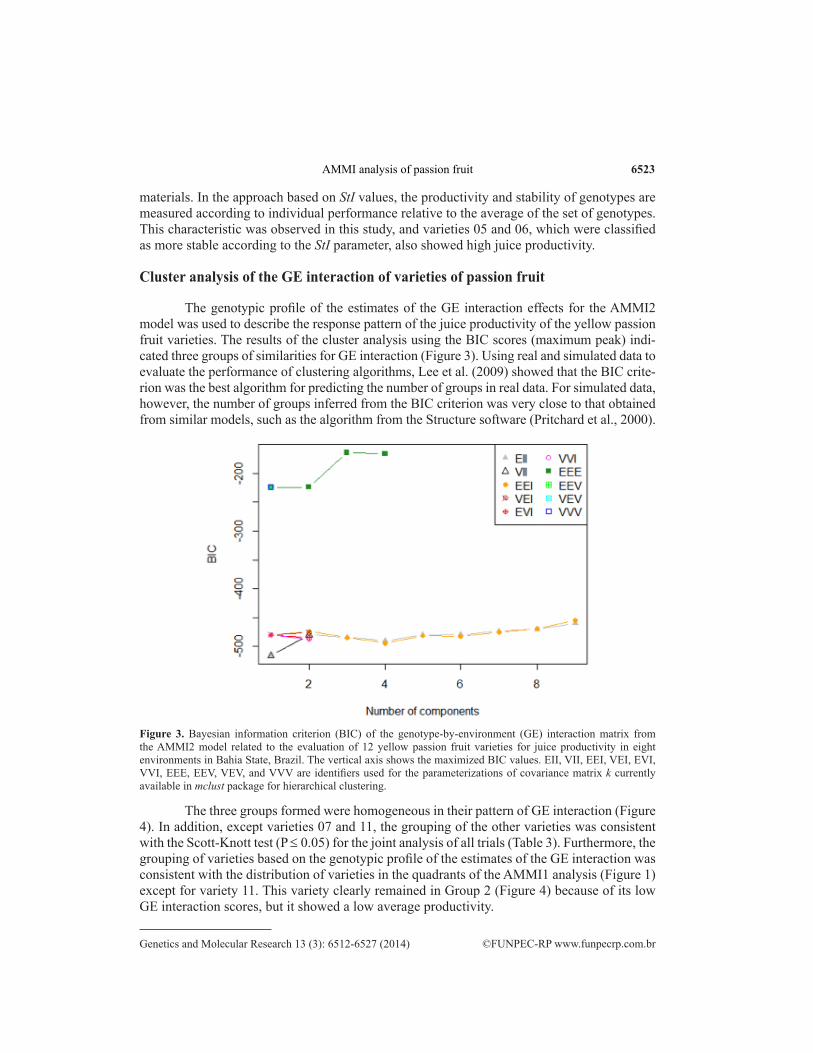
Interrelationships among stability parameters
The correlations between the rankings of the yellow passion fruit varieties for each of the stability parameters are shown in Figure 5. Positive and significant correlations (P ≤ 0.05) were observed for IPCA1 x (ASV and YSI), juice productivity variable (JuProd) x (StI and YSI), ASV x YSI, and StI x YSI. The high positive correlations between IPCA1 x ASV (0.99), IPCA1 x YSI (0.77), and ASV x YSI (0.75) are expected because IPCA1 is a component of the ASV and YSI formulas. Similarly, the positive correlations between JuProd x StI (0.93), JuProd x YSI (0.75), and StI x YSI (0.82) are a consequence of including the average juice productivity in the computation of the stability parameters.
The SuI showed no significant correlations with the other stability parameters. This outcome is consistent with the selection of varieties that were not identified by the other meth-ods (Table 4). Additionally, no significant correlation was found between IPCA1 and IPCA2. This result shows that the first two IPCAs from the AMMI model did not produce similar results in the ranking of the most stable varieties. However, the occurrence of larger IPCA1 values and smaller IPCA2 values to discriminate environmental abilities has been used to identify genotypes that were adapted to specific environments (Yan and Rajcan, 2002).
Recommendation of varieties
The primary purpose of plant breeding is to select varieties that can increase the po-tential crop productivity in different environments regardless of the GE interaction. However, this goal is difficult to attain, particularly because different methodological approaches are
Figure 4. Dendrogram constructed with the Ward method using the genotypic profile of the estimates of the effects of the genotype-by-environment interaction. The yellow passion fruit varieties evaluated were placed in three groups according to juice productivity as assessed in eight production environments in Bahia State, Brazil.
6525
©FUNPEC-RP www.funpecrp.com.brGenetics and Molecular Research 13 (3): 6512-6527 (2014)
AMMI analysis of passion fruit
used to study GE interactions. Because this interaction is multivariate, several strategies have been developed over many years to summarize information from a number of vectors. AMMI analysis is one such method that can aid in approaching this goal (Babić et al., 2010). Accord-ingly, the yellow passion fruit varieties that demonstrated a strong GE interaction were again ranked according to this strategy.
Figure 5. Scatterplot of the correlation between the stability parameters for the juice productivity of 12 yellow passion fruit varieties. The numbers above the parentheses represent the estimated correlation, and those within the parentheses represent the P value for the correlation. IPCA1 and IPCA2: interaction principal component axis 1 and 2, respectively; JuProd = juice productivity; ASV = AMMI stability value; SuI = sustainability index; StI = stability index; and YSI = yield stability index.
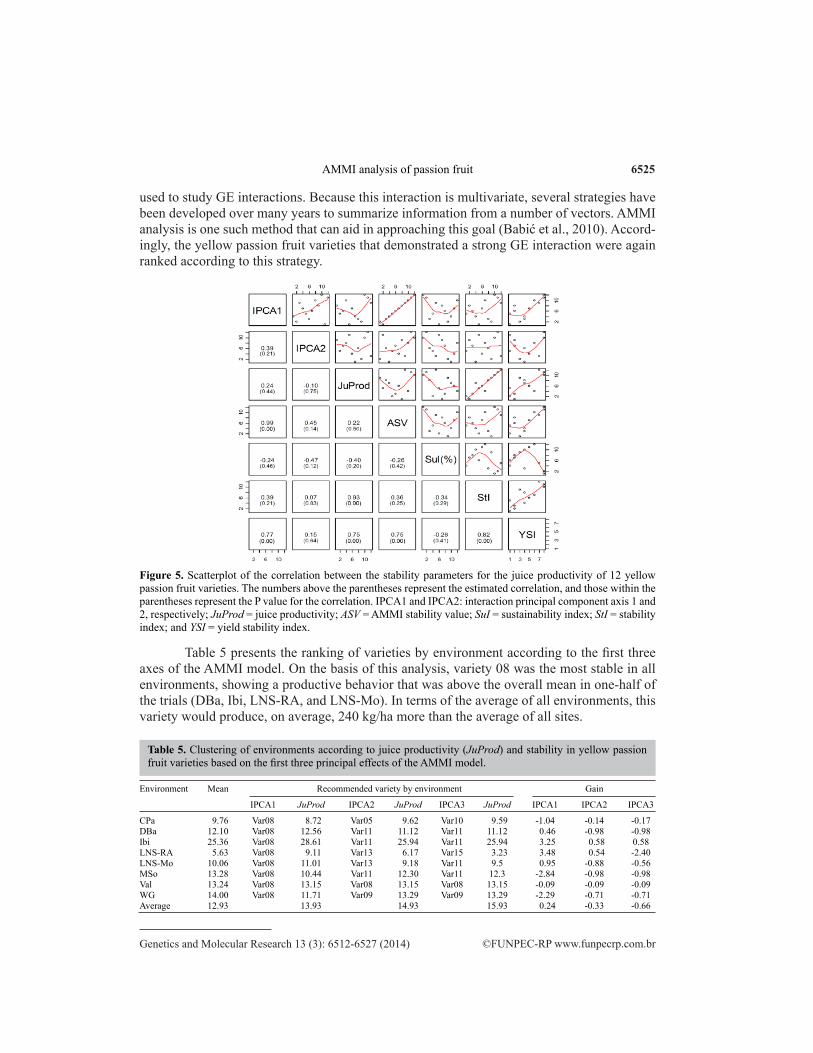
Table 5 presents the ranking of varieties by environment according to the first three axes of the AMMI model. On the basis of this analysis, variety 08 was the most stable in all environments, showing a productive behavior that was above the overall mean in one-half of the trials (DBa, Ibi, LNS-RA, and LNS-Mo). In terms of the average of all environments, this variety would produce, on average, 240 kg/ha more than the average of all sites.
Environment Mean Recommended variety by environment Gain
IPCA1 JuProd IPCA2 JuProd IPCA3 JuProd IPCA1 IPCA2 IPCA3
CPa 9.76 Var08 8.72 Var05 9.62 Var10 9.59 -1.04 -0.14 -0.17DBa 12.10 Var08 12.56 Var11 11.12 Var11 11.12 0.46 -0.98 -0.98Ibi 25.36 Var08 28.61 Var11 25.94 Var11 25.94 3.25 0.58 0.58LNS-RA 5.63 Var08 9.11 Var13 6.17 Var15 3.23 3.48 0.54 -2.40LNS-Mo 10.06 Var08 11.01 Var13 9.18 Var11 9.5 0.95 -0.88 -0.56MSo 13.28 Var08 10.44 Var11 12.30 Var11 12.3 -2.84 -0.98 -0.98Val 13.24 Var08 13.15 Var08 13.15 Var08 13.15 -0.09 -0.09 -0.09WG 14.00 Var08 11.71 Var09 13.29 Var09 13.29 -2.29 -0.71 -0.71Average 12.93 13.93 14.93 15.93 0.24 -0.33 -0.66
Table 5. Clustering of environments according to juice productivity (JuProd) and stability in yellow passion fruit varieties based on the first three principal effects of the AMMI model.
6526
©FUNPEC-RP www.funpecrp.com.brGenetics and Molecular Research 13 (3): 6512-6527 (2014)
E.J. Oliveira et al.
Variety 11 was found to show high stability in four environments (DBa, Ibi, LNS-Mo, and MSo) according to IPCA1 and IPCA2, but it always had low juice productivity (except in Ibi). Therefore, it can be considered a stable genotype with low productivity. Varieties 05 and 10 were found to show good stability in the CPa environment based on IPCA2 and IPCA3, respectively, whereas variety 15 showed high stability based on IPCA3 (LNS-RA). All of these varieties showed low productivity. Furthermore, variety 09 showed good stability based on IPCA2 and IPCA3 in the WG environment, and variety 13 was ranked in the LNS-RA and LNS-Mo environments according to the IPCA2 analysis.
ACKNOWLEDGMENT
Research supported by Fundação de Amparo à Pesquisa do Estado da Bahia, Coor-denação de Aperfeiçoamento de Pessoal de Nível Superior, and the Conselho Nacional de Desenvolvimento Científico e Tecnológico.
REFERENCES
Babarmanzoor A, Tariq MS, Ghulam A and Muhammad A (2009). Genotype x environment interaction for seed yield in Kabuli chickpea (Cicer arietinum L.) genotypes developed through mutation breeding. Pak. J. Bot. 41: 1883-1890.
Babić V, Babić M, Ivanović M and Kraljević-Balalić M (2010). Understanding and utilization of genotype-by-environment interaction in maize breeding. Genetika 42: 79-90.
Bajpai PK and Prabhakaran VT (2000). A new procedure of simultaneous selection for high yielding and stable crop genotypes. Indian J. Genet. Plant Breed. 60: 141-146.
Centro de Produções Técnicas. (CPT) (2013). Maracujá é a fruta que produz o terceiro suco mais consumido no Brasil. Available at [http://www.cpt.com.br/cursos-fruticultura-agricultura/artigos/maracuja-fruta-produz-terceiro-suco-mais-consumido-brasil#ixzz2XbkJj49p] Accessed August 6, 2013.
Cornelius PL, Seyedsadr M and Crossa J (1992). Using the shifted multiplicative model to search for “separability” in crop cultivar trials. Theor. Appl. Genet. 84: 161-172.
Crossa J (1990). Statistical analyses of multilocation trials. Adv. Agron. 44: 55-85.Crossa J, Gauch HG and Zobel RW (1990). Additive main effects and multiplicative interaction analysis of two
international maize cultivar trials. Crop Sci. 30: 493-500.Das S, Misra RC, Patnaik MC and Das SR (2010). GxE interaction, adaptability and yield stability of mid-early rice
genotypes. Indian J. Agric. Res. 44: 104-111.de Mendiburu F (2010). Agricolae: Statistical Procedures for Agricultural Research. R package version 1.0-9. Available
at [http://CRAN.R-project.org/package=agricolae] Accessed July 8, 2013.Farshadfar E, Mahmodi N and Yaghotipoor A (2011). AMMI stability value and simultaneous estimation of yield and
yield stability in bread wheat (Triticum aestivum L.). Aust. J. Crop Sci. 5: 1837-1844.Farshadfar E (2008). Incorporation of AMMI stability value and grain yield in a single non-parametric index (GSI) in
bread wheat. Pak. J. Biol. Sci. 11: 1791-1796.Fraley C and Raftery AE (2007). Model-based methods of classification: using the mclust software in chemometrics. J.
Stat. Softw. 18: 1-13.Freitas JPX, Oliveira EJ, Cruz Neto AJ and Santos LR (2011). Avaliação de recursos genéticos de maracujazeiro-amarelo.
Pesq. Agropec. Bras. 46: 1013-1020.Gauch HG (1988). Model selection and validation for yield trials with interaction. Biometrics 44: 705-715.Gauch HG and Zobel RW (1996). AMMI Analysis of Yield Trials. In: Genotype-by-Environment Interaction (Kang MS
and Gauch HG, eds.). CRC Press, Boca Raton, 85-122.Gonçalves JS and Souza SAM (2006). Fruta da Paixão: panorama econômico do maracujá no Brasil. Inf. Econ. 36: 29-36.Holhs T (1995). Analysis of genotype-environment interactions. S. Afr. J. Sci. 91: 121-124.Lee C, Abdool A and Huang CH (2009). PCA-based population structure inference with generic clustering algorithms.
BMC Bioinformatics 10 (Suppl. 1): S73.Lin CS, Binns MR and Lefkovitch LP (1986). Stability analysis: where do we stand? Crop Sci. 26: 894-900.Maechler M, Rousseeuw P, Struyf A and Hubert M (2013). Cluster: cluster analysis basics and extensions. R package
6527
©FUNPEC-RP www.funpecrp.com.brGenetics and Molecular Research 13 (3): 6512-6527 (2014)
AMMI analysis of passion fruit
version 1.14.4. Accessed July 8, 2013.Mladenov V, Banjac B and Milošević M (2012). Evaluation of yield and seed requirements stability of bread wheat
(Triticum aestivum L.) via AMMI model. Turk. J. Field Crops 17: 203-207.Mohammadi R and Amri A (2009). Analysis of genotype x environment interactions for grain yield in durum wheat. Crop
Sci. 49: 1177-1186.Murakami DM, Cardoso AA, Cruz CD and Bizão N (2004). Considerações sobre duas metodologias de análise de
estabilidade e adaptabilidade. Cienc. Rural 34: 71-78.Oliveira EJ and Godoy IJ (2006). Pod yield stability analysis of runner peanut lines using AMMI. Crop Breed. Appl.
Biotechnol. 6: 311-317.Paderewski J, Gauch HG, Mądry W and Drzazga T (2011). Yield response of winter wheat to agro-ecological conditions
using additive main effects and multiplicative interaction and cluster analysis. Crop Sci. 51: 969-980.Pritchard JK, Stephens M and Donnelly P (2000). Inference of population structure using multilocus genotype data.
Genetics 155: 945-959.Purchase JL, Hatting H and Van Deventer CS (2000). Genotype x environment interaction of winter wheat (Triticum
aestivum L.) in South Africa: II. Stability analysis of yield performance. S. Afr. J. Plant Soil 17: 101-107.R Development Core Team (2011). R: A Language and Environment for Statistical Computing. R Foundation for
Statistical Computing. Available at [http://www.R-project.org/] Accessed December 18, 2011, Vienna.Rao M, Lakshmikantha Reddy G, Kulkarni RS and Lalitha Reddy SS (2004). Stability analysis of sunflower hybrids
through non-parametric model. Helia 27: 59-66.Rocha MM, Freire Filho FR, Ribeiro VQ and Carvalho HWL (2007). Adaptabilidade e estabilidade produtiva de genótipos
de feijão-caupi de porte semi-ereto na região Nordeste do Brasil. Pesq. Agropec. Bras. 42: 1283-1289.Shukla GK (1972). Some statistical aspects of partitioning genotype-environmental components of variability. Heredity
29: 237-245.Silveira LCI, Kist V, Paula TOM and Barbosa MHP (2013). AMMI analysis to evaluate the adaptability and phenotypic
stability of sugarcane genotypes. Sci. Agric. 70: 27-32.Yan W and Rajcan I (2002). Biplot Analysis of Test Sites and Trait Relations of Soybean in Ontario. Crop Sci. 42: 11-20.Yockteng R, Chies T and D’eeckenbrugge GC (2011). Passiflora. In: Wealth of Wild Species: Genetic, Genomic and
Breeding Resources (Kole C, ed.). Springer-Verlag, New York, 129-171.Zobel RW, Wright MJ and Gauch HG (1988). Statistical analysis of a yield trial. Agron. J. 80: 388-393.