Are Phosphorous and Phosphoric Acids Equal Phosphorous Sources
agronomy
Article
Genetic Diversification and Selection Strategies forImproving Sorghum Grain Yield UnderPhosphorous-Deficient Conditions in West Africa
Chiaka Diallo 1, H. Frederick W. Rattunde 2,*, Vernon Gracen 3, Aboubacar Touré 4,Baloua Nebié 4, Willmar Leiser 5 , Daniel K. Dzidzienyo 6, Ibrahima Sissoko 4, Eric Y. Danquah 6,Abdoulaye G. Diallo 7, Bakary Sidibé 4, Mamourou Sidibé 4 and Eva Weltzien 2
1 Department of Agronomic Sciences, Institut Polytechnique Rural de Formation et Recherche Appliquée deKatibougou, (IPR/IFRA), BP 06 Koulikoro, Mali; [email protected]
2 Agronomy Department, University of Wisconsin-Madison, Madison, WI 53706, USA;[email protected]
3 School of Integrative Plant Sciences, Section of Plant Breeding and Genetics Cornell University, Ithaca,NY 14853, USA; [email protected]
4 Sorghum Program, International Crops Research Institute for Semi-Arid Tropics, (ICRISAT), 65 Bamako,Mali; [email protected] (A.T.); [email protected] (B.N.); [email protected] (I.S.);[email protected] (B.S.); [email protected] (M.S.)
5 State Plant Breeding Institute, Univ. of Hohenheim, 70599 Stuttgart, Germany;[email protected]
6 West Africa Center for Crop Improvement (WACCI), University of Ghana (UG), P.O. Box LG 25 Accra,Ghana; [email protected] (D.K.D.); [email protected] (E.Y.D.)
7 Institut d’Economie Rurale, BP 262 Bamako, Mali; [email protected]* Correspondence: [email protected]
Received: 2 October 2019; Accepted: 4 November 2019; Published: 11 November 2019�����������������
Abstract: Sorghum, a major crop for income generation and food security in West and CentralAfrica, is predominantly grown in low-input farming systems with serious soil phosphorus (P)deficiencies. This study (a) estimates genetic parameters needed to design selection protocols thatoptimize genetic gains for yield under low-phosphorus conditions and (b) examines the utility ofintrogressed backcross nested association mapping (BCNAM) populations for diversifying Malianbreeding materials. A total of 1083 BC1F5 progenies derived from an elite hybrid restorer “Lata-3”and 13 diverse donor accessions were evaluated for yield and agronomic traits under contrasting soilP conditions in Mali in 2013. A subset of 298 progenies were further tested under low-P (LP) andhigh-P (HP) conditions in 2014 and 2015. Significant genetic variation for grain yield was observedunder LP and HP conditions. Selection for grain yield under LP conditions was feasible and moreefficient than the indirect selection under HP in all three years of testing. Several of the BCNAMpopulations exhibited yields under LP conditions that were superior to the elite restorer line used asa recurrent parent. The BCNAM approach appears promising for diversifying the male parent poolwith introgression of diverse materials using both adapted Malian breed and unadapted landracematerial from distant geographic origins as donors.
Keywords: base broadening; germplasm; sorghum; phosphorus adaptation; selection strategy
1. Introduction
Sorghum is one of the most important crops for smallholder farmers in West Africa who annuallycultivate 14.1 million ha, approximately half of African and one-third of world production area ofsorghum [1]. This cereal crop is produced in low-input farming systems [2–4] in which soil phosphorous
Agronomy 2019, 9, 742; doi:10.3390/agronomy9110742 www.mdpi.com/journal/agronomy
Agronomy 2019, 9, 742 2 of 17
deficiency is widespread and a serious constraint to yield [5,6]. Sorghum is critical for food securityand plays an important role in West African farming systems as it can be produced under poor soilconditions [7]. Nevertheless, soil phosphorous (P) deficiency limits the growth and development ofsorghum, reducing grain yield and delaying maturity, which increases exposure to end-of-seasondrought stress [6,8]. Specific efforts to breed sorghum with superior grain yield under P-limitedconditions are necessary to optimize genetic gains for grain yield in these environments [6,9]. Geneticvariation occurs for yields under low P-fertility [6] and requires appropriate statistical designs toreliably determine grain yield in low-P fields [6]. These findings were based on a group of pure-linevarieties that do not represent the situation when selecting in elite segregating materials for developingsuperior hybrid parents.
Sorghum breeding in Mali and Burkina Faso emphasizes the use of Guinea-race germplasm,the race predominantly cultivated in West Africa. Random-mating populations based on West AfricanGuinea landrace varieties have been created as a source of diversity [7,10] and subjected to severalcycles of selection for grain yield and key traits for adaptation and farmer acceptability. This workproduced novel, dual-purpose (grain plus fodder) varieties with desirable Guinea-race grain, but thegenetic gains for grain yield were low. One factor hindering gains progress for grain yield could havebeen the low genetic diversity within West African Guinea-race varieties. The low genomic diversityfound within West African Guinea-race varieties, relative to global diversity within the Guinea raceand over races [11], supports this hypothesis. An additional factor could have been low populationsizes, even when starting with very large populations, because of the strong culling for numerous traits(e.g., grain hardness, free threshing glumes, panicle form sufficiently lax to minimize head-bug andgrain mold losses) required for adaptation and farmer acceptance of new varieties.
The nested association mapping (NAM) method was developed to dissect complex traits inmaize [12]. A modification of the NAM method using backcrossing, the backcross nested associationmapping (BC-NAM), was employed in sorghum for using exotic, unadapted germplasm to increasegenetic diversity while retaining critical gene complexes essential for adaptation and efficient hybridbreeding (minimizing disturbance of fertility restoration genes) [13]. An elite hybrid male was usedas the recurrent parent for a single backcross generation, and the resulting BC1F1 populations wereselected for plant height and maturity [14]. This method was reported to be useful for both appliedbreeding and genetic dissection of yield and other complex agronomic traits using molecular genetictools [13].
A series of BCNAM populations were created in Mali using the pure line variety and successfulhybrid male parent “Lata3” as the recurrent parent. The variety “Lata3” was derived from a WestAfrican Guinea-race random-mating population [7] and identified through farmer-participatory varietytesting in Mali. Furthermore, several donor parents used to create these populations were usefulfor diversifying the hybrid male parent pool and increasing heterosis with the female pool basedGuinea-race materials from Mali and neighboring countries [15,16]. Therefore, these populationsrepresent promising materials for genetic diversification of West African Guinea-race sorghum forpure-line as well as hybrid variety development.
This study seeks to support sorghum breeding in West Africa with (1) genetic parameters needed fordesigning efficient breeding programs targeting yield improvement under low-P production conditionsand (2) information regarding the usefulness of specific Lata3-BCNAM backcross populations and theBCNAM method for increasing genetic variation for grain yield under contrasting P fertility conditions.
2. Materials and Methods
2.1. Plant Materials
Thirteen biparental backcross populations were developed using the same recurrent parent “Lata”and 13 different donor parents (Table 1). The recurrent parent was derived from a random-matingGuinea Population [7] and identified through farmer-participatory variety testing [16,17]. Lata3 was
Agronomy 2019, 9, 742 3 of 17
chosen as the recurrent parent because of its importance. It is cultivated as a novel intermediate-height,pure-line variety and used as the male parent for successful hybrids even though it has weaknessesincluding suboptimal glume opening and susceptibility to Striga. The 13 donor parents were chosento represent geographical and racial diversity from within the Guinea-race and other races (Table 1).They were also chosen to contribute traits that contribute to adaptation and farmer acceptance of newvarieties including tolerance to biotic (Striga, sorghum midge) and abiotic (soil phosphorus deficiency,aluminum toxicity) stresses, quality (grain vitreousness, stem sweetness), and panicle desirability(laxness, glume opening).
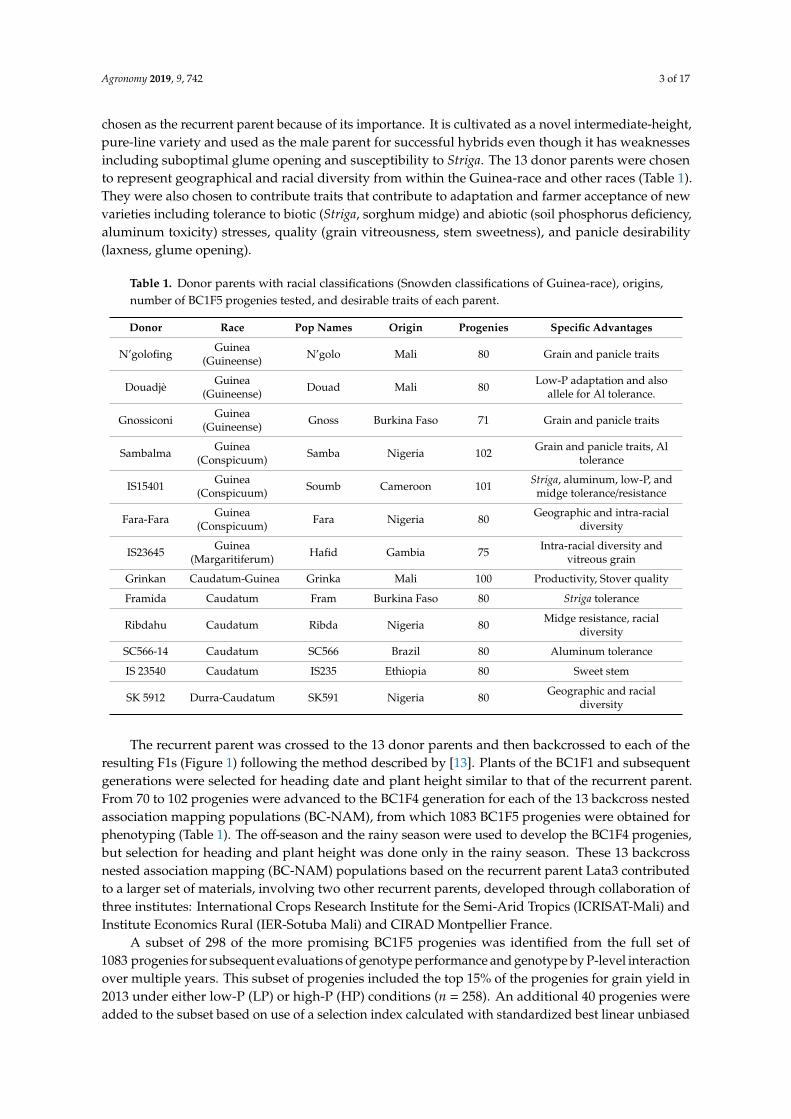
Table 1. Donor parents with racial classifications (Snowden classifications of Guinea-race), origins,number of BC1F5 progenies tested, and desirable traits of each parent.
Donor Race Pop Names Origin Progenies Specific Advantages
N’golofing Guinea(Guineense) N’golo Mali 80 Grain and panicle traits
Douadjè Guinea(Guineense) Douad Mali 80 Low-P adaptation and also
allele for Al tolerance.
Gnossiconi Guinea(Guineense) Gnoss Burkina Faso 71 Grain and panicle traits
Sambalma Guinea(Conspicuum) Samba Nigeria 102 Grain and panicle traits, Al
tolerance
IS15401 Guinea(Conspicuum) Soumb Cameroon 101 Striga, aluminum, low-P, and
midge tolerance/resistance
Fara-Fara Guinea(Conspicuum) Fara Nigeria 80 Geographic and intra-racial
diversity
IS23645 Guinea(Margaritiferum) Hafid Gambia 75 Intra-racial diversity and
vitreous grain
Grinkan Caudatum-Guinea Grinka Mali 100 Productivity, Stover quality
Framida Caudatum Fram Burkina Faso 80 Striga tolerance
Ribdahu Caudatum Ribda Nigeria 80 Midge resistance, racialdiversity
SC566-14 Caudatum SC566 Brazil 80 Aluminum tolerance
IS 23540 Caudatum IS235 Ethiopia 80 Sweet stem
SK 5912 Durra-Caudatum SK591 Nigeria 80 Geographic and racialdiversity
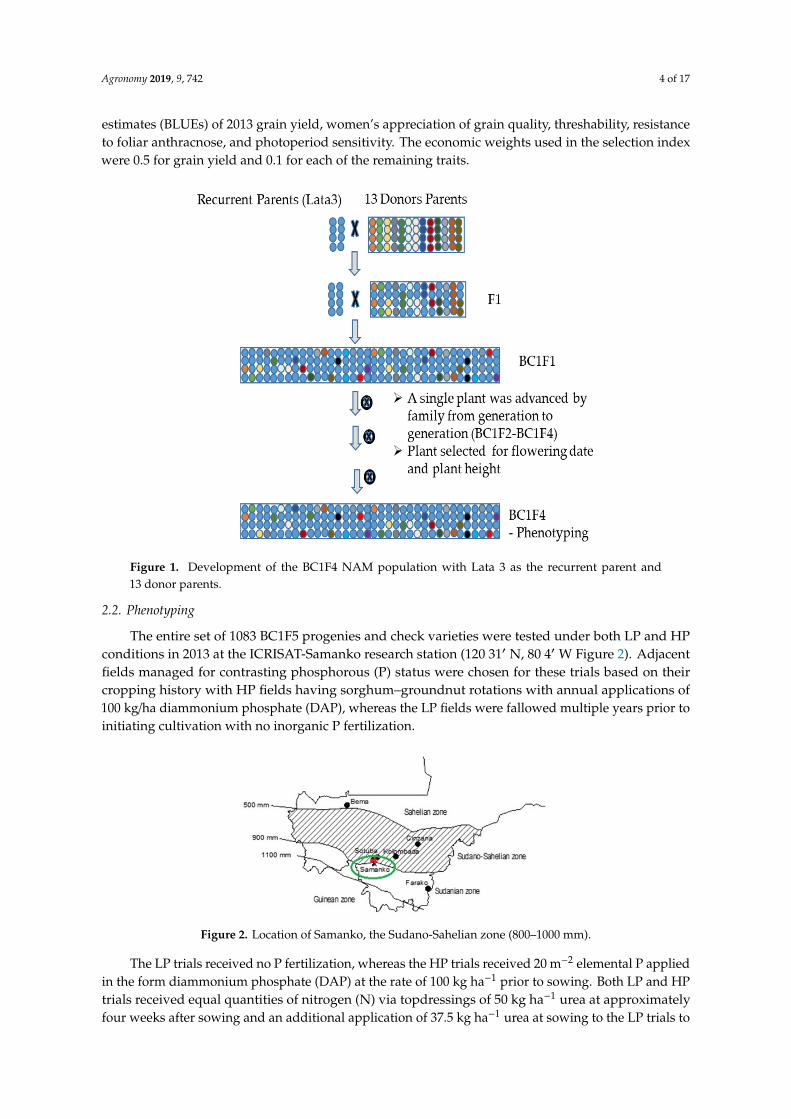
The recurrent parent was crossed to the 13 donor parents and then backcrossed to each of theresulting F1s (Figure 1) following the method described by [13]. Plants of the BC1F1 and subsequentgenerations were selected for heading date and plant height similar to that of the recurrent parent.From 70 to 102 progenies were advanced to the BC1F4 generation for each of the 13 backcross nestedassociation mapping populations (BC-NAM), from which 1083 BC1F5 progenies were obtained forphenotyping (Table 1). The off-season and the rainy season were used to develop the BC1F4 progenies,but selection for heading and plant height was done only in the rainy season. These 13 backcrossnested association mapping (BC-NAM) populations based on the recurrent parent Lata3 contributedto a larger set of materials, involving two other recurrent parents, developed through collaboration ofthree institutes: International Crops Research Institute for the Semi-Arid Tropics (ICRISAT-Mali) andInstitute Economics Rural (IER-Sotuba Mali) and CIRAD Montpellier France.
A subset of 298 of the more promising BC1F5 progenies was identified from the full set of1083 progenies for subsequent evaluations of genotype performance and genotype by P-level interactionover multiple years. This subset of progenies included the top 15% of the progenies for grain yield in2013 under either low-P (LP) or high-P (HP) conditions (n = 258). An additional 40 progenies wereadded to the subset based on use of a selection index calculated with standardized best linear unbiased
Agronomy 2019, 9, 742 4 of 17
estimates (BLUEs) of 2013 grain yield, women’s appreciation of grain quality, threshability, resistanceto foliar anthracnose, and photoperiod sensitivity. The economic weights used in the selection indexwere 0.5 for grain yield and 0.1 for each of the remaining traits.Agronomy 2019, 9, x FOR PEER REVIEW 2 of 17
Figure 1. Development of the BC1F4 NAM population with Lata 3 as the recurrent parent and 13 donor parents .
2.2. Phenotyping
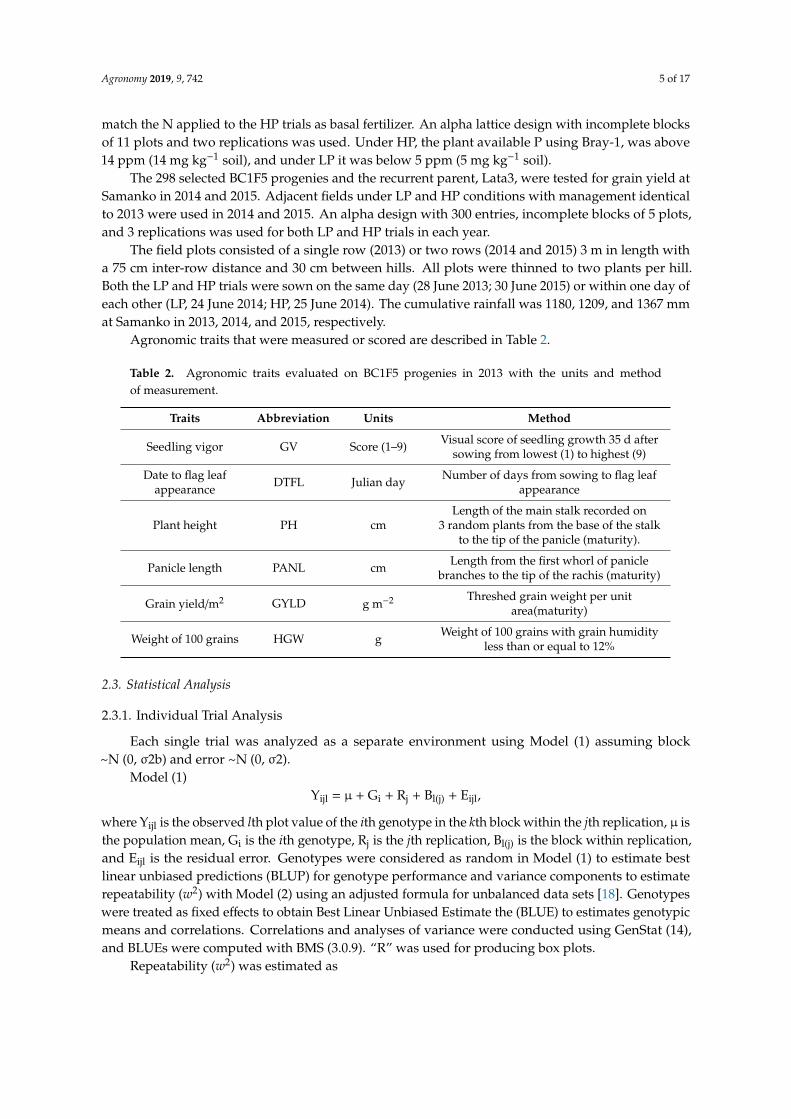
The entire set of 1083 BC1F5 progenies and check varieties were tested under both LP and HP conditions in 2013 at the ICRISAT-Samanko research station (120 31′ N, 80 4′ W Figure 2). Adjacent fields managed for contrasting phosphorous (P) status were chosen for these trials based on their cropping history with HP fields having sorghum–groundnut rotations with annual applications of 100 kg/ha diammonium phosphate (DAP), whereas the LP fields were fallowed multiple years prior to initiating cultivation with no inorganic P fertilization.
The LP trials received no P fertilization, whereas the HP trials received 20 m−2 elemental P applied in the form diammonium phosphate (DAP) at the rate of 100 kg ha−1 prior to sowing. Both LP and HP trials received equal quantities of nitrogen (N) via topdressings of 50 kg ha−1 urea at approximately four weeks after sowing and an additional application of 37.5 kg ha−1 urea at sowing to the LP trials to match the N applied to the HP trials as basal fertilizer. An alpha lattice design with incomplete blocks of 11 plots and two replications was used. Under HP, the plant available P using Bray-1, was above 14 ppm (14 mg kg−1 soil), and under LP it was below 5 ppm (5 mg kg−1 soil).
The 298 selected BC1F5 progenies and the recurrent parent, Lata3, were tested for grain yield at Samanko in 2014 and 2015. Adjacent fields under LP and HP conditions with management identical to 2013 were used in 2014 and 2015. An alpha design with 300 entries, incomplete blocks of 5 plots, and 3 replications was used for both LP and HP trials in each year.
The field plots consisted of a single row (2013) or two rows (2014 and 2015) 3 m in length with a 75 cm inter-row distance and 30 cm between hills. All plots were thinned to two plants per hill. Both the LP and HP trials were sown on the same day (28 June 2013; 30 June 2015) or within one day of each other (LP, 24 June 2014; HP, 25 June 2014). The cumulative rainfall was 1180, 1209, and 1367 mm at Samanko in 2013, 2014, and 2015, respectively.
Figure 1. Development of the BC1F4 NAM population with Lata 3 as the recurrent parent and13 donor parents.
2.2. Phenotyping
The entire set of 1083 BC1F5 progenies and check varieties were tested under both LP and HPconditions in 2013 at the ICRISAT-Samanko research station (120 31′ N, 80 4′ W Figure 2). Adjacentfields managed for contrasting phosphorous (P) status were chosen for these trials based on theircropping history with HP fields having sorghum–groundnut rotations with annual applications of100 kg/ha diammonium phosphate (DAP), whereas the LP fields were fallowed multiple years prior toinitiating cultivation with no inorganic P fertilization.
Agronomy 2019, 9, x FOR PEER REVIEW 2 of 17
Figure 2. Location of Samanko, the Sudano-Sahelian zone (800–1000 mm).
Agronomic traits that were measured or scored are described in Table 2.
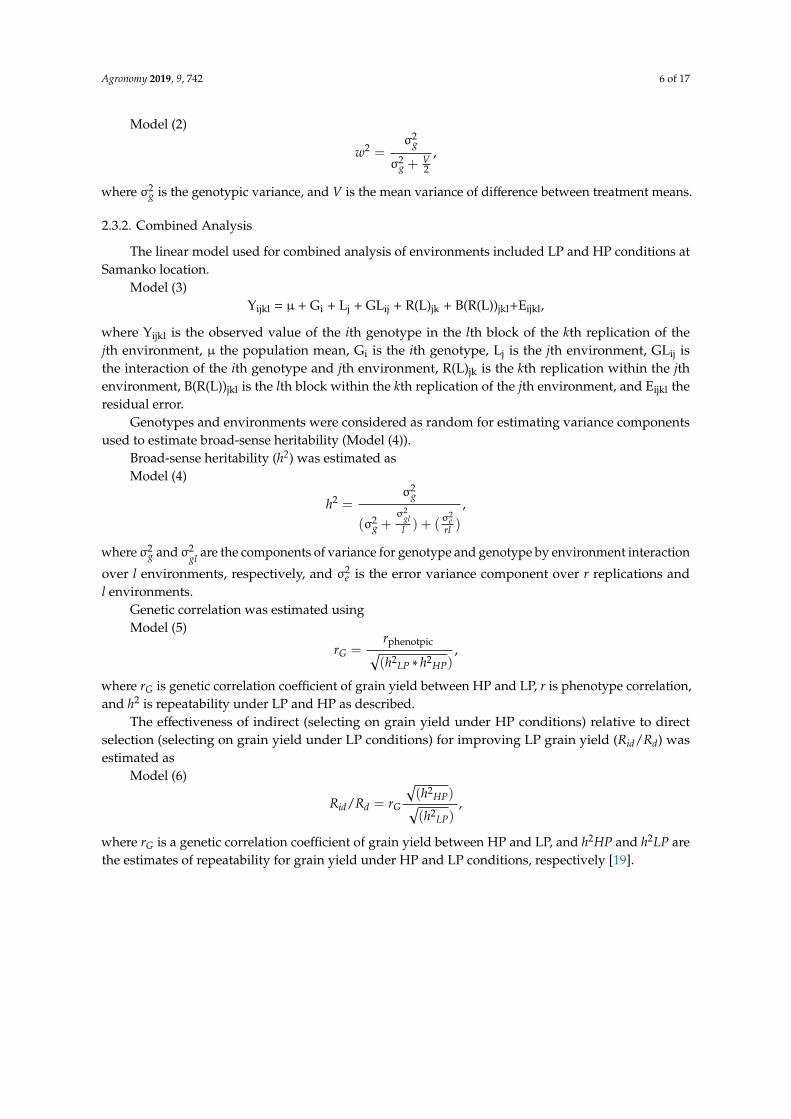
Table 2. Agronomic traits evaluated on BC1F5 progenies in 2013 with the units and method of measurement.
Traits Abbreviation Units Method
Seedling vigor GV Score (1–9) Visual score of seedling growth 35 d after sowing from lowest (1) to highest (9)
Date to flag leaf appearance DTFL Julian day Number of days from sowing to flag leaf appearance
Plant height PH cm Length of the main stalk recorded on 3
random plants from the base of the stalk to the tip of the panicle (maturity).
Panicle length PANL cm Length from the first whorl of panicle branches to the tip of the rachis (maturity)
Grain yield/m2 GYLD g m−2 Threshed grain weight per unit area(maturity)
Weight of 100 grains HGW g Weight of 100 grains with grain humidity less than or equal to 12%
2.3. Statistical Analysis
2.3.1. Individual Trial Analysis
Each single trial was analyzed as a separate environment using Model (1) assuming block ~N (0, σ2b) and error ~N (0, σ2).
Model (1)
Yijl = µ + Gi + Rj + Bl(j) + Eijl,
where Yijl is the observed lth plot value of the ith genotype in the kth block within the jth replication, µ is the population mean, Gi is the ith genotype, Rj is the jth replication, Bl(j) is the block within replication, and Eijl is the residual error. Genotypes were considered as random in Model (1) to estimate best linear unbiased predictions (BLUP) for genotype performance and variance components to estimate repeatability (𝑤 ) with Model (2) using an adjusted formula for unbalanced data sets [18]. Genotypes were treated as fixed effects to obtain Best Linear Unbiased Estimate the (BLUE) to estimates genotypic means and correlations. Correlations and analyses of variance were conducted using GenStat (14), and BLUEs were computed with BMS (3.0.9). “R” was used for producing box plots.
Repeatability (𝑤 ) was estimated as
Figure 2. Location of Samanko, the Sudano-Sahelian zone (800–1000 mm).
The LP trials received no P fertilization, whereas the HP trials received 20 m−2 elemental P appliedin the form diammonium phosphate (DAP) at the rate of 100 kg ha−1 prior to sowing. Both LP and HPtrials received equal quantities of nitrogen (N) via topdressings of 50 kg ha−1 urea at approximatelyfour weeks after sowing and an additional application of 37.5 kg ha−1 urea at sowing to the LP trials to
Agronomy 2019, 9, 742 5 of 17
match the N applied to the HP trials as basal fertilizer. An alpha lattice design with incomplete blocksof 11 plots and two replications was used. Under HP, the plant available P using Bray-1, was above14 ppm (14 mg kg−1 soil), and under LP it was below 5 ppm (5 mg kg−1 soil).
The 298 selected BC1F5 progenies and the recurrent parent, Lata3, were tested for grain yield atSamanko in 2014 and 2015. Adjacent fields under LP and HP conditions with management identicalto 2013 were used in 2014 and 2015. An alpha design with 300 entries, incomplete blocks of 5 plots,and 3 replications was used for both LP and HP trials in each year.
The field plots consisted of a single row (2013) or two rows (2014 and 2015) 3 m in length witha 75 cm inter-row distance and 30 cm between hills. All plots were thinned to two plants per hill.Both the LP and HP trials were sown on the same day (28 June 2013; 30 June 2015) or within one day ofeach other (LP, 24 June 2014; HP, 25 June 2014). The cumulative rainfall was 1180, 1209, and 1367 mmat Samanko in 2013, 2014, and 2015, respectively.
Agronomic traits that were measured or scored are described in Table 2.
Table 2. Agronomic traits evaluated on BC1F5 progenies in 2013 with the units and methodof measurement.
Traits Abbreviation Units Method
Seedling vigor GV Score (1–9) Visual score of seedling growth 35 d aftersowing from lowest (1) to highest (9)
Date to flag leafappearance DTFL Julian day Number of days from sowing to flag leaf
appearance
Plant height PH cmLength of the main stalk recorded on
3 random plants from the base of the stalkto the tip of the panicle (maturity).
Panicle length PANL cm Length from the first whorl of paniclebranches to the tip of the rachis (maturity)
Grain yield/m2 GYLD g m−2 Threshed grain weight per unitarea(maturity)
Weight of 100 grains HGW g Weight of 100 grains with grain humidityless than or equal to 12%
2.3. Statistical Analysis
2.3.1. Individual Trial Analysis
Each single trial was analyzed as a separate environment using Model (1) assuming block~N (0, σ2b) and error ~N (0, σ2).
Model (1)Yijl = µ + Gi + Rj + Bl(j) + Eijl,
where Yijl is the observed lth plot value of the ith genotype in the kth block within the jth replication, µ isthe population mean, Gi is the ith genotype, Rj is the jth replication, Bl(j) is the block within replication,and Eijl is the residual error. Genotypes were considered as random in Model (1) to estimate bestlinear unbiased predictions (BLUP) for genotype performance and variance components to estimaterepeatability (w2) with Model (2) using an adjusted formula for unbalanced data sets [18]. Genotypeswere treated as fixed effects to obtain Best Linear Unbiased Estimate the (BLUE) to estimates genotypicmeans and correlations. Correlations and analyses of variance were conducted using GenStat (14),and BLUEs were computed with BMS (3.0.9). “R” was used for producing box plots.
Repeatability (w2) was estimated as
Agronomy 2019, 9, 742 6 of 17
Model (2)
w2 =σ2
g
σ2g +
V2
,
where σ2g is the genotypic variance, and V is the mean variance of difference between treatment means.
2.3.2. Combined Analysis
The linear model used for combined analysis of environments included LP and HP conditions atSamanko location.
Model (3)Yijkl = µ + Gi + Lj + GLij + R(L)jk + B(R(L))jkl+Eijkl,
where Yijkl is the observed value of the ith genotype in the lth block of the kth replication of thejth environment, µ the population mean, Gi is the ith genotype, Lj is the jth environment, GLij isthe interaction of the ith genotype and jth environment, R(L)jk is the kth replication within the jthenvironment, B(R(L))jkl is the lth block within the kth replication of the jth environment, and Eijkl theresidual error.
Genotypes and environments were considered as random for estimating variance componentsused to estimate broad-sense heritability (Model (4)).
Broad-sense heritability (h2) was estimated asModel (4)
h2 =σ2
g
(σ2g +
σ2gll ) + (
σ2e
rl )
,
where σ2g and σ2
gl are the components of variance for genotype and genotype by environment interaction
over l environments, respectively, and σ2e is the error variance component over r replications and
l environments.Genetic correlation was estimated usingModel (5)
rG =rphenotpic√(h2LP ∗ h2HP)
,
where rG is genetic correlation coefficient of grain yield between HP and LP, r is phenotype correlation,and h2 is repeatability under LP and HP as described.
The effectiveness of indirect (selecting on grain yield under HP conditions) relative to directselection (selecting on grain yield under LP conditions) for improving LP grain yield (Rid/Rd) wasestimated as
Model (6)
Rid/Rd = rG
√(h2HP)√(h2LP)
,
where rG is a genetic correlation coefficient of grain yield between HP and LP, and h2HP and h2LP arethe estimates of repeatability for grain yield under HP and LP conditions, respectively [19].
Agronomy 2019, 9, 742 7 of 17
3. Results
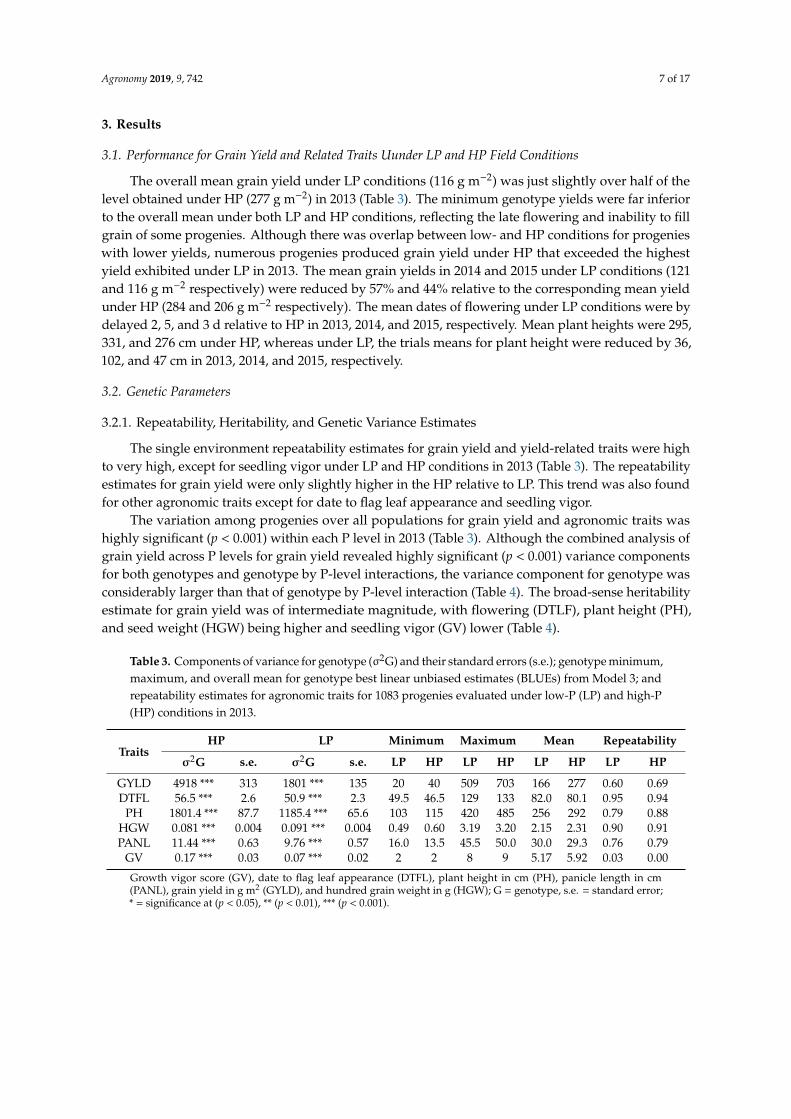
3.1. Performance for Grain Yield and Related Traits Uunder LP and HP Field Conditions
The overall mean grain yield under LP conditions (116 g m−2) was just slightly over half of thelevel obtained under HP (277 g m−2) in 2013 (Table 3). The minimum genotype yields were far inferiorto the overall mean under both LP and HP conditions, reflecting the late flowering and inability to fillgrain of some progenies. Although there was overlap between low- and HP conditions for progenieswith lower yields, numerous progenies produced grain yield under HP that exceeded the highestyield exhibited under LP in 2013. The mean grain yields in 2014 and 2015 under LP conditions (121and 116 g m−2 respectively) were reduced by 57% and 44% relative to the corresponding mean yieldunder HP (284 and 206 g m−2 respectively). The mean dates of flowering under LP conditions were bydelayed 2, 5, and 3 d relative to HP in 2013, 2014, and 2015, respectively. Mean plant heights were 295,331, and 276 cm under HP, whereas under LP, the trials means for plant height were reduced by 36,102, and 47 cm in 2013, 2014, and 2015, respectively.
3.2. Genetic Parameters
3.2.1. Repeatability, Heritability, and Genetic Variance Estimates
The single environment repeatability estimates for grain yield and yield-related traits were highto very high, except for seedling vigor under LP and HP conditions in 2013 (Table 3). The repeatabilityestimates for grain yield were only slightly higher in the HP relative to LP. This trend was also foundfor other agronomic traits except for date to flag leaf appearance and seedling vigor.
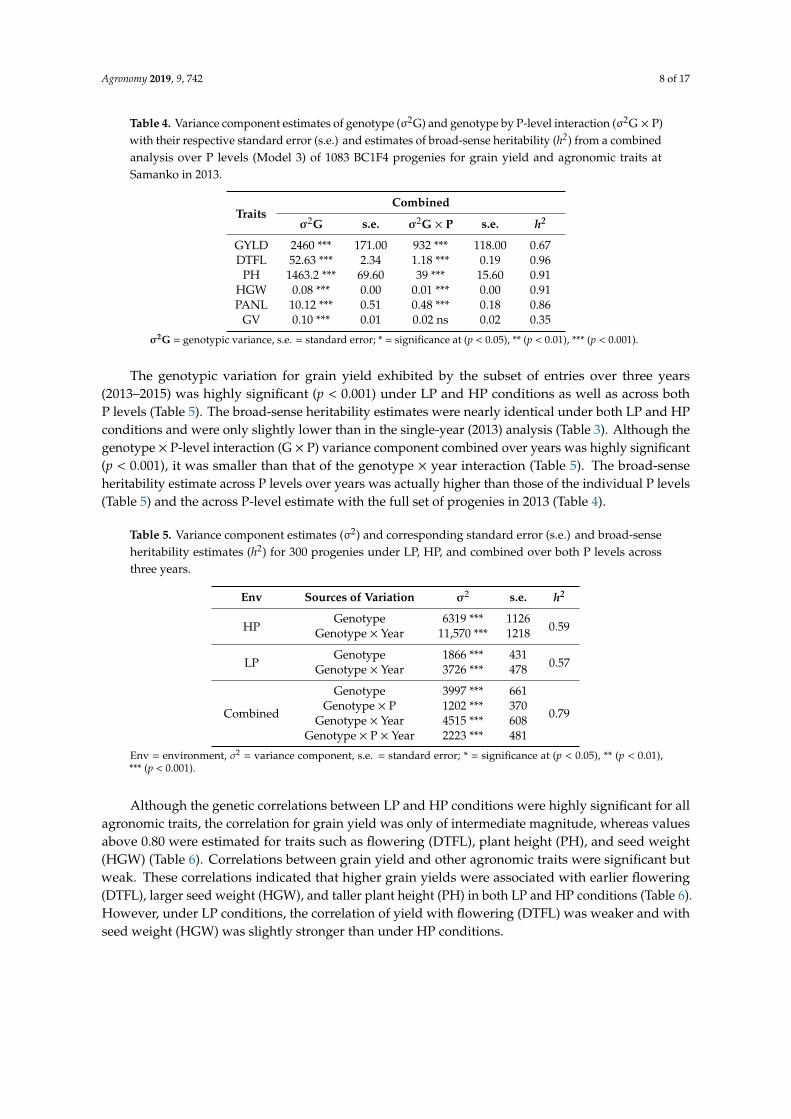
The variation among progenies over all populations for grain yield and agronomic traits washighly significant (p < 0.001) within each P level in 2013 (Table 3). Although the combined analysis ofgrain yield across P levels for grain yield revealed highly significant (p < 0.001) variance componentsfor both genotypes and genotype by P-level interactions, the variance component for genotype wasconsiderably larger than that of genotype by P-level interaction (Table 4). The broad-sense heritabilityestimate for grain yield was of intermediate magnitude, with flowering (DTLF), plant height (PH),and seed weight (HGW) being higher and seedling vigor (GV) lower (Table 4).
Table 3. Components of variance for genotype (σ2G) and their standard errors (s.e.); genotype minimum,maximum, and overall mean for genotype best linear unbiased estimates (BLUEs) from Model 3; andrepeatability estimates for agronomic traits for 1083 progenies evaluated under low-P (LP) and high-P(HP) conditions in 2013.
TraitsHP LP Minimum Maximum Mean Repeatability
σ2G s.e. σ2G s.e. LP HP LP HP LP HP LP HP
GYLD 4918 *** 313 1801 *** 135 20 40 509 703 166 277 0.60 0.69DTFL 56.5 *** 2.6 50.9 *** 2.3 49.5 46.5 129 133 82.0 80.1 0.95 0.94
PH 1801.4 *** 87.7 1185.4 *** 65.6 103 115 420 485 256 292 0.79 0.88HGW 0.081 *** 0.004 0.091 *** 0.004 0.49 0.60 3.19 3.20 2.15 2.31 0.90 0.91PANL 11.44 *** 0.63 9.76 *** 0.57 16.0 13.5 45.5 50.0 30.0 29.3 0.76 0.79
GV 0.17 *** 0.03 0.07 *** 0.02 2 2 8 9 5.17 5.92 0.03 0.00
Growth vigor score (GV), date to flag leaf appearance (DTFL), plant height in cm (PH), panicle length in cm(PANL), grain yield in g m2 (GYLD), and hundred grain weight in g (HGW); G = genotype, s.e. = standard error;* = significance at (p < 0.05), ** (p < 0.01), *** (p < 0.001).
Agronomy 2019, 9, 742 8 of 17
Table 4. Variance component estimates of genotype (σ2G) and genotype by P-level interaction (σ2G × P)with their respective standard error (s.e.) and estimates of broad-sense heritability (h2) from a combinedanalysis over P levels (Model 3) of 1083 BC1F4 progenies for grain yield and agronomic traits atSamanko in 2013.
TraitsCombined
σ2G s.e. σ2G × P s.e. h2
GYLD 2460 *** 171.00 932 *** 118.00 0.67DTFL 52.63 *** 2.34 1.18 *** 0.19 0.96
PH 1463.2 *** 69.60 39 *** 15.60 0.91HGW 0.08 *** 0.00 0.01 *** 0.00 0.91PANL 10.12 *** 0.51 0.48 *** 0.18 0.86
GV 0.10 *** 0.01 0.02 ns 0.02 0.35
σ2G = genotypic variance, s.e. = standard error; * = significance at (p < 0.05), ** (p < 0.01), *** (p < 0.001).
The genotypic variation for grain yield exhibited by the subset of entries over three years(2013–2015) was highly significant (p < 0.001) under LP and HP conditions as well as across bothP levels (Table 5). The broad-sense heritability estimates were nearly identical under both LP and HPconditions and were only slightly lower than in the single-year (2013) analysis (Table 3). Although thegenotype × P-level interaction (G × P) variance component combined over years was highly significant(p < 0.001), it was smaller than that of the genotype × year interaction (Table 5). The broad-senseheritability estimate across P levels over years was actually higher than those of the individual P levels(Table 5) and the across P-level estimate with the full set of progenies in 2013 (Table 4).
Table 5. Variance component estimates (σ2) and corresponding standard error (s.e.) and broad-senseheritability estimates (h2) for 300 progenies under LP, HP, and combined over both P levels acrossthree years.
Env Sources of Variation σ2 s.e. h2
HPGenotype 6319 *** 1126
0.59Genotype × Year 11,570 *** 1218
LPGenotype 1866 *** 431
0.57Genotype × Year 3726 *** 478
Combined
Genotype 3997 *** 661
0.79Genotype × P 1202 *** 370
Genotype × Year 4515 *** 608Genotype × P × Year 2223 *** 481
Env = environment, σ2 = variance component, s.e. = standard error; * = significance at (p < 0.05), ** (p < 0.01),*** (p < 0.001).
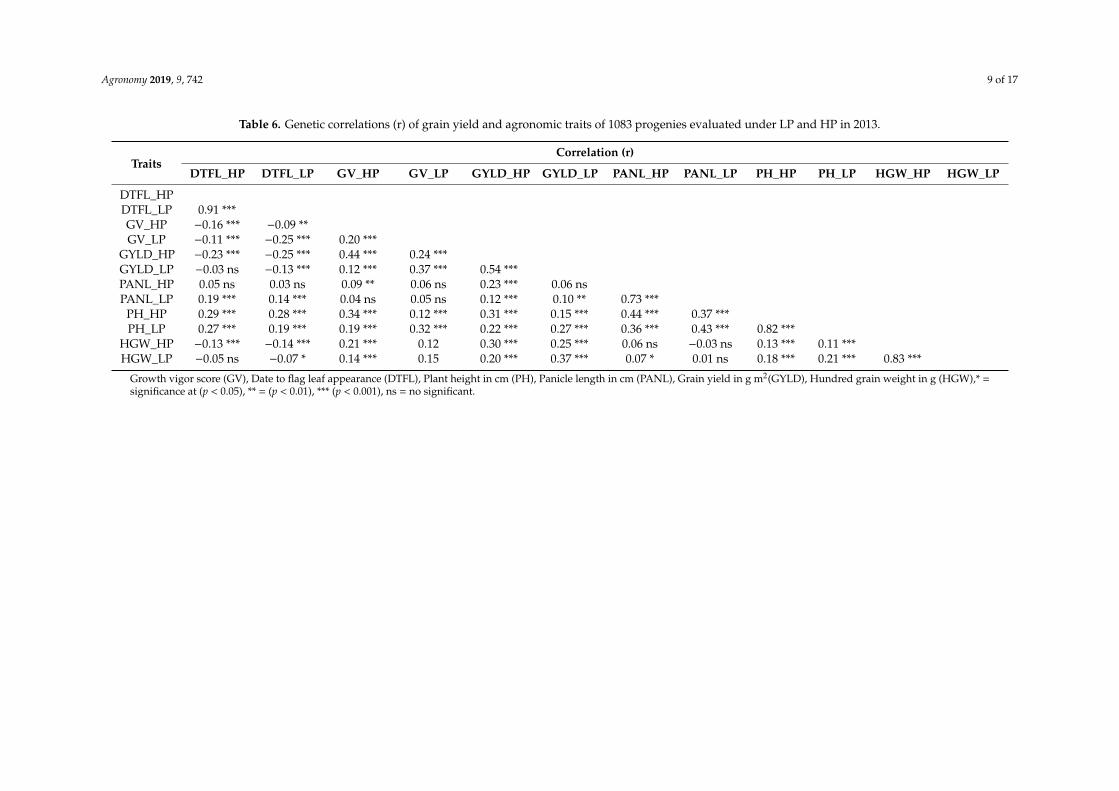
Although the genetic correlations between LP and HP conditions were highly significant for allagronomic traits, the correlation for grain yield was only of intermediate magnitude, whereas valuesabove 0.80 were estimated for traits such as flowering (DTFL), plant height (PH), and seed weight(HGW) (Table 6). Correlations between grain yield and other agronomic traits were significant butweak. These correlations indicated that higher grain yields were associated with earlier flowering(DTFL), larger seed weight (HGW), and taller plant height (PH) in both LP and HP conditions (Table 6).However, under LP conditions, the correlation of yield with flowering (DTFL) was weaker and withseed weight (HGW) was slightly stronger than under HP conditions.
Agronomy 2019, 9, 742 9 of 17
Table 6. Genetic correlations (r) of grain yield and agronomic traits of 1083 progenies evaluated under LP and HP in 2013.
TraitsCorrelation (r)
DTFL_HP DTFL_LP GV_HP GV_LP GYLD_HP GYLD_LP PANL_HP PANL_LP PH_HP PH_LP HGW_HP HGW_LP
DTFL_HPDTFL_LP 0.91 ***GV_HP −0.16 *** −0.09 **GV_LP −0.11 *** −0.25 *** 0.20 ***
GYLD_HP −0.23 *** −0.25 *** 0.44 *** 0.24 ***GYLD_LP −0.03 ns −0.13 *** 0.12 *** 0.37 *** 0.54 ***PANL_HP 0.05 ns 0.03 ns 0.09 ** 0.06 ns 0.23 *** 0.06 nsPANL_LP 0.19 *** 0.14 *** 0.04 ns 0.05 ns 0.12 *** 0.10 ** 0.73 ***
PH_HP 0.29 *** 0.28 *** 0.34 *** 0.12 *** 0.31 *** 0.15 *** 0.44 *** 0.37 ***PH_LP 0.27 *** 0.19 *** 0.19 *** 0.32 *** 0.22 *** 0.27 *** 0.36 *** 0.43 *** 0.82 ***
HGW_HP −0.13 *** −0.14 *** 0.21 *** 0.12 0.30 *** 0.25 *** 0.06 ns −0.03 ns 0.13 *** 0.11 ***HGW_LP −0.05 ns −0.07 * 0.14 *** 0.15 0.20 *** 0.37 *** 0.07 * 0.01 ns 0.18 *** 0.21 *** 0.83 ***
Growth vigor score (GV), Date to flag leaf appearance (DTFL), Plant height in cm (PH), Panicle length in cm (PANL), Grain yield in g m2(GYLD), Hundred grain weight in g (HGW),* =significance at (p < 0.05), ** = (p < 0.01), *** (p < 0.001), ns = no significant.
Agronomy 2019, 9, 742 10 of 17
3.2.2. Predicted Responses to Direct and Indirect Selection for Grain Yield Under P-Limited Conditions
The genetic correlation for grain yield between LP and HP conditions was 0.81, which, althoughsomewhat elevated, was considerably less than 1.00. The estimates of Rid/Rd ratios (Model 6) for thepredicted efficiency of indirect (high P) versus direct (low P) selection for grain yield under P-limitedconditions were lower than 1.00 in all cases, being 0.87, 0.67, and 0.79 for the 1083 BC1F5 progenies in2013 and the 298 BC1F5 progenies in 2014 and 2015, respectively.
The progeny mean yields showed very large rank changes between the LP and HP conditions overall 1083 progenies in 2013 and over the 298 selected progenies tested in 2014 and 2015 (SupplementaryMaterials) Examining the top yielding 10% of progenies in 2013 revealed that only 44 of the 109 (40.4%)top yielding progenies within P-level were common over both LP and HP conditions in 2013. Similarly,only 8 of the 29 (27.6%) top yielding progenies were common under both LP and HP conditions withcombined results over 2014 and 2015 (Supplementary Materials)
3.3. Performance of Specific Populations
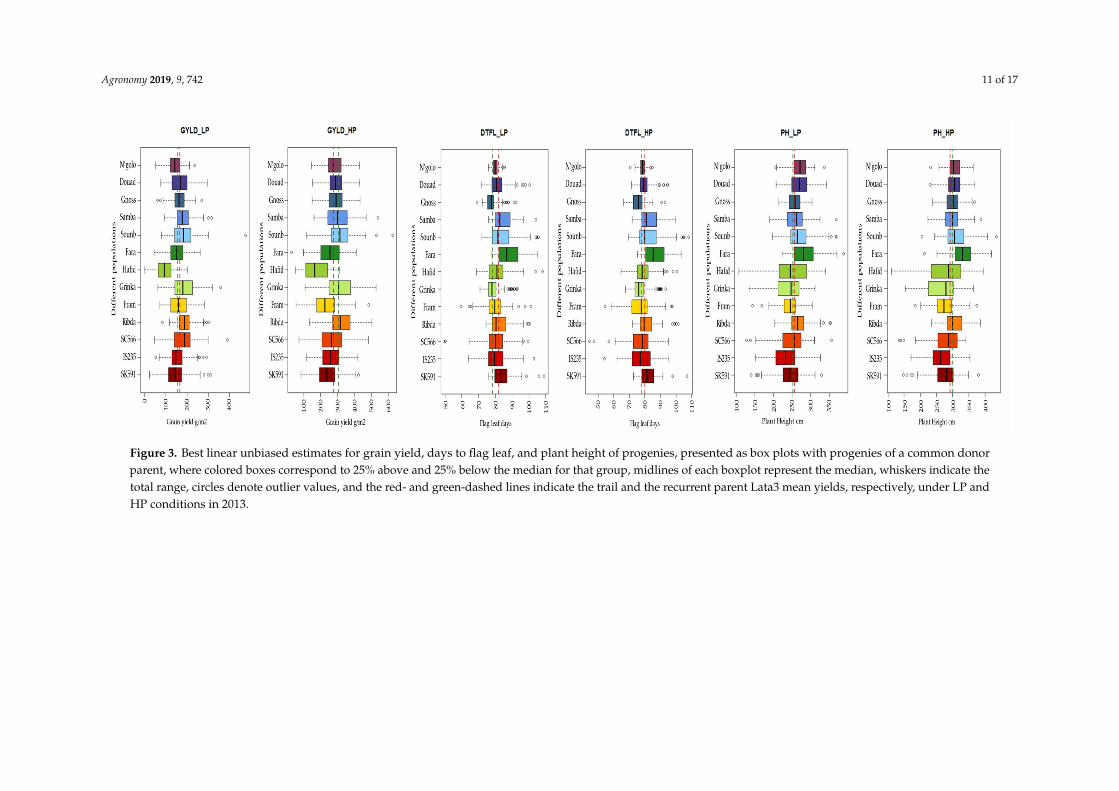
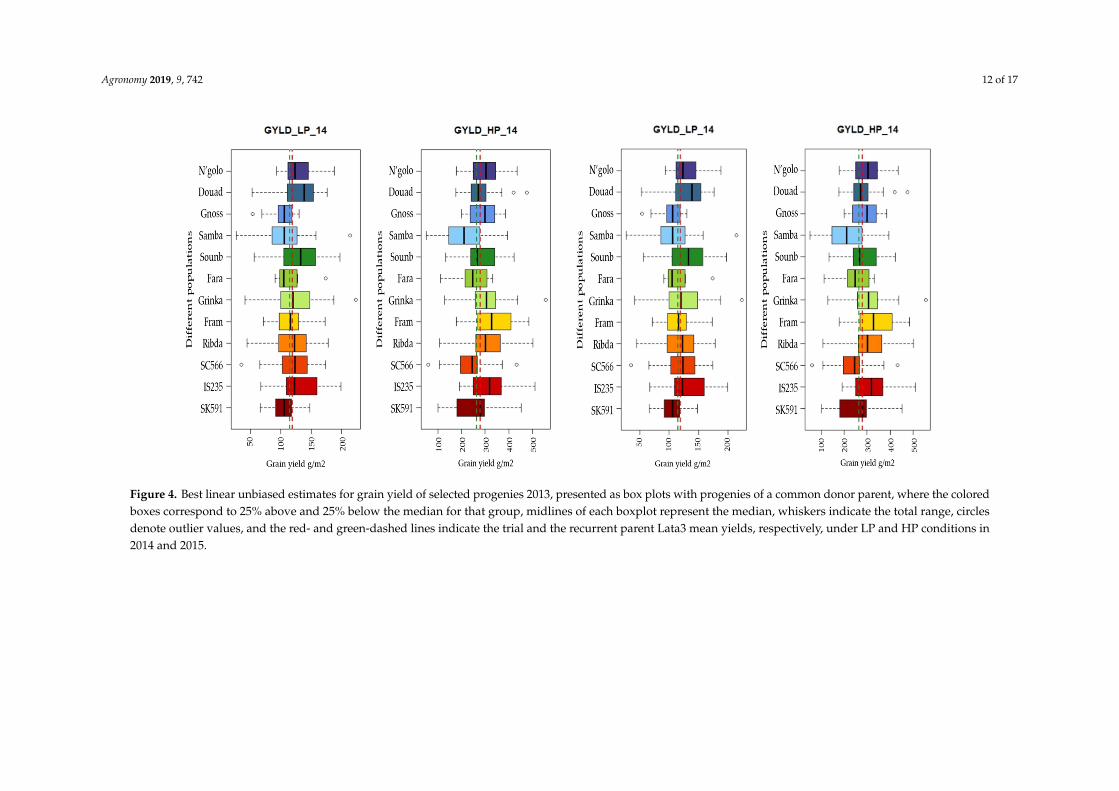
Large variations among progenies developed from a common donor for grain yield, flag leafappearance, and plant height in 2013 (Figure 3). The selected subset of 298 progenies also showedlarge variations for grain yield within each population under both LP and HP conditions in 2014 and2015 (Figure 4).
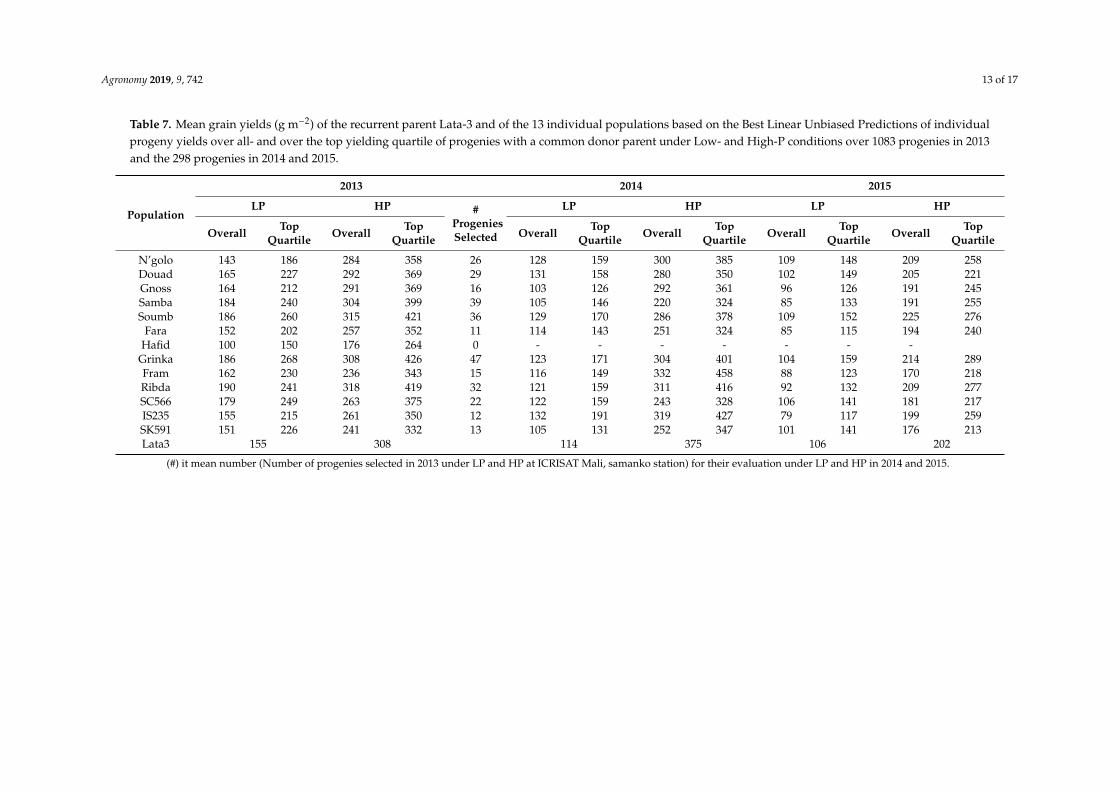
The population means for grain yield differed over a nearly two-fold range in the LP as well asthe HP environments of 2013 (Table 7). Whereas 8 of the 13 populations had mean yields superiorto the recurrent parent Lata3 under LP, only two showed numerically superior mean yields underHP. The four populations with the highest mean yields in both LP and HP in 2013 had donor parentsof Guinea- (Samba, Soumb) and Caudatum-race (Ribda) from over 1000 km east of Mali (Nigeriaand Cameroon) and a Guinea-Caudatum inter-racial line bred in Mali (Grinka). The populationswith Guinea-race donors from Mali (N’golo and Douad) or neighboring Burkina Faso (Gnoss) hadonly intermediate yield levels. The population with the lowest yield performance (Hafid) had aGuinea-magaretiferum variety as donor.
Examining the yields of the subset of progenies evaluated over two years revealed fivepopulations with means superior to the recurrent parent (Lata3) under LP but none under HP(Table 7). The populations with superior mean yields under LP included two populations that alsoexhibited superior yields in 2013 (Grinka and Soumb) and three other populations (N’golo and Douadwith Malian Guinea-race donors and SC566 with a Caudatum-race donor) (Table 7).
The progenies among the top 25% for yield in each population were generally all superior tothe recurrent parent under both LP and HP conditions in 2013 (Figure 3) as well as in 2014 and 2015(Figure 4). Only progenies in the top quartile of the population Hafid did not exceed the recurrentparent (Figure 3), with the top-quartile mean being numerically inferior under both LP and HPconditions (Table 7). Under LP conditions, two populations (Grinka and Soumb) had the highest meanfor the top quartile progenies in 2013 as well as combined over 2014 and 2015, with a third population(SC566) ranked third and fifth, respectively (Table 7). The five top-ranking populations for top-quartileprogenies means under HP were identical to those under LP in 2013, but in the multiyear evaluation,they included only two of the five populations (Soumb and N’golo) (Table 7).
Agronomy 2019, 9, 742 11 of 17Agronomy 2019, 9, x FOR PEER REVIEW 12 of 17
Agronomy 2019, 9, x; doi: FOR PEER REVIEW www.mdpi.com/journal/agronomy
Figure 3. Best linear unbiased estimates for grain yield, days to flag leaf, and plant height of progenies, presented as box plots with progenies of a common donor parent, where colored boxes correspond to 25% above and 25% below the median for that group, midlines of each boxplot represent the median, whiskers indicate the total range, circles denote outlier values, and the red- and green-dashed lines indicate the trail and the recurrent parent Lata3 mean yields, respectively, under LP and HP conditions in 2013.
Figure 3. Best linear unbiased estimates for grain yield, days to flag leaf, and plant height of progenies, presented as box plots with progenies of a common donorparent, where colored boxes correspond to 25% above and 25% below the median for that group, midlines of each boxplot represent the median, whiskers indicate thetotal range, circles denote outlier values, and the red- and green-dashed lines indicate the trail and the recurrent parent Lata3 mean yields, respectively, under LP andHP conditions in 2013.
Agronomy 2019, 9, 742 12 of 17Agronomy 2019, 9, x FOR PEER REVIEW 2 of 17
Figure 4. Best linear unbiased estimates for grain yield of selected progenies 2013, presented as box plots with progenies of a common donor parent, where the colored boxes correspond to 25% above and 25% below the median for that group, midlines of each boxplot represent the median, whiskers indicate the total range, circles denote outlier values, and the red- and green-dashed lines indicate the trial and the recurrent parent Lata3 mean yields, respectively, under LP and HP conditions in 2014 and 2015.
Figure 4. Best linear unbiased estimates for grain yield of selected progenies 2013, presented as box plots with progenies of a common donor parent, where the coloredboxes correspond to 25% above and 25% below the median for that group, midlines of each boxplot represent the median, whiskers indicate the total range, circlesdenote outlier values, and the red- and green-dashed lines indicate the trial and the recurrent parent Lata3 mean yields, respectively, under LP and HP conditions in2014 and 2015.
Agronomy 2019, 9, 742 13 of 17
Table 7. Mean grain yields (g m−2) of the recurrent parent Lata-3 and of the 13 individual populations based on the Best Linear Unbiased Predictions of individualprogeny yields over all- and over the top yielding quartile of progenies with a common donor parent under Low- and High-P conditions over 1083 progenies in 2013and the 298 progenies in 2014 and 2015.
Population
2013 2014 2015
LP HP #ProgeniesSelected
LP HP LP HP
Overall TopQuartile Overall Top
Quartile Overall TopQuartile Overall Top
Quartile Overall TopQuartile Overall Top
Quartile
N’golo 143 186 284 358 26 128 159 300 385 109 148 209 258Douad 165 227 292 369 29 131 158 280 350 102 149 205 221Gnoss 164 212 291 369 16 103 126 292 361 96 126 191 245Samba 184 240 304 399 39 105 146 220 324 85 133 191 255Soumb 186 260 315 421 36 129 170 286 378 109 152 225 276
Fara 152 202 257 352 11 114 143 251 324 85 115 194 240Hafid 100 150 176 264 0 - - - - - - -
Grinka 186 268 308 426 47 123 171 304 401 104 159 214 289Fram 162 230 236 343 15 116 149 332 458 88 123 170 218Ribda 190 241 318 419 32 121 159 311 416 92 132 209 277SC566 179 249 263 375 22 122 159 243 328 106 141 181 217IS235 155 215 261 350 12 132 191 319 427 79 117 199 259SK591 151 226 241 332 13 105 131 252 347 101 141 176 213Lata3 155 308 114 375 106 202
(#) it mean number (Number of progenies selected in 2013 under LP and HP at ICRISAT Mali, samanko station) for their evaluation under LP and HP in 2014 and 2015.
Agronomy 2019, 9, 742 14 of 17
4. Discussion
The considerable and significant reduction of grain yield and plant height under LP, and the delayin heading under LP conditions relative to HP (Table 3), suggest that the field conditions in this studywere appropriate for investigating selection strategies for genetic improvement of grain yield undercontrasting P conditions. Such yield reductions due to LP have been previously reported by numerousother studies [6,8,20–24]. Furthermore, the acceptable repeatability estimates for grain yield in both LPand HP conditions (Table 3) give confidence in the results obtained in this study.
4.1. Genetic Parameters
The significant genetic variation and the acceptable and nearly identical broad-sense heritabilitiesfor grain yield under both LP and HP conditions, estimated over multiple years (Table 5), suggestthat selection for grain yield among these backcross progenies should be effective under either LP orHP levels. Furthermore, varietal development efforts targeting P-deficient production environmentsis expected to make greater genetic gains through direct selection for yield under LP conditions,as indicated by the Rid/Rd ratios lower than 1.00. Leiser et al., 2012, came to the same conclusion,reporting quite similar Rid/Rd ratios from a panel of West African sorghum varieties evaluated underLP and HP conditions over multiple years. Studies on selection for grain yield under contrastingnitrogen (N) levels also reported direct selection under low N to be more effective when targetingproduction systems with low soil N [19,25].
4.2. Usefulness of BCNAM Populations
The recurrent parent (Lata3) used to create the backcross progenies evaluated in this study isthe male parent of high-yielding Guinea-race sorghum hybrids [26,27], including “Pablo”, one of themost widely cultivated hybrids in Mali [26]. The BCNAM populations in this study thus representpromising material for diversifying the male parent pool, as their genetic backgrounds are expected tobe approximately 75% from Lata3 and 25% derived from the donor parents, which are very diverseand most identified to be restorer lines. The yield superiorities under LP conditions of several of theseBCNAM populations and individual backcross progenies relative to Lata3 (Table 7 and Figures 3 and 4)thus indicates considerable potential for making genetic gains for, per se, yield performance of new maleparents targeting the predominant low-input production systems of Mali and West Africa. The reportthat male parent yield performance under LP conditions was positively related to sorghum hybridyield in P-deficient environments in Mali (correlations of 0.41 to 0.85, average of 0.59) [15] highlightsthe potential contribution these high-yielding BCNAM progenies could make to hybrid developmentfor P-limited environments.
The two BCNAM populations with the highest yielding backcross progenies under LP conditionsacross multiple years (Grinka and Soumb) (Table 7) had donor parents (Grinkan and IS 15401,respectively) that were previously identified to be among the top yielding entries across a panelof 70 West African varieties, with IS 15401 exhibiting specific adaptation to LP environments andGrinkan among the top-ranked varieties for yield under both LP and HP conditions (Leiser et al. 2012).The superior yields of progenies from both the Soumb and Grinka populations under HP as well asLP conditions (Table 7) suggests that genes for productivity other than or in addition to those foradaptation to LP may have been contributed by these donors.
A combining ability study revealed that male parents with introgression of IS 15401 or Ribdahuexhibited a superior general combining ability (GCA) when crossed onto newly developed Malianseed parents (Kante et al. 2019). This study observed a trend of higher GCA associated with maleparents having introgressed germplasm from the more humid sorghum growing regions of Cameroonand Nigeria. Our study also showed that introgression of some sorghum accessions from that regioncan create useful variation for grain yield under LP conditions, as exhibited by the Soumb, Ribda,
Agronomy 2019, 9, 742 15 of 17
and Samba populations, whereas other donors did not, with the SK591 and Fara populations havinginferior yields (Table 7).
Several of the donor parents used to create the BCNAM populations (IS 15401, Ribdahu, Sambalma)are actually late maturing and unadapted to the major sorghum belt of Mali, originating in more humidregions over 1000 km east of Mali. Despite the poor adaptation of many our BCNAM donors to theMalian environments, the yield superiority of many BCIF5 progenies relative to the elite recurrentparent and the large variation for yield indicates that useful genetic variation can be obtained throughthe BCNAM approach used here. This approach, based on use of an elite recurrent parent, crossing toa range of diverse donors, and conducting a single backcross to the elite parent and advancement ofmany BC1F1 derivatives with only limited early generation progeny culling for critical adaptationtraits (such as maturity), was pioneered for diversifying sorghum breeding material in Australia(Jordan et al. 2011).
5. Implications and Conclusions
Farmers in West Africa predominantly cultivate sorghum under low-fertility and, particularly,LP conditions [3,5,6,9]. For sorghum breeders to maximize genetic gains for grain yield under LPconditions in West Africa, direct testing and selection under LP conditions was shown to be feasibleand necessary by this study and others [6]. Sorghum breeding programs in West Africa will, therefore,need to manage certain research station fields for LP fertility that better represent farmers’ soilconditions or work with farmers to conduct certain activities directly in farmers’ LP fields. Bothapproaches are feasible, as was shown by results of this study and that of [3]. The diversification ofMalian breeding materials using the BCNAM approach for introgressing diverse germplasm, includingsorghums from the more humid regions of Nigeria and Cameroon, can create useful genetic variationfor improving grain yield under LP conditions. The materials generated in this study appear to behighly promising for diversifying the male parent pool for sorghum hybrids in Mali. Nevertheless,the genetic parameters estimated here show that use of conventional selection methods should befeasible for these traits under both LP and HP conditions.
Supplementary Materials: The following are available online at http://www.mdpi.com/2073-4395/9/11/742/s1.
Author Contributions: Conceptualization, C.D., E.W. and H.F.W.R.; methodology, C.D. and W.L.; validation,I.S. and C.D. and B.N.; formal analysis, C.D. and W.L.; investigation, C.D., M.S.; and B.S.; data curation, C.D.and I.S.; writing—original draft preparation, C.D.; writing—review and editing, H.F.W.R. and V.G. and A.T.;supervision, A.T. and E.Y.D. and D.K.D.; project administration, B.N. and E.W.; funding acquisition, E.W. Pleaseturn to the CRediT taxonomy for the term explanation. Authorship must be limited to those who have contributedsubstantially to the work reported.
Funding: This research received no external funding.
Acknowledgments: The authors thank the technical staff of the sorghum-breeding program in ICRISAT andIER-Mali for their contribution in phenotyping. We thanks the team of West Africa Center for Crop Improvement(WACCI) and AGRA project funded by the foundation bill and Melina gate for their participation. This work wasundertaken as a part of the CGIAR Research Program on Dryland Cereals.
Conflicts of Interest: The authors declare there to be no conflict of interest.
References
1. FAO. FAOSTAT. 2017. Available online: http://www.fao.org/faostat/en/#data/QC (accessed on17 December 2017).
2. Breman, H. Amélioration de la fertilité des sols en Afrique de l’Ouest: Contraintes et perspectives. In SoilFertility Management in West African Land Use Systems; Renard, G., Neef, A., Becker, K., Oppen, M.V., Eds.;Margraf Verlag: Weikersheim, Germany, 1998; pp. 7–20.
3. Rattunde, H.F.W. Farmer Participatory Early-Generation Yield Testing of Sorghum in West Africa: Possibilitiesto Optimize Genetic Gains for Yield in Farmers’ Fields. Crop Sci. 2016, 56, 2493. [CrossRef]
Agronomy 2019, 9, 742 16 of 17
4. vom Brocke, K.; Trouche, G.; Weltzien, E.; Barro-Kondombo, C.P.; Gozé, E.; Chantereau, J. Participatoryvariety development for sorghum in Burkina Faso: Farmers’ selection and farmers’ criteria. Field Crops Res.2010, 119, 183–194. [CrossRef]
5. Buerkert, A.; Bationo, A.; Piepho, H.-P. Efficient phosphorus application strategies for increased cropproduction in sub-Saharan West Africa. Field Crops Res. 2001, 72, 1–15. [CrossRef]
6. Leiser, W.L. Selection Strategy for Sorghum Targeting Phosphorus-limited Environments in West Africa:Analysis of Multi-environment Experiments. Crop Sci. 2012, 52, 2517. [CrossRef]
7. Weltzien, E.; Rattunde, H.F.W.; van Mourik, T.A.; Ajeigbe, H.A. Sorghum cultivation and improvement inWest and Central Africa. In Burleigh Dodds Series in Agricultural Science; Rooney, W., Ed.; Burleigh DoddsScience Publishing: Cambridge, UK, 2018; pp. 217–240.
8. Leiser, W.L. Phosphorous Efficiency and Tolerance Traits for Selection of Sorghum for Performance inPhosphorous-Limited Environments. Crop Sci. 2015, 55, 1152. [CrossRef]
9. Leiser, W.L.; Weltzien-Rattunde, H.F.; Weltzien-Rattunde, E.; Haussmann, B.I.G. Sorghum tolerance tolow-phosphorus soil conditions. In Burleigh Dodds Series in Agricultural Science; Texas A&M University, USA,Rooney, W., Eds.; Burleigh Dodds Science Publishing: Cambridge, UK, 2018; pp. 247–272.
10. Rattunde, H.F.W. Population Improvement of Pearl Millet and Sorghum: Current Research, Impact andIssues for Implementation. In Proceedings of the International Conference on Genetic Improvement ofSorghum and Pearl Millet, Holiday Inn Plaza, Lubbock, TX, USA, 22–27 September 1996; p. 188.
11. Morris, G.P. Population genomic and genome-wide association studies of agroclimatic traits in sorghum.Proc. Natl. Acad. Sci. USA 2016, 110, 453–458. [CrossRef] [PubMed]
12. Zhu, C.; Gore, M.; Buckler, E.S.; Yu, J. Status and Prospects of Association Mapping in Plants. Plant Genome J.2008, 1, 5. [CrossRef]
13. Jordan, D.R.; Mace, E.S.; Cruickshank, A.W.; Hunt, C.H.; Henzell, R.G. Exploring and Exploiting GeneticVariation from Unadapted Sorghum Germplasm in a Breeding Program. Crop Sci. 2011, 51, 1444. [CrossRef]
14. Mace, E.S.; Jordan, D.R. Integrating sorghum whole genome sequence information with a compendiumof sorghum QTL studies reveals uneven distribution of QTL and of gene-rich regions with significantimplications for crop improvement. Theor. Appl. Genet. 2011, 123, 169–191. [CrossRef] [PubMed]
15. Kante, M. Sorghum Hybrids for Low-Input Farming Systems in West Africa: Quantitative Genetic Parametersto Guide Hybrid Breeding. Crop Sci. 2019, 59, 1–18. [CrossRef]
16. Weltzien, E. Enhancing farmers’ access to sorghum varieties through scaling-up participatory plant breedingin Mali, West Africa. In Bringing Farmers Back into Breeding. Experiences with Participatory Plant Breding andChallenges for Institutionalisation; Almekinders, C., Hardon, J., Eds.; Agromisa Foundation: Wageningen, TheNetherlands, 2006; pp. 58–69.
17. Weltzien, E.; Vom Brocke, K.; Touré, A.; Rattunde, F.; Chantereau, J. Revue et Tendances pour la Recherche enSélection Participative en Afrique de l’Ouest [Review and outlook for participatory plant breeding researchin West Africa]. Cah. Agric. 2008, 17, 165–171.
18. Piepho, H.-P.; Mohring, J. Computing Heritability and Selection Response From Unbalanced Plant BreedingTrials. Genetics 2007, 177, 1881–1888. [CrossRef] [PubMed]
19. Atlin, G.N.; Frey, K.J. Predicting the relative effectiveness of direct versus indirect selection for oat yield inthree types of stress environments. Euphytica 1989, 44, 137–142. [CrossRef]
20. Chen, J.; Xu, L.; Cai, Y.; Xu, J. QTL mapping of phosphorus efficiency and relative biologic characteristics inmaize (Zea mays L.) at two sites. Plant Soil 2008, 313, 251–266. [CrossRef]
21. Cichy, K.A.; Snapp, S.S.; Blair, M.W. Plant growth habit, root architecture traits and tolerance to low soilphosphorus in an Andean bean population. Euphytica 2009, 165, 257–268. [CrossRef]
22. Parentoni, S. Inheritance and breeding strategies for phosphorous efficiency in tropical maize (Zea mays L).Maydica 2010, 55, 1.
23. Rossiter, R.C. Phosphorus deficiency and flowering in subterranean clover (T. subterraneum L.). Ann. Bot.1978, 42, 325–329. [CrossRef]
24. Wissuwa, M.; Ae, N. Further characterization of two QTLs that increase phosphorus uptake of rice (Oryzasativa L.) under phosphorus deficiency. Plant Soil 2001, 237, 275–286. [CrossRef]
25. Gelli, M. Mapping QTLs and association of differentially expressed gene transcripts for multiple agronomictraits under different nitrogen levels in sorghum. BMC Plant Biol. 2016. [CrossRef] [PubMed]

Agronomy 2019, 9, 742 17 of 17
26. Kante, M. Can Tall Guinea-Race Sorghum Hybrids Deliver Yield Advantage to Smallholder Farmers in Westand Central Africa? Crop Sci. 2017, 57, 833. [CrossRef]
27. Rattunde, H.F.W. Yield of Photoperiod-sensitive Sorghum Hybrids Based on Guinea-race Germplasm underFarmers’ Field Conditions in Mali. Crop Sci. 2013, 53, 2454. [CrossRef]
© 2019 by the authors. Licensee MDPI, Basel, Switzerland. This article is an open accessarticle distributed under the terms and conditions of the Creative Commons Attribution(CC BY) license (http://creativecommons.org/licenses/by/4.0/).