Government Charges in the GTA - BILD GTA · industry in the Greater Toronto Area, and represents...
56
Government Charges and Fees on New Homes in the Greater Toronto Area REVISED FINAL REPORT July 23, 2013
Transcript of Government Charges in the GTA - BILD GTA · industry in the Greater Toronto Area, and represents...

Government Charges and
Fees on New Homes in the
Greater Toronto Area
REVISED FINAL REPORT
July 23, 2013

Government Charges and Fees on New
Homes in the Greater Toronto Area
Prepared for:
Building Industry and Land Development
Association
Prepared by:
Altus Group Economic Consulting 33 Yonge Street Toronto Ontario M5E 1G4
Phone: (416) 641‐9500 Fax: (416) 641‐9501
altusgroup.com
July 23, 2013

July 23, 2013
Government Charges and Fees on New Altus Group Economic Consulting
Homes in the Greater Toronto Area Page i
EXECUTIVE SUMMARY
Altus Group Economic Consulting was retained by the Building Industry
and Land Development Association (BILD) to review the government
charges and fees on new homes in the Greater Toronto Area (GTA).
BILD is the voice of the land development, home building and professional
renovation industry in the GTA, and represents more than 1,400 member
companies. BILD advocates on behalf of the industry, as well as future
homebuyers to keep government charges and fees fair and reasonable.
Our review of government charges attempts to help readers understand the
variety of charges imposed by the different levels of government, and the
significant costs associated with the approval, building, development and
ultimate occupancy of new homes across the GTA. It is important for readers
to know the various fees and charges that governments collect from the
development of new homes.
We have collected and compiled information on government charges for six
GTA municipalities. The rates and fees reviewed in this report are current as
of February 2013. This report is specific to residential home building, and
does not review government charges on mixed‐use or non‐residential
development.
The government charges reviewed in this report are paid for by land owners,
developers, home builders and home buyers. The fees paid for by land
owners, developers and home builders can have direct implications on the
prices of new homes in the GTA. Charges paid for by new home buyers
increase the costs of home ownership, and have implications on the amount
of income available to pay for mortgage costs.
The issue of housing affordability poses significant challenges for the
industry as it does for homebuyers in the GTA. Since 2005, the average
selling price of new low‐rise homes across the GTA has increased by 70%,
while the average selling price of new high‐rise homes has increased by 61%.

July 23, 2013
Government Charges and Fees on New Altus Group Economic Consulting
Homes in the Greater Toronto Area Page ii
While the cost of housing is also driven by a range of economic and market
factors outside of the scope of this study, the increase in government charges
have also been a factor in the increased price for new homes in the GTA.
In most municipalities, the most significant government charge for new
homes are development charges, which comprise from 33% to 52% of the
government charges on new homes (in the five municipalities outside of the
City of Toronto). Since 2004, for the municipalities studied in this report,
development charges have increased between 143% and 357%.1
Based on our review, we have found that:
The average government charges for each new single‐detached home are
roughly $116,200, or roughly 22.6% of the average price for a new home.
For the six municipalities we have reviewed, the charges per home range
from $83,000 in the Town of Bradford West Gwillimbury to $145,800 in
the City of Markham.
For a new condominium apartment, the average government charges per
apartment are approximately $64,000, or roughly 19.7% of the average
price for a new condominium apartment. For the six municipalities we
have reviewed, the charges per condominium apartment range from
$47,600 in the Town of Bradford West Gwillimbury to $79,200 in the
Town of Oakville.
1 For each municipality reviewed in this report, DC rates, and the rates of other fees are current as of
February 1, 2013.

July 23, 2013
Government Charges and Fees on New Altus Group Economic Consulting
Homes in the Greater Toronto Area Page iii
Summary of Government Charges per New Home, Greater Toronto Area
Government Charges per Home
Estimated Value of Single-Detached
Units 1
Government Charges per Apartment
Estimated Value of New Condominium
Apartment Units 2
Municipality
Oakville / Halton Region 141,300 590,000 79,200 380,800
Brampton / Peel Region 133,500 490,000 64,500 289,500
Markham / York Region 147,700 600,000 77,800 368,900
Bradford West Gwillimbury / Simcoe County 83,000 410,000 47,600 250,600
Ajax / Durham Region 92,400 460,000 47,900 250,600
City of Toronto 101,000 540,000 66,900 406,900
1 Value of single-detached units based on 2,000 square foot home on 36' foot lots2
Source: Altus Group Economic Consulting
Low-Rise Development High-Rise Development
Dollars per Unit
Value of condominium apartments based on average price of apartment in building with 150 1-bedroom apartments 600 ft2 in size each, 125 1-bedroom + den apartments 710 ft2 in size each, 150 2-bedroom apartments 920 ft2 in size each, 50 2-bedroom + den apartments 1,180 ft2 in size each, and 25 3-bedroom apartments 1,310 ft2 in size each.
On average, 56% of government charges are levied on land owners,
developers, or home builders. Charges levied during the development
and/or building process are likely to get passed on to new home buyers,
so long as the market will allow for an increase in prices. Where the
market will not respond to an increase in prices, increased government
charges will either slow the demand for new homes, or require
developers to absorb the additional costs.
On average, the other 44% of government charges are imposed directly
on new home buyers. These charges add to the costs of home ownership,
and reduce the amount of income available to home owners to pay for
other costs of living.
Given the variety of government charges imposed on both developers and
home buyers, the effect these charges have on the price of new homes, the
impact the charges have on the income available for new home buyers to pay
for the costs of housing, and the rationale behind each charge for the
governments that levy them, the topic covered in this report is a complex
one, for which there are no easy answers.
Figure 1

July 23, 2013
Government Charges and Fees on New Altus Group Economic Consulting
Homes in the Greater Toronto Area Page iv
TABLE OF CONTENTS
Page
EXECUTIVE SUMMARY ................................................................................. i
1 INTRODUCTION ...................................................................................... 1
1.1 Building Industry and Land Development Association (BILD) ............................ 1
1.2 Study Purpose .............................................................................................................. 1
2 METHODOLOGY ...................................................................................... 4
2.1 Selected GTA Municipalities ...................................................................................... 4
2.2 Low‐Rise Development .............................................................................................. 4
2.3 High‐Rise Development ............................................................................................. 7
3 TYPES OF GOVERNMENT CHARGES .............................................. 11
3.1 Development Charges ...............................................................................................11
3.2 Municipal Approvals & Permits ...............................................................................15
3.3 Hydro/Utility Fees ......................................................................................................17
3.4 Property Taxes ............................................................................................................17
3.5 Parkland Dedication / Cash‐in‐Lieu .........................................................................18
3.6 Public Art Contributions ...........................................................................................19
3.7 Section 37 .....................................................................................................................19
3.8 Tarion Enrolment Fee .................................................................................................20
3.9 CMHC Mortgage Insurance ......................................................................................20
3.10 Harmonized Sales Tax (less Eligible Rebates) .........................................................20
3.11 Land Transfer Tax .......................................................................................................21
4 CONCLUSIONS ....................................................................................... 21
4.1 Low‐Rise Development .............................................................................................21
4.2 High‐Rise Development ............................................................................................23
4.3 Implications and Conclusions ...................................................................................25
APPENDIX A – SUMMARY CHARTS FOR COSTS OF LOW‐RISE
DEVELOPMENT
APPENDIX B – SUMMARY CHARTS FOR COSTS OF HIGH RISE
DEVELOPMENT
APPENDIX C – DETAILED TABLES

July 23, 2013
Government Charges and Fees on New Altus Group Economic Consulting
Homes in the Greater Toronto Area Page 1
1 INTRODUCTION
Altus Group Economic Consulting was retained by the Building Industry
and Land Development Association (BILD) to review the government
charges and fees on new homes in the Greater Toronto Area (GTA).
1.1 Building Industry and Land Development Association (BILD)
The Building Industry and Land Development Association (BILD) is the
voice of the land development, home building and professional renovation
industry in the Greater Toronto Area, and represents more than 1,400
member companies across the GTA.
The building industry is part of the economic foundation of the GTA and
Ontario. In 2011, the value of new home construction in the GTA amounted
to $24.6 billion, with more than 193,000 jobs created in the new home
construction, renovation and related fields last year. These jobs generated
more than $10 billion in wages for local households, as well as:
$1.8 billion in federal and provincial income tax revenues;
$840 million in CPP premiums;
$330 million in employment insurance premiums;
$1.6 billion in HST revenues to the federal government, and another
$1.9 billion to the provincial government; and
$1.9 billion in harmonized sales tax revenues.2
1.2 Study Purpose
Our review of government charges attempts to help readers understand the
variety of charges, and the significant costs associated with the approval,
building, development and ultimate occupancy of new homes across the
GTA.
2 Building Industry and Land Development Association.
July 23, 2013
Government Charges and Fees on New Altus Group Economic Consulting
Homes in the Greater Toronto Area Page 2
The government charges analyzed and summarized in this report are
incurred by land owners, developers, home builders and/or purchasers, and
have implications for the affordability of new housing in the Greater Toronto
Area.
For the government charges that are paid for by the developer or home‐
builder, these costs often get passed on to the end‐user of a home, through
increased prices or rents, where the market will allow for such increases.
Figure 2 shows the trend in the average price of new absorbed single‐
detached homes in six selected GTA municipalities, based on CMHC data.
Since 2005, single‐detached home prices have increased by between 46% and
100%.
Average Price of New Absorbed Single-Detached Units, GTA Municipalities
Oakville Brampton MarkhamBradford West
Gwillimbury AjaxToronto
(Scarborough)
Year
2005 532,331 370,881 381,833 292,271 321,088 349,258 2006 655,362 375,675 419,549 361,312 374,217 389,105 2007 736,788 399,021 462,911 373,940 440,897 449,287 2008 711,006 433,461 482,853 375,788 503,188 440,334 2009 934,754 460,487 548,447 366,913 474,272 509,653 2010 958,735 483,190 580,844 393,419 481,555 517,660 2011 1,588,261 524,958 564,458 429,614 502,159 539,902 2012 1,065,177 562,491 608,807 427,958 533,152 629,243
% Change 100 52 59 46 66 80
Source: Altus Group Economic Consulting based on CMHC Housing Now reports
Dollars per Unit
Percent
Figure 3 shows the increase in average prices for low‐rise and high‐rise
homes, based on RealNet data, which shows that the average price of low‐
rise homes across the Greater Toronto Area have increased by 70% over the
2004‐2012 period, while the average price of high rise apartments have
increased by 61%.3
3 Low‐rise includes single‐detached, link, semi‐detached, and townhouse units. High‐rise includes
apartments, loft and stacked townhouses.
Figure 2

July 23, 2013
Government Charges and Fees on New Altus Group Economic Consulting
Homes in the Greater Toronto Area Page 3
Average New Home Price, Low-Rise and High-Rise, 2004-2012
$200,000
$300,000
$400,000
$500,000
$600,000
2004 2005 2006 2007 2008 2009 2010 2011 2012
Low-Rise High-Rise
Dollars per Unit
Source: Altus Group Economic Consulting based on Realnet data
In addition to the charges paid for by the developer or home builder, other
costs are paid for directly by the purchaser of a new home. While
government charges imposed directly on a home buyer do not increase the
price of a new home, they do add to the costs of home ownership. Increases
to the government charges paid for by new home owners can have direct
impacts on the amount of income available to pay for a mortgage, as well as
other costs of living.
Additionally, costs that are paid for by a developer or home builder, and then
passed on through higher home prices, are also carried by home owners,
through the increased interest costs associated with a larger mortgage
required to finance an increased home price.4
4 For example, a house with a $500,000 mortgage would pay approximately $291,800 in interest costs
over the life of the mortgage (over and above the principal repayment). For every additional $10,000
in the mortgage principal, the interest costs increase by $5,830 over the life of the mortgage (Mortgage
costs based on a 25‐year amortization, 4% interest rate, monthly payments).
Figure 3

July 23, 2013
Government Charges and Fees on New Altus Group Economic Consulting
Homes in the Greater Toronto Area Page 4
2 METHODOLOGY
This section presents the methodology used in the calculation of government
charges on new housing developments in the Greater Toronto Area. This
report is specific to residential home building, and does not review
government charges on mixed‐use or non‐residential development.
2.1 Selected GTA Municipalities
This report will analyze the government charges associated with both low‐
rise and high‐rise developments in the four GTA regional municipalities
(York, Durham, Halton and Peel), Simcoe County and the City of Toronto.
For each regional municipality/County, we have selected one lower‐tier
municipality:
Town of Ajax (Durham Region);
City of Markham (York Region);
Town of Oakville (Halton Region);
City of Brampton (Peel Region);
Town of Bradford West Gwillimbury (Simcoe County); and
City of Toronto.
We have collected our information based on publicly available information or
where information was not readily available, through correspondence with
contacts at various government agencies. The rates for charges reviewed in
this report are those that were posted by each municipality or government
agency as of the time of writing this report.
2.2 Low‐Rise Development
2.2.1 Development Assumptions
In order to quantify the total government charges for a new low‐rise
development in the Greater Toronto Area, we have estimated the costs
associated with the application, approval and build‐out of a hypothetical
residential subdivision. The characteristics of the hypothetical low‐rise
development are as follows:

July 23, 2013
Government Charges and Fees on New Altus Group Economic Consulting
Homes in the Greater Toronto Area Page 5
500 single‐detached homes, each with 36 foot frontages;
At average household size of 3.7 persons per home, the development
would be built at a density of 50 persons per net hectare, which
would mean the gross land area required would equal 46.3 hectares.
At a net‐to‐gross ratio of 80%, the net land area would be 37.0
hectares; and
We have assumed that there would be approximately 3,300 metres of
local roads within the development.5
These development assumptions have been held constant across all six of the
municipalities to allow for an “apples‐to‐apples” comparison. It should be
recognized that the low‐rise development used in this report is hypothetical
only, and may not be a realistic development option in some of the
municipalities reviewed.
2.2.2 Common Assumptions
In building our model, we have used several assumptions that were kept
constant across each municipality:
Required Planning Applications – we have assumed that the low‐rise
development would require both lower‐/single‐tier and upper‐tier official
plan amendments, a zoning by‐law amendment and plan of subdivision
approval.
Average Home Size ‐ we have assumed that each single‐detached home
would be 2,000 square feet, which, according to RealNet data, is roughly
consistent with the average size of new single‐detached homes on 36‐foot
lots.
Down Payment Amount ‐ we have assumed that the average buyer of the
homes would have a 15% down payment, meaning that the remaining 85%
would be financed through a CMHC insured mortgage. This assumption is
5 36 feet frontage per unit x 500 units = 18,000 feet of frontage. Assuming 2 units on each side of every
street = 9,000 feet of road frontage, plus an assumed 20% of roads frontage for parks, etc, = 10,800 feet
of roads, or 3,291 metres.

July 23, 2013
Government Charges and Fees on New Altus Group Economic Consulting
Homes in the Greater Toronto Area Page 6
the key input in determining the amount of CMHC mortgage insurance
required.
Value of Engineering Works ‐ Our estimate of the value of engineering
works is based on the 2012 Altus Group Cost Guide, which provides an
estimate of the costs for site servicing. For houses on local roads, site
servicing costs are estimated to be $2,700 per metre of road frontage (which is
the low end of the range provided in the Cost Guide). As we have assumed
that the low‐rise development will have approximately 3,300 metres of local
road frontage, this means that the site servicing costs would amount to
approximately $8.9 million.
We have split the $8.9 million servicing costs based on cost splits used in the
2009 Delta Urban study prepared for BILD.6 The approximately $8.9 million
in servicing costs is assumed to be broken down as follows:
$3,199,000 for road works;
$853,100 for site preparation;
$2,687,200 for water and sanitary sewer services; and
$2,148,700 for storm sewers, manholes, catch basins and storm water
management pond(s).
2.2.3 Variable Assumptions
We have also made a number of assumptions that vary from one
municipality to another:
Value of Single‐Detached Homes – using RealNet data for new single‐
detached homes in each lower‐tier municipality, we compiled data on prices
for new single‐detached homes marketed since 2006, and indexed the prices
per square foot to 2012 dollars. We have controlled for both the size of lot and
6 Delta Urban Inc., Municipal Fees and Related Charges: A Comparative Study of Development Costs
Across the Greater Toronto Area, (November 25, 2009).

July 23, 2013
Government Charges and Fees on New Altus Group Economic Consulting
Homes in the Greater Toronto Area Page 7
size of the house, by only including houses on 34’ to 38’ lots, and only houses
between 1,500 and 2,500 square feet in size.7
Land Value – It is necessary to acknowledge the differences in land values
among the municipalities reviewed in this report. An assumption regarding
land value is required for the calculation of property taxes payable during
the application process (while the land is vacant) and to the estimate of the
cost of a cash‐in‐lieu of parkland payment. To determine the land value in
each municipality, we have taken RealNet data on the average price per
hectare for land sales in each of the lower‐tier municipalities. Each land sale
in RealNet’s database was then indexed to 2012 dollars using Statistics
Canada’s New Housing Price Index for land in the Toronto/Oshawa CMA.8
2.3 High‐Rise Development
Similar to our low‐rise development analysis, the high‐rise development
used for the analysis in this report is assumed to be residential‐only, and not
a mixed‐use building.
2.3.1 Development Assumptions
In order to quantify the government charges for a new high‐rise
development, we have estimated the costs associated with the application,
approval and building of a hypothetical condominium apartment building.
The characteristics of the high‐rise development are as follows:
500 condominium apartments contained in a high‐rise development,
located at the intersection of two arterial roads;
The development would be built on 4.0 gross hectares of land (and
would be a square‐shaped site at the intersection of two arterial
7 The prices per square foot for new units from Realnet were indexed to 2012 value using the Realnet
price index for low‐rise units, based on the date each development’s price lists were updated. 8 For the price of low‐density land, we used Realnet’s “low‐density” land sale category. Where we
need an estimate of the value of raw vacant land, we used Realnet’s database of land sales for “long‐
term” land in each of the lower‐tier municipalities. For Bradford West Gwillimbury, as no land sales
were found in the Realnet database, we used East Gwillimbury as a proxy. For Toronto, we have only
used land sales from the outer municipalities of the former Metro Toronto – Etobicoke, Scarborough
and North York.

July 23, 2013
Government Charges and Fees on New Altus Group Economic Consulting
Homes in the Greater Toronto Area Page 8
roads, and therefore would have 200 metres of frontage on each of its
two arterial frontages);
Parking would be provided through the construction of an
underground garage.
The development assumptions have been held constant across all six of the
municipalities to allow for an “apples‐to‐apples” comparison. It should be
recognized that the high‐rise development used in this report is hypothetical
only, and may not be a realistic development option in some of the
municipalities reviewed.9
2.3.2 Common Assumptions
In building our model, we have used several assumptions that were kept
constant across each municipality:
Required Planning Applications – we have assumed that the high‐rise
development would require both lower‐/single‐tier and upper‐tier official
plan amendments, a zoning by‐law amendment, site plan approval, and plan
of condominium approval.
Mix and Size of Apartments – the mix of apartments shown in Figure 4 is
assumed for the purposes of this analysis. Our assumptions would see the
high‐rise development include 150 one‐bedroom apartments, 125 one‐
bedroom plus den apartments, 150 two‐bedroom apartments, 50 two‐
bedroom plus den apartments, and 25 three‐bedroom apartments.
The average apartment sizes are based on the average sizes in new high‐rise
developments across the GTA. See Figure 4 for the assumed mix and sizes of
apartments in the hypothetical high‐rise development.
The mix and size of apartments shown in Figure 4 may not reflect the mix
and size of apartments and apartment buildings being built in municipalities
in the GTA nor those reviewed in this report. However, we require this
9 In particular, the assumptions may not be realistic for a development in the City of Toronto. To
address this, we have run our calculations on a more typical Toronto high‐rise building, wh ich is
assumed to be built on a smaller site. The calculation of government charges per unit for a smaller
site high‐rise building in Toronto is presented in a footnote later in this report.

July 23, 2013
Government Charges and Fees on New Altus Group Economic Consulting
Homes in the Greater Toronto Area Page 9
assumption to be uniform across all six municipalities, so that the results of
this report can be compared on an “apples‐to‐apples” basis.
Unit Mix and Unit Sizes, Hypothetical High-Rise Development
One-Bedroom
One-Bedroom +
DenTwo-
Bedroom
Two-Bedroom +
Den 3-Bedroom Total
Average Size per Unit (ft2) 600 710 920 1,180 1,310 -
Share of Units 30% 25% 30% 10% 5% 100%
Units by Type 150 125 150 50 25 500
Building Area (Units) 90,000 88,750 138,000 59,000 32,750 408,500
Source: Altus Group Economic Consulting
Square Feet
Percent
Units
Square Feet
Down Payment Amount ‐ we have assumed that the average buyer of the
condominium apartments would have a 15% down payment, meaning that
the remaining 85% would be financed through a CMHC insured mortgage.
This assumption is the key input in determining the amount of CMHC
mortgage insurance required.
Gross to Net Area within the Condominium Building(s): We have assumed
that the gross floor area within the apartments would comprise
approximately 80% of the total area within the high‐rise building(s). The
remaining 20% of the building(s) would include the lobby, storage areas,
amenity rooms, and other common areas. An assumption of the gross floor
area of the building(s) is necessary for the calculation of building permit fees
payable in some municipalities we have reviewed.
Value of Engineering Works ‐ Our estimate of the value of Engineering
Works is based on the 2012 Altus Group Cost Guide, which estimated costs
for site servicing. For developments built with arterial road frontage,
servicing amounted to $3,800 per metre of frontage. As we have assumed
that the high‐rise development will have approximately 400 metres of arterial
Figure 4

July 23, 2013
Government Charges and Fees on New Altus Group Economic Consulting
Homes in the Greater Toronto Area Page 10
road frontage, this means that the site servicing costs would amount to
approximately $1.5 million.10
We have split the $1.5 million servicing costs based on cost splits used in the
2009 Delta Urban study prepared for BILD. The approximately $1.5 million
in servicing costs is assumed to be broken down as follows:
$547,100 for road works;
$145,900 for site preparation;
$459,600 for water and sanitary sewer services; and
$367,500 for storm sewers, manholes, catch basins and a storm water
management pond.
2.3.3 Variable Assumptions
We have also made a number of assumptions for the high‐rise development
that vary from one municipality to another:
Value of Condominium Apartments – using RealNet data for new
condominium apartments marketed in each municipality since 2006, we have
calculated the average prices for each apartment type in each municipality.
Using RealNet’s price index for high‐rise apartments, the sales price for each
development were indexed to 2012 dollars, based on the date that prices for
each development were last updated by RealNet. We have controlled for
apartment size by each type by removing apartments from the calculation
that were more than 20% larger or smaller than the average apartments that
have been marketed since 2006.
Land Value – It is necessary to acknowledge the differences in land values
among the municipalities reviewed in this report. An assumption regarding
land value is required for the calculation of property taxes payable during
the application process (while the land is vacant) and the estimate of the cost
of a cash‐in‐lieu of parkland payment. To determine the land value in each
municipality, we have taken the average price per hectare for high‐density
10 These costs allow for underground storm, sanitary sewer, water and hydro services, earthworks,
curbs, asphalt roadways and sidewalks.

July 23, 2013
Government Charges and Fees on New Altus Group Economic Consulting
Homes in the Greater Toronto Area Page 11
land sales in each of the lower‐tier municipalities; with older land sales
indexed using Statistics Canada New Housing Price Index for land in the
Toronto/Oshawa CMA.11
Amount of Underground Parking Required ‐ The amount of parking
required in each building would vary depending on the parking
requirements in each municipality. Any differences in the size of the parking
garages required may cause a difference in the cost of the required building
permits.12
3 TYPES OF GOVERNMENT CHARGES
This section reviews the various government charges levied on new
development and/or purchasers of newly‐built homes. The charges reviewed
include those levied by lower‐tier or upper‐tier municipalities, school boards,
conservation authorities, the provincial government or provincial agencies,
and the federal government and its agencies.
3.1 Development Charges
3.1.1 Municipal Development Charges
The Development Charges Act grants authority to municipalities to enact a
development charges by‐law to impose a charge against land to be developed
where the development will increase the need for municipal services, thus
offsetting capital costs.
Municipal development charges collect funds for services deemed as being
eligible in the Development Charges Act, such as Parks & Recreation, Libraries,
Fire Services, Police Services, Water, Sewer, Roads, Transit, etc. Where there is
both an upper‐tier and lower‐tier municipality, the services included in each
11 Where we need an estimate of the value of raw vacant land, we used Realnet’s database of land
sales for “long‐term” land in each of the lower‐tier municipalities. For Bradford West Gwillimbury, as
no land sales were in the Realnet database, we used East Gwillimbury as a proxy. 12 While higher parking requirements in a given municipality may also increase the cost of
constructing an underground parking garage, we have not included these additional costs in our
analysis as additional construction costs are not a direct government charge.

July 23, 2013
Government Charges and Fees on New Altus Group Economic Consulting
Homes in the Greater Toronto Area Page 12
respective development charge are based on which tier is the provider of
each service.
Each of the lower‐tier/single‐tier municipalities reviewed in this report
imposes development charges for a variety of services. The development
charge rates seen in the six lower‐ and single‐tier municipalities, per single‐
detached home are:
Town of Ajax: $12,029 per single‐detached home;
Town of Oakville: $18,957 per single‐detached home;
City of Brampton: $25,351 per single‐detached home;
City of Markham: $19,626 per single‐detached home;
Town of Bradford West Gwillimbury: $29,024 per single‐detached
home; and
City of Toronto: $19,412 per single‐detached home.
The rates for other unit types (apartments, townhouses, etc.) vary from the
rates charged per single‐detached home shown above.
Each municipality’s respective upper‐tier municipality (except Toronto,
which is a single‐tier municipality) also impose development charges for a
variety of Regional/County services. The DC rates in the upper‐tier
municipalities per single‐detached home are:
Durham Region: $20,940 per single‐detached home;
Halton Region: $35,275 per single‐detached home;13
Peel Region: $35,532 per single‐detached home;
York Region: $40,107 per single‐detached home;
Simcoe County: $6,172 per single‐detached home.
13 For the purposes of this analysis, we have excluded Halton Region’s proposed Developer Financing
Program and the Recovery DC, as well as Bradford West Gwillimbury’s early payment agreement
funding amounts.

July 23, 2013
Government Charges and Fees on New Altus Group Economic Consulting
Homes in the Greater Toronto Area Page 13
As required under the Development Charges Act, these development charges
are to be reviewed at least every five years, and are indexed either annually
or semi‐annually, depending on the municipality.
The municipal DC’s included in this report are based on the DC’s as of
February 2013.
3.1.2 Education Development Charges
Education development charges (EDC’s) are collected by local municipalities
on behalf of the local school boards. EDC’s are used to fund the acquisition of
school sites, and related costs (site preparation, etc.) to accommodate growth‐
related pupils. EDC’s are typically charged by both public and separate
school boards, and are usually levied on both residential and non‐residential
growth.
3.1.3 GO Transit Development Charges
Development charges are also levied to collect funds for growth‐related
projects associated with the GO Transit system. Each City/Region in the
Greater Toronto & Hamilton Area has been allocated a share of the projected
growth‐related capital costs associated with the GO transit system, with the
municipal, provincial and federal governments each in total funding one‐
third shares of the capital costs.
The GO Transit development charge were originally approved for a two‐year
period, with the by‐laws expiring December 31, 2003. Since then, the GO
Transit development charges have been updated regularly to fund a rolling
ten‐year budget. The expiry of the GO Transit development charges have
been extended by Metrolinx through Ontario Reg. 518/10 to December 31,
2013.
The regional municipalities in the GTA (York, Peel, Durham and Halton)
have implemented GO Transit development charge by‐laws to fund their
share of the program under the Development Charges Act.
July 23, 2013
Government Charges and Fees on New Altus Group Economic Consulting
Homes in the Greater Toronto Area Page 14
3.1.4 Area‐Specific Development Charges
Two of the municipalities reviewed in this report impose area‐specific
development charges. We have therefore made assumptions regarding the
area that the hypothetical development would fall within:
Town of Oakville / Halton Region – Halton Region imposes a higher
development charge for homes built in the greenfield area than those
built within the built boundary. For this analysis we have assumed
that the low‐rise development is located within the Greenfield DC
area, and that the high‐rise development is located within the built
boundary area;
City of Markham / York Region – The City of Markham charges area‐
specific DC rates depending on where a home is being developed
within the City, over and above its ‘Town‐wide’ DC rate. For this
analysis, we have assumed that both the low‐rise and high‐rise
hypothetical development are located in the Cathedral area of the
City, which is subject to an area‐specific DC of $3,500 per hectare;
3.1.5 Trend in Development Charges
Development charges are the generally the most significant component of
government charges in the municipalities we have reviewed in this report
(Toronto being the exception). For the five municipalities outside of the City
of Toronto:
For low‐rise development, DCs comprise from 39% to 48% of all
government charges;
For high‐rise development, DCs comprise between 34% and 53% of
all government charges.
Figure 5 shows the significant increases to development charge rates since
the mid‐1990’s in five of the six municipalities14, combining the various DC’s
payable per single‐detached home. Since 1995, DC rates have increased from
at least 124% in the Town of Ajax/Durham Region, to as much as 386% in the
City of Brampton/Peel Region.
14 Historical data on Bradford West Gwillimbury’s DC rates were not available.

July 23, 2013
Government Charges and Fees on New Altus Group Economic Consulting
Homes in the Greater Toronto Area Page 15
Development Charges per Single-Detached Home, Selected GTA Municipalities
$0
$10,000
$20,000
$30,000
$40,000
$50,000
$60,000
1995 1999 2001 2004 2009 2011 2012 2013
Oakville / Halton Brampton / Peel
Markham / York Ajax / Durham
Toronto
Dollars per Single-Detached Unit
Source: Altus Group Economic Consulting
Note: Data for Bradford West Gwillimbury not shown as data for several of the years prior to 2009 was not available
3.2 Municipal Approvals & Permits
There are various fees and charges associated with the municipal approval
for a development, a number of fees for the permits required for the
construction of the building(s), and engineering fees and permits for the
infrastructure works associated with a development.
We have attempted to group these fees into three main categories outlined
below, but in many municipalities, there is no clear delineation between the
departments that review plans, approve plans, and/or issue permits.
3.2.1 Planning Review Fees
For this analysis, we have assumed that the low‐rise hypothetical
development would require both lower‐ and upper‐tier official plan
amendments (the latter not being applicable in the City of Toronto), a zoning
by‐law amendment and a plan of subdivision.
Figure 5

July 23, 2013
Government Charges and Fees on New Altus Group Economic Consulting
Homes in the Greater Toronto Area Page 16
We have assumed that the high‐rise development would also require official
plan amendments, a zoning by‐law amendment, as well as plan of
condominium and site plan approval.
To capture the planning review fees associated with the hypothetical
developments, we have applied any applicable lower‐tier or upper‐tier
planning review fees associated with these amendments and plan
submissions.
In some municipalities, planning review fees are also charged by local
Conservation Authorities and/or Health Departments. Where applicable, we
have included those fees in the calculation of government charges.
3.2.2 Building Permit Fees
Each of the lower‐/single‐tier municipalities charges building permit fees, for
the construction of each residential home, which they charge on a per square
metre or per square foot basis.
3.2.3 Engineering and Servicing Fees
Each lower‐ and upper‐tier municipality reviewed charges a variety of
engineering and service fees for the development, review, inspection,
connection and/or assumption of a development’s water, sanitary sewer and
storm sewer services. The various engineering and servicing related fees may
include:
Servicing and Subdivision Agreement & Assumption Fees;
Engineering Inspection Fees (typically charged as a percentage of the
engineering works to be done);
Site Alteration, Soil Removal, Fill and Lot Grading Fees.
Legal Fees
3.2.4 Peer Review Costs
Often, municipalities will charge for peer review of various technical
documents submitted as part of a development application (i.e., stormwater

July 23, 2013
Government Charges and Fees on New Altus Group Economic Consulting
Homes in the Greater Toronto Area Page 17
management plan, sound studies, etc.). Municipalities will typically require
that developers fund the cost of these peer review studies.
Given the difficulty in quantifying the cost of the various peer reviews
required for a development, we have not included these costs in our analysis.
However, these costs should also be kept in mind when assessing the various
government charges imposed on development.
3.3 Hydro/Utility Fees
In each municipality, the hydro‐electricity provider charges service
connection fees on new development. These are either recovered through
future user rates, or imposed on the developer through a cost sharing
agreement for the cost of the system to be built.
We have found the applicable charge levied by the hydro‐electricity provider
in most of our subject municipalities; however we did not receive responses
from some. For municipalities where we were not able to obtain information,
we have applied the average charge per new home in municipalities where
information was available, as a proxy.
3.4 Property Taxes
During the development process, developers are required to pay property
tax on the vacant land until such time that homebuyers begin to pay property
tax on their individual properties. We have taken a similar approach to
estimate these property taxes as the one used in the November 2009 Delta
Urban report:
For low‐rise development, we have assumed a five‐year
application/development period, including a 2.5‐year period where the lands
are assessed and taxed as farmland, and another 2.5‐year period where the
lands are assessed and taxed as residential.15
15 While the second 2.5‐year period would more likely see a “farmland awaiting development” tax
rate applied, this tax rate is not shown in some municipalities. Therefore, to be consistent across all
municipalities, we have instead applied the residential tax rate for the second 2.5‐year period.

July 23, 2013
Government Charges and Fees on New Altus Group Economic Consulting
Homes in the Greater Toronto Area Page 18
For high‐rise development, we have assumed a similar five‐year
application/development period, with the lands taxed as residential for the
entire five‐year period (based on the assumption that they are likely within
the existing built‐up area of a municipality).
3.5 Parkland Dedication / Cash‐in‐Lieu
Municipalities often acquire parkland and other forms of open space through
parkland dedication requirements imposed on new developments.
Alternatively, a developer may provide “cash‐in‐lieu” of parkland dedication
to a municipality.
Section 42 of the Ontario Planning Act says that as a condition of development
or redevelopment of land, that land in an amount not exceeding 5% of the
land to be conveyed to the municipality for park or other public recreational
purposes (section 42(1)). Alternatively, for residential developments, the land
conveyed to the municipality may also be provided at a rate of 1 hectare per
300 dwelling units (section 42 (3)).
These rates are used in each municipality reviewed in this report, except the
City of Toronto, which has an alternative parkland dedication rate of 2% of
land area, or 0.4 hectares per 300 units. In Toronto, the payments are capped
based on the size of the development site and the value of the site. For 1‐5
hectare sites, the value of the payment cannot exceed 15% of the value of the
site. For smaller sites (less than 1 hectare), this cap is 10% of the value of the
site, while for larger sites (greater than 5 hectares) this cap is 20% of the value
of the site. However, in no case can the parkland dedication or cash‐in‐lieu
thereof be less than 5% of the site or value of the site.
Section 51.1 of the Ontario Planning Act says that in lieu of providing the land
for parkland to the municipality, the developer may instead provide a
payment to the municipality in the amount of the value of the land to be
conveyed. Section 51.1 (4) says that the value of the land is to be determined
as of the day before approval of the draft plan of subdivision.
We have calculated the value per hectare for development land in each
municipality, based on the average price per hectare for low and/or high‐
density land in each of the lower‐tier municipalities, taken from RealNet land
sale data.
July 23, 2013
Government Charges and Fees on New Altus Group Economic Consulting
Homes in the Greater Toronto Area Page 19
The one exception to this land value methodology is in our calculation of
City of Brampton cash‐in‐lieu value, which prescribes land values for
developments proceeding with cash‐in‐lieu payments in a given year. The
City of Brampton’s 2013 parkland dedication rates are $550,000 per acre for
single‐detached homes, and $1,575,000 (but adjusted by 60% to $630,000) per
acre for apartments.
Under the City of Toronto’s alternative parkland dedication rate, parkland is
to be dedicated at a rate of 0.4 hectares per 300 units.
3.6 Public Art Contributions
The Town of Oakville, the City of Markham and the City of Toronto each
have public art contributions for development, set each at up to 1% of the
construction cost of development.
Other municipalities appear to allow for contributions to public art, but these
appear to be voluntary in nature and/or provided through Section 37 (where
applicable).
3.7 Section 37
Section 37 of the Ontario Planning Act allows for increases in permitted height
and/or density through the zoning by‐law in return for community benefits,
provided that Official Plan policies are in place.
Section 5.1.1 of the City of Toronto Official Plan sets out the City’s policies
regarding the provision of height and/or density incentives through Section
37 of the Planning Act. The City of Toronto Official Plan sets out a number of
community benefits that may be provided in return for increased height
and/or density, including parkland/park improvements, streetscape
improvements, public art, child care facilities, etc.
While Section 37 contributions are often provided by private developers
when developing in Toronto, there is no publicly available formula or
method for how these are calculated and/or arrived at. Therefore, we have
not attempted to include these costs in our analysis. However, they are a
significant government charge, and should be kept in mind when reading
this report and assessing its results.

July 23, 2013
Government Charges and Fees on New Altus Group Economic Consulting
Homes in the Greater Toronto Area Page 20
The use of Section 37 is not as common in other municipalities outside of the
City of Toronto, however it is a tool that is available through the Ontario
Planning Act.
3.8 Tarion Enrolment Fee
For new homes, builders are required to pay a warranty enrolment fee to
Tarion. The enrolment fee varies by the sale price of the home, based on the
Tarion Enrolment Fee Calculation table. For example, for homes priced in the
$350,000 to $400,000 range, the total enrolment fee is $881.40 per home.
3.9 CMHC Mortgage Insurance
To obtain CMHC mortgage loan insurance, lenders are required to pay an
insurance premium a cost that gets passed onto the borrower. The CMHC
mortgage loan insurance is calculated as a percentage of the mortgage loan.
The higher the percentage of the total price that is borrowed for, the higher
percentage that is required to be paid in insurance premiums.
Examples of CMHC mortgage insurance premiums and loan‐to‐value ratios
are as follows:
Loan‐to‐Value ratio of 80% ‐ 1.00% premium
Loan‐to‐Value ratio of 85% ‐ 1.75% premium
Loan‐to‐Value ratio of 90% ‐ 2.00% premium
Loan‐to‐Value ratio of 95% ‐ 2.75% premium
For the purposes of this analysis, we have assumed that buyers will have on
average an 85% loan‐to‐value ratio, and therefore will require a 1.75%
mortgage loan insurance premium.
3.10 Harmonized Sales Tax (less Eligible Rebates)
New home sales are subject to the Harmonized Sales Tax of 13%, of which 5%
is the federal portion (GST), and 8% is the provincial portion (PST).
The GST payable (or federal portion) is eligible for a rebate of 36% for houses
priced at $350,000 or less, with the amount of rebate declining for houses

July 23, 2013
Government Charges and Fees on New Altus Group Economic Consulting
Homes in the Greater Toronto Area Page 21
priced between $350,000 and $450,000 (on a straight line basis). There are no
GST rebates available on homes priced above $450,000.
The PST payable (or provincial portion) is also subject to a rebate, which is
calculated by applying a 75% factor to the PST payable, up to a maximum
rebate of $24,000.
3.11 Land Transfer Tax
The provincial land transfer tax applies to the purchase of homes in Ontario.
The progressive tax rates applied to each home are:
0.5% on amounts up to and including $55,000;
1.0% on amounts exceeding $55,000 up to and including $250,000;
1.5% on amounts exceeding $250,000 up to and including $400,000;
and
2% on amounts exceeding $400,000.
First‐time home buyers are eligible for a rebate on all or part of the land
transfer tax owing, up to a maximum rebate of $2,000. For the purposes of
this analysis, we have assumed that 40% of the home buyers would be first‐
time home buyers and eligible for the land transfer tax rebate.
The City of Toronto also imposes its own municipal land transfer tax (MLTT),
which is imposed on home sales. The rates and stages of the tax are similar to
the Ontario land transfer tax, however, new home buyers are eligible for a
rebate up to $3,725 of the municipal land transfer tax owing on a property.
4 CONCLUSIONS
4.1 Low‐Rise Development
Figure 6 summarizes the government charges imposed on low‐rise
development in each municipality and breaks down the various costs by
type. The total amount of government charges are compared to the estimated

July 23, 2013
Government Charges and Fees on New Altus Group Economic Consulting
Homes in the Greater Toronto Area Page 22
price for a new 36’ single‐detached home in each municipality, by calculating
the ratio of total government charges to new home prices.16
Summary of Government Charges, Greater Toronto Area, by Type, Low-Rise Development
Town of Oakville
City of Brampton
City of Markham
Town of Bradford West
Gwillimbury Town of Ajax City of Toronto
Upper-Tier Municipality Halton Region Peel Region York Region Simcoe County Durham Region
590,000 490,000 600,000 410,000 460,000 540,000
Government Charges by Type
Lower-Tier/Single-Tier DCs 18,957 25,351 19,950 29,024 12,029 19,412 Upper-Tier DCs 35,275 35,532 40,107 6,172 20,940 n.a.Education DCs 3,665 2,146 2,020 1,088 1,964 544 GO Transit DCs 1,032 476 314 n.a. 647 n.a.Planning Review Fees 1,922 2,268 1,390 452 534 1,121 Building Permits 2,694 2,399 2,293 2,747 1,807 3,136 Engineering and Servicing 1,357 2,223 3,567 329 1,589 1,654 Property Tax 2,237 2,241 1,708 2,569 1,775 2,876 Hydro 2,049 3,000 1,900 1,900 2,049 1,396 Parkland Dedication 4,584 6,286 3,405 4,041 2,508 6,846 Tarion Enrolment 1,187 1,040 1,187 961 1,040 1,130 CMHC Mortgage Insurance 8,776 7,289 8,925 6,099 6,843 8,033 Harmonized Sales Tax 50,858 38,353 52,108 24,031 33,807 44,605 Land Transfer Tax 6,738 4,936 6,918 3,583 4,875 10,234
Total 141,331 133,540 145,791 82,996 92,405 100,987
24.0% 27.3% 24.3% 20.2% 20.1% 18.7%
Charges Paid By
Developer 72,910 79,962 75,940 47,383 44,832 36,719 Home Owner 68,421 53,578 69,851 35,613 47,573 64,268
Share of Charges Paid By
Developer 52% 60% 52% 57% 49% 36%Home Owner 48% 40% 48% 43% 51% 64%
Source: Altus Group Economic Consulting
Dollars
Government Charges as % of Average New Home Price
Dollars / Unit
Average New Home Price - 36' Detached
Percent
Percent
Dollars / Unit
In total, government charges for the six municipalities range from $83,000 per
home in the Town of Bradford West Gwillimbury to $145,800 per home in the
City of Markham:
$145,800 per home in the City of Markham/York Region;
$141,300 per home in the Town of Oakville/Halton Region
16 As some government charges are paid for by home buyers, not all of the government charges
would affect, or be included, in the price of a home. Therefore, the ratio of government charges to
new home prices should not be interpreted as the ‘tax rate’ on new homes. This ratio is merely shown
to allow for a comparison across municipalities, and should be used with caution.
Figure 6

July 23, 2013
Government Charges and Fees on New Altus Group Economic Consulting
Homes in the Greater Toronto Area Page 23
$133,500 per home in the City of Brampton/Peel Region;
$101,000 per home in the City of Toronto;
$92,400 per home in the Town of Ajax/Durham Region; and
$83,000 per home in Town of Bradford West Gwillimbury/Simcoe
County.
As a percentage of average new home price, government charges range from
18.7% in the City of Toronto to 27.3% in the City of Brampton.
The most significant government charge imposed on new homes
development charges, which range from approximately $20,000 per single‐
detached home in the City of Toronto to $63,500 dollars per single‐detached
home in the City of Brampton. Other significant costs include Harmonized
Sales Tax, engineering and servicing fees, CMHC mortgage insurance,
building permits, parkland dedication and land transfer taxes.
The figures in Appendix A show the government charges, for each
municipality, by level of government, and by type of cost.
4.2 High‐Rise Development
Figure 7 summarizes the government charges for high‐rise development in
each municipality. The government charges are broken down by type, and
then totalled. The total government charges are then compared to the
estimated price for a new condominium apartment in each municipality, by
calculating the ratio of total government imposed costs to average prices
(based on the mix of apartments in our hypothetical high‐rise development).

July 23, 2013
Government Charges and Fees on New Altus Group Economic Consulting
Homes in the Greater Toronto Area Page 24
Summary of Government Charges, Greater Toronto Area, by Type, High-Rise Development
Town of Oakville
City of Brampton
City of Markham
Town of Bradford West
Gwillimbury Town of Ajax City of Toronto
Upper-Tier Municipality Halton Region Peel Region York Region Simcoe County Durham Region
380,800 289,500 368,900 250,600 250,600 406,900
Government Charges by Type
Lower-Tier/Single-Tier DCs 9,222 12,938 9,985 14,228 5,610 10,587 Upper-Tier DCs 13,146 18,680 21,272 4,278 9,804 n.a.Education DCs 3,665 2,146 2,020 1,088 1,964 544 GO Transit DCs 539 250 151 n.a. 332 n.a.Planning Review Fees 2,532 694 475 206 497 525 Building Permits 1,594 1,179 984 1,509 929 1,570 Engineering and Servicing 324 798 780 51 693 283 Property Tax 995 848 698 707 834 1,797 Hydro 142 142 140 140 142 145 Parkland Dedication 14,367 5,189 10,388 6,955 8,543 12,207 Public Art Contribution 2,102 - 2,102 - - 2,102 Tarion Enrolment 881 723 881 723 723 961 CMHC Mortgage Insurance 5,664 4,306 5,487 3,728 3,728 6,053 Harmonized Sales Tax 20,806 14,767 19,360 12,627 12,783 24,392 Land Transfer Tax 3,189 1,883 3,029 1,317 1,317 5,722
Total 79,169 64,542 77,753 47,556 47,899 66,887
20.8% 22.3% 21.1% 19.0% 19.1% 16.4%
Charges Paid By
Developer 49,368 43,444 49,737 29,744 29,930 30,576 Home Buyer 29,801 21,098 28,016 17,812 17,969 36,312
Share of Charges Paid
Developer 62% 67% 64% 63% 62% 46%Home Buyer 38% 33% 36% 37% 38% 54%
Source: Altus Group Economic Consulting
Dollars
Percent
Percent
Dollars / Unit
Average Condominium Apartment Price
Government Charges as % of Average New Home Price
Dollars / Unit
In total, government charges for high‐rise in the selected municipalities range
from $47,600 per apartment in the Town of Bradford West Gwillimbury to
$79,200 per apartment in the Town of Oakville:
$79,200 per apartment in the Town of Oakville/Halton Region;
$77,800 per apartment in the City of Markham/York Region;
$66,900 per apartment in the City of Toronto17;
17 We have also calculated the government charges per unit for Toronto based on a significantly
smaller site of 0.3 hectares (0.75 acres). Instead of government charges of $66,900 per apartment, the
government charges would be $53,400 per apartment, or 20% lower. The change in costs is due to
lower parkland dedication costs, property taxes and engineering costs, all driven by the smaller site
size.
Figure 7

July 23, 2013
Government Charges and Fees on New Altus Group Economic Consulting
Homes in the Greater Toronto Area Page 25
$64,500 per apartment in the City of Brampton/Peel Region;
$47,900 per apartment in the Town of Ajax/Durham Region;
$47,600 per apartment in the Town of Bradford West
Gwillimbury/Simcoe County;
As a percentage of the average price of a new apartment, government
charges range from 16.4% in the City of Toronto to 22.3% in the City of
Brampton.
The most significant government charge on new high‐rise homes are
development charges, which range from $11,100 per apartment in the City of
Toronto to $34,000 per apartment in the City of Brampton. Other significant
costs include parkland dedication/cash‐in‐lieu, Harmonized Sales Tax,
engineering and servicing fees, CMHC mortgage insurance, building permits
and land transfer taxes.
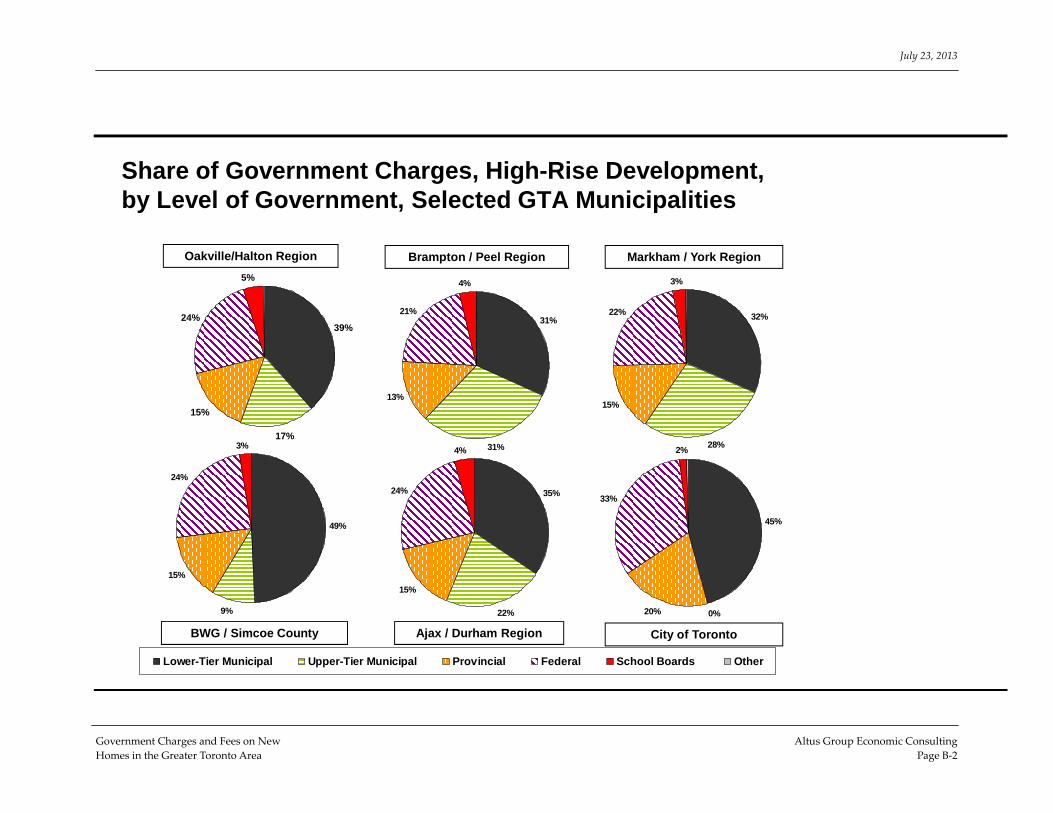
The figures in Appendix B show the government charges for each
municipality by level of government, and by type of cost.
4.3 Implications and Conclusions
Government charges are imposed on either the land owner/developer/home
builder (development charges, building permits, planning approval fees,
parkland dedication, etc.), or the home buyer (CMHC mortgage insurance,
HST, land transfer tax, etc.)
For low‐rise homes, an average of 51% of government charges are paid for by
developers/home builders, with the remaining 49% paid for directly by home
buyers.
For high‐rise homes, an average of 61% of government charges are paid for
by developers/home builders, with the remaining 39% paid for directly by
home buyers.
Government charges imposed on land owners/developers/home builders can
have direct impacts on the price of new housing, as increased costs are likely
to get passed on to new home buyers where the market will allow for
increase house prices. Where the housing market may not allow for increased

July 23, 2013
Government Charges and Fees on New Altus Group Economic Consulting
Homes in the Greater Toronto Area Page 26
house prices, homes will either become more difficult to market, prices will
have to moderate, or developers will have to absorb the additional costs.
Charges imposed on new home buyers increase the costs of home ownership
and reduce the amount of income available to pay on‐going mortgage costs,
as well as other costs of living. Additionally, where charges imposed on
developers/home builders are passed on to home buyers through higher
prices, home buyers will have both a higher mortgage principal to repay, but
will also have higher interest costs associated with a higher mortgage.

Appendix A
Summary Charts for Costs of Low‐Rise
Development

July 23, 2013
Government Charges and Fees on New Altus Group Economic Consulting
Homes in the Greater Toronto Area Page A‐1
Government Charges per Low-Rise Home, by Level of Government, Selected GTA Municipalities
$0
$30,000
$60,000
$90,000
$120,000
$150,000
Oakville Brampton Markham BWG Ajax Toronto
Other
School BoardsFederal
ProvincialUpper-Tier Municipal
Lower-Tier Municipal
Dollars per Unit
Oakville / Halton
Brampton / Peel
Markham / York
BWG / Simcoe Ajax / Durham Toronto
Level of Government
Lower-Tier Municipal 31,850 40,766 31,561 39,635 20,672 39,869 Upper-Tier Municipal 36,501 37,847 42,197 6,806 22,179 n.a.Provincial 32,194 21,654 32,419 12,420 19,364 26,167 Federal 36,434 30,442 37,033 22,253 27,849 33,438 School Boards 4,196 2,572 2,437 1,590 2,259 1,368 Other 156 258 146 291 81 146
Total 141,331 133,540 145,791 82,996 92,405 100,987
590,000 490,000 600,000 410,000 460,000 540,000
Source: Altus Group Economic Consulting
Dollars per Unit
Average New Home Price - 36' Detached

July 23, 2013
Government Charges and Fees on New Altus Group Economic Consulting
Homes in the Greater Toronto Area Page A‐2
Share of Government Charges, Low-Rise Development, by Level of Government, Selected GTA Municipalities
23%
25%
23%
26%
3%
Lower-Tier Municipal Upper-Tier Municipal Provincial Federal School Boards Other
31%
28%
16%
23%
2%
22%
29%22%
25%
2%
Oakville/Halton Region Brampton / Peel Region
22%
24%
21%
31%
2%
48%
8%
15%
27%
2%
Markham / York Region
BWG / Simcoe County Ajax / Durham Region
40%
0%
26%
33%
1%
City of Toronto

July 23, 2013
Government Charges and Fees on New Altus Group Economic Consulting
Homes in the Greater Toronto Area Page A‐3
Government Charges per Home, by Type of Cost, Low-Rise Development, Selected GTA Municipalities
$0
$30,000
$60,000
$90,000
$120,000
$150,000
Oakville Brampton Markham BWG Ajax Toronto
Lower-Tier DCs Upper-Tier DCS Education DCs GO Transit DCs
Approvals & Permits Property Tax Hydro Parkland Dedication
Tarion Enrolment CMHC Mortgage Insurance HST - Provincial Portion HST - Federal Portion
Land Transfer Tax
Dollars per Unit
Oakville / Halton
Brampton / Peel
Markham / York
BWG / Simcoe Ajax / Durham Toronto
Lower Tier DCs 18,957 25,351 19,950 29,024 12,029 19,412 Upper-Tier DCs 35,275 35,532 40,107 6,172 20,940 n.a.Education DCs 3,665 2,146 2,020 1,088 1,964 544 GO Transit DC's 1,032 476 314 - 647 - Planning Review Fees 1,922 2,268 1,390 452 534 1,121 Building Permits 2,694 2,399 2,293 2,747 1,807 3,136 Engineering and Servicing 1,357 2,223 3,567 329 1,589 1,654 Property Tax 2,237 2,241 1,708 2,569 1,775 2,876 Hydro 2,049 3,000 1,900 1,900 2,049 1,396 Parkland Dedication 4,584 6,286 3,405 4,041 2,508 6,846 Tarion Enrolment 1,187 1,040 1,187 961 1,040 1,130 CMHC Mortgage Insurance 8,776 7,289 8,925 6,099 6,843 8,033 HST - Provincial Portion 23,200 15,200 24,000 7,877 12,800 19,200 HST - Federal Portion 27,658 23,153 28,108 16,155 21,007 25,405 Land Transfer Tax 6,738 4,936 6,918 3,583 4,875 10,234
Total 141,331 133,540 145,791 82,996 92,405 100,987
590,000 490,000 600,000 410,000 460,000 540,000
Source: Altus Group Economic Consulting
Dollars / Unit
Average New Home Price - 36' Detached

July 23, 2013
Government Charges and Fees on New Altus Group Economic Consulting
Homes in the Greater Toronto Area Page A‐4
14%
29%
1%
16%
19%
5%
1%2%
6% 5%0%
1%
19%
0%
1%
1%
19%
25%
10%
7%
8%
6%
0%1%
36%
2%1%
10%
20%
4%
7%
5%
7%
4%1%
19%
27%
1%
11%
17%
4%
2%5%
5%
5% 0%2%
13%
23%
1%
14%
23%
5%
2%3%
7%4%
1%
2%
Share of Government Charges by Type of Cost, Low-Rise Development, Selected GTA Municipalities
13%
25%
1%1%
16%
20%
5%
3%
6% 4%
1%
3%
Lower-Tier DCs Upper-Tier DCS Education DCs GO Transit DCs
Approvals & Permits Property Tax Hydro Parkland Dedication
Tarion Enrolment CMHC Mortgage Insurance HST - Provincial Portion HST - Federal Portion
Land Transfer Tax
Oakville /
Halton Region
Brampton /
Peel Region
Markham /
York Region
BWG /
Simcoe County
Ajax /
Durham RegionToronto
Appendix B
High‐Rise Development

July 23, 2013
Government Charges and Fees on New Altus Group Economic Consulting
Homes in the Greater Toronto Area Page B‐1
Government Charges per High-Rise Apartment, by Level of Government, Selected GTA Municipalities
$0
$20,000
$40,000
$60,000
$80,000
Oakville Brampton Markham BWG Ajax Toronto
Lower-Tier Municipal Upper-Tier Municipal Provincial
Federal School Boards Other
Dollars per Unit
Oakville / Halton
Brampton / Peel
Markham / York
BWG / Simcoe Ajax / Durham Toronto
Level of Government
Lower-Tier Municipal 30,344$ 20,512$ 24,503$ 23,412$ 16,505$ 30,711$ Upper-Tier Municipal 13,677$ 19,717$ 21,979$ 4,498$ 10,365$ n.a.Provincial 12,238$ 8,646$ 11,440$ 6,897$ 7,386$ 13,053$ Federal 18,854$ 13,283$ 17,469$ 11,498$ 11,498$ 21,892$ School Boards 3,899$ 2,307$ 2,190$ 1,226$ 2,101$ 1,059$ Other 156$ 76$ 172$ 25$ 43$ 172$
Total 79,169$ 64,542$ 77,753$ 47,556$ 47,899$ 66,887$
380,800 289,500 368,900 250,600 250,600 406,900
Source: Altus Group Economic Consulting
Dollars per Unit
Average Condominium Apartment Price
July 23, 2013
Government Charges and Fees on New Altus Group Economic Consulting
Homes in the Greater Toronto Area Page B‐2
Share of Government Charges, High-Rise Development, by Level of Government, Selected GTA Municipalities
39%
17%
15%
24%
5%
Lower-Tier Municipal Upper-Tier Municipal Provincial Federal School Boards Other
31%
31%
13%
21%
4%
32%
28%
15%
22%
3%
Oakville/Halton Region Brampton / Peel Region
35%
22%
15%
24%
4%
49%
9%
15%
24%
3%
Markham / York Region
BWG / Simcoe County Ajax / Durham Region
45%
0%20%
33%
2%
City of Toronto

July 23, 2013
Government Charges and Fees on New Altus Group Economic Consulting
Homes in the Greater Toronto Area Page B‐3
Government Charges per Apartment, by Type of Cost, High-Rise Development, Selected GTA Municipalities
$0
$20,000
$40,000
$60,000
$80,000
Oakville Brampton Markham BWG Ajax Toronto
Lower-Tier DCs Upper-Tier DCS Education DCs GO Transit DCs
Approvals & Permits Property Tax Hydro Parkland Dedication
Public Art Contribution Tarion Enrolment CMHC Mortgage Insurance HST - Provincial Portion
HST - Federal Portion Land Transfer Tax
Dollars per Unit
Oakville / Halton
Brampton / Peel
Markham / York
BWG / Simcoe Ajax / Durham Toronto
Lower-Tier DCs 9,222 12,938 9,985 14,228 5,610 10,587 Upper-Tier DCs 13,146 18,680 21,272 4,278 9,804 n.a.Education DCs 3,665 2,146 2,020 1,088 1,964 544 GO Transit DCs 539 250 151 n.a. 332 n.a.Planning Review Fees 2,532 694 475 206 497 525 Building Permits 1,594 1,179 984 1,509 929 1,570 Engineering and Servicing 324 798 780 51 693 283 Property Tax 995 848 698 707 834 1,797 Hydro 142 142 140 140 142 145 Parkland Dedication 14,367 5,189 10,388 6,955 8,543 12,207 Public Art Contribution 2,102 - 2,102 2,102 Tarion Enrolment 881 723 881 723 723 961 CMHC Mortgage Insurance 5,664 4,306 5,487 3,728 3,728 6,053 HST - Provincial Portion 7,616 5,790 7,378 4,857 5,012 8,552 HST - Federal Portion 13,190 8,977 11,982 7,771 7,771 15,840 Land Transfer Tax 3,189 1,883 3,029 1,317 1,317 5,722
Total 79,169 64,542 77,753 47,556 47,899 66,887
380,800 289,500 368,900 250,600 250,600 406,900
Source: Altus Group Economic Consulting
Dollars / Unit
Average Condominium Apartment Price

July 23, 2013
Government Charges and Fees on New Altus Group Economic Consulting
Homes in the Greater Toronto Area Page B‐4
16%
1%
4%
18%
3%
1%9%
13%
23%
9%12%
20%
4%
1%
4%18%
2%
8%
10%
16%
3%
30%
9%
2%15%
2%
8%
10%
16%
3%
4%
13%
28%
3%13%
1%
7%
9%
15%
4%
3%
20%
30%
4%
8%
1%
7%
9%
14%
3%
3%
Share of Government Charges by Type of Cost, High-Rise Development, Selected GTA Municipalities
12%
16%
5%
1%
6%
17%3%
1%
7%
10%
17%
4%
Lower-Tier DCs Upper-Tier DCS Education DCs GO Transit DCs
Approvals & Permits Property Tax Hydro Parkland Dedication
Public Art Contribution Tarion Enrolment CMHC Mortgage Insurance HST - Provincial Portion
HST - Federal Portion Land Transfer Tax
Oakville /
Halton Region
Brampton /
Peel Region
Markham /
York Region
BWG /
Simcoe County
Ajax /
Durham RegionToronto
Appendix C
Detailed Tables

July 23, 2013
Government Charges and Fees on New Altus Group Economic Consulting
Homes in the Greater Toronto Area Page C‐1
Common and Variable Assumptions, Hypothetical Low-Rise Development in Selected GTA Municipalities
Common Assumptions
Units (Single-Detached Units) 500 unitsGross Hectares 46.3 gross hectaresNet Hectares (80%) 37.0 net hectaresDensity Requirement 50 persons per net hectareAverage PPU - New Single Detached unit 3.70 persons per unit Units per Net Hectare 13.5 units / net hectare
Frontage 36 feetTotal Frontage 18,000 feet frontage
Average Size per Unit (ft2) 2,000 square feetAverage Size per Unit (m2) 186 square metres
First Time Home Buyer % 40%
Servicing Costs Dollars
Road Works 3,199,029 Water / Sewer Works 2,687,184 Storm Sewer Works 2,148,681 Site Preparation 853,074
Cost of Engineering Works 8,887,968
Loan to Value Ratio 85%CMHC Mortgage Premium 1.75%
Number of Fixtures per Unit 9.0
Oakville Brampton Markham BWG Ajax Toronto
Variable Assumptions
Average Value per ft2 - New Homes $295.54 $244.59 $299.12 $203.02 $232.45 $270.88
Average Home Value - 36' Detached 590,000 490,000 600,000 410,000 460,000 540,000
Value per Hectare (Residential) 991,163 782,955 736,273 873,732 542,255 1,480,306 Value per Hectare (Raw) 187,742 205,396 316,702 114,120 140,363 529,646
Property Value 45,841,273 36,211,662 34,052,623 40,410,127 25,079,307 68,464,172
Source: Altus Group Economic Consulting based on Realnet Canada, Delta Urban Inc., Municipal Fees and Related Charges , (November 25, 2009)
Dollars per Square Foot
Dollars per Unit
Dollars per Hectare
Dollars

July 23, 2013
Government Charges and Fees on New Altus Group Economic Consulting
Homes in the Greater Toronto Area Page C‐2
Common and Variable Assumptions, Hypothetical High-Rise Development in Selected GTA Municipalities
Common Assumptions
Units (Single-Detached Units) 500 unitsGross Hectares 4.0 gross hectaresNet Hectares (80%) 3.2 net hectaresUnits per Net Hectare 156.3 units / net hectare
Loan to Value Ratio 85%CMHC Mortgage Premium 1.75%
First Time Home Buyer % 40%
Total Frontage 1,312 feet frontageBuilding Area (Units) 408,500 Building Area (Total) 490,200 (20% additional area)
One-Bedroom
One-Bedroom +
DenTwo-
Bedroom
Two-Bedroom +
Den 3-Bedroom Total
Unit Mix and Unit Sizes
Average Size per Unit (ft2) 600 710 920 1,180 1,310 Average Size per Unit (m2) 56 66 85 110 122
Share of Units 30% 25% 30% 10% 5% 100%Units by Type 150 125 150 50 25 500
Servicing Costs Dollars
Metres of Arterial Road Frontage 400 Cost of Site Servicing per Metre of Arterial Road 3,800 Site Servicing 1,520,000
One-Bedroom
One-Bedroom +
DenTwo-
Bedroom
Two-Bedroom +
Den 3-BedroomWeighted Average
Oakville 279,000 314,000 422,000 597,000 646,000 380,800 Brampton 207,000 252,000 314,000 410,000 583,333 289,500 Markham 269,000 322,000 415,000 543,000 577,000 368,900 Bradford West Gwillimbury 176,000 221,000 281,000 319,000 527,000 250,600 Ajax 176,000 221,000 281,000 319,000 527,000 250,600 Toronto 300,000 361,000 451,000 600,000 626,000 406,900
Source: Altus Group Economic Consulting based on Realnet Canada, Altus Group Cost Guide 2012
Dollars per UnitCondominium Apartment Unit Pricing by Municipality

July 23, 2013
Government Charges and Fees on New Altus Group Economic Consulting
Homes in the Greater Toronto Area Page C‐3
Development Charge Rates and Revenues, Selected GTA Municipalities, Low-Rise Development
Oakville Brampton Markham
Bradford West
Gwillimbury Ajax Toronto
DC Rates
Lower-Tier (Town/City-Wide) 18,957 25,351 19,626 29,024 12,029 19,412 Lower-Tier (Area-Specific) n.a. n.a. 3,500 1 n.a. n.a. n.a.Upper-Tier 35,275 35,532 40,107 6,172 20,940 n.a.GO Transit 1,032 476 314 n.a. 647 n.a.Education 3,665 2,146 2,020 1,088 1,964 544
DC Revenues
Lower-Tier (Town/City-Wide) 9,478,500 12,675,375 9,813,000 14,512,000 6,014,500 9,706,000 Lower-Tier (Area-Specific) n.a. n.a. 161,875 n.a. n.a. n.a.Upper-Tier 17,637,490 17,765,970 20,053,500 3,086,000 10,470,000 n.a.GO Transit 516,000 238,195 157,000 n.a. 323,500 n.a.Education 1,832,500 1,073,000 1,010,000 544,000 982,000 272,000
Total DC Revenues 29,464,490 31,752,540 31,195,375 18,142,000 17,790,000 9,978,000
Average DC Revenue per Unit 58,929 63,505 62,391 36,284 35,580 19,956
1 Area-specific DC rates are per hectareSource: Altus Group Economic Consulting based on various DC By-laws and Pamphlets
Dollars per Unit
Dollars
Dollars per Unit

July 23, 2013
Government Charges and Fees on New Altus Group Economic Consulting
Homes in the Greater Toronto Area Page C‐4
Oakville Brampton Markham
Bradford West
Gwillimbury Ajax Toronto
DC Rates
Lower-Tier - Large Apartments 12,019 17,134 12,138 16,325 6,628 12,412 Lower-Tier - Small Apartments 6,934 9,505 7,292 11,664 4,365 8,356
Lower-Tier (Area-Specific) n.a. n.a. 3,500 1 n.a. n.a. n.a.Upper-Tier - Large Apartments 13,146 25,380 24,863 4,278 11,766 n.a.Upper-Tier - Small Apartments n.a. 13,198 16,884 n.a. 7,407 n.a.GO Transit 539 340 182 n.a. 406 n.a.Education 3,665 2,146 2,020 1,088 1,964 544
DC Revenues
Lower-Tier (Town/City-Wide) 4,611,125 6,468,896 4,978,650 7,113,775 2,804,825 5,293,400 Lower-Tier (Area-Specific) n.a. n.a. 14,000 n.a. n.a. n.a.Upper-Tier 6,573,180 9,339,825 10,636,225 2,139,000 4,902,225 n.a.GO Transit 269,680 125,059 75,700 n.a. 165,875 n.a.Education 1,832,500 1,073,000 1,010,000 544,000 982,000 272,000
Total DC Revenues 13,286,485 17,006,781 16,714,575 9,796,775 8,854,925 5,565,400
Average DC Revenue per Unit 26,573 34,014 33,429 19,594 17,710 11,131
1 Area-specific DC rates are per hectareSource: Altus Group Economic Consulting based on various DC By-laws and Pamphlets
Dollars per Unit
Dollars
Dollars per Unit
Development Charge Rates and Revenues, Selected GTA Municipalities, High-Rise Development

July 23, 2013
Government Charges and Fees on New Altus Group Economic Consulting
Homes in the Greater Toronto Area Page C‐5
Planning Review Fees
Building Permits
Engineering Supervision &
Inspection
Oakville
Town of Oakville 854,796 1,347,094 516,069 Region of Halton 28,321 - 143,859 Other 77,980 - 18,702
Total 961,097 1,347,094 678,630
Brampton
City of Brampton 975,724 1,196,591 428,170 Region of Peel 31,500 - 683,295 Other 126,710 3,000 -
Total 1,133,934 1,199,591 1,111,465
Markham
City of Markham 580,130 1,146,423 1,207,868 Region of York 42,000 - 575,825 Other 72,760 - -
Total 694,890 1,146,423 1,783,693
Bradford West Gwillimbury
Town of BWG 68,000 1,373,500 152,813 Simcoe County 12,700 - 11,600 Other 145,450 - -
Total 226,150 1,373,500 164,413
Ajax
Town of Ajax 201,720 903,307 684,697 Region of Durham 23,500 - 109,669 Other 41,948 - -
Total 267,168 903,307 794,366
Toronto
City of Toronto 487,783 1,568,005 826,782 Other 72,760 - -
Total 560,543 1,568,005 826,782
Source: Altus Group Economic Consulting
Municipal Approval & Permit Fees, Low-Rise Development
Dollars

July 23, 2013
Government Charges and Fees on New Altus Group Economic Consulting
Homes in the Greater Toronto Area Page C‐6
Planning Review Fees
Building Permits
Engineering Supervision &
Inspection
Oakville
Town of Oakville 1,166,689 796,806 108,163 Region of Halton 21,493 - 47,500 Other 77,980 - 6,175
Total 1,266,162 796,806 161,838
Brampton
City of Brampton 290,424 586,341 69,285 Region of Peel 21,500 - 329,679 Other 35,065 3,000 -
Total 346,989 589,341 398,964
Markham
City of Markham 109,450 491,942 253,348 Region of York 42,000 - 136,800 Other 86,010 - -
Total 237,460 491,942 390,148
Bradford West Gwillimbury
Town of BWG 77,800 754,355 8,725 Simcoe County 12,700 - 16,600 Other 12,250 - -
Total 102,750 754,355 25,325
Ajax
Town of Ajax 202,840 464,531 318,594 Region of Durham 23,500 - 27,862 Other 22,390 - -
Total 248,730 464,531 346,456
Toronto
City of Toronto 176,717 784,797 141,596 Other 86,010 - -
Total 262,727 784,797 141,596
Source: Altus Group Economic Consulting
Municipal Approval & Permit Fees, High-Rise Development
Dollars

July 23, 2013
Government Charges and Fees on New Altus Group Economic Consulting
Homes in the Greater Toronto Area Page C‐7
Property Tax Rates and Revenues, Selected GTA Municipalities, Low-Rise Development
Oakville / Halton Region
Brampton / Peel Region
Markham / York Region
Bradford West
Gwillimbury / Simcoe County
Ajax / Durham Region
City of Toronto
Hectares 46.3 46.3 46.3 46.3 46.3 46.3
Raw Vacant Land - Value 187,742 205,396 316,702 436,866 140,363 529,646
Property Tax Rate 0.198713% 0.290437% 0.226370% 0.282560% 0.279638% 0.192800%
Years of Raw Unserviced Land 2.5 2.5 2.5 2.5 2.5 2.5
Total Property Taxes Payable - Raw Land 43,136 68,976 82,894 142,729 45,384 118,071
Vacant Residential Land - Value 991,163 782,955 736,273 873,732 542,255 1480306.428
Property Tax Rate 0.938318% 1.161747% 0.905489% 1.130235% 1.342943% 0.771198%
Years of Serviced Land Before Development 2.5 2.5 2.5 2.5 2.5 2.5
Total Property Taxes Payable - Vacant Res. Land 1,075,342 1,051,720 770,857 1,141,824 842,002 1,319,986
Total Property Taxes 1,118,478 1,120,696 853,750 1,284,552 887,386 1,438,057
Lower/Single-Tier Municipality Share 412,208 464,591 218,367 740,848 253,390 1,025,957 Upper-Tier Municipality Share 441,004 442,914 427,011 292,529 486,465 n.a.Education Share 265,267 213,191 208,373 251,174 147,530 412,100
Note:
Source: Altus Group Economic Consulting based on City, Town, County and/or Region tax rates for 2012, Realnet Canada
Dollars per Hectare
Gross Hectares
Dollars per Hectare
Percent
Years
Percent
We have used farmland tax rates for first half of five year period, and residential tax rates for second half of five year period. Not all municipalities have "farmland awaiting development" tax rates, so we have used residential tax rates to keep the assumptions consistent for each municipality
Years
Dollars
Dollars
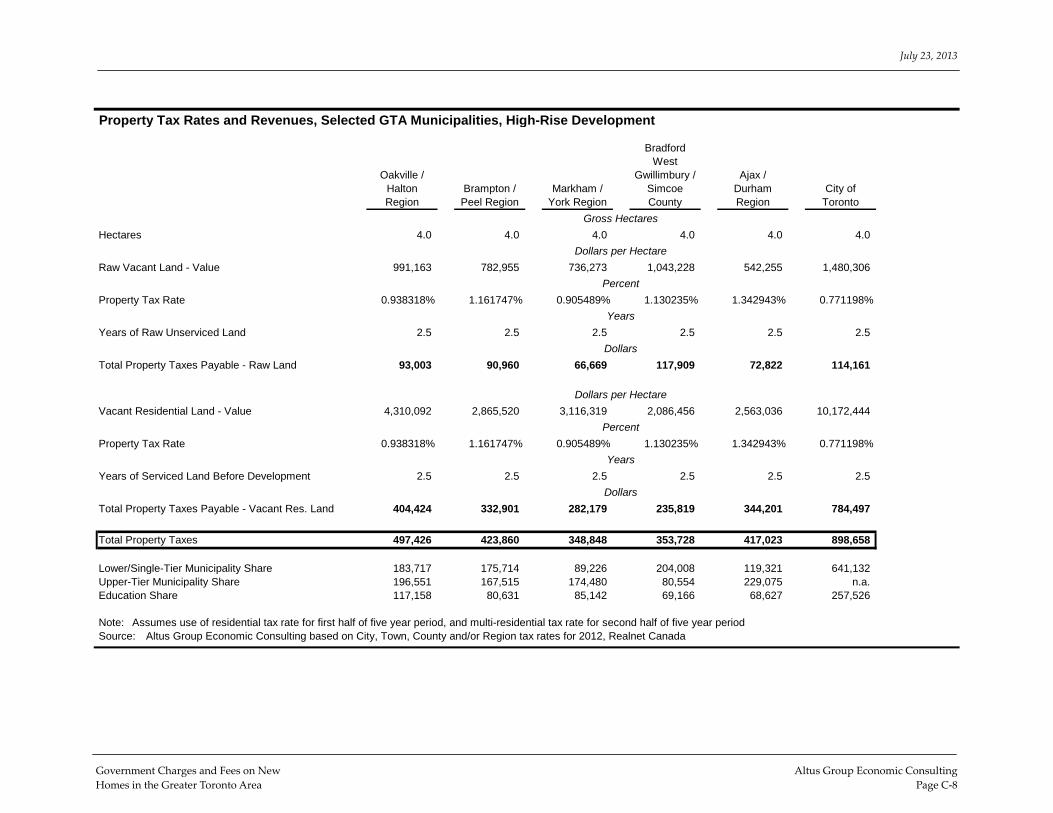
July 23, 2013
Government Charges and Fees on New Altus Group Economic Consulting
Homes in the Greater Toronto Area Page C‐8
Property Tax Rates and Revenues, Selected GTA Municipalities, High-Rise Development
Oakville / Halton Region
Brampton / Peel Region
Markham / York Region
Bradford West
Gwillimbury / Simcoe County
Ajax / Durham Region
City of Toronto
Hectares 4.0 4.0 4.0 4.0 4.0 4.0
Raw Vacant Land - Value 991,163 782,955 736,273 1,043,228 542,255 1,480,306
Property Tax Rate 0.938318% 1.161747% 0.905489% 1.130235% 1.342943% 0.771198%
Years of Raw Unserviced Land 2.5 2.5 2.5 2.5 2.5 2.5
Total Property Taxes Payable - Raw Land 93,003 90,960 66,669 117,909 72,822 114,161
Vacant Residential Land - Value 4,310,092 2,865,520 3,116,319 2,086,456 2,563,036 10,172,444
Property Tax Rate 0.938318% 1.161747% 0.905489% 1.130235% 1.342943% 0.771198%
Years of Serviced Land Before Development 2.5 2.5 2.5 2.5 2.5 2.5
Total Property Taxes Payable - Vacant Res. Land 404,424 332,901 282,179 235,819 344,201 784,497
Total Property Taxes 497,426 423,860 348,848 353,728 417,023 898,658
Lower/Single-Tier Municipality Share 183,717 175,714 89,226 204,008 119,321 641,132 Upper-Tier Municipality Share 196,551 167,515 174,480 80,554 229,075 n.a.Education Share 117,158 80,631 85,142 69,166 68,627 257,526
Note: Assumes use of residential tax rate for first half of five year period, and multi-residential tax rate for second half of five year periodSource: Altus Group Economic Consulting based on City, Town, County and/or Region tax rates for 2012, Realnet Canada
Gross Hectares
Percent
Dollars per Hectare
Years
Dollars
Dollars
Years
Dollars per Hectare
Percent

July 23, 2013
Government Charges and Fees on New Altus Group Economic Consulting
Homes in the Greater Toronto Area Page C‐9
Oakville Brampton Markham
Bradford West
Gwillimbury Ajax
City of
Toronto 2
Parkland Dedication / Cash-in-Lieu
5% of Land; or 2.31 2.31 2.31 2.31 2.31 2.31 1 hectare per 300 units (except Toronto - 0.4ha/300) 1.67 1.67 1.67 1.67 1.67 0.67 Greater Amount 2.31 2.31 2.31 2.31 2.31 2.31
Value per Hectare 991,163 1,359,031 736,273 873,732 542,255 1,480,306
Total Value of Parkland Dedication 2,292,064 3,142,760 1,702,631 2,020,506 1,253,965 3,423,209
Tarion
Average Sales Price of New Homes 590,000 490,000 600,000 410,000 460,000 540,000 Tarion Enrolment Fee - Per Unit 1,187 1,040 1,187 961 1,040 1,130
Tarion Enrolment Fee Revenues 593,250 519,800 593,250 480,250 519,800 565,000
CMHC Mortgage Insurance
Average Sales Price of New Homes 590,000 490,000 600,000 410,000 460,000 540,000
Loan Value (10% downpayment) 90% 90% 90% 90% 90% 85%CMHC Mortgage Insurance Premium 2% 2% 2% 2% 2% 2%
Mortgage Value 531,000 441,000 540,000 369,000 414,000 459,000 CMHC Mortage Insurance Premium - Per Unit 9,293 7,718 9,450 6,458 7,245 8,033
Total CMHC Mortgage Insuarance Premiums 4,646,250 3,858,750 4,725,000 3,228,750 3,622,500 4,016,250
Hydro Costs 1,024,500 1 1,500,000 950,000 950,000 1,024,500 1 698,000
1 Information not available for Ajax or Oakville. Instead, average of other four municipalities used as proxy.2 City of Toronto parkland fees capped at 20% of value of site, but payments must be a minimum of 5% of value of site using the 0.4 hectares / 300 unit rateSource: Altus Group Economic Consulting based on CMHC, Tarion and various Official Plan policies
Dollars per Unit
Dollars
Dollars per Unit
Parkland Dedication Rates and Revenues, Tarion Enrolment Fees, CMHC Mortgage Insurance Premiums and Hydro Costs, Selected GTA Municipalities, Low-Rise Development
Dollars
Percent
Dollars
Hectares
Dollars per Hectare
Dollars per Unit

July 23, 2013
Government Charges and Fees on New Altus Group Economic Consulting
Homes in the Greater Toronto Area Page C‐10
Oakville Brampton Markham
Bradford West
Gwillimbury Ajax
City of
Toronto 3
Parkland Dedication / Cash-in-Lieu
5% of Land; or 0.20 0.20 0.20 0.20 0.20 1 hectare per 300 units (except Toronto - 0.4 ha/300) 1.67 1.67 1.67 1.67 1.67 0.67 Greater Amount 1.67 1.67 1.67 1.67 1.67 0.67
Value per Hectare 4,310,092 1,556,709 1 3,116,319 2,086,456 2,563,036 10,172,444
Total Value of Parkland Dedication 7,183,486 2,594,514 5,193,864 3,477,427 4,271,727 6,103,467
Tarion
Average Sales Price of New Homes 380,800 289,500 368,900 250,600 250,600 406,900 Tarion Enrolment Fee - Per Unit 881 723 881 723 723 961
Tarion Enrolment Fee Revenues 440,700 361,600 440,700 361,600 361,600 480,250
CMHC Mortgage Insurance
Average Sales Price of New Homes 380,800 289,500 368,900 250,600 250,600 406,900
Loan Value (10% downpayment) 90% 90% 90% 90% 90% 85%CMHC Mortgage Insurance Premium 2% 2% 2% 2% 2% 2%
Mortgage Value 342,720 260,550 332,010 225,540 225,540 345,865 CMHC Mortage Insurance Premium - Per Unit 5,998 4,560 5,810 3,947 3,947 6,053
Total CMHC Mortgage Insuarance Premiums 2,998,800 2,279,813 2,905,088 1,973,475 1,973,475 3,026,319
Hydro Costs 70,833 2 70,833 2 70,000 70,000 70,833 2 72,500
1 The City of Brampton prescribes land value for parkland dedication of $630,000 per acre, which is reduced by 60% from $1,575,000 per acre 2 Information not available for Oakville, Brampton or Ajax. Instead, average of other three municipalities used as proxy 3 Value of land provided through City of Toronto parkland dedication rate of 0.4 hectares / 300 units not to exceed 15% of value of siteSource: Altus Group Economic Consulting based on CMHC, Tarion and various Official Plan policies
Parkland Dedication Rates and Revenues, Tarion Enrolment Fees, CMHC Mortgage Insurance Premiums and Hydro Costs, Selected GTA Municipalities, High-Rise Development
Hectares
Dollars per Unit
Dollars per Unit
Dollars per Unit
Dollars
Percent
Dollars per Hectare
Dollars
Dollars

July 23, 2013
Government Charges and Fees on New Altus Group Economic Consulting
Homes in the Greater Toronto Area Page C‐11
Provincial Federal Provincial Federal Provincial Federal Provincial Federal Provincial Federal Provincial Federal
Harmonized Sales Tax
Average Sales Price - Single-Detached 590,000 590,000 490,000 490,000 600,000 600,000 410,000 410,000 460,000 460,000 540,000 540,000 Value of Consideration 553,153 553,153 463,063 463,063 562,162 562,162 393,845 393,845 436,786 436,786 508,108 508,108
Share of HST Rate 8% 5% 8% 5% 8% 5% 8% 5% 8% 5% 8% 5%
Share of HST Payable 47,200 27,658 39,200 23,153 48,000 28,108 31,508 19,692 36,800 21,839 43,200 25,405
Rebate 24,000 - 24,000 - 24,000 - 23,631 3,538 24,000 832 24,000 - Remaining Payable per Unit 23,200 27,658 15,200 23,153 24,000 28,108 7,877 16,155 12,800 21,007 19,200 25,405
Total HST Revenues 11,600,000 13,828,829 7,600,000 11,576,577 12,000,000 14,054,054 3,938,455 8,077,269 6,400,000 10,503,410 9,600,000 12,702,703
Source: Altus Group Economic Consulting based on Canada Revenue Agency, GST/HST Info Sheet, (July 2010)
Calculation of Harmonized Sales Tax Payable on New Homes, Selected GTA Municipalities, Low-Rise Development
Oakville AjaxBradford West GwillimburyMarkhamBrampton Toronto
Dollars
Dollars per Unit
Percent
Dollars per Unit
Provincial Federal Provincial Federal Provincial Federal Provincial Federal Provincial Federal Provincial Federal
Harmonized Sales Tax
Average Sales Price of Condo Apts 380,800 380,800 289,500 289,500 368,900 368,900 250,600 250,600 250,600 250,600 406,900 406,900 Value of Consideration 367,610 367,610 280,523 280,523 356,918 356,918 242,829 242,829 242,829 242,829 391,060 391,060
Share of HST Rate 8% 5% 8% 5% 8% 5% 8% 5% 8% 5% 8% 5%
Share of HST Payable 30,464 18,381 23,160 14,026 29,512 17,846 19,426 12,141 20,048 12,141 32,552 19,553
Rebate 22,848 5,191 17,370 5,049 22,134 5,864 14,570 4,371 15,036 4,371 24,000 3,713 Remaining Payable per Unit 7,616 13,190 5,790 8,977 7,378 11,982 4,857 7,771 5,012 7,771 8,552 15,840
Total HST Revenues 3,808,000 6,594,969 2,895,000 4,488,372 3,689,000 5,990,881 2,428,295 3,885,271 2,506,000 3,885,271 4,276,000 7,919,901
Source: Altus Group Economic Consulting based on Canada Revenue Agency, GST/HST Info Sheet, (July 2010)
Calculation of Harmonized Sales Tax Payable on New Homes, Selected GTA Municipalities, High-Rise Development
Oakville AjaxBradford West GwillimburyMarkhamBrampton
Percent
Dollars per Unit
Dollars
Toronto
Dollars per Unit

July 23, 2013
Government Charges and Fees on New Altus Group Economic Consulting
Homes in the Greater Toronto Area Page C‐12
City Provincial
Land Transfer Tax
0.5% of value up to $55,000 275 275 275 275 275 275 275 1% of value between $55,000 and $250,000 1,950 1,950 1,950 1,950 1,950 n.a. 1,950 1.5% of value between $250,000 and $400,000 2,250 2,250 2,250 2,158 2,250 n.a. 2,250 1% of value between $55,000 and $400,000 3,450 n.a.2% amounts exceeding $400,000 3,063 1,261 3,243 - 1,200 2,162 2,162
Total Payable per Unit - Before Rebates 7,538 5,736 7,718 4,383 5,675 5,887 6,637
Units Not Occupied by First-Time Buyers 300 300 300 300 300 300 300
Revenue from Non-First Time Buyers 2,261,419 1,720,878 2,315,473 1,314,805 1,702,500 1,766,149 1,991,149
Units Occupied by First-Time Buyers 200 200 200 200 200 200 200
Total Revenue Before Rebate 1,507,613 1,147,252 1,543,649 876,536 1,135,000 1,177,432 1,327,432 Rebate 2,000 2,000 2,000 2,000 2,000 3,725 2,000 Total Rebates 400,000 400,000 400,000 400,000 400,000 745,000 400,000
Revenue from First-Time Buyers 1,107,613 747,252 1,143,649 476,536 735,000 432,432 927,432
Total Land Transfer Tax Revenues 3,369,032 2,468,131 3,459,122 1,791,341 2,437,500 2,198,581 2,918,581
Source: Altus Group Economic Consulting based on CMHC, Tarion and various Official Plan policies
Land Transfer Tax Revenues, Selected GTA Municipalities, Low-Rise Development
TorontoAjax
Bradford West
GwillimburyMarkhamBramptonOakville
Dollars
Dollars
Units
Units
Dollars

July 23, 2013
Government Charges and Fees on New Altus Group Economic Consulting
Homes in the Greater Toronto Area Page C‐13
City Provincial
Land Transfer Tax0.5% of value up to $55,000 275 275 275 275 275 275 275 1% of value between $55,000 and $250,000 1,950 1,950 1,950 1,950 1,950 n.a. 1,950 1.5% of value between $250,000 and $400,000 1,764 458 1,604 (108) (108) n.a. 2,116 1% of value between $55,000 and $400,000 3,361 n.a.2% amounts exceeding $400,000 - - - - - - -
Total Payable per Unit - Before Rebates 3,989 2,683 3,829 2,117 2,117 3,636 4,341
Units Not Occupied by First-Time Buyers 300 300 300 300 300 300 300
Revenue from Non-First Time Buyers 1,196,745 804,855 1,148,632 635,233 635,233 1,090,681 1,302,271
Units Occupied by First-Time Buyers 200 200 200 200 200 200 200
Total Revenue Before Rebate 797,830 536,570 765,755 423,488 423,488 727,120 868,181 Rebate 2,000 2,000 2,000 2,000 2,000 3,636 2,000 Total Rebates 400,000 400,000 400,000 400,000 400,000 745,000 400,000
Revenue from First-Time Buyers 397,830 136,570 365,755 23,488 23,488 - 468,181
Total Land Transfer Tax Revenues 1,594,575 941,424 1,514,387 658,721 658,721 1,090,681 1,770,451
Source: Altus Group Economic Consulting based on CMHC, Tarion and various Official Plan policies
Land Transfer Tax Revenues, Selected GTA Municipalities, High-Rise Development
TorontoAjax
Bradford West
GwillimburyMarkhamBramptonOakville
Dollars
Dollars
Units
Units
Dollars