Goldman Sachs Presentation to Credit Suisse Financial ... · PDF fileGoldman Sachs...
14
Goldman Sachs Presentation to Credit Suisse Financial Services Conference February 7, 2017 Lloyd C. Blankfein Chairman and Chief Executive Officer 1
Transcript of Goldman Sachs Presentation to Credit Suisse Financial ... · PDF fileGoldman Sachs...

Goldman Sachs Presentation to
Credit Suisse Financial Services Conference
February 7, 2017
Lloyd C. Blankfein
Chairman and Chief Executive Officer
1

Cautionary Note on Forward-Looking Statements
Today’s presentation may include forward-looking statements. These statements are not historical facts,
but instead represent only the Firm’s beliefs regarding future events, many of which, by their nature, are
inherently uncertain and outside of the Firm’s control. It is possible that the Firm’s actual results and
financial condition may differ, possibly materially, from the anticipated results and financial condition
indicated in these forward-looking statements.
For a discussion of some of the risks and important factors that could affect the Firm’s future results and
financial condition, see “Risk Factors” in our Annual Report on Form 10-K for the year ended December
31, 2015. You should also read the forward-looking disclaimers in our Form 10-Q for the period ended
September 30, 2016, particularly as it relates to capital and leverage ratios, and information on the
calculation of non-GAAP financial measures that is posted on the Investor Relations portion of our
website: www.gs.com.
The statements in the presentation are current only as of its date, February 7, 2017.
2

Uniquely positioned in an industry increasingly
driven by holistic advice, solutions,
implementation and service
Focused on performing well for our clients
~15,000 PWM, Institutional and Third-party
Distribution clients; over 5mm GSAM mutual
fund investors
Strong track record of risk-adjusted returns
over the past 5 years
— Private Equity
— Corporate, PWM and Real Estate Lending
— Middle Market and Specialty Financing
Adaptable in response to regulation and
business environment
Among the few global players with leading
FICC and Equities franchises, with ~7,000
active clients
Focused on increasing penetration with Asset
Managers and Corporates
Diversified client mix and robust ROAE
framework
Committed to Meeting the Needs of Our Clients
#1 ranked global M&A advisor
Over 8,000 clients globally ~100 countries
across a broad range of industries
Advice, capital raising, hedging and risk
management solutions; leading merger
defense franchise
Investment Banking 21% of 2016 Net Revenues
Institutional Client Services 47% of 2016 Net Revenues
Investment Management 19% of 2016 Net Revenues
Investing & Lending 13% of 2016 Net Revenues
Strong position in each of our businesses
3

-40% -13%
+19%
+12%
1Q16 2Q16 3Q16 4Q16
Continued improvement relative to a very challenging start of the year
Positive momentum heading into 2017
2016 Performance Review
Two consecutive quarters of
double-digit ROE
4
6.4%
8.7%
11.2% 11.4%
1Q16 2Q16 3Q16 4Q16
A tale of two halves
YoY Net Revenues (% ∆)
Two consecutive quarters of
YoY Net Revenues growth (% ∆)
-28%
+16%
1H16 2H16
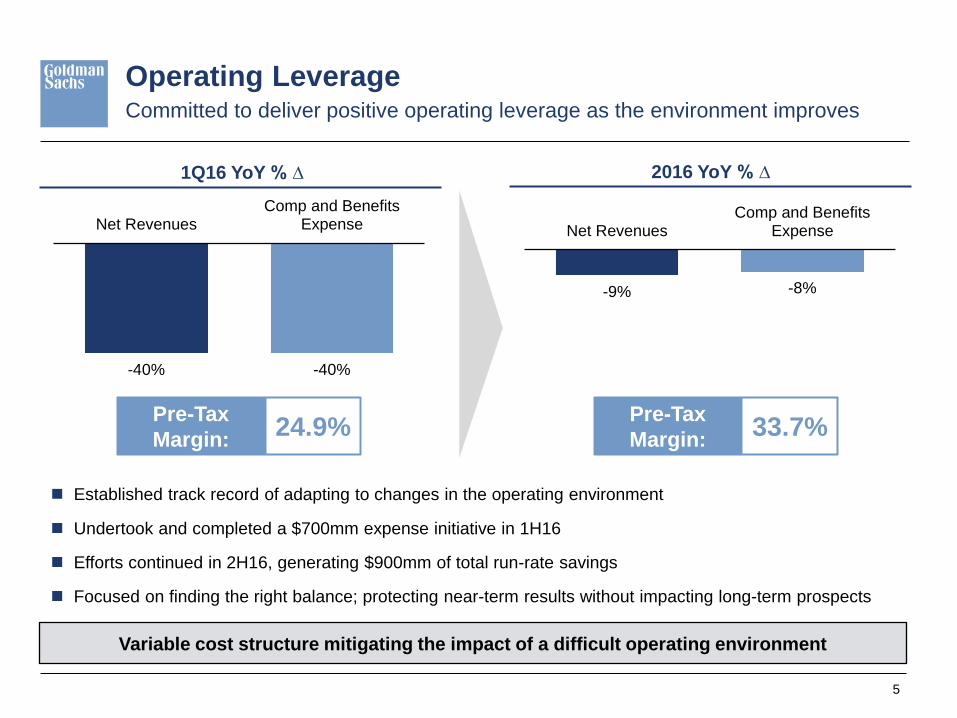
Established track record of adapting to changes in the operating environment
Undertook and completed a $700mm expense initiative in 1H16
Efforts continued in 2H16, generating $900mm of total run-rate savings
Focused on finding the right balance; protecting near-term results without impacting long-term prospects
Committed to deliver positive operating leverage as the environment improves
Operating Leverage
1Q16 YoY % ∆ 2016 YoY % ∆
24.9% Pre-Tax
Margin:
Variable cost structure mitigating the impact of a difficult operating environment
33.7% Pre-Tax
Margin:
5
-9% -8%
Net RevenuesComp and Benefits
Expense
-40% -40%
Net RevenuesComp and Benefits
Expense

Continued focus on operating efficiency over the past five years
Optimizing Costs and Efficiency
Finding the right balance
6
$2.8bn Announced and
completed initiatives
$1.9 billion
$ 0.9 billion
Announced expense initiatives
1 Initial expense initiative of $1.2bn announced in 2Q11 and increased by $0.2bn in 4Q11 and by $0.5bn in 2Q12
Supported continued
strategic investment &
improved operating
leverage
Maintained long-term focus
& optionality for better
environment
Responsive to current
environment & protecting
near-term results
Run-rate savings
announced in 2016
Run-rate savings
through 2011-20121
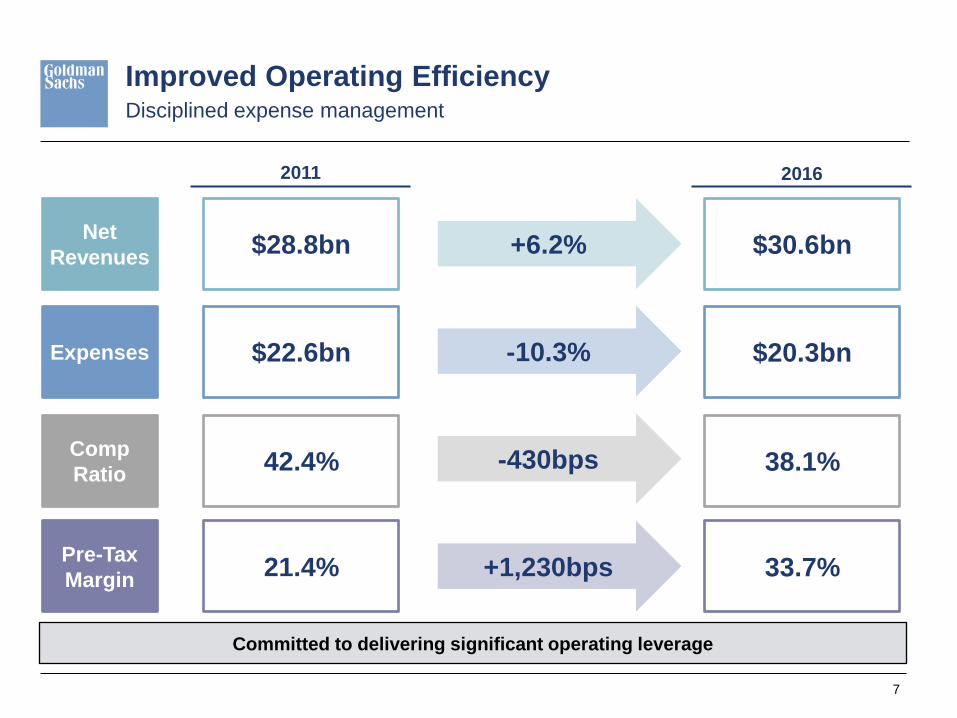
$28.8bn
Disciplined expense management
Improved Operating Efficiency
2011 2016
$30.6bn
33.7% 21.4%
$22.6bn $20.3bn
Net
Revenues
Pre-Tax
Margin
Expenses
+6.2%
-10.3%
+1,230bps
38.1% 42.4% Comp
Ratio -430bps
Committed to delivering significant operating leverage
7

Track record of adaptability
Continued Adjustment to Regulation
We’ve invested heavily to improve our financial profile and comply with regulations
Regulatory developments Improved risk profile (2007 – 2016)
1.9x -62%
Gross
Leverage
Common
Equity
GSIB-Surcharge
Basel III Risk-Based Capital
Liquidity Coverage Ratio
Supplementary Leverage Ratio
Dodd-Frank
CCAR
$76bn 9.9x
Global Core
Liquid Assets1
3.7x
$226bn
1 Prior to 4Q09, GCLA reflects loan value and subsequent periods reflect fair value 8
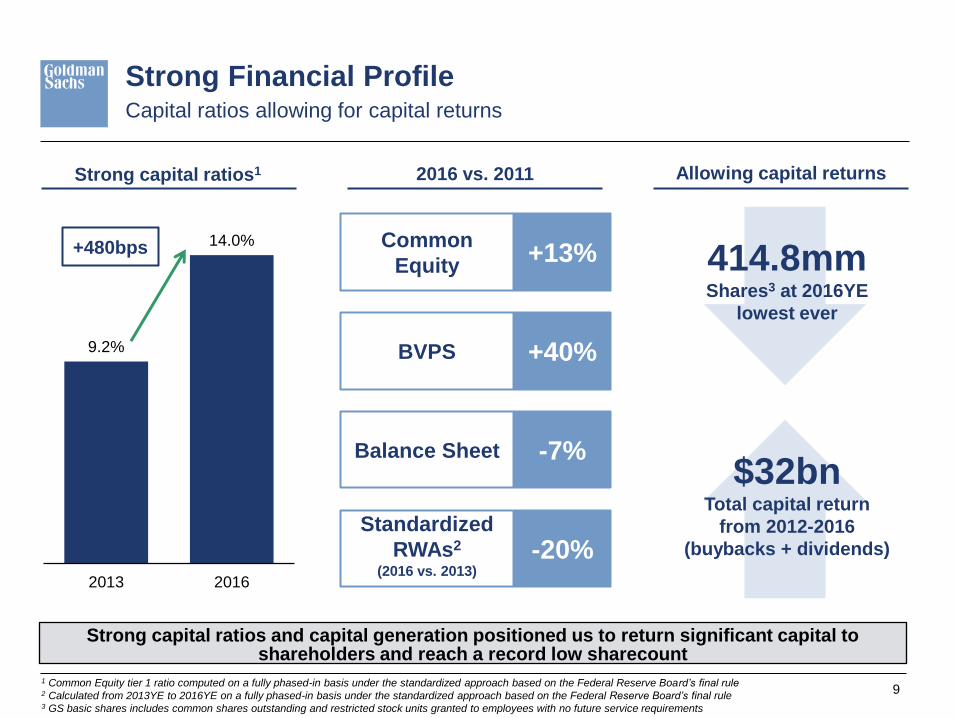
9.2%
14.0%
2013 2016
Capital ratios allowing for capital returns
Strong Financial Profile
Strong capital ratios and capital generation positioned us to return significant capital to shareholders and reach a record low sharecount
Allowing capital returns
414.8mm Shares3 at 2016YE
lowest ever
$32bn Total capital return
from 2012-2016
(buybacks + dividends)
2016 vs. 2011
1 Common Equity tier 1 ratio computed on a fully phased-in basis under the standardized approach based on the Federal Reserve Board’s final rule 2 Calculated from 2013YE to 2016YE on a fully phased-in basis under the standardized approach based on the Federal Reserve Board’s final rule 3 GS basic shares includes common shares outstanding and restricted stock units granted to employees with no future service requirements
Strong capital ratios1
+480bps
9
+13% Common
Equity
+40% BVPS
-7% Balance Sheet
-20% Standardized
RWAs2
(2016 vs. 2013)
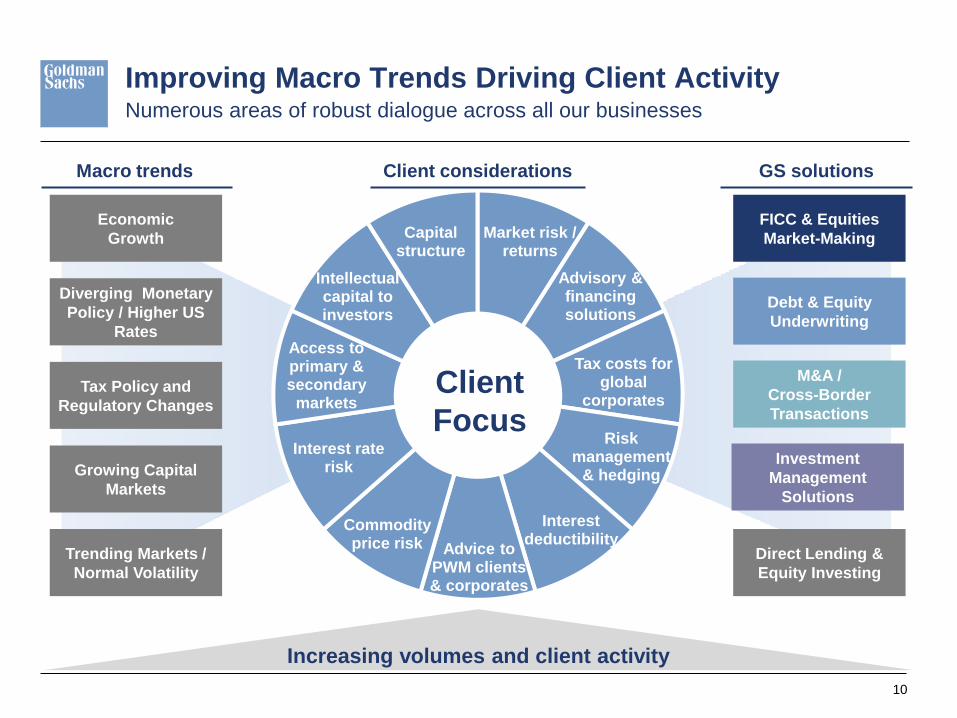
Client
Focus
Market risk / returns
Advisory & financing solutions
Tax costs for global
corporates
Risk management
& hedging
Interest deductibility
Advice to PWM clients & corporates
Commodity price risk
Access to primary & secondary
markets
Interest rate risk
Intellectual capital to investors
Capital structure
Increasing volumes and client activity
Improving Macro Trends Driving Client Activity
GS solutions Macro trends
Numerous areas of robust dialogue across all our businesses
Economic
Growth
Diverging Monetary
Policy / Higher US
Rates
Growing Capital
Markets
Tax Policy and
Regulatory Changes
Trending Markets /
Normal Volatility
M&A /
Cross-Border
Transactions
Debt & Equity
Underwriting
Investment
Management
Solutions
Direct Lending &
Equity Investing
FICC & Equities
Market-Making
Client considerations
10
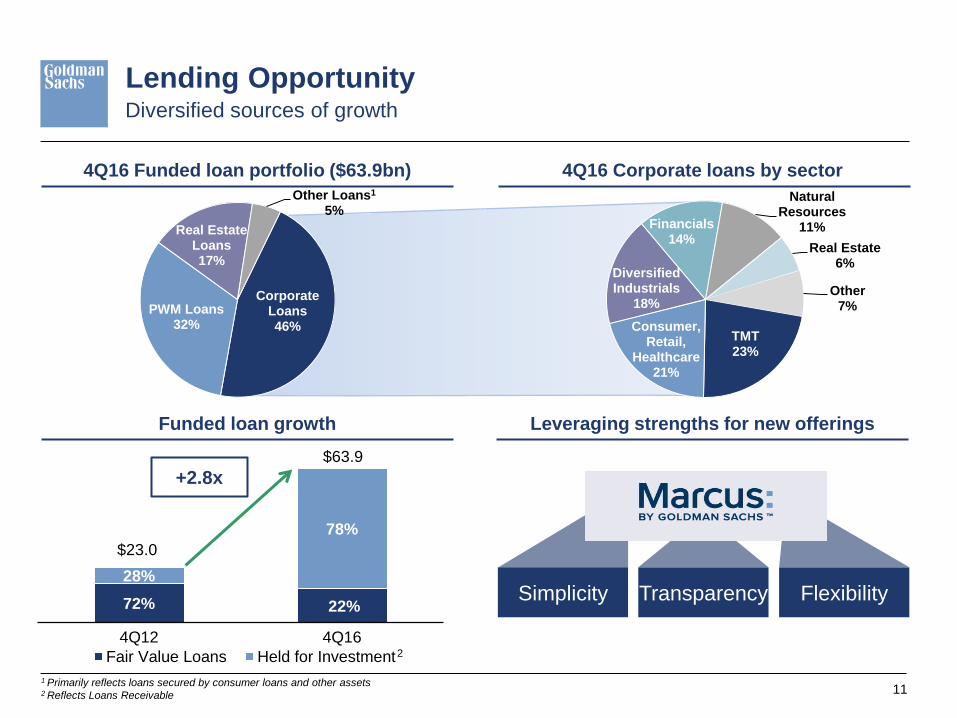
TMT 23%
Consumer, Retail,
Healthcare 21%
Diversified Industrials
18%
Financials 14%
Natural Resources
11%
Real Estate 6%
Other 7%
Corporate Loans 46%
PWM Loans 32%
Real Estate Loans 17%
Other Loans1 5%
72% 22%
28%
78%
4Q12 4Q16
Fair Value Loans Held for Investment
Leveraging strengths for new offerings
1 Primarily reflects loans secured by consumer loans and other assets 2 Reflects Loans Receivable
Lending Opportunity
Funded loan growth
$63.9
$23.0
Transparency Simplicity Flexibility
4Q16 Corporate loans by sector 4Q16 Funded loan portfolio ($63.9bn)
+2.8x
11
Diversified sources of growth
2

Leveraging Technology
Other selected capabilities
Marquee applications to enhance client experience
Invested in electronic execution
platform Pantor Engineering
We embrace technology disruption and continually modernize our tech footprint
Currencies Credit
Rates Commodities
Fixed Income: Systematic Market Making Cross-product benefits
E-trading capabilities
Delivering GS technology to clients
SecDB
ROAE
Framework
Equities
E-trading
Provides dynamic top-down and
bottom-up capital attribution
Drives return-focused decision-
making vs. appropriate hurdles
Unified global securities database
for pricing and risk management
Supports stress testing analysis
across assets globally
12
Marquee Trader Execution
Studio Portfolio Construction
SIMON Structured Notes
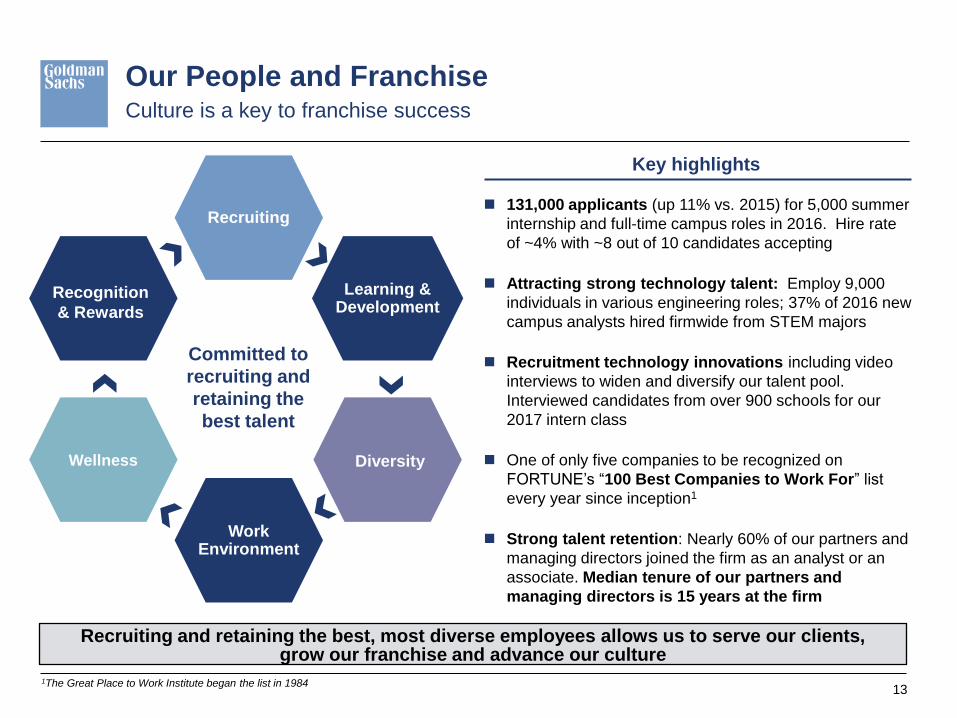
Committed to
recruiting and
retaining the
best talent
Our People and Franchise Culture is a key to franchise success
Recruiting and retaining the best, most diverse employees allows us to serve our clients, grow our franchise and advance our culture
1The Great Place to Work Institute began the list in 1984
Recruiting
Learning & Development
Work Environment
Wellness
Key highlights
Diversity
Recognition
& Rewards
131,000 applicants (up 11% vs. 2015) for 5,000 summer
internship and full-time campus roles in 2016. Hire rate
of ~4% with ~8 out of 10 candidates accepting
Attracting strong technology talent: Employ 9,000
individuals in various engineering roles; 37% of 2016 new
campus analysts hired firmwide from STEM majors
Recruitment technology innovations including video
interviews to widen and diversify our talent pool.
Interviewed candidates from over 900 schools for our
2017 intern class
One of only five companies to be recognized on
FORTUNE’s “100 Best Companies to Work For” list
every year since inception1
Strong talent retention: Nearly 60% of our partners and
managing directors joined the firm as an analyst or an
associate. Median tenure of our partners and
managing directors is 15 years at the firm
13
Goldman Sachs Presentation to
Credit Suisse Financial Services Conference
February 7, 2017
Lloyd C. Blankfein
Chairman and Chief Executive Officer
14