
BofA Merrill Lynch Citi J.P. Morgan · 2011-02-22 · BofA Merrill Lynch Citi J.P. Morgan Barclays...
229
SUBJECT TO COMPLETION, DATED FEBRUARY 22, 2011 PRELIMINARY PROSPECTUS HCA Holdings, Inc. 124,000,000 Shares Common Stock $ per share We are offering 87,719,300 shares of our common stock, and the selling stockholders named in this prospectus are offering 36,280,700 shares of our common stock. We will not receive any proceeds from the sale of the shares by the selling stockholders. This is an initial public offering of our common stock. Since November 2006 and prior to this offering, there has been no public market for our common stock. We currently expect the initial public offering price will be between $27.00 and $30.00 per share. We have applied to list the common stock on the New York Stock Exchange under the symbol “HCA.” Investing in our common stock involves a high degree of risk. See “Risk Factors” beginning on page 13 of this prospectus to read about factors you should consider before buying shares of our common stock. Neither the Securities and Exchange Commission nor any state securities commission has approved or disapproved of these securities or passed upon the adequacy or accuracy of this prospectus. Any representation to the contrary is a criminal offense. Per Share Total Initial price to public ......................................................... $ $ Underwriting discount ........................................................ $ $ Proceeds, before expenses, to HCA Holdings, Inc. ................................... $ $ Proceeds, before expenses, to the selling stockholders ................................. $ $ To the extent that the underwriters sell more than 124,000,000 shares of common stock, the underwriters have the option to purchase up to an additional 18,600,000 shares from the selling stockholders at the initial price to the public less the underwriting discount. The underwriters expect to deliver the shares against payment in New York, New York on or about , 2011. Joint Book-Running Managers BofA Merrill Lynch Citi J.P. Morgan Barclays Capital Credit Suisse Deutsche Bank Securities Goldman, Sachs & Co. Morgan Stanley Wells Fargo Securities Senior Co-Managers Credit Agricole CIB Mizuho Securities USA Inc. RBC Capital Markets RBS SMBC Nikko SunTrust Robinson Humphrey Co-Managers Avondale Partners Baird Cowen and Company CRT Capital Group LLC Lazard Capital Markets Leerink Swann Morgan Keegan Oppenheimer & Co. Raymond James Susquehanna Financial Group, LLLP Prospectus dated , 2011. The information in this preliminary prospectus is not complete and may be changed. We and the selling stockholders may not sell these securities until the registration statement filed with the Securities and Exchange Commission is effective. This preliminary prospectus is not an offer to sell these securities, and it is not soliciting an offer to buy these securities in any jurisdiction where the offer or sale is not permitted.
Transcript of BofA Merrill Lynch Citi J.P. Morgan · 2011-02-22 · BofA Merrill Lynch Citi J.P. Morgan Barclays...
SUBJECT TO COMPLETION, DATED FEBRUARY 22, 2011
PRELIMINARY PROSPECTUS
HCA Holdings, Inc.
124,000,000 Shares
Common Stock$ per share
We are offering 87,719,300 shares of our common stock, and the selling stockholders named in this prospectus areoffering 36,280,700 shares of our common stock. We will not receive any proceeds from the sale of the shares by the sellingstockholders.
This is an initial public offering of our common stock. Since November 2006 and prior to this offering, there has beenno public market for our common stock. We currently expect the initial public offering price will be between $27.00 and$30.00 per share. We have applied to list the common stock on the New York Stock Exchange under the symbol “HCA.”
Investing in our common stock involves a high degree of risk. See “Risk Factors” beginning on page 13 of thisprospectus to read about factors you should consider before buying shares of our common stock.
Neither the Securities and Exchange Commission nor any state securities commission has approved or disapproved ofthese securities or passed upon the adequacy or accuracy of this prospectus. Any representation to the contrary is a criminaloffense.
Per Share Total
Initial price to public . . . . . . . . . . . . . . . . . . . . . . . . . . . . . . . . . . . . . . . . . . . . . . . . . . . . . . . . . $ $Underwriting discount . . . . . . . . . . . . . . . . . . . . . . . . . . . . . . . . . . . . . . . . . . . . . . . . . . . . . . . . $ $Proceeds, before expenses, to HCA Holdings, Inc. . . . . . . . . . . . . . . . . . . . . . . . . . . . . . . . . . . . $ $Proceeds, before expenses, to the selling stockholders . . . . . . . . . . . . . . . . . . . . . . . . . . . . . . . . . $ $
To the extent that the underwriters sell more than 124,000,000 shares of common stock, the underwriters have theoption to purchase up to an additional 18,600,000 shares from the selling stockholders at the initial price to the public lessthe underwriting discount.
The underwriters expect to deliver the shares against payment in New York, New York on or about , 2011.
Joint Book-Running Managers
BofA Merrill Lynch Citi J.P. MorganBarclays Capital
Credit SuisseDeutsche Bank Securities
Goldman, Sachs & Co.Morgan Stanley
Wells Fargo Securities
Senior Co-Managers
Credit Agricole CIB Mizuho Securities USA Inc. RBC Capital MarketsRBS SMBC Nikko SunTrust Robinson Humphrey
Co-Managers
Avondale Partners Baird Cowen and Company CRT Capital Group LLCLazard Capital Markets Leerink Swann Morgan Keegan Oppenheimer & Co.Raymond James Susquehanna Financial Group, LLLP
Prospectus dated , 2011.Th
ein
form
atio
nin
this
pre
lim
ina
ryp
rosp
ectu
sis
no
tco
mp
lete
an
dm
ay
be
ch
an
ge
d.W
ea
nd
the
se
llin
gsto
ckh
old
ers
may
no
tse
llth
ese
se
cu
ritie
su
ntilth
ere
gis
tra
tio
nsta
tem
en
tfile
dw
ith
the
Se
cu
ritie
sa
nd
Exch
an
ge
Co
mm
issio
nis
effe
ctive.
Th
isp
relim
ina
ryp
rosp
ectu
sis
no
ta
no
ffe
rto
se
llth
ese
se
cu
ritie
s,
an
dit
isn
ot
so
licitin
ga
no
ffe
rto
bu
yth
ese
se
cu
ritie
sin
any
jurisd
ictio
nw
he
reth
eo
ffe
ro
rsa
leis
no
tp
erm
itte
d.
You should rely only on the information contained in this prospectus or in any free writingprospectus that we authorize be delivered to you. Neither we nor the underwriters have authorizedanyone to provide you with additional or different information. If anyone provides you with additional,different or inconsistent information, you should not rely on it. We and the underwriters are not makingan offer to sell these securities in any jurisdiction where an offer or sale is not permitted. You shouldassume that the information in this prospectus is accurate only as of the date on the front cover,regardless of the time of delivery of this prospectus or of any sale of our common stock. Our business,prospects, financial condition and results of operations may have changed since that date.
TABLE OF CONTENTS
Prospectus Summary . . . . . . . . . . . . . . . . . . . . . . . . . . . . . . . . . . . . . . . . . . . . . . . . . . . . . . . . . . . . . . . 1Risk Factors . . . . . . . . . . . . . . . . . . . . . . . . . . . . . . . . . . . . . . . . . . . . . . . . . . . . . . . . . . . . . . . . . . . . . 13Forward-Looking Statements . . . . . . . . . . . . . . . . . . . . . . . . . . . . . . . . . . . . . . . . . . . . . . . . . . . . . . . . . 29Use of Proceeds . . . . . . . . . . . . . . . . . . . . . . . . . . . . . . . . . . . . . . . . . . . . . . . . . . . . . . . . . . . . . . . . . . 31Dividend Policy . . . . . . . . . . . . . . . . . . . . . . . . . . . . . . . . . . . . . . . . . . . . . . . . . . . . . . . . . . . . . . . . . . 32Capitalization . . . . . . . . . . . . . . . . . . . . . . . . . . . . . . . . . . . . . . . . . . . . . . . . . . . . . . . . . . . . . . . . . . . . 33Dilution . . . . . . . . . . . . . . . . . . . . . . . . . . . . . . . . . . . . . . . . . . . . . . . . . . . . . . . . . . . . . . . . . . . . . . . . 35Selected Financial Data . . . . . . . . . . . . . . . . . . . . . . . . . . . . . . . . . . . . . . . . . . . . . . . . . . . . . . . . . . . . . 36Management’s Discussion and Analysis of Financial Condition and Results of Operations . . . . . . . . . . . . 38Business . . . . . . . . . . . . . . . . . . . . . . . . . . . . . . . . . . . . . . . . . . . . . . . . . . . . . . . . . . . . . . . . . . . . . . . . 57Regulation and Other Factors . . . . . . . . . . . . . . . . . . . . . . . . . . . . . . . . . . . . . . . . . . . . . . . . . . . . . . . . 81Management . . . . . . . . . . . . . . . . . . . . . . . . . . . . . . . . . . . . . . . . . . . . . . . . . . . . . . . . . . . . . . . . . . . . . 97Executive Compensation . . . . . . . . . . . . . . . . . . . . . . . . . . . . . . . . . . . . . . . . . . . . . . . . . . . . . . . . . . . . 110Principal and Selling Stockholders . . . . . . . . . . . . . . . . . . . . . . . . . . . . . . . . . . . . . . . . . . . . . . . . . . . . . 141Certain Relationships and Related Party Transactions . . . . . . . . . . . . . . . . . . . . . . . . . . . . . . . . . . . . . . . 144Description of Indebtedness . . . . . . . . . . . . . . . . . . . . . . . . . . . . . . . . . . . . . . . . . . . . . . . . . . . . . . . . . . 149Description of Capital Stock . . . . . . . . . . . . . . . . . . . . . . . . . . . . . . . . . . . . . . . . . . . . . . . . . . . . . . . . . 159Shares Eligible for Future Sale . . . . . . . . . . . . . . . . . . . . . . . . . . . . . . . . . . . . . . . . . . . . . . . . . . . . . . . 165Material United States Federal Income and Estate Tax Consequences to Non-U.S. Holders . . . . . . . . . . . 167Underwriting (Conflicts of Interest) . . . . . . . . . . . . . . . . . . . . . . . . . . . . . . . . . . . . . . . . . . . . . . . . . . . . 170Legal Matters . . . . . . . . . . . . . . . . . . . . . . . . . . . . . . . . . . . . . . . . . . . . . . . . . . . . . . . . . . . . . . . . . . . . 178Experts . . . . . . . . . . . . . . . . . . . . . . . . . . . . . . . . . . . . . . . . . . . . . . . . . . . . . . . . . . . . . . . . . . . . . . . . . 178Where You Can Find More Information . . . . . . . . . . . . . . . . . . . . . . . . . . . . . . . . . . . . . . . . . . . . . . . . . 179Index to Consolidated Financial Statements . . . . . . . . . . . . . . . . . . . . . . . . . . . . . . . . . . . . . . . . . . . . . . F-1
MARKET, RANKING AND OTHER INDUSTRY DATA
The data included in this prospectus regarding markets and ranking, including the size of certain marketsand our position and the position of our competitors within these markets, are based on reports of governmentagencies or published industry sources and estimates based on our management’s knowledge and experience inthe markets in which we operate. These estimates have been based on information obtained from our trade andbusiness organizations and other contacts in the markets in which we operate. We believe these estimates to beaccurate as of the date of this prospectus. However, this information may prove to be inaccurate because ofthe method by which we obtained some of the data for the estimates or because this information cannotalways be verified with complete certainty due to the limits on the availability and reliability of raw data, thevoluntary nature of the data gathering process and other limitations and uncertainties. As a result, you shouldbe aware that market, ranking and other similar industry data included in this prospectus, and estimates andbeliefs based on that data, may not be reliable. We cannot guarantee the accuracy or completeness of any suchinformation contained in this prospectus.
i
PROSPECTUS SUMMARY
This summary highlights significant aspects of our business and this offering, but it is not complete anddoes not contain all of the information you should consider before making your investment decision. Youshould carefully read the entire prospectus, including the information presented under the section entitled“Risk Factors” and the financial statements and related notes, before making an investment decision. Thissummary contains forward-looking statements that involve risks and uncertainties. Our actual results maydiffer significantly from the results discussed in the forward-looking statements as a result of certain factors,including those set forth in “Risk Factors” and “Forward-Looking Statements.”
As used herein, unless otherwise stated or indicated by context, references to the “Company,” “HCA,”“we,” “our” or “us” refer to HCA Inc. and its affiliates prior to the Corporate Reorganization (as definedbelow) and to HCA Holdings, Inc. and its affiliates after the Corporate Reorganization. The term “affiliates”means direct and indirect subsidiaries of HCA Holdings, Inc. and partnerships and joint ventures in whichsuch subsidiaries are partners. The terms “facilities” or “hospitals” refer to entities owned and operated byaffiliates of HCA and the term “employees” refers to employees of affiliates of HCA.
Our Company
We are the largest non-governmental hospital operator in the U.S. and a leading comprehensive,integrated provider of health care and related services. We provide these services through a network of acutecare hospitals, outpatient facilities, clinics and other patient care delivery settings. As of December 31, 2010,we operated a diversified portfolio of 164 hospitals (with approximately 41,000 beds) and 106 freestandingsurgery centers across 20 states throughout the U.S. and in England. As a result of our efforts to establishsignificant market share in large and growing urban markets with attractive demographic and economicprofiles, we currently have a substantial market presence in 14 of the top 25 fastest growing markets withpopulations greater than 500,000 in the U.S. and currently maintain the first or second position, based oninpatient admissions, in many of our key markets. We believe our ability to successfully position and grow ourassets in attractive markets and execute our operating plan has contributed to the strength of our financialperformance over the last several years. For the year ended December 31, 2010, we generated revenues of$30.683 billion, net income attributable to HCA Holdings, Inc. of $1.207 billion and Adjusted EBITDA of$5.868 billion.
Our patient-first strategy is to provide high quality health care services in a cost-efficient manner. Weintend to build upon our history of profitable growth by maintaining our dedication to quality care, increasingour presence in key markets through organic expansion and strategic acquisitions and joint ventures,leveraging our scale and infrastructure, and further developing our physician and employee relationships. Webelieve pursuing these core elements of our strategy helps us develop a faster-growing, more stable and moreprofitable business and increases our relevance to patients, physicians, payers and employers.
Using our scale, significant resources and over 40 years of operating experience, we have developed asignificant management and support infrastructure. Some of the key components of our support infrastructureinclude a revenue cycle management organization, a health care group purchasing organization, (“GPO”), aninformation technology and services provider, a nurse staffing agency and a medical malpractice insuranceunderwriter. These shared services have helped us to maximize our cash collection efficiency, achieve savings inpurchasing through our scale, more rapidly deploy information technology upgrades, more effectively manageour labor pool and achieve greater stability in malpractice insurance premiums. Collectively, these componentshave helped us to further enhance our operating effectiveness, cost efficiency and overall financial results. Weare also creating a subsidiary that will offer certain of these component services to other health care companies.
Since the founding of our business in 1968 as a single-facility hospital company, we have demonstratedan ability to consistently innovate and sustain growth during varying economic and regulatory climates. Underthe leadership of an experienced senior management team, whose tenure at HCA averages over 20 years, wehave established an extensive record of providing high quality care, profitably growing our business, makingand integrating strategic acquisitions and efficiently and strategically allocating capital spending.
On November 17, 2006, HCA Inc. was acquired by a private investor group comprised of affiliates of orfunds sponsored by Bain Capital Partners, LLC (“Bain Capital”), Kohlberg Kravis Roberts & Co. (“KKR”),
1
Merrill Lynch Global Private Equity (“MLGPE”), now BAML Capital Partners (each a “Sponsor”), CitigroupInc., Bank of America Corporation (the “Sponsor Assignees”) and HCA founder Dr. Thomas F. Frist, Jr. (the“Frist Entities”), a group we collectively refer to as the “Investors,” and by members of management andcertain other investors. We refer to the merger, the financing transactions related to the merger and otherrelated transactions collectively as the “Recapitalization.”
Since the Recapitalization, we have achieved substantial operational and financial progress. During thistime, we have made significant investments in expanding our service lines and expanding our alignment withhighly specialized and primary care physicians. In addition, we have enhanced our operating efficienciesthrough a number of corporate cost-saving initiatives and an expansion of our support infrastructure. We havemade investments in information technology to optimize our facilities and systems. We have also undertaken anumber of initiatives to improve clinical quality and patient satisfaction. As a result of these initiatives, ourfinancial performance has improved significantly from the year ended December 31, 2007, the first full yearfollowing the Recapitalization, to the year ended December 31, 2010, with revenues growing by$3.825 billion, net income attributable to HCA Holdings, Inc. increasing by $333 million and AdjustedEBITDA increasing by $1.276 billion. This represents compounded annual growth rates on these key metricsof 4.5%, 11.4% and 8.5%, respectively.
Our Industry
We believe well-capitalized, comprehensive and integrated health care delivery providers are well-positioned to benefit from the current industry trends, some of which include:
Aging Population and Continued Growth in the Need for Health Care Services. According to theU.S. Census Bureau, the demographic age group of persons aged 65 and over is expected to experiencecompounded annual growth of 3.0% over the next 20 years, and constitute 19.3% of the total U.S. populationby 2030. The Centers for Medicare & Medicaid Services (“CMS”) projects continued increases in hospitalservices based on the aging of the U.S. population, advances in medical procedures, expansion of healthcoverage, increasing consumer demand for expanded medical services and increased prevalence of chronicconditions such as diabetes, heart disease and obesity. We believe these factors will continue to drive increasedutilization of health care services and the need for comprehensive, integrated hospital networks that canprovide a wide array of essential and sophisticated health care.
Continued Evolution of Quality-Based Reimbursement Favors Large-Scale, Comprehensive and IntegratedProviders. We believe the U.S. health care system is continuing to evolve in ways that favor large-scale,comprehensive and integrated providers that provide high levels of quality care. Specifically, we believe thereare a number of initiatives that will continue to gain importance in the foreseeable future, including:introduction of value-based payment methodologies tied to performance, quality and coordination of care,implementation of integrated electronic health records and information, and an increasing ability for patientsand consumers to make choices about all aspects of health care. We believe our company is well positioned torespond to these emerging trends and has the resources, expertise and flexibility necessary to adapt in a timelymanner to the changing health care regulatory and reimbursement environment.
Impact of Health Reform Law. The Patient Protection and Affordable Care Act, as amended by theHealth Care and Education Reconciliation Act of 2010 (collectively, the “Health Reform Law”), will changehow health care services are covered, delivered and reimbursed. It will do so through expanded coverage ofuninsured individuals, significant reductions in the growth of Medicare program payments, material decreasesin Medicare and Medicaid disproportionate share hospital (“DSH”) payments, and the establishment ofprograms where reimbursement is tied in part to quality and integration. The Health Reform Law, as enacted,is expected to expand health insurance coverage to approximately 32 to 34 million additional individualsthrough a combination of public program expansion and private sector health insurance reforms. We believethe expansion of private sector and Medicaid coverage will, over time, increase our reimbursement related toproviding services to individuals who were previously uninsured. On the other hand, the reductions in thegrowth in Medicare payments and the decreases in DSH payments will adversely affect our governmentreimbursement. Because of the many variables involved, including pending court challenges, the potential for
2
changes to the law as a result and efforts to amend or repeal the law, we are unable to predict the net impactof the Health Reform Law on us; however, we believe our experienced management team, emphasis on qualitycare and diverse service offerings will enable us to capitalize on the opportunities presented by the HealthReform Law, as well as adapt in a timely manner to its challenges.
Our Competitive Strengths
We believe our key competitive strengths include:
Largest Comprehensive, Integrated Health Care Delivery System. We are the largest non-governmentalhospital operator in the U.S., providing approximately 4% to 5% of all U.S. hospital services through ournational footprint. The scope and scale of our operations, evidenced by the types of facilities we operate, thediverse medical specialties we offer and the numerous patient care access points we provide, enable us toprovide a comprehensive range of health care services in a cost-effective manner. As a result, we believe thebreadth of our platform is a competitive advantage in the marketplace enabling us to attract patients,physicians and clinical staff while also providing significant economies of scale and increasing our relevancewith commercial payers.
Reputation for High Quality Patient-Centered Care. Since our founding, we have maintained anunwavering focus on patients and clinical outcomes. We believe clinical quality influences physician andpatient choices about health care delivery. We align our quality initiatives throughout the organization byengaging corporate, local, physician and nurse leaders to share best practices and develop standards fordelivering high quality care. We have invested extensively in quality of care initiatives, with an emphasis onimplementing information technology and adopting industry-wide best practices and clinical protocols. As aresult of these efforts, we have achieved significant progress in clinical quality. As measured by the CMSclinical core measures reported on the CMS Hospital Compare website and based on publicly available datafor the twelve months ended March 31, 2010, our hospitals achieved a composite score of 98.4% of the CMScore measures versus the national average of 95.3%, making us among the top performing major healthsystems in the U.S. In addition, as required by the Health Reform Law, CMS will establish a value-basedpurchasing system and will adjust hospital payment rates based on hospital-acquired conditions and hospitalreadmissions. We also believe our quality initiatives favorably position us in a payment environment that isincreasingly performance-based.
Leading Local Market Positions in Large, Growing, Urban Markets. Over our history, we have soughtto selectively expand and upgrade our asset base to create a premium portfolio of assets in attractive growingmarkets. As a result, we have a strong market presence in 14 of the top 25 fastest growing markets withpopulations greater than 500,000 in the U.S. We currently operate in 29 markets, 17 of which havepopulations of 1 million or more, with all but one of these markets projecting growth above the nationalaverage from 2009 to 2014. Our inpatient market share places us first or second in many of our key markets.We believe the strength and stability of these market positions will create organic growth opportunities andallow us to develop long-term relationships with patients, physicians, large employers and third-party payers.
Diversified Revenue Base and Payer Mix. We believe our broad geographic footprint, varied servicelines and diverse revenue base mitigate our risks in numerous ways. Our diversification limits our exposure tocompetitive dynamics and economic conditions in any single local market, reimbursement changes in specificservice lines and disruptions with respect to payers such as state Medicaid programs or large commercialinsurers. We have a diverse portfolio of assets with no single facility contributing more than 2.3% of ourrevenues and no single metropolitan statistical area contributing more than 8.0% of revenues for the yearended December 31, 2010. We have also developed a highly diversified payer base, including approximately3,000 managed care contracts, with no single commercial payer representing more than 8% of revenues for theyear ended December 31, 2010. In addition, we are one of the country’s largest providers of outpatientservices, which accounted for approximately 38% of our revenues for the year ended December 31, 2010. We
3
believe the geographic diversity of our markets and the scope of our inpatient and outpatient operations helpreduce volatility in our operating results.
Scale and Infrastructure Drive Cost Savings and Efficiencies. Our scale allows us to leverage oursupport infrastructure to achieve significant cost savings and operating efficiencies, thereby driving marginexpansion. We strategically manage our supply chain through centralized purchasing and supply warehouses,as well as our revenue cycle through centralized billing, collections and health information managementfunctions. We also manage the provision of information technology through a combination of centralizedsystems with regional service support as well as centralize many other clinical and corporate functions,creating economies of scale in managing expenses and business processes. In addition to the cost savings andoperating efficiencies, this support infrastructure simultaneously generates revenue from third parties thatutilize our services.
Well-Capitalized Portfolio of High Quality Assets. In order to expand the range and improve the qualityof services provided at our facilities, we invested over $7.5 billion in our facilities and information technologysystems over the five-year period ended December 31, 2010. We believe our significant capital investments inthese areas will continue to attract new and returning patients, attract and retain high-quality physicians,maximize cost efficiencies and address the health care needs of our local communities. Furthermore, webelieve our platform, as well as electronic health record infrastructure, national research and physicianmanagement capabilities, provide a strategic advantage by enhancing our ability to capitalize on anticipatedincentives through the Health Information Technology for Economic and Clinical Health Act (“HITECH”)provisions of the American Recovery and Reinvestment Act of 2009 (“ARRA”) and position us well in anenvironment that increasingly emphasizes quality, transparency and coordination of care.
Strong Operating Results and Cash Flows. Our leading scale, diversification, favorable marketpositions, dedication to clinical quality and focus on operational efficiency have enabled us to achieveattractive historical financial performance even during the most recent economic period. In the year endedDecember 31, 2010, we generated net income attributable to HCA Holdings, Inc. of $1.207 billion, AdjustedEBITDA of $5.868 billion and cash flows from operating activities of $3.085 billion. Our ability to generatestrong and consistent cash flow from operations has enabled us to invest in our operations, reduce our debt,enhance earnings per share and continue to pursue attractive growth opportunities.
Proven and Experienced Management Team. We believe the extensive experience and depth of ourmanagement team are a distinct competitive advantage in the complicated and evolving industry in which wecompete. Our CEO and Chairman of the Board of Directors, Richard M. Bracken, began his career with ourcompany over 29 years ago and has held various executive positions with us over that period, including, mostrecently, as our President and Chief Operating Officer. Our President, Chief Financial Officer and Director, R.Milton Johnson, joined our company over 28 years ago and has held various positions in our financialoperations since that time. Our six Group Presidents average approximately 20 years of experience with ourcompany. Members of our senior management hold significant equity interests in our company, furtheraligning their long-term interests with those of our stockholders.
Our Growth Strategy
We are committed to providing the communities we serve with high quality, cost-effective health carewhile growing our business, increasing our profitability and creating long-term value for our stockholders. Toachieve these objectives, we align our efforts around the following growth agenda:
Grow Our Presence in Existing Markets. We believe we are well positioned in a number of large andgrowing markets that will allow us the opportunity to generate long-term, attractive growth through theexpansion of our presence in these markets. We plan to continue recruiting and strategically collaborating withthe physician community and adding attractive service lines such as cardiology, emergency services, oncologyand women’s services. Additional components of our growth strategy include expanding our footprint throughdeveloping various outpatient access points, including surgery centers, rural outreach, freestanding emergencydepartments and walk-in clinics. Since our Recapitalization, we have invested significant capital into thesemarkets and expect to continue to see the benefit of this investment.
4
Achieve Industry-Leading Performance in Clinical and Satisfaction Measures. Achieving high levels ofpatient safety, patient satisfaction and clinical quality are central goals of our business model. To achieve thesegoals, we have implemented a number of initiatives including infection reduction initiatives, hospitalistprograms, advanced health information technology and evidence-based medicine programs. We routinelyanalyze operational practices from our best-performing hospitals to identify ways to implement organization-wide performance improvements and reduce clinical variation. We believe these initiatives will continue toimprove patient care, help us achieve cost efficiencies, grow our revenues and favorably position us in anenvironment where our constituents are increasingly focused on quality, efficacy and efficiency.
Recruit and Employ Physicians to Meet Need for High Quality Health Services. We depend on thequality and dedication of the health care providers and other team members who serve at our facilities. Webelieve a critical component of our growth strategy is our ability to successfully recruit and strategicallycollaborate with physicians and other professionals to provide high quality care. We attract and retainphysicians by providing high quality, convenient facilities with advanced technology, by expanding ourspecialty services and by building our outpatient operations. We believe our continued investment in theemployment, recruitment and retention of physicians will improve the quality of care at our facilities.
Continue to Leverage Our Scale and Market Positions to Enhance Profitability. We believe there issignificant opportunity to continue to grow the profitability of our company by fully leveraging the scale andscope of our franchise. We are currently pursuing next generation performance improvement initiatives such ascontracting for services on a multistate basis and expanding our support infrastructure for additional clinicaland support functions, such as physician credentialing, medical transcription and electronic medicalrecordkeeping. We believe our centrally managed business processes and ability to leverage cost-savingpractices across our extensive network will enable us to continue to manage costs effectively. We are in theprocess of creating a subsidiary that will leverage key components of our support infrastructure, includingrevenue cycle management, health care group purchasing, supply chain management and staffing functions, byoffering these services to other hospital companies.
Selectively Pursue a Disciplined Development Strategy. We continue to believe there are significantgrowth opportunities in our markets. We will continue to provide financial and operational resources tosuccessfully execute on our in-market opportunities. To complement our in-market growth agenda, we intendto focus on selectively developing and acquiring new hospitals, outpatient facilities and other health careservice providers. We believe the challenges faced by the hospital industry may spur consolidation and webelieve our size, scale, national presence and access to capital will position us well to participate in any suchconsolidation. We have a strong record of successfully acquiring and integrating hospitals and entering intojoint ventures and intend to continue leveraging this experience.
Corporate Reorganization
On November 22, 2010, HCA Inc. reorganized by creating a new holding company structure (the“Corporate Reorganization”). We are the new parent company, and HCA Inc. is now our wholly-owned directsubsidiary. As part of the Corporate Reorganization, HCA Inc.’s outstanding shares of capital stock wereautomatically converted, on a share for share basis, into identical shares of our common stock. Our amendedand restated certificate of incorporation, amended and restated bylaws, executive officers and board ofdirectors following the Corporate Reorganization are the same as HCA Inc.’s in effect immediately prior to theCorporate Reorganization, and the rights, privileges and interests of HCA Inc.’s stockholders remain the samewith respect to us as the new holding company. Additionally, as a result of the Corporate Reorganization, weare deemed the successor registrant to HCA Inc. under the Securities and Exchange Act of 1934, as amended(the “Exchange Act”), and shares of our common stock are deemed registered under Section 12(g) of theExchange Act. As part of the Corporate Reorganization, we became a guarantor but did not assume the debtof HCA Inc.’s outstanding secured notes. See “Description of Indebtedness.”
We have assumed all of HCA Inc.’s obligations with respect to the outstanding shares previously registered onForm S-8 for distribution pursuant to HCA Inc.’s stock incentive plan and have also assumed HCA Inc.’s otherequity incentive plans that provide for the right to acquire HCA Inc.’s common stock, whether or not exercisable.
5
We have also assumed and agreed to perform HCA Inc.’s obligations under its other compensation plans andagreements pursuant to which HCA Inc. is to issue equity securities to its directors, officers, or employees. Theagreements and plans we assumed were each deemed to be automatically amended as necessary to provide thatreferences therein to HCA Inc. now refer to HCA Holdings, Inc. Consequently, following the CorporateReorganization, the right to receive HCA Inc.’s common stock under its various compensation plans andagreements automatically converted into rights for the same number of shares of our common stock, with the samerights and conditions as the corresponding HCA Inc. rights prior to the Corporate Reorganization.
Risk Factors
Investing in our common stock involves substantial risk, and our ability to successfully operate ourbusiness is subject to numerous risks, including those that are generally associated with operating in the healthcare industry. Any of the factors set forth under “Risk Factors” may limit our ability to successfully executeour business strategy. You should carefully consider all of the information set forth in this prospectus and, inparticular, should evaluate the specific factors set forth under “Risk Factors” in deciding whether to invest inour common stock. Among these important risks are the following:
• our substantial debt could limit our ability to pursue our growth strategy;
• our debt agreements contain restrictions that may limit our flexibility in operating our business;
• the current economic climate and general economic factors may adversely affect our performance;
• we face intense competition that could limit our growth opportunities;
• we are required to comply with extensive laws and regulations that could impact our operations;
• legal proceedings and governmental investigations could negatively impact our business; and
• uninsured and patient due accounts could adversely affect our results of operations.
In addition, it is difficult to predict the impact on our company of the Health Reform Law due to the law’scomplexity, lack of implementing regulations or interpretive guidance, gradual and potentially delayedimplementation, pending court challenges and possible amendment or repeal, as well as our inability to foreseehow individuals and businesses will respond to the choices afforded them by the law. Because of the manyvariables involved, we are unable to predict the net effect on the Company of the Health Reform Law’s plannedreductions in the growth of Medicare payments, the expected increases in our revenues from providing care topreviously uninsured individuals, and numerous other provisions in the law that may affect us.
Through our predecessors, we commenced operations in 1968. HCA Inc. was incorporated in Nevada inJanuary 1990 and reincorporated in Delaware in September 1993. HCA Holdings, Inc. was incorporated inDelaware in October 2010. Our principal executive offices are located at One Park Plaza, Nashville, Tennessee37203, and our telephone number is (615) 344-9551. Our website address is www.hcahealthcare.com. Theinformation on our website is not part of this prospectus.
6
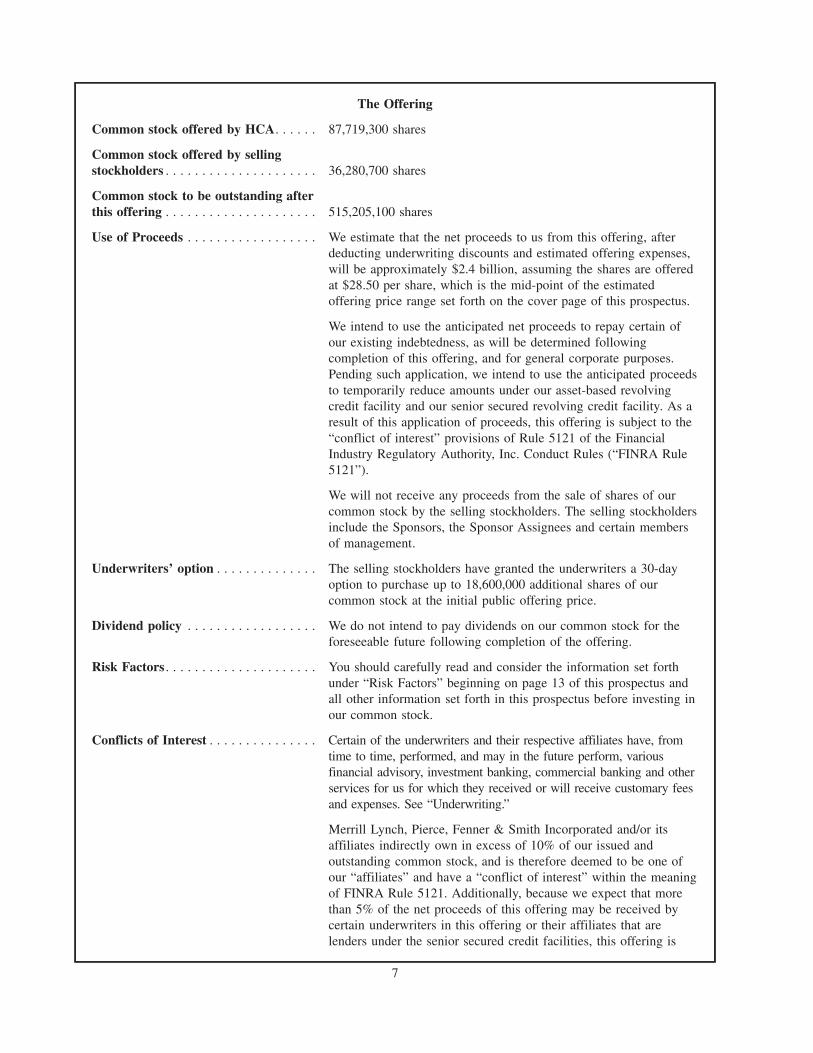
The Offering
Common stock offered by HCA. . . . . . 87,719,300 shares
Common stock offered by sellingstockholders . . . . . . . . . . . . . . . . . . . . . 36,280,700 shares
Common stock to be outstanding afterthis offering . . . . . . . . . . . . . . . . . . . . . 515,205,100 shares
Use of Proceeds . . . . . . . . . . . . . . . . . . We estimate that the net proceeds to us from this offering, afterdeducting underwriting discounts and estimated offering expenses,will be approximately $2.4 billion, assuming the shares are offeredat $28.50 per share, which is the mid-point of the estimatedoffering price range set forth on the cover page of this prospectus.
We intend to use the anticipated net proceeds to repay certain ofour existing indebtedness, as will be determined followingcompletion of this offering, and for general corporate purposes.Pending such application, we intend to use the anticipated proceedsto temporarily reduce amounts under our asset-based revolvingcredit facility and our senior secured revolving credit facility. As aresult of this application of proceeds, this offering is subject to the“conflict of interest” provisions of Rule 5121 of the FinancialIndustry Regulatory Authority, Inc. Conduct Rules (“FINRA Rule5121”).
We will not receive any proceeds from the sale of shares of ourcommon stock by the selling stockholders. The selling stockholdersinclude the Sponsors, the Sponsor Assignees and certain membersof management.
Underwriters’ option . . . . . . . . . . . . . . The selling stockholders have granted the underwriters a 30-dayoption to purchase up to 18,600,000 additional shares of ourcommon stock at the initial public offering price.
Dividend policy . . . . . . . . . . . . . . . . . . We do not intend to pay dividends on our common stock for theforeseeable future following completion of the offering.
Risk Factors . . . . . . . . . . . . . . . . . . . . . You should carefully read and consider the information set forthunder “Risk Factors” beginning on page 13 of this prospectus andall other information set forth in this prospectus before investing inour common stock.
Conflicts of Interest . . . . . . . . . . . . . . . Certain of the underwriters and their respective affiliates have, fromtime to time, performed, and may in the future perform, variousfinancial advisory, investment banking, commercial banking and otherservices for us for which they received or will receive customary feesand expenses. See “Underwriting.”
Merrill Lynch, Pierce, Fenner & Smith Incorporated and/or itsaffiliates indirectly own in excess of 10% of our issued andoutstanding common stock, and is therefore deemed to be one ofour “affiliates” and have a “conflict of interest” within the meaningof FINRA Rule 5121. Additionally, because we expect that morethan 5% of the net proceeds of this offering may be received bycertain underwriters in this offering or their affiliates that arelenders under the senior secured credit facilities, this offering is
7
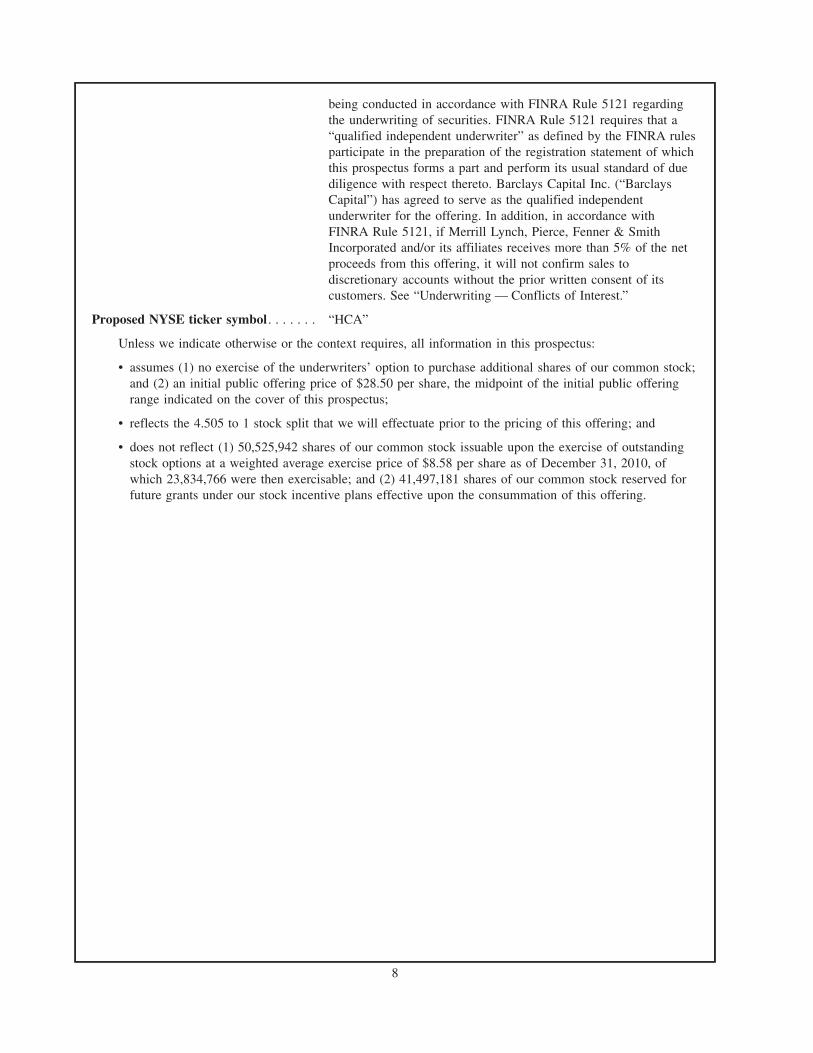
being conducted in accordance with FINRA Rule 5121 regardingthe underwriting of securities. FINRA Rule 5121 requires that a“qualified independent underwriter” as defined by the FINRA rulesparticipate in the preparation of the registration statement of whichthis prospectus forms a part and perform its usual standard of duediligence with respect thereto. Barclays Capital Inc. (“BarclaysCapital”) has agreed to serve as the qualified independentunderwriter for the offering. In addition, in accordance withFINRA Rule 5121, if Merrill Lynch, Pierce, Fenner & SmithIncorporated and/or its affiliates receives more than 5% of the netproceeds from this offering, it will not confirm sales todiscretionary accounts without the prior written consent of itscustomers. See “Underwriting — Conflicts of Interest.”
Proposed NYSE ticker symbol . . . . . . . “HCA”
Unless we indicate otherwise or the context requires, all information in this prospectus:
• assumes (1) no exercise of the underwriters’ option to purchase additional shares of our common stock;and (2) an initial public offering price of $28.50 per share, the midpoint of the initial public offeringrange indicated on the cover of this prospectus;
• reflects the 4.505 to 1 stock split that we will effectuate prior to the pricing of this offering; and
• does not reflect (1) 50,525,942 shares of our common stock issuable upon the exercise of outstandingstock options at a weighted average exercise price of $8.58 per share as of December 31, 2010, ofwhich 23,834,766 were then exercisable; and (2) 41,497,181 shares of our common stock reserved forfuture grants under our stock incentive plans effective upon the consummation of this offering.
8
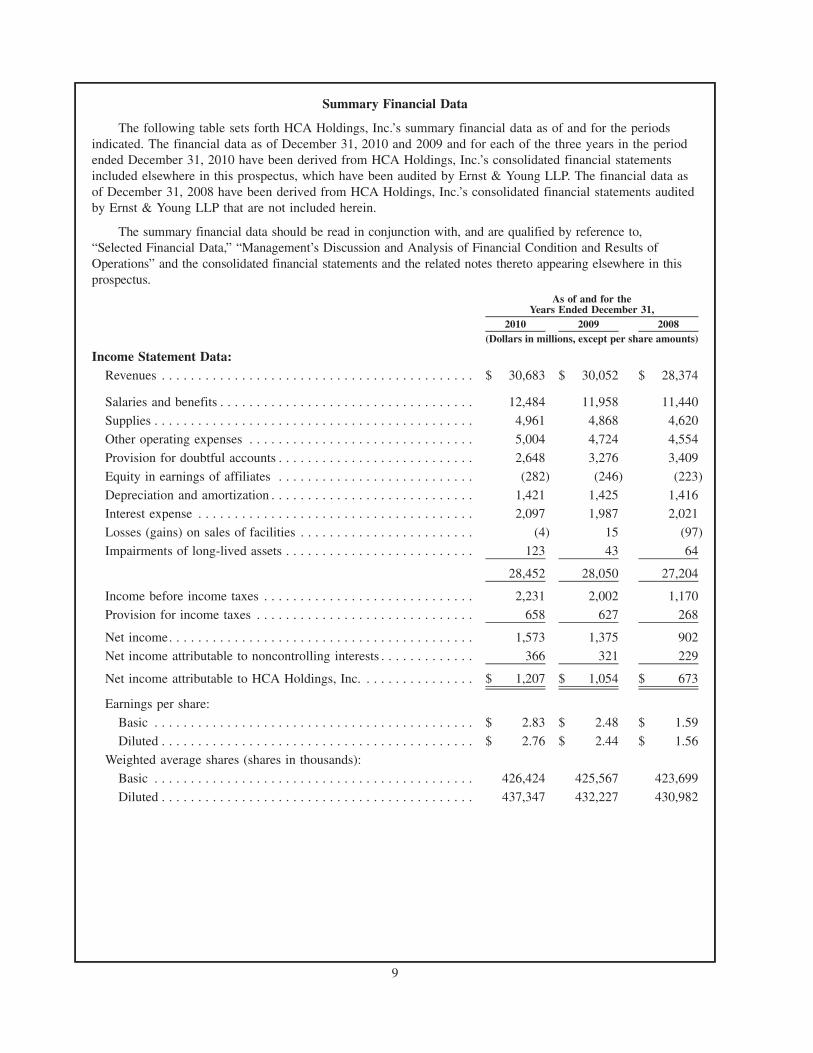
Summary Financial Data
The following table sets forth HCA Holdings, Inc.’s summary financial data as of and for the periodsindicated. The financial data as of December 31, 2010 and 2009 and for each of the three years in the periodended December 31, 2010 have been derived from HCA Holdings, Inc.’s consolidated financial statementsincluded elsewhere in this prospectus, which have been audited by Ernst & Young LLP. The financial data asof December 31, 2008 have been derived from HCA Holdings, Inc.’s consolidated financial statements auditedby Ernst & Young LLP that are not included herein.
The summary financial data should be read in conjunction with, and are qualified by reference to,“Selected Financial Data,” “Management’s Discussion and Analysis of Financial Condition and Results ofOperations” and the consolidated financial statements and the related notes thereto appearing elsewhere in thisprospectus.
2010 2009 2008
As of and for theYears Ended December 31,
(Dollars in millions, except per share amounts)
Income Statement Data:Revenues . . . . . . . . . . . . . . . . . . . . . . . . . . . . . . . . . . . . . . . . . . . $ 30,683 $ 30,052 $ 28,374
Salaries and benefits . . . . . . . . . . . . . . . . . . . . . . . . . . . . . . . . . . . 12,484 11,958 11,440
Supplies . . . . . . . . . . . . . . . . . . . . . . . . . . . . . . . . . . . . . . . . . . . . 4,961 4,868 4,620
Other operating expenses . . . . . . . . . . . . . . . . . . . . . . . . . . . . . . . 5,004 4,724 4,554
Provision for doubtful accounts . . . . . . . . . . . . . . . . . . . . . . . . . . . 2,648 3,276 3,409
Equity in earnings of affiliates . . . . . . . . . . . . . . . . . . . . . . . . . . . (282) (246) (223)
Depreciation and amortization . . . . . . . . . . . . . . . . . . . . . . . . . . . . 1,421 1,425 1,416Interest expense . . . . . . . . . . . . . . . . . . . . . . . . . . . . . . . . . . . . . . 2,097 1,987 2,021
Losses (gains) on sales of facilities . . . . . . . . . . . . . . . . . . . . . . . . (4) 15 (97)
Impairments of long-lived assets . . . . . . . . . . . . . . . . . . . . . . . . . . 123 43 64
28,452 28,050 27,204
Income before income taxes . . . . . . . . . . . . . . . . . . . . . . . . . . . . . 2,231 2,002 1,170
Provision for income taxes . . . . . . . . . . . . . . . . . . . . . . . . . . . . . . 658 627 268
Net income. . . . . . . . . . . . . . . . . . . . . . . . . . . . . . . . . . . . . . . . . . 1,573 1,375 902
Net income attributable to noncontrolling interests . . . . . . . . . . . . . 366 321 229
Net income attributable to HCA Holdings, Inc. . . . . . . . . . . . . . . . $ 1,207 $ 1,054 $ 673
Earnings per share:
Basic . . . . . . . . . . . . . . . . . . . . . . . . . . . . . . . . . . . . . . . . . . . . $ 2.83 $ 2.48 $ 1.59
Diluted . . . . . . . . . . . . . . . . . . . . . . . . . . . . . . . . . . . . . . . . . . . $ 2.76 $ 2.44 $ 1.56
Weighted average shares (shares in thousands):
Basic . . . . . . . . . . . . . . . . . . . . . . . . . . . . . . . . . . . . . . . . . . . . 426,424 425,567 423,699
Diluted . . . . . . . . . . . . . . . . . . . . . . . . . . . . . . . . . . . . . . . . . . . 437,347 432,227 430,982
9
2010 2009 2008
As of and for theYears Ended December 31,
(Dollars in millions, except per share amounts)
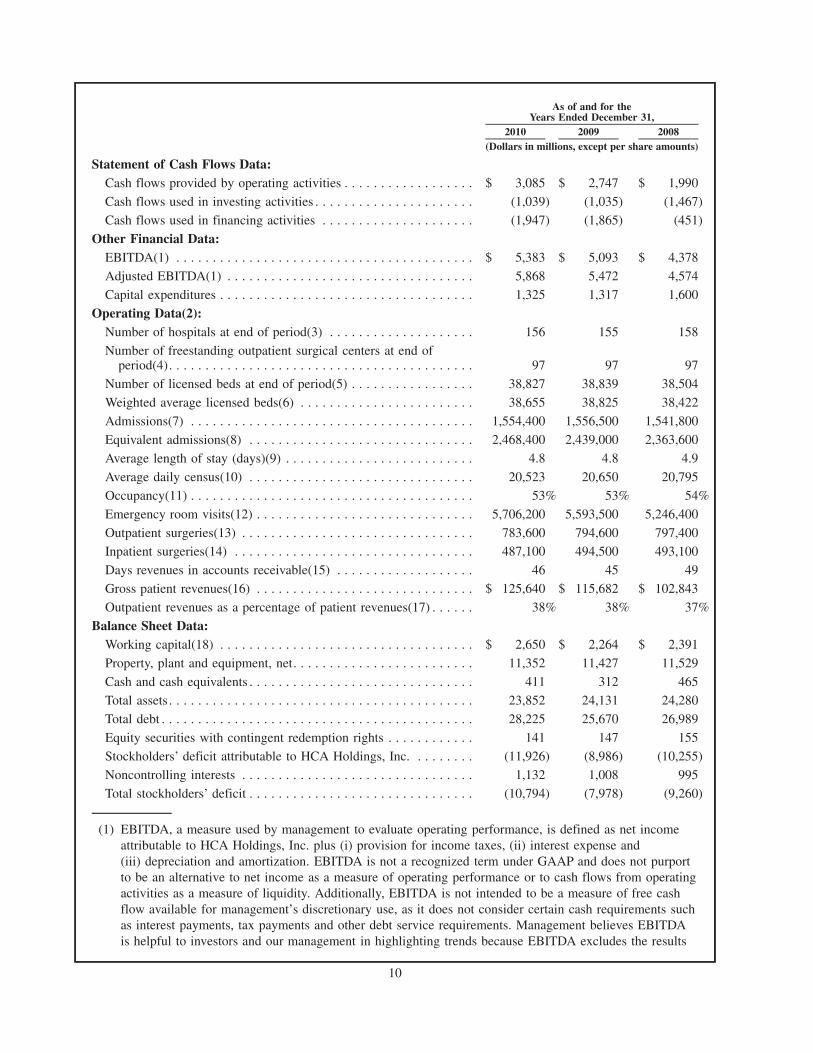
Statement of Cash Flows Data:Cash flows provided by operating activities . . . . . . . . . . . . . . . . . . $ 3,085 $ 2,747 $ 1,990
Cash flows used in investing activities . . . . . . . . . . . . . . . . . . . . . . (1,039) (1,035) (1,467)
Cash flows used in financing activities . . . . . . . . . . . . . . . . . . . . . (1,947) (1,865) (451)
Other Financial Data:EBITDA(1) . . . . . . . . . . . . . . . . . . . . . . . . . . . . . . . . . . . . . . . . . $ 5,383 $ 5,093 $ 4,378
Adjusted EBITDA(1) . . . . . . . . . . . . . . . . . . . . . . . . . . . . . . . . . . 5,868 5,472 4,574
Capital expenditures . . . . . . . . . . . . . . . . . . . . . . . . . . . . . . . . . . . 1,325 1,317 1,600
Operating Data(2):Number of hospitals at end of period(3) . . . . . . . . . . . . . . . . . . . . 156 155 158
Number of freestanding outpatient surgical centers at end ofperiod(4). . . . . . . . . . . . . . . . . . . . . . . . . . . . . . . . . . . . . . . . . . 97 97 97
Number of licensed beds at end of period(5) . . . . . . . . . . . . . . . . . 38,827 38,839 38,504
Weighted average licensed beds(6) . . . . . . . . . . . . . . . . . . . . . . . . 38,655 38,825 38,422
Admissions(7) . . . . . . . . . . . . . . . . . . . . . . . . . . . . . . . . . . . . . . . 1,554,400 1,556,500 1,541,800
Equivalent admissions(8) . . . . . . . . . . . . . . . . . . . . . . . . . . . . . . . 2,468,400 2,439,000 2,363,600
Average length of stay (days)(9) . . . . . . . . . . . . . . . . . . . . . . . . . . 4.8 4.8 4.9
Average daily census(10) . . . . . . . . . . . . . . . . . . . . . . . . . . . . . . . 20,523 20,650 20,795
Occupancy(11) . . . . . . . . . . . . . . . . . . . . . . . . . . . . . . . . . . . . . . . 53% 53% 54%
Emergency room visits(12) . . . . . . . . . . . . . . . . . . . . . . . . . . . . . . 5,706,200 5,593,500 5,246,400
Outpatient surgeries(13) . . . . . . . . . . . . . . . . . . . . . . . . . . . . . . . . 783,600 794,600 797,400Inpatient surgeries(14) . . . . . . . . . . . . . . . . . . . . . . . . . . . . . . . . . 487,100 494,500 493,100
Days revenues in accounts receivable(15) . . . . . . . . . . . . . . . . . . . 46 45 49
Gross patient revenues(16) . . . . . . . . . . . . . . . . . . . . . . . . . . . . . . $ 125,640 $ 115,682 $ 102,843
Outpatient revenues as a percentage of patient revenues(17) . . . . . . 38% 38% 37%
Balance Sheet Data:Working capital(18) . . . . . . . . . . . . . . . . . . . . . . . . . . . . . . . . . . . $ 2,650 $ 2,264 $ 2,391
Property, plant and equipment, net. . . . . . . . . . . . . . . . . . . . . . . . . 11,352 11,427 11,529
Cash and cash equivalents . . . . . . . . . . . . . . . . . . . . . . . . . . . . . . . 411 312 465
Total assets . . . . . . . . . . . . . . . . . . . . . . . . . . . . . . . . . . . . . . . . . . 23,852 24,131 24,280
Total debt . . . . . . . . . . . . . . . . . . . . . . . . . . . . . . . . . . . . . . . . . . . 28,225 25,670 26,989
Equity securities with contingent redemption rights . . . . . . . . . . . . 141 147 155
Stockholders’ deficit attributable to HCA Holdings, Inc. . . . . . . . . (11,926) (8,986) (10,255)
Noncontrolling interests . . . . . . . . . . . . . . . . . . . . . . . . . . . . . . . . 1,132 1,008 995
Total stockholders’ deficit . . . . . . . . . . . . . . . . . . . . . . . . . . . . . . . (10,794) (7,978) (9,260)
(1) EBITDA, a measure used by management to evaluate operating performance, is defined as net incomeattributable to HCA Holdings, Inc. plus (i) provision for income taxes, (ii) interest expense and(iii) depreciation and amortization. EBITDA is not a recognized term under GAAP and does not purportto be an alternative to net income as a measure of operating performance or to cash flows from operatingactivities as a measure of liquidity. Additionally, EBITDA is not intended to be a measure of free cashflow available for management’s discretionary use, as it does not consider certain cash requirements suchas interest payments, tax payments and other debt service requirements. Management believes EBITDAis helpful to investors and our management in highlighting trends because EBITDA excludes the results
10
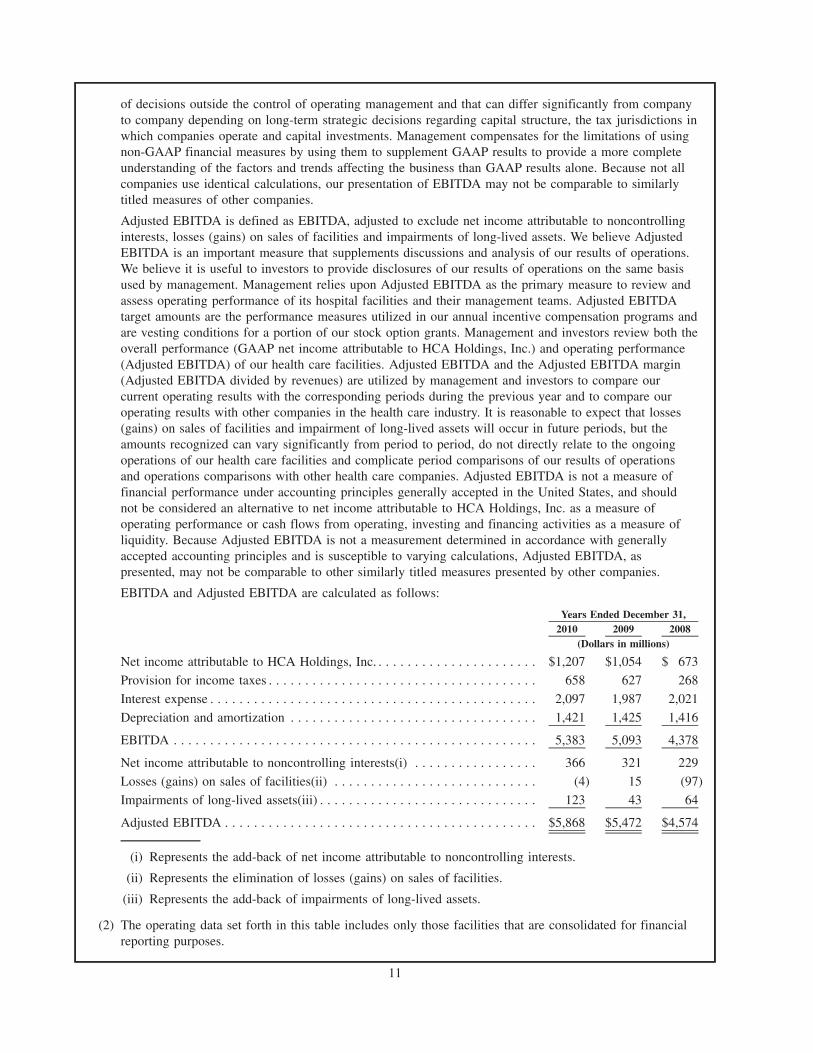
of decisions outside the control of operating management and that can differ significantly from companyto company depending on long-term strategic decisions regarding capital structure, the tax jurisdictions inwhich companies operate and capital investments. Management compensates for the limitations of usingnon-GAAP financial measures by using them to supplement GAAP results to provide a more completeunderstanding of the factors and trends affecting the business than GAAP results alone. Because not allcompanies use identical calculations, our presentation of EBITDA may not be comparable to similarlytitled measures of other companies.
Adjusted EBITDA is defined as EBITDA, adjusted to exclude net income attributable to noncontrollinginterests, losses (gains) on sales of facilities and impairments of long-lived assets. We believe AdjustedEBITDA is an important measure that supplements discussions and analysis of our results of operations.We believe it is useful to investors to provide disclosures of our results of operations on the same basisused by management. Management relies upon Adjusted EBITDA as the primary measure to review andassess operating performance of its hospital facilities and their management teams. Adjusted EBITDAtarget amounts are the performance measures utilized in our annual incentive compensation programs andare vesting conditions for a portion of our stock option grants. Management and investors review both theoverall performance (GAAP net income attributable to HCA Holdings, Inc.) and operating performance(Adjusted EBITDA) of our health care facilities. Adjusted EBITDA and the Adjusted EBITDA margin(Adjusted EBITDA divided by revenues) are utilized by management and investors to compare ourcurrent operating results with the corresponding periods during the previous year and to compare ouroperating results with other companies in the health care industry. It is reasonable to expect that losses(gains) on sales of facilities and impairment of long-lived assets will occur in future periods, but theamounts recognized can vary significantly from period to period, do not directly relate to the ongoingoperations of our health care facilities and complicate period comparisons of our results of operationsand operations comparisons with other health care companies. Adjusted EBITDA is not a measure offinancial performance under accounting principles generally accepted in the United States, and shouldnot be considered an alternative to net income attributable to HCA Holdings, Inc. as a measure ofoperating performance or cash flows from operating, investing and financing activities as a measure ofliquidity. Because Adjusted EBITDA is not a measurement determined in accordance with generallyaccepted accounting principles and is susceptible to varying calculations, Adjusted EBITDA, aspresented, may not be comparable to other similarly titled measures presented by other companies.
EBITDA and Adjusted EBITDA are calculated as follows:
2010 2009 2008Years Ended December 31,
(Dollars in millions)
Net income attributable to HCA Holdings, Inc. . . . . . . . . . . . . . . . . . . . . . . $1,207 $1,054 $ 673
Provision for income taxes . . . . . . . . . . . . . . . . . . . . . . . . . . . . . . . . . . . . . 658 627 268
Interest expense . . . . . . . . . . . . . . . . . . . . . . . . . . . . . . . . . . . . . . . . . . . . . 2,097 1,987 2,021
Depreciation and amortization . . . . . . . . . . . . . . . . . . . . . . . . . . . . . . . . . . 1,421 1,425 1,416
EBITDA . . . . . . . . . . . . . . . . . . . . . . . . . . . . . . . . . . . . . . . . . . . . . . . . . . 5,383 5,093 4,378
Net income attributable to noncontrolling interests(i) . . . . . . . . . . . . . . . . . 366 321 229
Losses (gains) on sales of facilities(ii) . . . . . . . . . . . . . . . . . . . . . . . . . . . . (4) 15 (97)
Impairments of long-lived assets(iii) . . . . . . . . . . . . . . . . . . . . . . . . . . . . . . 123 43 64
Adjusted EBITDA . . . . . . . . . . . . . . . . . . . . . . . . . . . . . . . . . . . . . . . . . . . $5,868 $5,472 $4,574
(i) Represents the add-back of net income attributable to noncontrolling interests.
(ii) Represents the elimination of losses (gains) on sales of facilities.
(iii) Represents the add-back of impairments of long-lived assets.
(2) The operating data set forth in this table includes only those facilities that are consolidated for financialreporting purposes.
11
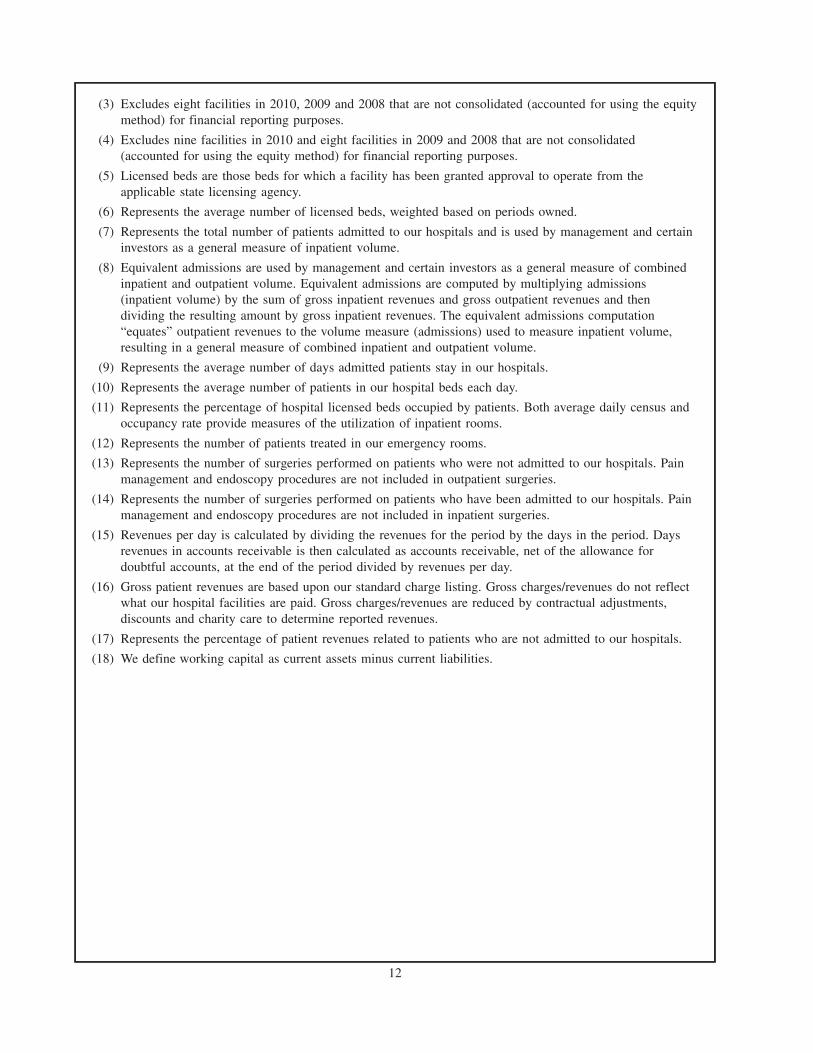
(3) Excludes eight facilities in 2010, 2009 and 2008 that are not consolidated (accounted for using the equitymethod) for financial reporting purposes.
(4) Excludes nine facilities in 2010 and eight facilities in 2009 and 2008 that are not consolidated(accounted for using the equity method) for financial reporting purposes.
(5) Licensed beds are those beds for which a facility has been granted approval to operate from theapplicable state licensing agency.
(6) Represents the average number of licensed beds, weighted based on periods owned.
(7) Represents the total number of patients admitted to our hospitals and is used by management and certaininvestors as a general measure of inpatient volume.
(8) Equivalent admissions are used by management and certain investors as a general measure of combinedinpatient and outpatient volume. Equivalent admissions are computed by multiplying admissions(inpatient volume) by the sum of gross inpatient revenues and gross outpatient revenues and thendividing the resulting amount by gross inpatient revenues. The equivalent admissions computation“equates” outpatient revenues to the volume measure (admissions) used to measure inpatient volume,resulting in a general measure of combined inpatient and outpatient volume.
(9) Represents the average number of days admitted patients stay in our hospitals.
(10) Represents the average number of patients in our hospital beds each day.
(11) Represents the percentage of hospital licensed beds occupied by patients. Both average daily census andoccupancy rate provide measures of the utilization of inpatient rooms.
(12) Represents the number of patients treated in our emergency rooms.
(13) Represents the number of surgeries performed on patients who were not admitted to our hospitals. Painmanagement and endoscopy procedures are not included in outpatient surgeries.
(14) Represents the number of surgeries performed on patients who have been admitted to our hospitals. Painmanagement and endoscopy procedures are not included in inpatient surgeries.
(15) Revenues per day is calculated by dividing the revenues for the period by the days in the period. Daysrevenues in accounts receivable is then calculated as accounts receivable, net of the allowance fordoubtful accounts, at the end of the period divided by revenues per day.
(16) Gross patient revenues are based upon our standard charge listing. Gross charges/revenues do not reflectwhat our hospital facilities are paid. Gross charges/revenues are reduced by contractual adjustments,discounts and charity care to determine reported revenues.
(17) Represents the percentage of patient revenues related to patients who are not admitted to our hospitals.
(18) We define working capital as current assets minus current liabilities.
12

RISK FACTORS
An investment in our common stock involves risk. You should carefully consider the following risks aswell as the other information included in this prospectus, including “Management’s Discussion and Analysisof Financial Condition and Results of Operations” and the financial statements and related notes includedelsewhere in this prospectus, before investing in our common stock. Any of the following risks could materiallyand adversely affect our business, financial condition or results of operations. However, the selected risksdescribed below are not the only risks facing us. Additional risks and uncertainties not currently known to usor those we currently view to be immaterial may also materially and adversely affect our business, financialcondition or results of operations. In such a case, the trading price of the common stock could decline, andyou may lose all or part of your investment in us.
Risks Related to Our Business
Our hospitals face competition for patients from other hospitals and health care providers.
The health care business is highly competitive, and competition among hospitals and other health careproviders for patients has intensified in recent years. Generally, other hospitals in the local communities weserve provide services similar to those offered by our hospitals. In addition, CMS publicizes on its HospitalCompare website performance data related to quality measures and data on patient satisfaction surveyshospitals submit in connection with their Medicare reimbursement. Federal law provides for the futureexpansion of the number of quality measures that must be reported. Additional quality measures and futuretrends toward clinical transparency may have an unanticipated impact on our competitive position and patientvolumes. Further, the Health Reform Law requires all hospitals to annually establish, update and make publica list of the hospital’s standard charges for items and services. If any of our hospitals achieve poor results (orresults that are lower than our competitors) on these quality measures or on patient satisfaction surveys or ifour standard charges are higher than our competitors, our patient volumes could decline.
In addition, the number of freestanding specialty hospitals, surgery centers and diagnostic and imagingcenters in the geographic areas in which we operate has increased significantly. As a result, most of ourhospitals operate in a highly competitive environment. Some of the facilities that compete with our hospitalsare owned by governmental agencies or not-for-profit corporations supported by endowments, charitablecontributions and/or tax revenues and can finance capital expenditures and operations on a tax-exempt basis.Our hospitals face increasing competition from specialty hospitals, some of which are physician-owned, andfrom both our own and unaffiliated freestanding surgery centers for market share in high margin services andfor quality physicians and personnel. If ambulatory surgery centers are better able to compete in thisenvironment than our hospitals, our hospitals may experience a decline in patient volume, and we mayexperience a decrease in margin, even if those patients use our ambulatory surgery centers. In states that donot require a Certificate of Need (“CON”) for the purchase, construction or expansion of health care facilitiesor services, competition in the form of new services, facilities and capital spending is more prevalent. Further,if our competitors are better able to attract patients, recruit physicians, expand services or obtain favorablemanaged care contracts at their facilities than our hospitals and ambulatory surgery centers, we mayexperience an overall decline in patient volume. See “Business — Competition.”
The growth of uninsured and patient due accounts and a deterioration in the collectibility of theseaccounts could adversely affect our results of operations.
The primary collection risks of our accounts receivable relate to the uninsured patient accounts andpatient accounts for which the primary insurance carrier has paid the amounts covered by the applicableagreement, but patient responsibility amounts (deductibles and copayments) remain outstanding. The provisionfor doubtful accounts relates primarily to amounts due directly from patients.
The amount of the provision for doubtful accounts is based upon management’s assessment of historicalwrite-offs and expected net collections, business and economic conditions, trends in federal and stategovernmental and private employer health care coverage, the rate of growth in uninsured patient admissions andother collection indicators. At December 31, 2010, our allowance for doubtful accounts represented
13
approximately 93% of the $4.249 billion patient due accounts receivable balance. The sum of the provision fordoubtful accounts, uninsured discounts and charity care increased from $7.009 billion for 2008 to $8.362 billionfor 2009 and to $9.626 billion for 2010.
A continuation of the trends that have resulted in an increasing proportion of accounts receivable beingcomprised of uninsured accounts and a deterioration in the collectibility of these accounts will adversely affectour collection of accounts receivable, cash flows and results of operations. Prior to the Health Reform Lawbeing fully implemented, our facilities may experience growth in bad debts, uninsured discounts and charitycare as a result of a number of factors, including the economic downturn and increase in unemployment. TheHealth Reform Law seeks to decrease, over time, the number of uninsured individuals. As enacted, the HealthReform Law will, effective January 1, 2014, expand Medicaid and incentivize employers to offer, and requireindividuals to carry, health insurance or be subject to penalties. More than 20 challenges to the Health ReformLaw have been filed in federal courts. Some federal courts have upheld the constitutionality of the HealthReform Law or dismissed cases on procedural grounds. Others have held unconstitutional the requirement thatindividuals maintain health insurance or pay a penalty and have either found the Health Reform Law void inits entirety or left the remainder of the law intact. These lawsuits are subject to appeal, and several arecurrently on appeal, including those that hold the law unconstitutional. It is difficult to predict the full impactof the Health Reform Law due to the law’s complexity, lack of implementing regulations or interpretiveguidance, gradual and potentially delayed implementation, pending court challenges and possible amendmentor repeal, as well as our inability to foresee how individuals and businesses will respond to the choicesafforded them by the law. In addition, even after implementation of the Health Reform Law, we may continueto experience bad debts and have to provide uninsured discounts and charity care for undocumented alienswho are not permitted to enroll in a health insurance exchange or government health care programs andcertain others who may not have insurance coverage.
Changes in government health care programs may reduce our revenues.
A significant portion of our patient volume is derived from government health care programs, principallyMedicare and Medicaid. Specifically, we derived 40.7% of our revenues from the Medicare and Medicaidprograms in 2010. Changes in government health care programs may reduce the reimbursement we receiveand could adversely affect our business and results of operations.
In recent years, legislative and regulatory changes have resulted in limitations on and, in some cases,reductions in levels of payments to health care providers for certain services under the Medicare program. Forexample, CMS completed a two-year transition to full implementation of the Medicare severity diagnosis-related group (“MS-DRG”) system, which represents a refinement to the existing diagnosis-related groupsystem. Future realignments in the MS-DRG system could impact the margins we receive for certain services.Further, the Health Reform Law provides for material reductions in the growth of Medicare program spending,including reductions in Medicare market basket updates and Medicare DSH funding. Medicare payments infederal fiscal year 2011 for inpatient hospital services are slightly lower than payments for the same servicesin federal fiscal year 2010, because of reductions resulting from the Health Reform Law and the MS-DRGimplementation.
Since most states must operate with balanced budgets and since the Medicaid program is often a state’slargest program, some states can be expected to enact or consider enacting legislation designed to reduce theirMedicaid expenditures. The current economic downturn has increased the budgetary pressures on many states,and these budgetary pressures have resulted, and likely will continue to result, in decreased spending, ordecreased spending growth, for Medicaid programs and the Children’s Health Insurance Program (“CHIP”) inmany states. The Health Reform Law provides for material reductions to Medicaid DSH funding. Further, manystates have also adopted, or are considering, legislation designed to reduce coverage, enroll Medicaid recipientsin managed care programs and/or impose additional taxes on hospitals to help finance or expand the states’Medicaid systems. Effective March 23, 2010, the Health Reform Law requires states to at least maintainMedicaid eligibility standards established prior to the enactment of the law for adults until January 1, 2014 andfor children until October 1, 2019. However, states with budget deficits may seek a waiver from this requirementto address eligibility standards that apply to adults making more than 133% of the federal poverty level. The
14
Health Reform Law also provides for significant expansions to the Medicaid program, but these changes are notrequired until 2014. In addition, the Health Reform Law will result in increased state legislative and regulatorychanges in order for states to comply with new federal mandates, such as the requirement to establish AmericanHealth Benefit Exchanges (“Exchanges”), and to participate in grants and other incentive opportunities.
In some cases, commercial third-party payers rely on all or portions of the MS-DRG system to determinepayment rates, which may result in decreased reimbursement from some commercial third-party payers. Otherchanges to government health care programs may negatively impact payments from commercial third-party payers.
Current or future health care reform efforts, changes in laws or regulations regarding government healthcare programs, other changes in the administration of government health care programs and changes tocommercial third-party payers in response to health care reform and other changes to government health careprograms could have a material, adverse effect on our financial position and results of operations.
We are unable to predict the impact of the Health Reform Law, which represents a significant change tothe health care industry.
As enacted, the Health Reform Law will change how health care services are covered, delivered, andreimbursed through expanded coverage of uninsured individuals, reduced growth in Medicare programspending, reductions in Medicare and Medicaid DSH payments and the establishment of programs wherereimbursement is tied to quality and integration. In addition, the law reforms certain aspects of healthinsurance, expands existing efforts to tie Medicare and Medicaid payments to performance and quality, andcontains provisions intended to strengthen fraud and abuse enforcement.
The expansion of health insurance coverage under the Health Reform Law may result in a material increasein the number of patients using our facilities who have either private or public program coverage. In addition, adisproportionately large percentage of the new Medicaid coverage is likely to be in states that currently haverelatively low income eligibility requirements. Two such states are Texas and Florida, where about one-half ofour licensed beds are located. We also have a significant presence in other relatively low income eligibilitystates, including Georgia, Kansas, Louisiana, Missouri, Oklahoma and Virginia. Further, the Health Reform Lawprovides for a value-based purchasing program, the establishment of Accountable Care Organizations (“ACOs”)and bundled payment pilot programs, which will create possible sources of additional revenue.
However, it is difficult to predict the size of the potential revenue gains to the Company as a result of theseelements of the Health Reform Law, because of uncertainty surrounding a number of material factors, includingthe following:
• how many previously uninsured individuals will obtain coverage as a result of the Health Reform Law(while the Congressional Budget Office (“CBO”) estimates 32 million, CMS estimates almost 34 million;both agencies made a number of assumptions to derive that figure, including how many individuals willignore substantial subsidies and decide to pay the penalty rather than obtain health insurance and whatpercentage of people in the future will meet the new Medicaid income eligibility requirements);
• what percentage of the newly insured patients will be covered under the Medicaid program and whatpercentage will be covered by private health insurers;
• the extent to which states will enroll new Medicaid participants in managed care programs;
• the pace at which insurance coverage expands, including the pace of different types of coverage expansion;
• the change, if any, in the volume of inpatient and outpatient hospital services that are sought by andprovided to previously uninsured individuals;
• the rate paid to hospitals by private payers for newly covered individuals, including those coveredthrough the newly created Exchanges and those who might be covered under the Medicaid programunder contracts with the state;
• the rate paid by state governments under the Medicaid program for newly covered individuals;
15
• how the value-based purchasing and other quality programs will be implemented;
• the percentage of individuals in the Exchanges who select the high deductible plans, since healthinsurers offering those kinds of products have traditionally sought to pay lower rates to hospitals;
• whether the net effect of the Health Reform Law, including the prohibition on excluding individualsbased on pre-existing conditions, the requirement to keep medical costs at or above a specifiedminimum percentage of premium revenue, other health insurance reforms and the annual fee applied toall health insurers, will be to put pressure on the bottom line of health insurers, which in turn mightcause them to seek to reduce payments to hospitals with respect to both newly insured individuals andtheir existing business; and
• the possibility that implementation of the provisions expanding health insurance coverage or the entireHealth Reform Law will be delayed due to court challenges or revised or eliminated as a result of courtchallenges and efforts to repeal or amend the law. More than 20 challenges to the Health Reform Lawhave been filed in federal courts. Some federal district courts have upheld the constitutionality of theHealth Reform Law or dismissed cases on procedural grounds. Others have held unconstitutional therequirement that individuals maintain health insurance or pay a penalty and have either found the HealthReform Law void in its entirety or left the remainder of the law intact. These lawsuits are subject toappeal, and several are currently on appeal, including those that hold the law unconstitutional.
On the other hand, the Health Reform Law provides for significant reductions in the growth of Medicarespending, reductions in Medicare and Medicaid DSH payments and the establishment of programs wherereimbursement is tied to quality and integration. Since 40.7% of our revenues in 2010 were from Medicareand Medicaid, reductions to these programs may significantly impact us and could offset any positive effectsof the Health Reform Law. It is difficult to predict the size of the revenue reductions to Medicare andMedicaid spending, because of uncertainty regarding a number of material factors, including the following:
• the amount of overall revenues we will generate from Medicare and Medicaid business when thereductions are implemented;
• whether reductions required by the Health Reform Law will be changed by statute or by judicialdecision prior to becoming effective;
• the size of the Health Reform Law’s annual productivity adjustment to the market basket beginning in2012 payment years;
• the amount of the Medicare DSH reductions that will be made, commencing in federal fiscal year 2014;
• the allocation to our hospitals of the Medicaid DSH reductions, commencing in federal fiscal year 2014;
• what the losses in revenues will be, if any, from the Health Reform Law’s quality initiatives;
• how successful ACOs, in which we anticipate participating, will be at coordinating care and reducingcosts or whether they will decrease reimbursement;
• the scope and nature of potential changes to Medicare reimbursement methods, such as an emphasis onbundling payments or coordination of care programs;
• whether our revenues from upper payment limit (“UPL”) programs will be adversely affected, becausethere may be fewer indigent, non-Medicaid patients for whom the Company provides services pursuantto UPL programs; and
• reductions to Medicare payments CMS may impose for “excessive readmissions.”
Because of the many variables involved, we are unable to predict the net effect on us of the expectedincreases in insured individuals using our facilities, the reductions in Medicare spending, reductions in Medicareand Medicaid DSH funding, and numerous other provisions in the Health Reform Law that may affect us.Further, it is unclear how efforts to repeal or revise the Health Reform Law and federal lawsuits challenging itsconstitutionality will be resolved or what the impact would be of any resulting changes to the law.
16
If we are unable to retain and negotiate favorable contracts with nongovernment payers, includingmanaged care plans, our revenues may be reduced.
Our ability to obtain favorable contracts with nongovernment payers, including health maintenanceorganizations, preferred provider organizations and other managed care plans significantly affects the revenuesand operating results of our facilities. Revenues derived from these entities and other insurers accounted for53.7% and 53.4% of our revenues for 2010 and 2009, respectively. Nongovernment payers, including managedcare payers, continue to demand discounted fee structures, and the trend toward consolidation amongnongovernment payers tends to increase their bargaining power over fee structures. As various provisions ofthe Health Reform Law are implemented, including the establishment of the Exchanges, nongovernmentpayers increasingly may demand reduced fees. Our future success will depend, in part, on our ability to retainand renew our managed care contracts and enter into new managed care contracts on terms favorable to us.Other health care providers may impact our ability to enter into managed care contracts or negotiate increasesin our reimbursement and other favorable terms and conditions. For example, some of our competitors maynegotiate exclusivity provisions with managed care plans or otherwise restrict the ability of managed carecompanies to contract with us. It is not clear what impact, if any, the increased obligations on managed carepayers and other payers imposed by the Health Reform Law will have on our ability to negotiatereimbursement increases. If we are unable to retain and negotiate favorable contracts with managed care plansor experience reductions in payment increases or amounts received from nongovernment payers, our revenuesmay be reduced.
Our performance depends on our ability to recruit and retain quality physicians.
The success of our hospitals depends in part on the number and quality of the physicians on the medicalstaffs of our hospitals, the admitting practices of those physicians and maintaining good relations with thosephysicians. Although we employ some physicians, physicians are often not employees of the hospitals atwhich they practice and, in many of the markets we serve, most physicians have admitting privileges at otherhospitals in addition to our hospitals. Such physicians may terminate their affiliation with our hospitals at anytime. If we are unable to provide adequate support personnel or technologically advanced equipment andhospital facilities that meet the needs of those physicians and their patients, they may be discouraged fromreferring patients to our facilities, admissions may decrease and our operating performance may decline.
Our hospitals face competition for staffing, which may increase labor costs and reduce profitability.
Our operations are dependent on the efforts, abilities and experience of our management and medicalsupport personnel, such as nurses, pharmacists and lab technicians, as well as our physicians. We compete withother health care providers in recruiting and retaining qualified management and support personnel responsiblefor the daily operations of each of our hospitals, including nurses and other nonphysician health careprofessionals. In some markets, the availability of nurses and other medical support personnel has been asignificant operating issue to health care providers. We may be required to continue to enhance wages andbenefits to recruit and retain nurses and other medical support personnel or to hire more expensive temporary orcontract personnel. As a result, our labor costs could increase. We also depend on the available labor pool ofsemi-skilled and unskilled employees in each of the markets in which we operate. Certain proposed changes infederal labor laws, including the Employee Free Choice Act, could increase the likelihood of employeeunionization attempts. To the extent a significant portion of our employee base unionizes, it is possible our laborcosts could increase materially. When negotiating collective bargaining agreements with unions, whether suchagreements are renewals or first contracts, there is the possibility that strikes could occur during the negotiationprocess, and our continued operation during any strikes could increase our labor costs. In addition, the states inwhich we operate could adopt mandatory nurse-staffing ratios or could reduce mandatory nurse staffing ratiosalready in place. State-mandated nurse-staffing ratios could significantly affect labor costs and have an adverseimpact on revenues if we are required to limit admissions in order to meet the required ratios. If our labor costsincrease, we may not be able to raise rates to offset these increased costs. Because a significant percentage ofour revenues consists of fixed, prospective payments, our ability to pass along increased labor costs isconstrained. Our failure to recruit and retain qualified management, nurses and other medical support personnel,or to control labor costs, could have a material, adverse effect on our results of operations.
17

If we fail to comply with extensive laws and government regulations, we could suffer penalties or berequired to make significant changes to our operations.
The health care industry is required to comply with extensive and complex laws and regulations at thefederal, state and local government levels relating to, among other things:
• billing and coding for services and properly handling overpayments;
• relationships with physicians and other referral sources;
• necessity and adequacy of medical care;
• quality of medical equipment and services;
• qualifications of medical and support personnel;
• confidentiality, maintenance, data breach, identity theft and security issues associated with health-related and personal information and medical records;
• screening, stabilization and transfer of individuals who have emergency medical conditions;
• licensure and certification;
• hospital rate or budget review;
• preparing and filing of cost reports;
• operating policies and procedures;
• activities regarding competitors; and
• addition of facilities and services.
Among these laws are the federal Anti-kickback Statute, the federal physician self-referral law(commonly called the “Stark Law”), the federal False Claims Act (“FCA”) and similar state laws. We have avariety of financial relationships with physicians and others who either refer or influence the referral ofpatients to our hospitals and other health care facilities, and these laws govern those relationships. The Officeof Inspector General of the Department of Health and Human Services (“OIG”) has enacted safe harborregulations that outline practices deemed protected from prosecution under the Anti-kickback Statute. Whilewe endeavor to comply with the applicable safe harbors, certain of our current arrangements, including jointventures and financial relationships with physicians and other referral sources and persons and entities towhich we refer patients, do not qualify for safe harbor protection. Failure to qualify for a safe harbor does notmean the arrangement necessarily violates the Anti-kickback Statute but may subject the arrangement togreater scrutiny. However, we cannot offer assurance that practices outside of a safe harbor will not be foundto violate the Anti-kickback Statute. Allegations of violations of the Anti-kickback Statute may be broughtunder the federal Civil Monetary Penalty Law, which requires a lower burden of proof than other fraud andabuse laws, including the Anti-kickback Statute.
Our financial relationships with referring physicians and their immediate family members must comply withthe Stark Law by meeting an exception. We attempt to structure our relationships to meet an exception to theStark Law, but the regulations implementing the exceptions are detailed and complex, and we cannot provideassurance that every relationship complies fully with the Stark Law. Unlike the Anti-kickback Statute, failure tomeet an exception under the Stark Law results in a violation of the Stark Law, even if such violation is technicalin nature.
Additionally, if we violate the Anti-kickback Statute or Stark Law, or if we improperly bill for ourservices, we may be found to violate the FCA, either under a suit brought by the government or by a privateperson under a qui tam, or “whistleblower,” suit. See “Business — Regulation and Other Factors.”
If we fail to comply with the Anti-kickback Statute, the Stark Law, the FCA or other applicable laws andregulations, we could be subjected to liabilities, including civil penalties (including the loss of our licenses tooperate one or more facilities), exclusion of one or more facilities from participation in the Medicare,
18
Medicaid and other federal and state health care programs and, for violations of certain laws and regulations,criminal penalties.
We do not always have the benefit of significant regulatory or judicial interpretation of these laws andregulations. In the future, different interpretations or enforcement of, or amendment to, these laws andregulations could subject our current or past practices to allegations of impropriety or illegality or couldrequire us to make changes in our facilities, equipment, personnel, services, capital expenditure programs andoperating expenses. A determination that we have violated these laws, or the public announcement that we arebeing investigated for possible violations of these laws, could have a material, adverse effect on our business,financial condition, results of operations or prospects, and our business reputation could suffer significantly. Inaddition, other legislation or regulations at the federal or state level may be adopted that adversely affect ourbusiness.
We have been and could become the subject of governmental investigations, claims and litigation.
Health care companies are subject to numerous investigations by various governmental agencies. Further,under the FCA, private parties have the right to bring qui tam, or “whistleblower,” suits against companies thatsubmit false claims for payments to, or improperly retain overpayments from, the government. Some states haveadopted similar state whistleblower and false claims provisions. Certain of our individual facilities have received,and other facilities may receive, government inquiries from, and may be subject to investigation by, federal andstate agencies. Depending on whether the underlying conduct in these or future inquiries or investigations couldbe considered systemic, their resolution could have a material, adverse effect on our financial position, results ofoperations and liquidity.
Governmental agencies and their agents, such as the Medicare Administrative Contractors, fiscalintermediaries and carriers, as well as the OIG, CMS and state Medicaid programs, conduct audits of our healthcare operations. Private payers may conduct similar post-payment audits, and we also perform internal audits andmonitoring. Depending on the nature of the conduct found in such audits and whether the underlying conductcould be considered systemic, the resolution of these audits could have a material, adverse effect on our financialposition, results of operations and liquidity.
As required by statute, CMS has implemented the Recovery Audit Contractor (“RAC”) program on anationwide basis. Under the program, CMS contracts with RACs on a contingency fee basis to conduct post-payment reviews to detect and correct improper payments in the fee-for-service Medicare program. The HealthReform Law expands the RAC program’s scope to include managed Medicare plans and to include Medicaidclaims. In addition, CMS employs Medicaid Integrity Contractors (“MICs”) to perform post-payment audits ofMedicaid claims and identify overpayments. The Health Reform Law increases federal funding for the MICprogram for federal fiscal year 2011 and later years. In addition to RACs and MICs, the state Medicaidagencies and other contractors have increased their review activities.
Should we be found out of compliance with any of these laws, regulations or programs, depending on thenature of the findings, our business, our financial position and our results of operations could be negativelyimpacted. See “Business — Legal Proceedings — Government Investigations, Claims and Litigation.”
Controls designed to reduce inpatient services may reduce our revenues.
Controls imposed by Medicare, managed Medicare, Medicaid, managed Medicaid and commercial third-party payers designed to reduce admissions and lengths of stay, commonly referred to as “utilization review,”have affected and are expected to continue to affect our facilities. Utilization review entails the review of theadmission and course of treatment of a patient by health plans. Inpatient utilization, average lengths of stayand occupancy rates continue to be negatively affected by payer-required preadmission authorization andutilization review and by payer pressure to maximize outpatient and alternative health care delivery servicesfor less acutely ill patients. Efforts to impose more stringent cost controls are expected to continue. Forexample, the Health Reform Law potentially expands the use of prepayment review by Medicare contractorsby eliminating statutory restrictions on their use. Although we are unable to predict the effect these changes
19
will have on our operations, significant limits on the scope of services reimbursed and on reimbursement ratesand fees could have a material, adverse effect on our business, financial position and results of operations.
Our overall business results may suffer from the economic downturn.
During periods of high unemployment, governmental entities often experience budget deficits as a resultof increased costs and lower than expected tax collections. These budget deficits at federal, state and localgovernment entities have decreased, and may continue to decrease, spending for health and human serviceprograms, including Medicare, Medicaid and similar programs, which represent significant payer sources forour hospitals. Other risks we face during periods of high unemployment include potential declines in thepopulation covered under managed care agreements, patient decisions to postpone or cancel elective and non-emergency health care procedures, potential increases in the uninsured and underinsured populations andfurther difficulties in our collecting patient co-payment and deductible receivables.
The industry trend towards value-based purchasing may negatively impact our revenues.
There is a trend in the health care industry towards value-based purchasing of health care services. Thesevalue-based purchasing programs include both public reporting of quality data and preventable adverse eventstied to the quality and efficiency of care provided by facilities. Governmental programs including Medicareand Medicaid currently require hospitals to report certain quality data to receive full reimbursement updates.In addition, Medicare does not reimburse for care related to certain preventable adverse events (also called“never events”). Many large commercial payers currently require hospitals to report quality data, and severalcommercial payers do not reimburse hospitals for certain preventable adverse events. Further, we haveimplemented a policy pursuant to which we do not bill patients or third-party payers for fees or expensesincurred due to certain preventable adverse events.
Effective July 1, 2011, the Health Reform Law will prohibit the use of federal funds under the Medicaidprogram to reimburse providers for medical assistance provided to treat hospital acquired conditions(“HACs”). Beginning in federal fiscal year 2015, the 25% of hospitals with the worst national risk-adjustedHAC rates in the previous year will receive a 1% reduction in their total inpatient operating Medicarepayments. Hospitals with excessive readmissions for conditions designated by the Department of Health andHuman Services (“HHS”) will receive reduced payments for all inpatient discharges, not just dischargesrelating to the conditions subject to the excessive readmission standard.
The Health Reform Law also requires HHS to implement a value-based purchasing program for inpatienthospital services. The Health Reform Law requires HHS to reduce inpatient hospital payments for alldischarges by a percentage beginning at 1% in federal fiscal year 2013 and increasing by 0.25% each fiscalyear up to 2% in federal fiscal year 2017 and subsequent years. HHS will pool the amount collected fromthese reductions to fund payments to reward hospitals that meet or exceed certain quality performancestandards established by HHS. HHS will determine the amount each hospital that meets or exceeds the qualityperformance standards will receive from the pool of dollars created by these payment reductions. As proposedby CMS, the value-based purchasing program will initially calculate incentive payments based on hospitals’achievement of 17 clinical process of care measures and eight dimensions of a patient’s experience of careusing the Hospital Consumer Assessment of Healthcare Providers and Systems (“HCAHPS”) survey and theirimprovement in meeting these standards compared to prior periods. For federal fiscal year 2013, CMSestimates the value-based purchasing program will redistribute $850 million among the nation’s hospitals.
We expect value-based purchasing programs, including programs that condition reimbursement on patientoutcome measures, to become more common and to involve a higher percentage of reimbursement amounts.We are unable at this time to predict how this trend will affect our results of operations, but it couldnegatively impact our revenues.
Our operations could be impaired by a failure of our information systems.
Any system failure that causes an interruption in service or availability of our systems could adverselyaffect operations or delay the collection of revenues. Even though we have implemented network security
20
measures, our servers are vulnerable to computer viruses, break-ins and similar disruptions from unauthorizedtampering. The occurrence of any of these events could result in interruptions, delays, the loss or corruption ofdata, cessations in the availability of systems or liability under privacy and security laws, all of which could havea material adverse effect on our financial position and results of operations and harm our business reputation.
The performance of our information technology and systems is critical to our business operations. Inaddition to our shared services initiatives, our information systems are essential to a number of critical areasof our operations, including:
• accounting and financial reporting;
• billing and collecting accounts;
• coding and compliance;
• clinical systems;
• medical records and document storage;
• inventory management;
• negotiating, pricing and administering managed care contracts and supply contracts; and
• monitoring quality of care and collecting data on quality measures necessary for full Medicare paymentupdates.
If we fail to effectively and timely implement electronic health record systems, our operations could beadversely affected.
As required by ARRA, the Secretary of HHS is in the process of developing and implementing an incentivepayment program for eligible hospitals and health care professionals that adopt and meaningfully use certifiedelectronic health record (“EHR”) technology. HHS intends to use the Provider Enrollment, Chain and OwnershipSystem (“PECOS”) to verify Medicare enrollment prior to making EHR incentive program payments. During2011, we anticipate receiving Medicare and Medicaid incentive payments for being a meaningful user ofcertified EHR technology. We anticipate a majority of 2011 incentive payments will be received and recognizedas revenues during the fourth quarter of 2011. Medicare and Medicaid incentive payments for our eligiblehospitals and professionals are estimated to range from $275 to $325 million for 2011. Actual incentivepayments could vary from these estimates due to certain factors such as availability of federal funding for bothMedicare and Medicaid incentive payments, timing of the approval of state Medicaid incentive payment plans byCMS and our ability to implement and demonstrate meaningful use of certified EHR technology.
We have incurred and will continue to incur both capital costs and operating expenses in order toimplement our certified EHR technology and meet meaningful use requirements. These expenses are ongoingand are projected to continue over all stages of implementation of meaningful use. The timing of expenseswill not correlate with the receipt of the incentive payments and the recognition of revenues. We estimate thatoperating expenses to implement our certified EHR technology and meet meaningful use will range from $125to $150 million for 2011. Actual operating expenses could vary from these estimates. If our hospitals andemployed professionals are unable to meet the requirements for participation in the incentive paymentprogram, including having an enrollment record in PECOS, we will not be eligible to receive incentivepayments that could offset some of the costs of implementing EHR systems. Further, eligible providers thatfail to demonstrate meaningful use of certified EHR technology will be subject to reduced payments fromMedicare, beginning in federal fiscal year 2015 for eligible hospitals and calendar year 2015 for eligibleprofessionals. Failure to implement certified EHR systems effectively and in a timely manner could have amaterial, adverse effect on our financial position and results of operations.
21
State efforts to regulate the construction or expansion of health care facilities could impair our ability tooperate and expand our operations.
Some states, particularly in the eastern part of the country, require health care providers to obtain priorapproval, known as a CON, for the purchase, construction or expansion of health care facilities, to make certaincapital expenditures or to make changes in services or bed capacity. In giving approval, these states consider theneed for additional or expanded health care facilities or services. We currently operate health care facilities in anumber of states with CON laws. The failure to obtain any requested CON could impair our ability to operate orexpand operations. Any such failure could, in turn, adversely affect our ability to attract patients to our facilitiesand grow our revenues, which would have an adverse effect on our results of operations.
Our facilities are heavily concentrated in Florida and Texas, which makes us sensitive to regulatory,economic, environmental and competitive conditions and changes in those states.
We operated 164 hospitals at December 31, 2010, and 74 of those hospitals are located in Florida andTexas. Our Florida and Texas facilities’ combined revenues represented approximately 52% of ourconsolidated revenues for the year ended December 31, 2010. This concentration makes us particularlysensitive to regulatory, economic, environmental and competitive conditions and changes in those states. Anymaterial change in the current payment programs or regulatory, economic, environmental or competitiveconditions in those states could have a disproportionate effect on our overall business results.
In addition, our hospitals in Florida, Texas and other areas across the Gulf Coast are located in hurricane-prone areas. In the recent past, hurricanes have had a disruptive effect on the operations of our hospitals inFlorida, Texas and other coastal states, and the patient populations in those states. Our business activitiescould be harmed by a particularly active hurricane season or even a single storm, and the property insurancewe obtain may not be adequate to cover losses from future hurricanes or other natural disasters.
We may be subject to liabilities from claims by the Internal Revenue Service.
We are currently contesting, before the Internal Revenue Service (“IRS”) Appeals Division, certain claimeddeficiencies and adjustments proposed by the IRS Examination Division in connection with its audit of HCAInc.’s 2005 and 2006 federal income tax returns. The disputed items include the timing of recognition of certainpatient service revenues, the deductibility of certain debt retirement costs and our method for calculating the taxallowance for doubtful accounts. In addition, eight taxable periods of HCA Inc. and its predecessors ended in1997 through 2004, for which the primary remaining issue is the computation of the tax allowance for doubtfulaccounts, are currently pending before the IRS Examination Division. The IRS Examination Division began anaudit of HCA Inc.’s 2007, 2008 and 2009 federal income tax returns in December 2010.
Management believes HCA Holdings, Inc., its predecessors, subsidiaries and affiliates properly reportedtaxable income and paid taxes in accordance with applicable laws and agreements established with the IRS andfinal resolution of these disputes will not have a material, adverse effect on our results of operations or financialposition. However, if payments due upon final resolution of these issues exceed our recorded estimates, suchresolutions could have a material, adverse effect on our results of operations or financial position.
We may be subject to liabilities from claims brought against our facilities.
We are subject to litigation relating to our business practices, including claims and legal actions bypatients and others in the ordinary course of business alleging malpractice, product liability or other legaltheories. See “Business — Legal Proceedings.” Many of these actions involve large claims and significantdefense costs. We insure a portion of our professional liability risks through a wholly-owned subsidiary.Management believes our reserves for self-insured retentions and insurance coverage are sufficient to coverinsured claims arising out of the operation of our facilities. Our wholly-owned insurance subsidiary hasentered into certain reinsurance contracts, and the obligations covered by the reinsurance contracts areincluded in its reserves for professional liability risks, as the subsidiary remains liable to the extent that thereinsurers do not meet their obligations under the reinsurance contracts. If payments for claims exceed
22
actuarially determined estimates, are not covered by insurance, or reinsurers, if any, fail to meet theirobligations, our results of operations and financial position could be adversely affected.
We are exposed to market risks related to changes in the market values of securities and interest ratechanges.
We are exposed to market risk related to changes in market values of securities. The investments in debtand equity securities of our wholly-owned insurance subsidiary were $734 million and $8 million, respectively,at December 31, 2010. These investments are carried at fair value, with changes in unrealized gains and lossesbeing recorded as adjustments to other comprehensive income. At December 31, 2010, we had a netunrealized gain of $10 million on the insurance subsidiary’s investment securities.
We are exposed to market risk related to market illiquidity. Liquidity of the investments in debt andequity securities of our wholly-owned insurance subsidiary could be impaired by the inability to access thecapital markets. Should the wholly-owned insurance subsidiary require significant amounts of cash in excessof normal cash requirements to pay claims and other expenses on short notice, we may have difficulty sellingthese investments in a timely manner or be forced to sell them at a price less than what we might otherwisehave been able to in a normal market environment. At December 31, 2010, our wholly-owned insurancesubsidiary had invested $250 million ($251 million par value) in tax-exempt student loan auction ratesecurities that continue to experience market illiquidity. It is uncertain if auction-related market liquidity willresume for these securities. We may be required to recognize other-than-temporary impairments on these long-term investments in future periods should issuers default on interest payments or should the fair marketvaluations of the securities deteriorate due to ratings downgrades or other issue specific factors.
We are also exposed to market risk related to changes in interest rates, and we periodically enter intointerest rate swap agreements to manage our exposure to these fluctuations. Our interest rate swap agreementsinvolve the exchange of fixed and variable rate interest payments between two parties, based on commonnotional principal amounts and maturity dates. The notional amounts of the swap agreements representbalances used to calculate the exchange of cash flows and are not our assets or liabilities. See “Management’sDiscussion and Analysis of Financial Condition and Results of Operations — Market Risk.”
Risks Related to Our Indebtedness
Our substantial leverage could adversely affect our ability to raise additional capital to fund ouroperations, limit our ability to react to changes in the economy or our industry, expose us to interest raterisk to the extent of our variable rate debt and prevent us from meeting our obligations.
We are highly leveraged. As of December 31, 2010, our total indebtedness was $28.225 billion. As ofDecember 31, 2010 we had availability of $1.189 billion under our cash flow credit facility and $125 millionunder our asset-based revolving credit facility, after giving effect to letters of credit and borrowing baselimitations. Our high degree of leverage could have important consequences, including:
• increasing our vulnerability to downturns or adverse changes in general economic, industry orcompetitive conditions and adverse changes in government regulations;
• requiring a substantial portion of cash flow from operations to be dedicated to the payment of principaland interest on our indebtedness, therefore reducing our ability to use our cash flow to fund ouroperations, capital expenditures and future business opportunities;
• exposing us to the risk of increased interest rates as certain of our unhedged borrowings are at variablerates of interest;
• limiting our ability to make strategic acquisitions or causing us to make nonstrategic divestitures;
• limiting our ability to obtain additional financing for working capital, capital expenditures, product orservice line development, debt service requirements, acquisitions and general corporate or otherpurposes; and
23
• limiting our ability to adjust to changing market conditions and placing us at a competitivedisadvantage compared to our competitors who are less highly leveraged.
We and our subsidiaries have the ability to incur additional indebtedness in the future, subject to therestrictions contained in our senior secured credit facilities and the indentures governing our outstanding notes.If new indebtedness is added to our current debt levels, the related risks that we now face could intensify.
We may not be able to generate sufficient cash to service all of our indebtedness and may not be able torefinance our indebtedness on favorable terms. If we are unable to do so, we may be forced to take otheractions to satisfy our obligations under our indebtedness, which may not be successful.
Our ability to make scheduled payments on or to refinance our debt obligations depends on our financialcondition and operating performance, which are subject to prevailing economic and competitive conditions andto certain financial, business and other factors beyond our control. We cannot assure you we will maintain alevel of cash flows from operating activities sufficient to permit us to pay the principal, premium, if any, andinterest on our indebtedness.
In addition, we conduct our operations through our subsidiaries. Accordingly, repayment of ourindebtedness is dependent on the generation of cash flow by our subsidiaries and their ability to make suchcash available to us by dividend, debt repayment or otherwise. Our subsidiaries may not be able to, or maynot be permitted to, make distributions to enable us to make payments in respect of our indebtedness. Eachsubsidiary is a distinct legal entity, and, under certain circumstances, legal and contractual restrictions maylimit our ability to obtain cash from our subsidiaries.
We may find it necessary or prudent to refinance our outstanding indebtedness with longer-maturity debtat a higher interest rate. In February, April and August of 2009 and, in March of 2010, for example, we issued$310 million in aggregate principal amount of 97⁄8% second lien notes due 2017, $1.500 billion in aggregateprincipal amount of 81⁄2% first lien notes due 2019, $1.250 billion in aggregate principal amount of 77⁄8% firstlien notes due 2020 and $1.400 billion in aggregate principal amount of 71⁄4% first lien notes due 2020,respectively. The net proceeds of those offerings were used to prepay term loans under our cash flow creditfacility, which currently bears interest at a lower floating rate. Our ability to refinance our indebtedness onfavorable terms, or at all, is directly affected by the current global economic and financial conditions. Inaddition, our ability to incur secured indebtedness (which would generally enable us to achieve better pricingthan the incurrence of unsecured indebtedness) depends in part on the value of our assets, which depends, inturn, on the strength of our cash flows and results of operations, and on economic and market conditions andother factors.
If our cash flows and capital resources are insufficient to fund our debt service obligations or we areunable to refinance our indebtedness, we may be forced to reduce or delay investments and capitalexpenditures, or to sell assets, seek additional capital or restructure our indebtedness. These alternativemeasures may not be successful and may not permit us to meet our scheduled debt service obligations. If ouroperating results and available cash are insufficient to meet our debt service obligations, we could facesubstantial liquidity problems and might be required to dispose of material assets or operations to meet ourdebt service and other obligations. We may not be able to consummate those dispositions, or the proceedsfrom the dispositions may not be adequate to meet any debt service obligations then due.
Our debt agreements contain restrictions that limit our flexibility in operating our business.
Our senior secured credit facilities and the indentures governing our outstanding notes contain variouscovenants that limit our ability to engage in specified types of transactions. These covenants limit our andcertain of our subsidiaries’ ability to, among other things:
• incur additional indebtedness or issue certain preferred shares;
• pay dividends on, repurchase or make distributions in respect of our capital stock or make otherrestricted payments;
24

• make certain investments;
• sell or transfer assets;
• create liens;
• consolidate, merge, sell or otherwise dispose of all or substantially all of our assets; and
• enter into certain transactions with our affiliates.
Under our asset-based revolving credit facility, when (and for as long as) the combined availability underour asset-based revolving credit facility and our senior secured revolving credit facility is less than a specifiedamount for a certain period of time or, if a payment or bankruptcy event of default has occurred and iscontinuing, funds deposited into any of our depository accounts will be transferred on a daily basis into ablocked account with the administrative agent and applied to prepay loans under the asset-based revolvingcredit facility and to cash collateralize letters of credit issued thereunder.
Under our senior secured credit facilities, we are required to satisfy and maintain specified financialratios. Our ability to meet those financial ratios can be affected by events beyond our control, and there can beno assurance we will continue to meet those ratios. A breach of any of these covenants could result in adefault under both the cash flow credit facility and the asset-based revolving credit facility. Upon theoccurrence of an event of default under the senior secured credit facilities, the lenders thereunder could electto declare all amounts outstanding under the senior secured credit facilities to be immediately due and payableand terminate all commitments to extend further credit. If we were unable to repay those amounts, the lendersunder the senior secured credit facilities could proceed against the collateral granted to them to secure suchindebtedness. We have pledged a significant portion of our assets under our senior secured credit facilities, andthat collateral (other than certain European collateral securing our senior secured European term loan facility)is also pledged as collateral under our first lien notes. If any of the lenders under the senior secured creditfacilities accelerate the repayment of borrowings, there can be no assurance there will be sufficient assets torepay the senior secured credit facilities, the first lien notes and our other indebtedness.
Risks Related to this Offering and Ownership of Our Common Stock
An active, liquid trading market for our common stock may not develop.
After our Recapitalization and prior to this offering, there has not been a public market for our commonstock. We cannot predict the extent to which investor interest in our company will lead to the development of atrading market on the New York Stock Exchange or otherwise or how active and liquid that market may become.If an active and liquid trading market does not develop, you may have difficulty selling any of our common stockthat you purchase. The initial public offering price for the shares will be determined by negotiations between usand the underwriters and may not be indicative of prices that will prevail in the open market following thisoffering. The market price of our common stock may decline below the initial offering price, and you may not beable to sell your shares of our common stock at or above the price you paid in this offering, or at all.
You will incur immediate and substantial dilution in the net tangible book value of the shares youpurchase in this offering.
Prior investors have paid substantially less per share of our common stock than the price in this offering.The initial public offering price of our common stock is substantially higher than the net tangible book valueper share of outstanding common stock prior to completion of the offering. Based on our net tangible bookvalue as of December 31, 2010 and upon the issuance and sale of 87,719,300 shares of common stock by us atan assumed initial public offering price of $28.50 per share (the midpoint of the initial public offering pricerange indicated on the cover of this prospectus), if you purchase our common stock in this offering, you willpay more for your shares than the amounts paid by our existing stockholders for their shares and you willsuffer immediate dilution of approximately $51.16 per share in net tangible book value. We also have a largenumber of outstanding stock options to purchase common stock with exercise prices that are below theestimated initial public offering price of our common stock. To the extent that these options are exercised, youwill experience further dilution. See “Dilution.”
25

Our stock price may change significantly following the offering, and you could lose all or part of yourinvestment as a result.
We and the underwriters will negotiate to determine the initial public offering price. You may not be ableto resell your shares at or above the initial public offering price due to a number of factors such as those listedin “— Risks Related to Our Business” and the following, some of which are beyond our control:
• quarterly variations in our results of operations;
• results of operations that vary from the expectations of securities analysts and investors;
• results of operations that vary from those of our competitors;
• changes in expectations as to our future financial performance, including financial estimates bysecurities analysts and investors;
• announcements by us, our competitors or our vendors of significant contracts, acquisitions, jointmarketing relationships, joint ventures or capital commitments;
• announcements by third parties or governmental entities of significant claims or proceedings against us;
• new laws and governmental regulations applicable to the health care industry, including the HealthReform Law;
• a default under the agreements governing our indebtedness;
• future sales of our common stock by us, directors, executives and significant stockholders; and
• changes in domestic and international economic and political conditions and regionally in our markets.
Furthermore, the stock market has recently experienced extreme volatility that, in some cases, has beenunrelated or disproportionate to the operating performance of particular companies. These broad market andindustry fluctuations may adversely affect the market price of our common stock, regardless of our actual operatingperformance.
In the past, following periods of market volatility, stockholders have instituted securities class actionlitigation. If we were involved in securities litigation, it could have a substantial cost and divert resources andthe attention of executive management from our business regardless of the outcome of such litigation.
If we or our existing investors sell additional shares of our common stock after this offering, the marketprice of our common stock could decline.
The market price of our common stock could decline as a result of sales of a large number of shares ofcommon stock in the market after this offering, or the perception that such sales could occur. These sales, orthe possibility that these sales may occur, also might make it more difficult for us to sell equity securities inthe future at a time and at a price that we deem appropriate. After the completion of this offering, we willhave 515,205,100 shares of common stock outstanding. This number includes 124,000,000 shares that arebeing sold in this offering, which may be resold immediately in the public market.
We and the selling stockholders, our executive officers and directors and the Investors have agreed not tosell or transfer any common stock or securities convertible into, exchangeable for, exercisable for, or repayablewith common stock, for 180 days after the date of this prospectus without first obtaining the written consent oftwo of the representatives of the underwriters. In addition, pursuant to stockholders agreements, we have grantedcertain stockholders the right to cause us, in certain instances, at our expense, to file registration statementsunder the Securities Act of 1933, as amended (the “Securities Act”) covering resales of our common stock heldby them. These shares will represent approximately 73.3% of our outstanding common stock after this offering(69.8% if the overallotment option is exercised in full). These shares also may be sold pursuant to Rule 144under the Securities Act, depending on their holding period and subject to restrictions in the case of shares heldby persons deemed to be our affiliates. As restrictions on resale end or if these stockholders exercise theirregistration rights, the market price of our stock could decline if the holders of restricted shares sell them or areperceived by the market as intending to sell them. See “Certain Relationships and Related Party Transactions —Stockholder Agreements — Management Stockholder’s Agreement,” “Certain Relationships and Related PartyTransactions — Registration Rights Agreement,” “Shares Eligible for Future Sale” and “Underwriting.”
26
As of December 31, 2010, 427,458,800 shares of our common stock were outstanding, 23,834,766 shareswere issuable upon the exercise of outstanding vested stock options under our stock incentive plans,26,691,176 shares were subject to outstanding unvested stock options under our stock incentive plans and,effective upon the consummation of this offering, 41,497,181 shares will be reserved for future grant under ourstock incentive plans. Shares acquired upon the exercise of vested options under our stock incentive plan willfirst become eligible for resale at any time after the date of this prospectus. Sales of a substantial number ofshares of our common stock following the vesting of outstanding stock options could cause the market price ofour common stock to decline.
Because we do not currently intend to pay cash dividends on our common stock for the foreseeablefuture, you may not receive any return on investment unless you sell your common stock for a pricegreater than that which you paid for it.
We currently intend to retain future earnings, if any, for future operation, expansion and debt repaymentand do not intend to pay any cash dividends for the foreseeable future. Any decision to declare and paydividends in the future will be made at the discretion of our board of directors (the “Board” or the “Board ofDirectors”) and will depend on, among other things, our results of operations, financial condition, cashrequirements, contractual restrictions and other factors that our Board of Directors may deem relevant. Inaddition, our ability to pay dividends may be limited by covenants of any existing and future outstandingindebtedness we or our subsidiaries incur, including our senior secured credit facilities and the indenturesgoverning our notes. As a result, you may not receive any return on an investment in our common stockunless you sell our common stock for a price greater than that which you paid for it.
Some provisions of Delaware law and our governing documents could discourage a takeover thatstockholders may consider favorable.
In addition to the Investors’ ownership of a controlling percentage of our common stock, Delaware law andprovisions contained in our amended and restated certificate of incorporation and amended and restated bylawsas we expect them to be in effect upon pricing of this offering could make it difficult for a third party to acquireus, even if doing so might be beneficial to our stockholders. For example, our amended and restated certificateof incorporation authorizes our Board of Directors to determine the rights, preferences, privileges and restrictionsof unissued preferred stock, without any vote or action by our stockholders. As a result, our Board couldauthorize and issue shares of preferred stock with voting or conversion rights that could adversely affect thevoting or other rights of holders of our common stock or with other terms that could impede the completion of amerger, tender offer or other takeover attempt. In addition, as described under “Description of Capital Stock —Delaware Anti-Takeover Statutes” elsewhere in this prospectus, we are subject to certain provisions of Delawarelaw that may discourage potential acquisition proposals and may delay, deter or prevent a change of control ofour company, including through transactions, and, in particular, unsolicited transactions, that some or all of ourstockholders might consider to be desirable. As a result, efforts by our stockholders to change the direction ormanagement of our company may be unsuccessful.
The Investors will continue to have significant influence over us after this offering, including controlover decisions that require the approval of stockholders, which could limit your ability to influence theoutcome of key transactions, including a change of control.
We are controlled, and after this offering is completed will continue to be controlled, by the Investors.The Investors will indirectly own through their investment in Hercules Holding II, LLC (“Hercules Holding”)approximately 73.3% of our common stock after the completion of this offering (69.8% if the overallotmentoption is exercised in full). In addition, representatives of the Investors will have the right to designate amajority of the seats on our Board of Directors. As a result, the Investors will have control over our decisionsto enter into any corporate transaction (and the terms thereof) and the ability to prevent any change in thecomposition of our Board of Directors and any transaction that requires stockholder approval regardless ofwhether others believe that such change or transaction is in our best interests. So long as the Investorscontinue to indirectly hold a majority of our outstanding common stock, they will have the ability to control
27
the vote in any election of directors, amend our amended and restated certificate of incorporation or amendedand restated bylaws or take other actions requiring the vote of our stockholders. Even if such amount is lessthan 50%, the Investors will continue to be able to strongly influence or effectively control our decisions.
Additionally, Bain Capital, KKR, and BAML Capital Partners are in the business of making investmentsin companies and may acquire and hold interests in businesses that compete directly or indirectly with us. Oneor more of the Sponsors may also pursue acquisition opportunities that may be complementary to our businessand, as a result, those acquisition opportunities may not be available to us.
We are a “controlled company” within the meaning of the New York Stock Exchange rules and, as aresult, will qualify for, and intend to rely on, exemptions from certain corporate governancerequirements. You will not have the same protections afforded to stockholders of companies that aresubject to such requirements.
After completion of this offering, the Investors will continue to control a majority of the voting power ofour outstanding common stock. As a result, we are a “controlled company” within the meaning of thecorporate governance standards of the New York Stock Exchange. Under these rules, a company of whichmore than 50% of the voting power is held by an individual, group or another company is a “controlledcompany” and may elect not to comply with certain corporate governance requirements, including:
• the requirement that a majority of the Board of Directors consist of independent directors;
• the requirement that we have a nominating/corporate governance committee that is composed entirelyof independent directors with a written charter addressing the committee’s purpose and responsibilities;
• the requirement that we have a compensation committee that is composed entirely of independentdirectors with a written charter addressing the committee’s purpose and responsibilities; and
• the requirement for an annual performance evaluation of the nominating/corporate governance andcompensation committees.
Following this offering, we intend to utilize these exemptions. As a result, we will not have a majority ofindependent directors, our nominating and corporate governance committee, if any, and compensationcommittee will not consist entirely of independent directors and such committees will not be subject to annualperformance evaluations. Accordingly, you will not have the same protections afforded to stockholders ofcompanies that are subject to all of the corporate governance requirements of the New York Stock Exchange.
28
FORWARD-LOOKING STATEMENTS
This prospectus contains “forward-looking statements” within the meaning of the federal securities laws,which involve risks and uncertainties. Forward-looking statements include all statements that do not relatesolely to historical or current facts, and you can identify forward-looking statements because they containwords such as “believes,” “expects,” “may,” “will,” “should,” “seeks,” “approximately,” “intends,” “plans,”“estimates,” “projects,” “continue,” “initiative” or “anticipates” or similar expressions that concern ourprospects, objectives, strategies, plans or intentions. All statements made relating to our estimated andprojected earnings, margins, costs, expenditures, cash flows, growth rates, operating and growth strategies,ability to repay or refinance our substantial existing indebtedness and financial results or to the impact ofexisting or proposed laws or regulations (including the Health Reform Law) described in this prospectus areforward-looking statements. These forward-looking statements are subject to risks and uncertainties that maychange at any time, and, therefore, our actual results may differ materially from those expected. We derivemany of our forward-looking statements from our operating budgets and forecasts, which are based uponmany detailed assumptions. While we believe our assumptions are reasonable, it is very difficult to predict theimpact of known factors, and, of course, it is impossible to anticipate all factors that could affect our actualresults. These factors include, but are not limited to:
• the ability to recognize the benefits of the Recapitalization;
• the impact of the substantial indebtedness incurred to finance the Recapitalization and distributions tostockholders and the ability to refinance such indebtedness on acceptable terms;
• the effects related to the enactment of the Health Reform Law, the possible enactment of additionalfederal or state health care reforms and possible changes to the Health Reform Law and other federal,state or local laws or regulations affecting the health care industry;
• increases in the amount and risk of collectibility of uninsured accounts and deductibles and copaymentamounts for insured accounts;
• the ability to achieve operating and financial targets, attain expected levels of patient volumes andcontrol the costs of providing services;
• possible changes in the Medicare, Medicaid and other state programs, including Medicaid supplementalpayments pursuant to UPL programs, that may impact reimbursements to health care providers andinsurers;
• the highly competitive nature of the health care business;
• changes in revenue mix, including potential declines in the population covered under managed careagreements and the ability to enter into and renew managed care provider agreements on acceptableterms;
• the efforts of insurers, health care providers and others to contain health care costs;
• the outcome of our continuing efforts to monitor, maintain and comply with appropriate laws,regulations, policies and procedures;
• increases in wages and the ability to attract and retain qualified management and personnel, includingaffiliated physicians, nurses and medical and technical support personnel;
• the availability and terms of capital to fund the expansion of our business and improvements to ourexisting facilities;
• changes in accounting practices;
• changes in general economic conditions nationally and regionally in our markets;
• future divestitures which may result in charges and possible impairments of long-lived assets;
• changes in business strategy or development plans;
29

• delays in receiving payments for services provided;
• the outcome of pending and any future tax audits, appeals and litigation associated with our taxpositions;
• potential adverse impact of known and unknown government investigations, litigation and other claimsthat may be made against us; and
• other risk factors described in this prospectus.
All subsequent written and oral forward-looking statements attributable to us, or persons acting on ourbehalf, are expressly qualified in their entirety by these cautionary statements.
We caution you that the important factors discussed above may not contain all of the material factors thatare important to you. The forward-looking statements included in this prospectus are made only as of the datehereof. We undertake no obligation to publicly update or revise any forward-looking statement as a result ofnew information, future events or otherwise, except as otherwise required by law.
30
USE OF PROCEEDS
We estimate that the net proceeds we will receive from the sale of 87,719,300 shares of our commonstock in this offering, after deducting underwriter discounts and commissions and estimated expenses payableby us, will be approximately $2.4 billion. This estimate assumes an initial public offering price of $28.50 pershare, the midpoint of the range set forth on the cover page of this prospectus.
A $1.00 increase (decrease) in the assumed initial public offering price of $28.50 per share wouldincrease (decrease) the net proceeds to us from this offering by $84 million, assuming the number of sharesoffered by us, as set forth on the cover page of this prospectus, remains the same and after deducting theestimated underwriting discounts and commissions and estimated expenses payable by us. We will not receiveany proceeds from the sale of 36,280,700 shares (54,880,700 if the underwriters exercise the option topurchase additional shares in full) of our common stock by the selling stockholders.
We intend to use the anticipated net proceeds from this offering to repay certain of our existingindebtedness, as will be determined following completion of this offering, and for general corporate purposes.Pending such application, we intend to use the anticipated proceeds to temporarily reduce amounts under ourasset-based revolving credit facility and our senior secured revolving credit facility. Our asset-based revolvingcredit facility currently matures on November 16, 2012 and bears interest at LIBOR plus 1.25%. Our seniorsecured revolving credit facility matures on November 17, 2012 and will be extended to November 17, 2015and currently bears interest at LIBOR plus 1.50%.
Affiliates of certain of the underwriters are lenders under our senior secured credit facilities and,accordingly, may receive a portion of the net proceeds from this offering through repayment of suchindebtedness. See “Underwriting — Conflicts of Interest.”
31

DIVIDEND POLICY
Following completion of the offering, we do not intend to pay any cash dividends on our common stockfor the foreseeable future and instead may retain earnings, if any, for future operation and expansion and debtrepayment. Any decision to declare and pay dividends in the future will be made at the discretion of ourBoard of Directors and will depend on, among other things, our results of operations, cash requirements,financial condition, contractual restrictions and other factors that our Board of Directors may deem relevant. Inaddition, our ability to pay dividends is limited by covenants in our senior secured credit facilities and in theindentures governing certain of our notes. See “Description of Indebtedness” and Note 10 to our consolidatedfinancial statements for restrictions on our ability to pay dividends.
On January 27, 2010, our Board of Directors declared a distribution to our stockholders and holders ofvested stock options of $1.751 billion in the aggregate. On May 5, 2010, our Board of Directors declared adistribution to our stockholders and holders of vested stock options of $500 million in the aggregate. OnNovember 23, 2010, our Board of Directors declared a distribution to our stockholders and holders of stockoptions of approximately $2.1 billion in the aggregate.
32
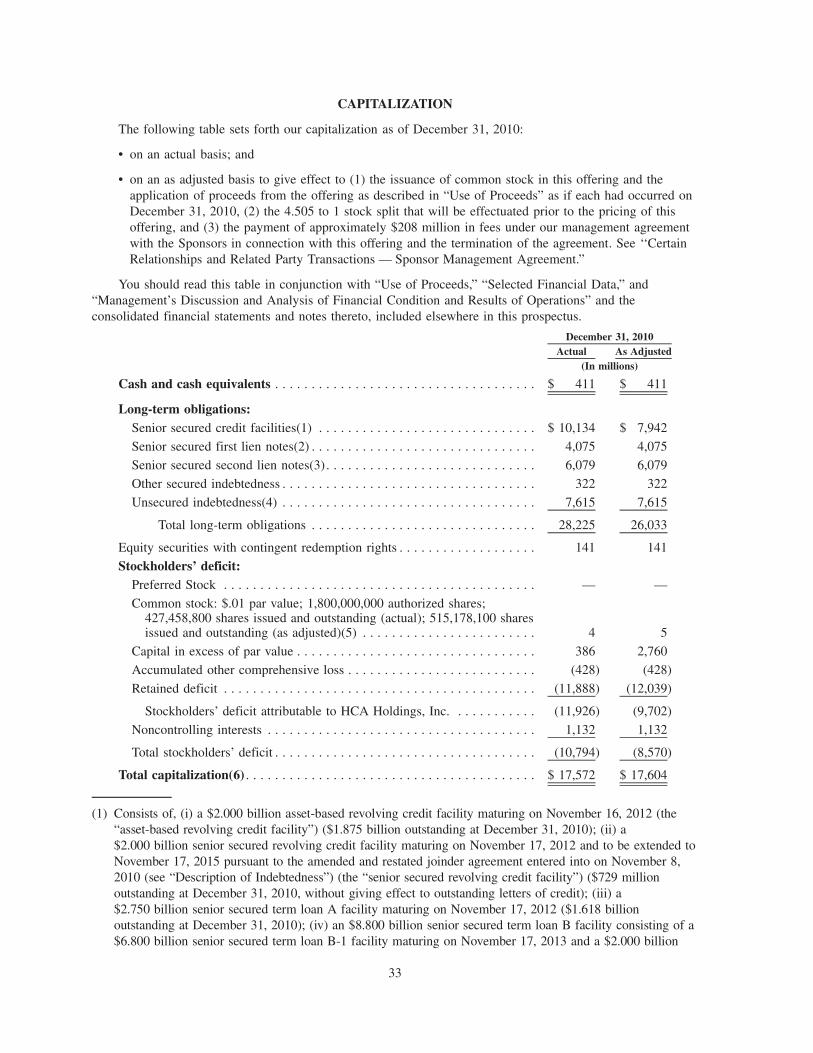
CAPITALIZATION
The following table sets forth our capitalization as of December 31, 2010:
• on an actual basis; and
• on an as adjusted basis to give effect to (1) the issuance of common stock in this offering and theapplication of proceeds from the offering as described in “Use of Proceeds” as if each had occurred onDecember 31, 2010, (2) the 4.505 to 1 stock split that will be effectuated prior to the pricing of thisoffering, and (3) the payment of approximately $208 million in fees under our management agreementwith the Sponsors in connection with this offering and the termination of the agreement. See ‘‘CertainRelationships and Related Party Transactions — Sponsor Management Agreement.”
You should read this table in conjunction with “Use of Proceeds,” “Selected Financial Data,” and“Management’s Discussion and Analysis of Financial Condition and Results of Operations” and theconsolidated financial statements and notes thereto, included elsewhere in this prospectus.
Actual As AdjustedDecember 31, 2010
(In millions)
Cash and cash equivalents . . . . . . . . . . . . . . . . . . . . . . . . . . . . . . . . . . . . $ 411 $ 411
Long-term obligations:Senior secured credit facilities(1) . . . . . . . . . . . . . . . . . . . . . . . . . . . . . . $ 10,134 $ 7,942
Senior secured first lien notes(2) . . . . . . . . . . . . . . . . . . . . . . . . . . . . . . . 4,075 4,075
Senior secured second lien notes(3) . . . . . . . . . . . . . . . . . . . . . . . . . . . . . 6,079 6,079
Other secured indebtedness . . . . . . . . . . . . . . . . . . . . . . . . . . . . . . . . . . . 322 322
Unsecured indebtedness(4) . . . . . . . . . . . . . . . . . . . . . . . . . . . . . . . . . . . 7,615 7,615
Total long-term obligations . . . . . . . . . . . . . . . . . . . . . . . . . . . . . . . 28,225 26,033
Equity securities with contingent redemption rights . . . . . . . . . . . . . . . . . . . 141 141
Stockholders’ deficit:Preferred Stock . . . . . . . . . . . . . . . . . . . . . . . . . . . . . . . . . . . . . . . . . . . — —
Common stock: $.01 par value; 1,800,000,000 authorized shares;427,458,800 shares issued and outstanding (actual); 515,178,100 sharesissued and outstanding (as adjusted)(5) . . . . . . . . . . . . . . . . . . . . . . . . 4 5
Capital in excess of par value . . . . . . . . . . . . . . . . . . . . . . . . . . . . . . . . . 386 2,760
Accumulated other comprehensive loss . . . . . . . . . . . . . . . . . . . . . . . . . . (428) (428)
Retained deficit . . . . . . . . . . . . . . . . . . . . . . . . . . . . . . . . . . . . . . . . . . . (11,888) (12,039)
Stockholders’ deficit attributable to HCA Holdings, Inc. . . . . . . . . . . . (11,926) (9,702)
Noncontrolling interests . . . . . . . . . . . . . . . . . . . . . . . . . . . . . . . . . . . . . 1,132 1,132
Total stockholders’ deficit . . . . . . . . . . . . . . . . . . . . . . . . . . . . . . . . . . . . (10,794) (8,570)
Total capitalization(6) . . . . . . . . . . . . . . . . . . . . . . . . . . . . . . . . . . . . . . . . $ 17,572 $ 17,604
(1) Consists of, (i) a $2.000 billion asset-based revolving credit facility maturing on November 16, 2012 (the“asset-based revolving credit facility”) ($1.875 billion outstanding at December 31, 2010); (ii) a$2.000 billion senior secured revolving credit facility maturing on November 17, 2012 and to be extended toNovember 17, 2015 pursuant to the amended and restated joinder agreement entered into on November 8,2010 (see “Description of Indebtedness”) (the “senior secured revolving credit facility”) ($729 millionoutstanding at December 31, 2010, without giving effect to outstanding letters of credit); (iii) a$2.750 billion senior secured term loan A facility maturing on November 17, 2012 ($1.618 billionoutstanding at December 31, 2010); (iv) an $8.800 billion senior secured term loan B facility consisting of a$6.800 billion senior secured term loan B-1 facility maturing on November 17, 2013 and a $2.000 billion
33
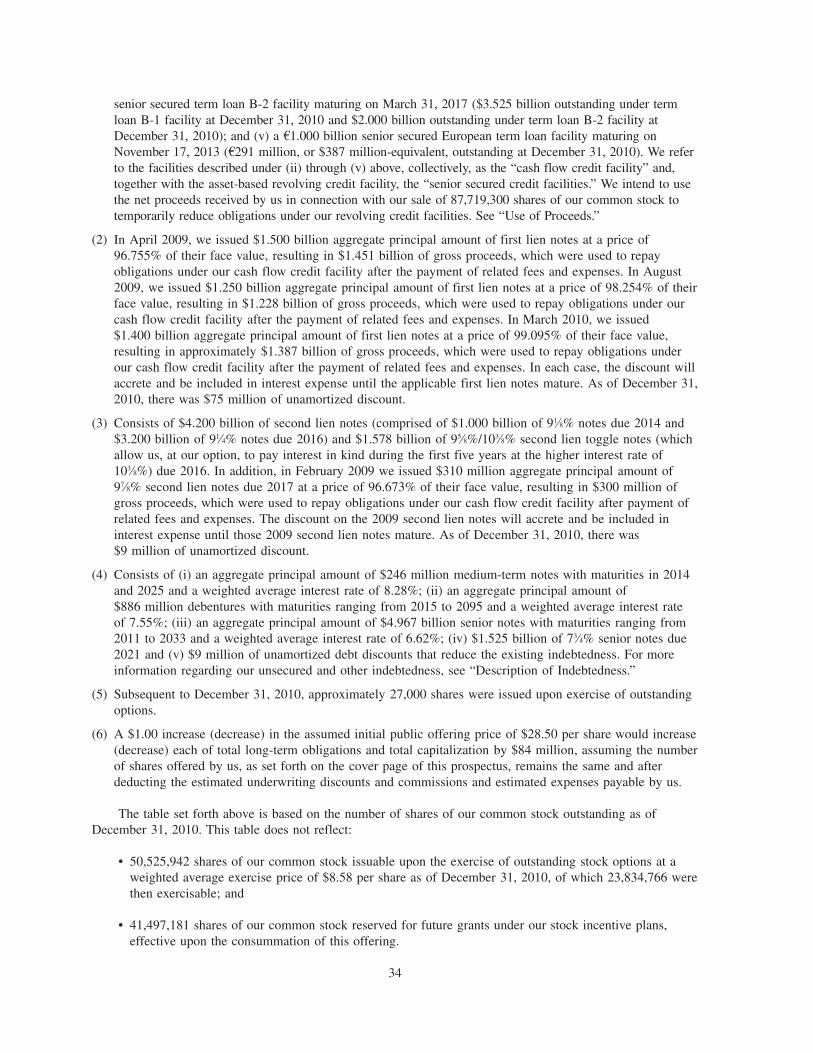
senior secured term loan B-2 facility maturing on March 31, 2017 ($3.525 billion outstanding under termloan B-1 facility at December 31, 2010 and $2.000 billion outstanding under term loan B-2 facility atDecember 31, 2010); and (v) a A1.000 billion senior secured European term loan facility maturing onNovember 17, 2013 (A291 million, or $387 million-equivalent, outstanding at December 31, 2010). We referto the facilities described under (ii) through (v) above, collectively, as the “cash flow credit facility” and,together with the asset-based revolving credit facility, the “senior secured credit facilities.” We intend to usethe net proceeds received by us in connection with our sale of 87,719,300 shares of our common stock totemporarily reduce obligations under our revolving credit facilities. See “Use of Proceeds.”
(2) In April 2009, we issued $1.500 billion aggregate principal amount of first lien notes at a price of96.755% of their face value, resulting in $1.451 billion of gross proceeds, which were used to repayobligations under our cash flow credit facility after the payment of related fees and expenses. In August2009, we issued $1.250 billion aggregate principal amount of first lien notes at a price of 98.254% of theirface value, resulting in $1.228 billion of gross proceeds, which were used to repay obligations under ourcash flow credit facility after the payment of related fees and expenses. In March 2010, we issued$1.400 billion aggregate principal amount of first lien notes at a price of 99.095% of their face value,resulting in approximately $1.387 billion of gross proceeds, which were used to repay obligations underour cash flow credit facility after the payment of related fees and expenses. In each case, the discount willaccrete and be included in interest expense until the applicable first lien notes mature. As of December 31,2010, there was $75 million of unamortized discount.
(3) Consists of $4.200 billion of second lien notes (comprised of $1.000 billion of 91⁄8% notes due 2014 and$3.200 billion of 91⁄4% notes due 2016) and $1.578 billion of 95⁄8%/103⁄8% second lien toggle notes (whichallow us, at our option, to pay interest in kind during the first five years at the higher interest rate of103⁄8%) due 2016. In addition, in February 2009 we issued $310 million aggregate principal amount of97⁄8% second lien notes due 2017 at a price of 96.673% of their face value, resulting in $300 million ofgross proceeds, which were used to repay obligations under our cash flow credit facility after payment ofrelated fees and expenses. The discount on the 2009 second lien notes will accrete and be included ininterest expense until those 2009 second lien notes mature. As of December 31, 2010, there was$9 million of unamortized discount.
(4) Consists of (i) an aggregate principal amount of $246 million medium-term notes with maturities in 2014and 2025 and a weighted average interest rate of 8.28%; (ii) an aggregate principal amount of$886 million debentures with maturities ranging from 2015 to 2095 and a weighted average interest rateof 7.55%; (iii) an aggregate principal amount of $4.967 billion senior notes with maturities ranging from2011 to 2033 and a weighted average interest rate of 6.62%; (iv) $1.525 billion of 73⁄4% senior notes due2021 and (v) $9 million of unamortized debt discounts that reduce the existing indebtedness. For moreinformation regarding our unsecured and other indebtedness, see “Description of Indebtedness.”
(5) Subsequent to December 31, 2010, approximately 27,000 shares were issued upon exercise of outstandingoptions.
(6) A $1.00 increase (decrease) in the assumed initial public offering price of $28.50 per share would increase(decrease) each of total long-term obligations and total capitalization by $84 million, assuming the numberof shares offered by us, as set forth on the cover page of this prospectus, remains the same and afterdeducting the estimated underwriting discounts and commissions and estimated expenses payable by us.
The table set forth above is based on the number of shares of our common stock outstanding as ofDecember 31, 2010. This table does not reflect:
• 50,525,942 shares of our common stock issuable upon the exercise of outstanding stock options at aweighted average exercise price of $8.58 per share as of December 31, 2010, of which 23,834,766 werethen exercisable; and
• 41,497,181 shares of our common stock reserved for future grants under our stock incentive plans,effective upon the consummation of this offering.
34
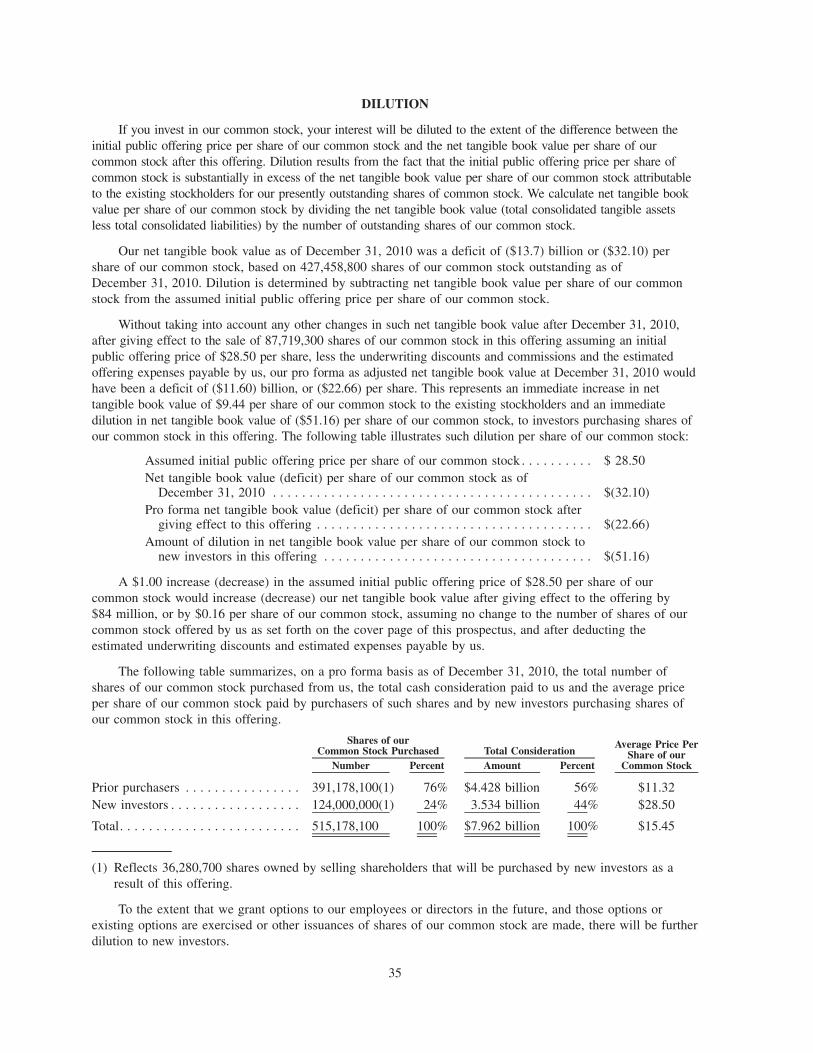
DILUTION
If you invest in our common stock, your interest will be diluted to the extent of the difference between theinitial public offering price per share of our common stock and the net tangible book value per share of ourcommon stock after this offering. Dilution results from the fact that the initial public offering price per share ofcommon stock is substantially in excess of the net tangible book value per share of our common stock attributableto the existing stockholders for our presently outstanding shares of common stock. We calculate net tangible bookvalue per share of our common stock by dividing the net tangible book value (total consolidated tangible assetsless total consolidated liabilities) by the number of outstanding shares of our common stock.
Our net tangible book value as of December 31, 2010 was a deficit of ($13.7) billion or ($32.10) pershare of our common stock, based on 427,458,800 shares of our common stock outstanding as ofDecember 31, 2010. Dilution is determined by subtracting net tangible book value per share of our commonstock from the assumed initial public offering price per share of our common stock.
Without taking into account any other changes in such net tangible book value after December 31, 2010,after giving effect to the sale of 87,719,300 shares of our common stock in this offering assuming an initialpublic offering price of $28.50 per share, less the underwriting discounts and commissions and the estimatedoffering expenses payable by us, our pro forma as adjusted net tangible book value at December 31, 2010 wouldhave been a deficit of ($11.60) billion, or ($22.66) per share. This represents an immediate increase in nettangible book value of $9.44 per share of our common stock to the existing stockholders and an immediatedilution in net tangible book value of ($51.16) per share of our common stock, to investors purchasing shares ofour common stock in this offering. The following table illustrates such dilution per share of our common stock:
Assumed initial public offering price per share of our common stock . . . . . . . . . . $ 28.50Net tangible book value (deficit) per share of our common stock as of
December 31, 2010 . . . . . . . . . . . . . . . . . . . . . . . . . . . . . . . . . . . . . . . . . . . . $(32.10)Pro forma net tangible book value (deficit) per share of our common stock after
giving effect to this offering . . . . . . . . . . . . . . . . . . . . . . . . . . . . . . . . . . . . . . $(22.66)Amount of dilution in net tangible book value per share of our common stock to
new investors in this offering . . . . . . . . . . . . . . . . . . . . . . . . . . . . . . . . . . . . . $(51.16)
A $1.00 increase (decrease) in the assumed initial public offering price of $28.50 per share of ourcommon stock would increase (decrease) our net tangible book value after giving effect to the offering by$84 million, or by $0.16 per share of our common stock, assuming no change to the number of shares of ourcommon stock offered by us as set forth on the cover page of this prospectus, and after deducting theestimated underwriting discounts and estimated expenses payable by us.
The following table summarizes, on a pro forma basis as of December 31, 2010, the total number ofshares of our common stock purchased from us, the total cash consideration paid to us and the average priceper share of our common stock paid by purchasers of such shares and by new investors purchasing shares ofour common stock in this offering.
Number Percent Amount Percent
Average Price PerShare of our
Common Stock
Shares of ourCommon Stock Purchased Total Consideration
Prior purchasers . . . . . . . . . . . . . . . . 391,178,100(1) 76% $4.428 billion 56% $11.32New investors . . . . . . . . . . . . . . . . . . 124,000,000(1) 24% 3.534 billion 44% $28.50
Total. . . . . . . . . . . . . . . . . . . . . . . . . 515,178,100 100% $7.962 billion 100% $15.45
(1) Reflects 36,280,700 shares owned by selling shareholders that will be purchased by new investors as aresult of this offering.
To the extent that we grant options to our employees or directors in the future, and those options orexisting options are exercised or other issuances of shares of our common stock are made, there will be furtherdilution to new investors.
35
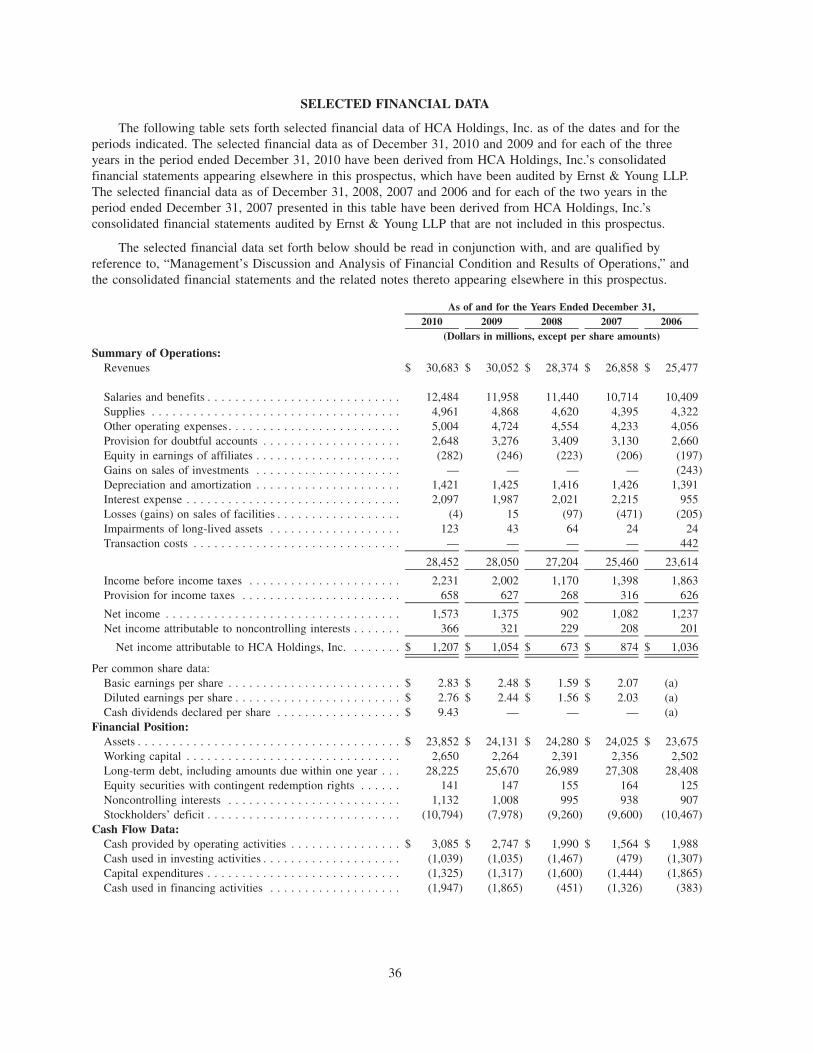
SELECTED FINANCIAL DATA
The following table sets forth selected financial data of HCA Holdings, Inc. as of the dates and for theperiods indicated. The selected financial data as of December 31, 2010 and 2009 and for each of the threeyears in the period ended December 31, 2010 have been derived from HCA Holdings, Inc.’s consolidatedfinancial statements appearing elsewhere in this prospectus, which have been audited by Ernst & Young LLP.The selected financial data as of December 31, 2008, 2007 and 2006 and for each of the two years in theperiod ended December 31, 2007 presented in this table have been derived from HCA Holdings, Inc.’sconsolidated financial statements audited by Ernst & Young LLP that are not included in this prospectus.
The selected financial data set forth below should be read in conjunction with, and are qualified byreference to, “Management’s Discussion and Analysis of Financial Condition and Results of Operations,” andthe consolidated financial statements and the related notes thereto appearing elsewhere in this prospectus.
2010 2009 2008 2007 2006As of and for the Years Ended December 31,
(Dollars in millions, except per share amounts)
Summary of Operations:Revenues $ 30,683 $ 30,052 $ 28,374 $ 26,858 $ 25,477
Salaries and benefits . . . . . . . . . . . . . . . . . . . . . . . . . . . . 12,484 11,958 11,440 10,714 10,409Supplies . . . . . . . . . . . . . . . . . . . . . . . . . . . . . . . . . . . . 4,961 4,868 4,620 4,395 4,322Other operating expenses. . . . . . . . . . . . . . . . . . . . . . . . . 5,004 4,724 4,554 4,233 4,056Provision for doubtful accounts . . . . . . . . . . . . . . . . . . . . 2,648 3,276 3,409 3,130 2,660Equity in earnings of affiliates . . . . . . . . . . . . . . . . . . . . . (282) (246) (223) (206) (197)Gains on sales of investments . . . . . . . . . . . . . . . . . . . . . — — — — (243)Depreciation and amortization . . . . . . . . . . . . . . . . . . . . . 1,421 1,425 1,416 1,426 1,391Interest expense . . . . . . . . . . . . . . . . . . . . . . . . . . . . . . . 2,097 1,987 2,021 2,215 955Losses (gains) on sales of facilities . . . . . . . . . . . . . . . . . . (4) 15 (97) (471) (205)Impairments of long-lived assets . . . . . . . . . . . . . . . . . . . 123 43 64 24 24Transaction costs . . . . . . . . . . . . . . . . . . . . . . . . . . . . . . — — — — 442
28,452 28,050 27,204 25,460 23,614
Income before income taxes . . . . . . . . . . . . . . . . . . . . . . 2,231 2,002 1,170 1,398 1,863Provision for income taxes . . . . . . . . . . . . . . . . . . . . . . . 658 627 268 316 626
Net income . . . . . . . . . . . . . . . . . . . . . . . . . . . . . . . . . . 1,573 1,375 902 1,082 1,237Net income attributable to noncontrolling interests . . . . . . . 366 321 229 208 201
Net income attributable to HCA Holdings, Inc. . . . . . . . $ 1,207 $ 1,054 $ 673 $ 874 $ 1,036
Per common share data:Basic earnings per share . . . . . . . . . . . . . . . . . . . . . . . . . $ 2.83 $ 2.48 $ 1.59 $ 2.07 (a)Diluted earnings per share . . . . . . . . . . . . . . . . . . . . . . . . $ 2.76 $ 2.44 $ 1.56 $ 2.03 (a)Cash dividends declared per share . . . . . . . . . . . . . . . . . . $ 9.43 — — — (a)
Financial Position:Assets . . . . . . . . . . . . . . . . . . . . . . . . . . . . . . . . . . . . . . $ 23,852 $ 24,131 $ 24,280 $ 24,025 $ 23,675Working capital . . . . . . . . . . . . . . . . . . . . . . . . . . . . . . . 2,650 2,264 2,391 2,356 2,502Long-term debt, including amounts due within one year . . . 28,225 25,670 26,989 27,308 28,408Equity securities with contingent redemption rights . . . . . . 141 147 155 164 125Noncontrolling interests . . . . . . . . . . . . . . . . . . . . . . . . . 1,132 1,008 995 938 907Stockholders’ deficit . . . . . . . . . . . . . . . . . . . . . . . . . . . . (10,794) (7,978) (9,260) (9,600) (10,467)
Cash Flow Data:Cash provided by operating activities . . . . . . . . . . . . . . . . $ 3,085 $ 2,747 $ 1,990 $ 1,564 $ 1,988Cash used in investing activities . . . . . . . . . . . . . . . . . . . . (1,039) (1,035) (1,467) (479) (1,307)Capital expenditures . . . . . . . . . . . . . . . . . . . . . . . . . . . . (1,325) (1,317) (1,600) (1,444) (1,865)Cash used in financing activities . . . . . . . . . . . . . . . . . . . (1,947) (1,865) (451) (1,326) (383)
36
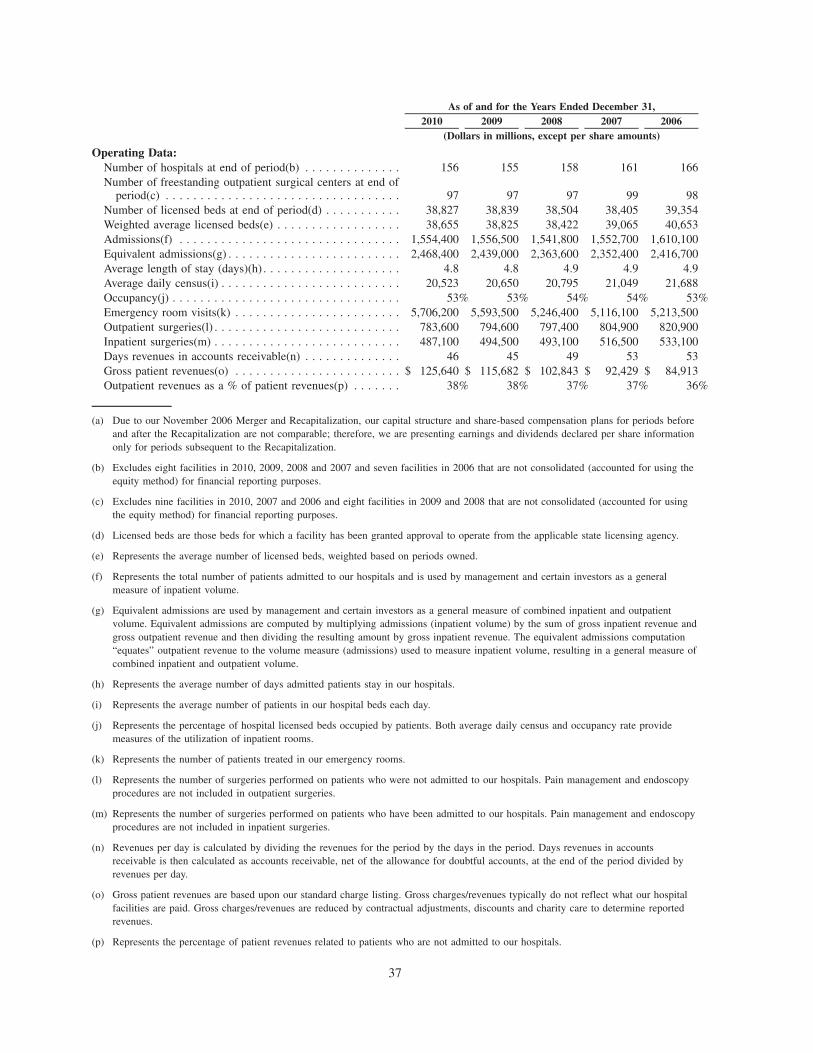
2010 2009 2008 2007 2006As of and for the Years Ended December 31,
(Dollars in millions, except per share amounts)
Operating Data:Number of hospitals at end of period(b) . . . . . . . . . . . . . . 156 155 158 161 166Number of freestanding outpatient surgical centers at end of
period(c) . . . . . . . . . . . . . . . . . . . . . . . . . . . . . . . . . . 97 97 97 99 98Number of licensed beds at end of period(d) . . . . . . . . . . . 38,827 38,839 38,504 38,405 39,354Weighted average licensed beds(e) . . . . . . . . . . . . . . . . . . 38,655 38,825 38,422 39,065 40,653Admissions(f) . . . . . . . . . . . . . . . . . . . . . . . . . . . . . . . . 1,554,400 1,556,500 1,541,800 1,552,700 1,610,100Equivalent admissions(g) . . . . . . . . . . . . . . . . . . . . . . . . . 2,468,400 2,439,000 2,363,600 2,352,400 2,416,700Average length of stay (days)(h) . . . . . . . . . . . . . . . . . . . . 4.8 4.8 4.9 4.9 4.9Average daily census(i) . . . . . . . . . . . . . . . . . . . . . . . . . . 20,523 20,650 20,795 21,049 21,688Occupancy(j) . . . . . . . . . . . . . . . . . . . . . . . . . . . . . . . . . 53% 53% 54% 54% 53%Emergency room visits(k) . . . . . . . . . . . . . . . . . . . . . . . . 5,706,200 5,593,500 5,246,400 5,116,100 5,213,500Outpatient surgeries(l) . . . . . . . . . . . . . . . . . . . . . . . . . . . 783,600 794,600 797,400 804,900 820,900Inpatient surgeries(m) . . . . . . . . . . . . . . . . . . . . . . . . . . . 487,100 494,500 493,100 516,500 533,100Days revenues in accounts receivable(n) . . . . . . . . . . . . . . 46 45 49 53 53Gross patient revenues(o) . . . . . . . . . . . . . . . . . . . . . . . . $ 125,640 $ 115,682 $ 102,843 $ 92,429 $ 84,913Outpatient revenues as a % of patient revenues(p) . . . . . . . 38% 38% 37% 37% 36%
(a) Due to our November 2006 Merger and Recapitalization, our capital structure and share-based compensation plans for periods beforeand after the Recapitalization are not comparable; therefore, we are presenting earnings and dividends declared per share informationonly for periods subsequent to the Recapitalization.
(b) Excludes eight facilities in 2010, 2009, 2008 and 2007 and seven facilities in 2006 that are not consolidated (accounted for using theequity method) for financial reporting purposes.
(c) Excludes nine facilities in 2010, 2007 and 2006 and eight facilities in 2009 and 2008 that are not consolidated (accounted for usingthe equity method) for financial reporting purposes.
(d) Licensed beds are those beds for which a facility has been granted approval to operate from the applicable state licensing agency.
(e) Represents the average number of licensed beds, weighted based on periods owned.
(f) Represents the total number of patients admitted to our hospitals and is used by management and certain investors as a generalmeasure of inpatient volume.
(g) Equivalent admissions are used by management and certain investors as a general measure of combined inpatient and outpatientvolume. Equivalent admissions are computed by multiplying admissions (inpatient volume) by the sum of gross inpatient revenue andgross outpatient revenue and then dividing the resulting amount by gross inpatient revenue. The equivalent admissions computation“equates” outpatient revenue to the volume measure (admissions) used to measure inpatient volume, resulting in a general measure ofcombined inpatient and outpatient volume.
(h) Represents the average number of days admitted patients stay in our hospitals.
(i) Represents the average number of patients in our hospital beds each day.
(j) Represents the percentage of hospital licensed beds occupied by patients. Both average daily census and occupancy rate providemeasures of the utilization of inpatient rooms.
(k) Represents the number of patients treated in our emergency rooms.
(l) Represents the number of surgeries performed on patients who were not admitted to our hospitals. Pain management and endoscopyprocedures are not included in outpatient surgeries.
(m) Represents the number of surgeries performed on patients who have been admitted to our hospitals. Pain management and endoscopyprocedures are not included in inpatient surgeries.
(n) Revenues per day is calculated by dividing the revenues for the period by the days in the period. Days revenues in accountsreceivable is then calculated as accounts receivable, net of the allowance for doubtful accounts, at the end of the period divided byrevenues per day.
(o) Gross patient revenues are based upon our standard charge listing. Gross charges/revenues typically do not reflect what our hospitalfacilities are paid. Gross charges/revenues are reduced by contractual adjustments, discounts and charity care to determine reportedrevenues.
(p) Represents the percentage of patient revenues related to patients who are not admitted to our hospitals.
37
MANAGEMENT’S DISCUSSION AND ANALYSIS OFFINANCIAL CONDITION AND RESULTS OF OPERATIONS
You should read the following discussion of our results of operations and financial condition with“Selected Financial Data” and the consolidated financial statements and related notes included elsewhere inthis prospectus. This discussion contains forward-looking statements and involves numerous risks anduncertainties, including, but not limited to, those described in the “Risk Factors” section of this prospectus.Actual results may differ materially from those contained in any forward-looking statements.
You also should read the following discussion of our results of operations and financial condition with“Business — Business Drivers and Measures” for a discussion of certain of our important financial policiesand objectives; performance measures and operational factors we use to evaluate our financial condition andoperating performance; and our business segments.
Overview
We are the largest non-governmental hospital operator in the U.S. and a leading comprehensive,integrated provider of health care and related services. At December 31, 2010, we operated 164 hospitals,comprised of 158 general, acute care hospitals; five psychiatric hospitals; and one rehabilitation hospital. The164 hospital total includes eight hospitals (seven general, acute care hospitals and one rehabilitation hospital)owned by joint ventures in which an affiliate of HCA is a partner, and these joint ventures are accounted forusing the equity method. In addition, we operated 106 freestanding surgery centers, nine of which are ownedby joint ventures in which an affiliate of HCA is a partner, and these joint ventures are accounted for usingthe equity method. Our facilities are located in 20 states and England. For the year ended December 31, 2010,we generated revenues of $30.683 billion and net income attributable to HCA Holdings, Inc. of $1.207 billion.
On November 17, 2006, HCA Inc. was acquired by a private investor group comprised of affiliates of orfunds sponsored by Bain Capital, KKR, MLGPE (now BAML Capital Partners), Citigroup Inc., Bank ofAmerica Corporation and HCA founder Dr. Thomas F. Frist, Jr., and by members of management and certainother investors. We refer to the merger, the financing transactions related to the merger and other relatedtransactions collectively as the “Recapitalization.”
2010 Operations Summary
Net income attributable to HCA Holdings, Inc. totaled $1.207 billion for 2010, compared to$1.054 billion for 2009. The 2010 results include net gains on sales of facilities of $4 million and impairmentsof long-lived assets of $123 million. The 2009 results include net losses on sales of facilities of $15 millionand impairments of long-lived assets of $43 million.
Revenues increased to $30.683 billion for 2010 from $30.052 billion for 2009. Revenues increased 2.1%on both a consolidated basis and on a same facility basis for 2010, compared to 2009. The consolidatedrevenues increase can be attributed to the combined impact of a 0.9% increase in revenue per equivalentadmission and a 1.2% increase in equivalent admissions. The same facility revenues increase resulted from a0.6% increase in same facility revenue per equivalent admission and a 1.4% increase in same facilityequivalent admissions.
During 2010, consolidated admissions declined 0.1% and same facility admissions increased 0.1%,compared to 2009. Inpatient surgical volumes declined 1.5% on a consolidated basis and declined 1.4% on asame facility basis during 2010, compared to 2009. Outpatient surgical volumes declined 1.4% on aconsolidated basis and declined 1.2% on a same facility basis during 2010, compared to 2009. Emergencyroom visits increased 2.0% on a consolidated basis and increased 2.1% on a same facility basis during 2010,compared to 2009.
For 2010, the provision for doubtful accounts declined $628 million, to 8.6% of revenues from 10.9% ofrevenues for 2009. The combined self-pay revenue deductions for charity care and uninsured discountsincreased $1.892 billion for 2010, compared to 2009. The sum of the provision for doubtful accounts,uninsured discounts and charity care, as a percentage of the sum of net revenues, uninsured discounts and
38
charity care, was 25.6% for 2010, compared to 23.8% for 2009. Same facility uninsured admissions increased5.4% and same facility uninsured emergency room visits increased 1.2% for 2010, compared to 2009.
Interest expense totaled $2.097 billion for 2010, compared to $1.987 billion for 2009. The $110 millionincrease in interest expense for 2010 was due primarily to an increase in the average effective interest rate.
Cash flows from operating activities increased $338 million, from $2.747 billion for 2009 to$3.085 billion for 2010. The increase related primarily to the net impact of improvements from a $198 millionincrease in net income and a $547 million reduction in income tax payments, offsetting a $384 million netdecline from changes in working capital items and the provision for doubtful accounts.
Critical Accounting Policies and Estimates
The preparation of our consolidated financial statements requires management to make estimates andassumptions that affect the reported amounts of assets and liabilities, the disclosure of contingent liabilitiesand the reported amounts of revenues and expenses. Our estimates are based on historical experience andvarious other assumptions we believe are reasonable under the circumstances. We evaluate our estimates on anongoing basis and make changes to the estimates and related disclosures as experience develops or newinformation becomes known. Actual results may differ from these estimates.
We believe the following critical accounting policies affect our more significant judgments and estimatesused in the preparation of our consolidated financial statements.
Revenues
Revenues are recorded during the period the health care services are provided, based upon the estimatedamounts due from payers. Estimates of contractual allowances under managed care health plans are basedupon the payment terms specified in the related contractual agreements. Laws and regulations governing theMedicare and Medicaid programs are complex and subject to interpretation. The estimated reimbursementamounts are made on a payer-specific basis and are recorded based on the best information available regardingmanagement’s interpretation of the applicable laws, regulations and contract terms. Management continuallyreviews the contractual estimation process to consider and incorporate updates to laws and regulations and thefrequent changes in managed care contractual terms resulting from contract renegotiations and renewals. Wehave invested significant resources to refine and improve our computerized billing systems and the informationsystem data used to make contractual allowance estimates. We have developed standardized calculationprocesses and related training programs to improve the utility of our patient accounting systems.
The Emergency Medical Treatment and Active Labor Act (“EMTALA”) requires any hospitalparticipating in the Medicare program to conduct an appropriate medical screening examination of everyperson who presents to the hospital’s emergency room for treatment and, if the individual is suffering from anemergency medical condition, to either stabilize the condition or make an appropriate transfer of the individualto a facility able to handle the condition. The obligation to screen and stabilize emergency medical conditionsexists regardless of an individual’s ability to pay for treatment. Federal and state laws and regulations,including but not limited to EMTALA, require, and our commitment to providing quality patient careencourages, the provision of services to patients who are financially unable to pay for the health care servicesthey receive. The Health Reform Law requires health plans to reimburse hospitals for emergency servicesprovided to enrollees without prior authorization and without regard to whether a participating providercontract is in place. Further, as enacted, the Health Reform Law contains provisions that seek to decrease thenumber of uninsured individuals, including requirements or incentives, which do not become effective until2014, for individuals to obtain, and large employers to provide, insurance coverage. These mandates mayreduce the financial impact of screening for and stabilizing emergency medical conditions. However, manyfactors are unknown regarding the impact of the Health Reform Law, including the outcome of courtchallenges to the constitutionality of the law and Congressional efforts to amend or repeal the law, how manypreviously uninsured individuals will obtain coverage as a result of the law or the change, if any, in thevolume of inpatient and outpatient hospital services that are sought by and provided to previously uninsuredindividuals and the payer mix.
39
We do not pursue collection of amounts related to patients who meet our guidelines to qualify as charitycare; therefore, they are not reported in revenues. Patients treated at our hospitals for nonelective care, whohave income at or below 200% of the federal poverty level, are eligible for charity care. The federal povertylevel is established by the federal government and is based on income and family size. We provide discountsfrom our gross charges to uninsured patients who do not qualify for Medicaid or charity care. These discountsare similar to those provided to many local managed care plans. After the discounts are applied, we are stillunable to collect a significant portion of uninsured patients’ accounts, and we record significant provisions fordoubtful accounts (based upon our historical collection experience) related to uninsured patients in the periodthe services are provided.
Due to the complexities involved in the classification and documentation of health care services authorizedand provided, the estimation of revenues earned and the related reimbursement are often subject tointerpretations that could result in payments that are different from our estimates. Adjustments to estimatedMedicare and Medicaid reimbursement amounts and disproportionate-share funds, which resulted in net increasesto revenues, related primarily to cost reports filed during the respective year were $52 million, $40 million and$32 million in 2010, 2009 and 2008, respectively. The adjustments to estimated reimbursement amounts, whichresulted in net increases to revenues, related primarily to cost reports filed during previous years were$50 million, $60 million and $35 million in 2010, 2009 and 2008, respectively. We expect adjustments duringthe next 12 months related to Medicare and Medicaid cost report filings and settlements and disproportionate-share funds will result in increases to revenues within generally similar ranges.
Provision for Doubtful Accounts and the Allowance for Doubtful Accounts
The collection of outstanding receivables from Medicare, managed care payers, other third-party payersand patients is our primary source of cash and is critical to our operating performance. The primary collectionrisks relate to uninsured patient accounts, including patient accounts for which the primary insurance carrierhas paid the amounts covered by the applicable agreement, but patient responsibility amounts (deductibles andcopayments) remain outstanding. The provision for doubtful accounts and the allowance for doubtful accountsrelate primarily to amounts due directly from patients. An estimated allowance for doubtful accounts isrecorded for all uninsured accounts, regardless of the aging of those accounts. Accounts are written off whenall reasonable internal and external collection efforts have been performed. Our collection policies include areview of all accounts against certain standard collection criteria, upon completion of our internal collectionefforts. Accounts determined to possess positive collectibility attributes are forwarded to a secondary externalcollection agency and the other accounts are written off. The accounts that are not collected by the secondaryexternal collection agency are written off when they are returned to us by the collection agency (usuallywithin 12 months). Writeoffs are based upon specific identification and the writeoff process requires a writeoffadjustment entry to the patient accounting system. We do not pursue collection of amounts related to patientsthat meet our guidelines to qualify as charity care.
The amount of the provision for doubtful accounts is based upon management’s assessment of historicalwriteoffs and expected net collections, business and economic conditions, trends in federal, state, and privateemployer health care coverage and other collection indicators. Management relies on the results of detailedreviews of historical writeoffs and recoveries at facilities that represent a majority of our revenues andaccounts receivable (the “hindsight analysis”) as a primary source of information in estimating thecollectibility of our accounts receivable. We perform the hindsight analysis quarterly, utilizing rolling twelve-months accounts receivable collection and writeoff data. We believe our quarterly updates to the estimatedallowance for doubtful accounts at each of our hospital facilities provide reasonable valuations of our accountsreceivable. These routine, quarterly changes in estimates have not resulted in material adjustments to ourallowance for doubtful accounts, provision for doubtful accounts or period-to-period comparisons of ourresults of operations. At December 31, 2010 and 2009, the allowance for doubtful accounts representedapproximately 93% and 94%, respectively, of the $4.249 billion and $5.176 billion, respectively, patient dueaccounts receivable balance. The patient due accounts receivable balance represents the estimated uninsuredportion of our accounts receivable. The estimated uninsured portion of Medicaid pending and uninsureddiscount pending accounts is included in our patient due accounts receivable balance.
40
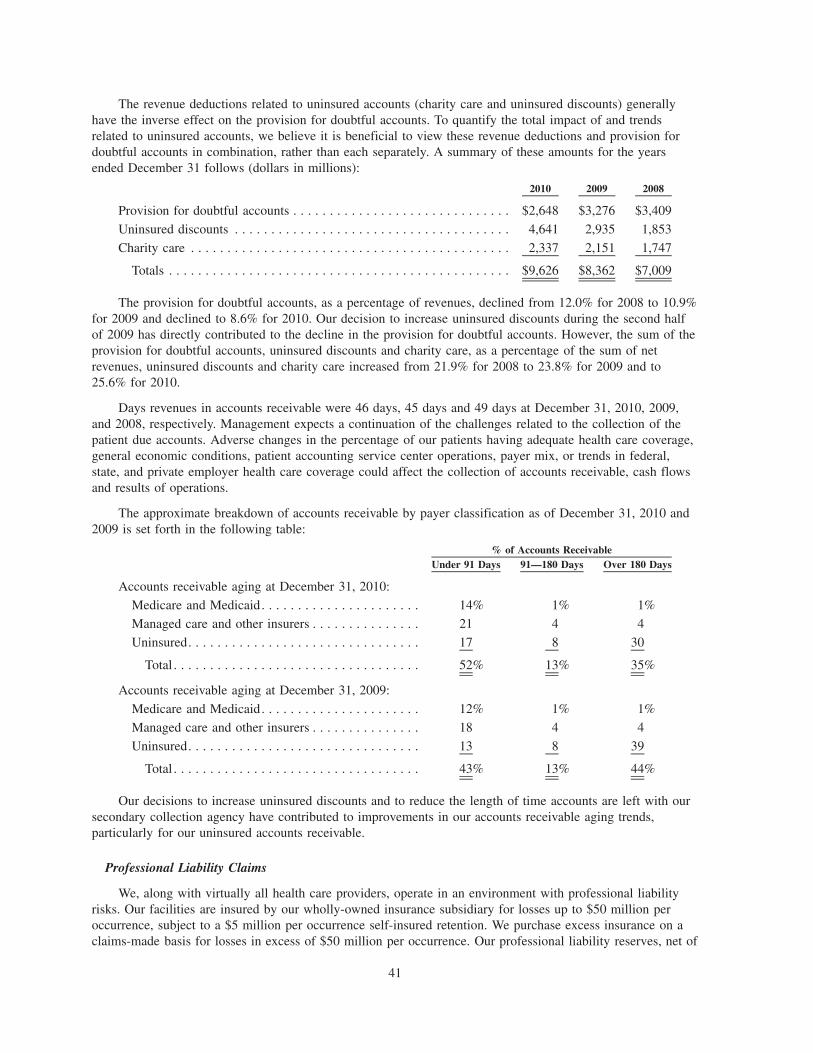
The revenue deductions related to uninsured accounts (charity care and uninsured discounts) generallyhave the inverse effect on the provision for doubtful accounts. To quantify the total impact of and trendsrelated to uninsured accounts, we believe it is beneficial to view these revenue deductions and provision fordoubtful accounts in combination, rather than each separately. A summary of these amounts for the yearsended December 31 follows (dollars in millions):
2010 2009 2008
Provision for doubtful accounts . . . . . . . . . . . . . . . . . . . . . . . . . . . . . . $2,648 $3,276 $3,409
Uninsured discounts . . . . . . . . . . . . . . . . . . . . . . . . . . . . . . . . . . . . . . 4,641 2,935 1,853
Charity care . . . . . . . . . . . . . . . . . . . . . . . . . . . . . . . . . . . . . . . . . . . . 2,337 2,151 1,747
Totals . . . . . . . . . . . . . . . . . . . . . . . . . . . . . . . . . . . . . . . . . . . . . . . $9,626 $8,362 $7,009
The provision for doubtful accounts, as a percentage of revenues, declined from 12.0% for 2008 to 10.9%for 2009 and declined to 8.6% for 2010. Our decision to increase uninsured discounts during the second halfof 2009 has directly contributed to the decline in the provision for doubtful accounts. However, the sum of theprovision for doubtful accounts, uninsured discounts and charity care, as a percentage of the sum of netrevenues, uninsured discounts and charity care increased from 21.9% for 2008 to 23.8% for 2009 and to25.6% for 2010.
Days revenues in accounts receivable were 46 days, 45 days and 49 days at December 31, 2010, 2009,and 2008, respectively. Management expects a continuation of the challenges related to the collection of thepatient due accounts. Adverse changes in the percentage of our patients having adequate health care coverage,general economic conditions, patient accounting service center operations, payer mix, or trends in federal,state, and private employer health care coverage could affect the collection of accounts receivable, cash flowsand results of operations.
The approximate breakdown of accounts receivable by payer classification as of December 31, 2010 and2009 is set forth in the following table:
Under 91 Days 91—180 Days Over 180 Days% of Accounts Receivable
Accounts receivable aging at December 31, 2010:
Medicare and Medicaid. . . . . . . . . . . . . . . . . . . . . . 14% 1% 1%
Managed care and other insurers . . . . . . . . . . . . . . . 21 4 4
Uninsured. . . . . . . . . . . . . . . . . . . . . . . . . . . . . . . . 17 8 30
Total . . . . . . . . . . . . . . . . . . . . . . . . . . . . . . . . . . 52% 13% 35%
Accounts receivable aging at December 31, 2009:
Medicare and Medicaid. . . . . . . . . . . . . . . . . . . . . . 12% 1% 1%
Managed care and other insurers . . . . . . . . . . . . . . . 18 4 4
Uninsured. . . . . . . . . . . . . . . . . . . . . . . . . . . . . . . . 13 8 39
Total . . . . . . . . . . . . . . . . . . . . . . . . . . . . . . . . . . 43% 13% 44%
Our decisions to increase uninsured discounts and to reduce the length of time accounts are left with oursecondary collection agency have contributed to improvements in our accounts receivable aging trends,particularly for our uninsured accounts receivable.
Professional Liability Claims
We, along with virtually all health care providers, operate in an environment with professional liabilityrisks. Our facilities are insured by our wholly-owned insurance subsidiary for losses up to $50 million peroccurrence, subject to a $5 million per occurrence self-insured retention. We purchase excess insurance on aclaims-made basis for losses in excess of $50 million per occurrence. Our professional liability reserves, net of
41
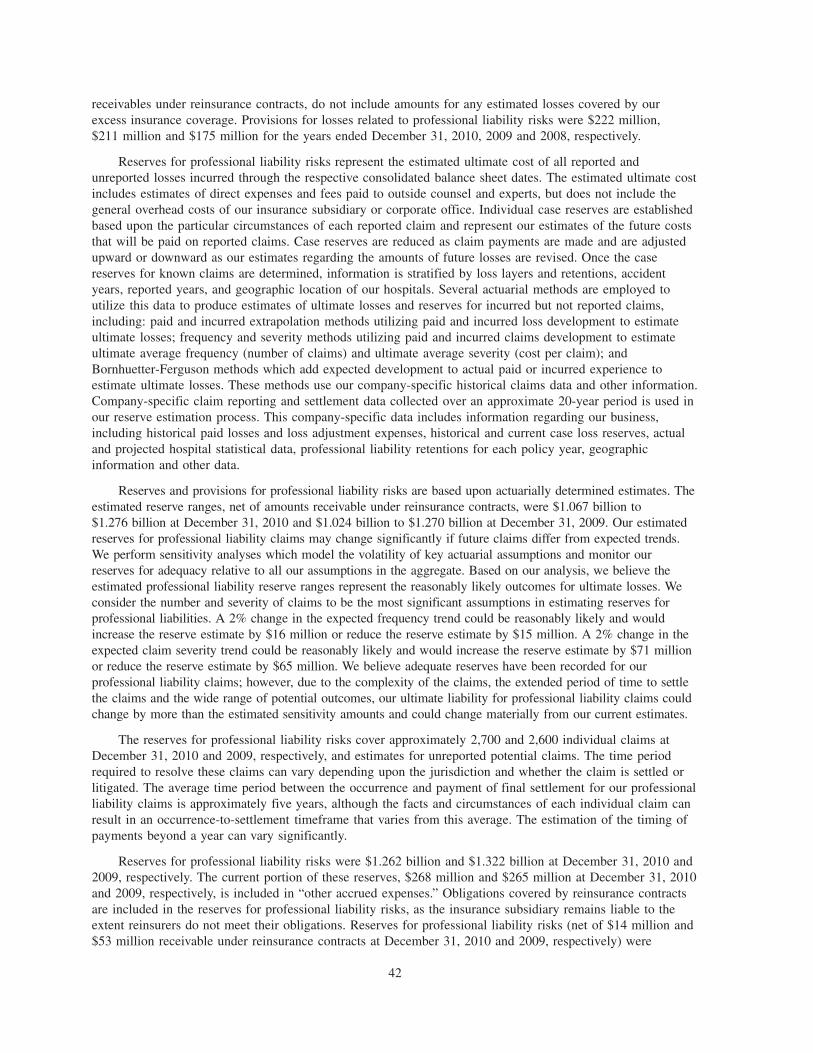
receivables under reinsurance contracts, do not include amounts for any estimated losses covered by ourexcess insurance coverage. Provisions for losses related to professional liability risks were $222 million,$211 million and $175 million for the years ended December 31, 2010, 2009 and 2008, respectively.
Reserves for professional liability risks represent the estimated ultimate cost of all reported andunreported losses incurred through the respective consolidated balance sheet dates. The estimated ultimate costincludes estimates of direct expenses and fees paid to outside counsel and experts, but does not include thegeneral overhead costs of our insurance subsidiary or corporate office. Individual case reserves are establishedbased upon the particular circumstances of each reported claim and represent our estimates of the future coststhat will be paid on reported claims. Case reserves are reduced as claim payments are made and are adjustedupward or downward as our estimates regarding the amounts of future losses are revised. Once the casereserves for known claims are determined, information is stratified by loss layers and retentions, accidentyears, reported years, and geographic location of our hospitals. Several actuarial methods are employed toutilize this data to produce estimates of ultimate losses and reserves for incurred but not reported claims,including: paid and incurred extrapolation methods utilizing paid and incurred loss development to estimateultimate losses; frequency and severity methods utilizing paid and incurred claims development to estimateultimate average frequency (number of claims) and ultimate average severity (cost per claim); andBornhuetter-Ferguson methods which add expected development to actual paid or incurred experience toestimate ultimate losses. These methods use our company-specific historical claims data and other information.Company-specific claim reporting and settlement data collected over an approximate 20-year period is used inour reserve estimation process. This company-specific data includes information regarding our business,including historical paid losses and loss adjustment expenses, historical and current case loss reserves, actualand projected hospital statistical data, professional liability retentions for each policy year, geographicinformation and other data.
Reserves and provisions for professional liability risks are based upon actuarially determined estimates. Theestimated reserve ranges, net of amounts receivable under reinsurance contracts, were $1.067 billion to$1.276 billion at December 31, 2010 and $1.024 billion to $1.270 billion at December 31, 2009. Our estimatedreserves for professional liability claims may change significantly if future claims differ from expected trends.We perform sensitivity analyses which model the volatility of key actuarial assumptions and monitor ourreserves for adequacy relative to all our assumptions in the aggregate. Based on our analysis, we believe theestimated professional liability reserve ranges represent the reasonably likely outcomes for ultimate losses. Weconsider the number and severity of claims to be the most significant assumptions in estimating reserves forprofessional liabilities. A 2% change in the expected frequency trend could be reasonably likely and wouldincrease the reserve estimate by $16 million or reduce the reserve estimate by $15 million. A 2% change in theexpected claim severity trend could be reasonably likely and would increase the reserve estimate by $71 millionor reduce the reserve estimate by $65 million. We believe adequate reserves have been recorded for ourprofessional liability claims; however, due to the complexity of the claims, the extended period of time to settlethe claims and the wide range of potential outcomes, our ultimate liability for professional liability claims couldchange by more than the estimated sensitivity amounts and could change materially from our current estimates.
The reserves for professional liability risks cover approximately 2,700 and 2,600 individual claims atDecember 31, 2010 and 2009, respectively, and estimates for unreported potential claims. The time periodrequired to resolve these claims can vary depending upon the jurisdiction and whether the claim is settled orlitigated. The average time period between the occurrence and payment of final settlement for our professionalliability claims is approximately five years, although the facts and circumstances of each individual claim canresult in an occurrence-to-settlement timeframe that varies from this average. The estimation of the timing ofpayments beyond a year can vary significantly.
Reserves for professional liability risks were $1.262 billion and $1.322 billion at December 31, 2010 and2009, respectively. The current portion of these reserves, $268 million and $265 million at December 31, 2010and 2009, respectively, is included in “other accrued expenses.” Obligations covered by reinsurance contractsare included in the reserves for professional liability risks, as the insurance subsidiary remains liable to theextent reinsurers do not meet their obligations. Reserves for professional liability risks (net of $14 million and$53 million receivable under reinsurance contracts at December 31, 2010 and 2009, respectively) were
42
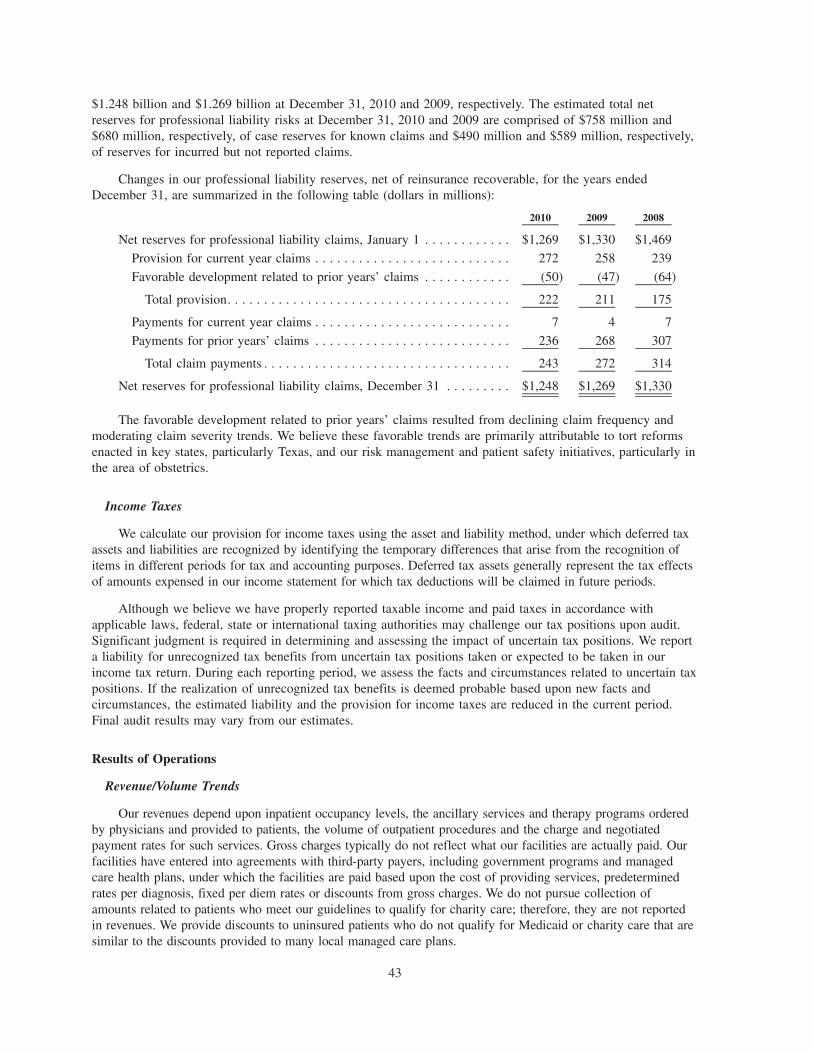
$1.248 billion and $1.269 billion at December 31, 2010 and 2009, respectively. The estimated total netreserves for professional liability risks at December 31, 2010 and 2009 are comprised of $758 million and$680 million, respectively, of case reserves for known claims and $490 million and $589 million, respectively,of reserves for incurred but not reported claims.
Changes in our professional liability reserves, net of reinsurance recoverable, for the years endedDecember 31, are summarized in the following table (dollars in millions):
2010 2009 2008
Net reserves for professional liability claims, January 1 . . . . . . . . . . . . $1,269 $1,330 $1,469
Provision for current year claims . . . . . . . . . . . . . . . . . . . . . . . . . . . 272 258 239
Favorable development related to prior years’ claims . . . . . . . . . . . . (50) (47) (64)
Total provision. . . . . . . . . . . . . . . . . . . . . . . . . . . . . . . . . . . . . . . 222 211 175
Payments for current year claims . . . . . . . . . . . . . . . . . . . . . . . . . . . 7 4 7
Payments for prior years’ claims . . . . . . . . . . . . . . . . . . . . . . . . . . . 236 268 307
Total claim payments . . . . . . . . . . . . . . . . . . . . . . . . . . . . . . . . . . 243 272 314
Net reserves for professional liability claims, December 31 . . . . . . . . . $1,248 $1,269 $1,330
The favorable development related to prior years’ claims resulted from declining claim frequency andmoderating claim severity trends. We believe these favorable trends are primarily attributable to tort reformsenacted in key states, particularly Texas, and our risk management and patient safety initiatives, particularly inthe area of obstetrics.
Income Taxes
We calculate our provision for income taxes using the asset and liability method, under which deferred taxassets and liabilities are recognized by identifying the temporary differences that arise from the recognition ofitems in different periods for tax and accounting purposes. Deferred tax assets generally represent the tax effectsof amounts expensed in our income statement for which tax deductions will be claimed in future periods.
Although we believe we have properly reported taxable income and paid taxes in accordance withapplicable laws, federal, state or international taxing authorities may challenge our tax positions upon audit.Significant judgment is required in determining and assessing the impact of uncertain tax positions. We reporta liability for unrecognized tax benefits from uncertain tax positions taken or expected to be taken in ourincome tax return. During each reporting period, we assess the facts and circumstances related to uncertain taxpositions. If the realization of unrecognized tax benefits is deemed probable based upon new facts andcircumstances, the estimated liability and the provision for income taxes are reduced in the current period.Final audit results may vary from our estimates.
Results of Operations
Revenue/Volume Trends
Our revenues depend upon inpatient occupancy levels, the ancillary services and therapy programs orderedby physicians and provided to patients, the volume of outpatient procedures and the charge and negotiatedpayment rates for such services. Gross charges typically do not reflect what our facilities are actually paid. Ourfacilities have entered into agreements with third-party payers, including government programs and managedcare health plans, under which the facilities are paid based upon the cost of providing services, predeterminedrates per diagnosis, fixed per diem rates or discounts from gross charges. We do not pursue collection ofamounts related to patients who meet our guidelines to qualify for charity care; therefore, they are not reportedin revenues. We provide discounts to uninsured patients who do not qualify for Medicaid or charity care that aresimilar to the discounts provided to many local managed care plans.
43
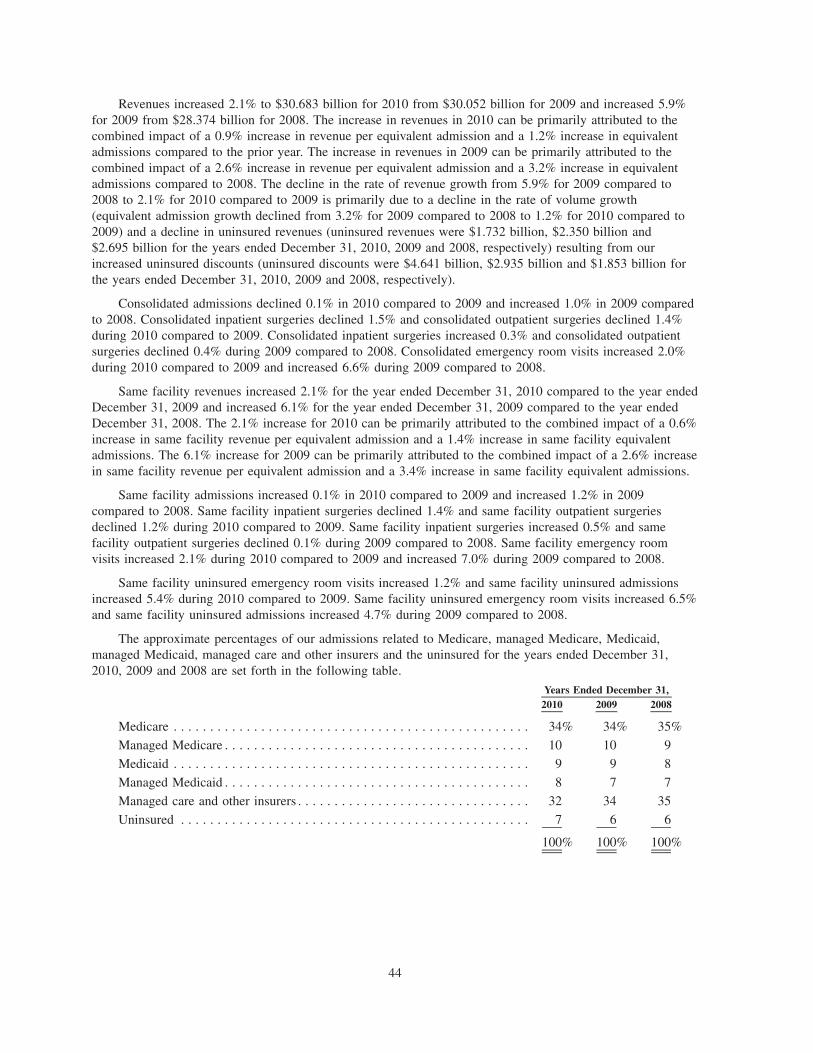
Revenues increased 2.1% to $30.683 billion for 2010 from $30.052 billion for 2009 and increased 5.9%for 2009 from $28.374 billion for 2008. The increase in revenues in 2010 can be primarily attributed to thecombined impact of a 0.9% increase in revenue per equivalent admission and a 1.2% increase in equivalentadmissions compared to the prior year. The increase in revenues in 2009 can be primarily attributed to thecombined impact of a 2.6% increase in revenue per equivalent admission and a 3.2% increase in equivalentadmissions compared to 2008. The decline in the rate of revenue growth from 5.9% for 2009 compared to2008 to 2.1% for 2010 compared to 2009 is primarily due to a decline in the rate of volume growth(equivalent admission growth declined from 3.2% for 2009 compared to 2008 to 1.2% for 2010 compared to2009) and a decline in uninsured revenues (uninsured revenues were $1.732 billion, $2.350 billion and$2.695 billion for the years ended December 31, 2010, 2009 and 2008, respectively) resulting from ourincreased uninsured discounts (uninsured discounts were $4.641 billion, $2.935 billion and $1.853 billion forthe years ended December 31, 2010, 2009 and 2008, respectively).
Consolidated admissions declined 0.1% in 2010 compared to 2009 and increased 1.0% in 2009 comparedto 2008. Consolidated inpatient surgeries declined 1.5% and consolidated outpatient surgeries declined 1.4%during 2010 compared to 2009. Consolidated inpatient surgeries increased 0.3% and consolidated outpatientsurgeries declined 0.4% during 2009 compared to 2008. Consolidated emergency room visits increased 2.0%during 2010 compared to 2009 and increased 6.6% during 2009 compared to 2008.
Same facility revenues increased 2.1% for the year ended December 31, 2010 compared to the year endedDecember 31, 2009 and increased 6.1% for the year ended December 31, 2009 compared to the year endedDecember 31, 2008. The 2.1% increase for 2010 can be primarily attributed to the combined impact of a 0.6%increase in same facility revenue per equivalent admission and a 1.4% increase in same facility equivalentadmissions. The 6.1% increase for 2009 can be primarily attributed to the combined impact of a 2.6% increasein same facility revenue per equivalent admission and a 3.4% increase in same facility equivalent admissions.
Same facility admissions increased 0.1% in 2010 compared to 2009 and increased 1.2% in 2009compared to 2008. Same facility inpatient surgeries declined 1.4% and same facility outpatient surgeriesdeclined 1.2% during 2010 compared to 2009. Same facility inpatient surgeries increased 0.5% and samefacility outpatient surgeries declined 0.1% during 2009 compared to 2008. Same facility emergency roomvisits increased 2.1% during 2010 compared to 2009 and increased 7.0% during 2009 compared to 2008.
Same facility uninsured emergency room visits increased 1.2% and same facility uninsured admissionsincreased 5.4% during 2010 compared to 2009. Same facility uninsured emergency room visits increased 6.5%and same facility uninsured admissions increased 4.7% during 2009 compared to 2008.
The approximate percentages of our admissions related to Medicare, managed Medicare, Medicaid,managed Medicaid, managed care and other insurers and the uninsured for the years ended December 31,2010, 2009 and 2008 are set forth in the following table.
2010 2009 2008Years Ended December 31,
Medicare . . . . . . . . . . . . . . . . . . . . . . . . . . . . . . . . . . . . . . . . . . . . . . . . . 34% 34% 35%
Managed Medicare . . . . . . . . . . . . . . . . . . . . . . . . . . . . . . . . . . . . . . . . . . 10 10 9
Medicaid . . . . . . . . . . . . . . . . . . . . . . . . . . . . . . . . . . . . . . . . . . . . . . . . . 9 9 8
Managed Medicaid . . . . . . . . . . . . . . . . . . . . . . . . . . . . . . . . . . . . . . . . . . 8 7 7
Managed care and other insurers . . . . . . . . . . . . . . . . . . . . . . . . . . . . . . . . 32 34 35
Uninsured . . . . . . . . . . . . . . . . . . . . . . . . . . . . . . . . . . . . . . . . . . . . . . . . 7 6 6
100% 100% 100%
44
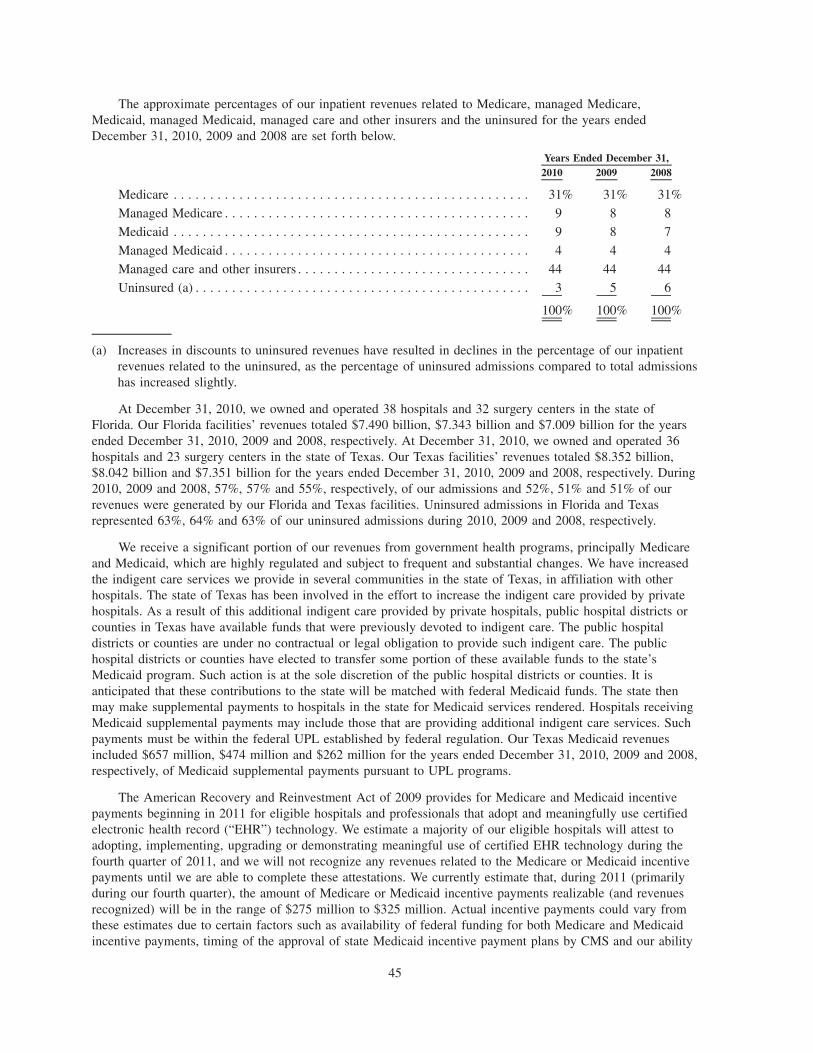
The approximate percentages of our inpatient revenues related to Medicare, managed Medicare,Medicaid, managed Medicaid, managed care and other insurers and the uninsured for the years endedDecember 31, 2010, 2009 and 2008 are set forth below.
2010 2009 2008Years Ended December 31,
Medicare . . . . . . . . . . . . . . . . . . . . . . . . . . . . . . . . . . . . . . . . . . . . . . . . . 31% 31% 31%
Managed Medicare . . . . . . . . . . . . . . . . . . . . . . . . . . . . . . . . . . . . . . . . . . 9 8 8
Medicaid . . . . . . . . . . . . . . . . . . . . . . . . . . . . . . . . . . . . . . . . . . . . . . . . . 9 8 7
Managed Medicaid . . . . . . . . . . . . . . . . . . . . . . . . . . . . . . . . . . . . . . . . . . 4 4 4
Managed care and other insurers . . . . . . . . . . . . . . . . . . . . . . . . . . . . . . . . 44 44 44
Uninsured (a) . . . . . . . . . . . . . . . . . . . . . . . . . . . . . . . . . . . . . . . . . . . . . . 3 5 6
100% 100% 100%
(a) Increases in discounts to uninsured revenues have resulted in declines in the percentage of our inpatientrevenues related to the uninsured, as the percentage of uninsured admissions compared to total admissionshas increased slightly.
At December 31, 2010, we owned and operated 38 hospitals and 32 surgery centers in the state ofFlorida. Our Florida facilities’ revenues totaled $7.490 billion, $7.343 billion and $7.009 billion for the yearsended December 31, 2010, 2009 and 2008, respectively. At December 31, 2010, we owned and operated 36hospitals and 23 surgery centers in the state of Texas. Our Texas facilities’ revenues totaled $8.352 billion,$8.042 billion and $7.351 billion for the years ended December 31, 2010, 2009 and 2008, respectively. During2010, 2009 and 2008, 57%, 57% and 55%, respectively, of our admissions and 52%, 51% and 51% of ourrevenues were generated by our Florida and Texas facilities. Uninsured admissions in Florida and Texasrepresented 63%, 64% and 63% of our uninsured admissions during 2010, 2009 and 2008, respectively.
We receive a significant portion of our revenues from government health programs, principally Medicareand Medicaid, which are highly regulated and subject to frequent and substantial changes. We have increasedthe indigent care services we provide in several communities in the state of Texas, in affiliation with otherhospitals. The state of Texas has been involved in the effort to increase the indigent care provided by privatehospitals. As a result of this additional indigent care provided by private hospitals, public hospital districts orcounties in Texas have available funds that were previously devoted to indigent care. The public hospitaldistricts or counties are under no contractual or legal obligation to provide such indigent care. The publichospital districts or counties have elected to transfer some portion of these available funds to the state’sMedicaid program. Such action is at the sole discretion of the public hospital districts or counties. It isanticipated that these contributions to the state will be matched with federal Medicaid funds. The state thenmay make supplemental payments to hospitals in the state for Medicaid services rendered. Hospitals receivingMedicaid supplemental payments may include those that are providing additional indigent care services. Suchpayments must be within the federal UPL established by federal regulation. Our Texas Medicaid revenuesincluded $657 million, $474 million and $262 million for the years ended December 31, 2010, 2009 and 2008,respectively, of Medicaid supplemental payments pursuant to UPL programs.
The American Recovery and Reinvestment Act of 2009 provides for Medicare and Medicaid incentivepayments beginning in 2011 for eligible hospitals and professionals that adopt and meaningfully use certifiedelectronic health record (“EHR”) technology. We estimate a majority of our eligible hospitals will attest toadopting, implementing, upgrading or demonstrating meaningful use of certified EHR technology during thefourth quarter of 2011, and we will not recognize any revenues related to the Medicare or Medicaid incentivepayments until we are able to complete these attestations. We currently estimate that, during 2011 (primarilyduring our fourth quarter), the amount of Medicare or Medicaid incentive payments realizable (and revenuesrecognized) will be in the range of $275 million to $325 million. Actual incentive payments could vary fromthese estimates due to certain factors such as availability of federal funding for both Medicare and Medicaidincentive payments, timing of the approval of state Medicaid incentive payment plans by CMS and our ability
45
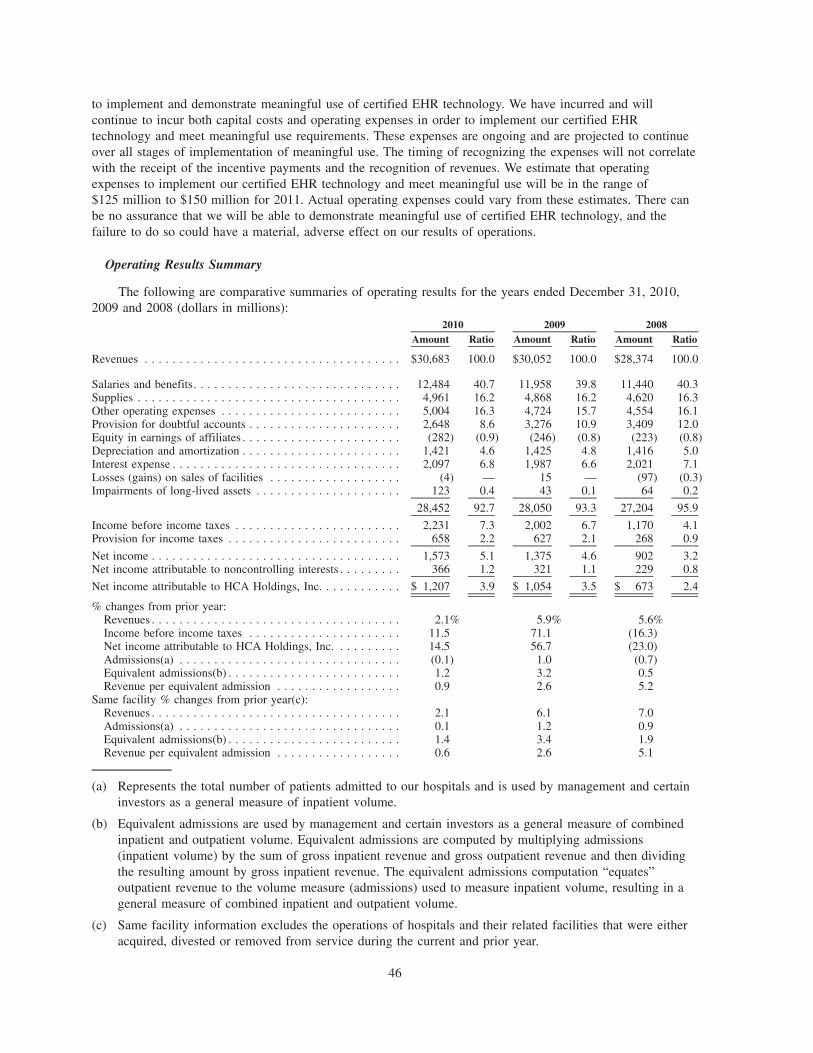
to implement and demonstrate meaningful use of certified EHR technology. We have incurred and willcontinue to incur both capital costs and operating expenses in order to implement our certified EHRtechnology and meet meaningful use requirements. These expenses are ongoing and are projected to continueover all stages of implementation of meaningful use. The timing of recognizing the expenses will not correlatewith the receipt of the incentive payments and the recognition of revenues. We estimate that operatingexpenses to implement our certified EHR technology and meet meaningful use will be in the range of$125 million to $150 million for 2011. Actual operating expenses could vary from these estimates. There canbe no assurance that we will be able to demonstrate meaningful use of certified EHR technology, and thefailure to do so could have a material, adverse effect on our results of operations.
Operating Results Summary
The following are comparative summaries of operating results for the years ended December 31, 2010,2009 and 2008 (dollars in millions):
Amount Ratio Amount Ratio Amount Ratio2010 2009 2008
Revenues . . . . . . . . . . . . . . . . . . . . . . . . . . . . . . . . . . . . . $30,683 100.0 $30,052 100.0 $28,374 100.0
Salaries and benefits. . . . . . . . . . . . . . . . . . . . . . . . . . . . . . 12,484 40.7 11,958 39.8 11,440 40.3Supplies . . . . . . . . . . . . . . . . . . . . . . . . . . . . . . . . . . . . . . 4,961 16.2 4,868 16.2 4,620 16.3Other operating expenses . . . . . . . . . . . . . . . . . . . . . . . . . . 5,004 16.3 4,724 15.7 4,554 16.1Provision for doubtful accounts . . . . . . . . . . . . . . . . . . . . . . 2,648 8.6 3,276 10.9 3,409 12.0Equity in earnings of affiliates . . . . . . . . . . . . . . . . . . . . . . . (282) (0.9) (246) (0.8) (223) (0.8)Depreciation and amortization . . . . . . . . . . . . . . . . . . . . . . . 1,421 4.6 1,425 4.8 1,416 5.0Interest expense . . . . . . . . . . . . . . . . . . . . . . . . . . . . . . . . . 2,097 6.8 1,987 6.6 2,021 7.1Losses (gains) on sales of facilities . . . . . . . . . . . . . . . . . . . (4) — 15 — (97) (0.3)Impairments of long-lived assets . . . . . . . . . . . . . . . . . . . . . 123 0.4 43 0.1 64 0.2
28,452 92.7 28,050 93.3 27,204 95.9
Income before income taxes . . . . . . . . . . . . . . . . . . . . . . . . 2,231 7.3 2,002 6.7 1,170 4.1Provision for income taxes . . . . . . . . . . . . . . . . . . . . . . . . . 658 2.2 627 2.1 268 0.9
Net income . . . . . . . . . . . . . . . . . . . . . . . . . . . . . . . . . . . . 1,573 5.1 1,375 4.6 902 3.2Net income attributable to noncontrolling interests . . . . . . . . . 366 1.2 321 1.1 229 0.8
Net income attributable to HCA Holdings, Inc. . . . . . . . . . . . $ 1,207 3.9 $ 1,054 3.5 $ 673 2.4
% changes from prior year:Revenues . . . . . . . . . . . . . . . . . . . . . . . . . . . . . . . . . . . . 2.1% 5.9% 5.6%Income before income taxes . . . . . . . . . . . . . . . . . . . . . . 11.5 71.1 (16.3)Net income attributable to HCA Holdings, Inc. . . . . . . . . . 14.5 56.7 (23.0)Admissions(a) . . . . . . . . . . . . . . . . . . . . . . . . . . . . . . . . (0.1) 1.0 (0.7)Equivalent admissions(b) . . . . . . . . . . . . . . . . . . . . . . . . . 1.2 3.2 0.5Revenue per equivalent admission . . . . . . . . . . . . . . . . . . 0.9 2.6 5.2
Same facility % changes from prior year(c):Revenues . . . . . . . . . . . . . . . . . . . . . . . . . . . . . . . . . . . . 2.1 6.1 7.0Admissions(a) . . . . . . . . . . . . . . . . . . . . . . . . . . . . . . . . 0.1 1.2 0.9Equivalent admissions(b) . . . . . . . . . . . . . . . . . . . . . . . . . 1.4 3.4 1.9Revenue per equivalent admission . . . . . . . . . . . . . . . . . . 0.6 2.6 5.1
(a) Represents the total number of patients admitted to our hospitals and is used by management and certaininvestors as a general measure of inpatient volume.
(b) Equivalent admissions are used by management and certain investors as a general measure of combinedinpatient and outpatient volume. Equivalent admissions are computed by multiplying admissions(inpatient volume) by the sum of gross inpatient revenue and gross outpatient revenue and then dividingthe resulting amount by gross inpatient revenue. The equivalent admissions computation “equates”outpatient revenue to the volume measure (admissions) used to measure inpatient volume, resulting in ageneral measure of combined inpatient and outpatient volume.
(c) Same facility information excludes the operations of hospitals and their related facilities that were eitheracquired, divested or removed from service during the current and prior year.
46
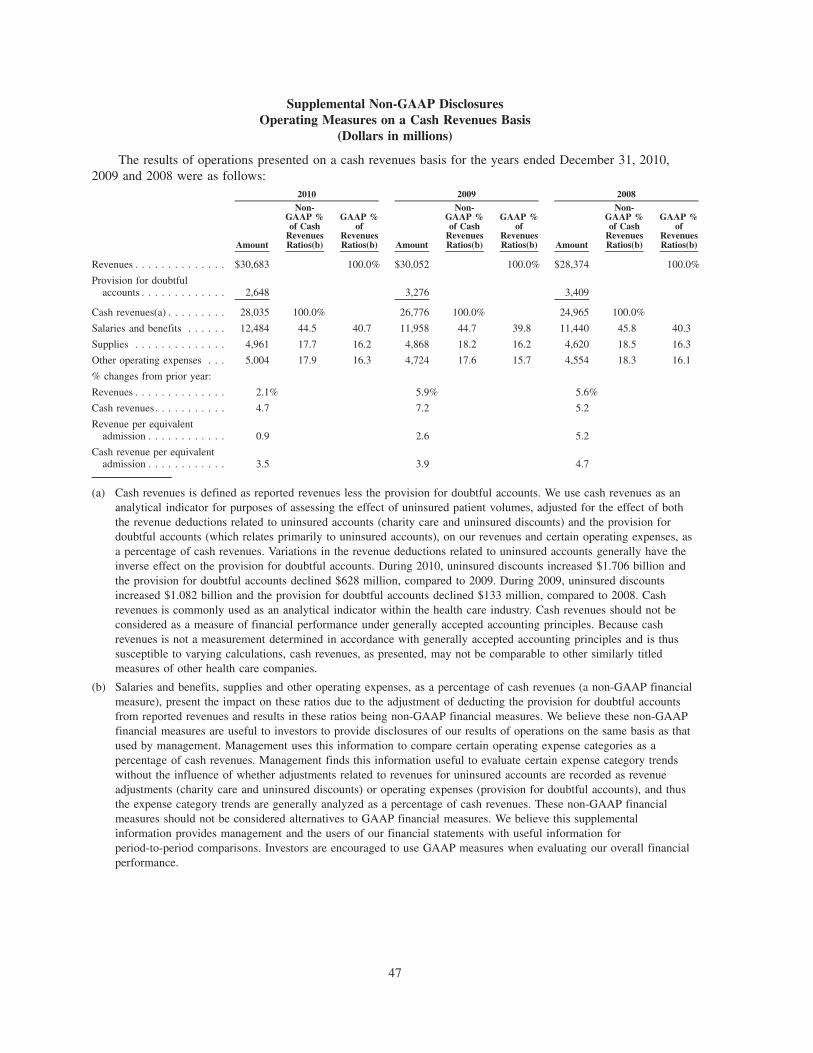
Supplemental Non-GAAP DisclosuresOperating Measures on a Cash Revenues Basis
(Dollars in millions)
The results of operations presented on a cash revenues basis for the years ended December 31, 2010,2009 and 2008 were as follows:
Amount
Non-GAAP %of Cash
RevenuesRatios(b)
GAAP %of
RevenuesRatios(b) Amount
Non-GAAP %of Cash
RevenuesRatios(b)
GAAP %of
RevenuesRatios(b) Amount
Non-GAAP %of Cash
RevenuesRatios(b)
GAAP %of
RevenuesRatios(b)
2010 2009 2008
Revenues . . . . . . . . . . . . . . $30,683 100.0% $30,052 100.0% $28,374 100.0%
Provision for doubtfulaccounts . . . . . . . . . . . . . 2,648 3,276 3,409
Cash revenues(a) . . . . . . . . . 28,035 100.0% 26,776 100.0% 24,965 100.0%
Salaries and benefits . . . . . . 12,484 44.5 40.7 11,958 44.7 39.8 11,440 45.8 40.3
Supplies . . . . . . . . . . . . . . 4,961 17.7 16.2 4,868 18.2 16.2 4,620 18.5 16.3
Other operating expenses . . . 5,004 17.9 16.3 4,724 17.6 15.7 4,554 18.3 16.1
% changes from prior year:
Revenues . . . . . . . . . . . . . . 2.1% 5.9% 5.6%
Cash revenues. . . . . . . . . . . 4.7 7.2 5.2
Revenue per equivalentadmission . . . . . . . . . . . . 0.9 2.6 5.2
Cash revenue per equivalentadmission . . . . . . . . . . . . 3.5 3.9 4.7
(a) Cash revenues is defined as reported revenues less the provision for doubtful accounts. We use cash revenues as ananalytical indicator for purposes of assessing the effect of uninsured patient volumes, adjusted for the effect of boththe revenue deductions related to uninsured accounts (charity care and uninsured discounts) and the provision fordoubtful accounts (which relates primarily to uninsured accounts), on our revenues and certain operating expenses, asa percentage of cash revenues. Variations in the revenue deductions related to uninsured accounts generally have theinverse effect on the provision for doubtful accounts. During 2010, uninsured discounts increased $1.706 billion andthe provision for doubtful accounts declined $628 million, compared to 2009. During 2009, uninsured discountsincreased $1.082 billion and the provision for doubtful accounts declined $133 million, compared to 2008. Cashrevenues is commonly used as an analytical indicator within the health care industry. Cash revenues should not beconsidered as a measure of financial performance under generally accepted accounting principles. Because cashrevenues is not a measurement determined in accordance with generally accepted accounting principles and is thussusceptible to varying calculations, cash revenues, as presented, may not be comparable to other similarly titledmeasures of other health care companies.
(b) Salaries and benefits, supplies and other operating expenses, as a percentage of cash revenues (a non-GAAP financialmeasure), present the impact on these ratios due to the adjustment of deducting the provision for doubtful accountsfrom reported revenues and results in these ratios being non-GAAP financial measures. We believe these non-GAAPfinancial measures are useful to investors to provide disclosures of our results of operations on the same basis as thatused by management. Management uses this information to compare certain operating expense categories as apercentage of cash revenues. Management finds this information useful to evaluate certain expense category trendswithout the influence of whether adjustments related to revenues for uninsured accounts are recorded as revenueadjustments (charity care and uninsured discounts) or operating expenses (provision for doubtful accounts), and thusthe expense category trends are generally analyzed as a percentage of cash revenues. These non-GAAP financialmeasures should not be considered alternatives to GAAP financial measures. We believe this supplementalinformation provides management and the users of our financial statements with useful information forperiod-to-period comparisons. Investors are encouraged to use GAAP measures when evaluating our overall financialperformance.
47
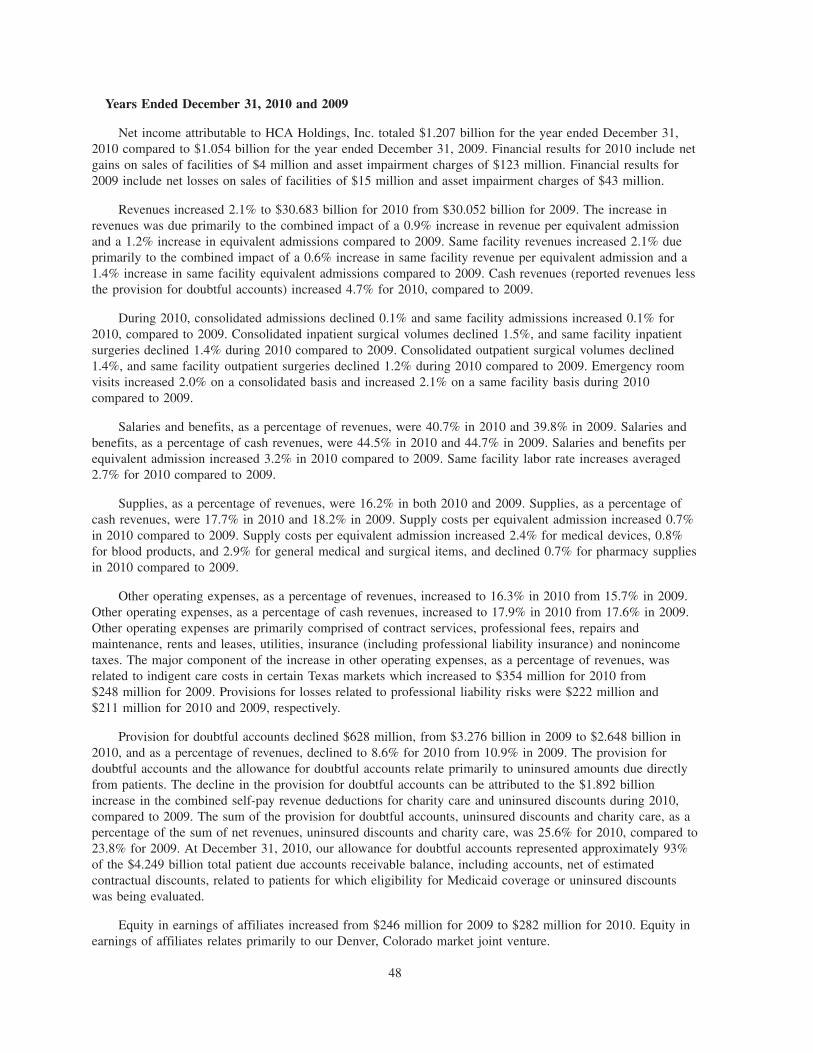
Years Ended December 31, 2010 and 2009
Net income attributable to HCA Holdings, Inc. totaled $1.207 billion for the year ended December 31,2010 compared to $1.054 billion for the year ended December 31, 2009. Financial results for 2010 include netgains on sales of facilities of $4 million and asset impairment charges of $123 million. Financial results for2009 include net losses on sales of facilities of $15 million and asset impairment charges of $43 million.
Revenues increased 2.1% to $30.683 billion for 2010 from $30.052 billion for 2009. The increase inrevenues was due primarily to the combined impact of a 0.9% increase in revenue per equivalent admissionand a 1.2% increase in equivalent admissions compared to 2009. Same facility revenues increased 2.1% dueprimarily to the combined impact of a 0.6% increase in same facility revenue per equivalent admission and a1.4% increase in same facility equivalent admissions compared to 2009. Cash revenues (reported revenues lessthe provision for doubtful accounts) increased 4.7% for 2010, compared to 2009.
During 2010, consolidated admissions declined 0.1% and same facility admissions increased 0.1% for2010, compared to 2009. Consolidated inpatient surgical volumes declined 1.5%, and same facility inpatientsurgeries declined 1.4% during 2010 compared to 2009. Consolidated outpatient surgical volumes declined1.4%, and same facility outpatient surgeries declined 1.2% during 2010 compared to 2009. Emergency roomvisits increased 2.0% on a consolidated basis and increased 2.1% on a same facility basis during 2010compared to 2009.
Salaries and benefits, as a percentage of revenues, were 40.7% in 2010 and 39.8% in 2009. Salaries andbenefits, as a percentage of cash revenues, were 44.5% in 2010 and 44.7% in 2009. Salaries and benefits perequivalent admission increased 3.2% in 2010 compared to 2009. Same facility labor rate increases averaged2.7% for 2010 compared to 2009.
Supplies, as a percentage of revenues, were 16.2% in both 2010 and 2009. Supplies, as a percentage ofcash revenues, were 17.7% in 2010 and 18.2% in 2009. Supply costs per equivalent admission increased 0.7%in 2010 compared to 2009. Supply costs per equivalent admission increased 2.4% for medical devices, 0.8%for blood products, and 2.9% for general medical and surgical items, and declined 0.7% for pharmacy suppliesin 2010 compared to 2009.
Other operating expenses, as a percentage of revenues, increased to 16.3% in 2010 from 15.7% in 2009.Other operating expenses, as a percentage of cash revenues, increased to 17.9% in 2010 from 17.6% in 2009.Other operating expenses are primarily comprised of contract services, professional fees, repairs andmaintenance, rents and leases, utilities, insurance (including professional liability insurance) and nonincometaxes. The major component of the increase in other operating expenses, as a percentage of revenues, wasrelated to indigent care costs in certain Texas markets which increased to $354 million for 2010 from$248 million for 2009. Provisions for losses related to professional liability risks were $222 million and$211 million for 2010 and 2009, respectively.
Provision for doubtful accounts declined $628 million, from $3.276 billion in 2009 to $2.648 billion in2010, and as a percentage of revenues, declined to 8.6% for 2010 from 10.9% in 2009. The provision fordoubtful accounts and the allowance for doubtful accounts relate primarily to uninsured amounts due directlyfrom patients. The decline in the provision for doubtful accounts can be attributed to the $1.892 billionincrease in the combined self-pay revenue deductions for charity care and uninsured discounts during 2010,compared to 2009. The sum of the provision for doubtful accounts, uninsured discounts and charity care, as apercentage of the sum of net revenues, uninsured discounts and charity care, was 25.6% for 2010, compared to23.8% for 2009. At December 31, 2010, our allowance for doubtful accounts represented approximately 93%of the $4.249 billion total patient due accounts receivable balance, including accounts, net of estimatedcontractual discounts, related to patients for which eligibility for Medicaid coverage or uninsured discountswas being evaluated.
Equity in earnings of affiliates increased from $246 million for 2009 to $282 million for 2010. Equity inearnings of affiliates relates primarily to our Denver, Colorado market joint venture.
48

Depreciation and amortization declined, as a percentage of revenues, to 4.6% in 2010 from 4.8% in 2009.Depreciation expense was $1.416 billion for 2010 and $1.419 billion for 2009.
Interest expense increased to $2.097 billion for 2010 from $1.987 billion for 2009. The increase ininterest expense was due primarily to an increase in the average effective interest rate. Our average debtbalance was $26.751 billion for 2010 compared to $26.267 billion for 2009. The average interest rate for ourlong-term debt increased from 7.6% for 2009 to 7.8% for 2010.
Net gains on sales of facilities were $4 million for 2010 and were related to sales of real estate and otherhealth care entity investments. Net losses on sales of facilities were $15 million for 2009 and included$8 million of net losses on the sales of three hospital facilities and $7 million of net losses on sales of realestate and other health care entity investments.
Impairments of long-lived assets were $123 million for 2010 and included $74 million related to twohospital facilities and $49 million related to other health care entity investments, which includes $35 millionfor the writeoff of capitalized engineering and design costs related to certain building safety requirements(California earthquake standards) that have been revised. Impairments of long-lived assets were $43 millionfor 2009 and included $19 million related to goodwill and $24 million related to property and equipment.
The effective tax rate was 35.3% and 37.3% for 2010 and 2009, respectively. The effective tax ratecomputations exclude net income attributable to noncontrolling interests as it relates to consolidatedpartnerships. Our provisions for income taxes for 2010 and 2009 were reduced by $44 million and$12 million, respectively, related to reductions in interest expense related to taxing authority examinations.Excluding the effect of these adjustments, the effective tax rate for 2010 and 2009 would have been 37.6%and 38.0%, respectively.
Net income attributable to noncontrolling interests increased from $321 million for 2009 to $366 millionfor 2010. The increase in net income attributable to noncontrolling interests related primarily to growth inoperating results of hospital joint ventures in two Texas markets.
Years Ended December 31, 2009 and 2008
Net income attributable to HCA Holdings, Inc. totaled $1.054 billion for the year ended December 31,2009 compared to $673 million for the year ended December 31, 2008. Financial results for 2009 includelosses on sales of facilities of $15 million and asset impairment charges of $43 million. Financial results for2008 include gains on sales of facilities of $97 million and asset impairment charges of $64 million.
Revenues increased 5.9% to $30.052 billion for 2009 from $28.374 billion for 2008. The increase inrevenues was due primarily to the combined impact of a 2.6% increase in revenue per equivalent admissionand a 3.2% increase in equivalent admissions compared to 2008. Same facility revenues increased 6.1% dueprimarily to the combined impact of a 2.6% increase in same facility revenue per equivalent admission and a3.4% increase in same facility equivalent admissions compared to 2008. Cash revenues (reported revenues lessthe provision for doubtful accounts) increased 7.2% for 2009, compared to 2008.
During 2009, consolidated admissions increased 1.0% and same facility admissions increased 1.2% for2009, compared to 2008. Consolidated inpatient surgical volumes increased 0.3%, and same facility inpatientsurgeries increased 0.5% during 2009 compared to 2008. Consolidated outpatient surgical volumes declined0.4%, and same facility outpatient surgeries declined 0.1% during 2009 compared to 2008. Emergencydepartment visits increased 6.6% on a consolidated basis and increased 7.0% on a same facility basis during2009 compared to 2008.
Salaries and benefits, as a percentage of revenues, were 39.8% in 2009 and 40.3% in 2008. Salaries andbenefits, as a percentage of cash revenues, were 44.7% in 2009 and 45.8% in 2008. Salaries and benefits perequivalent admission increased 1.3% in 2009 compared to 2008. Same facility labor rate increases averaged3.7% for 2009 compared to 2008.
Supplies, as a percentage of revenues, were 16.2% in 2009 and 16.3% in 2008. Supplies, as a percentageof cash revenues, were 18.2% in 2009 and 18.5% in 2008. Supply costs per equivalent admission increased
49
2.1% in 2009 compared to 2008. Same facility supply costs increased 5.9% for medical devices, 4.0% forpharmacy supplies, 7.1% for blood products and 7.0% for general medical and surgical items in 2009compared to 2008.
Other operating expenses, as a percentage of revenues, declined to 15.7% in 2009 from 16.1% in 2008.Other operating expenses, as a percentage of cash revenues, declined to 17.6% in 2009 from 18.3% in 2008.Other operating expenses are primarily comprised of contract services, professional fees, repairs andmaintenance, rents and leases, utilities, insurance (including professional liability insurance) and nonincometaxes. The overall decline in other operating expenses, as a percentage of revenues, is comprised of relativelysmall reductions in several areas, including utilities, employee recruitment and travel and entertainment. Otheroperating expenses include $248 million and $144 million of indigent care costs in certain Texas marketsduring 2009 and 2008, respectively. Provisions for losses related to professional liability risks were$211 million and $175 million for 2009 and 2008, respectively.
Provision for doubtful accounts declined $133 million, from $3.409 billion in 2008 to $3.276 billion in2009, and as a percentage of revenues, declined to 10.9% for 2009 from 12.0% in 2008. The provision fordoubtful accounts and the allowance for doubtful accounts relate primarily to uninsured amounts due directlyfrom patients. The decline in the provision for doubtful accounts can be attributed to the $1.486 billionincrease in the combined self-pay revenue deductions for charity care and uninsured discounts during 2009,compared to 2008. The sum of the provision for doubtful accounts, uninsured discounts and charity care, as apercentage of the sum of net revenues, uninsured discounts and charity care, was 23.8% for 2009, compared to21.9% for 2008. At December 31, 2009, our allowance for doubtful accounts represented approximately 94%of the $5.176 billion total patient due accounts receivable balance, including accounts, net of estimatedcontractual discounts, related to patients for which eligibility for Medicaid coverage or uninsured discountswas being evaluated.
Equity in earnings of affiliates increased from $223 million for 2008 to $246 million for 2009. Equity inearnings of affiliates relates primarily to our Denver, Colorado market joint venture.
Depreciation and amortization decreased, as a percentage of revenues, to 4.8% in 2009 from 5.0% in2008. Depreciation expense was $1.419 billion for 2009 and $1.412 billion for 2008.
Interest expense declined to $1.987 billion for 2009 from $2.021 billion for 2008. The decline in interestexpense was due to reductions in the average debt balance. Our average debt balance was $26.267 billion for2009 compared to $27.211 billion for 2008. The average interest rate for our long-term debt increased from7.4% for 2008 to 7.6% for 2009.
Net losses on sales of facilities were $15 million for 2009 and included $8 million of net losses on thesales of three hospital facilities and $7 million of net losses on sales of real estate and other health care entityinvestments. Gains on sales of facilities were $97 million for 2008 and included $81 million of gains on thesales of two hospital facilities and $16 million of net gains on sales of real estate and other health care entityinvestments.
Impairments of long-lived assets were $43 million for 2009 and included $19 million related to goodwilland $24 million related to property and equipment. Impairments of long-lived assets were $64 million for2008 and included $48 million related to goodwill and $16 million related to property and equipment.
The effective tax rate was 37.3% and 28.5% for 2009 and 2008, respectively. The effective tax ratecomputations exclude net income attributable to noncontrolling interests as it relates to consolidatedpartnerships. Primarily as a result of reaching a settlement with the IRS Appeals Division and the revision ofthe amount of a proposed IRS adjustment related to prior taxable periods, we reduced our provision forincome taxes by $69 million in 2008. Excluding the effect of these adjustments, the effective tax rate for 2008would have been 35.8%.
Net income attributable to noncontrolling interests increased from $229 million for 2008 to $321 millionfor 2009. The increase in net income attributable to noncontrolling interests related primarily to growth inoperating results of hospital joint ventures in two Texas markets.
50
Liquidity and Capital Resources
Our primary cash requirements are paying our operating expenses, servicing our debt, capitalexpenditures on our existing properties, acquisitions of hospitals and other health care entities, distributions tostockholders and distributions to noncontrolling interests. Our primary cash sources are cash flow fromoperating activities, issuances of debt and equity securities and dispositions of hospitals and other health careentities.
Cash provided by operating activities totaled $3.085 billion in 2010 compared to $2.747 billion in 2009and $1.990 billion in 2008. Working capital totaled $2.650 billion at December 31, 2010 and $2.264 billion atDecember 31, 2009. The $338 million increase in cash provided by operating activities for 2010, compared to2009, was primarily comprised of the net impact of the $198 million increase in net income, a $547 millionimprovement from lower income tax payments and a $384 million decline from changes in operating assetsand liabilities and the provision for doubtful accounts. The $757 million increase in cash provided byoperating activities for 2009, compared to 2008, related primarily to the $473 million increase in net incomeand $143 million improvement from changes in operating assets and liabilities and the provision for doubtfulaccounts. Cash payments for interest and income taxes declined $387 million for 2010 compared to 2009 andincreased $203 million for 2009 compared to 2008.
Cash used in investing activities was $1.039 billion, $1.035 billion and $1.467 billion in 2010, 2009 and2008, respectively. Excluding acquisitions, capital expenditures were $1.325 billion in 2010, $1.317 billion in2009 and $1.600 billion in 2008. We expended $233 million, $61 million and $85 million for acquisitions ofhospitals and health care entities during 2010, 2009 and 2008, respectively. Expenditures for acquisitions in2010 included two hospital facilities, and in 2009 and 2008 were generally comprised of outpatient andancillary services entities. Planned capital expenditures are expected to approximate $1.600 billion in 2011. AtDecember 31, 2010, there were projects under construction which had an estimated additional cost to completeand equip over the next five years of $1.700 billion. We expect to finance capital expenditures with internallygenerated and borrowed funds.
During 2010, we received cash proceeds of $37 million from sales of other health care entities and realestate investments. We also received net cash proceeds of $472 million related to net changes in ourinvestments. During 2009, we received cash proceeds of $41 million from dispositions of three hospitals andsales of other health care entities and real estate investments. We also received net cash proceeds of$303 million related to net changes in our investments. During 2008, we received cash proceeds of$143 million from dispositions of two hospitals and $50 million from sales of other health care entities andreal estate investments.
Cash used in financing activities totaled $1.947 billion in 2010, $1.865 billion in 2009 and $451 millionin 2008. During 2010, we paid $4.257 billion in distributions to our stockholders and received net proceeds of$2.533 billion from our debt issuance and debt repayment activities. During 2009 and 2008, we used cashproceeds from sales of facilities and available cash provided by operations to make net debt repayments of$1.459 billion and $260 million, respectively. During 2010, we received contributions from noncontrollinginterests of $57 million. During 2010, 2009 and 2008, we made distributions to noncontrolling interests of$342 million, $330 million and $178 million, respectively. We paid debt issuance costs of $50 million and$70 million for 2010 and 2009, respectively. During 2010, we received income tax benefits of $114 millionfor certain items (primarily the cash distributions to holders of our stock options) that were deductibleexpenses for tax purposes, but were recognized as adjustments to stockholders’ deficit for financial reportingpurposes. We or our affiliates, including affiliates of the Sponsors, may in the future repurchase portions ofour debt securities, subject to certain limitations, from time to time in either the open market or throughprivately negotiated transactions, in accordance with applicable SEC and other legal requirements. The timing,prices, and sizes of purchases depend upon prevailing trading prices, general economic and market conditions,and other factors, including applicable securities laws. Funds for the repurchase of debt securities have, andare expected to, come primarily from cash generated from operations and borrowed funds.
51
In addition to cash flows from operations, available sources of capital include amounts available underour senior secured credit facilities ($1.314 billion as of December 31, 2010 and $1.523 billion as ofJanuary 31, 2011) and anticipated access to public and private debt markets.
During 2010, our Board of Directors declared three distributions to our stockholders and holders of stockoptions. The distributions totaled $42.50 per share and vested stock option, or $4.332 billion in the aggregate.The distributions were funded using funds available under our existing senior secured credit facilities,proceeds from the November 2010 issuance of $1.525 billion aggregate principal amount of 73⁄4% seniorunsecured notes due 2021 and cash on hand.
Investments of our professional liability insurance subsidiary, to maintain statutory equity and pay claims,totaled $742 million and $1.316 billion at December 31, 2010 and 2009, respectively. Investments werereduced during 2010 as a result of the insurance subsidiary distributing $500 million of excess capital to theCompany. The insurance subsidiary maintained net reserves for professional liability risks of $452 million and$590 million at December 31, 2010 and 2009, respectively. Our facilities are insured by our wholly-ownedinsurance subsidiary for losses up to $50 million per occurrence; however, since January 2007, this coverage issubject to a $5 million per occurrence self-insured retention. Net reserves for the self-insured professionalliability risks retained were $796 million and $679 million at December 31, 2010 and 2009, respectively.Claims payments, net of reinsurance recoveries, during the next 12 months are expected to approximate$265 million. We estimate that approximately $165 million of the expected net claim payments during thenext 12 months will relate to claims subject to the self-insured retention.
Financing Activities
We are a highly leveraged company with significant debt service requirements. Our debt totaled$28.225 billion and $25.670 billion at December 31, 2010 and 2009, respectively. Our interest expense was$2.097 billion for 2010 and $1.987 billion for 2009.
During February 2009, HCA Inc. issued $310 million aggregate principal amount of 97⁄8% senior securedsecond lien notes due 2017 at a price of 96.673% of their face value, resulting in $300 million of grossproceeds. During April 2009, HCA Inc. issued $1.500 billion aggregate principal amount of 81⁄2% seniorsecured first lien notes due 2019 at a price of 96.755% of their face value, resulting in $1.451 billion of grossproceeds. During August 2009, HCA Inc. issued $1.250 billion aggregate principal amount of 77⁄8% seniorsecured first lien notes due 2020 at a price of 98.254% of their face value, resulting in $1.228 billion of grossproceeds. During March 2010, HCA Inc. issued $1.400 billion aggregate principal amount of 71⁄4% seniorsecured first lien notes due 2020 at a price of 99.095% of their face value, resulting in $1.387 billion of grossproceeds. After the payment of related fees and expenses, we used the proceeds from these debt offerings torepay outstanding indebtedness under our senior secured term loan facilities. During November 2010, weissued $1.525 billion aggregate principal amount of 73⁄4% senior unsecured notes due 2021 at a price of 100%of their face value. After the payment of related fees and expenses, we used the proceeds to make adistribution to our stockholders and optionholders.
Management believes that cash flows from operations, amounts available under our senior secured creditfacilities and our anticipated access to public and private debt markets will be sufficient to meet expectedliquidity needs during the next twelve months.
52
Contractual Obligations and Off-Balance Sheet Arrangements
As of December 31, 2010, maturities of contractual obligations and other commercial commitments arepresented in the table below (dollars in millions):
Contractual Obligations(a) Total Current 2-3 Years 4-5 YearsAfter
5 Years
Payments Due by Period
Long-term debt including interest, excluding thesenior secured credit facilities(b) . . . . . . . . . . . $29,803 $1,845 $ 4,824 $5,053 $18,081
Loans outstanding under the senior secured creditfacilities, including interest(b) . . . . . . . . . . . . . 12,013 848 7,828 1,147 2,190
Operating leases(c) . . . . . . . . . . . . . . . . . . . . . . . 1,876 269 466 293 848
Purchase and other obligations(c) . . . . . . . . . . . . . 225 37 44 36 108
Total contractual obligations . . . . . . . . . . . . . . . . $43,917 $2,999 $13,162 $6,529 $21,227
Other Commercial Commitments Not Recorded on theConsolidated Balance Sheet Total Current 2-3 Years 4-5 Years
After5 Years
Commitment Expiration by Period
Surety bonds(d) . . . . . . . . . . . . . . . . . . . . . . . . . . $ 59 $52 $ 6 $ 1 $—
Letters of credit(e) . . . . . . . . . . . . . . . . . . . . . . . 82 9 41 32 —
Physician commitments(f) . . . . . . . . . . . . . . . . . . 33 26 7 — —
Guarantees(g) . . . . . . . . . . . . . . . . . . . . . . . . . . . 2 — — — 2
Total commercial commitments . . . . . . . . . . . . . . $176 $87 $54 $33 $ 2
(a) We have not included obligations to pay estimated professional liability claims ($1.248 billion atDecember 31, 2010, including net reserves of $452 million related to the wholly-owned insurancesubsidiary) in this table. The estimated professional liability claims, which occurred prior to 2007, areexpected to be funded by the designated investment securities that are restricted for this purpose($742 million at December 31, 2010). We also have not included obligations related to unrecognized taxbenefits of $413 million at December 31, 2010, as we cannot reasonably estimate the timing or amountsof cash payments, if any, at this time.
(b) Estimates of interest payments assume that interest rates, borrowing spreads and foreign currencyexchange rates at December 31, 2010, remain constant during the period presented.
(c) Amounts relate to future operating lease obligations, purchase obligations and other obligations and arenot recorded in our consolidated balance sheet. Amounts also include physician commitments that arerecorded in our consolidated balance sheet.
(d) Amounts relate primarily to instances in which we have agreed to indemnify various commercial insurerswho have provided surety bonds to cover self-insured workers’ compensation claims, utility deposits anddamages for malpractice cases which were awarded to plaintiffs by the courts. These cases are currentlyunder appeal and the bonds will not be released by the courts until the cases are closed.
(e) Amounts relate primarily to various insurance programs and employee benefit plan obligations for whichwe have letters of credit outstanding.
(f) In consideration for physicians relocating to the communities in which our hospitals are located andagreeing to engage in private practice for the benefit of the respective communities, we make advances tophysicians, normally over a period of one year, to assist in establishing the physicians’ practices. Theactual amount of these commitments to be advanced often depends upon the financial results of thephysicians’ private practices during the recruitment agreement payment period. The physiciancommitments reflected were based on our maximum exposure on effective agreements at December 31,2010.
(g) We have entered into guarantee agreements related to certain leases.
53
Market Risk
We are exposed to market risk related to changes in market values of securities. The investments in debtand equity securities of our wholly-owned insurance subsidiary were $734 million and $8 million, respectively,at December 31, 2010. These investments are carried at fair value, with changes in unrealized gains and lossesbeing recorded as adjustments to other comprehensive income. At December 31, 2010, we had a netunrealized gain of $10 million on the insurance subsidiary’s investment securities.
We are exposed to market risk related to market illiquidity. Liquidity of the investments in debt andequity securities of our wholly-owned insurance subsidiary could be impaired by the inability to access thecapital markets. Should the wholly-owned insurance subsidiary require significant amounts of cash in excessof normal cash requirements to pay claims and other expenses on short notice, we may have difficulty sellingthese investments in a timely manner or be forced to sell them at a price less than what we might otherwisehave been able to in a normal market environment. At December 31, 2010, our wholly-owned insurancesubsidiary had invested $250 million ($251 million par value) in tax-exempt student loan auction ratesecurities that continue to experience market illiquidity. It is uncertain if auction-related market liquidity willresume for these securities. We may be required to recognize other-than-temporary impairments on these long-term investments in future periods should issuers default on interest payments or should the fair marketvaluations of the securities deteriorate due to ratings downgrades or other issue specific factors.
We are also exposed to market risk related to changes in interest rates, and we periodically enter intointerest rate swap agreements to manage our exposure to these fluctuations. Our interest rate swap agreementsinvolve the exchange of fixed and variable rate interest payments between two parties, based on commonnotional principal amounts and maturity dates. The notional amounts of the swap agreements representbalances used to calculate the exchange of cash flows and are not our assets or liabilities. Our credit riskrelated to these agreements is considered low because the swap agreements are with creditworthy financialinstitutions. The interest payments under these agreements are settled on a net basis. These derivatives havebeen recognized in the financial statements at their respective fair values. Changes in the fair value of thesederivatives, which are designated as cash flow hedges, are included in other comprehensive income, andchanges in the fair value of derivatives which have not been designated as hedges are recorded in operations.
With respect to our interest-bearing liabilities, approximately $3.037 billion of long-term debt atDecember 31, 2010 was subject to variable rates of interest, while the remaining balance in long-term debt of$25.188 billion at December 31, 2010 was subject to fixed rates of interest. Both the general level of interestrates and, for the senior secured credit facilities, our leverage affect our variable interest rates. Our variablerate debt is comprised primarily of amounts outstanding under the senior secured credit facilities. Borrowingsunder the senior secured credit facilities bear interest at a rate equal to an applicable margin plus, at ouroption, either (a) a base rate determined by reference to the higher of (1) the federal funds rate plus 0.50%and (2) the prime rate of Bank of America or (b) a LIBOR rate for the currency of such borrowing for therelevant interest period. The applicable margin for borrowings under the senior secured credit facilities mayfluctuate according to a leverage ratio. The average effective interest rate for our long-term debt increasedfrom 7.6% for 2009 to 7.8% for 2010.
On March 2, 2009, the cash flow credit facility was amended to allow for one or more future issuances ofadditional secured notes, which may include notes that are secured on a pari passu basis or on a junior basiswith the obligations under the cash flow credit facility, so long as (1) such notes do not require, subject tocertain exceptions, scheduled repayments, payment of principal or redemption prior to the scheduled term loanB-1 maturity date, (2) the terms of such notes, taken as a whole, are not more restrictive than those in the cashflow credit facility and (3) no subsidiary of HCA Inc. that is not a U.S. guarantor is an obligor of suchadditional secured notes, and such notes are not secured by any European collateral securing the cash flowcredit facility. The U.S. security documents related to the cash flow credit facility were also amended andrestated in connection with the amendment in order to give effect to the security interests to be granted toholders of such additional secured notes.
On March 2, 2009, the asset-based revolving credit facility was amended to allow for one or more futureissuances of additional secured notes or loans, which may include notes or loans that are secured on a pari
54
passu basis or on a junior basis with the obligations under the cash flow credit facility, so long as (1) suchnotes or loans do not require, subject to certain exceptions, scheduled repayments, payment of principal orredemption prior to the scheduled term loan B-1 maturity date, (2) the terms of such notes or loans, asapplicable, taken as a whole, are not more restrictive than those in the cash flow credit facility and (3) nosubsidiary of HCA Inc. that is not a U.S. guarantor is an obligor of such additional secured notes. Theamendment to the asset-based revolving credit facility also altered the excess facility availability requirementto include a separate minimum facility availability requirement applicable to the asset-based revolving creditfacility and increased the applicable LIBOR and asset-based revolving margins for all borrowings under theasset-based revolving credit facility by 0.25% each.
On June 18, 2009, the cash flow credit facility was amended to permit the unlimited incurrence of newterm loans to refinance the term loans initially incurred as well as any previously incurred refinancing termloans and to permit the establishment of commitments under a replacement cash flow revolver under the cashflow credit facility to replace all or a portion of the revolving commitments initially established under the cashflow credit facility as well as any previously issued replacement revolvers.
On April 6, 2010 the cash flow credit facility was further amended to (i) extend the maturity date for$2.0 billion of the tranche B term loans from November 17, 2013 to March 31, 2017 and (ii) increase theABR margin and LIBOR margin with respect to such extended term loans to 2.25% and 3.25%, respectively.
On November 8, 2010, an amended and restated joinder agreement was entered into with respect to thecash flow credit facility to establish a new replacement revolving credit series, which will mature onNovember 17, 2015. The replacement revolving credit commitments will become effective upon the earlier of(i) our receipt of all or a portion of the proceeds (including by way of contribution) from an initial publicoffering of common stock of HCA Inc. or its direct or indirect parent company (the “IPO ProceedsCondition”) and (ii) May 17, 2012, subject to the satisfaction of certain other conditions. If the IPO ProceedsCondition has not been satisfied, on May 17, 2012 or, if the IPO Proceeds Condition has been satisfied priorto May 17, 2012, on November 17, 2012, the applicable ABR and LIBOR margins with respect to thereplacement revolving loans will be increased from the applicable ABR and LIBOR margins of the existingrevolving loans based upon the achievement of a certain leverage ratio, which level will decrease from thelevels of the existing revolving loans. The offering contemplated hereby will satisfy the IPO ProceedsCondition.
The estimated fair value of our total long-term debt was $28.738 billion at December 31, 2010. Theestimates of fair value are based upon the quoted market prices for the same or similar issues of long-termdebt with the same maturities. Based on a hypothetical 1% increase in interest rates, the potential annualizedreduction to future pretax earnings would be approximately $30 million. To mitigate the impact of fluctuationsin interest rates, we generally target a portion of our debt portfolio to be maintained at fixed rates.
Our international operations and the European term loan expose us to market risks associated withforeign currencies. In order to mitigate the currency exposure related to debt service obligations throughDecember 31, 2011 under the European term loan, we have entered into cross currency swap agreements. Across currency swap is an agreement between two parties to exchange a stream of principal and interestpayments in one currency for a stream of principal and interest payments in another currency over a specifiedperiod.
Financial Instruments
Derivative financial instruments are employed to manage risks, including foreign currency and interestrate exposures, and are not used for trading or speculative purposes. We recognize derivative instruments, suchas interest rate swap agreements and foreign exchange contracts, in the consolidated balance sheets at fairvalue. Changes in the fair value of derivatives are recognized periodically either in earnings or instockholders’ equity, as a component of other comprehensive income, depending on whether the derivativefinancial instrument qualifies for hedge accounting, and if so, whether it qualifies as a fair value hedge or acash flow hedge. Gains and losses on derivatives designated as cash flow hedges, to the extent they areeffective, are recorded in other comprehensive income, and subsequently reclassified to earnings to offset the
55
impact of the hedged items when they occur. Changes in the fair value of derivatives not qualifying as hedges,and for any portion of a hedge that is ineffective, are reported in earnings.
The net interest paid or received on interest rate swaps is recognized as interest expense. Gains and lossesresulting from the early termination of interest rate swap agreements are deferred and amortized asadjustments to expense over the remaining period of the debt originally covered by the terminated swap.
Effects of Inflation and Changing Prices
Various federal, state and local laws have been enacted that, in certain cases, limit our ability to increaseprices. Revenues for general, acute care hospital services rendered to Medicare patients are established underthe federal government’s prospective payment system. Total fee-for-service Medicare revenues approximated23.5% in 2010, 22.8% in 2009 and 23.1% in 2008 of our revenues.
Management believes hospital industry operating margins have been, and may continue to be, undersignificant pressure because of changes in payer mix and growth in operating expenses in excess of theincrease in prospective payments under the Medicare program. In addition, as a result of increasing regulatoryand competitive pressures, our ability to maintain operating margins through price increases to non-Medicarepatients is limited.
IRS Disputes
At December 31, 2010, we were contesting, before the IRS Appeals Division, certain claimed deficienciesand adjustments proposed by the IRS Examination Division in connection with its audit of HCA Inc.’s 2005and 2006 federal income tax returns. The disputed items include the timing of recognition of certain patientservice revenues, the deductibility of certain debt retirement costs and our method for calculating the taxallowance for doubtful accounts. In addition, eight taxable periods of HCA Inc. and its predecessors ended in1997 through 2004, for which the primary remaining issue is the computation of the tax allowance fordoubtful accounts, were pending before the IRS Examination Division as of December 31, 2010. The IRSExamination Division began an audit of HCA Inc.’s 2007, 2008 and 2009 federal income tax returns inDecember 2010.
Management believes we and our predecessors and affiliates properly reported taxable income and paidtaxes in accordance with applicable laws and agreements established with the IRS and final resolution of thesedisputes will not have a material, adverse effect on our results of operations or financial position. However, ifpayments due upon final resolution of these issues exceed our recorded estimates, such resolutions could havea material, adverse effect on our results of operations or financial position.
56
BUSINESS
Our Company
We are the largest non-governmental hospital operator in the U.S. and a leading comprehensive,integrated provider of health care and related services. We provide these services through a network of acutecare hospitals, outpatient facilities, clinics and other patient care delivery settings. As of December 31, 2010,we operated a diversified portfolio of 164 hospitals (with approximately 41,000 beds) and 106 freestandingsurgery centers across 20 states throughout the U.S. and in England. As a result of our efforts to establishsignificant market share in large and growing urban markets with attractive demographic and economicprofiles, we currently have a substantial market presence in 14 of the top 25 fastest growing markets withpopulations greater than 500,000 in the U.S. and currently maintain the first or second position, based oninpatient admissions, in many of our key markets. We believe our ability to successfully position and grow ourassets in attractive markets and execute our operating plan has contributed to the strength of our financialperformance over the last several years. For the year ended December 31, 2010, we generated revenues of$30.683 billion, net income attributable to HCA Holdings, Inc. of $1.207 billion and Adjusted EBITDA of$5.868 billion.
Our patient-first strategy is to provide high quality health care services in a cost-efficient manner. Weintend to build upon our history of profitable growth by maintaining our dedication to quality care, increasingour presence in key markets through organic expansion and strategic acquisitions and joint ventures,leveraging our scale and infrastructure, and further developing our physician and employee relationships. Webelieve pursuing these core elements of our strategy helps us develop a faster-growing, more stable and moreprofitable business and increases our relevance to patients, physicians, payers and employers.
Using our scale, significant resources and over 40 years of operating experience, we have developed asignificant management and support infrastructure. Some of the key components of our support infrastructureinclude a revenue cycle management organization, a health care GPO, an information technology and servicesprovider, a nurse staffing agency and a medical malpractice insurance underwriter. These shared services havehelped us to maximize our cash collection efficiency, achieve savings in purchasing through our scale, morerapidly deploy information technology upgrades, more effectively manage our labor pool and achieve greaterstability in malpractice insurance premiums. Collectively, these components have helped us to further enhanceour operating effectiveness, cost efficiency and overall financial results. We are also creating a subsidiary thatwill offer certain of these component services to other health care companies.
Since the founding of our business in 1968 as a single-facility hospital company, we have demonstratedan ability to consistently innovate and sustain growth during varying economic and regulatory climates. Underthe leadership of an experienced senior management team, whose tenure at HCA averages over 20 years, wehave established an extensive record of providing high quality care, profitably growing our business, makingand integrating strategic acquisitions and efficiently and strategically allocating capital spending.
On November 17, 2006, we were acquired by a private investor group comprised of affiliates of or fundssponsored by Bain Capital, KKR, MLGPE (now BAML Capital Partners) (each a “Sponsor”), Citigroup Inc.,Bank of America Corporation (the “Sponsor Assignees”) and HCA founder Dr. Thomas F. Frist, Jr. (the “FristEntities”), a group we collectively refer to as the “Investors,” and by members of management and certainother investors. We refer to the merger, the financing transactions related to the merger and other relatedtransactions collectively as the “Recapitalization.”
Since the Recapitalization, we have achieved substantial operational and financial progress. During thistime, we have made significant investments in expanding our service lines and expanding our alignment withhighly specialized and primary care physicians. In addition, we have enhanced our operating efficienciesthrough a number of corporate cost-saving initiatives and an expansion of our support infrastructure. We havemade investments in information technology to optimize our facilities and systems. We have also undertaken anumber of initiatives to improve clinical quality and patient satisfaction. As a result of these initiatives, ourfinancial performance has improved significantly from the year ended December 31, 2007, the first full yearfollowing the Recapitalization, to the year ended December 31, 2010, with revenues growing by
57
$3.825 billion, net income attributable to HCA Holdings, Inc. increasing by $333 million and AdjustedEBITDA increasing by $1.276 billion. This represents compounded annual growth rates on these key metricsof 4.5%, 11.4% and 8.5%, respectively.
Our Industry
We believe well-capitalized, comprehensive and integrated health care delivery providers are well-positioned to benefit from the current industry trends, some of which include:
Aging Population and Continued Growth in the Need for Health Care Services. According to theU.S. Census Bureau, the demographic age group of persons aged 65 and over is expected to experiencecompounded annual growth of 3.0% over the next 20 years, and constitute 19.3% of the total U.S. populationby 2030. CMS projects continued increases in hospital services based on the aging of the U.S. population,advances in medical procedures, expansion of health coverage, increasing consumer demand for expandedmedical services and increased prevalence of chronic conditions such as diabetes, heart disease and obesity.We believe these factors will continue to drive increased utilization of health care services and the need forcomprehensive, integrated hospital networks that can provide a wide array of essential and sophisticated healthcare.
Continued Evolution of Quality-Based Reimbursement Favors Large-Scale, Comprehensive and IntegratedProviders. We believe the U.S. health care system is continuing to evolve in ways that favor large-scale,comprehensive and integrated providers that provide high levels of quality care. Specifically, we believe thereare a number of initiatives that will continue to gain importance in the foreseeable future, including:introduction of value-based payment methodologies tied to performance, quality and coordination of care,implementation of integrated electronic health records and information, and an increasing ability for patientsand consumers to make choices about all aspects of health care. We believe our company is well positioned torespond to these emerging trends and has the resources, expertise and flexibility necessary to adapt in a timelymanner to the changing health care regulatory and reimbursement environment.
Impact of Health Reform Law. The Health Reform Law will change how health care services arecovered, delivered and reimbursed. It will do so through expanded coverage of uninsured individuals,significant reductions in the growth of Medicare program payments, material decreases in Medicare andMedicaid DSH payments, and the establishment of programs where reimbursement is tied in part to qualityand integration. The Health Reform Law, as enacted, is expected to expand health insurance coverage toapproximately 32 to 34 million additional individuals through a combination of public program expansion andprivate sector health insurance reforms. We believe the expansion of private sector and Medicaid coveragewill, over time, increase our reimbursement related to providing services to individuals who were previouslyuninsured. On the other hand, the reductions in the growth in Medicare payments and the decreases in DSHpayments will adversely affect our government reimbursement. Because of the many variables involved,including pending court challenges, the potential for changes to the law as a result and efforts to amend orrepeal the law, we are unable to predict the net impact of the Health Reform Law on us; however, we believeour experienced management team, emphasis on quality care and diverse service offerings will enable us tocapitalize on the opportunities presented by the Health Reform Law, as well as adapt in a timely manner to itschallenges.
Our Competitive Strengths
We believe our key competitive strengths include:
Largest Comprehensive, Integrated Health Care Delivery System. We are the largest non-governmentalhospital operator in the U.S., providing approximately 4% to 5% of all U.S. hospital services through ournational footprint. The scope and scale of our operations, evidenced by the types of facilities we operate, thediverse medical specialties we offer and the numerous patient care access points we provide, enable us toprovide a comprehensive range of health care services in a cost-effective manner. As a result, we believe thebreadth of our platform is a competitive advantage in the marketplace enabling us to attract patients,
58
physicians and clinical staff while also providing significant economies of scale and increasing our relevancewith commercial payers.
Reputation for High Quality Patient-Centered Care. Since our founding, we have maintained anunwavering focus on patients and clinical outcomes. We believe clinical quality influences physician andpatient choices about health care delivery. We align our quality initiatives throughout the organization byengaging corporate, local, physician and nurse leaders to share best practices and develop standards fordelivering high quality care. We have invested extensively in quality of care initiatives, with an emphasis onimplementing information technology and adopting industry-wide best practices and clinical protocols. As aresult of these efforts, we have achieved significant progress in clinical quality. As measured by the CMSclinical core measures reported on the CMS Hospital Compare website and based on publicly available datafor the twelve months ended March 31, 2010, our hospitals achieved a composite score of 98.4% of the CMScore measures versus the national average of 95.3%, making us among the top performing major healthsystems in the U.S. In addition, as required by the Health Reform Law, CMS will establish a value-basedpurchasing system and will adjust hospital payment rates based on hospital-acquired conditions and hospitalreadmissions. We also believe our quality initiatives favorably position us in a payment environment that isincreasingly performance-based.
Leading Local Market Positions in Large, Growing, Urban Markets. Over our history, we have soughtto selectively expand and upgrade our asset base to create a premium portfolio of assets in attractive growingmarkets. As a result, we have a strong market presence in 14 of the top 25 fastest growing markets withpopulations greater than 500,000 in the U.S. We currently operate in 29 markets, 17 of which havepopulations of 1 million or more, with all but one of these markets projecting growth above the nationalaverage from 2009 to 2014. Our inpatient market share places us first or second in many of our key markets.We believe the strength and stability of these market positions will create organic growth opportunities andallow us to develop long-term relationships with patients, physicians, large employers and third-party payers.
Diversified Revenue Base and Payer Mix. We believe our broad geographic footprint, varied servicelines and diverse revenue base mitigate our risks in numerous ways. Our diversification limits our exposure tocompetitive dynamics and economic conditions in any single local market, reimbursement changes in specificservice lines and disruptions with respect to payers such as state Medicaid programs or large commercialinsurers. We have a diverse portfolio of assets with no single facility contributing more than 2.3% of ourrevenues and no single metropolitan statistical area contributing more than 8.0% of revenues for the yearended December 31, 2010. We have also developed a highly diversified payer base, including approximately3,000 managed care contracts, with no single commercial payer representing more than 8% of revenues for theyear ended December 31, 2010. In addition, we are one of the country’s largest providers of outpatientservices, which accounted for approximately 38% of our revenues for the year ended December 31, 2010. Webelieve the geographic diversity of our markets and the scope of our inpatient and outpatient operations helpreduce volatility in our operating results.
Scale and Infrastructure Drive Cost Savings and Efficiencies. Our scale allows us to leverage oursupport infrastructure to achieve significant cost savings and operating efficiencies, thereby driving marginexpansion. We strategically manage our supply chain through centralized purchasing and supply warehouses,as well as our revenue cycle through centralized billing, collections and health information managementfunctions. We also manage the provision of information technology through a combination of centralizedsystems with regional service support as well as centralize many other clinical and corporate functions,creating economies of scale in managing expenses and business processes. In addition to the cost savings andoperating efficiencies, this support infrastructure simultaneously generates revenue from third parties thatutilize our services.
Well-Capitalized Portfolio of High Quality Assets. In order to expand the range and improve the qualityof services provided at our facilities, we invested over $7.5 billion in our facilities and information technologysystems over the five-year period ended December 31, 2010. We believe our significant capital investments in
59
these areas will continue to attract new and returning patients, attract and retain high-quality physicians,maximize cost efficiencies and address the health care needs of our local communities. Furthermore, webelieve our platform, as well as electronic health record infrastructure, national research and physicianmanagement capabilities, provide a strategic advantage by enhancing our ability to capitalize on anticipatedincentives through the HITECH provisions of ARRA and position us well in an environment that increasinglyemphasizes quality, transparency and coordination of care.
Strong Operating Results and Cash Flows. Our leading scale, diversification, favorable marketpositions, dedication to clinical quality and focus on operational efficiency have enabled us to achieveattractive historical financial performance even during the most recent economic period. In the year endedDecember 31, 2010, we generated net income attributable to HCA Holdings, Inc. of $1.207 billion, AdjustedEBITDA of $5.868 billion and cash flows from operating activities of $3.085 billion. Our ability to generatestrong and consistent cash flow from operations has enabled us to invest in our operations, reduce our debt,enhance earnings per share and continue to pursue attractive growth opportunities.
Proven and Experienced Management Team. We believe the extensive experience and depth of ourmanagement team are a distinct competitive advantage in the complicated and evolving industry in which wecompete. Our CEO and Chairman of the Board of Directors, Richard M. Bracken, began his career with ourcompany over 29 years ago and has held various executive positions with us over that period, including, mostrecently, as our President and Chief Operating Officer. Our President, Chief Financial Officer and Director, R.Milton Johnson, joined our company over 28 years ago and has held various positions in our financialoperations since that time. Our six Group Presidents average approximately 20 years of experience with ourcompany. Members of our senior management hold significant equity interests in our company, furtheraligning their long-term interests with those of our stockholders.
Our Growth Strategy
We are committed to providing the communities we serve with high quality, cost-effective health carewhile growing our business, increasing our profitability and creating long-term value for our stockholders. Toachieve these objectives, we align our efforts around the following growth agenda:
Grow Our Presence in Existing Markets. We believe we are well positioned in a number of large andgrowing markets that will allow us the opportunity to generate long-term, attractive growth through theexpansion of our presence in these markets. We plan to continue recruiting and strategically collaborating withthe physician community and adding attractive service lines such as cardiology, emergency services, oncologyand women’s services. Additional components of our growth strategy include expanding our footprint throughdeveloping various outpatient access points, including surgery centers, rural outreach, freestanding emergencydepartments and walk-in clinics. Since our Recapitalization, we have invested significant capital into thesemarkets and expect to continue to see the benefit of this investment.
Achieve Industry-Leading Performance in Clinical and Satisfaction Measures. Achieving high levels ofpatient safety, patient satisfaction and clinical quality are central goals of our business model. To achieve thesegoals, we have implemented a number of initiatives including infection reduction initiatives, hospitalistprograms, advanced health information technology and evidence-based medicine programs. We routinelyanalyze operational practices from our best-performing hospitals to identify ways to implement organization-wide performance improvements and reduce clinical variation. We believe these initiatives will continue toimprove patient care, help us achieve cost efficiencies, grow our revenues and favorably position us in anenvironment where our constituents are increasingly focused on quality, efficacy and efficiency.
Recruit and Employ Physicians to Meet Need for High Quality Health Services. We depend on thequality and dedication of the health care providers and other team members who serve at our facilities. Webelieve a critical component of our growth strategy is our ability to successfully recruit and strategicallycollaborate with physicians and other professionals to provide high quality care. We attract and retainphysicians by providing high quality, convenient facilities with advanced technology, by expanding ourspecialty services and by building our outpatient operations. We believe our continued investment in theemployment, recruitment and retention of physicians will improve the quality of care at our facilities.
60

Continue to Leverage Our Scale and Market Positions to Enhance Profitability. We believe there issignificant opportunity to continue to grow the profitability of our company by fully leveraging the scale andscope of our franchise. We are currently pursuing next generation performance improvement initiatives such ascontracting for services on a multistate basis and expanding our support infrastructure for additional clinicaland support functions, such as physician credentialing, medical transcription and electronic medicalrecordkeeping. We believe our centrally managed business processes and ability to leverage cost-savingpractices across our extensive network will enable us to continue to manage costs effectively. We are in theprocess of creating a subsidiary that will leverage key components of our support infrastructure, includingrevenue cycle management, health care group purchasing, supply chain management and staffing functions, byoffering these services to other hospital companies.
Selectively Pursue a Disciplined Development Strategy. We continue to believe there are significantgrowth opportunities in our markets. We will continue to provide financial and operational resources tosuccessfully execute on our in-market opportunities. To complement our in-market growth agenda, we intendto focus on selectively developing and acquiring new hospitals, outpatient facilities and other health careservice providers. We believe the challenges faced by the hospital industry may spur consolidation and webelieve our size, scale, national presence and access to capital will position us well to participate in any suchconsolidation. We have a strong record of successfully acquiring and integrating hospitals and entering intojoint ventures and intend to continue leveraging this experience.
Business Drivers and Measures
Our Financial Policies and Objectives
We seek to optimize our financial and operating performance by implementing the business strategy setforth under “Business — Our Growth Strategy.” Our success in implementing this strategy depends, in turn, onour ability to fulfill our financial policies and objectives, which include the following:
• Operations: We plan to focus on our core operations: the provision of high quality, cost-effectivehealth care in large, high growth urban communities, primarily in the southern and western regions ofthe United States. Our specific policies designed to maintain this focus include:
• using investments in new and expanded services to drive use of our facilities;
• seeking rate increases from managed care payers commensurate with increases in our underlyingcosts to provide high quality services;
• managing operating expenses by, among other methods, leveraging our scale;
• seeking cost savings by reducing variations in our patient care and support processes and reducingour discretionary operating expenses; and
• considering divesting non-core assets, where appropriate.
• Leverage: We expect to have significant indebtedness for the foreseeable future. However, we expectto:
• manage our floating interest rate exposure through our $7.1 billion aggregate notional amount ofpay-fixed rate swap agreements related to our senior secured credit facilities debt at December 31,2010; and
• endeavor to improve our credit quality over time.
• Capital Expenditures: We plan to maintain a disciplined capital expenditure approach by:
• targeting new investments with potentially high returns;
61

• deploying capital strategically to improve our competitive position and market share and to enhanceour operations; and
• managing discretionary capital expenditures based on the strength of our cash flows.
Operational Factors
In pursuing our business and our financial policies and objectives, we pay close attention to a number ofperformance measures and operational factors.
Our revenues depend upon inpatient occupancy levels, the ancillary services and therapy programsordered by physicians and provided to patients, the volume of outpatient procedures and the charges andnegotiated payment rates for such services. Our expenses depend upon the levels of salaries and benefits paidto our employees, the cost of supplies and the costs of other operating expenses. To monitor these variables,we use a variety of metrics, including those described below.
• Volume Measures:
• admissions, which is the total number of patients admitted to our hospitals and which we use as ameasure of inpatient volume;
• equivalent admissions, which is a measure of patient volume that takes into account both inpatientand outpatient volume;
• the payer mix of our admissions, i.e., the percentage of our admissions related to Medicare,Medicaid, managed Medicare, managed Medicaid, managed care and other insurers, and uninsuredpatients;
• emergency room visits;
• inpatient and outpatient surgeries; and
• the average daily census of patients in our hospital beds.
• Pricing Measures:
• revenue per equivalent admission; and
• revenue, minus our provision for doubtful accounts, per equivalent admission.
• Expense Measures:
• salaries and benefits per equivalent admission;
• supply costs per equivalent admission;
• other operating expenses (including contract services, professional fees, repairs and maintenance,rents and leases, utilities, insurance and nonincome taxes) per equivalent admission; and
• operating expenses, minus our provision for doubtful accounts, per equivalent admission.
We set forth the volume measures described above, except for payer mix, for the years endedDecember 31, 2010, 2009, 2008, 2007 and 2006 under the heading “Operating Data” in “Selected FinancialData.” We give details about the payer mix for the years ended December 31, 2010, 2009 and 2008 in“Management’s Discussion and Analysis of Financial Condition and Results of Operations — Results ofOperations — Revenue/Volume Trends.”
The pricing and expense measures described above can be derived by dividing (1) the amounts from theapplicable line items in our income statement (minus our provision for doubtful accounts, where indicated) by(2) equivalent admissions, which are set forth under the heading “Operating Data” in “Selected FinancialData.”
62
Business Segments
Our company operations were structured in three geographically organized groups at December 31, 2010:
• Western Group. The Western Group was comprised of the markets in Alaska, California, Colorado,Idaho, Kansas (south central portion), Nevada, Oklahoma, Texas and Utah. As of December 31, 2010,there were 56 consolidating hospitals within the Western Group. The Western Group includes seven ofour non-consolidating hospitals, with respect to which major strategic and operating decisions areshared equally with non-HCA partners. For the year ended December 31, 2010, the Western Groupgenerated revenues of $13.467 billion.
• Central Group. The Central Group was comprised of the markets in Indiana, Georgia (northernportion), Kansas (eastern portion), Kentucky, Louisiana, Mississippi, Missouri, New Hampshire,Tennessee and Virginia. As of December 31, 2010, there were 46 consolidating hospitals within theCentral Group. The Central Group includes one of our non-consolidating hospitals, with respect towhich major strategic and operating decisions are shared equally with non-HCA partners. For the yearended December 31, 2010, the Central Group generated revenues of $7.222 billion.
• Eastern Group. The Eastern Group was comprised of the markets in Florida, Georgia (southernportion) and South Carolina. As of December 31, 2010, there were 48 consolidating hospitals withinthe Eastern Group. For the year ended December 31, 2010, the Eastern Group generated revenues of$9.006 billion.
We also owned and operated six hospitals in England as of December 31, 2010, which are included inour Corporate and other group. These international facilities generated revenues of $792 million for the yearended December 31, 2010. Our divisions and market structures are designed to augment our market-basedstrategy to provide integrated services to their respective community. This structure allows our management tofocus on manageable groupings of hospitals and provide them with direct support.
Note 14 to our consolidated financial statements contains information by segment on our revenues, equityin earnings of affiliates, adjusted segment EBITDA and depreciation and amortization for the years endedDecember 31, 2010, 2009 and 2008.
On February 11, 2011, we announced an internal reorganization, which includes the creation of a newsubsidiary to provide business services to other health care companies, a new structuring of provideroperations and a further integration of clinical quality performance with physician practice services.
Health Care Facilities
We currently own, manage or operate hospitals; freestanding surgery centers; diagnostic and imagingcenters; radiation and oncology therapy centers; comprehensive rehabilitation and physical therapy centers;and various other facilities.
At December 31, 2010, we owned and operated 151 general, acute care hospitals with 38,321 licensedbeds, and an additional seven general, acute care hospitals with 2,269 licensed beds are operated through jointventures, which are accounted for using the equity method. Most of our general, acute care hospitals providemedical and surgical services, including inpatient care, intensive care, cardiac care, diagnostic services andemergency services. The general, acute care hospitals also provide outpatient services such as outpatientsurgery, laboratory, radiology, respiratory therapy, cardiology and physical therapy. Each hospital has anorganized medical staff and a local board of trustees or governing board, made up of members of the localcommunity.
Our hospitals do not typically engage in extensive medical research and education programs. However,some of our hospitals are affiliated with medical schools and may participate in the clinical rotation ofmedical interns and residents and other education programs.
63
At December 31, 2010, we operated five psychiatric hospitals with 506 licensed beds. Our psychiatrichospitals provide therapeutic programs including child, adolescent and adult psychiatric care, adult andadolescent alcohol and drug abuse treatment and counseling.
We also operate outpatient health care facilities which include freestanding ambulatory surgery centers(“ASCs”), diagnostic and imaging centers, comprehensive outpatient rehabilitation and physical therapycenters, outpatient radiation and oncology therapy centers and various other facilities. These outpatientservices are an integral component of our strategy to develop comprehensive health care networks in selectcommunities. Most of our ASCs are operated through partnerships or limited liability companies, withmajority ownership of each partnership or limited liability company typically held by a general partner orsubsidiary that is an affiliate of HCA.
Certain of our affiliates provide a variety of management services to our health care facilities, includingpatient safety programs; ethics and compliance programs; national supply contracts; equipment purchasing andleasing contracts; accounting, financial and clinical systems; governmental reimbursement assistance;construction planning and coordination; information technology systems and solutions; legal counsel; humanresources services; and internal audit services.
Sources of Revenue
Hospital revenues depend upon inpatient occupancy levels, the medical and ancillary services ordered byphysicians and provided to patients, the volume of outpatient procedures and the charges or payment rates forsuch services. Charges and reimbursement rates for inpatient services vary significantly depending on the typeof payer, the type of service (e.g., medical/surgical, intensive care or psychiatric) and the geographic locationof the hospital. Inpatient occupancy levels fluctuate for various reasons, many of which are beyond ourcontrol.
We receive payment for patient services from the federal government under the Medicare program, stategovernments under their respective Medicaid or similar programs, managed care plans, private insurers anddirectly from patients. The approximate percentages of our revenues from such sources were as follows:
2010 2009 2008
Year EndedDecember 31,
Medicare . . . . . . . . . . . . . . . . . . . . . . . . . . . . . . . . . . . . . . . . . . . . . . . . . . . . . 24% 23% 23%
Managed Medicare . . . . . . . . . . . . . . . . . . . . . . . . . . . . . . . . . . . . . . . . . . . . . 7 7 6
Medicaid . . . . . . . . . . . . . . . . . . . . . . . . . . . . . . . . . . . . . . . . . . . . . . . . . . . . . 6 6 5
Managed Medicaid . . . . . . . . . . . . . . . . . . . . . . . . . . . . . . . . . . . . . . . . . . . . . 4 4 3
Managed care and other insurers . . . . . . . . . . . . . . . . . . . . . . . . . . . . . . . . . . . 53 52 53
Uninsured . . . . . . . . . . . . . . . . . . . . . . . . . . . . . . . . . . . . . . . . . . . . . . . . . . . . 6 8 10
Total . . . . . . . . . . . . . . . . . . . . . . . . . . . . . . . . . . . . . . . . . . . . . . . . . . . . . . 100% 100% 100%
Medicare is a federal program that provides certain hospital and medical insurance benefits to personsage 65 and over, some disabled persons, persons with end-stage renal disease and persons with Lou Gehrig’sDisease. Medicaid is a federal-state program, administered by the states, which provides hospital and medicalbenefits to qualifying individuals who are unable to afford health care. All of our general, acute care hospitalslocated in the United States are certified as health care services providers for persons covered under Medicareand Medicaid programs. Amounts received under Medicare and Medicaid programs are generally significantlyless than established hospital gross charges for the services provided.
Our hospitals generally offer discounts from established charges to certain group purchasers of healthcare services, including private insurance companies, employers, HMOs, PPOs and other managed care plans.These discount programs generally limit our ability to increase revenues in response to increasing costs. See“Business — Competition.” Patients are generally not responsible for the total difference between establishedhospital gross charges and amounts reimbursed for such services under Medicare, Medicaid, HMOs or PPOs
64
and other managed care plans, but are responsible to the extent of any exclusions, deductibles or coinsurancefeatures of their coverage. The amount of such exclusions, deductibles and coinsurance continues to increase.Collection of amounts due from individuals is typically more difficult than from governmental or third-partypayers. We provide discounts to uninsured patients who do not qualify for Medicaid or charity care under ourcharity care policy. These discounts are similar to those provided to many local managed care plans. Inimplementing the discount policy, we attempt to qualify uninsured patients for Medicaid, other federal or stateassistance or charity care under our charity care policy. If an uninsured patient does not qualify for theseprograms, the uninsured discount is applied.
Medicare
Inpatient Acute Care
Under the Medicare program, we receive reimbursement under a prospective payment system (“PPS”) forgeneral, acute care hospital inpatient services. Under the hospital inpatient PPS, fixed payment amounts perinpatient discharge are established based on the patient’s assigned MS-DRG. CMS completed a two-yeartransition to full implementation of MS-DRGs to replace the previously used Medicare diagnosis relatedgroups in an effort to better recognize severity of illness in Medicare payment rates. MS-DRGs classifytreatments for illnesses according to the estimated intensity of hospital resources necessary to furnish care foreach principal diagnosis. MS-DRG weights represent the average resources for a given MS-DRG relative tothe average resources for all MS-DRGs. MS-DRG payments are adjusted for area wage differentials.Hospitals, other than those defined as “new,” receive PPS reimbursement for inpatient capital costs based onMS-DRG weights multiplied by a geographically adjusted federal rate. When the cost to treat certain patientsfalls well outside the normal distribution, providers typically receive additional “outlier” payments.
MS-DRG rates are updated and MS-DRG weights are recalibrated using cost relative weights each federalfiscal year (which begins October 1). The index used to update the MS-DRG rates (the “market basket”) givesconsideration to the inflation experienced by hospitals and entities outside the health care industry inpurchasing goods and services. The Health Reform Law provides for annual decreases to the market basket,including a 0.25% reduction in 2010 for discharges occurring on or after April 1, 2010. The Health ReformLaw also provides for the following reductions to the market basket update for each of the following federalfiscal years: 0.25% in 2011, 0.1% in 2012 and 2013, 0.3% in 2014, 0.2% in 2015 and 2016 and 0.75% in2017, 2018 and 2019. For federal fiscal year 2012 and each subsequent federal fiscal year, the Health ReformLaw provides for the annual market basket update to be further reduced by a productivity adjustment. Theamount of that reduction will be the projected, nationwide productivity gains over the preceding 10 years. Todetermine the projection, HHS will use the Bureau of Labor Statistics (“BLS”) 10-year moving average ofchanges in specified economy-wide productivity (the BLS data is typically a few years old). The HealthReform Law does not contain guidelines for use by HHS in projecting the productivity figure. Based upon thelatest available data, federal fiscal year 2012 market basket reductions resulting from this productivityadjustment are likely to range from 1.0% to 1.4%. CMS estimates that the combined market basket andproductivity adjustments will reduce Medicare payments under the inpatient PPS by $112.6 billion from 2010to 2019. A decrease in payments rates or an increase in rates that is below the increase in our costs mayadversely affect the results of our operations.
For federal fiscal year 2010, CMS initially set the MS-DRG rate increase at the full market basket of2.1%, but CMS reduced the increase to 1.85% for discharges occurring on or after April 1, 2010, as requiredby the Health Reform Law. For federal fiscal year 2011, CMS increased the MS-DRG rate for federal fiscalyear 2011 by 2.35%, representing the full market basket of 2.6% minus the 0.25% reduction required by theHealth Reform Law. CMS also applied a documentation and coding adjustment of negative 2.9% in federalfiscal year 2011 to account for increases in aggregate payments during implementation of the MS-DRGsystem. This reduction represents half of the documentation and coding adjustment that CMS intends toimplement. CMS plans to recover the remaining 2.9% and interest in federal fiscal year 2012. The marketbasket update and the documentation and coding adjustment together result in an aggregate market basketadjustment for federal fiscal year 2011 of negative 0.55%. CMS has also announced that an additionalprospective negative adjustment of 3.9% will be needed to avoid increased Medicare spending unrelated to
65
patient severity of illness. CMS did not implement this additional 3.9% reduction in federal fiscal year 2011but has stated that it will be required in the future.
Further realignments in the MS-DRG system could also reduce the payments we receive for certainspecialties, including cardiology and orthopedics. CMS has focused on payment levels for such specialties inrecent years in part because of the proliferation of specialty hospitals. Changes in the payments received forspecialty services could have an adverse effect on our results of operations.
The Medicare Prescription Drug, Improvement, and Modernization Act of 2003 (“MMA”) provides forhospitals to receive a 2% reduction to their market basket updates if they fail to submit data for patient carequality indicators to the Secretary of HHS. As required by the Deficit Reduction Act of 2005 (“DRA 2005”),CMS has expanded, through a series of rulemakings, the number of quality measures that must be reported toavoid the market basket reduction. In federal fiscal year 2011, CMS requires hospitals to report 55 qualitymeasures in order to avoid the market basket reduction for inpatient PPS payments in federal fiscal year 2012.All of our hospitals paid under the Medicare inpatient PPS are participating in the quality initiative bysubmitting the requested quality data. While we will endeavor to comply with all data submissionrequirements as additional requirements continue to be added, our submissions may not be deemed timely orsufficient to entitle us to the full market basket adjustment for all of our hospitals.
As part of CMS’ goal of transforming Medicare from a passive payer to an active purchaser of qualitygoods and services, for discharges occurring after October 1, 2008, Medicare no longer assigns an inpatienthospital discharge to a higher paying MS-DRG if a selected HAC was not present on admission. In thissituation, the case is paid as though the secondary diagnosis was not present. Currently, there are tencategories of conditions on the list of HACs. In addition, CMS has established three National CoverageDeterminations that prohibit Medicare reimbursement for erroneous surgical procedures performed on aninpatient or outpatient basis. The Health Reform Law provides for reduced payments based on a hospital’sHAC rates. Beginning in federal fiscal year 2015, the 25% of hospitals with the worst national risk-adjustedHAC rates in the previous year will receive a 1% reduction in their total inpatient operating Medicarepayments. In addition, effective July 1, 2011, the Health Reform Law prohibits the use of federal funds underthe Medicaid program to reimburse providers for medical services provided to treat HACs.
The Health Reform Law also provides for reduced payments to hospitals based on readmission rates.Beginning in federal fiscal year 2013, inpatient payments will be reduced if a hospital experiences “excessive”readmissions within a time period specified by HHS from the date of discharge for heart attack, heart failure,pneumonia or other conditions designated by HHS. Hospitals with what HHS defines as excessivereadmissions for these conditions will receive reduced payments for all inpatient discharges, not justdischarges relating to the conditions subject to the excessive readmission standard. Each hospital’sperformance will be publicly reported by HHS. HHS has the discretion to determine what “excessive”readmissions means and other terms and conditions of this program.
The Health Reform Law additionally establishes a value-based purchasing program to further linkpayments to quality and efficiency. In federal fiscal year 2013, HHS is directed to implement a value-basedpurchasing program for inpatient hospital services. Beginning in federal fiscal year 2013, CMS will reduce theinpatient PPS payment amount for all discharges by the following: 1% for 2013; 1.25% for 2014; 1.5% for2015; 1.75% for 2016; and 2% for 2017 and subsequent years. For each federal fiscal year, the total amountcollected from these reductions will be pooled and used to fund payments to reward hospitals that meet certainquality performance standards established by HHS. HHS will determine the quality performance measures, thestandards hospitals must achieve in order to meet the quality performance measures and the methodology forcalculating payments to hospitals that meet the required quality threshold. HHS will also determine theamount each hospital that meets or exceeds the quality performance standards will receive from the pool ofdollars created by the reductions related to the value-based purchasing program. On January 7, 2011, CMSissued a proposed rule for the value-based purchasing program that would use 17 clinical process of caremeasures and eight dimensions of a patient’s experience of care using the HCAHPS survey to determineincentive payments for federal fiscal year 2013. As proposed, the incentive payments would be calculatedbased on a combination of measures of hospitals’ achievement of the performance standards and their
66
improvement in meeting the performance standards compared to prior periods. To determine payments infederal fiscal year 2013, the baseline performance period (measurement standard) as proposed would beJuly 1, 2009 through March 31, 2010. To determine whether hospitals meet performance standards, CMSwould compare each hospital’s performance in the period July 1, 2011 through March 31, 2012 to itsperformance in the baseline performance period. CMS has not yet proposed specific threshold values for theperformance standards. CMS also proposes to add three outcome measures for federal fiscal year 2014, forwhich the performance period would be July 1, 2011 through December 31, 2012 and the baselineperformance period would be July 1, 2008 through December 31, 2009.
Historically, the Medicare program has set aside 5.10% of Medicare inpatient payments to pay for outliercases. For federal fiscal year 2010, CMS established an outlier threshold of $23,140, and for federal fiscalyear 2011, CMS reduced the outlier threshold to $23,075. We do not anticipate that the decrease to the outlierthreshold for federal fiscal year 2011 will have a material impact on our results of operations.
Outpatient
CMS reimburses hospital outpatient services (and certain Medicare Part B services furnished to hospitalinpatients who have no Part A coverage) on a PPS basis. CMS uses fee schedules to pay for physical,occupational and speech therapies, durable medical equipment, clinical diagnostic laboratory services andnonimplantable orthotics and prosthetics, freestanding surgery centers services and services provided byindependent diagnostic testing facilities.
Hospital outpatient services paid under PPS are classified into groups called ambulatory paymentclassifications (“APCs”). Services for each APC are similar clinically and in terms of the resources they require. Apayment rate is established for each APC. Depending on the services provided, a hospital may be paid for morethan one APC for a patient visit. The APC payment rates were updated for calendar years 2008 and 2009 bymarket baskets of 3.30% and 3.60%, respectively. CMS updated payment rates for calendar year 2010 by the fullmarket basket of 2.1%. However, the Health Reform Law includes a 0.25% reduction to the market basket for2010. The Health Reform Law also provides for the following reductions to the market basket update for each ofthe following calendar years: 0.25% in 2011, 0.1% in 2012 and 2013, 0.3% in 2014, 0.2% in 2015 and 2016 and0.75% in 2017, 2018 and 2019. For calendar year 2011, CMS implemented a market basket update of 2.6%. Withthe 0.25% reduction required by the Health Reform Law, this update results in a market basket increase of 2.35%.For calendar year 2012 and each subsequent calendar year, the Health Reform Law provides for an annual marketbasket update to be further reduced by a productivity adjustment. The amount of that reduction will be theprojected, nationwide productivity gains over the preceding 10 years. To determine the projection, HHS will usethe BLS 10-year moving average of changes in specified economy-wide productivity (the BLS data is typically afew years old). The Health Reform Law does not contain guidelines for use by HHS in projecting the productivityfigure. However, CMS estimates that the combined market basket and productivity adjustments will reduceMedicare payments under the outpatient PPS by $26.3 billion from 2010 to 2019. CMS continues to requirehospitals to submit quality data relating to outpatient care to avoid receiving a 2% reduction to the market basketupdate under the outpatient PPS. CMS required hospitals to report data on 11 quality measures in calendar year2010 for the payment determination in calendar year 2011 and requires hospitals to report 15 quality measures incalendar year 2011 to avoid reduced payments in calendar year 2012.
Rehabilitation
CMS reimburses inpatient rehabilitation facilities (“IRFs”) on a PPS basis. Under IRF PPS, patients areclassified into case mix groups based upon impairment, age, comorbidities (additional diseases or disorders fromwhich the patient suffers) and functional capability. IRFs are paid a predetermined amount per discharge that reflectsthe patient’s case mix group and is adjusted for area wage levels, low-income patients, rural areas and high-costoutliers. CMS provided for a market basket update of 2.5% for federal fiscal year 2010. However, the Health ReformLaw requires a 0.25% reduction to the market basket for 2010 for discharges occurring on or after April 1, 2010. TheHealth Reform Law also provides for the following reductions to the market basket update for each of the followingfederal fiscal years: 0.25% in 2011, 0.1% in 2012 and 2013, 0.3% in 2014, 0.2% in 2015 and 2016 and 0.75% in2017, 2018 and 2019. For federal fiscal year 2011, CMS implemented a market basket update of 2.5%. With the0.25% reduction required by the Health Reform Law, this update results in a market basket increase of 2.25% for
67
federal fiscal year 2011. For federal fiscal year 2012 and each subsequent federal fiscal year, the Health Reform Lawprovides for the annual market basket update to be further reduced by a productivity adjustment. The amount of thatreduction will be the projected, nationwide productivity gains over the preceding 10 years. To determine theprojection, HHS will use the BLS 10-year moving average of changes in specified economy-wide productivity (theBLS data is typically a few years old). The Health Reform Law does not contain guidelines for use by HHS inprojecting the productivity figure. However, CMS estimates that the combined market basket and productivityadjustments will reduce Medicare payments under the IRF PPS by $5.7 billion from 2010 to 2019. Beginning infederal fiscal year 2014, IRFs will be required to report quality measures to CMS or will receive a two percentagepoint reduction to the market basket update. As of December 31, 2010, we had one rehabilitation hospital, which isoperated through a joint venture, and 43 hospital rehabilitation units.
On May 7, 2004, CMS published a final rule to change the criteria for being classified as an IRF.Pursuant to that final rule, 75% of a facility’s inpatients over a given year had to have been treated for at leastone of 10 specified conditions, and a subsequent regulation expanded the number of specified conditions to13. Since then, several statutory and regulatory adjustments have been made to the rule, including adjustmentsto the percentage of a facility’s patients that must be treated for one of the 13 specified conditions. Currently,the compliance threshold is set by statute at 60%. Implementation of this 60% threshold has reduced our IRFadmissions and can be expected to continue to restrict the treatment of patients whose medical conditions donot meet any of the 13 approved conditions. In addition, effective January 1, 2010, IRFs must meet additionalcoverage criteria, including patient selection and care requirements relating to pre-admission screenings, post-admission evaluations, ongoing coordination of care and involvement of rehabilitation physicians. A facilitythat fails to meet the 60% threshold or other criteria to be classified as an IRF will be paid under the acutecare hospital inpatient or outpatient PPS, which generally provide for lower payment amounts.
Psychiatric
Inpatient hospital services furnished in psychiatric hospitals and psychiatric units of general, acute carehospitals and critical access hospitals are reimbursed under a prospective payment system (“IPF PPS”), a perdiem payment, with adjustments to account for certain patient and facility characteristics. IPF PPS contains an“outlier” policy for extraordinarily costly cases and an adjustment to a facility’s base payment if it maintains afull-service emergency department. CMS has established the IPF PPS payment rate in a manner intended to bebudget neutral and has adopted a July 1 update cycle, with each twelve month period referred to as a “rateyear.” CMS issued a proposed rule that includes changing the IPF PPS from the rate year update cycle to afiscal year schedule. If implemented as proposed, the rates for 2012 would be effective from July 1, 2011through September 30, 2012, with future updates coinciding with the federal fiscal year (from October 1through September 30). The rehabilitation, psychiatric and long-term care (“RPL”) market basket update isused to update the IPF PPS. The annual RPL market basket update for rate year 2010 was 2.1%, and theannual RPL market basket update for rate year 2011 is 2.4%. However, the Health Reform Law includes a0.25% reduction to the market basket for rate year 2010 and again in 2011. The Health Reform Law alsoprovides for the following reductions to the market basket update for rate years that begin in the followingcalendar years: 0.1% in 2012 and 2013, 0.3% in 2014, 0.2% in 2015 and 2016 and 0.75% in 2017, 2018 and2019. For rate year 2012 and each subsequent rate year, the Health Reform Law provides for the annualmarket basket update to be further reduced by a productivity adjustment. The amount of that reduction will bethe projected, nationwide productivity gains over the preceding 10 years. To determine the projection, HHSwill use the BLS 10-year moving average of changes in specified economy-wide productivity (the BLS data istypically a few years old). The Health Reform Law does not contain guidelines for use by HHS in projectingthe productivity figure. However, CMS estimates that the combined market basket and productivityadjustments will reduce Medicare payments under the IPF PPS by $4.3 billion from 2010 to 2019. In aproposed rule, CMS proposes a market basket update of 3.0% for rate year 2012. If implemented as proposed,and with the 0.25% reduction required by the Health Reform Law, this would result in a market basket updateof 2.75%. As of December 31, 2010, we had five psychiatric hospitals and 35 hospital psychiatric units.
Ambulatory Surgery Centers
CMS reimburses ASCs using a predetermined fee schedule. Reimbursements for ASC overhead costs arelimited to no more than the overhead costs paid to hospital outpatient departments under the Medicare hospital
68
outpatient PPS for the same procedure. Effective January 1, 2008, ASC payment groups increased from nineclinically disparate payment groups to an extensive list of covered surgical procedures among the APCs usedunder the outpatient PPS for these surgical services. Because the new payment system has a significant impacton payments for certain procedures, for services previously in the nine payment groups, CMS has establisheda four-year transition period for implementing the required payment rates. Moreover, if CMS determines that aprocedure is commonly performed in a physician’s office, the ASC reimbursement for that procedure islimited to the reimbursement allowable under the Medicare Part B Physician Fee Schedule, with limitedexceptions. In addition, all surgical procedures, other than those that pose a significant safety risk or generallyrequire an overnight stay, are payable as ASC procedures. As a result, more Medicare procedures nowperformed in hospitals may be moved to ASCs, reducing surgical volume in our hospitals. Also, moreMedicare procedures now performed in ASCs may be moved to physicians’ offices. Commercial third-partypayers may adopt similar policies. The Health Reform Law requires HHS to issue a plan by January 1, 2011for developing a value-based purchasing program for ASCs, but HHS has not yet publicly issued this plan.Such a program may further impact Medicare reimbursement of ASCs or increase our operating costs in orderto satisfy the value-based standards. For federal fiscal year 2011 and each subsequent federal fiscal year, theHealth Reform Law provides for the annual market basket update to be reduced by a productivity adjustment.The amount of that reduction will be the projected nationwide productivity gains over the preceding 10 years.To determine the projection, HHS will use the BLS 10-year moving average of changes in specified economy-wide productivity (the BLS data is typically a few years old).
Physician Services
Physician services are reimbursed under the physician fee schedule (“PFS”) system, under which CMShas assigned a national relative value unit (“RVU”) to most medical procedures and services that reflects thevarious resources required by a physician to provide the services relative to all other services. Each RVU iscalculated based on a combination of work required in terms of time and intensity of effort for the service,practice expense (overhead) attributable to the service and malpractice insurance expense attributable to theservice. These three elements are each modified by a geographic adjustment factor to account for localpractice costs then aggregated. The aggregated amount is multiplied by a conversion factor that accounts forinflation and targeted growth in Medicare expenditures (as calculated by the SGR) to arrive at the paymentamount for each service. While RVUs for various services may change in a given year, any alterations arerequired by statute to be virtually budget neutral, such that total payments made under the PFS may not differby more than $20 million from what payments would have been if adjustments were not made.
The PFS rates are adjusted each year, and reductions in both current and future payments are anticipated.The SGR formula, if implemented as mandated by statute, would result in significant reductions to paymentsunder the PFS. Since 2003, the U.S. Congress has passed multiple legislative acts delaying application of theSGR to the PFS. For calendar year 2011, CMS issued a final rule that would have applied the SGR andresulted in an aggregate reduction of 24.9% to all physician payments under the PFS for federal fiscal year2011. On December 15, 2010, President Obama signed legislation delaying application of the SGR untilJanuary 1, 2012. We cannot predict whether the U.S. Congress will intervene to prevent this reduction topayments in the future.
Other
Under PPS, the payment rates are adjusted for the area differences in wage levels by a factor (“wage index”)reflecting the relative wage level in the geographic area compared to the national average wage level. Beginning infederal fiscal year 2007, CMS adjusted 100% of the wage index factor for occupational mix. The redistributiveimpact of wage index changes, while slightly negative in the aggregate, is not anticipated to have a materialfinancial impact for 2011. However, the Health Reform Law requires HHS to report to Congress by December 31,2011 with recommendations on how to comprehensively reform the Medicare wage index system.
As required by the MMA, CMS is implementing contractor reform whereby CMS has competitively bidthe Medicare fiscal intermediary and Medicare carrier functions to 15 Medicare Administrative Contractors(“MACs”), which are geographically assigned and service both Part A and Part B providers within a given
69
jurisdiction. Although CMS has awarded initial contracts to all 15 MAC jurisdictions, full transition to theMAC jurisdictions has been delayed due to CMS resoliciting some bids and implementing other correctiveactions in response to filed protests. While chain providers had the option of having all hospitals use onehome office MAC, HCA chose to use the MACs assigned to the geographic areas in which our hospitals arelocated. The individual MAC jurisdictions are in varying phases of transition. During the transition periods andfor a potentially unforeseen period thereafter, all of these changes could impact claims processing functionsand the resulting cash flow; however, we are unable to predict the impact at this time.
Under the RAC program, CMS contracts with RACs on a contingency fee basis to conduct post-paymentreviews to detect and correct improper payments in the fee-for-service Medicare program. The RAC programwas originally limited to certain states, but in 2010, CMS implemented the RAC program on a permanent,nationwide basis as required by statute.
The U.S. Congress has not permanently addressed the SGR reductions in physician compensation underthe PFS. Any repeal of the SGR may be offset by reductions in Medicare payments to other types ofproviders.
Managed Medicare
Managed Medicare plans relate to situations where a private company contracts with CMS to providemembers with Medicare Part A, Part B and Part D benefits. Managed Medicare plans can be structured asHMOs, PPOs or private fee-for-service plans. The Medicare program allows beneficiaries to choose enrollmentin certain managed Medicare plans. In 2003, MMA increased reimbursement to managed Medicare plans andexpanded Medicare beneficiaries’ health care options. Since 2003, the number of beneficiaries choosing toreceive their Medicare benefits through such plans has increased. However, the Medicare Improvements forPatients and Providers Act of 2008 imposed new restrictions and implemented focused cuts to certain managedMedicare plans. In addition, the Health Reform Law reduces, over a three year period, premium payments tomanaged Medicare plans such that CMS’ managed care per capita premium payments are, on average, equalto traditional Medicare. The Health Reform Law also implements fee payment adjustments based on servicebenchmarks and quality ratings. The CBO has estimated that, as a result of these changes, payments to planswill be reduced by $138 billion between 2010 and 2019, while CMS has estimated the reduction to be $145billion. In addition, the Health Reform Law expands the RAC program to include managed Medicare plans. Inlight of the current economic downturn and the Health Reform Law, managed Medicare plans may experiencereduced premium payments, which may lead to decreased enrollment in such plans.
Medicaid
Medicaid programs are funded jointly by the federal government and the states and are administered bystates under approved plans. Most state Medicaid program payments are made under a PPS or are based onnegotiated payment levels with individual hospitals. Medicaid reimbursement is often less than a hospital’scost of services. The Health Reform Law also requires states to expand Medicaid coverage to all individualsunder age 65 with incomes up to 133% of the federal poverty level (“FPL”) by 2014. However, the HealthReform Law also requires states to apply a “5% income disregard” to the Medicaid eligibility standard, so thatMedicaid eligibility will effectively be extended to those with incomes up to 138% of the FPL. In addition,effective July 1, 2011, the Health Reform Law will prohibit the use of federal funds under the Medicaidprogram to reimburse providers for medical assistance provided to treat HACs. On February 17, 2011, CMSpublished a proposed rule that would require each state Medicaid program to deny payments to providers forthe treatment of HACs designated by CMS and any additional preventable conditions that may be designatedby the state.
Since most states must operate with balanced budgets and since the Medicaid program is often the state’slargest program, states can be expected to adopt or consider adopting legislation designed to reduce theirMedicaid expenditures. The current economic downturn has increased the budgetary pressures on most states,and these budgetary pressures have resulted and likely will continue to result in decreased spending, ordecreased spending growth, for Medicaid programs in many states. ARRA allocated approximately $87.0
70
billion to temporarily increase the share of program costs paid by the federal government to fund each state’sMedicaid program. Although initially scheduled to expire at the end of 2010, Congress has allocatedadditional funds to extend this increased federal funding to states through June 2011. These funds havehelped avoid more extensive program and reimbursement cuts, but the expiration of the increased federalfunding could result in significant reductions to state Medicaid programs.
Further, as permitted by law, certain states in which we operate have adopted broad-based provider taxesto fund the non-federal share of Medicaid programs. Many states have also adopted, or are considering,legislation designed to reduce coverage, enroll Medicaid recipients in managed care programs and/or imposeadditional taxes on hospitals to help finance or expand the states’ Medicaid systems. Effective March 23,2010, the Health Reform Law requires states to at least maintain Medicaid eligibility standards establishedprior to the enactment of the law for adults until January 1, 2014 and for children until October 1, 2019.However, states with budget deficits may seek a waiver from this requirement to address eligibility standardsthat apply to adults making more than 133% of the FPL.
Through DRA 2005, Congress has expanded the federal government’s involvement in fighting fraud,waste and abuse in the Medicaid program by creating the Medicaid Integrity Program. Among other things,DRA 2005 requires CMS to employ MICs, to perform post-payment audits of Medicaid claims and identifyoverpayments. MICs are assigned to five geographic regions and have commenced audits in states assigned tothose regions. The Health Reform Law increases federal funding for the MIC program for federal fiscal year2011 and later years. In addition to MICs, several other contractors and state Medicaid agencies haveincreased their review activities. The Health Reform Law expands the RAC program’s scope to includeMedicaid claims.
Managed Medicaid
Managed Medicaid programs enable states to contract with one or more entities for patient enrollment,care management and claims adjudication. The states usually do not relinquish program responsibilities forfinancing, eligibility criteria and core benefit plan design. We generally contract directly with one of thedesignated entities, usually a managed care organization. The provisions of these programs are state-specific.
Enrollment in managed Medicaid plans has increased in recent years, as state governments seek to controlthe cost of Medicaid programs. However, general economic conditions in the states in which we operate mayrequire reductions in premium payments to these plans and may reduce enrollment in these plans.
Electronic Health Records
ARRA provides for Medicare and Medicaid incentive payments beginning in federal fiscal year 2011 foreligible hospitals and calendar year 2011 for eligible professionals that adopt and meaningfully use certifiedEHR technology. A total of at least $20 billion in incentives is being made available through the Medicare andMedicaid EHR incentive programs to eligible hospitals and eligible professionals in the adoption of EHRs.
Under the Medicare incentive program, acute care hospitals that demonstrate meaningful use will receiveincentive payments for up to four fiscal years. The Medicare incentive payment amount is the product of threefactors: (1) an initial amount comprised of a base amount of $2,000,000 plus $200 for each acute careinpatient discharge during a payment year, beginning with a hospital’s 1,150th discharge of the year andending with a hospital’s 23,000th discharge of the year; (2) the “Medicare share,” which is the sum ofMedicare Part A and Part C acute care inpatient-bed-days divided by the product of the total inpatient-bed-days and a charity care factor; and (3) a transition factor applicable to the payment year. In order to maximizetheir incentive payments, acute care hospitals must participate in the incentive program by federal fiscal year2013. Beginning in federal fiscal year 2015, acute care hospitals that fail to demonstrate meaningful use ofcertified EHR technology will receive reduced market basket updates under inpatient PPS.
Eligible professionals who demonstrate meaningful use are entitled to incentive payments for up to fivepayment years in an amount equal to 75% of their estimated Medicare allowed charges for coveredprofessional services furnished during the relevant calendar year, subject to an annual limit. Eligible
71
professionals must participate in the incentive payment program by calendar year 2012 in order to maximizetheir incentive payments and must participate by calendar year 2014 in order to receive any incentivepayments. Beginning in calendar year 2015, eligible professionals who do not demonstrate meaningful use ofcertified EHR technology will face Medicare payment reductions.
The Medicaid EHR incentive program is voluntary for states to implement. For participating states, theMedicaid EHR incentive program will provide incentive payments for acute care hospitals and eligibleprofessionals that meet certain volume percentages of Medicaid patients as well as children’s hospitals.Providers may only participate in a single state’s Medicaid EHR incentive program. Eligible professionals canonly participate in either the Medicaid incentive program or the Medicare incentive program and can changethis election only one time. Hospitals may participate in both the Medicare and Medicaid incentive programs.
To qualify for incentive payments under the Medicaid program, providers must adopt, implement,upgrade or demonstrate meaningful use of, certified EHR technology during their first participation year orsuccessfully demonstrate meaningful use of certified EHR technology in subsequent participation years.Payments may be received for up to six participation years. For hospitals, the aggregate Medicaid EHRincentive amount is the product of two factors: (1) the overall EHR amount which is comprised of a baseamount of $2,000,000 plus a discharge-related amount, multiplied by the Medicare share (which is set at oneby statute) multiplied by a transition factor, and (2) the “Medicaid share,” which is the estimated Medicaidinpatient-bed days plus estimated Medicaid managed care inpatient bed-days, divided by the product of theestimated total inpatient bed-days and a charity care factor. Under the Medicaid incentive program, eligibleprofessionals may receive payments based on their EHR costs, up to total amount of $63,750, or forpediatricians, $42,500. There is no penalty for hospitals or professionals under Medicaid for failing to meetEHR meaningful use requirements.
Accountable Care Organizations and Pilot Projects
The Health Reform Law requires HHS to establish a Medicare Shared Savings Program that promotesaccountability and coordination of care through the creation of ACOs, beginning no later than January 1,2012. The program will allow providers (including hospitals), physicians and other designated professionalsand suppliers to form ACOs and voluntarily work together to invest in infrastructure and redesign deliveryprocesses to achieve high quality and efficient delivery of services. The program is intended to producesavings as a result of improved quality and operational efficiency. ACOs that achieve quality performancestandards established by HHS will be eligible to share in a portion of the amounts saved by the Medicareprogram. HHS has significant discretion to determine key elements of the program, including what stepsproviders must take to be considered an ACO, how to decide if Medicare program savings have occurred, andwhat portion of such savings will be paid to ACOs. In addition, HHS will determine to what degree hospitals,physicians and other eligible participants will be able to form and operate an ACO without violating certainexisting laws, including the Civil Monetary Penalty Law, the Anti-kickback Statute and the Stark Law. TheHealth Reform Law does not authorize HHS to waive other laws that may impact the ability of hospitals andother eligible participants to participate in ACOs, such as antitrust laws.
The Health Reform Law requires HHS to establish a five-year, voluntary national bundled payment pilotprogram for Medicare services beginning no later than January 1, 2013. Under the program, providers wouldagree to receive one payment for services provided to Medicare patients for certain medical conditions orepisodes of care. HHS will have the discretion to determine how the program will function. For example, HHSwill determine what medical conditions will be included in the program and the amount of the payment foreach condition. In addition, the Health Reform Law provides for a five-year bundled payment pilot programfor Medicaid services to begin January 1, 2012. HHS will select up to eight states to participate based on thepotential to lower costs under the Medicaid program while improving care. State programs may targetparticular categories of beneficiaries, selected diagnoses or geographic regions of the state. The selected stateprograms will provide one payment for both hospital and physician services provided to Medicaid patients forcertain episodes of inpatient care. For both pilot programs, HHS will determine the relationship between theprograms and restrictions in certain existing laws, including the Civil Monetary Penalty Law, the Anti-kickback Statute, the Stark Law and the Health Insurance Portability and Accountability Act of 1996
72
(“HIPAA”) privacy, security and transaction standard requirements. However, the Health Reform Law does notauthorize HHS to waive other laws that may impact the ability of hospitals and other eligible participants toparticipate in the pilot programs, such as antitrust laws.
Disproportionate Share Hospital Payments
In addition to making payments for services provided directly to beneficiaries, Medicare makes additionalpayments to hospitals that treat a disproportionately large number of low-income patients (Medicaid andMedicare patients eligible to receive Supplemental Security Income). DSH payments are determined annuallybased on certain statistical information required by HHS and are calculated as a percentage addition to MS-DRG payments. The primary method used by a hospital to qualify for Medicare DSH payments is a complexstatutory formula that results in a DSH percentage that is applied to payments on MS-DRGs.
Under the Health Reform Law, beginning in federal fiscal year 2014, Medicare DSH payments will bereduced to 25% of the amount they otherwise would have been absent the law. The remaining 75% of theamount that would otherwise be paid under Medicare DSH will be effectively pooled, and this pool will bereduced further each year by a formula that reflects reductions in the national level of uninsured who areunder 65 years of age. Each DSH hospital will then be paid, out of the reduced DSH payment pool, anamount allocated based upon its level of uncompensated care. It is difficult to predict the full impact of theMedicare DSH reductions. The CBO estimates $22 billion in reductions to Medicare DSH payments between2010 and 2019, while for the same time period, CMS estimates reimbursement reductions totaling $50 billion.
Hospitals that provide care to a disproportionately high number of low-income patients may receiveMedicaid DSH payments. The federal government distributes federal Medicaid DSH funds to each state basedon a statutory formula. The states then distribute the DSH funding among qualifying hospitals. States havebroad discretion to define which hospitals qualify for Medicaid DSH payments and the amount of suchpayments. The Health Reform Law will reduce funding for the Medicaid DSH hospital program in federalfiscal years 2014 through 2020 by the following amounts: 2014 ($500 million); 2015 ($600 million); 2016($600 million); 2017 ($1.8 billion); 2018 ($5 billion); 2019 ($5.6 billion); and 2020 ($4 billion). How suchcuts are allocated among the states and how the states allocate these cuts among providers, have yet to bedetermined.
TRICARE
TRICARE is the Department of Defense’s health care program for members of the armed forces. Forinpatient services, TRICARE reimburses hospitals based on a DRG system modeled on the Medicare inpatientPPS. The Department of Defense has also implemented a PPS for hospital outpatient services furnished toTRICARE beneficiaries similar to that utilized for services furnished to Medicare beneficiaries. Because theMedicare outpatient PPS APC rates have historically been below TRICARE rates, the adoption of thispayment methodology for TRICARE beneficiaries has reduced our reimbursement; however, TRICAREoutpatient services do not represent a significant portion of our patient volumes.
Annual Cost Reports
All hospitals participating in the Medicare, Medicaid and TRICARE programs, whether paid on areasonable cost basis or under a PPS, are required to meet certain financial reporting requirements. Federaland, where applicable, state regulations require the submission of annual cost reports covering the revenues,costs and expenses associated with the services provided by each hospital to Medicare beneficiaries andMedicaid recipients.
Annual cost reports required under the Medicare and Medicaid programs are subject to routine audits,which may result in adjustments to the amounts ultimately determined to be due to us under thesereimbursement programs. These audits often require several years to reach the final determination of amountsdue to or from us under these programs. Providers also have rights of appeal, and it is common to contestissues raised in audits of cost reports.
73
Managed Care and Other Discounted Plans
Most of our hospitals offer discounts from established charges to certain large group purchasers of healthcare services, including managed care plans and private insurance companies. Admissions reimbursed bycommercial managed care and other insurers were 32%, 34% and 35% of our total admissions for the yearsended December 31, 2010, 2009 and 2008, respectively. Managed care contracts are typically negotiated forterms between one and three years. While we generally received annual average yield increases of 5% to 6%from managed care payers during 2010, there can be no assurance that we will continue to receive increases inthe future. It is not clear what impact, if any, the increased obligations on managed care payers and otherhealth plans imposed by the Health Reform Law will have on our ability to negotiate reimbursement increases.
Uninsured and Self-Pay Patients
A high percentage of our uninsured patients are initially admitted through our emergency rooms. For theyear ended December 31, 2010, approximately 82% of our admissions of uninsured patients occurred throughour emergency rooms. EMTALA requires any hospital that participates in the Medicare program to conduct anappropriate medical screening examination of every person who presents to the hospital’s emergency room fortreatment and, if the individual is suffering from an emergency medical condition, to either stabilize thatcondition or make an appropriate transfer of the individual to a facility that can handle the condition. Theobligation to screen and stabilize emergency medical conditions exists regardless of an individual’s ability topay for treatment. The Health Reform Law requires health plans to reimburse hospitals for emergency servicesprovided to enrollees without prior authorization and without regard to whether a participating providercontract is in place. Further, as enacted, the Health Reform Law contains provisions that seek to decrease thenumber of uninsured individuals, including requirements and incentives, which do not become effective until2014, for individuals to obtain, and large employers to provide, insurance coverage. These mandates mayreduce the financial impact of screening for and stabilizing emergency medical conditions. However, manyfactors are unknown regarding the impact of the Health Reform Law, including how many previouslyuninsured individuals will obtain coverage as a result of the law or the change, if any, in the volume ofinpatient and outpatient hospital services that are sought by and provided to previously uninsured individualsand the payer mix. In addition, it is difficult to predict the full impact of the Health Reform Law due to thelaw’s complexity, lack of implementing regulations or interpretive guidance, gradual and potentially delayedimplementation, pending court challenges and possible amendment or repeal.
We are taking proactive measures to reduce our provision for doubtful accounts by, among other things:screening all patients, including the uninsured, through our emergency screening protocol, to determine theappropriate care setting in light of their condition, while reducing the potential for bad debt and increasing up-front collections from patients subject to co-pay and deductible requirements and uninsured patients.
Hospital Utilization
We believe that the most important factors relating to the overall utilization of a hospital are the qualityand market position of the hospital and the number and quality of physicians and other health careprofessionals providing patient care within the facility. Generally, we believe the ability of a hospital to be amarket leader is determined by its breadth of services, level of technology, emphasis on quality of care andconvenience for patients and physicians. Other factors that impact utilization include the growth in localpopulation, local economic conditions and market penetration of managed care programs.
74
The following table sets forth certain operating statistics for our health care facilities. Health care facilityoperations are subject to certain seasonal fluctuations, including decreases in patient utilization during holidayperiods and increases in the cold weather months. The data set forth in this table includes only those facilitiesthat are consolidated for financial reporting purposes.
2010 2009 2008 2007 2006Years Ended December 31,
Number of hospitals at end of period(a) . . . . 156 155 158 161 166
Number of freestanding outpatient surgerycenters at end of period(b) . . . . . . . . . . . . 97 97 97 99 98
Number of licensed beds at end ofperiod(c) . . . . . . . . . . . . . . . . . . . . . . . . . 38,827 38,839 38,504 38,405 39,354
Weighted average licensed beds(d) . . . . . . . . 38,655 38,825 38,422 39,065 40,653
Admissions(e) . . . . . . . . . . . . . . . . . . . . . . . 1,554,400 1,556,500 1,541,800 1,552,700 1,610,100
Equivalent admissions(f) . . . . . . . . . . . . . . . 2,468,400 2,439,000 2,363,600 2,352,400 2,416,700
Average length of stay (days)(g) . . . . . . . . . . 4.8 4.8 4.9 4.9 4.9
Average daily census(h) . . . . . . . . . . . . . . . . 20,523 20,650 20,795 21,049 21,688
Occupancy rate(i). . . . . . . . . . . . . . . . . . . . . 53% 53% 54% 54% 53%
Emergency room visits(j) . . . . . . . . . . . . . . . 5,706,200 5,593,500 5,246,400 5,116,100 5,213,500
Outpatient surgeries(k) . . . . . . . . . . . . . . . . . 783,600 794,600 797,400 804,900 820,900
Inpatient surgeries(l) . . . . . . . . . . . . . . . . . . 487,100 494,500 493,100 516,500 533,100
(a) Excludes eight facilities in 2010, 2009, 2008 and 2007 and seven facilities in 2006 that are notconsolidated (accounted for using the equity method) for financial reporting purposes.
(b) Excludes nine facilities in 2010, 2007 and 2006 and eight facilities in 2009 and 2008 that are notconsolidated (accounted for using the equity method) for financial reporting purposes.
(c) Licensed beds are those beds for which a facility has been granted approval to operate from theapplicable state licensing agency.
(d) Represents the average number of licensed beds, weighted based on periods owned.
(e) Represents the total number of patients admitted to our hospitals and is used by management and certaininvestors as a general measure of inpatient volume.
(f) Equivalent admissions are used by management and certain investors as a general measure of combinedinpatient and outpatient volume. Equivalent admissions are computed by multiplying admissions(inpatient volume) by the sum of gross inpatient revenue and gross outpatient revenue and then dividingthe resulting amount by gross inpatient revenue. The equivalent admissions computation “equates”outpatient revenue to the volume measure (admissions) used to measure inpatient volume, resulting in ageneral measure of combined inpatient and outpatient volume.
(g) Represents the average number of days admitted patients stay in our hospitals.
(h) Represents the average number of patients in our hospital beds each day.
(i) Represents the percentage of hospital licensed beds occupied by patients. Both average daily census andoccupancy rate provide measures of the utilization of inpatient rooms.
(j) Represents the number of patients treated in our emergency rooms.
(k) Represents the number of surgeries performed on patients who were not admitted to our hospitals. Painmanagement and endoscopy procedures are not included in outpatient surgeries.
(l) Represents the number of surgeries performed on patients who have been admitted to our hospitals. Painmanagement and endoscopy procedures are not included in inpatient surgeries.
75
Competition
Generally, other hospitals in the local communities served by most of our hospitals provide servicessimilar to those offered by our hospitals. Additionally, in recent years the number of freestanding ASCs anddiagnostic centers (including facilities owned by physicians) in the geographic areas in which we operate hasincreased significantly. As a result, most of our hospitals operate in a highly competitive environment. In somecases, competing hospitals are more established than our hospitals. Some competing hospitals are owned bytax-supported government agencies and many others are owned by not-for-profit entities that may be supportedby endowments, charitable contributions and/or tax revenues and are exempt from sales, property and incometaxes. Such exemptions and support are not available to our hospitals. In certain localities there are largeteaching hospitals that provide highly specialized facilities, equipment and services which may not beavailable at most of our hospitals. We face increasing competition from specialty hospitals, some of which arephysician-owned, and both our own and unaffiliated freestanding ASCs for market share in high marginservices.
Psychiatric hospitals frequently attract patients from areas outside their immediate locale and, therefore,our psychiatric hospitals compete with both local and regional hospitals, including the psychiatric units ofgeneral, acute care hospitals.
Our strategies are designed to ensure our hospitals are competitive. We believe our hospitals competewithin local communities on the basis of many factors, including the quality of care, ability to attract andretain quality physicians, skilled clinical personnel and other health care professionals, location, breadth ofservices, technology offered and prices charged. The Health Reform Law requires hospitals to publishannually a list of their standard charges for items and services. We have increased our focus on operatingoutpatient services with improved accessibility and more convenient service for patients, and increasedpredictability and efficiency for physicians.
Two of the most significant factors to the competitive position of a hospital are the number and quality ofphysicians affiliated with or employed by the hospital. Although physicians may at any time terminate theirrelationship with a hospital we operate, our hospitals seek to retain physicians with varied specialties on thehospitals’ medical staffs and to attract other qualified physicians. We believe physicians refer patients to ahospital on the basis of the quality and scope of services it renders to patients and physicians, the quality ofphysicians on the medical staff, the location of the hospital and the quality of the hospital’s facilities,equipment and employees. Accordingly, we strive to maintain and provide quality facilities, equipment,employees and services for physicians and patients.
Another major factor in the competitive position of a hospital is our ability to negotiate service contractswith purchasers of group health care services. Managed care plans attempt to direct and control the use ofhospital services and obtain discounts from hospitals’ established gross charges. In addition, employers andtraditional health insurers continue to attempt to contain costs through negotiations with hospitals for managedcare programs and discounts from established gross charges. Generally, hospitals compete for service contractswith group health care services purchasers on the basis of price, market reputation, geographic location,quality and range of services, quality of the medical staff and convenience. Our future success will depend, inpart, on our ability to retain and renew our managed care contracts and enter into new managed care contractson favorable terms. Other health care providers may impact our ability to enter into managed care contracts ornegotiate increases in our reimbursement and other favorable terms and conditions. For example, some of ourcompetitors may negotiate exclusivity provisions with managed care plans or otherwise restrict the ability ofmanaged care companies to contract with us. The trend toward consolidation among non-government payerstends to increase their bargaining power over fee structures. In addition, as various provisions of the HealthReform Law are implemented, including the establishment of Exchanges and limitations on rescissions ofcoverage and pre-existing condition exclusions, non-government payers may increasingly demand reduced feesor be unwilling to negotiate reimbursement increases. The importance of obtaining contracts with managedcare organizations varies from community to community, depending on the market strength of suchorganizations.
76
State CON laws, which place limitations on a hospital’s ability to expand hospital services and facilities,make capital expenditures and otherwise make changes in operations, may also have the effect of restrictingcompetition. We currently operate health care facilities in a number of states with CON laws. Before issuing aCON, these states consider the need for additional or expanded health care facilities or services. In those stateswhich have no CON laws or which set relatively high levels of expenditures before they become reviewableby state authorities, competition in the form of new services, facilities and capital spending is more prevalent.See “Regulation and Other Factors.”
We and the health care industry as a whole face the challenge of continuing to provide quality patientcare while dealing with rising costs and strong competition for patients. Changes in medical technology,existing and future legislation, regulations and interpretations and managed care contracting for providerservices by private and government payers remain ongoing challenges.
Admissions, average lengths of stay and reimbursement amounts continue to be negatively affected bypayer-required pre-admission authorization, utilization review and payer pressure to maximize outpatient andalternative health care delivery services for less acutely ill patients. The Health Reform Law potentiallyexpands the use of prepayment review by Medicare contractors by eliminating statutory restrictions on theiruse. Increased competition, admission constraints and payer pressures are expected to continue. To meet thesechallenges, we intend to expand our facilities or acquire or construct new facilities where appropriate, toenhance the provision of a comprehensive array of outpatient services, offer market competitive pricing toprivate payer groups, upgrade facilities and equipment and offer new or expanded programs and services.
Environmental Matters
We are subject to various federal, state and local statutes and ordinances regulating the discharge ofmaterials into the environment. We do not believe that we will be required to expend any material amounts inorder to comply with these laws and regulations.
Insurance
As is typical in the health care industry, we are subject to claims and legal actions by patients in theordinary course of business. Subject to a $5 million per occurrence self-insured retention, our facilities areinsured by our wholly-owned insurance subsidiary for losses up to $50 million per occurrence. The insurancesubsidiary has obtained reinsurance for professional liability risks generally above a retention level of$15 million per occurrence. We also maintain professional liability insurance with unrelated commercialcarriers for losses in excess of amounts insured by our insurance subsidiary.
We purchase, from unrelated insurance companies, coverage for directors and officers liability andproperty loss in amounts we believe are adequate. The directors and officers liability coverage includes a$25 million corporate deductible for the period prior to the Recapitalization and a $1 million corporatedeductible subsequent to the Recapitalization. In addition, we will continue to purchase coverage for ourdirectors and officers on an ongoing basis. The property coverage includes varying deductibles depending onthe cause of the property damage. These deductibles range from $500,000 per claim up to 5% of the affectedproperty values for certain flood and wind and earthquake related incidents.
Employees and Medical Staffs
At December 31, 2010, we had approximately 194,000 employees, including approximately 48,000 part-time employees. References herein to “employees” refer to employees of our affiliates. We are subject tovarious state and federal laws that regulate wages, hours, benefits and other terms and conditions relating toemployment. At December 31, 2010, employees at 32 of our hospitals are represented by various labor unions.It is possible additional hospitals may unionize in the future. We consider our employee relations to be goodand have not experienced work stoppages that have materially, adversely affected our business or results ofoperations. Our hospitals, like most hospitals, have experienced labor costs rising faster than the generalinflation rate. In some markets, nurse and medical support personnel availability has become a significantoperating issue to health care providers. To address this challenge, we have implemented several initiatives toimprove retention, recruiting, compensation programs and productivity.
77
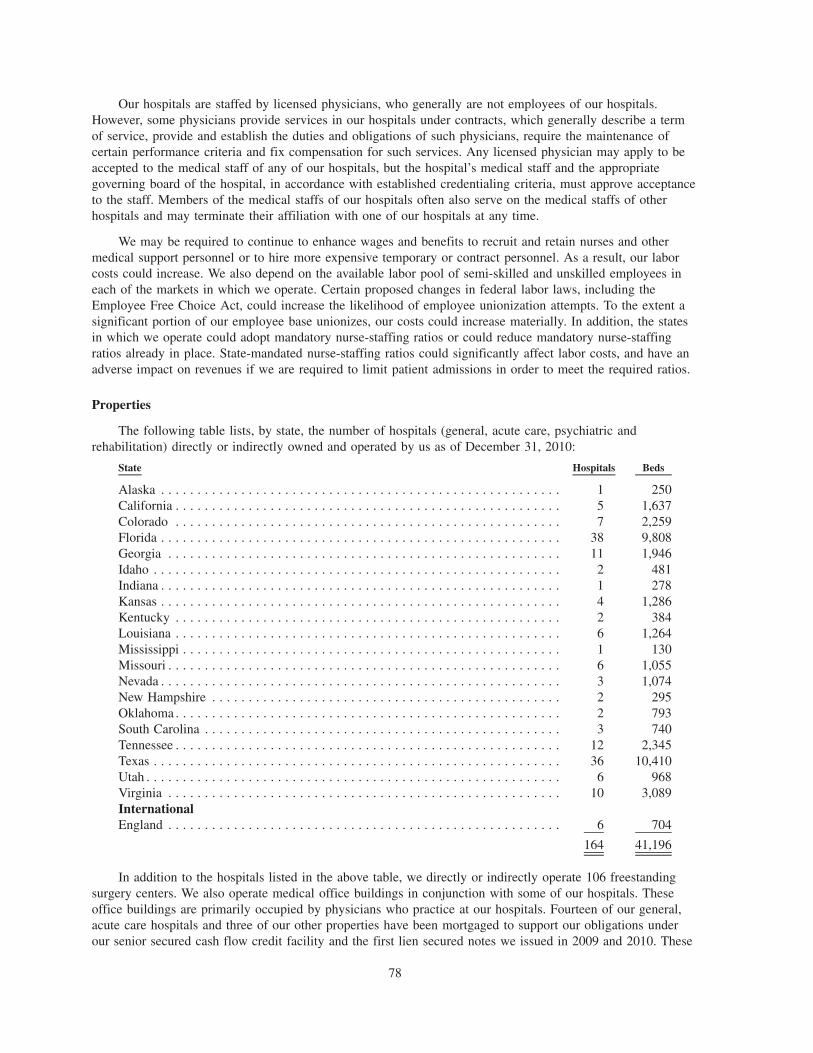
Our hospitals are staffed by licensed physicians, who generally are not employees of our hospitals.However, some physicians provide services in our hospitals under contracts, which generally describe a termof service, provide and establish the duties and obligations of such physicians, require the maintenance ofcertain performance criteria and fix compensation for such services. Any licensed physician may apply to beaccepted to the medical staff of any of our hospitals, but the hospital’s medical staff and the appropriategoverning board of the hospital, in accordance with established credentialing criteria, must approve acceptanceto the staff. Members of the medical staffs of our hospitals often also serve on the medical staffs of otherhospitals and may terminate their affiliation with one of our hospitals at any time.
We may be required to continue to enhance wages and benefits to recruit and retain nurses and othermedical support personnel or to hire more expensive temporary or contract personnel. As a result, our laborcosts could increase. We also depend on the available labor pool of semi-skilled and unskilled employees ineach of the markets in which we operate. Certain proposed changes in federal labor laws, including theEmployee Free Choice Act, could increase the likelihood of employee unionization attempts. To the extent asignificant portion of our employee base unionizes, our costs could increase materially. In addition, the statesin which we operate could adopt mandatory nurse-staffing ratios or could reduce mandatory nurse-staffingratios already in place. State-mandated nurse-staffing ratios could significantly affect labor costs, and have anadverse impact on revenues if we are required to limit patient admissions in order to meet the required ratios.
Properties
The following table lists, by state, the number of hospitals (general, acute care, psychiatric andrehabilitation) directly or indirectly owned and operated by us as of December 31, 2010:
State Hospitals Beds
Alaska . . . . . . . . . . . . . . . . . . . . . . . . . . . . . . . . . . . . . . . . . . . . . . . . . . . . . . . 1 250California . . . . . . . . . . . . . . . . . . . . . . . . . . . . . . . . . . . . . . . . . . . . . . . . . . . . . 5 1,637Colorado . . . . . . . . . . . . . . . . . . . . . . . . . . . . . . . . . . . . . . . . . . . . . . . . . . . . . 7 2,259Florida . . . . . . . . . . . . . . . . . . . . . . . . . . . . . . . . . . . . . . . . . . . . . . . . . . . . . . . 38 9,808Georgia . . . . . . . . . . . . . . . . . . . . . . . . . . . . . . . . . . . . . . . . . . . . . . . . . . . . . . 11 1,946Idaho . . . . . . . . . . . . . . . . . . . . . . . . . . . . . . . . . . . . . . . . . . . . . . . . . . . . . . . . 2 481Indiana . . . . . . . . . . . . . . . . . . . . . . . . . . . . . . . . . . . . . . . . . . . . . . . . . . . . . . . 1 278Kansas . . . . . . . . . . . . . . . . . . . . . . . . . . . . . . . . . . . . . . . . . . . . . . . . . . . . . . . 4 1,286Kentucky . . . . . . . . . . . . . . . . . . . . . . . . . . . . . . . . . . . . . . . . . . . . . . . . . . . . . 2 384Louisiana . . . . . . . . . . . . . . . . . . . . . . . . . . . . . . . . . . . . . . . . . . . . . . . . . . . . . 6 1,264Mississippi . . . . . . . . . . . . . . . . . . . . . . . . . . . . . . . . . . . . . . . . . . . . . . . . . . . . 1 130Missouri . . . . . . . . . . . . . . . . . . . . . . . . . . . . . . . . . . . . . . . . . . . . . . . . . . . . . . 6 1,055Nevada . . . . . . . . . . . . . . . . . . . . . . . . . . . . . . . . . . . . . . . . . . . . . . . . . . . . . . . 3 1,074New Hampshire . . . . . . . . . . . . . . . . . . . . . . . . . . . . . . . . . . . . . . . . . . . . . . . . 2 295Oklahoma . . . . . . . . . . . . . . . . . . . . . . . . . . . . . . . . . . . . . . . . . . . . . . . . . . . . . 2 793South Carolina . . . . . . . . . . . . . . . . . . . . . . . . . . . . . . . . . . . . . . . . . . . . . . . . . 3 740Tennessee . . . . . . . . . . . . . . . . . . . . . . . . . . . . . . . . . . . . . . . . . . . . . . . . . . . . . 12 2,345Texas . . . . . . . . . . . . . . . . . . . . . . . . . . . . . . . . . . . . . . . . . . . . . . . . . . . . . . . . 36 10,410Utah . . . . . . . . . . . . . . . . . . . . . . . . . . . . . . . . . . . . . . . . . . . . . . . . . . . . . . . . . 6 968Virginia . . . . . . . . . . . . . . . . . . . . . . . . . . . . . . . . . . . . . . . . . . . . . . . . . . . . . . 10 3,089InternationalEngland . . . . . . . . . . . . . . . . . . . . . . . . . . . . . . . . . . . . . . . . . . . . . . . . . . . . . . 6 704
164 41,196
In addition to the hospitals listed in the above table, we directly or indirectly operate 106 freestandingsurgery centers. We also operate medical office buildings in conjunction with some of our hospitals. Theseoffice buildings are primarily occupied by physicians who practice at our hospitals. Fourteen of our general,acute care hospitals and three of our other properties have been mortgaged to support our obligations underour senior secured cash flow credit facility and the first lien secured notes we issued in 2009 and 2010. These
78
three other properties are also subject to second mortgages to support our obligations under the second liensecured notes we issued in 2006 and 2009.
We maintain our headquarters in approximately 1,200,000 square feet of space in the Nashville,Tennessee area. In addition to the headquarters in Nashville, we maintain regional service centers related toour shared services initiatives. These service centers are located in markets in which we operate hospitals.
We believe our headquarters, hospitals and other facilities are suitable for their respective uses and are, ingeneral, adequate for our present needs. Our properties are subject to various federal, state and local statutesand ordinances regulating their operation. Management does not believe that compliance with such statutesand ordinances will materially affect our financial position or results of operations.
Legal Proceedings
We operate in a highly regulated and litigious industry. As a result, various lawsuits, claims and legal andregulatory proceedings have been and can be expected to be instituted or asserted against us. The resolution ofany such lawsuits, claims or legal and regulatory proceedings could materially and adversely affect our resultsof operations and financial position in a given period.
Government Investigations, Claims and Litigation
Health care companies are subject to numerous investigations by various governmental agencies. Further,under the federal FCA, private parties have the right to bring qui tam, or “whistleblower,” suits againstcompanies that submit false claims for payments to, or improperly retain overpayments from, the government.Some states have adopted similar state whistleblower and false claims provisions. Certain of our individualfacilities have received, and from time to time, other facilities may receive, government inquiries from, andmay be subject to investigation by, federal and state agencies. Depending on whether the underlying conductin these or future inquiries or investigations could be considered systemic, their resolution could have amaterial, adverse effect on our financial position, results of operations and liquidity.
The Civil Division of the Department of Justice (“DOJ”) has contacted us in connection with itsnationwide review of whether, in certain cases, hospital charges to the federal government relating toimplantable cardio-defibrillators (“ICDs”) met the CMS criteria. In connection with this nationwide review, theDOJ has indicated that it will be reviewing certain ICD billing and medical records at 95 HCA hospitals; thereview covers the period from October 2003 to the present. The review could potentially give rise to claimsagainst us under the federal FCA or other statutes, regulations or laws. At this time, we cannot predict whateffect, if any, this review or any resulting claims could have on us.
New Hampshire Hospital Merger Litigation
In 2006, the Foundation for Seacoast Health (the “Foundation”) filed suit against HCA in state court inNew Hampshire. The Foundation alleged that both the 2006 Recapitalization transaction and a prior 1999intra-corporate transaction violated a 1983 agreement that placed certain restrictions on transfers of thePortsmouth Regional Hospital. In May 2007, the trial court ruled against the Foundation on all its claims. Onappeal, the New Hampshire Supreme Court affirmed the ruling on the Recapitalization, but remanded to thetrial court the claims based on the 1999 intra-corporate transaction. The trial court ruled in December 2009that the 1999 intra-corporate transaction breached the transfer restriction provisions of the 1983 agreement.The court will now conduct additional proceedings to determine whether any harm has flowed from thealleged breach, and if so, what the appropriate remedy should be. The court may consider whether to, amongother things, award monetary damages, rescind or undo the 1999 intra-corporate transfer or give theFoundation a right to purchase hospital assets at a price to be determined (which the Foundation asserts shouldbe below the fair market value of the hospital). The trial for the remedies phase is currently set for May 2011.
79

General Liability and Other Claims
We are a party to certain proceedings relating to claims for income taxes and related interest before theIRS Appeals Division. For a description of those proceedings, see “Management’s Discussion and Analysis ofFinancial Condition and Results of Operations — IRS Disputes” and Note 5 to our consolidated financialstatements.
We are also subject to claims and suits arising in the ordinary course of business, including claims forpersonal injuries or for wrongful restriction of, or interference with, physicians’ staff privileges. In certain ofthese actions the claimants have asked for punitive damages against us, which may not be covered byinsurance. In the opinion of management, the ultimate resolution of these pending claims and legalproceedings will not have a material, adverse effect on our results of operations or financial position.
80
REGULATION AND OTHER FACTORS
Licensure, Certification and Accreditation
Health care facility construction and operation are subject to numerous federal, state and local regulationsrelating to the adequacy of medical care, equipment, personnel, operating policies and procedures,maintenance of adequate records, fire prevention, rate-setting and compliance with building codes andenvironmental protection laws. Facilities are subject to periodic inspection by governmental and otherauthorities to assure continued compliance with the various standards necessary for licensing and accreditation.We believe our health care facilities are properly licensed under applicable state laws. Each of our acute carehospitals are certified for participation in the Medicare and Medicaid programs and are accredited by TheJoint Commission. If any facility were to lose its Medicare or Medicaid certification, the facility would beunable to receive reimbursement from federal health care programs. If any facility were to lose accreditationby The Joint Commission, the facility would be subject to state surveys, potentially be subject to increasedscrutiny by CMS and likely lose payment from non-government payers. Management believes our facilities arein substantial compliance with current applicable federal, state, local and independent review body regulationsand standards. The requirements for licensure, certification and accreditation are subject to change and, inorder to remain qualified, it may become necessary for us to make changes in our facilities, equipment,personnel and services. The requirements for licensure also may include notification or approval in the eventof the transfer or change of ownership. Failure to obtain the necessary state approval in these circumstancescan result in the inability to complete an acquisition or change of ownership.
Certificates of Need
In some states where we operate hospitals and other health care facilities, the construction or expansionof health care facilities, the acquisition of existing facilities, the transfer or change of ownership and theaddition of new beds or services may be subject to review by and prior approval of state regulatory agenciesunder a CON program. Such laws generally require the reviewing state agency to determine the public needfor additional or expanded health care facilities and services. Failure to obtain necessary state approval canresult in the inability to expand facilities, complete an acquisition or change ownership.
State Rate Review
Some states have adopted legislation mandating rate or budget review for hospitals or have adopted taxeson hospital revenues, assessments or licensure fees to fund indigent health care within the state. In theaggregate, indigent tax provisions have not materially, adversely affected our results of operations. Althoughwe do not currently operate facilities in states that mandate rate or budget reviews, we cannot predict whetherwe will operate in such states in the future, or whether the states in which we currently operate may adoptlegislation mandating such reviews.
Federal Health Care Program Regulations
Participation in any federal health care program, including the Medicare and Medicaid programs, isheavily regulated by statute and regulation. If a hospital fails to substantially comply with the numerousconditions of participation in the Medicare and Medicaid programs or performs certain prohibited acts, thehospital’s participation in the federal health care programs may be terminated, or civil and/or criminalpenalties may be imposed.
Anti-kickback Statute
A section of the Social Security Act known as the “Anti-kickback Statute” prohibits providers and othersfrom directly or indirectly soliciting, receiving, offering or paying any remuneration with the intent ofgenerating referrals or orders for services or items covered by a federal health care program. Courts haveinterpreted this statute broadly and held that there is a violation of the Anti-kickback Statute if just onepurpose of the remuneration is to generate referrals, even if there are other lawful purposes. Furthermore, theHealth Reform Law provides that knowledge of the law or the intent to violate the law is not required.
81
Violations of the Anti-kickback Statute may be punished by a criminal fine of up to $25,000 for each violationor imprisonment, civil money penalties of up to $50,000 per violation and damages of up to three times thetotal amount of the remuneration and/or exclusion from participation in federal health care programs,including Medicare and Medicaid. The Health Reform Law provides that submission of a claim for services oritems generated in violation of the Anti-kickback Statute constitutes a false or fraudulent claim and may besubject to additional penalties under the federal FCA.
The OIG, among other regulatory agencies, is responsible for identifying and eliminating fraud, abuse andwaste. The OIG carries out this mission through a nationwide program of audits, investigations andinspections. As one means of providing guidance to health care providers, the OIG issues “Special FraudAlerts.” These alerts do not have the force of law, but identify features of arrangements or transactions that thegovernment believes may cause the arrangements or transactions to violate the Anti-kickback Statute or otherfederal health care laws. The OIG has identified several incentive arrangements that constitute suspectpractices, including: (a) payment of any incentive by a hospital each time a physician refers a patient to thehospital, (b) the use of free or significantly discounted office space or equipment in facilities usually locatedclose to the hospital, (c) provision of free or significantly discounted billing, nursing or other staff services,(d) free training for a physician’s office staff in areas such as management techniques and laboratorytechniques, (e) guarantees which provide, if the physician’s income fails to reach a predetermined level, thehospital will pay any portion of the remainder, (f) low-interest or interest-free loans, or loans which may beforgiven if a physician refers patients to the hospital, (g) payment of the costs of a physician’s travel andexpenses for conferences, (h) coverage on the hospital’s group health insurance plans at an inappropriately lowcost to the physician, (i) payment for services (which may include consultations at the hospital) which requirefew, if any, substantive duties by the physician, (j) purchasing goods or services from physicians at prices inexcess of their fair market value, and (k) rental of space in physician offices, at other than fair market valueterms, by persons or entities to which physicians refer. The OIG has encouraged persons having informationabout hospitals who offer the above types of incentives to physicians to report such information to the OIG.
The OIG also issues Special Advisory Bulletins as a means of providing guidance to health careproviders. These bulletins, along with the Special Fraud Alerts, have focused on certain arrangements thatcould be subject to heightened scrutiny by government enforcement authorities, including: (a) contractual jointventure arrangements and other joint venture arrangements between those in a position to refer business, suchas physicians, and those providing items or services for which Medicare or Medicaid pays, and (b) certain“gainsharing” arrangements, i.e., the practice of giving physicians a share of any reduction in a hospital’s costsfor patient care attributable in part to the physician’s efforts.
In addition to issuing Special Fraud Alerts and Special Advisory Bulletins, the OIG issues complianceprogram guidance for certain types of health care providers. The OIG guidance identifies a number of riskareas under federal fraud and abuse statutes and regulations. These areas of risk include compensationarrangements with physicians, recruitment arrangements with physicians and joint venture relationships withphysicians.
As authorized by Congress, the OIG has published safe harbor regulations that outline categories ofactivities deemed protected from prosecution under the Anti-kickback Statute. Currently, there are statutoryexceptions and safe harbors for various activities, including the following: certain investment interests, spacerental, equipment rental, practitioner recruitment, personnel services and management contracts, sale ofpractice, referral services, warranties, discounts, employees, group purchasing organizations, waiver ofbeneficiary coinsurance and deductible amounts, managed care arrangements, obstetrical malpractice insurancesubsidies, investments in group practices, freestanding surgery centers, ambulance replenishing, and referralagreements for specialty services.
The fact that conduct or a business arrangement does not fall within a safe harbor, or it is identified in aSpecial Fraud Alert or Advisory Bulletin or as a risk area in the Supplemental Compliance Guidelines forHospitals, does not necessarily render the conduct or business arrangement illegal under the Anti-kickbackStatute. However, such conduct and business arrangements may lead to increased scrutiny by governmentenforcement authorities.
82
We have a variety of financial relationships with physicians and others who either refer or influence thereferral of patients to our hospitals and other health care facilities, including employment contracts, leases,medical director agreements and professional service agreements. We also have similar relationships withphysicians and facilities to which patients are referred from our facilities. In addition, we provide financialincentives, including minimum revenue guarantees, to recruit physicians into the communities served by ourhospitals. While we endeavor to comply with the applicable safe harbors, certain of our current arrangements,including joint ventures and financial relationships with physicians and other referral sources and persons andentities to which we refer patients, do not qualify for safe harbor protection.
Although we believe our arrangements with physicians and other referral sources have been structured tocomply with current law and available interpretations, there can be no assurance regulatory authoritiesenforcing these laws will determine these financial arrangements comply with the Anti-kickback Statute orother applicable laws. An adverse determination could subject us to liabilities under the Social Security Actand other laws, including criminal penalties, civil monetary penalties and exclusion from participation inMedicare, Medicaid or other federal health care programs.
Stark Law
The Social Security Act also includes a provision commonly known as the “Stark Law.” The Stark Lawprohibits physicians from referring Medicare and Medicaid patients to entities with which they or any of theirimmediate family members have a financial relationship, if these entities provide certain “designated healthservices” reimbursable by Medicare or Medicaid unless an exception applies. The Stark Law also prohibitsentities that provide designated health services reimbursable by Medicare and Medicaid from billing theMedicare and Medicaid programs for any items or services that result from a prohibited referral and requiresthe entities to refund amounts received for items or services provided pursuant to the prohibited referral.“Designated health services” include inpatient and outpatient hospital services, clinical laboratory services andradiology services. Sanctions for violating the Stark Law include denial of payment, civil monetary penaltiesof up to $15,000 per claim submitted and exclusion from the federal health care programs. The statute alsoprovides for a penalty of up to $100,000 for a circumvention scheme. There are exceptions to the self-referralprohibition for many of the customary financial arrangements between physicians and providers, includingemployment contracts, leases and recruitment agreements. Unlike safe harbors under the Anti-kickback Statutewith which compliance is voluntary, an arrangement must comply with every requirement of a Stark Lawexception or the arrangement is in violation of the Stark Law. Although there is an exception for a physician’sownership interest in an entire hospital, the Health Reform Law prohibits newly created physician-ownedhospitals from billing for Medicare patients referred by their physician owners. As a result, the law effectivelyprevents the formation of new physician-owned hospitals after December 31, 2010. While the Health ReformLaw grandfathers existing physician-owned hospitals, it does not allow these hospitals to increase thepercentage of physician ownership and significantly restricts their ability to expand services.
Through a series of rulemakings, CMS has issued final regulations implementing the Stark Law.Additional changes to these regulations, which became effective October 1, 2009, further restrict the types ofarrangements facilities and physicians may enter, including additional restrictions on certain leases, percentagecompensation arrangements, and agreements under which a hospital purchases services “under arrangements.”While these regulations were intended to clarify the requirements of the exceptions to the Stark Law, it isunclear how the government will interpret many of these exceptions for enforcement purposes. CMS hasindicated it is considering additional changes to the Stark Law regulations. We do not always have the benefitof significant regulatory or judicial interpretation of these laws and regulations. We attempt to structure ourrelationships to meet an exception to the Stark Law, but the regulations implementing the exceptions aredetailed and complex, and we cannot assure that every relationship complies fully with the Stark Law.
Similar State Laws
Many states in which we operate also have laws similar to the Anti-kickback Statute that prohibitpayments to physicians for patient referrals and laws similar to the Stark Law that prohibit certain self-referrals. The scope of these state laws is broad, since they can often apply regardless of the source of
83
payment for care, and little precedent exists for their interpretation or enforcement. These statutes typicallyprovide for criminal and civil penalties, as well as loss of facility licensure.
Other Fraud and Abuse Provisions
HIPAA broadened the scope of certain fraud and abuse laws by adding several criminal provisions forhealth care fraud offenses that apply to all health benefit programs. The Social Security Act also imposescriminal and civil penalties for making false claims and statements to Medicare and Medicaid. False claimsinclude, but are not limited to, billing for services not rendered or for misrepresenting actual services renderedin order to obtain higher reimbursement, billing for unnecessary goods and services and cost report fraud.Federal enforcement officials have the ability to exclude from Medicare and Medicaid any investors, officersand managing employees associated with business entities that have committed health care fraud, even if theofficer or managing employee had no knowledge of the fraud. Criminal and civil penalties may be imposedfor a number of other prohibited activities, including failure to return known overpayments, certaingainsharing arrangements, billing Medicare amounts that are substantially in excess of a provider’s usualcharges, offering remuneration to influence a Medicare or Medicaid beneficiary’s selection of a health careprovider, contracting with an individual or entity known to be excluded from a federal health care program,making or accepting a payment to induce a physician to reduce or limit services, and soliciting or receivingany remuneration in return for referring an individual for an item or service payable by a federal health careprogram. Like the Anti-kickback Statute, these provisions are very broad. Under the Health Reform Law, civilpenalties may be imposed for the failure to report and return an overpayment within 60 days of identifying theoverpayment or by the date a corresponding cost report is due, whichever is later. To avoid liability, providersmust, among other things, carefully and accurately code claims for reimbursement, promptly returnoverpayments and accurately prepare cost reports.
Some of these provisions, including the federal Civil Monetary Penalty Law, require a lower burden ofproof than other fraud and abuse laws, including the Anti-kickback Statute. Civil monetary penalties that maybe imposed under the federal Civil Monetary Penalty Law range from $10,000 to $50,000 per act, and in somecases may result in penalties of up to three times the remuneration offered, paid, solicited or received. Inaddition, a violator may be subject to exclusion from federal and state health care programs. Federal and stategovernments increasingly use the federal Civil Monetary Penalty Law, especially where they believe theycannot meet the higher burden of proof requirements under the Anti-kickback Statute. Further, individuals canreceive up to $1,000 for providing information on Medicare fraud and abuse that leads to the recovery of atleast $100 of Medicare funds under the Medicare Integrity Program.
The Federal False Claims Act and Similar State Laws
The qui tam, or whistleblower, provisions of the FCA allow private individuals to bring actions on behalfof the government alleging that the defendant has defrauded the federal government. Further, the governmentmay use the FCA to prosecute Medicare and other government program fraud in areas such as coding errors,billing for services not provided and submitting false cost reports. When a private party brings a qui tamaction under the FCA, the defendant is not made aware of the lawsuit until the government commences itsown investigation or makes a determination whether it will intervene. When a defendant is determined by acourt of law to be liable under the FCA, the defendant may be required to pay three times the actual damagessustained by the government, plus mandatory civil penalties of between $5,500 and $11,000 for each separatefalse claim. There are many potential bases for liability under the FCA. Liability often arises when an entityknowingly submits a false claim for reimbursement to the federal government. The FCA defines the term“knowingly” broadly. Though simple negligence will not give rise to liability under the FCA, submitting aclaim with reckless disregard to its truth or falsity constitutes a “knowing” submission under the FCA and,therefore, will qualify for liability. The Fraud Enforcement and Recovery Act of 2009 expanded the scope ofthe FCA by, among other things, creating liability for knowingly and improperly avoiding repayment of anoverpayment received from the government and broadening protections for whistleblowers. Under the HealthReform Law, the FCA is implicated by the knowing failure to report and return an overpayment within60 days of identifying the overpayment or by the date a corresponding cost report is due, whichever is later.Further, the Health Reform Law expands the scope of the FCA to cover payments in connection with theExchanges to be created by the Health Reform Law, if those payments include any federal funds.
84
In some cases, whistleblowers and the federal government have taken the position, and some courts haveheld, that providers who allegedly have violated other statutes, such as the Anti-kickback Statute and the StarkLaw, have thereby submitted false claims under the FCA. The Health Reform Law clarifies this issue withrespect to the Anti-kickback Statute by providing that submission of claims for services or items generated inviolation of the Anti-kickback Statute constitutes a false or fraudulent claim under the FCA. Every entity thatreceives at least $5 million annually in Medicaid payments must have written policies for all employees,contractors or agents, providing detailed information about false claims, false statements and whistleblowerprotections under certain federal laws, including the FCA, and similar state laws. In addition, federal lawprovides an incentive to states to enact false claims laws comparable to the FCA. A number of states in whichwe operate have adopted their own false claims provisions as well as their own whistleblower provisions underwhich a private party may file a civil lawsuit in state court. We have adopted and distributed policiespertaining to the FCA and relevant state laws.
HIPAA Administrative Simplification and Privacy and Security Requirements
The Administrative Simplification Provisions of HIPAA require the use of uniform electronic datatransmission standards for certain health care claims and payment transactions submitted or receivedelectronically. These provisions are intended to encourage electronic commerce in the health care industry.HHS has issued regulations implementing the HIPAA Administrative Simplification Provisions and compliancewith these regulations is mandatory for our facilities. In addition, HIPAA requires that each provider use aNational Provider Identifier. In January 2009, CMS published a final rule making changes to the formats usedfor certain electronic transactions and requiring the use of updated standard code sets for certain diagnoses andprocedures known as ICD-10 code sets. While use of the ICD-10 code sets is not mandatory until October 1,2013, we will be modifying our payment systems and processes to prepare for the implementation.Implementing the ICD-10 code sets will require significant administrative changes, but we believe that thecost of compliance with these regulations has not had and is not expected to have a material, adverse effect onour business, financial position or results of operations. The Health Reform Law requires HHS to adoptstandards for additional electronic transactions and to establish operating rules to promote uniformity in theimplementation of each standardized electronic transaction.
The privacy and security regulations promulgated pursuant to HIPAA extensively regulate the use anddisclosure of individually identifiable health information and require covered entities, including health plansand most health care providers, to implement administrative, physical and technical safeguards to protect thesecurity of such information. ARRA broadened the scope of the HIPAA privacy and security regulations. Inaddition, ARRA extends the application of certain provisions of the security and privacy regulations tobusiness associates (entities that handle identifiable health information on behalf of covered entities) andsubjects business associates to civil and criminal penalties for violation of the regulations. On July 14, 2010,HHS issued a proposed rule that would implement many of these ARRA provisions. If finalized, these changeswould likely require amendments to existing agreements with business associates and would subject businessassociates and their subcontractors to direct liability under the HIPAA privacy and security regulations. Wecurrently enforce a HIPAA compliance plan, which we believe complies with HIPAA privacy and securityrequirements and under which a HIPAA compliance group monitors our compliance. The privacy regulationsand security regulations have and will continue to impose significant costs on our facilities in order to complywith these standards.
As required by ARRA, HHS published an interim final rule on August 24, 2009, that requires coveredentities to report breaches of unsecured protected health information to affected individuals withoutunreasonable delay but not to exceed 60 days of discovery of the breach by a covered entity or its agents.Notification must also be made to HHS and, in certain situations involving large breaches, to the media. HHSis required to publish on its website a list of all covered entities that report a breach involving more than 500individuals. Various state laws and regulations may also require us to notify affected individuals in the eventof a data breach involving individually identifiable information.
Violations of the HIPAA privacy and security regulations may result in civil and criminal penalties, andARRA has strengthened the enforcement provisions of HIPAA, which may result in increased enforcementactivity. Under ARRA, HHS is required to conduct periodic compliance audits of covered entities and their
85
business associates. ARRA broadens the applicability of the criminal penalty provisions to employees ofcovered entities and requires HHS to impose penalties for violations resulting from willful neglect. ARRA alsosignificantly increases the amount of the civil penalties, with penalties of up to $50,000 per violation for amaximum civil penalty of $1,500,000 in a calendar year for violations of the same requirement. In addition,ARRA authorizes state attorneys general to bring civil actions seeking either injunction or damages inresponse to violations of HIPAA privacy and security regulations that threaten the privacy of state residents.Our facilities also remain subject to any federal or state privacy-related laws that are more restrictive than theprivacy regulations issued under HIPAA. These laws vary and could impose additional penalties.
There are numerous other laws and legislative and regulatory initiatives at the federal and state levelsaddressing privacy and security concerns. For example, the Federal Trade Commission (“FTC”) issued a finalrule in October 2007 requiring financial institutions and creditors, which arguably included health providersand health plans, to implement written identity theft prevention programs to detect, prevent and mitigateidentity theft in connection with certain accounts. The FTC delayed enforcement of this rule untilDecember 31, 2010. In addition, on December 18, 2010, the Red Flag Program Clarification Act of 2010became law, restricting the definition of a “creditor.” This law may exempt many hospitals from complyingwith the rule.
EMTALA
All of our hospitals in the United States are subject to EMTALA. This federal law requires any hospitalparticipating in the Medicare program to conduct an appropriate medical screening examination of everyindividual who presents to the hospital’s emergency room for treatment and, if the individual is suffering froman emergency medical condition, to either stabilize the condition or make an appropriate transfer of theindividual to a facility able to handle the condition. The obligation to screen and stabilize emergency medicalconditions exists regardless of an individual’s ability to pay for treatment. There are severe penalties underEMTALA if a hospital fails to screen or appropriately stabilize or transfer an individual or if the hospitaldelays appropriate treatment in order to first inquire about the individual’s ability to pay. Penalties forviolations of EMTALA include civil monetary penalties and exclusion from participation in the Medicareprogram. In addition, an injured individual, the individual’s family or a medical facility that suffers a financialloss as a direct result of a hospital’s violation of the law can bring a civil suit against the hospital.
The government broadly interprets EMTALA to cover situations in which individuals do not actuallypresent to a hospital’s emergency room, but present for emergency examination or treatment to the hospital’scampus, generally, or to a hospital-based clinic that treats emergency medical conditions or are transported ina hospital-owned ambulance, subject to certain exceptions. At least one court has interpreted the law also toapply to a hospital that has been notified of a patient’s pending arrival in a non-hospital owned ambulance.EMTALA does not generally apply to individuals admitted for inpatient services. The government hasexpressed its intent to investigate and enforce EMTALA violations actively in the future. We believe ourhospitals operate in substantial compliance with EMTALA.
Corporate Practice of Medicine/Fee Splitting
Some of the states in which we operate have laws prohibiting corporations and other entities from employingphysicians, practicing medicine for a profit and making certain direct and indirect payments or fee-splittingarrangements between health care providers designed to induce or encourage the referral of patients to, or therecommendation of, particular providers for medical products and services. Possible sanctions for violation of theserestrictions include loss of license and civil and criminal penalties. In addition, agreements between the corporationand the physician may be considered void and unenforceable. These statutes vary from state to state, are oftenvague and have seldom been interpreted by the courts or regulatory agencies.
Health Care Industry Investigations
Significant media and public attention has focused in recent years on the hospital industry. This mediaand public attention, changes in government personnel or other factors may lead to increased scrutiny of thehealth care industry. While we are currently not aware of any material investigations of the Company under
86
federal or state health care laws or regulations, it is possible that governmental entities could initiateinvestigations or litigation in the future at facilities we operate and that such matters could result in significantpenalties, as well as adverse publicity. It is also possible that our executives and managers could be includedin governmental investigations or litigation or named as defendants in private litigation.
Our substantial Medicare, Medicaid and other governmental billings result in heightened scrutiny of ouroperations. We continue to monitor all aspects of our business and have developed a comprehensive ethics andcompliance program that is designed to meet or exceed applicable federal guidelines and industry standards.Because the law in this area is complex and constantly evolving, governmental investigations or litigation mayresult in interpretations that are inconsistent with our or industry practices.
In public statements surrounding current investigations, governmental authorities have taken positions ona number of issues, including some for which little official interpretation previously has been available, thatappear to be inconsistent with practices that have been common within the industry and that previously havenot been challenged in this manner. In some instances, government investigations that have in the past beenconducted under the civil provisions of federal law may now be conducted as criminal investigations.
Both federal and state government agencies have increased their focus on and coordination of civil andcriminal enforcement efforts in the health care area. The OIG and the DOJ have, from time to time, establishednational enforcement initiatives, targeting all hospital providers that focus on specific billing practices or othersuspected areas of abuse. The Health Reform Law includes additional federal funding of $350 million over thenext 10 years to fight health care fraud, waste and abuse, including $105 million for federal fiscal year 2011 and$65 million in federal fiscal year 2012. In addition, governmental agencies and their agents, such as MACs, fiscalintermediaries and carriers, may conduct audits of our health care operations. Private payers may conduct similarpost-payment audits, and we also perform internal audits and monitoring.
In addition to national enforcement initiatives, federal and state investigations have addressed a widevariety of routine health care operations such as: cost reporting and billing practices, including for Medicareoutliers; financial arrangements with referral sources; physician recruitment activities; physician joint ventures;and hospital charges and collection practices for self-pay patients. We engage in many of these routine healthcare operations and other activities that could be the subject of governmental investigations or inquiries. Forexample, we have significant Medicare and Medicaid billings, numerous financial arrangements withphysicians who are referral sources to our hospitals and joint venture arrangements involving physicianinvestors. Certain of our individual facilities have received, and other facilities may receive, governmentinquiries from, and may be subject to investigation by, federal and state agencies. Any additionalinvestigations of the Company, our executives or managers could result in significant liabilities or penalties tous, as well as adverse publicity.
Commencing in 1997, we became aware we were the subject of governmental investigations and litigationrelating to our business practices. As part of the investigations, the United States intervened in a number of qui tamactions brought by private parties. The investigations related to, among other things, DRG coding, outpatientlaboratory billing, home health issues, physician relations, cost report and wound care issues. The investigationswere concluded through a series of agreements executed in 2000 and 2003 with the Criminal Division of the DOJ,the Civil Division of the DOJ, various U.S. Attorneys’ offices, CMS, a negotiating team representing states withclaims against us, and others. In January 2001, we entered into an eight-year CIA with the OIG, which expiredJanuary 24, 2009. We submitted our final report pursuant to the CIA on April 30, 2009, and in April 2010, wereceived notice from the OIG that our final report was accepted, relieving us of future obligations under the CIA. Ifthe government were to determine that we violated or breached the CIA or other federal or state laws relating toMedicare, Medicaid or similar programs, we could be subject to substantial monetary fines, civil and criminalpenalties and/or exclusion from participation in the Medicare and Medicaid programs and other federal and statehealth care programs. Alleged violations may be pursued by the government or through private qui tam actions.Sanctions imposed against us as a result of such actions could have a material, adverse effect on our results ofoperations and financial position.
87
Health Care Reform
As enacted, the Health Reform Law will change how health care services are covered, delivered andreimbursed through expanded coverage of uninsured individuals, reduced growth in Medicare programspending, reductions in Medicare and Medicaid DSH payments, and the establishment of programs wherereimbursement is tied to quality and integration. In addition, the law reforms certain aspects of healthinsurance, expands existing efforts to tie Medicare and Medicaid payments to performance and quality, andcontains provisions intended to strengthen fraud and abuse enforcement. More than 20 challenges to theHealth Reform Law have been filed in federal courts. Some federal district courts have upheld theconstitutionality of the Health Reform Law or dismissed cases on procedural grounds. Others have heldunconstitutional the requirement that individuals maintain health insurance or pay a penalty and have eitherfound the Health Reform Law void in its entirety or left the remainder of the Health Reform Law intact.These lawsuits are subject to appeal, and several are currently on appeal, including those that hold the lawunconstitutional. It is unclear how these lawsuits will be resolved. Further, Congress is considering bills thatwould repeal or revise the Health Reform Law.
Expanded Coverage
Based on CBO and CMS estimates, by 2019, the Health Reform Law will expand coverage to 32 to34 million additional individuals (resulting in coverage of an estimated 94% of the legal U.S. population).This increased coverage will occur through a combination of public program expansion and private sectorhealth insurance and other reforms.
Medicaid Expansion
The primary public program coverage expansion will occur through changes in Medicaid, and to a lesserextent, expansion of CHIP. The most significant changes will expand the categories of individuals eligible forMedicaid coverage and permit individuals with relatively higher incomes to qualify. The federal governmentreimburses the majority of a state’s Medicaid expenses, and it conditions its payment on the state meetingcertain requirements. The federal government currently requires that states provide coverage for only limitedcategories of low-income adults under 65 years old (e.g., women who are pregnant, and the blind or disabled).In addition, the income level required for individuals and families to qualify for Medicaid varies widely fromstate to state.
The Health Reform Law materially changes the requirements for Medicaid eligibility. CommencingJanuary 1, 2014, all state Medicaid programs are required to provide, and the federal government willsubsidize, Medicaid coverage to virtually all adults under 65 years old with incomes at or under 133% of theFPL. This expansion will create a minimum Medicaid eligibility threshold that is uniform across states.Further, the Health Reform Law also requires states to apply a ‘‘5% income disregard” to the Medicaideligibility standard, so that Medicaid eligibility will effectively be extended to those with incomes up to 138%of the FPL. These new eligibility requirements will expand Medicaid and CHIP coverage by an estimated 16to 18 million persons nationwide. A disproportionately large percentage of the new Medicaid coverage islikely to be in states that currently have relatively low income eligibility requirements.
As Medicaid is a joint federal and state program, the federal government provides states with “matchingfunds” in a defined percentage, known as the federal medical assistance percentage (“FMAP”). Beginning in2014, states will receive an enhanced FMAP for the individuals enrolled in Medicaid pursuant to the HealthReform Law. The FMAP percentage is as follows: 100% for calendar years 2014 through 2016; 95% for 2017;94% in 2018; 93% in 2019; and 90% in 2020 and thereafter.
The Health Reform Law also provides that the federal government will subsidize states that create non-Medicaid plans for residents whose incomes are greater than 133% of the FPL but do not exceed 200% of theFPL. Approved state plans will be eligible to receive federal funding. The amount of that funding perindividual will be equal to 95% of subsidies that would have been provided for that individual had he or sheenrolled in a health plan offered through one of the Exchanges, as discussed below.
88
Historically, states often have attempted to reduce Medicaid spending by limiting benefits and tighteningMedicaid eligibility requirements. Effective March 23, 2010, the Health Reform Law requires states to at leastmaintain Medicaid eligibility standards established prior to the enactment of the law for adults until January 1,2014 and for children until October 1, 2019. States with budget deficits may, however, seek a waiver from thisrequirement, but only to address eligibility standards that apply to adults making more than 133% of the FPL.
Private Sector Expansion
The expansion of health coverage through the private sector as a result of the Health Reform Law willoccur through new requirements on health insurers, employers and individuals. Commencing January 1, 2014,health insurance companies will be prohibited from imposing annual coverage limits, dropping coverage,excluding persons based upon pre-existing conditions or denying coverage for any individual who is willing topay the premiums for such coverage. Effective January 1, 2011, each health plan must keep its annual non-medical costs lower than 15% of premium revenue for the group market and lower than 20% in the smallgroup and individual markets or rebate its enrollees the amount spent in excess of the percentage. In addition,effective September 23, 2010, health insurers will not be permitted to deny coverage to children based upon apre-existing condition and must allow dependent care coverage for children up to 26 years old.
Larger employers will be subject to new requirements and incentives to provide health insurance benefitsto their full time employees. Effective January 1, 2014, employers with 50 or more employees that do notoffer health insurance will be held subject to a penalty if an employee obtains coverage through an Exchangeif the coverage is subsidized by the government. The employer penalties will range from $2,000 to $3,000 peremployee, subject to certain thresholds and conditions.
As enacted, the Health Reform Law uses various means to induce individuals who do not have healthinsurance to obtain coverage. By January 1, 2014, individuals will be required to maintain health insurance fora minimum defined set of benefits or pay a tax penalty. The penalty in most cases is $95 in 2014, $325 in2015, $695 in 2016, and indexed to a cost of living adjustment in subsequent years. The IRS, in consultationwith HHS, is responsible for enforcing the tax penalty, although the Health Reform Law limits the availabilityof certain IRS enforcement mechanisms. In addition, for individuals and families below 400% of the FPL, thecost of obtaining health insurance through the Exchanges will be subsidized by the federal government. Thosewith lower incomes will be eligible to receive greater subsidies. It is anticipated that those at the lowestincome levels will have the majority of their premiums subsidized by the federal government, in some cases inexcess of 95% of the premium amount.
To facilitate the purchase of health insurance by individuals and small employers, each state mustestablish an Exchange by January 1, 2014. Based on CBO and CMS estimates, between 29 and 31 millionindividuals will obtain their health insurance coverage through an Exchange by 2019. Of that amount, anestimated 16 million will be individuals who were previously uninsured, and 13 to 15 million will beindividuals who switched from their prior insurance coverage to a plan obtained through the Exchange. TheHealth Reform Law requires that the Exchanges be designed to make the process of evaluating, comparingand acquiring coverage simple for consumers. For example, each state’s Exchange must maintain an internetwebsite through which consumers may access health plan ratings that are assigned by the state based onquality and price, view governmental health program eligibility requirements and calculate the actual cost ofhealth coverage. Health insurers participating in an Exchange must offer a set of minimum benefits to bedefined by HHS and may offer more benefits. Health insurers must offer at least two, and up to five, levels ofplans that vary by the percentage of medical expenses that must be paid by the enrollee. These levels arereferred to as platinum, gold, silver, bronze and catastrophic plans, with gold and silver being the twomandatory levels of plans. Each level of plan must require the enrollee to share the following percentages ofmedical expenses up to the deductible/co-payment limit: platinum, 10%; gold, 20%; silver, 30%; bronze, 40%;and catastrophic, 100%. Health insurers may establish varying deductible/co-payment levels, up to thestatutory maximum (estimated to be between $6,000 and $7,000 for an individual). The health insurers mustcover 100% of the amount of medical expenses in excess of the deductible/co-payment limit. For example, anindividual making 100% to 200% of the FPL will have co-payments and deductibles reduced to about one-third of the amount payable by those with the same plan with incomes at or above 400% of the FPL.
89
Public Program Spending
The Health Reform Law provides for Medicare, Medicaid and other federal health care program spendingreductions between 2010 and 2019. The CBO estimates that these will include $156 billion in Medicarefee-for-service market basket and productivity reimbursement reductions for all providers, the majority ofwhich will come from hospitals; CMS sets this estimate at $233 billion. The CBO estimates also include anadditional $36 billion in reductions of Medicare and Medicaid disproportionate share funding ($22 billion forMedicare and $14 billion for Medicaid). CMS estimates include an additional $64 billion in reductions ofMedicare and Medicaid disproportionate share funding, with $50 billion of the reductions coming fromMedicare.
Payments for Hospitals and Ambulatory Surgery Centers
Inpatient Market Basket and Productivity Adjustment. Under the Medicare program, hospitals receivereimbursement under a PPS for general, acute care hospital inpatient services. CMS establishes fixed PPSpayment amounts per inpatient discharge based on the patient’s assigned MS-DRG. These MS-DRG rates areupdated each federal fiscal year, which begins October 1, using a market basket index that takes into accountinflation experienced by hospitals and other entities outside the health care industry in purchasing goods andservices.
The Health Reform Law provides for three types of annual reductions in the market basket. The first is ageneral reduction of a specified percentage each federal fiscal year starting in 2010 and extending through2019. These reductions are as follows: federal fiscal year 2010, 0.25% for discharges occurring on or afterApril 1, 2010; 2011 (0.25%); 2012 (0.1%); 2013 (0.1%); 2014 (0.3%); 2015 (0.2%); 2016 (0.2%); 2017(0.75%); 2018 (0.75%); and 2019 (0.75%).
The second type of reduction to the market basket is a “productivity adjustment” that will beimplemented by HHS beginning in federal fiscal year 2012. The amount of that reduction will be the projectednationwide productivity gains over the preceding 10 years. To determine the projection, HHS will use the BLS10-year moving average of changes in specified economy-wide productivity (the BLS data is typically a fewyears old). The Health Reform Law does not contain guidelines for HHS to use in projecting the productivityfigure. Based upon the latest available data, federal fiscal year 2012 market basket reductions resulting fromthis productivity adjustment are likely to range from 1% to 1.4%.
The third type of reduction is in connection with the value-based purchasing program discussed in moredetail below. Beginning in federal fiscal year 2013, CMS will reduce the inpatient PPS payment amount for alldischarges by the following: 1% for 2013; 1.25% for 2014; 1.5% for 2015; 1.75% for 2016; and 2% for 2017and subsequent years. For each federal fiscal year, the total amount collected from these reductions will bepooled and used to fund payments to hospitals that satisfy certain quality metrics. While some or all of thesereductions may be recovered if a hospital satisfies these quality metrics, the recovery amounts may bedelayed.
If the aggregate of the three market basket reductions described above is more than the annual marketbasket adjustments made to account for inflation, there will be a reduction in the MS-DRG rates paid tohospitals. For example, for the federal fiscal year 2011 hospital inpatient PPS, the market basket increase toaccount for inflation is 2.6% and the aggregate reduction due to the Health Reform Law and thedocumentation and coding adjustment is 3.15%. Thus, the rates paid to a hospital for inpatient services infederal fiscal year 2011 will be 0.55% less than rates paid for the same services in the prior year.
Quality-Based Payment Adjustments and Reductions for Inpatient Services. The Health Reform Lawestablishes or expands three provisions to promote value-based purchasing and to link payments to quality andefficiency. First, in federal fiscal year 2013, HHS is directed to implement a value-based purchasing programfor inpatient hospital services. This program will reward hospitals that meet certain quality performancestandards established by HHS. The Health Reform Law provides HHS considerable discretion over the value-based purchasing program. For example, HHS will determine the quality performance measures, the standardshospitals must achieve in order to meet the quality performance measures, and the methodology for
90
calculating payments to hospitals that meet the required quality threshold. HHS will also determine how muchmoney each hospital will receive from the pool of dollars created by the reductions related to the value-basedpurchasing program as described above. Because the Health Reform Law provides that the pool will be fullydistributed, hospitals that meet or exceed the quality performance standards set by HHS will receive greaterreimbursement under the value-based purchasing program than they would have otherwise. On the other hand,hospitals that do not achieve the necessary quality performance will receive reduced Medicare inpatienthospital payments. On January 7, 2011, CMS issued a proposed rule for the value-based purchasing programthat would use 17 clinical process of care measures and eight dimensions of a patient’s experience of careusing the HCAHPS survey to determine incentive payments for federal fiscal year 2013. As proposed, theincentive payments would be calculated based on a combination of measures of hospitals’ achievement of theperformance standards and their improvement in meeting the performance standards compared to priorperiods. To determine payments in federal fiscal year 2013, the baseline performance period (measurementstandard) as proposed would be July 1, 2009 through March 31, 2010. To determine whether hospitals meetperformance standards, CMS would compare each hospital’s performance in the period July 1, 2011 throughMarch 31, 2012 to its performance in the baseline performance period. CMS has not yet proposed specificthreshold values for the performance standards. CMS also proposes to add three outcome measures for federalfiscal year 2014, for which the performance period would be July 1, 2011 through December 31, 2012 and thebaseline performance period would be July 1, 2008 through December 31, 2009.
Second, beginning in federal fiscal year 2013, inpatient payments will be reduced if a hospitalexperiences “excessive readmissions” within a time period specified by HHS from the date of discharge forheart attack, heart failure, pneumonia or other conditions designated by HHS. Hospitals with what HHSdefines as “excessive readmissions” for these conditions will receive reduced payments for all inpatientdischarges, not just discharges relating to the conditions subject to the excessive readmission standard. Eachhospital’s performance will be publicly reported by HHS. HHS has the discretion to determine what “excessivereadmissions” means and other terms and conditions of this program.
Third, reimbursement will be reduced based on a facility’s HAC rates. An HAC is a condition that isacquired by a patient while admitted as an inpatient in a hospital, such as a surgical site infection. Beginningin federal fiscal year 2015, the 25% of hospitals with the worst national risk-adjusted HAC rates in theprevious year will receive a 1% reduction in their total inpatient operating Medicare payments. In addition,effective July 1, 2011, the Health Reform Law prohibits the use of federal funds under the Medicaid programto reimburse providers for medical services provided to treat HACs.
Outpatient Market Basket and Productivity Adjustment. Hospital outpatient services paid under PPS areclassified into APCs. The APC payment rates are updated each calendar year based on the market basket. Thefirst two market basket changes outlined above— the general reduction and the productivity adjustment —apply to outpatient services as well as inpatient services, although these are applied on a calendar year basis.The percentage changes specified in the Health Reform Law summarized above as the general reduction forinpatients — e.g., 0.2% in 2015— are the same for outpatients.
Medicare and Medicaid DSH Payments. The Medicare DSH program provides for additional paymentsto hospitals that treat a disproportionate share of low-income patients. Under the Health Reform Law,beginning in federal fiscal year 2014, Medicare DSH payments will be reduced to 25% of the amount theyotherwise would have been absent the law. The remaining 75% of the amount that would otherwise be paidunder Medicare DSH will be effectively pooled, and this pool will be reduced further each year by a formulathat reflects reductions in the national level of uninsured who are under 65 years of age. In other words, thegreater the level of coverage for the uninsured nationally, the more the Medicare DSH payment pool will bereduced. Each hospital will then be paid, out of the reduced DSH payment pool, an amount allocated basedupon its level of uncompensated care.
It is difficult to predict the full impact of the Medicare DSH reductions, and CBO and CMS estimatesdiffer by $38 billion. The Health Reform Law does not mandate what data source HHS must use to determinethe reduction, if any, in the uninsured population nationally. In addition, the Health Reform Law does notcontain a definition of “uncompensated care.” As a result, it is unclear how a hospital’s share of the Medicare
91
DSH payment pool will be calculated. CMS could use the definition of “uncompensated care” used inconnection with hospital cost reports. However, in July 2009, CMS proposed material revisions to thedefinition of “uncompensated care” used for cost report purposes. Those revisions would exclude certainsignificant costs that had historically been covered, such as unreimbursed costs of Medicaid services. CMS hasnot issued a final rule, and the Health Reform Law does not require HHS to use this definition, even iffinalized, for DSH purposes. How CMS ultimately defines “uncompensated care” for purposes of these DSHfunding provisions could have a material effect on a hospital’s Medicare DSH reimbursements.
In addition to Medicare DSH funding, hospitals that provide care to a disproportionately high number of low-income patients may receive Medicaid DSH payments. The federal government distributes federal Medicaid DSHfunds to each state based on a statutory formula. The states then distribute the DSH funding among qualifyinghospitals. Although federal Medicaid law defines some level of hospitals that must receive Medicaid DSH funding,states have broad discretion to define additional hospitals that also may qualify for Medicaid DSH payments andthe amount of such payments. The Health Reform Law will reduce funding for the Medicaid DSH hospitalprogram in federal fiscal years 2014 through 2020 by the following amounts: 2014 ($500 million); 2015($600 million); 2016 ($600 million); 2017 ($1.8 billion); 2018 ($5 billion); 2019 ($5.6 billion); and 2020($4 billion). How such cuts are allocated among the states, and how the states allocate these cuts among providers,have yet to be determined.
ACOs. The Health Reform Law requires HHS to establish a Medicare Shared Savings Program thatpromotes accountability and coordination of care through the creation of ACOs. Beginning no later thanJanuary 1, 2012, the program will allow providers (including hospitals), physicians and other designatedprofessionals and suppliers to form ACOs and voluntarily work together to invest in infrastructure andredesign delivery processes to achieve high quality and efficient delivery of services. The program is intendedto produce savings as a result of improved quality and operational efficiency. ACOs that achieve qualityperformance standards established by HHS will be eligible to share in a portion of the amounts saved by theMedicare program. HHS has significant discretion to determine key elements of the program, including whatsteps providers must take to be considered an ACO, how to decide if Medicare program savings haveoccurred, and what portion of such savings will be paid to ACOs. In addition, HHS will determine to whatdegree hospitals, physicians and other eligible participants will be able to form and operate an ACO withoutviolating certain existing laws, including the Civil Monetary Penalty Law, the Anti-kickback Statute and theStark Law. However, the Health Reform Law does not authorize HHS to waive other laws that may impact theability of hospitals and other eligible participants to participate in ACOs, such as antitrust laws.
Bundled Payment Pilot Programs. The Health Reform Law requires HHS to establish a five-year,voluntary national bundled payment pilot program for Medicare services beginning no later than January 1,2013. Under the program, providers would agree to receive one payment for services provided to Medicarepatients for certain medical conditions or episodes of care. HHS will have the discretion to determine how theprogram will function. For example, HHS will determine what medical conditions will be included in theprogram and the amount of the payment for each condition. In addition, the Health Reform Law provides for afive-year bundled payment pilot program for Medicaid services to begin January 1, 2012. HHS will select upto eight states to participate based on the potential to lower costs under the Medicaid program whileimproving care. State programs may target particular categories of beneficiaries, selected diagnoses orgeographic regions of the state. The selected state programs will provide one payment for both hospital andphysician services provided to Medicaid patients for certain episodes of inpatient care. For both pilotprograms, HHS will determine the relationship between the programs and restrictions in certain existing laws,including the Civil Monetary Penalty Law, the Anti-kickback Statute, the Stark Law and the HIPAA privacy,security and transaction standard requirements. However, the Health Reform Law does not authorize HHS towaive other laws that may impact the ability of hospitals and other eligible participants to participate in thepilot programs, such as antitrust laws.
Ambulatory Surgery Centers. The Health Reform Law reduces reimbursement for ASCs through aproductivity adjustment to the market basket similar to the productivity adjustment for inpatient and outpatienthospital services, beginning in federal fiscal year 2011.
92

Medicare Managed Care (Medicare Advantage or “MA”). Under the MA program, the federalgovernment contracts with private health plans to provide inpatient and outpatient benefits to beneficiaries whoenroll in such plans. Nationally, approximately 22% of Medicare beneficiaries have elected to enroll in MAplans. Effective in 2014, the Health Reform Law requires MA plans to keep annual administrative costs lowerthan 15% of annual premium revenue. The Health Reform Law reduces, over a three year period, premiumpayments to the MA plans such that CMS’ managed care per capita premium payments are, on average, equalto traditional Medicare. In addition, the Health Reform Law implements fee payment adjustments based onservice benchmarks and quality ratings. As a result of these changes, payments to MA plans are estimated tobe reduced by $138 to $145 billion between 2010 and 2019. These reductions to MA plan premium paymentsmay cause some plans to raise premiums or limit benefits, which in turn might cause some Medicarebeneficiaries to terminate their MA coverage and enroll in traditional Medicare.
Specialty Hospital Limitations
Over the last decade, we have faced significant competition from hospitals that have physician ownership.The Health Reform Law prohibits newly created physician-owned hospitals from billing for Medicare patientsreferred by their physician owners. As a result, the law effectively prevents the formation of new physician-owned hospitals after December 31, 2010. While the law grandfathers existing physician-owned hospitals, itdoes not allow these hospitals to increase the percentage of physician ownership and significantly restrictstheir ability to expand services.
Program Integrity and Fraud and Abuse
The Health Reform Law makes several significant changes to health care fraud and abuse laws, providesadditional enforcement tools to the government, increases cooperation between agencies by establishingmechanisms for the sharing of information and enhances criminal and administrative penalties for non-compliance. For example, the Health Reform Law: (1) provides $350 million in increased federal funding overthe next 10 years to fight health care fraud, waste and abuse; (2) expands the scope of the RAC program toinclude MA plans and Medicaid; (3) authorizes HHS, in consultation with the OIG, to suspend Medicare andMedicaid payments to a provider of services or a supplier “pending an investigation of a credible allegation offraud;” (4) provides Medicare contractors with additional flexibility to conduct random prepayment reviews;and (5) tightens up the rules for returning overpayments made by governmental health programs and expandsFCA liability to include failure to timely repay identified overpayments.
Impact of Health Reform Law on the Company
The expansion of health insurance coverage under the Health Reform Law may result in a materialincrease in the number of patients using our facilities who have either private or public program coverage. Inaddition, a disproportionately large percentage of the new Medicaid coverage is likely to be in states thatcurrently have relatively low income eligibility requirements. Two such states are Texas and Florida, whereabout one-half of the Company’s licensed beds are located. We also have a significant presence in otherrelatively low income eligibility states, including Georgia, Kansas, Louisiana, Missouri, Oklahoma andVirginia. Further, the Health Reform Law provides for a value-based purchasing program, the establishment ofACOs and bundled payment pilot programs, which will create possible sources of additional revenue.
However, it is difficult to predict the size of the potential revenue gains to the Company as a result ofthese elements of the Health Reform Law, because of uncertainty surrounding a number of material factors,including the following:
• how many previously uninsured individuals will obtain coverage as a result of the Health Reform Law(while the CBO estimates 32 million, CMS estimates almost 34 million; both agencies made a numberof assumptions to derive that figure, including how many individuals will ignore substantial subsidiesand decide to pay the penalty rather than obtain health insurance and what percentage of people in thefuture will meet the new Medicaid income eligibility requirements);
93

• what percentage of the newly insured patients will be covered under the Medicaid program and whatpercentage will be covered by private health insurers;
• the extent to which states will enroll new Medicaid participants in managed care programs;
• the pace at which insurance coverage expands, including the pace of different types of coverageexpansion;
• the change, if any, in the volume of inpatient and outpatient hospital services that are sought by andprovided to previously uninsured individuals;
• the rate paid to hospitals by private payers for newly covered individuals, including those coveredthrough the newly created Exchanges and those who might be covered under the Medicaid programunder contracts with the state;
• the rate paid by state governments under the Medicaid program for newly covered individuals;
• how the value-based purchasing and other quality programs will be implemented;
• the percentage of individuals in the Exchanges who select the high deductible plans, since healthinsurers offering those kinds of products have traditionally sought to pay lower rates to hospitals;
• whether the net effect of the Health Reform Law, including the prohibition on excluding individualsbased on pre-existing conditions, the requirement to keep medical costs at or above a specified minimumpercentage of premium revenue, other health insurance reforms and the annual fee applied to all healthinsurers, will be to put pressure on the bottom line of health insurers, which in turn might cause them toseek to reduce payments to hospitals with respect to both newly insured individuals and their existingbusiness; and
• the possibility that implementation of the provisions expanding health insurance coverage or the entireHealth Reform Law will be delayed due to court challenges or revised or eliminated as a result of courtchallenges and efforts to repeal or amend the law. More than 20 challenges to the Health Reform Lawhave been filed in federal courts. Some federal district courts have upheld the constitutionality of theHealth Reform Law or dismissed cases on procedural grounds. Others have held unconstitutional therequirement that individuals maintain health insurance or pay a penalty and have either found the entireHealth Reform Law void in its entirety or left the remainder of the Health Reform Law intact. Theselawsuits are subject to appeal, and several are currently on appeal, including those that hold the lawunconstitutional.
On the other hand, the Health Reform Law provides for significant reductions in the growth of Medicarespending, reductions in Medicare and Medicaid DSH payments and the establishment of programs wherereimbursement is tied to quality and integration. Since 40.7% of our revenues in 2010 were from Medicareand Medicaid, reductions to these programs may significantly impact the Company and could offset anypositive effects of the Health Reform Law. It is difficult to predict the size of the revenue reductions toMedicare and Medicaid spending, because of uncertainty regarding a number of material factors, including thefollowing:
• the amount of overall revenues the Company will generate from Medicare and Medicaid business whenthe reductions are implemented;
• whether reductions required by the Health Reform Law will be changed by statute or by judicialdecision prior to becoming effective;
• the size of the Health Reform Law’s annual productivity adjustment to the market basket beginning in2012 payment years;
• the amount of the Medicare DSH reductions that will be made, commencing in federal fiscal year2014;
94
• the allocation to our hospitals of the Medicaid DSH reductions, commencing in federal fiscal year2014;
• what the losses in revenues will be, if any, from the Health Reform Law’s quality initiatives;
• how successful ACOs, in which we anticipate participating, will be at coordinating care and reducingcosts or whether they will decrease reimbursement;
• the scope and nature of potential changes to Medicare reimbursement methods, such as an emphasis onbundling payments or coordination of care programs;
• whether the Company’s revenues from UPL programs will be adversely affected, because there may befewer indigent, non-Medicaid patients for whom the Company provides services pursuant to UPLprograms; and
• reductions to Medicare payments CMS may impose for “excessive readmissions.”
Because of the many variables involved, we are unable to predict the net effect on the Company of theexpected increases in insured individuals using our facilities, the reductions in Medicare spending andreductions in Medicare and Medicaid DSH Funding, and numerous other provisions in the Health Reform Lawthat may affect the Company. Further, it is unclear how efforts to repeal or revise the Health Reform Law andfederal lawsuits challenging its constitutionality will be resolved or what the impact would be of any resultingchanges to the law.
General Economic and Demographic Factors
The United States economy has weakened significantly in recent years. Depressed consumer spending andhigher unemployment rates continue to pressure many industries. During economic downturns, governmentalentities often experience budget deficits as a result of increased costs and lower than expected tax collections.These budget deficits have forced federal, state and local government entities to decrease spending for health andhuman service programs, including Medicare, Medicaid and similar programs, which represent significant payersources for our hospitals. Other risks we face from general economic weakness include potential declines in thepopulation covered under managed care agreements, patient decisions to postpone or cancel elective and non-emergency health care procedures, potential increases in the uninsured and underinsured populations and furtherdifficulties in our collecting patient co-payment and deductible receivables. The Health Reform Law seeks todecrease over time the number of uninsured individuals, by among other things requiring employers to offer, andindividuals to carry, health insurance or be subject to penalties. However, it is difficult to predict the full impact ofthe Health Reform Law due to the law’s complexity, lack of implementing regulations or interpretive guidance,gradual and potentially delayed implementation, pending court challenges, and possible amendment or repeal.
The health care industry is impacted by the overall United States economy. The federal deficit, thegrowing magnitude of Medicare expenditures and the aging of the United States population will continue toplace pressure on federal health care programs.
Compliance Program
We maintain a comprehensive ethics and compliance program that is designed to meet or exceed applicablefederal guidelines and industry standards. The program is intended to monitor and raise awareness of variousregulatory issues among employees and to emphasize the importance of complying with governmental laws andregulations. As part of the ethics and compliance program, we provide annual ethics and compliance training to ouremployees and encourage all employees to report any violations to their supervisor, an ethics and complianceofficer or a toll-free telephone ethics line. The Health Reform Law requires providers to implement core elementsof a compliance program criteria to be established by HHS, on a timeline to be established by HHS, as a conditionof enrollment in the Medicare or Medicaid programs, and we may have to modify our compliance programs tocomply with these new criteria.
95

Antitrust Laws
The federal government and most states have enacted antitrust laws that prohibit certain types of conductdeemed to be anti-competitive. These laws prohibit price fixing, concerted refusal to deal, marketmonopolization, price discrimination, tying arrangements, acquisitions of competitors and other practices thathave, or may have, an adverse effect on competition. Violations of federal or state antitrust laws can result invarious sanctions, including criminal and civil penalties. Antitrust enforcement in the health care industry iscurrently a priority of the Federal Trade Commission. We believe we are in compliance with such federal andstate laws, but courts or regulatory authorities may reach a determination in the future that could adverselyaffect our operations.
96
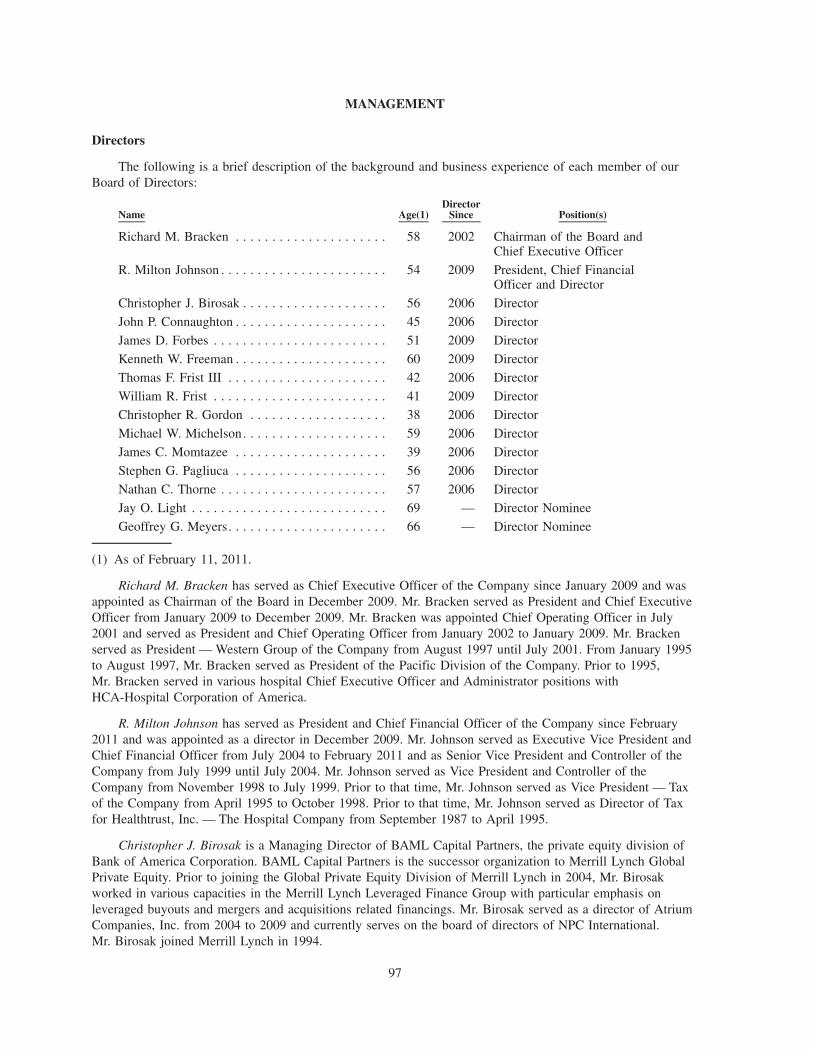
MANAGEMENT
Directors
The following is a brief description of the background and business experience of each member of ourBoard of Directors:
Name Age(1)Director
Since Position(s)
Richard M. Bracken . . . . . . . . . . . . . . . . . . . . . 58 2002 Chairman of the Board andChief Executive Officer
R. Milton Johnson . . . . . . . . . . . . . . . . . . . . . . . 54 2009 President, Chief FinancialOfficer and Director
Christopher J. Birosak . . . . . . . . . . . . . . . . . . . . 56 2006 Director
John P. Connaughton . . . . . . . . . . . . . . . . . . . . . 45 2006 Director
James D. Forbes . . . . . . . . . . . . . . . . . . . . . . . . 51 2009 Director
Kenneth W. Freeman . . . . . . . . . . . . . . . . . . . . . 60 2009 DirectorThomas F. Frist III . . . . . . . . . . . . . . . . . . . . . . 42 2006 Director
William R. Frist . . . . . . . . . . . . . . . . . . . . . . . . 41 2009 Director
Christopher R. Gordon . . . . . . . . . . . . . . . . . . . 38 2006 Director
Michael W. Michelson. . . . . . . . . . . . . . . . . . . . 59 2006 Director
James C. Momtazee . . . . . . . . . . . . . . . . . . . . . 39 2006 Director
Stephen G. Pagliuca . . . . . . . . . . . . . . . . . . . . . 56 2006 Director
Nathan C. Thorne . . . . . . . . . . . . . . . . . . . . . . . 57 2006 Director
Jay O. Light . . . . . . . . . . . . . . . . . . . . . . . . . . . 69 — Director Nominee
Geoffrey G. Meyers. . . . . . . . . . . . . . . . . . . . . . 66 — Director Nominee
(1) As of February 11, 2011.
Richard M. Bracken has served as Chief Executive Officer of the Company since January 2009 and wasappointed as Chairman of the Board in December 2009. Mr. Bracken served as President and Chief ExecutiveOfficer from January 2009 to December 2009. Mr. Bracken was appointed Chief Operating Officer in July2001 and served as President and Chief Operating Officer from January 2002 to January 2009. Mr. Brackenserved as President — Western Group of the Company from August 1997 until July 2001. From January 1995to August 1997, Mr. Bracken served as President of the Pacific Division of the Company. Prior to 1995,Mr. Bracken served in various hospital Chief Executive Officer and Administrator positions withHCA-Hospital Corporation of America.
R. Milton Johnson has served as President and Chief Financial Officer of the Company since February2011 and was appointed as a director in December 2009. Mr. Johnson served as Executive Vice President andChief Financial Officer from July 2004 to February 2011 and as Senior Vice President and Controller of theCompany from July 1999 until July 2004. Mr. Johnson served as Vice President and Controller of theCompany from November 1998 to July 1999. Prior to that time, Mr. Johnson served as Vice President — Taxof the Company from April 1995 to October 1998. Prior to that time, Mr. Johnson served as Director of Taxfor Healthtrust, Inc. — The Hospital Company from September 1987 to April 1995.
Christopher J. Birosak is a Managing Director of BAML Capital Partners, the private equity division ofBank of America Corporation. BAML Capital Partners is the successor organization to Merrill Lynch GlobalPrivate Equity. Prior to joining the Global Private Equity Division of Merrill Lynch in 2004, Mr. Birosakworked in various capacities in the Merrill Lynch Leveraged Finance Group with particular emphasis onleveraged buyouts and mergers and acquisitions related financings. Mr. Birosak served as a director of AtriumCompanies, Inc. from 2004 to 2009 and currently serves on the board of directors of NPC International.Mr. Birosak joined Merrill Lynch in 1994.
97
John P. Connaughton has been a Managing Director of Bain Capital Partners, LLC since 1997 and amember of the firm since 1989. Prior to joining Bain Capital, Mr. Connaughton was a consultant at Bain &Company, Inc., where he worked in the health care, consumer products and business services industries.Mr. Connaughton served as a director of Stericycle, Inc. from 1999 to 2005, M/C Communications (PriMed)from 2004 to 2009, AMC Theatres from 2004 to 2009, ProSiebenSat.1 Media from 2003 to 2007, CumulusMedia Partners from 2006 to 2008 and Epoch Senior Living from 2001 to 2007. He currently serves as adirector of Air Medical Group Holdings, Inc., Clear Channel Communications, Inc., CRC Health Corporation,Warner Chilcott, Ltd., Sungard Data Systems, Warner Music Group, Quintiles Transnational Corp. and TheBoston Celtics.
James D. Forbes has been Head of Bank of America’s Global Principal Investments Division since March2009. Mr. Forbes chairs the Investment Committee at BAML Capital Partners, the private equity division ofthe Bank of America Corporation. From November 2008 to March 2009, Mr. Forbes served as Head of AsiaPacific Corporate and Investment Banking based in Hong Kong. From August 2002 to November 2008, heserved as Global Head of Healthcare Investment Banking at Merrill Lynch. Before joining Merrill Lynch in1995, Mr. Forbes worked at CS First Boston where he was part of its Debt Capital Markets Group. Mr. Forbesalso serves on the Board of Conversus Capital, L.P. and Sterling Stamos Capital Management, L.P.
Kenneth W. Freeman has been a senior advisor of Kohlberg Kravis Roberts & Co. since August 2010 and,in August 2010, was appointed Dean of Boston University School of Management. From October 2009 toAugust 2010, Mr. Freeman was a member of KKR Management LLC, the general partner of KKR & Co. L.P.Before that, he was a member of the limited liability company which served as the general partner ofKohlberg Kravis Roberts & Co. L.P. since 2007 and joined the firm as Managing Director in May 2005. FromMay 2004 to December 2004, Mr. Freeman was Chairman of Quest Diagnostics Incorporated, and fromJanuary 1996 to May 2004, he served as Chairman and Chief Executive Officer of Quest DiagnosticsIncorporated. From May 1995 to December 1996, Mr. Freeman was President and Chief Executive Officer ofCorning Clinical Laboratories, the predecessor company to Quest Diagnostics. Prior to that, he served invarious general management and financial roles with Corning Incorporated. Mr. Freeman currently serves as adirector of Accellent, Inc. and Masonite, Inc., and is chairman of the board of trustees of Bucknell University.
Thomas F. Frist III is a principal of Frist Capital LLC, a private investment vehicle for Mr. Frist andcertain related persons and has held such position since 1998. Mr. Frist is also a general partner at FriscoPartners, another Frist family investment vehicle. Mr. Frist served as a director of Triad Hospitals, Inc. from1998 to October 2006 and currently serves as a director of SAIC, Inc. Mr. Frist is the brother of William R.Frist, who also serves as a director of the Company.
William R. Frist is a principal of Frist Capital LLC, a private investment vehicle for Mr. Frist and certainrelated persons and has held such position since 2003. Mr. Frist is also a general partner at Frisco Partners,another Frist family investment vehicle. Mr. Frist is the brother of Thomas F. Frist III, who also serves as adirector of the Company.
Christopher R. Gordon is a Managing Director of Bain Capital Partners, LLC and joined the firm in1997. Prior to joining Bain Capital, Mr. Gordon was a consultant at Bain & Company. Mr. Gordon currentlyserves as a director of Accellent, Inc., Air Medical Group Holdings, Inc., CRC Health Corporation andQuintiles Transnational Corp.
Michael W. Michelson has been a member of KKR Management LLC, the general partner of KKR & Co.L.P., since October 1, 2009. Before that, he was a member of the limited liability company which served asthe general partner of Kohlberg Kravis Roberts & Co. L.P. since 1996. Prior to that, he was a general partnerof Kohlberg Kravis Roberts & Co. L.P. Mr. Michelson served as a director of Accellent Inc. from 2005 to2009 and Alliance Imaging from 1999 to 2007. Mr. Michelson is currently a director of Biomet, Inc. and JazzPharmaceuticals, Inc.
James C. Momtazee has been a member of KKR Management LLC, the general partner of KKR & Co.L.P. since October 1, 2009. Before that, he was a member of the limited liability company which served as thegeneral partner of Kohlberg Kravis Roberts & Co. L.P. since 2009. From 1996 to 2009, he was an executive of
98

Kohlberg Kravis Roberts & Co. L.P. From 1994 to 1996, Mr. Momtazee was with Donaldson, Lufkin &Jenrette in its investment banking department. Mr. Momtazee served as a director of Alliance Imaging from2002 to 2007 and Accuride from March 2005 to December 2005 and currently serves as a director ofAccellent, Inc. and Jazz Pharmaceuticals, Inc.
Stephen G. Pagliuca is a Managing Director of Bain Capital Partners, LLC. Mr. Pagliuca is also a ManagingPartner and an owner of the Boston Celtics basketball franchise. Mr. Pagliuca joined Bain & Company in 1982 andfounded the Information Partners private equity fund for Bain Capital in 1989. He also worked as a senioraccountant and international tax specialist for Peat Marwick Mitchell & Company in the Netherlands. Mr. Pagliucaserved as a director of Warner Chilcott, Ltd. from 2005 to 2009, HCA Inc. from November 2006 to September2009, Quintiles Transnational Corp. from 2008 to 2009, M/C Communications from 2004 to 2009, FCI, S.A. from2005 to 2009 and Burger King Holdings Inc. from 2002 to 2010 and currently serves as a director of Gartner, Inc.
Nathan C. Thorne was a Senior Vice President of Merrill Lynch & Co., Inc., a subsidiary of Bank ofAmerica Corporation, from February 2006 to July 2009, and President of Merrill Lynch Global Private Equityfrom 2002 to 2009. Mr. Thorne joined Merrill Lynch in 1984. Mr. Thorne served as a director of NuveenInvestments, Inc. from December 2007 to February 2011.
Jay O. Light will be an independent director upon the pricing of this offering. Mr. Light has also servedas a member of the board of directors of The Blackstone Group L.P.’s general partner since September 2008.Mr. Light is the Dean Emeritus of Harvard Business School and, prior to becoming Dean in April 2006,Mr. Light was Senior Associate Dean, Chairman of the Finance Area, and a professor teaching InvestmentManagement, Capital Markets, and Entrepreneurial Finance for 30 years. Mr. Light is a director of theHarvard Management Company, a director of Partners HealthCare (the Mass General and Brigham &Women’s Hospitals) and chairman of its Investment Committee, a member of the Investment Committee ofseveral endowments and a director of several private firms. In prior years until 2008, Mr. Light was a Trusteeof the GMO Trusts, a family of mutual funds for institutional investors.
Geoffrey G. Meyers will be an independent director upon the pricing of this offering. Mr. Meyers has alsoserved as a director PharMerica Corporation since November 2009, and currently is Chairman of the Boardand, in February 2010, became a member of its Nominating and Governance Committee. Mr. Meyers is theretired Chief Financial Officer and Executive Vice President and Treasurer for Manor Care, Inc. where he hadresponsibility for administration and financial management from 1988 until 2006 and was a director of HealthCare and Retirement Corp., a predecessor of Manor Care, Inc., from 1991 to 1998. Mr. Meyers currently isChairman of the Board of the Trust Company of Toledo, a northwestern Ohio trust bank. He is also Treasurerof the Board of Directors of Mercy Health Partners, the northern region of Catholic Health Partners. He hasbeen appointed a part-time member of senior management at flexible solar panel manufacturer, XunlightCorporation. He received his BS from Northwestern University and his MBA from The Ohio State University.
99
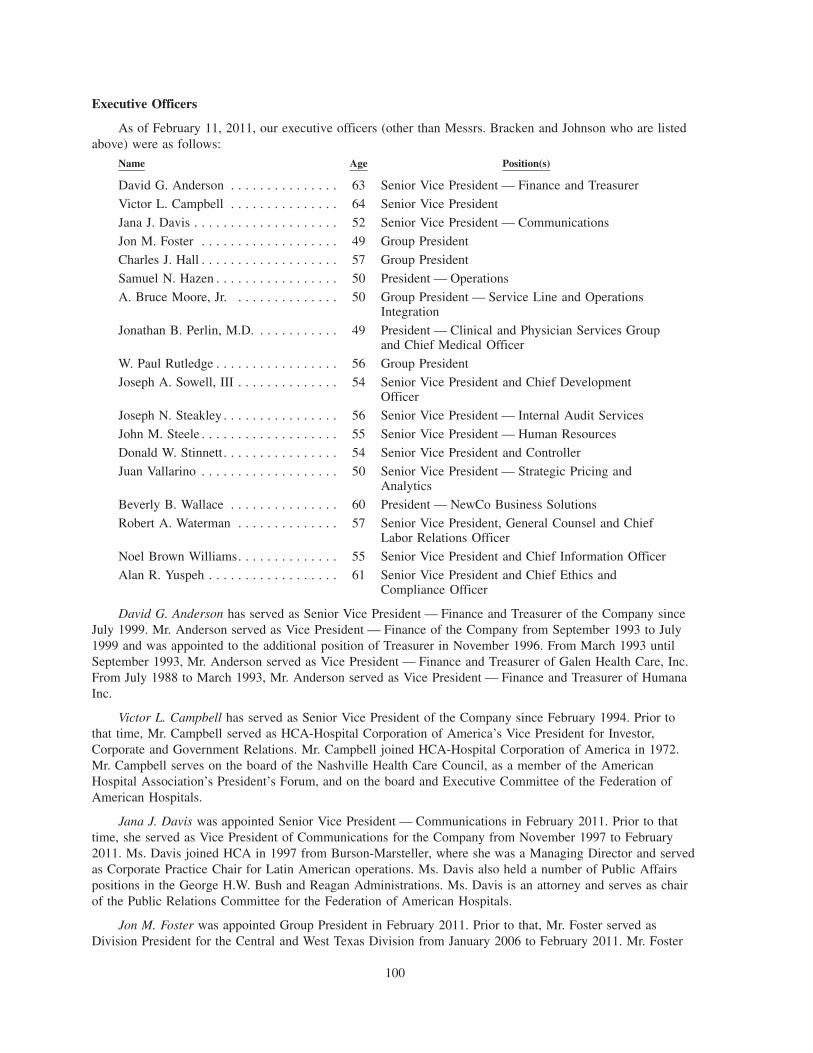
Executive Officers
As of February 11, 2011, our executive officers (other than Messrs. Bracken and Johnson who are listedabove) were as follows:
Name Age Position(s)
David G. Anderson . . . . . . . . . . . . . . . 63 Senior Vice President — Finance and Treasurer
Victor L. Campbell . . . . . . . . . . . . . . . 64 Senior Vice President
Jana J. Davis . . . . . . . . . . . . . . . . . . . . 52 Senior Vice President — Communications
Jon M. Foster . . . . . . . . . . . . . . . . . . . 49 Group President
Charles J. Hall . . . . . . . . . . . . . . . . . . . 57 Group President
Samuel N. Hazen . . . . . . . . . . . . . . . . . 50 President — Operations
A. Bruce Moore, Jr. . . . . . . . . . . . . . . 50 Group President — Service Line and OperationsIntegration
Jonathan B. Perlin, M.D. . . . . . . . . . . . 49 President — Clinical and Physician Services Groupand Chief Medical Officer
W. Paul Rutledge . . . . . . . . . . . . . . . . . 56 Group President
Joseph A. Sowell, III . . . . . . . . . . . . . . 54 Senior Vice President and Chief DevelopmentOfficer
Joseph N. Steakley . . . . . . . . . . . . . . . . 56 Senior Vice President — Internal Audit Services
John M. Steele . . . . . . . . . . . . . . . . . . . 55 Senior Vice President — Human Resources
Donald W. Stinnett. . . . . . . . . . . . . . . . 54 Senior Vice President and Controller
Juan Vallarino . . . . . . . . . . . . . . . . . . . 50 Senior Vice President — Strategic Pricing andAnalytics
Beverly B. Wallace . . . . . . . . . . . . . . . 60 President — NewCo Business Solutions
Robert A. Waterman . . . . . . . . . . . . . . 57 Senior Vice President, General Counsel and ChiefLabor Relations Officer
Noel Brown Williams. . . . . . . . . . . . . . 55 Senior Vice President and Chief Information Officer
Alan R. Yuspeh . . . . . . . . . . . . . . . . . . 61 Senior Vice President and Chief Ethics andCompliance Officer
David G. Anderson has served as Senior Vice President — Finance and Treasurer of the Company sinceJuly 1999. Mr. Anderson served as Vice President — Finance of the Company from September 1993 to July1999 and was appointed to the additional position of Treasurer in November 1996. From March 1993 untilSeptember 1993, Mr. Anderson served as Vice President — Finance and Treasurer of Galen Health Care, Inc.From July 1988 to March 1993, Mr. Anderson served as Vice President — Finance and Treasurer of HumanaInc.
Victor L. Campbell has served as Senior Vice President of the Company since February 1994. Prior tothat time, Mr. Campbell served as HCA-Hospital Corporation of America’s Vice President for Investor,Corporate and Government Relations. Mr. Campbell joined HCA-Hospital Corporation of America in 1972.Mr. Campbell serves on the board of the Nashville Health Care Council, as a member of the AmericanHospital Association’s President’s Forum, and on the board and Executive Committee of the Federation ofAmerican Hospitals.
Jana J. Davis was appointed Senior Vice President — Communications in February 2011. Prior to thattime, she served as Vice President of Communications for the Company from November 1997 to February2011. Ms. Davis joined HCA in 1997 from Burson-Marsteller, where she was a Managing Director and servedas Corporate Practice Chair for Latin American operations. Ms. Davis also held a number of Public Affairspositions in the George H.W. Bush and Reagan Administrations. Ms. Davis is an attorney and serves as chairof the Public Relations Committee for the Federation of American Hospitals.
Jon M. Foster was appointed Group President in February 2011. Prior to that, Mr. Foster served asDivision President for the Central and West Texas Division from January 2006 to February 2011. Mr. Foster
100

joined HCA in March 2001 as President and CEO of St. David’s HealthCare in Austin, Texas and served inthat position until February 2011. Prior to joining the Company, Mr. Foster served in various executivecapacities within the Baptist Health System, Knoxville, Tennessee and The Methodist Hospital System inHouston, Texas.
Charles J. Hall was appointed Group President in October 2006; his formal title prior to February 2011was President — Eastern Group. Prior to that time, Mr. Hall had served as President — North Florida Divisionsince April 2003. Mr. Hall had previously served the Company as President of the East Florida Division fromJanuary 1999 until April 2003, as a Market President in the East Florida Division from January 1998 untilDecember 1998, as President of the South Florida Division from February 1996 until December 1997, and asPresident of the Southwest Florida Division from October 1994 until February 1996, and in various othercapacities since 1987.
Samuel N. Hazen was appointed President — Operations of the Company in February 2011. Mr. Hazenserved as President — Western Group from July 2001 to February 2011 and as Chief Financial Officer —Western Group of the Company from August 1995 to July 2001. Mr. Hazen served as Chief FinancialOfficer — North Texas Division of the Company from February 1994 to July 1995. Prior to that time,Mr. Hazen served in various hospital and regional Chief Financial Officer positions with Humana Inc. andGalen Health Care, Inc.
A. Bruce Moore, Jr. was appointed Group President — Service Line and Operations Integration inFebruary 2011. Mr. Moore had served as President — Outpatient Services Group since January 2006. Mr.Moore served as Senior Vice President and as Chief Operating Officer — Outpatient Services Group from July2004 to January 2006 and as Senior Vice President — Operations Administration from July 1999 until July2004. Mr. Moore served as Vice President — Operations Administration of the Company from September1997 to July 1999, as Vice President — Benefits from October 1996 to September 1997, and as VicePresident — Compensation from March 1995 until October 1996.
Dr. Jonathan B. Perlin was appointed President — Clinical and Physician Services Group and ChiefMedical Officer in February 2011. Dr. Perlin had served as President — Clinical Services Group and ChiefMedical Officer from November 2007 to February 2011 and as Chief Medical Officer and Senior VicePresident — Quality of the Company from August 2006 to November 2007. Prior to joining the Company,Dr. Perlin served as Under Secretary for Health in the U.S. Department of Veterans Affairs since April 2004.Dr. Perlin joined the Veterans Health Administration in November 1999 where he served in various capacities,including as Deputy Under Secretary for Health from July 2002 to April 2004, and as Chief Quality andPerformance Officer from November 1999 to September 2002.
W. Paul Rutledge was appointed as Group President in October 2005; his formal title prior to February2011 was President — Central Group. Mr. Rutledge had served as President of the MidAmerica Division sinceJanuary 2001. He served as President of TriStar Health System from June 1996 to January 2001 and served asPresident of Centennial Medical Center from May 1993 to June 1996. He has served in leadership capacitieswith HCA for more than 28 years, working with hospitals in the United States and London, England.
Joseph A. Sowell, III was appointed as Senior Vice President and Chief Development Officer of theCompany in December 2009. From 1987 to 1996 and again from 1999 to 2009, Mr. Sowell was a partner atthe law firm of Waller Lansden Dortch & Davis where he specialized in the areas of health care law, mergersand acquisitions, joint ventures, private equity financing, tax law and general corporate law. He also co-managed the firm’s corporate and commercial transactions practice. From 1996 to 1999, Mr. Sowell served asthe head of development, and later as the Chief Operating Officer of Arcon Healthcare.
Joseph N. Steakley has served as Senior Vice President — Internal Audit Services of the Company sinceJuly 1999. Mr. Steakley served as Vice President — Internal Audit Services from November 1997 to July1999. From October 1989 until October 1997, Mr. Steakley was a partner with Ernst & Young LLP.Mr. Steakley is a member of the board of directors of J. Alexander’s Corporation, where he serves on thecompensation committee and as chairman of the audit committee.
101

John M. Steele has served as Senior Vice President — Human Resources of the Company sinceNovember 2003. Mr. Steele served as Vice President — Compensation and Recruitment of the Company fromNovember 1997 to October 2003. From March 1995 to November 1997, Mr. Steele served as Assistant VicePresident — Recruitment.
Donald W. Stinnett has served as Senior Vice President and Controller since December 2008. Mr. Stinnettserved as Chief Financial Officer — Eastern Group from October 2005 to December 2008 and Chief FinancialOfficer of the Far West Division from July 1999 to October 2005. Mr. Stinnett served as Chief FinancialOfficer and Vice President of Finance of Franciscan Health System of the Ohio Valley from 1995 until 1999,and served in various capacities with Franciscan Health System of Cincinnati and Providence Hospital inCincinnati prior to that time.
Juan Vallarino was appointed Senior Vice President — Strategic Pricing and Analytics in February 2011.Prior to that time, Mr. Vallarino had served as Vice President — Strategic Pricing and Analytics since October2006. Prior to that, Mr. Vallarino served as Vice President of Managed Care for the Western Group of theCompany from January 1998 to October 2006.
Beverly B. Wallace was appointed President — NewCo Business Solutions in February 2011. From March2006 until February 2011, Ms. Wallace served as President — Shared Services Group, and from January 2003until March 2006, Ms. Wallace served as President — Financial Services Group. Ms. Wallace served as SeniorVice President — Revenue Cycle Operations Management of the Company from July 1999 to January 2003.Ms. Wallace served as Vice President — Managed Care of the Company from July 1998 to July 1999. From1997 to 1998, Ms. Wallace served as President — Homecare Division of the Company. From 1996 to 1997,Ms. Wallace served as Chief Financial Officer — Nashville Division of the Company. From 1994 to 1996,Ms. Wallace served as Chief Financial Officer — Mid-America Division of the Company.
Robert A. Waterman has served as Senior Vice President and General Counsel of the Company sinceNovember 1997 and Chief Labor Relations Officer since March 2009. Mr. Waterman served as a partner in thelaw firm of Latham & Watkins from September 1993 to October 1997; he was Chair of the firm’s health caregroup during 1997.
Noel Brown Williams has served as Senior Vice President and Chief Information Officer of the Companysince October 1997. From October 1996 to September 1997, Ms. Williams served as Chief Information Officerfor American Service Group/Prison Health Services, Inc. From September 1995 to September 1996,Ms. Williams worked as an independent consultant. From June 1993 to June 1995, Ms. Williams served asVice President, Information Services for HCA Information Services. From February 1979 to June 1993, sheheld various positions with HCA-Hospital Corporation of America Information Services.
Alan R. Yuspeh has served as Senior Vice President and Chief Ethics and Compliance Officer of theCompany since May 2007. From October 1997 to May 2007, Mr. Yuspeh served as Senior Vice President —Ethics, Compliance and Corporate Responsibility of the Company. From September 1991 until October 1997,Mr. Yuspeh was a partner with the law firm of Howrey & Simon. As a part of his law practice, Mr. Yuspehserved from 1987 to 1997 as Coordinator of the Defense Industry Initiative on Business Ethics and Conduct.
Board of Directors
Our Board of Directors currently consists of thirteen directors, who are each managers of HerculesHolding. Upon the consummation of this offering, we will enter into a stockholders’ agreement (the“Stockholders’ Agreement”) with Hercules Holding and the Investors (other than the Sponsor Assignees)which, among other things, will provide for certain rights of the Sponsors and the Frist Entities to nominatemembers of our Board of Directors. See “Certain Relationships and Related Party Transactions.” In addition,Mr. Bracken’s and Mr. Johnson’s employment agreements provide that they will continue to serve as amember of our Board of Directors so long as they remain an officer of HCA. Because of these requirements,together with Hercules Holding’s ownership of approximately 96.8% of our outstanding common stock priorto this offering, we do not currently have a policy or procedures with respect to stockholder recommendationsfor nominees to the Board of Directors, nor do we have a nominating and corporate governance committee, or
102
a committee that serves a similar purpose. We intend to establish a nominating and corporate governancecommittee and stockholder nomination recommendation procedures upon the pricing this offering.
Upon the pricing of this offering, we intend to appoint Jay O. Light and Geoffrey G. Meyers as newmembers of our Board of Directors. Our Board has affirmatively determined that each of such nominees meetsthe definition of “independent director” for purposes of the New York Stock Exchange rules.
Controlled Company Exception
After completion of this offering, the Investors will continue to control a majority of our outstandingcommon stock. As a result, we will be a “controlled company” within the meaning of the New York StockExchange corporate governance standards. Under the New York Stock Exchange rules, a company of whichmore than 50% of the voting power is held by an individual, group or another company is a “controlledcompany” and may elect not to comply with certain New York Stock Exchange corporate governancerequirements, including:
• the requirement that a majority of the Board of Directors consist of independent directors;
• the requirement that we have a nominating and corporate governance committee that is composedentirely of independent directors with a written charter addressing the committee’s purpose andresponsibilities;
• the requirement that we have a compensation committee that is composed entirely of independentdirectors with a written charter addressing the committee’s purpose and responsibilities; and
• the requirement for an annual performance evaluation of the nominating and corporate governance andcompensation committees.
Following this offering, we intend to rely on these exemptions. As a result, we will not have a majority ofindependent directors on our Board of Directors nor will our compensation committee or nominating andcorporate governance committee consist entirely of independent directors and such committees will not besubject to annual performance evaluations. Accordingly, you will not have the same protections afforded tostockholders of companies that are subject to all of the New York Stock Exchange corporate governancerequirements.
103
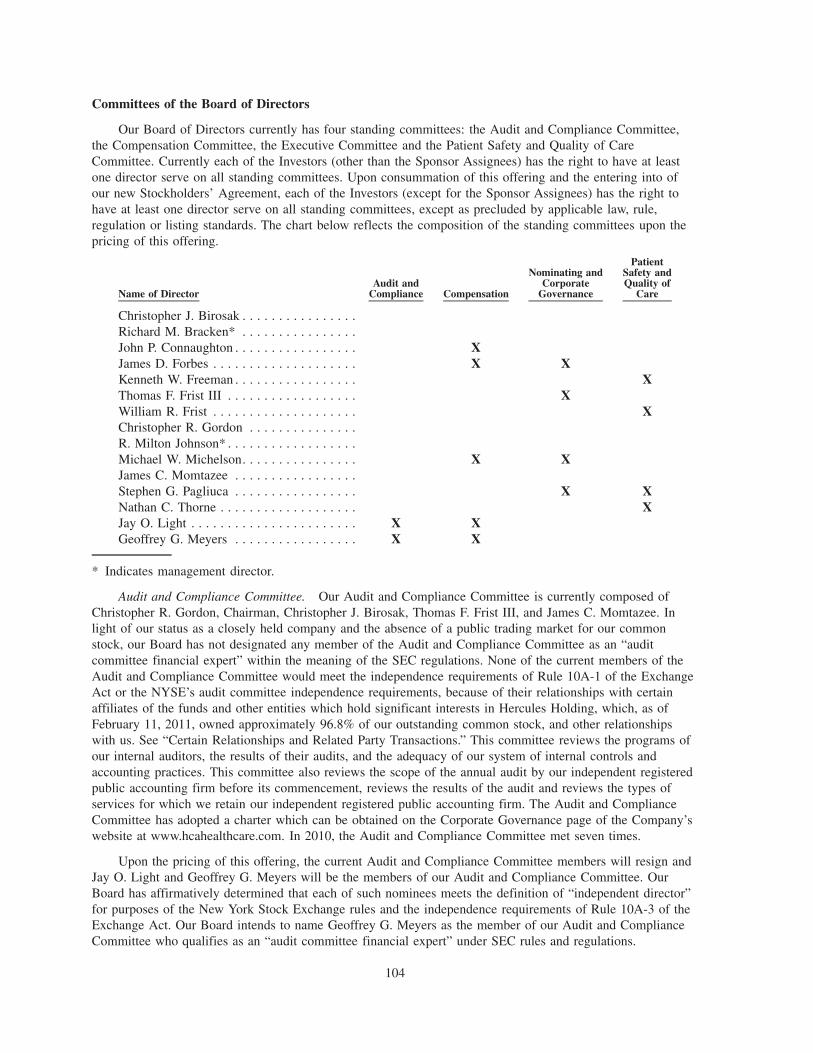
Committees of the Board of Directors
Our Board of Directors currently has four standing committees: the Audit and Compliance Committee,the Compensation Committee, the Executive Committee and the Patient Safety and Quality of CareCommittee. Currently each of the Investors (other than the Sponsor Assignees) has the right to have at leastone director serve on all standing committees. Upon consummation of this offering and the entering into ofour new Stockholders’ Agreement, each of the Investors (except for the Sponsor Assignees) has the right tohave at least one director serve on all standing committees, except as precluded by applicable law, rule,regulation or listing standards. The chart below reflects the composition of the standing committees upon thepricing of this offering.
Name of DirectorAudit and
Compliance Compensation
Nominating andCorporate
Governance
PatientSafety andQuality of
Care
Christopher J. Birosak . . . . . . . . . . . . . . . .Richard M. Bracken* . . . . . . . . . . . . . . . .John P. Connaughton . . . . . . . . . . . . . . . . . XJames D. Forbes . . . . . . . . . . . . . . . . . . . . X XKenneth W. Freeman . . . . . . . . . . . . . . . . . XThomas F. Frist III . . . . . . . . . . . . . . . . . . XWilliam R. Frist . . . . . . . . . . . . . . . . . . . . XChristopher R. Gordon . . . . . . . . . . . . . . .R. Milton Johnson* . . . . . . . . . . . . . . . . . .Michael W. Michelson. . . . . . . . . . . . . . . . X XJames C. Momtazee . . . . . . . . . . . . . . . . .Stephen G. Pagliuca . . . . . . . . . . . . . . . . . X XNathan C. Thorne . . . . . . . . . . . . . . . . . . . XJay O. Light . . . . . . . . . . . . . . . . . . . . . . . X XGeoffrey G. Meyers . . . . . . . . . . . . . . . . . X X
* Indicates management director.
Audit and Compliance Committee. Our Audit and Compliance Committee is currently composed ofChristopher R. Gordon, Chairman, Christopher J. Birosak, Thomas F. Frist III, and James C. Momtazee. Inlight of our status as a closely held company and the absence of a public trading market for our commonstock, our Board has not designated any member of the Audit and Compliance Committee as an “auditcommittee financial expert” within the meaning of the SEC regulations. None of the current members of theAudit and Compliance Committee would meet the independence requirements of Rule 10A-1 of the ExchangeAct or the NYSE’s audit committee independence requirements, because of their relationships with certainaffiliates of the funds and other entities which hold significant interests in Hercules Holding, which, as ofFebruary 11, 2011, owned approximately 96.8% of our outstanding common stock, and other relationshipswith us. See “Certain Relationships and Related Party Transactions.” This committee reviews the programs ofour internal auditors, the results of their audits, and the adequacy of our system of internal controls andaccounting practices. This committee also reviews the scope of the annual audit by our independent registeredpublic accounting firm before its commencement, reviews the results of the audit and reviews the types ofservices for which we retain our independent registered public accounting firm. The Audit and ComplianceCommittee has adopted a charter which can be obtained on the Corporate Governance page of the Company’swebsite at www.hcahealthcare.com. In 2010, the Audit and Compliance Committee met seven times.
Upon the pricing of this offering, the current Audit and Compliance Committee members will resign andJay O. Light and Geoffrey G. Meyers will be the members of our Audit and Compliance Committee. OurBoard has affirmatively determined that each of such nominees meets the definition of “independent director”for purposes of the New York Stock Exchange rules and the independence requirements of Rule 10A-3 of theExchange Act. Our Board intends to name Geoffrey G. Meyers as the member of our Audit and ComplianceCommittee who qualifies as an “audit committee financial expert” under SEC rules and regulations.
104
Our Audit and Compliance Committee will be responsible for, among other things:
• selecting the independent auditors,
• pre-approving all audit engagement fees and terms, as well as audit and permitted non-audit services tobe provided by the independent auditors,
• at least annually, obtaining and reviewing a report of the independent auditors describing the auditfirm’s internal quality-control procedures and any material issues raised by its most recent review ofinternal quality controls,
• evaluating the qualifications, performance and independence of the independent auditors,
• reviewing with the independent auditor any difficulties the independent auditor encountered during thecourse of the audit work, including any restrictions in the scope of activities or access to requestedinformation or any significant disagreements with management and management’s responses to suchmatters,
• setting policies regarding the hiring of current and former employees of the independent auditors,
• reviewing and discussing the annual audited and quarterly unaudited financial statements withmanagement and the independent auditor,
• discussing earnings press releases and the financial information and earnings guidance provided toanalysts and rating agencies,
• discussing policies governing the process by which risk assessment and risk management is to beundertaken,
• reviewing disclosures made by the CEO and CFO regarding any significant deficiencies or materialweaknesses in our internal control over financial reporting,
• reviewing with the independent auditor the internal audit responsibilities, budget and staffing, as well asprocedures for implementing recommendations made by the independent auditor and any significantmatters contained in reports from the internal audit department,
• establishing procedures for receipt, retention and treatment of complaints we receive regardingaccounting, auditing or internal controls and the confidential, anonymous submission of anonymousemployee concerns regarding questionable accounting and auditing matters,
• discussing with our general counsel legal or regulatory matters that could reasonably be expected tohave a material impact on business or financial statements,
• periodically evaluating performance of the Audit and Compliance Committee and reviewing andreassessing the Audit and Compliance Committee charter,
• providing information to our Board that may assist the Board in fulfilling its responsibility to overseethe integrity of the Company’s financial statements, the Company’s compliance with legal andregulatory requirements, the independent auditor’s qualifications and independence and the performanceof the Company’s internal audit function and independent auditor, and
• preparing the report required by the SEC to be included in our annual report on Form 10-K or ourproxy or information statement.
Our Board of Directors will adopt an amended written charter for the Audit and Compliance Committeewhich will be available on our website as soon as practical upon the consummation of this offering.
Compensation Committee. Our Compensation Committee is currently composed of James D. Forbes(Chairman), John P. Connaughton and Michael W. Michelson. None of the current members of ourCompensation Committee would meet the NYSE’s independence requirements. The Compensation Committeeis generally charged with the oversight of our executive compensation and rewards programs. Responsibilitiesof the Compensation Committee include the review and approval of the following items:
• executive compensation strategy and philosophy,
• compensation arrangements for executive management,
105
• design and administration of the annual cash-based Senior Officer Performance Excellence Program,
• design and administration of our equity incentive plans,
• executive benefits and perquisites (including the HCA Restoration Plan and the Supplemental ExecutiveRetirement Plan), and
• any other executive compensation or benefits related items deemed noteworthy by the CompensationCommittee.
The Compensation Committee may retain the services of independent outside consultants, as it deemsappropriate, to assist in the strategic review of programs and arrangements relating to executive compensationand performance. In 2010, the Compensation Committee hired Semler Brossy Consulting Group, LLC to assistin conducting an assessment of competitive executive compensation. Semler Brossy Consulting Group isretained by, and reports directly to, the Compensation Committee. A consultant from the firm attends most ofthe Compensation Committee meetings in person or by phone and supports the Committee’s role by providingindependent expertise. Its main responsibilities are to:
• review and advise on the Company’s executive compensation programs, including base salaries, short-and long-term incentives, and other benefits, if any,
• review and analyze peer proxy officer compensation, compensation survey data, and other publiclyavailable data,
• review and analyze management prepared market pricing analysis (i.e., review compensation surveysused, job matches, survey weightings, and year-over-year change in analysis results), and
• advise on current trends in compensation including design and pay levels.
The Compensation Committee may consider recommendations from our Chief Executive Officer andcompensation consultants, among other factors, in making its compensation determinations. The CompensationCommittee has the authority to delegate any of its responsibilities to one or more subcommittees as thecommittee may deem appropriate. For a discussion of the processes and procedures for determining executiveand director compensation and the role of executive officers and compensation consultants in determining orrecommending the amount or form of compensation, see “Executive Compensation — CompensationDiscussion and Analysis.” The Compensation Committee has adopted a charter which can be obtained on theCorporate Governance page of our website at www.hcahealthcare.com. In 2010, the Compensation Committeemet twelve times.
Upon the pricing of this offering, we intend to appoint Jay O. Light and Geoffrey G. Meyers as additionalmembers of our Compensation Committee. Our Board of Directors has affirmatively determined that each of suchnewly-appointed nominees meets the definition of “independent director” for purposes of the New York StockExchange rules, the definition of “outside director” for purposes of Section 162(m) of the Internal Revenue Codeof 1986, as amended, and the definition of “non-employee director” for purposes of Section 16 of the SecuritiesExchange Act of 1934, as amended. In addition, we intend to establish a sub-committee of our CompensationCommittee consisting of Jay O. Light and Geoffrey G. Meyers for purposes of approving any compensation thatmay otherwise be subject to Section 162(m) of the Internal Revenue Code of 1986, as amended.
Nominating and Corporate Governance Committee. Upon the pricing of this offering, we will form aNominating and Corporate Governance Committee that will consist of James D. Forbes, Thomas F. Frist III,Michael W. Michelson and Stephen G. Pagliuca. The Nominating and Corporate Governance Committee willbe responsible for (1) identifying, recruiting and recommending to the Board of Directors individuals qualifiedto become members of our Board of Directors, (2) reviewing the qualifications of incumbent directors todetermine whether to recommend them for reelection, (3) reviewing and recommending corporate governancepolicies, principles and procedures applicable to the Company and (4) handling such other matters that arespecifically delegated to the Nominating and Corporate Governance Committee by the Board of Directorsfrom time to time.
Our Board of Directors will adopt a written charter for the Nominating and Corporate GovernanceCommittee which will be available on our website as soon as practical after the consummation of this offering.
106
Patient Safety and Quality of Care Committee. Our Patient Safety and Quality of Care Committee iscomposed of Kenneth W. Freeman (Chairman), William R. Frist, Stephen G. Pagliuca and Nathan C. Thorne.This committee reviews our policies and procedures relating to the delivery of quality medical care to patientsas well as matters concerning or relating to the efforts to advance the quality of health care provided andpatient safety. In 2010, the Patient Safety and Quality of Care Committee met three times.
Director Qualification
The Board of Directors seeks to ensure the Board is composed of members whose particular experience,qualifications, attributes and skills, when taken together, will allow the Board to satisfy its oversightresponsibilities effectively. In identifying candidates for membership on the Board, the Board takes intoaccount (1) minimum individual qualifications, such as high ethical standards, integrity, mature and carefuljudgment, industry knowledge or experience and an ability to work collegially with the other members of theBoard and (2) all other factors it considers appropriate, including alignment with our stockholders, especiallyinvestment funds affiliated with the Sponsors. While we do not have any specific diversity policies forconsidering Board candidates, we believe each director contributes to the Board of Directors’ overalldiversity — diversity being broadly construed to mean a variety of opinions, perspectives, personal andprofessional experiences and backgrounds.
In 2010, Messrs. Birosak, Bracken, Connaughton, Forbes, Freeman, Frist III, Frist, Gordon, Johnson,Michelson, Momtazee, Pagliuca and Thorne were elected to the Company’s Board. Messrs. Birosak,Connaughton, Forbes, Freeman, Frist III, Frist, Gordon, Michelson, Momtazee, Pagliuca and Thorne wereappointed to the Board as a consequence of their respective relationships with investment funds affiliated withthe Sponsors and the Frist Entities. They are collectively referred to as the “Sponsor Directors.” Messrs. Brackenand Johnson are collectively referred to as the “Management Directors.”
When considering whether the Board’s directors and nominees have the experience, qualifications,attributes and skills, taken as a whole, to enable the Board to satisfy its oversight responsibilities effectively inlight of our business and structure, the Board focused primarily on the information discussed in each of theBoard members’ and nominees’ biographical information set forth above.
Each of our directors and director nominees possesses high ethical standards, acts with integrity, andexercises careful, mature judgment. Each is committed to employing their skills and abilities to aid the long-term interests of the stakeholders of the Company. In addition, our directors and director nominees areknowledgeable and experienced in one or more business, governmental or civic endeavors, which furtherqualifies them for service as members of the Board. Alignment with our stockholders is important in buildingvalue at the Company over time.
Each of the Sponsor Directors was elected to the Board pursuant to the Amended and Restated LimitedLiability Company Agreement of Hercules Holding. Pursuant to such agreement, Messrs. Freeman, Michelsonand Momtazee were appointed to the Board as a consequence of their respective relationships with KKR,Messrs. Birosak, Forbes and Thorne were appointed to the Board as a consequence of their respectiverelationships with BAML Capital Partners, Messrs. Connaughton, Gordon and Pagliuca were appointed to theBoard as a consequence of their respective relationships with Bain Capital Partners, LLC and Messrs. Frist IIIand Frist were appointed to the Board as a consequence of their respective relationships with the Frist Entities.
As a group, the Sponsor Directors possess experience in owning and managing enterprises like theCompany and are familiar with corporate finance, strategic business planning activities and issues involvingstakeholders more generally.
The Management Directors bring leadership, extensive business, operating, legal and policy experience,and tremendous knowledge of the Company and the Company’s industry, to the Board. In addition, theManagement Directors bring their broad strategic vision for our Company to the Board. Mr. Bracken’s serviceas the Chairman and Chief Executive Officer of the Company and Mr. Johnson’s service as President, ChiefFinancial Officer and Director creates a critical link between management and the Board, enabling the Boardto perform its oversight function with the benefits of management’s perspectives on the business. In addition,having the Chief Executive Officer and President and Chief Financial Officer, and Messrs. Bracken andJohnson in particular, on our Board provides the Company with ethical, decisive and effective leadership.
107
Mr. Light was selected as a director in light of his experience in serving as a director of several firms,including public companies, his financial expertise and his service with other health care organizations. Mr.Light’s professional experience will be particularly beneficial in providing financial and general businessexpertise to the Board of Directors. Mr. Meyers was selected as a director in light of his experience in servingas a director of several firms, including public companies, and his extensive experience in the health careindustry. In addition, Mr. Meyers’ experience as a chief financial officer of a public company will providevaluable experience in his role as chair of our Audit and Compliance Committee.
As noted above, upon the consummation of this offering, we will enter into the Stockholders’ Agreementwhich, among other things, will provide for certain rights of the Sponsors and the Frist Entities to nominatemembers of our Board of Directors.
Board Leadership Structure
The Board appointed the Company’s Chief Executive Officer as Chairman because he is the director mostfamiliar with the Company’s business and industry, and as a result is best suited to effectively identifystrategic priorities and lead the discussion and execution of strategy. The Board believes the combined positionof Chairman and CEO promotes a unified direction and leadership for the Board and gives a single, clearfocus for the chain of command for our organization, strategy and business plans.
Board’s Role in Risk Oversight
Risk is inherent with every business. Management is responsible for the day-to-day management of risksthe Company faces, while the Board of Directors, as a whole and through its committees, has responsibilityfor the oversight of risk management. In its risk oversight role, the Board of Directors has the responsibility tosatisfy itself that the risk management processes designed and implemented by management are adequate andfunctioning as designed. Our Board of Directors oversees an enterprise-wide approach to risk management,designed to support the achievement of organizational objectives, including strategic objectives, to improvelong-term organizational performance and enhance stockholder value. A fundamental aspect of riskmanagement is not only understanding the risks a company faces and what steps management is taking tomanage those risks, but also understanding what level of risk is appropriate for the company. The involvementof the full Board of Directors in setting our business strategy is a key part of its assessment of management’sappetite for risk and also a determination of what constitutes an appropriate level of risk for the Company.
We conduct an annual enterprise risk management assessment, which is facilitated by our enterprise riskmanagement team in collaboration with our internal auditors. The senior internal audit executive officerreports to the Chief Executive Officer and Chairman and to the Audit and Compliance Committee in thiscapacity. In this process, we assess risk throughout the Company by conducting surveys and interviews of ouremployees and directors soliciting information regarding business risks that could significantly adversely affectthe Company, including the achievement of its strategic plan. We then identify any controls or initiatives inplace to mitigate any material risk and the effectiveness of any such controls or initiatives. The enterprise riskmanagement team annually prepares a report for senior management and, ultimately, the Board of Directorsregarding the key identified risks and how we manage these risks to review and analyze both on an annual andongoing basis. Senior management attends the quarterly Board meetings and is available to address anyquestions or concerns raised by the Board regarding risk management and any other matters. Additionally,each quarter, the Board of Directors receives presentations from senior management on strategic mattersinvolving our operations.
While the Board of Directors has the ultimate oversight responsibility for the risk management process,various committees of the Board assist the Board in fulfilling its oversight responsibilities in certain areas ofrisk. In particular, the Audit and Compliance Committee focuses on financial and enterprise risk exposures,including internal controls, and discusses with management, the senior internal audit executive officer, thesenior chief ethics and compliance officer and the independent auditor our policies with respect to riskassessment and risk management. The Audit and Compliance Committee also assists the Board in fulfilling itsduties and oversight responsibilities relating to the Company’s compliance with applicable laws andregulations, the Company Code of Conduct and related Company policies and procedures, including theCorporate Ethics and Compliance Program. The Compensation Committee assists the Board in fulfilling its
108
oversight responsibilities with respect to the management of risks arising from our compensation policies andprograms. The Patient Safety and Quality of Care Committee assists the Board in fulfilling its risk oversightresponsibility with respect to our policies and procedures relating to patient safety and the delivery of qualitymedical care to patients.
Board Meetings
During 2010, our Board of Directors held ten meetings. All directors attended at least 75% of the Boardmeetings and meetings of the committees of the Board on which the director served. The Company did nothave an annual meeting of stockholders in 2009 or 2010, and our directors were re-elected throughstockholder actions taken on written consent effective September 21, 2009 and April 28, 2010.
Policy Regarding Communications with the Board of Directors
Stockholders and other interested parties may contact the Board of Directors, a particular director, or thenon-management directors or independent directors as a group by sending a letter (signed or anonymous) to:c/o Board of Directors, HCA Holdings, Inc., One Park Plaza, Nashville, TN 37203, Attention: CorporateSecretary.
We will forward all such communications to the applicable Board member(s) at least quarterly, except foradvertisements or solicitations which will be discarded. The legal department will review the communication.Concerns will be addressed through our regular procedures for addressing such matters. Depending on thenature of the concern, management also may refer it to our internal audit, legal, finance or other appropriatedepartment. If the volume of communication becomes such that the Board adopts a process for determiningwhich communications will be relayed to Board members, that process will appear on the CorporateGovernance page of our website at www.hcahealthcare.com.
Complaints or concerns about our accounting, internal accounting controls, auditing or other matters maybe reported to our legal department or to the Audit and Compliance Committee in any of the following waysand may be reported anonymously:
• Call the HCA Ethics Line at 1-800-455-1996
• Write to the Audit and Compliance Committee at: Audit and Compliance Committee Chairman, HCAHoldings, Inc., c/o General Counsel, One Park Plaza, Nashville, TN 37203
All accounting, internal accounting controls, or auditing matters will be reported to the Audit andCompliance Committee on at least a quarterly basis. Depending on the nature of the concern, it also may bereferred to our internal audit, legal, finance or other appropriate department. We will treat a complaint orconcern about questionable accounting or auditing matters confidentially if requested, except to the extentnecessary to protect the Company’s interests or to comply with an applicable law, rule or regulation or orderof a judicial or governmental authority.
Our policy prohibits any employee from retaliating or taking any adverse action against anyone who, ingood faith, reports or helps to resolve an ethical or legal concern.
Code of Ethics
We have a Code of Conduct, which is applicable to all our directors, officers and employees (the “Codeof Conduct”). The Code of Conduct is available on the Ethics and Compliance and Corporate Governancepages of our website at www.hcahealthcare.com. To the extent required pursuant to applicable SECregulations, we intend to post amendments to or waivers from our Code of Conduct (to the extent applicableto our chief executive officer, principal financial officer or principal accounting officer) at these locations onour website or report the same on a Current Report on Form 8-K. Our Code of Conduct is available free ofcharge upon request to our Corporate Secretary, HCA Holdings, Inc., One Park Plaza, Nashville, TN 37203.
109
EXECUTIVE COMPENSATION
Compensation Risk Assessment
In consultation with the Compensation Committee (the “Committee”) of the Board of Directors, membersof Human Resources, Financial Reporting, Legal, Enterprise Risk Management and Internal Auditmanagement conducted an assessment of whether the Company’s compensation policies and practicesencourage excessive or inappropriate risk taking by our employees, including employees other than our namedexecutive officers. This assessment included a review of the risk characteristics of our business and the designof our incentive plans and policies. Although a significant portion of our executive compensation program isperformance-based, the Compensation Committee has focused on aligning the Company’s compensationpolicies with the long-term interests of the Company and avoiding rewards or incentive structures that couldcreate unnecessary risks to the Company.
Management reported its findings to the Compensation Committee, which agreed with management’sassessment that our plans and policies do not encourage excessive or inappropriate risk taking and determinedsuch policies or practices are not reasonably likely to have a material, adverse effect on the Company.
Compensation Discussion and Analysis
The Committee is generally charged with the oversight of our executive compensation and rewardsprograms. The Committee is currently composed of John P. Connaughton, James D. Forbes and Michael W.Michelson. Responsibilities of the Committee include the review and approval of the following items:
• Executive compensation strategy and philosophy;
• Compensation arrangements for executive management;
• Design and administration of the annual Senior Officer Performance Excellence Program (“PEP”);
• Design and administration of our equity incentive plans;
• Executive benefits and perquisites (including the HCA Restoration Plan and the SupplementalExecutive Retirement Plan); and
• Any other executive compensation or benefits related items deemed appropriate by the Committee.
In addition, the Committee considers the proper alignment of executive pay policies with Companyvalues and strategy by overseeing executive compensation policies, corporate performance measurement andassessment, and Chief Executive Officer performance assessment. The Committee may retain the services ofindependent outside consultants, as it deems appropriate, to assist in the strategic review of programs andarrangements relating to executive compensation and performance.
The following executive compensation discussion and analysis describes the principles underlying ourexecutive compensation policies and decisions as well as the material elements of compensation for our namedexecutive officers. Our named executive officers for 2010 were:
• Richard M. Bracken, Chairman and Chief Executive Officer;
• R. Milton Johnson, Executive Vice President and Chief Financial Officer;
• Samuel N. Hazen, President — Western Group;
• Beverly B. Wallace, President — Shared Services Group; and
• W. Paul Rutledge, President — Central Group.
Compensation Philosophy and Objectives
The core philosophy of our executive compensation program is to support the Company’s primaryobjective of providing the highest quality health care to our patients while enhancing the long-term value of
110
the Company to our stockholders. Specifically, the Committee believes the most effective executivecompensation program (for all executives, including named executive officers):
• Reinforces HCA’s strategic initiatives;
• Aligns the economic interests of our executives with those of our stockholders; and
• Encourages attraction and long-term retention of key contributors.
The Committee is committed to a strong, positive link between our objectives and our compensation andbenefits practices.
Our compensation philosophy also allows for flexibility in establishing executive compensation based onan evaluation of information prepared by management or other advisors and other subjective and objectiveconsiderations deemed appropriate by the Committee, subject to any contractual agreements with ourexecutives. The Committee will also consider the recommendations of our Chief Executive Officer. Thisflexibility is important to ensure our compensation programs are competitive and that our compensationdecisions appropriately reflect the unique contributions and characteristics of our executives.
Compensation Structure and Market Positioning
Our compensation program is heavily weighted towards performance-based compensation, reflecting ourphilosophy of increasing the long-term value of the Company and supporting strategic imperatives. Total directcompensation and other benefits consist of the following elements:
Total Direct Compensation • Base Salary
• Annual Incentives (offered through our PEP)
• Long-Term Equity Incentives
Other Benefits • Retirement Plans
• Limited Perquisites and Other Personal Benefits
• Severance Benefits
The Committee does not support rigid adherence to benchmarks or compensatory formulas and strives tomake compensation decisions which effectively support our compensation objectives and reflect the uniqueattributes of the Company and each executive. Our general practice, however, with respect to pay positioning,is that executive base salaries and annual incentive (PEP) target values should generally position total annualcash compensation between the median and 75th percentile of similarly-sized general industry companies. Weutilize the general industry as our primary source for competitive pay levels because HCA is significantlylarger than its industry peers. See the discussion of market positioning below for further information. Thenamed executive officers’ pay fell within the range noted above for jobs with equivalent market comparisons.
The cash compensation mix between salary and PEP has historically been more weighted towards salarythan competitive practice among our general industry peers would suggest. Over time, we have made stepstowards a mix of cash compensation that will place a greater emphasis on annual performance-basedcompensation.
Although we look at competitive long-term equity incentive award values in similarly-sized generalindustry companies when assessing the competitiveness of our compensation programs, we do not makeannual executive option grants (and we did not base our initial post-Merger 2007 stock option grants on theselevels) since equity is structured differently in closely-held companies than in publicly-traded companies. As istypical in similar situations, the Investors wanted to share a certain percentage of the equity with executivesshortly after the consummation of the Merger and establish performance objectives and incentives up front inlieu of annual grants to ensure our executives’ long-term economic interests would be aligned with those ofthe Investors. This pool of equity was then further allocated based on the executives’ responsibilities andanticipated impact on, and potential for, driving Company strategy and performance. On a cumulative basis,the resulting total direct pay mix is heavily weighted towards performance-based pay (PEP plus stock options)
111
rather than fixed pay, which the Committee believes reflects the compensation philosophy and objectivesdiscussed above.
Compensation Process
The Committee ensures executives’ pay levels are materially consistent with the compensation strategydescribed above, in part, by conducting annual assessments of competitive executive compensation. SemlerBrossy Consulting Group, LLC has been retained by, and reports directly to the Committee, and does not haveany other consulting engagements with management or HCA. Management (but no named executive officer),in collaboration with Semler Brossy, collects and presents compensation data from similarly-sized generalindustry companies, based to the extent possible on comparable position matches and compensationcomponents. The following nationally recognized survey sources were utilized in anticipation of establishing2010 executive compensation:
Survey Revenue Scope
Towers Perrin Executive Compensation Database. . . . . . . . . . . . . . . . . . . . . . . . Greater than $20B
Hewitt Total Compensation Measurement . . . . . . . . . . . . . . . . . . . . . . . . . . . . . $10B - $25B
Hewitt Total Compensation Measurement . . . . . . . . . . . . . . . . . . . . . . . . . . . . . Greater than $25B
These particular revenue scopes were selected because they were the closest approximations to HCA’srevenue size. Each survey that provided an appropriate position match and sufficient sample size to be used inthe compensation review was weighted equally. For this purpose, the two Hewitt survey cuts were consideredas one survey, and we used an average of the two surveys (50% for the $10B — $25B cut and 50% for theGreater than $25B).
Data was also collected from health care providers within our industry including Community HealthSystems, Inc., Health Management Associates, Inc., Kindred Healthcare, Inc., LifePoint Hospitals, Inc., TenetHealthcare Corporation and Universal Health Services, Inc. These health care providers are used only toobtain a general understanding of current industry compensation practices since we are significantly largerthan these companies. CEO and CFO compensation data was also collected and reviewed for large publichealth care companies which included, in addition to health care providers, companies in the health insurance,pharmaceutical, medical supplies and related industries. This peer group’s 2009 revenues ranged from$7.4 billion to $87.1 billion with median revenues of $24.8 billion. The companies in this analysis includedAbbott Laboratories, Aetna Inc., Amgen Inc., Baxter International Inc., Boston Scientific Corp., Bristol-MyersSquibb Company, CIGNA Corp., Coventry Health Care, Inc., Express Scripts, Inc., Humana Inc., Johnson &Johnson, Eli Lilly and Company, Medco Health Solutions Inc., Merck & Co., Inc., Pfizer Inc., QuestDiagnostics Incorporated, Thermo Fisher Scientific Inc., UnitedHealth Group Incorporated and Wellpoint, Inc.
Consistent with our flexible compensation philosophy, the Committee is not required to approvecompensation precisely reflecting the results of these surveys, and may also consider, among other factors(typically not reflected in these surveys): the requirements of the applicable employment agreements, theexecutive’s individual performance during the year, his or her projected role and responsibilities for thecoming year, his or her actual and potential impact on the successful execution of Company strategy,recommendations from our Chief Executive Officer and compensation consultants, an officer’s priorcompensation, experience, and professional status, internal pay equity considerations, and employment marketconditions and compensation practices within our peer group. The weighting of these and other relevantfactors is determined on a case-by-case basis for each executive upon consideration of the relevant facts andcircumstances.
Employment Agreements
In connection with the Merger, we entered into employment agreements with each of our namedexecutive officers and certain other members of senior management to help ensure the retention of thoseexecutives critical to the future success of the Company. Among other things, these agreements set theexecutives’ compensation terms, their rights upon a termination of employment, and restrictive covenantsaround non-competition, non-solicitation, and confidentiality. These terms and conditions are further explained
112
in the remaining portion of this Compensation Discussion and Analysis and under “Narrative Disclosure toSummary Compensation Table and 2010 Grants of Plan-Based Awards Table — Employment Agreements.”
Elements of Compensation
Base Salary
Base salaries are intended to provide reasonable and competitive fixed compensation for regular jobduties. The threshold base salaries for our executives are set forth in their employment agreements. In light ofactual total cash compensation realized for 2009 and cash compensation opportunities levels for 2010(including the cash distributions on vested options), we did not increase named executive officer base salariesin 2010, other than a 3.7% increase in Mr. Rutledge’s salary effective April 1, 2010 as an internal equityadjustment to internal peer roles. Changes, if any, to the named executive officers’ base salaries in 2011 havenot yet been determined by the Committee.
Annual Incentive Compensation: PEP
The PEP is intended to reward named executive officers for annual financial performance, with the goalsof providing high quality health care for our patients and increasing stockholder value. Accordingly, theCompany’s 2010 Senior Officer Performance Excellence Program, (the “2010 PEP”), was approved by theCommittee to cover annual incentive awards for 2010. Each named executive officer in the 2010 PEP wasassigned a 2010 annual award target expressed as a percentage of salary ranging from 66% to 130%. For2010, the Committee had the ability to apply negative discretion based on performance of Company-widequality metrics against industry benchmarks, and for Ms. Wallace, negative discretion could have been appliedbased on performance of individuals goals related to the operations of the Shared Services Group. TheCommittee set Mr. Bracken’s 2010 target percentage at 130% of his 2010 base salary for his role as Chairmanand Chief Executive Officer and set Mr. Johnson’s 2010 target percentage at 80% of his 2010 base salary forthe position of Executive Vice President and Chief Financial Officer. The 2010 target percentage for each ofMessrs. Hazen and Rutledge and Ms. Wallace was set at 66% of their respective 2010 base salaries (seeindividual targets in the table below). These targets were intended to provide a meaningful incentive forexecutives to achieve or exceed performance goals.
The 2010 PEP was designed to provide 100% of the target award for target performance, 25% of thetarget award for a minimum acceptable (threshold) level of performance, and a maximum of 200% of thetarget award for maximum performance, while no payments were to be made for performance below thresholdlevels. The Committee believes this payout curve is consistent with competitive practice. More importantly, itpromotes and rewards continuous growth as performance goals have consistently been set at increasinglyhigher levels each year. Actual awards under the PEP are generally determined using the following two steps:
1. The executive’s conduct must reflect our mission and values by upholding our Code of Conductand following our compliance policies and procedures. This step is critical to reinforcing our commitmentto integrity and the delivery of high quality health care. In the event the Committee determines theparticipant’s conduct during the fiscal year is not in compliance with the first step, he or she will not beeligible for an incentive award.
2. The actual award amount is determined based upon Company performance. In 2010, the PEP forall named executive officers, other than Mr. Hazen and Mr. Rutledge, incorporated one Companyfinancial performance measure, EBITDA, defined in the 2010 PEP as earnings before interest, taxes,depreciation, amortization, minority interest expense (now, net income attributable to noncontrollinginterests), gains or losses on sales of facilities, gains or losses on extinguishment of debt, asset orinvestment impairment charges, restructuring charges, and any other significant nonrecurring non-cashgains or charges (but excluding any expenses for share-based compensation under Financial AccountingStandards Board (FASB) Accounting Standards Codification Topic 718, Compensation-StockCompensation (“ASC 718”)) (“EBITDA”). The Company EBITDA target for 2010, as adjusted, was$5.752 billion for the named executive officers. Mr. Hazen’s 2010 PEP, as the Western Group President,was based 50% on Company EBITDA and 50% on Western Group EBITDA (with a Western Group
113
EBITDA target for 2010 of $2.993 billion, as adjusted) to ensure his accountability for his group’sresults. Similarly, Mr. Rutledge’s 2010 PEP, as the Central Group President, was based 50% on CompanyEBITDA and 50% on Central Group EBITDA (with a Central Group EBITDA target for 2010 of$1.392 billion, as adjusted). The Committee chose to base annual incentives on EBITDA for a number ofreasons:
• It effectively measures overall Company performance;
• It can be considered an important surrogate for cash flow, a critical metric related to paying downthe Company’s significant debt obligation;
• It is the key metric driving the valuation in the internal Company model, consistent with thevaluation approach used by industry analysts; and
• It is consistent with the metric used for the vesting of the financial performance portion of ouroption grants.
These EBITDA targets should not be understood as management’s predictions of future performance orother guidance and investors should not apply these in any other context. Our 2010 threshold performancelevel was set at the prior year’s performance level and the maximum performance goal was set atapproximately 5% above the target goal to reflect likely performance volatility. EBITDA targets were linkedto the Company’s short-term and long-term business objectives to ensure incentives are provided forappropriate annual growth.
Upon review of the Company’s 2010 financial performance, the Committee determined that CompanyEBITDA performance for the fiscal year ended December 31, 2010 was approximately 102.6% of targetperformance levels as set by the Compensation Committee, as adjusted, resulting in a 151.8% of target payout.The EBITDA performance of the Western Group was 103.1% of the performance target, resulting in a 161.9%of target payout, and the EBITDA performance of the Central Group was under the threshold performancelevel.
2010 AdjustedEBITDA Target
2010 ActualAdjusted EBITDA
Company . . . . . . . . . . . . . . . . . . . . . . . . . . . . . . . . . . . . . . . . . . $5.752 billion $5.901 billion
Western Group . . . . . . . . . . . . . . . . . . . . . . . . . . . . . . . . . . . . . . $2.993 billion $3.086 billion
Central Group . . . . . . . . . . . . . . . . . . . . . . . . . . . . . . . . . . . . . . $1.392 billion $1.272 billion
Accordingly, the 2010 PEP will be paid out as follows to the named executive officers (the actual 2010PEP payout amounts are included in the “Non-Equity Incentive Plan Compensation” column of the SummaryCompensation Table):
Named Executive Officer2010 Target PEP
(% of Salary)
2010 Actual PEPAward
(% of Salary)
Richard M. Bracken (Chairman and CEO) . . . . . . . . . . . . . . . . . . 130% 197%
R. Milton Johnson (Executive Vice President and CFO) . . . . . . . . 80% 121%
Samuel N. Hazen (President, Western Group) . . . . . . . . . . . . . . . . 66% 104%
Beverly B. Wallace (President, Shared Services Group). . . . . . . . . 66% 100%
W. Paul Rutledge (President, Central Group) . . . . . . . . . . . . . . . . 66% 50%
Under the 2010 PEP, incentive payouts up to the target will be paid in cash during the first quarter of2011. Payouts above the target will be paid 50% in cash and 50% in Restricted Stock Units (“RSUs”). TheRSU grants will vest 50% on the second anniversary of grant date and 50% on the third anniversary of thegrant date. Messrs. Bracken, Johnson and Hazen and Ms. Wallace will each receive an RSU grant forachieving PEP payouts over the target level.
The Company can recover (or “clawback”) incentive compensation pursuant to our 2010 PEP that wasbased on (i) achievement of financial results that are subsequently the subject of a restatement due to material
114
noncompliance with any financial reporting requirement under either GAAP or federal securities laws, otherthan as a result of changes to accounting rules and regulations, or (ii) a subsequent finding that the financialinformation or performance metrics used by the Committee to determine the amount of the incentivecompensations are materially inaccurate, in each case regardless of individual fault. In addition, the Companymay recover any incentive compensation awarded or paid pursuant to this policy based on the participant’sconduct which is not in good faith and which materially disrupts, damages, impairs or interferes with thebusiness of the Company and its affiliates. The Committee may also provide for incremental additionalpayments to then-current executives in the event any restatement or error indicates that such executives shouldhave received higher performance-based payments. This policy is administered by the Committee in theexercise of its discretion and business judgment based on the relevant facts and circumstances.
The Senior Officer Performance Excellence Program for 2011 has not yet been adopted by theCommittee.
Long-Term Equity Incentive Awards: Options
In connection with the Merger, the Board of Directors of HCA Inc. approved and adopted the 2006 StockIncentive Plan for Key Employees of HCA Inc. and its Affiliates (the “2006 Plan”). The 2006 Plan wasassumed by HCA Holdings, Inc. on November 22, 2010 in connection with the Corporate Reorganization. Thepurpose of the 2006 Plan is to:
• Promote our long term financial interests and growth by attracting and retaining management and otherpersonnel and key service providers with the training, experience and abilities to enable them to makesubstantial contributions to the success of our business;
• Motivate management personnel by means of growth-related incentives to achieve long rangegoals; and
• Further the alignment of interests of participants with those of our stockholders through opportunitiesfor increased stock or stock-based ownership in the Company.
In January 2007, pursuant to the terms of the named executive officers’ respective employmentagreements, the Committee approved long-term stock option grants to our named executive officers under the2006 Plan consisting solely of a one-time, multi-year stock option grant in lieu of annual long-term equityincentive award grants (“New Options”). In addition to the New Options granted in 2007, the Companycommitted to grant the named executive officers 2x Time Options (as defined below) in their respectiveemployment agreements, as described in more detail below under “Narrative Disclosure to SummaryCompensation Table and 2010 Grants of Plan-Based Awards Table — Employment Agreements.” TheCommittee believes stock options are the most effective long-term vehicle to directly align the interests ofexecutives with those of our stockholders by motivating performance that results in the long-term appreciationof the Company’s value, since they only provide value to the executive if the value of the Company increases.As is typical in leveraged buyout situations, the Committee determined that granting all of the stock options(except the 2x Time Options) up front rather than annually was appropriate to aid in retaining key leaderscritical to the Company’s success over the next several years and, coupled with the executives’ significantpersonal investments in connection with the Merger, provide an equity incentive and stake in the Companythat directly aligns the long-term economic interests of the executives with those of the Investors.
The New Options have a ten year term and are divided so that 1/3 are time vested options, 1/3 areEBITDA-based performance vested options and 1/3 are performance options that vest based on investmentreturn to the Sponsors, each as described below. The combination of time, performance and investor returnbased vesting of these awards is designed to compensate executives for long term commitment to theCompany, while motivating sustained increases in our financial performance and helping ensure the Sponsorshave received an appropriate return on their invested capital before executives receive significant value fromthese grants.
The time vested options were granted to aid in retention. Consistent with this goal, the time vestedoptions granted in 2007 vest and become exercisable in equal increments of 20% on each of the first five
115
anniversaries of the grant date. The time vested options have an exercise price equivalent to fair market valueon the date of grant. Since our common stock was not then traded on a national securities exchange, fairmarket value was determined reasonably and in good faith by the Board of Directors after consultation withthe Chief Executive Officer and other advisors.
The EBITDA-based performance vested options are intended to motivate sustained improvement in long-term performance. Consistent with this goal, the EBITDA-based performance vested options granted in 2007are eligible to vest and become exercisable in equal increments of 20% at the end of fiscal years 2007, 2008,2009, 2010 and 2011 if certain annual EBITDA performance targets are achieved. These EBITDAperformance targets were established at the time of the Merger and can be adjusted by the Board of Directorsin consultation with the Chief Executive Officer as described below. We chose EBITDA (defined in the awardagreements as earnings before interest, taxes, depreciation, amortization, minority interest expense (now, netincome attributable to noncontrolling interests), gains or losses on sales of facilities, gains or losses onextinguishment of debt, asset or investment impairment charges, restructuring charges, and any othersignificant nonrecurring non-cash gains or charges (but excluding any expenses for share-based compensationunder ASC 718 with respect to any awards granted under the 2006 Plan)) as the performance metric since it isa key driver of our valuation and for other reasons as described above in the “Annual Incentive Compensation:PEP” section of this Compensation Discussion and Analysis. Due to the number of events that can occurwithin our industry in any given year that are beyond the control of management but may significantly impactour financial performance (e.g., health care regulations, industry-wide significant fluctuations in volume, etc.),we have incorporated “catch up” vesting provisions. The EBITDA-based performance vested options may vestand become exercisable on a “catch up” basis, such that options that were eligible to vest but failed to vestdue to our failure to achieve prior EBITDA targets will vest if at the end of any subsequent year or at the endof fiscal year 2012, the cumulative total EBITDA earned in all prior years exceeds the cumulative EBITDAtarget at the end of such fiscal year.
As with the EBITDA targets under our PEP, pursuant to the terms of the 2006 Plan and the Stock OptionAgreements governing the 2007 grants, the Board of Directors, in consultation with our Chief ExecutiveOfficer, has the ability to adjust the established EBITDA targets for significant events, changes in accountingrules and other customary adjustment events. We believe these adjustments may be necessary in order toeffectuate the intents and purposes of our compensation plans and to avoid unintended consequences that areinconsistent with these intents and purposes. For example, the Board of Directors exercised its ability to makeadjustments to the Company’s 2010-2011 EBITDA performance targets (including cumulative EBITDAtargets) for facility acquisitions and accounting changes.
The options that vest based on investment return to the Sponsors are intended to align the interests ofexecutives with those of our principal stockholders to ensure stockholders receive their expected return ontheir investment before the executives can receive their gains on this portion of the option grant. These optionsvest and become exercisable with respect to 10% of the common stock subject to such options at the end offiscal years 2007, 2008, 2009, 2010 and 2011 if the Investor Return (as defined below) is at least equal to twotimes the price paid to stockholders in the Merger (or $22.64), and with respect to an additional 10% at theend of fiscal years 2007, 2008, 2009, 2010 and 2011 if the Investor Return is at least equal to two-and-a-halftimes the price paid to stockholders in the Merger (or $28.30). “Investor Return” means, on any of the firstfive anniversaries of the closing date of the Merger, or any date thereafter, all cash proceeds actually receivedby affiliates of the Sponsors after the closing date in respect of their common stock, including the receipt ofany cash dividends or other cash distributions (including the fair market value of any distribution of commonstock by the Sponsors to their limited partners), determined on a fully diluted, per share basis. In addition, thefair market value of the Company’s common stock held by the Sponsors shall be deemed “cash proceeds”under the Investor Return options with respect to one third of such options upon each of the closing of theCompany’s initial public offering, December 31, 2011 and December 31, 2012. The Sponsor investment returnoptions also may become vested and exercisable on a “catch up” basis if the relevant Investor Return isachieved at any time occurring prior to the expiration of such options.
Upon review of the Company’s 2010 financial performance, the Committee determined the Companyachieved the 2010 EBITDA performance target of $5.066 billion, as adjusted, under the New Option awards;
116
therefore, pursuant to the terms of the 2007 Stock Option Agreements, 20% of each named executive officer’sEBITDA-based performance vested options vested as of December 31, 2010. Further, 20% of each namedexecutive officer’s time vested options vested on the third anniversary of their grant date, January 30, 2010. Asof the end of the 2010 fiscal year, no portion of the options that vest based on Investor Return have vested;however, such options remain subject to the “catch up” vesting provisions described above.
In each of the employment agreements with the named executive officers, we also committed to grant,among the named executive officers and certain other executives, 10% of the options initially authorized forgrant under the 2006 Plan at some time before November 17, 2011 (but with a good faith commitment to doso before a “change in control” (as defined in the 2006 Plan) or a “public offering” (as defined in the 2006Plan) and before the time when our Board of Directors reasonably believed that the fair market value of ourcommon stock is likely to exceed the equivalent of $22.64 per share) at an exercise price per share that is theequivalent of $22.64 per share (“2x Time Options”). On October 6, 2009, the 2x Time Options were granted.The Committee allocated those options in consultation with our Chief Executive Officer based on pastexecutive contributions and future anticipated impact on Company objectives. Forty percent of the 2x TimeOptions were vested upon grant to reflect employment served since the Merger, an additional twenty percentof these options vested on November 17, 2009 and November 17, 2010, respectively, and twenty percent ofthese options will vest on November 17, 2011. The terms of the 2x Time Options are otherwise consistentwith other time vesting options granted under the 2006 Plan.
For additional information concerning the options awarded in 2007 and 2009, see the Outstanding EquityAwards at 2010 Fiscal Year-End Table.
Distributions on Options
The Company declared cash distributions in respect of the outstanding common stock of the Company inJanuary, May and November 2010. In recognition of the value created by management through effectiveexecution of operating strategies, and as otherwise required pursuant to the terms of the applicable optionagreements, the Company also made cash distribution payments to holders of vested stock options outstandingon the respective distribution record dates, as outlined below.
On January 27, 2010 and May 5, 2010, the Board of Directors of HCA Inc. declared cash distributions of$3.88 per share of HCA Inc.’s outstanding common stock and $1.11 per share of HCA Inc.’s outstandingcommon stock (the “February and May Distributions”), respectively, payable to stockholders of record onFebruary 1, 2010 and May 6, 2010 (the “February and May Record Dates”), respectively.
In connection with the February and May Distributions, HCA Inc. made cash payments to holders ofvested options to purchase the common stock granted pursuant to HCA Inc.’s equity incentive plans. The cashpayments equaled the product of (x) the number of shares of common stock subject to such optionsoutstanding on the February and May Record Dates, respectively, multiplied by (y) the per share amount ofthe respective February and May Distributions, less (z) any applicable withholding taxes. In order to effect thecash payments to holders of vested options granted pursuant to the 2006 Plan, the Committee amended theapplicable option agreements to provide that, in connection with the February and May Distributions, HCAInc. made the cash payments described above to holders of vested options granted pursuant to the 2006 Planin lieu of adjusting the exercise prices of such options. HCA Inc. reduced the per share exercise prices of anyunvested options outstanding as of the February and May Record Dates, respectively, by the respective pershare February and May Distributions amount paid in accordance with the terms of the option agreements.
On November 23, 2010, the Board of Directors of HCA Holdings, Inc. declared a cash distribution of$4.44 per share of the HCA Holdings, Inc.’s outstanding common stock (the “November Distribution”),payable to stockholders of record on November 24, 2010 (the “November Record Date”).
In connection with the November Distribution, HCA Holdings, Inc. made a cash payment to holders ofvested options to purchase the HCA Holdings, Inc. common stock granted pursuant to HCA Holdings, Inc.’sequity incentive plans. The cash payment equaled the product of (x) the number of shares of common stocksubject to such options outstanding on the November Record Date, multiplied by (y) the per share amount of
117
the November Distribution, less (z) any applicable withholding taxes. HCA Holdings, Inc. reduced the pershare exercise prices of any unvested options outstanding as of the November Record Date by the per shareNovember Distribution amount to the extent the per share exercise price could be reduced under applicable taxrules. If the per share exercise price could not be reduced by the full amount of the per share NovemberDistribution, HCA Holdings, Inc. agreed to pay to each holder of unvested options to purchase shares of HCAHoldings Inc.’s common stock granted pursuant to HCA Holdings Inc.’s equity incentive plans outstanding onthe November Record Date an amount on a per share basis equal to the balance of the per share amount of theNovember Distribution not permitted to be applied to reduce the exercise price of the applicable option inrespect of each share of common stock subject to an unvested option to purchase shares of HCA Holdings,Inc.’s common stock as of the November Record Date on or about the date such option becomes vested.
For additional information concerning the distribution payments on options held by the named executiveofficers, see the 2010 Summary Compensation Table.
Ownership Guidelines
While we have maintained stock ownership guidelines in the past, as a non-listed company, we no longerhave a policy regarding stock ownership guidelines. However, we do believe equity ownership aligns ourexecutive officers’ interests with those of the Investors. Accordingly, all of our named executive officers wererequired to rollover at least half their pre-Merger equity and, therefore, maintain significant stock ownership inthe Company. See “Security Ownership of Certain Beneficial Owners and Management and RelatedStockholder Matters.”
Retirement Plans
We currently maintain one tax-qualified retirement plan in which the named executive officers areeligible to participate, the HCA 401(k) Plan, to aid in retention and to assist employees in providing for theirretirement. We also formerly maintained the HCA Retirement Plan, which as of April 1, 2008, merged into theHCA 401(k) Plan resulting in one tax-qualified retirement plan. Generally all employees who have completedthe required service are eligible to participate in the HCA 401(k) Plan. Each of our named executive officersparticipates in the plan. For additional information on these plans, including amounts contributed by HCA in2010 to the named executive officers, see the Summary Compensation Table and related footnotes andnarratives and “2010 Pension Benefits.”
Our key executives, including the named executive officers, also participate in two supplementalretirement programs. The Committee and the Board initially approved these supplemental programs to:
• Recognize significant long-term contributions and commitments by executives to the Company and toperformance over an extended period of time;
• Induce our executives to continue in our employ through a specified normal retirement age (initially62 through 65, but reduced to 60 upon the change in control at the time of the Merger in 2006); and
• Provide a competitive benefit to aid in attracting and retaining key executive talent.
The HCA Restoration Plan, a non-qualified retirement plan, provides a benefit to replace a portion of thecontributions lost in the HCA 401(k) Plan due to certain Internal Revenue Service limitations. EffectiveJanuary 1, 2008, participants in the SERP (described below) are no longer eligible for Restoration Plancontributions. However, the hypothetical accounts maintained for each named executive officer under this planas of January 1, 2008 will continue to be maintained and were increased or decreased with hypotheticalinvestment returns based on the actual investment return of the Mix B fund within the HCA 401(k) Planthrough December 31, 2010. Subsequently, the hypothetical accounts as of December 31, 2010 will continueto be maintained but will not be increased or decreased with hypothetical investment returns. For additionalinformation concerning the Restoration Plan, see “2010 Nonqualified Deferred Compensation.”
Key executives also participate in the Supplemental Executive Retirement Plan (the “SERP”), adopted in2001. The SERP benefit brings the total value of annual retirement income to a specific income replacement
118
level. For named executive officers with 25 years or more of service, this income replacement level is 60% offinal average pay (base salary and PEP payouts) at normal retirement, a competitive level of benefit at thetime the plan was implemented. Due to the Merger, all participants are fully vested in their SERP benefits andthe plan is now frozen to new entrants. For additional information concerning the SERP, see “2010 PensionBenefits.”
In the event a participant renders service to another health care organization within five years followingretirement or termination of employment, he or she forfeits the rights to any further payment, and must repayany payments already made. This non-competition provision is subject to waiver by the Committee withrespect to the named executive officers.
Personal Benefits
Our executive officers receive limited, if any, benefits outside of those offered to our other employees.Generally, we provide these benefits to increase travel and work efficiencies and allow for more productiveuse of the executive’s time. Mr. Bracken is permitted to use the Company aircraft for personal trips, subject tothe aircraft’s availability. The named executive officers may have their spouses accompany them on businesstrips taken on the Company aircraft, subject to seat availability. In addition, there are times when it isappropriate for an executive’s spouse to attend events related to our business. On those occasions, we will payfor the travel expenses of the executive’s spouse. We will, on an as needed basis, provide mobile telephonesand personal digital assistants to our employees and certain of our executive officers have obtained suchdevices through us. The value of these personal benefits, if any, is included in the executive officer’s incomefor tax purposes and, in certain limited circumstances, the additional income attributed to an executive officeras a result of one or more of these benefits may be grossed up to cover the taxes due on that income. Exceptas otherwise discussed herein, other welfare and employee-benefit programs are the same for all of oureligible employees, including our executive officers. For additional information, see footnote (4) to theSummary Compensation Table.
Severance and Change in Control Benefits
As noted above, all of our named executive officers have entered into employment agreements, whichprovide, among other things, each executive’s rights upon a termination of employment in exchange fornon-competition, non-solicitation, and confidentiality covenants. We believe that reasonable severance benefitsare appropriate in order to be competitive in our executive retention efforts. These benefits should reflect thefact that it may be difficult for such executives to find comparable employment within a short period of time.We also believe that these types of agreements are appropriate and customary in situations such as the Mergerwherein the executives have made significant personal investments in the Company and that investment isgenerally illiquid for a significant period of time. Finally, we believe formalized severance arrangements arecommon benefits offered by employers competing for similar senior executive talent.
Severance Benefits for Named Executive Officers
If employment is terminated by the Company without “cause” or by the executive for “good reason”(whether or not the termination was in connection with a change-in-control), the executive would be entitledto “accrued rights” (cause, good reason and accrued rights are as defined in “Narrative Disclosure to SummaryCompensation Table and 2010 Grants of Plan-Based Awards Table — Employment Agreements”) plus:
• Subject to restrictive covenants and the signing of a general release of claims, an amount equal to twotimes for Messrs. Hazen and Rutledge and Ms. Wallace and three times in the case of Messrs. Brackenand Johnson the sum of base salary plus the annual PEP incentive paid or payable in respect of thefiscal year immediately preceding the fiscal year in which termination occurs, payable over a two yearperiod;
119
• Pro-rata bonus; and
• Continued coverage under our group health plans during the period over which the cash severance ispaid.
Additionally, unvested options will be forfeited; however, vested New Options (including 2x Time Options)will remain exercisable until the first anniversary of the termination of the executive’s employment.
Because we believe a termination by the executive for good reason (a constructive termination) isconceptually the same as an actual termination by the Company without cause, we believe it is appropriate toprovide severance benefits following such a constructive termination of the named executive officer’semployment. All of our severance provisions are believed to be within the realm of competitive practice andare intended to provide fair and reasonable compensation to the executive upon a termination event.
Change in Control Benefits
Pursuant to the Stock Option Agreements governing the New Options granted in 2007 and the 2x TimeOptions granted in 2009, both under the 2006 Plan, upon a Change in Control of the Company (as definedbelow), all unvested time vesting New Options and 2x Time Options (that have not otherwise terminated orbecome exercisable) shall become immediately exercisable. Performance options that vest subject to theachievement of EBITDA targets will become exercisable upon a Change in Control of the Company if:(i) prior to the date of the occurrence of such event, all EBITDA targets have been achieved for years endingprior to such date; (ii) on the date of the occurrence of such event, the Company’s actual cumulative totalEBITDA earned in all years occurring after the performance option grant date, and ending on the date of theChange in Control, exceeds the cumulative total of all EBITDA targets in effect for those same years; or(iii) the Investor Return is at least two-and-a-half times the price paid to the stockholders in the Merger (or$28.30). For purposes of the vesting provision set forth in clause (ii) above, the EBITDA target for the year inwhich the Change in Control occurs shall be equitably adjusted by the Board of Directors in good faith inconsultation with the chief executive officer (which adjustment shall take into account the time during suchyear at which the Change in Control occurs). Performance vesting options that vest based on the investmentreturn to the Sponsors will only vest upon the occurrence of a Change in Control if, as a result of such event,the applicable Investor Return (i.e., at least two times the price paid to the stockholders in the Merger for halfof these options and at least two-and-one-half times the price paid to the stockholders in the Merger for theother half of these options) is also achieved in such transaction (if not previously achieved). “Change inControl” means in one or more of a series of transactions (i) the transfer or sale of all or substantially all ofthe assets of the Company (or any direct or indirect parent of the Company) to an Unaffiliated Person (asdefined below); (ii) a merger, consolidation, recapitalization or reorganization of the Company (or any director indirect parent of the Company) with or into another Unaffiliated Person, or a transfer or sale of the votingstock of the Company (or any direct or indirect parent of the Company), an Investor, or any affiliate of any ofthe Investors to an Unaffiliated Person, in any such event that results in more than 50% of the common stockof the Company (or any direct or indirect parent of the Company) or the resulting company being held by anUnaffiliated Person; or (iii) a merger, consolidation, recapitalization or reorganization of the Company (or anydirect or indirect parent of the Company) with or into another Unaffiliated Person, or a transfer or sale by theCompany (or any direct or indirect parent of the Company), an Investor or any affiliate of any of the Investors,in any such event after which the Investors and their affiliates (x) collectively own less than 15% of thecommon stock of and (y) collectively have the ability to appoint less than 50% of the directors to the Board(or any resulting company after a merger). For purposes of this definition, the term “Unaffiliated Person”means a person or group who is not an Investor, an affiliate of any of the Investors or an entity in which anyInvestor holds, directly or indirectly, a majority of the economic interest in such entity.
Additional information regarding applicable payments under such agreements for the named executiveofficers is provided under “Narrative Disclosure to Summary Compensation Table and 2010 Grants of Plan-Based Awards Table — Employment Agreements” and “Potential Payments Upon Termination or Change inControl.”
120
Recoupment of Compensation
Information regarding the Company’s policy with respect to recovery of incentive compensation isprovided under “Annual Incentive Compensation: PEP” above.
Tax and Accounting Implications
On April 29, 2008, we registered our common stock pursuant to Section 12(g) of the Securities ExchangeAct of 1934, as amended; and the Company became subject to Section 162(m) of the Code, for fiscal year2008 and beyond, so long as the Company’s stock remains registered with the SEC. The Committee considersthe impact of Section 162(m) in the design of its compensation strategies. Under Section 162(m),compensation paid to executive officers in excess of $1,000,000 cannot be taken by us as a tax deductionunless the compensation qualifies as performance-based compensation. We have determined, however, that wewill not necessarily seek to limit executive compensation to amounts deductible under Section 162(m) if suchlimitation is not in the best interests of our stockholders. While considering the tax implications of itscompensation decisions, the Committee believes its primary focus should be to attract, retain and motivateexecutives and to align the executives’ interests with those of our stakeholders.
The Committee operates its compensation programs with the good faith intention of complying withSection 409A of the Internal Revenue Code. We account for stock based payments with respect to our longterm equity incentive award programs in accordance with the requirements of ASC 718.
2010 Summary Compensation Table
The following table sets forth information regarding the compensation earned by the Chief ExecutiveOfficer, the Chief Financial Officer and our other three most highly compensated executive officers during2010.
Name and Principal Positions YearSalary
($)
OptionAwards($)(1)
Non-EquityIncentive
PlanCompensation
($)(2)
Changes inPension
Value andNonqualified
DeferredCompensationEarnings ($)(3)
All OtherCompensation
($)(4) Total ($)
Richard M. Bracken . . . . . . . . . . . . . . . . 2010 $1,324,975 — $2,614,824 $9,250,610 $25,010,638 $38,201,047Chairman and Chief 2009 $1,324,975 $3,361,016 $3,445,000 $4,096,368 $ 25,532 $12,252,891Executive Officer 2008 $1,060,872 — $ 694,370 $1,740,620 $ 31,781 $ 3,527,643
R. Milton Johnson . . . . . . . . . . . . . . . . . 2010 $ 849,984 — $1,032,267 $3,524,104 $16,520,422 $21,926,777Executive Vice President, . . . . . . . . . . . 2009 $ 849,984 $2,520,714 $1,360,000 $2,032,089 $ 17,674 $ 6,780,461Chief Financial Officer and Director 2008 $ 786,698 — $ 355,491 $1,871,790 $ 38,769 $ 3,052,748
Samuel N. Hazen. . . . . . . . . . . . . . . . . . 2010 $ 788,672 — $ 816,431 $2,637,016 $10,759,757 $15,001,876President — Western Group 2009 $ 788,672 $ 997,771 $1,041,067 $1,725,405 $ 16,499 $ 4,569,414
2008 $ 788,672 — $ 350,807 $ 810,462 $ 15,651 $ 1,965,592
Beverly B. Wallace . . . . . . . . . . . . . . . . 2010 $ 700,000 — $ 701,348 $3,293,981 $ 8,538,321 $13,233,650President — Shared 2009 $ 700,000 $ 997,771 $ 924,018 $2,047,036 $ 16,500 $ 4,685,325Services Group 2008 $ 700,000 — $ 314,992 $2,080,836 $ 15,651 $ 3,111,479
W. Paul Rutledge . . . . . . . . . . . . . . . . . . 2010 $ 693,740 — $ 350,667 $2,598,032 $ 7,944,136 $11,586,575President — Central Group 2009 $ 675,000 $ 997,771 $ 891,017 $1,510,040 $ 16,500 $ 4,090,328
(1) Option Awards for 2009 include the aggregate grant date fair value of the stock option awards grantedduring fiscal year 2009 in accordance with ASC 718 with respect to the 2x Time Options to purchaseshares of our common stock awarded to the named executive officers in fiscal year 2009 under the 2006Plan.
(2) Non-Equity Incentive Plan Compensation for 2010 reflects amounts earned for the year endedDecember 31, 2010 under the 2010 PEP, which amounts will be paid in cash up to the target level and50% in cash and 50% through the grant of RSU awards in the first quarter of 2011 pursuant to the termsof the 2010 PEP. For 2010, the Company achieved its target performance level, but not did not reach its
121
maximum performance level, as adjusted, with respect to the Company’s EBITDA; therefore, pursuant tothe terms of the 2010 PEP, 2010 awards under the 2010 PEP will be paid out to the named executiveofficers at approximately 151.8% of each such officer’s respective target amount, with the exception ofMr. Hazen, whose award will be paid out at approximately 156.9% his target amount, due to the 50% ofhis PEP based on the Western Group EBITDA, which also exceeded the target performance level but didnot reach the maximum performance level, and Mr. Rutledge, whose award will be paid out atapproximately 75.9% of his target amount, due to the 50% of his PEP based on the Central GroupEBITDA, which did not reach the threshold performance level.
Non-Equity Incentive Plan Compensation for 2009 reflects amounts earned for the year endedDecember 31, 2009 under the 2008-2009 PEP, which amounts were paid in the first quarter of 2010pursuant to the terms of the 2008-2009 PEP. For 2009, the Company exceeded its maximum performancelevel, as adjusted, with respect to the Company’s EBITDA and the Central and Western Group EBITDA;therefore, pursuant to the terms of the 2008-2009 PEP, awards under the 2008-2009 PEP were paid out tothe named executive officers, at the maximum level of 200% of their respective target amounts.
Non-Equity Incentive Plan Compensation for 2008 reflects amounts earned for the year endedDecember 31, 2008 under the 2008-2009 PEP, which amounts were paid in the first quarter of 2009pursuant to the terms of the 2008-2009 PEP. For 2008, the Company did not achieve its targetperformance level, but exceeded its threshold performance level, as adjusted, with respect to theCompany’s EBITDA; therefore, pursuant to the terms of the 2008-2009 PEP, 2008 awards under the2008-2009 PEP were paid out to the named executive officers at approximately 68.2% of each suchofficer’s respective target amount, with the exception of Mr. Hazen, whose award was paid out atapproximately 67.4% of his target amount, due to the 50% of his PEP based on the Western GroupEBITDA, which also exceeded the threshold performance level but did not reach the target performancelevel.
(3) All amounts for 2010 are attributable to changes in value of the SERP benefits. Assumptions used tocalculate these figures are provided under the table titled “2010 Pension Benefits.” The changes in theSERP benefit value during 2010 were impacted mainly by: (i) the passage of time which reflects anotheryear of pay and service plus actual investment return and (ii) the discount rate changing from 5.00% to4.25%, which resulted in an increase in the value. The impact of these events on the SERP benefit valueswas:
Bracken Johnson Hazen Wallace Rutledge
Passage of Time. . . . . . . . . . . . . . . . . . $6,851,260 $2,181,373 $1,351,824 $2,240,652 $1,617,037
Discount Rate Change . . . . . . . . . . . . . $2,399,350 $1,342,731 $1,285,192 $1,053,329 $ 980,995
All amounts for 2009 are attributable to changes in value of the SERP benefits. Assumptions used tocalculate these figures are provided under the table titled “2010 Pension Benefits.” The changes in theSERP benefit value during 2009 were impacted mainly by: (i) the passage of time which reflects anotheryear of pay and service plus actual investment return and (ii) the discount rate changing from 6.25% to5.00%, which resulted in an increase in the value. The impact of these events on the SERP benefit valueswas:
Bracken Johnson Hazen Wallace Rutledge
Passage of Time. . . . . . . . . . . . . . . . . . $1,655,097 $ 618,320 $ 343,653 $ 788,376 $ 420,979
Discount Rate Change . . . . . . . . . . . . . $2,441,271 $1,413,769 $1,381,752 $1,258,660 $1,089,061
All amounts for 2008 are attributable to changes in value of the SERP benefits. Assumptions used tocalculate these figures are provided under the table titled “2010 Pension Benefits.” The changes in theSERP benefit value during 2008 were impacted mainly by: (i) the passage of time which reflects anotheryear of pay and service plus actual investment return and (ii) the discount rate changing from 6.00% to
122
6.25%, which resulted in a decrease in the value. The impact of these events on the SERP benefit valueswas:
Bracken Johnson Hazen Wallace
Passage of Time . . . . . . . . . . . . . . . . . . . . . . . . . . . $2,142,217 $2,100,290 $1,037,631 $2,301,107
Discount Rate Change . . . . . . . . . . . . . . . . . . . . . . $ (401,597) $ (228,500) $ (227,169) $ (220,271)
(4) 2010 amounts generally consist of:
• Distributions paid in 2010 on vested stock options held by the named executive officers on theapplicable distribution record dates. Distributions of $3.88, $1.11 and $4.44, respectively, per share ofcommon stock subject to such outstanding vested stock options held on the February 1, May 6 andNovember 24, 2010 record dates, respectively, were paid to the named executive officers in 2010. Thetotal cash distributions received on vested stock options by the named executive officers in 2010 were:
Bracken Johnson Hazen Wallace Rutledge
Cash distributions on vested stockoptions . . . . . . . . . . . . . . . . . . . . $21,752,083 $14,193,133 $9,264,688 $7,228,640 $6,630,283
• Distributions that will become payable to the named executive officers upon the vesting of theapplicable unvested stock option awards held by the named executive officers on the November 24,2010 record date. In accordance with the award agreements governing the New Option awards held bythe named executive officers, the Company reduced the per share exercise price of any unvested optionoutstanding as of the November 24, 2010 record date by the per share distribution amount ($4.44 pershare) to the extent the per share exercise price could be reduced under applicable tax rules. Pursuant tosuch award agreements, to the extent the per share exercise price could not be reduced by the full $4.44per share distribution, the Company will pay the named executive officers an amount on a per sharebasis equal to the balance of the per share distribution amount not permitted to be applied to reduce theexercise price of the applicable option in respect of each share of common stock subject to suchunvested option outstanding as of the November 24, 2010 record date upon the vesting of such option.The total cash distributions attributable to the November 24, 2010 record date distribution (suchamounts representing the balance of the distribution amount by which the exercise price of such optionscould not be reduced under applicable tax rules) that will become payable upon vesting of theapplicable unvested stock options awards held by the named executive officers on November 24, 2010are:
Bracken Johnson Hazen Wallace Rutledge
Balance of November 24, 2010distribution amount payable onunvested stock options upon vestingof such options . . . . . . . . . . . . . . . . $3,232,926 $2,309,235 $1,477,896 $1,293,161 $1,293,161
• Matching Company contributions to our 401(k) Plan as set forth below.
Bracken Johnson Hazen Wallace Rutledge
HCA 401(k) matching contribution . . . . . . . $16,500 $16,500 $16,499 $16,500 $16,499
• Personal use of corporate aircraft. In 2010, Messrs. Bracken, Johnson and Rutledge were allowedpersonal use of Company aircraft with an estimated incremental cost of $6,149, $1,554 and $2,339,respectively, to the Company. Ms. Wallace and Mr. Hazen did not have any personal travel onCompany aircraft in 2010. We calculate the aggregate incremental cost of the personal use of Companyaircraft based on a methodology that includes the average aggregate cost, on a per nautical mile basis,of variable expenses incurred in connection with personal plane usage, including trip-relatedmaintenance, landing fees, fuel, crew hotels and meals, on-board catering, trip-related hangar andparking costs and other variable costs. Because our aircraft are used primarily for business travel, ourincremental cost methodology does not include fixed costs of owning and operating aircraft that do notchange based on usage. We grossed up the income attributed to Mr. Bracken with respect to certaintrips on Company aircraft. The additional income attributed to him as a result of gross ups was $1,891.
123
In addition, we will pay the expenses of our executives’ spouses associated with travel to and/orattendance at business related events at which spouse attendance is appropriate. We paid approximately$692, $495 and $1,178 for travel and/or other expenses incurred by Messrs. Bracken, Hazen andRutledge’s spouses, respectively, for such business related events, and additional income of $397, $179and $676 was attributed to Messrs. Bracken, Hazen and Rutledge, respectively, as a result of the grossup on such amounts.
2009 amounts generally consist of:
• Matching Company contributions to our 401(k) Plan as set forth below.
Bracken Johnson Hazen Wallace Rutledge
HCA 401(k) matching contribution . . . . . . . $16,500 $16,500 $16,499 $16,500 $16,500
• Personal use of corporate aircraft. In 2009, Messrs. Bracken and Johnson were allowed personal use ofCompany aircraft with an estimated incremental cost of $5,025 and $1,129, respectively, to theCompany. Ms. Wallace and Messrs. Hazen and Rutledge did not have any personal travel on Companyaircraft in 2009. We calculate the aggregate incremental cost of the personal use of Company aircraftbased on a methodology that includes the average aggregate cost, on a per nautical mile basis, ofvariable expenses incurred in connection with personal plane usage, including trip-related maintenance,landing fees, fuel, crew hotels and meals, on-board catering, trip-related hangar and parking costs andother variable costs. Because our aircraft are used primarily for business travel, our incremental costmethodology does not include fixed costs of owning and operating aircraft that do not change based onusage. We grossed up the income attributed to Mr. Bracken with respect to certain trips on Companyaircraft. The additional income attributed to him as a result of gross ups was $594. In addition, we willpay the expenses of our executives’ spouses associated with travel to and/or attendance at businessrelated events at which spouse attendance is appropriate. We paid approximately $2,477 for traveland/or other expenses incurred by Mr. Bracken’s spouse for such business related events, and additionalincome of $891 was attributed to Mr. Bracken as a result of the gross up on such amount.
2008 amounts consist of:
• Company contributions to our former Retirement Plan and matching Company contributions to our401(k) Plan as set forth below.
Bracken Johnson Hazen Wallace
HCA Retirement Plan. . . . . . . . . . . . . . . . . . . . . . . . . . $ 3,163 $ 3,163 $ 3,163 $ 3,163HCA 401(k) matching contribution . . . . . . . . . . . . . . . . $12,488 $12,488 $12,488 $12,488
• Personal use of corporate aircraft. In 2008, Messrs. Bracken and Johnson were allowed personal use ofCompany aircraft with an estimated incremental cost of $15,233 and $4,546, respectively, to theCompany. Ms. Wallace and Mr. Hazen did not have any personal travel on Company aircraft in 2008.We calculate the aggregate incremental cost of the personal use of Company aircraft based on amethodology that includes the average aggregate cost, on a per nautical mile basis, of variable expensesincurred in connection with personal plane usage, including trip-related maintenance, landing fees, fuel,crew hotels and meals, on-board catering, trip-related hangar and parking costs and other variable costs.Because our aircraft are used primarily for business travel, our incremental cost methodology does notinclude fixed costs of owning and operating aircraft that do not change based on usage. We grossed upthe income attributed to Mr. Bracken with respect to certain trips on Company aircraft. The additionalincome attributed to him as a result of gross ups was $599. In addition, we will pay the expenses of ourexecutives’ spouses associated with travel to and/or attendance at business related events at whichspouse attendance is appropriate. We paid approximately $189 and $13,660 for travel and/or otherexpenses incurred by Messrs. Bracken’s and Johnson’s spouses, respectively, for such business relatedevents, and additional income of $109 and $4,912 was attributed to Messrs. Bracken and Johnson,respectively, as a result of the gross up on such amounts.
124
2010 Grants of Plan-Based Awards
The following table provides information with respect to awards made under our 2010 PEP during the2010 fiscal year.
NameGrantDate
Threshold($)
Target($)
Maximum($)
Threshold(#)
Target(#)
Maximum(#)
All OtherOption
Awards:Number ofSecurities
UnderlyingOptions(2)
Exercise orBase Priceof OptionAwards($/sh)
Grant DateFair Valueof OptionAwards
Estimated Possible PayoutsUnder Non-Equity Incentive
Plan Awards ($)(1)
Estimated Possible PayoutsUnder Equity Incentive
Plan Awards (#)
Richard M. Bracken . . . . . . . . . N/A $430,625 $1,722,500 $3,445,000 — — — — — —
R. Milton Johnson . . . . . . . . . . N/A $170,000 $ 680,000 $1,360,000 — — — — — —
Samuel N. Hazen . . . . . . . . . . . N/A $130,133 $ 520,534 $1,041,067 — — — — — —
Beverly B. Wallace. . . . . . . . . . N/A $115,502 $ 462,009 $ 924,018 — — — — — —
W. Paul Rutledge . . . . . . . . . . . N/A $115,500 $ 462,000 $ 924,000 — — — — — —
(1) Non-equity incentive awards granted to each of the named executive officers pursuant to our 2010 PEP forthe 2010 fiscal year, as described in more detail under “Compensation Discussion and Analysis — AnnualIncentive Compensation: PEP.” The amounts shown in the “Threshold” column reflect the thresholdpayment, which is 25% of the amount shown in the “Target” column. The amount shown in the“Maximum” column is 200% of the target amount. Pursuant to the terms of the 2010 PEP, the Companyachieved its target performance level, as adjusted, but not did not reach its maximum performance level,as adjusted, with respect to the Company’s EBITDA and the Western Group EBITDA; however, theCompany did not reach the threshold performance level, as adjusted, with respect to the Central GroupEBITDA. Therefore, 2010 awards under the 2010 PEP will be paid out to the named executive officers atapproximately 151.8% of each such officer’s respective target amount, with the exception of Mr. Hazen,whose award will be paid out at approximately 156.9% his target amount, due to the 50% of his PEPbased on the Western Group EBITDA, and Mr. Rutledge, whose award will be paid out at approximately75.9% of his target amount, due to the 50% of his PEP based on the Central Group EBITDA (includingthe International Division). Under the 2010 PEP for the 2010 fiscal year, Messrs. Bracken, Johnson, Hazenand Rutledge and Ms. Wallace will receive cash payments of $2,168,662, $856,134, $668,482, $350,667and $581,678, respectively, and approximately $446,162, $176,133, $147,949, $0 and $119,670,respectively, payable in RSU awards at a grant price to be determined by the Board of Directors inconsultation with the CEO in accordance with the 2010 PEP and our equity award policy, which RSUawards will vest 50% on the second anniversary of grant date and 50% on the third anniversary of thegrant date. Such amounts are reflected in the “Non-Equity Incentive Plan Compensation” column of theSummary Compensation Table.
Narrative Disclosure to Summary Compensation Table and 2010 Grants of Plan-Based Awards Table
Total Compensation
In 2010, 2009 and 2008, total direct compensation, as described in the Summary Compensation Table,consisted primarily of base salary, annual PEP awards payable in cash, and, in 2009, 2x Time Option grants asset forth in each named executive officer’s employment agreement to be fully vested on the fifth anniversaryof the Merger, and in 2010, distributions paid on the vested stock options held by the named executive officerson the applicable record dates and distributions that will become payable to the named executive officers uponthe vesting of the certain unvested stock option awards held by the named executive officers on theNovember 24, 2010 distribution record date to the extent the exercise price of such options could not be fullyreduced by the distribution amount under applicable tax rules. This mix was intended to reflect our philosophythat a significant portion of an executive’s compensation should be equity-linked and/or tied to our operatingperformance. In addition, we provided an opportunity for executives to participate in two supplementalretirement plans; however, effective January 1, 2008, participants in the SERP are no longer eligible forRestoration Plan contributions, although Restoration Plan accounts will continue to be maintained for suchparticipants (for additional information concerning the Restoration Plan, see “2010 Nonqualified DeferredCompensation”).
125
Options
In January 2007, New Options to purchase common stock of the Company were granted under the 2006Plan to members of management and key employees, including the named executive officers. The NewOptions were designed to be long term equity incentive awards, constituting a one-time stock option grant inlieu of annual equity grants. The New Options granted in 2007 have a ten year term and are structured so that1/3 are time vested options (vesting in five equal installments on the first five anniversaries of the grant date),1/3 are EBITDA-based performance vested options and 1/3 are performance options that vest based oninvestment return to the Sponsors. The terms of the New Options granted in 2007 are described in greaterdetail under “Compensation Discussion and Analysis — Long Term Equity Incentive Awards: Options.”
In accordance with their employment agreements entered into at the time of the Merger, as each mayhave been or may be subsequently amended, our named executive officers received the 2x Time Options inOctober 2009 with an exercise price equal to two times the share price at the Merger (or $22.64). TheCommittee allocated the 2x Time Options in consultation with our Chief Executive Officer, based on pastexecutive contributions and future anticipated impact on Company objectives. The 2x Time Options have a tenyear term and are structured so that forty percent were vested upon grant, an additional twenty percent of theoptions vested on November 17, 2009 and November 17, 2010, respectively, and twenty percent of the optionsgranted to each recipient will vest on November 17, 2011. Thereby, a portion of the grant was vested on thedate of the grant based on employment served since the Merger. The terms of the 2x Time Options areotherwise consistent with other time vesting options granted under the 2006 Plan. The terms of the 2x TimeOptions granted in 2009 are described in greater detail under “Compensation Discussion and Analysis — LongTerm Equity Incentive Awards: Options.” The aggregate grant date fair value of the 2x Time Options grantedin 2009 in accordance with ASC 718 is included under the “Option Awards” column of the SummaryCompensation Table.
As a result of the Merger, all unvested awards under the HCA 2005 Equity Incentive Plan (the “2005Plan”) (and all predecessor equity incentive plans) vested in November 2006. Generally, all outstandingoptions under the 2005 Plan (and any predecessor plans) were cancelled and converted into the right to receivea cash payment equal to the number of shares of common stock underlying the option multiplied by theamount by which the Merger consideration of $11.32 per share exceeded the exercise price for the options(without interest and less any applicable withholding taxes). However, certain members of management,including the named executive officers, were given the opportunity to convert options held by them prior toconsummation of the Merger into options to purchase shares of common stock of the surviving corporation(“Rollover Options”). Immediately after the consummation of the Merger, all Rollover Options (other thanthose with an exercise price below $2.83) were adjusted so that they retained the same “spread value” (asdefined below) as immediately prior to the Merger, but the new per share exercise price for all RolloverOptions became $2.83. The term “spread value” means the difference between (x) the aggregate fair marketvalue of the common stock (determined using the Merger consideration of $11.32 per share) subject to theoutstanding options held by the participant immediately prior to the Merger that became Rollover Options, and(y) the aggregate exercise price of those options.
New Options, 2x Time Options and Rollover Options held by the named executive officers are describedin the Outstanding Equity Awards at 2010 Fiscal Year-End Table.
Employment Agreements
In connection with the Merger, on November 16, 2006, Hercules Holding entered into substantiallysimilar employment agreements with each of the named executive officers and certain other executives, whichagreements were shortly thereafter assumed by HCA Inc., and then in November 2010, to the extentapplicable, by HCA Holdings, Inc., and which agreements govern the terms of each executive’s employment.The Company entered into an amendment to Mr. Bracken’s employment agreement, effective January 1, 2009,to reflect his appointment to the position of Chief Executive Officer. Effective as of February 9, 2011, theCompany entered into amendments to Messrs. Bracken’s, Johnson’s, Hazen’s and Ms. Wallace’s employmentagreements reflecting the new titles and new responsibilities resulting from the Company’s internal
126
reorganization. In addition, Mr. Johnson’s amendment reflects that he shall serve as a member of the Board ofDirectors of the Company for so long as he is an officer of the Company.
Executive Employment Agreements
The term of employment under each of these agreements is indefinite, and they are terminable by eitherparty at any time; provided that an executive must give no less than 90 days notice prior to a resignation.
Each employment agreement sets forth the executive’s annual base salary, which will be subject todiscretionary annual increases upon review by the Board of Directors, and states that the executive will beeligible to earn an annual bonus as a percentage of salary with respect to each fiscal year, based upon theextent to which annual performance targets established by the Board of Directors are achieved. Theemployment agreements committed us to provide each executive with annual bonus opportunities in 2008 thatwere consistent with those applicable to the 2007 fiscal year, unless doing so would be adverse to our interestsor the interests of our stockholders, and for later fiscal years, the agreements provide that the Board ofDirectors will set bonus opportunities in consultation with our Chief Executive Officer. With respect to the2010 fiscal year and the 2009 and 2008 fiscal years, each executive was eligible to earn under the 2010 PEPand the 2008-2009 PEP, respectively, (i) a target bonus, if performance targets were met; (ii) a specifiedpercentage of the target bonus, if “threshold” levels of performance were achieved but performance targetswere not met; or (iii) a multiple of the target bonus if “maximum” performance goals were achieved, with theannual bonus amount being interpolated, in the sole discretion of the Board of Directors, for performanceresults that exceeded “threshold” levels but do not meet or exceed “maximum” levels. The annual bonusopportunities for 2010 were set forth in the 2010 PEP, as described in more detail under “CompensationDiscussion and Analysis — Annual Incentive Compensation: PEP.” As described above, the Company achievedits target performance level, as adjusted, for 2010 but did not reach its maximum performance level, asadjusted, with respect to the Company’s EBITDA and the Western Group EBITDA; however, the Companydid not reach the threshold performance level, as adjusted, with respect to the Central Group EBITDA.Therefore, 2010 awards under the 2010 PEP will be paid out to the named executive officers at approximately151.8% of each such officer’s respective target amount, with the exception of Mr. Hazen, whose award will bepaid out at approximately 156.9% of his target amount, due to the 50% of his PEP based on the WesternGroup EBITDA, and Mr. Rutledge, whose award will be paid out at approximately 75.9% of his targetamount, due to the 50% of his PEP based on the Central Group EBITDA. As described above, the Companyexceeded its maximum performance level, as adjusted, for 2009 with respect to the Company’s EBITDA andthe Central and Western Group EBITDA; therefore, pursuant to the terms of the 2008-2009 PEP, awards werepaid out to the named executive officers, at the maximum level of 200% of their respective target amounts for2009. As described above, awards under the 2008 PEP were paid out to the named executive officers atapproximately 68.2% of each such officer’s respective target amount, with the exception of Mr. Hazen, whoseaward was paid out at approximately 67.4% of the target amount. Each employment agreement also sets forththe number of options that the executive received pursuant to the 2006 Plan as a percentage of the total equityinitially made available for grants pursuant to the 2006 Plan. Such option awards, the New Options, weremade January 30, 2007 and are described above under “Options.” In each of the employment agreements withthe named executive officers, we also committed to grant, among the named executive officers and certainother executives, the 2x Time Options, which were granted, as described above, on October 6, 2009.Additionally, pursuant to the employment agreements, we agree to indemnify each executive against anyadverse tax consequences (including, without limitation, under Section 409A and 4999 of the Internal RevenueCode), if any, that result from the adjustment by us of stock options held by the executive in connection withMerger or the future payment of any extraordinary cash dividends.
Pursuant to each employment agreement, if an executive’s employment terminates due to death ordisability, the executive would be entitled to receive (i) any base salary and any bonus that is earned andunpaid through the date of termination; (ii) reimbursement of any unreimbursed business expenses properlyincurred by the executive; (iii) such employee benefits, if any, as to which the executive may be entitled underour employee benefit plans (the payments and benefits described in (i) through (iii) being “accrued rights”);and (iv) a pro rata portion of any annual bonus that the executive would have been entitled to receive pursuant
127
to the employment agreement based upon our actual results for the year of termination (with such prorationbased on the percentage of the fiscal year that shall have elapsed through the date of termination ofemployment, payable to the executive when the annual bonus would have been otherwise payable (the “prorata bonus”)).
If an executive’s employment is terminated by us without “cause” (as defined below) or by the executivefor “good reason” (as defined below) (each a “qualifying termination”), the executive would be (i) entitled tothe accrued rights; (ii) subject to compliance with certain confidentiality, non-competition and non-solicitationcovenants contained in his or her employment agreement and execution of a general release of claims onbehalf of the Company, an amount equal to the product of (x) two (three in the case of Richard M. Brackenand R. Milton Johnson) and (y) the sum of (A) the executive’s base salary and (B) annual bonus paid orpayable in respect of the fiscal year immediately preceding the fiscal year in which termination occurs,payable over a two- year period; (iii) entitled to the pro rata bonus; and (iv) entitled to continued coverageunder our group health plans during the period over which the cash severance described in clause (ii) is paid.The executive’s vested New Options and 2x Time Options would also remain exercisable until the firstanniversary of the termination of the executive’s employment. However, in lieu of receiving the payments andbenefits described in (ii), (iii) and (iv) immediately above, the executive may instead elect to have his or hercovenants not to compete waived by us. The same severance applies regardless of whether the termination wasin connection with a change in control of the Company.
“Cause” is defined as an executive’s (i) willful and continued failure to perform his material duties to theCompany which continues beyond 10 business days after a written demand for substantial performance isdelivered; (ii) willful or intentional engagement in material misconduct that causes material and demonstrableinjury, monetarily or otherwise, to the Company or the Sponsors; (iii) conviction of, or a plea of nolocontendere to, a crime constituting a felony, or a misdemeanor for which a sentence of more than six months’imprisonment is imposed; or (iv) willful and material breach of his covenants under the employmentagreement which continues beyond the designated cure period or of the agreements relating to the new equity.“Good Reason” is defined as (i) a reduction in the executive’s base salary (other than a general reduction thataffects all similarly situated employees in substantially the same proportions which is implemented by theBoard in good faith after consultation with the chief executive officer and chief operating officer), a reductionin the executive’s annual incentive compensation opportunity, or the reduction of benefits payable to theexecutive under the SERP; (ii) a substantial diminution in the executive’s title, duties and responsibilities; or(iii) a transfer of the executive’s primary workplace to a location that is more than 20 miles from his or hercurrent workplace (other than, in the case of (i) and (ii), any isolated, insubstantial and inadvertent failure thatis not in bad faith and is cured within 10 business days after the executive’s written notice to the Company).
In the event of an executive’s termination of employment that is not a qualifying termination or atermination due to death or disability, he or she will only be entitled to the “accrued rights” (as definedabove).
Additional information with respect to potential payments to the named executive officers pursuant totheir employment agreements and the 2006 Plan is contained in “Potential Payments Upon Termination orChange in Control.”
128
Outstanding Equity Awards at 2010 Fiscal Year-End
The following table includes certain information with respect to options held by the named executiveofficers as of December 31, 2010.
Name
Number ofSecurities
UnderlyingUnexercised
OptionsExercisable(#)(1)(2)(3)
Number ofSecurities
UnderlyingUnexercised
OptionsUnexercisable
(#)(2)(3)
Equity IncentivePlan Awards:
Number ofSecurities
UnderlyingUnexercised
UnearnedOptions(#)(2)
OptionExercise
Price($)(4)(5)(6)
OptionExpiration
Date
Richard M. Bracken . . . . . . . . . . . . . . . . . . 134,852 — — $ 2.83 1/24/2012
Richard M. Bracken . . . . . . . . . . . . . . . . . . 182,407 — — $ 2.83 1/29/2013
Richard M. Bracken . . . . . . . . . . . . . . . . . . 136,208 — — $ 2.83 1/29/2014
Richard M. Bracken . . . . . . . . . . . . . . . . . . 48,378 — — $ 2.83 1/27/2015
Richard M. Bracken . . . . . . . . . . . . . . . . . . 31,961 — — $ 2.83 1/26/2016
Richard M. Bracken . . . . . . . . . . . . . . . . . . 105,011 210,032 630,078 $ 5.31 1/30/2017
Richard M. Bracken . . . . . . . . . . . . . . . . . . 630,068 — — $11.32 1/30/2017
Richard M. Bracken . . . . . . . . . . . . . . . . . . — 284,490 — $13.21 10/6/2019
Richard M. Bracken . . . . . . . . . . . . . . . . . . 284,481 — — $17.65 10/6/2019
Richard M. Bracken . . . . . . . . . . . . . . . . . . 853,445 — — $22.64 10/6/2019
R. Milton Johnson . . . . . . . . . . . . . . . . . . . 43,153 — — $ 2.83 1/24/2012
R. Milton Johnson . . . . . . . . . . . . . . . . . . . 41,689 — — $ 2.83 1/29/2013
R. Milton Johnson . . . . . . . . . . . . . . . . . . . 36,319 — — $ 2.83 1/29/2014
R. Milton Johnson . . . . . . . . . . . . . . . . . . . 117,188 — — $ 2.83 7/22/2014
R. Milton Johnson . . . . . . . . . . . . . . . . . . . 29,016 — — $ 2.83 1/27/2015
R. Milton Johnson . . . . . . . . . . . . . . . . . . . 19,374 — — $ 2.83 1/26/2016
R. Milton Johnson . . . . . . . . . . . . . . . . . . . 75,008 150,021 450,057 $ 5.31 1/30/2017
R. Milton Johnson . . . . . . . . . . . . . . . . . . . 450,048 — — $11.32 1/30/2017
R. Milton Johnson . . . . . . . . . . . . . . . . . . . — 213,365 — $13.21 10/6/2019R. Milton Johnson . . . . . . . . . . . . . . . . . . . 213,356 — — $17.65 10/6/2019
R. Milton Johnson . . . . . . . . . . . . . . . . . . . 640,070 — — $22.64 10/6/2019
Samuel N. Hazen . . . . . . . . . . . . . . . . . . . . 86,306 — — $ 2.83 1/24/2012
Samuel N. Hazen . . . . . . . . . . . . . . . . . . . . 104,232 — — $ 2.83 1/29/2013
Samuel N. Hazen . . . . . . . . . . . . . . . . . . . . 75,670 — — $ 2.83 1/29/2014
Samuel N. Hazen . . . . . . . . . . . . . . . . . . . . 29,016 — — $ 2.83 1/27/2015
Samuel N. Hazen . . . . . . . . . . . . . . . . . . . . 19,374 — — $ 2.83 1/26/2016
Samuel N. Hazen . . . . . . . . . . . . . . . . . . . . 48,005 96,015 288,031 $ 5.31 1/30/2017
Samuel N. Hazen . . . . . . . . . . . . . . . . . . . . 288,030 — — $11.32 1/30/2017
Samuel N. Hazen . . . . . . . . . . . . . . . . . . . . — 84,464 — $13.21 10/6/2019
Samuel N. Hazen . . . . . . . . . . . . . . . . . . . . 84,450 — — $17.65 10/6/2019
Samuel N. Hazen . . . . . . . . . . . . . . . . . . . . 253,352 — — $22.64 10/6/2019
Beverly B. Wallace . . . . . . . . . . . . . . . . . . 62,538 — — $ 2.83 1/29/2013
Beverly B. Wallace . . . . . . . . . . . . . . . . . . 51,456 — — $ 2.83 1/29/2014
Beverly B. Wallace . . . . . . . . . . . . . . . . . . 20,726 — — $ 2.83 1/27/2015
Beverly B. Wallace . . . . . . . . . . . . . . . . . . 16,032 — — $ 2.83 1/26/2016
Beverly B. Wallace . . . . . . . . . . . . . . . . . . 42,004 84,013 252,027 $ 5.31 1/30/2017
Beverly B. Wallace . . . . . . . . . . . . . . . . . . 252,026 — — $11.32 1/30/2017
129
Name
Number ofSecurities
UnderlyingUnexercised
OptionsExercisable(#)(1)(2)(3)
Number ofSecurities
UnderlyingUnexercised
OptionsUnexercisable
(#)(2)(3)
Equity IncentivePlan Awards:
Number ofSecurities
UnderlyingUnexercised
UnearnedOptions(#)(2)
OptionExercise
Price($)(4)(5)(6)
OptionExpiration
Date
Beverly B. Wallace . . . . . . . . . . . . . . . . . . — 84,464 — $13.21 10/6/2019
Beverly B. Wallace . . . . . . . . . . . . . . . . . . 84,450 — — $17.65 10/6/2019
Beverly B. Wallace . . . . . . . . . . . . . . . . . . 253,352 — — $22.64 10/6/2019
W. Paul Rutledge . . . . . . . . . . . . . . . . . . . . 37,756 — — $ 2.83 1/24/2012
W. Paul Rutledge . . . . . . . . . . . . . . . . . . . . 41,689 — — $ 2.83 1/29/2013
W. Paul Rutledge . . . . . . . . . . . . . . . . . . . . 24,214 — — $ 2.83 1/29/2014
W. Paul Rutledge . . . . . . . . . . . . . . . . . . . . 10,346 — — $ 2.83 1/27/2015W. Paul Rutledge . . . . . . . . . . . . . . . . . . . . 24,304 — — $ 2.83 10/1/2015
W. Paul Rutledge . . . . . . . . . . . . . . . . . . . . 19,374 — — $ 2.83 1/26/2016
W. Paul Rutledge . . . . . . . . . . . . . . . . . . . . 42,004 84,013 252,027 $ 5.31 1/30/2017
W. Paul Rutledge . . . . . . . . . . . . . . . . . . . . 252,026 — — $11.32 1/30/2017
W. Paul Rutledge . . . . . . . . . . . . . . . . . . . . — 84,464 — $13.21 10/6/2019
W. Paul Rutledge . . . . . . . . . . . . . . . . . . . . 84,450 — — $17.65 10/6/2019
W. Paul Rutledge . . . . . . . . . . . . . . . . . . . . 253,352 — — $22.64 10/6/2019
(1) Reflects Rollover Options, as further described under “Narrative Disclosure to Summary CompensationTable and 2010 Grants of Plan-Based Awards Table — Options,” the 60% of the named executive officer’stime vested New Options, comprised of the 20% that vested as of January 30, 2008, January 30, 2009 andJanuary 30, 2010, respectively, the 80% of the named executive officer’s EBITDA-based performancevested New Options, comprised of the 20% that vested as of December 31, 2007, December 31, 2008,December 31, 2009 and December 31, 2010, respectively (upon the Committee’s determination that theCompany achieved the 2007, 2008, 2009 and 2010 EBITDA performance targets under the option awards,as adjusted, as described in more detail under “Compensation Discussion and Analysis — Long TermEquity Incentive Awards: Options”) and the 80% of the named executive officer’s vested 2x Time Options,comprised of the 40% that were vested on the grant date and the 20% that vested on November 17, 2009and November 17, 2010, respectively.
(2) Reflects New Options awarded in January 2007 under the 2006 Plan by the Compensation Committee aspart of the named executive officer’s long term equity incentive award. The New Options granted in 2007are structured so that 1/3 are time vested options (vesting in five equal installments on the first fiveanniversaries of the January 30, 2007 grant date), 1/3 are EBITDA-based performance vested options(vesting in equal increments of 20% at the end of fiscal years 2007, 2008, 2009, 2010 and 2011 if certainannual EBITDA performance targets are achieved, subject to “catch up” vesting, such that, options thatwere eligible to vest but failed to vest due to our failure to achieve prior EBITDA targets will vest if atthe end of any subsequent year or at the end of fiscal year 2012, the cumulative total EBITDA earned inall prior years exceeds the cumulative EBITDA target at the end of such fiscal year) and 1/3 areperformance options that vest based on investment return to the Sponsors (vesting with respect to 10% ofthe common stock subject to such options at the end of fiscal years 2007, 2008, 2009, 2010 and 2011 ifthe Investor Return is at least $22.64 and with respect to an additional 10% at the end of fiscal years2007, 2008, 2009, 2010 and 2011 if the Investor Return is at least $28.30, subject to “catch up” vesting ifthe relevant Investor Return is achieved at any time occurring prior to January 30, 2017, so long as thenamed executive officer remains employed by the Company). The time vested options are reflected in the“Number of Securities Underlying Unexercised Options Unexercisable” column (with the exception of the60% of the time vested options that were vested as of December 31, 2010, which are reflected in the“Number of Securities Underlying Unexercised Options Exercisable” column), and the EBITDA-based
130
performance vested options and investment return performance vested options are both reflected in the“Equity Incentive Plan Awards: Number of Securities Underlying Unexercised Unearned Options” column(with the exception of the 80% of the EBITDA-based performance vested options that were vested as ofDecember 31, 2010, which are reflected in the “Number of Securities Underlying Unexercised OptionsExercisable” column). The terms of these option awards are described in more detail under “NarrativeDisclosure to Summary Compensation Table and 2010 Grants of Plan-Based Awards Table — Options.”
(3) Reflects 2x Time Options awarded in October 2009 under the 2006 Plan by the Compensation Committee,pursuant to the named executive officer’s employment agreement, as part of the named executive officer’slong term equity incentive award. The 2x Time Options are structured, pursuant to the named executiveofficer’s respective employment agreements, so that 40% were vested on the grant date, an additional 20%vested on November 17, 2009 and November 17, 2010, respectively, and an additional 20% will vest onNovember 17, 2011. The 80% of the 2x Time Options that were vested as of December 31, 2010 arereflected in the “Number of Securities Underlying Unexercised Options Exercisable” column, and the 20%of the 2x Time Options that were not vested as of December 31, 2010 are reflected in the “Number ofSecurities Underlying Unexercised Options Unexercisable” column. The terms of these option awards aredescribed in more detail under “Narrative Disclosure to Summary Compensation Table and 2010 Grants ofPlan-Based Awards Table — Options.”
(4) Immediately after the consummation of the Merger, all Rollover Options (other than those with anexercise price below $2.83) were adjusted such that they retained the same “spread value” (as definedbelow) as immediately prior to the Merger, but the new per share exercise price for all Rollover Optionswould be $2.83. The term “spread value” means the difference between (x) the aggregate fair marketvalue of the common stock (determined using the Merger consideration of $11.32 per share) subject to theoutstanding options held by the participant immediately prior to the Merger that became Rollover Options,and (y) the aggregate exercise price of those options.
(5) The exercise price for the New Options granted under the 2006 Plan to the named executive officers onJanuary 30, 2007 was equal to the fair value of our common stock on the date of the grant, as determinedby our Board of Directors in consultation with our Chief Executive Officer and other advisors, pursuant tothe terms of the 2006 Plan. Pursuant to the New Options award agreements, in connection with thedistributions of $3.88, $1.11 and $4.44, respectively, per share of outstanding common stock andoutstanding vested stock option held on the February 1, May 6 and November 24, 2010 record dates,respectively, the Company reduced the per share exercise price of any unvested New Options outstandingas of the applicable record dates by the per share distribution amount to the extent the per share exerciseprice could be reduced under applicable tax rules. With respect to the November 24, 2010 distribution andpursuant the New Option award agreements, to the extent the per share exercise price could not bereduced by the full $4.44 per share distribution, the Company will pay the named executive officers anamount on a per share basis equal to the balance of the per share distribution amount not permitted to beapplied to reduce the exercise price of the applicable option in respect of each share of common stocksubject to such unvested option outstanding as of the November 24, 2010 record date upon the vesting ofsuch option. The total cash distributions attributable to the November 24, 2010 record date distribution(such amounts representing the balance of the distribution amount by which the exercise price of suchoptions could not be reduced under applicable tax rules) that will become payable upon vesting of theapplicable unvested stock options awards held by the named executive officers on November 24, 2010 arereflected in the “All Other Compensation” column of the Summary Compensation Table.
(6) The exercise price for the 2x Time Options granted under the 2006 Plan to the named executive officerson October 6, 2009 was $22.64, pursuant to the named executive officers’ employment agreements.Pursuant to the New Options award agreements, in connection with the distributions of $3.88, $1.11 and$4.44, respectively, per share of outstanding common stock and outstanding vested stock option held onthe February 1, May 6 and November 24, 2010 record dates, respectively, the Company reduced the pershare exercise price of any unvested 2x Time Options outstanding as of the applicable record dates by theper share distribution amount to the extent the per share exercise price could be reduced under applicabletax rules.
131
Option Exercises and Stock Vested in 2010
The following table includes certain information with respect to options exercised by the named executiveofficers during the fiscal year ended December 31, 2010.
Name
Number of SharesAcquired onExercise(1)
Value Realized onExercise ($)(2)
Option Awards
Richard M. Bracken . . . . . . . . . . . . . . . . . . . . . . . . . . . . . . . . . 154,521 $3,137,421
R. Milton Johnson . . . . . . . . . . . . . . . . . . . . . . . . . . . . . . . . . . 15,173 $ 552,387
Samuel N. Hazen . . . . . . . . . . . . . . . . . . . . . . . . . . . . . . . . . . . 86,328 $1,752,840Beverly B. Wallace . . . . . . . . . . . . . . . . . . . . . . . . . . . . . . . . . . 70,358 $1,428,578
(1) Messrs. Bracken and Hazen and Ms. Wallace elected a cash exercise of 154,521, 86,328 and 70,358 stockoptions, respectively, resulting in net shares realized of 154,521, 86,328 and 70,358, respectively.Mr. Johnson elected a cashless exercise of 27,205 stock options, resulting in net shares realized of 15,173.
(2) Represents the difference between the exercise price of the options and the fair market value of thecommon stock on the date of exercise, as determined by our Board of Directors in consultation with ourChief Executive Officer and other advisors.
2010 Pension Benefits
Our SERP is intended to qualify as a “top-hat” plan designed to benefit a select group of management orhighly compensated employees. There are no other defined benefit plans that provide for payments or benefitsto any of the named executive officers. Information about benefits provided by the SERP is as follows:
NamePlan
NameNumber of YearsCredited Service
Present Value ofAccumulated Benefit
Payments DuringLast Fiscal Year
Richard M. Bracken . . . . . . . . . . . SERP 29 $23,554,306 —
R. Milton Johnson . . . . . . . . . . . . . SERP 28 $ 9,877,428 —
Samuel N. Hazen . . . . . . . . . . . . . SERP 28 $ 7,967,999 —
Beverly B. Wallace . . . . . . . . . . . . SERP 27 $11,990,524 —
W. Paul Rutledge . . . . . . . . . . . . . SERP 29 $ 8,102,058 —
Messrs. Bracken and Rutledge and Ms. Wallace are eligible for early retirement. The remaining namedexecutive officers have not satisfied the eligibility requirements for normal or early retirement. All of thenamed executive officers are 100% vested in their accrued SERP benefit.
Plan Provisions
In the event the employee’s “accrued benefits under the Company’s Plans” (computed using “actuarialfactors”) are insufficient to provide the “life annuity amount,” the SERP will provide a benefit equal to theamount of the shortfall. Benefits can be paid in the form of an annuity or a lump sum. The lump sum iscalculated by converting the annuity benefit using the “actuarial factors.” All benefits with a present value notexceeding one million dollars are paid as a lump sum regardless of the election made.
Normal retirement eligibility requires attainment of age 60 for employees who were participants at thetime of the change in control which occurred as a result of the Merger, including all of the named executiveofficers. Early retirement eligibility requires age 55 with 20 or more years of service. The service requirementfor early retirement is waived for employees participating in the SERP at the time of its inception in 2001,including all of the named executive officers. The “life annuity amount” payable to a participant who takesearly retirement is reduced by three percent for each full year or portion thereof that the participant retiresprior to normal retirement age.
The “life annuity amount” is the annual benefit payable as a life annuity to a participant upon normalretirement. It is equal to the participant’s “accrual rate” multiplied by the product of the participant’s “years of
132
service” times the participant’s “pay average.” The SERP benefit for each year equals the life annuity amountless the annual life annuity amount produced by the employee’s “accrued benefit under the Company’s Plans.”
The “accrual rate” is a percentage assigned to each participant, and is either 2.2% or 2.4%. All of thenamed executive officers are assigned a percentage of 2.4%.
A participant is credited with a “year of service” for each calendar year that the participant performs1,000 hours of service for HCA Inc. or one of its subsidiaries, or for each year the participant is otherwisecredited by us, subject to a maximum credit of 25 years of service.
A participant’s “pay average” is an amount equal to one-fifth of the sum of the compensation during theperiod of 60 consecutive months for which total compensation is greatest within the 120 consecutive monthperiod immediately preceding the participant’s retirement. For purposes of this calculation, the participant’scompensation includes base compensation, payments under the PEP, and bonuses paid prior to theestablishment of the PEP.
The “accrued benefits under the Company’s Plans” for an employee equals the sum of the employer-funded benefits accrued under the former HCA Retirement Plan (which was merged into the HCA 401(k) Planin 2008), the HCA 401(k) Plan and any other tax-qualified plan maintained by HCA Inc. or one of itssubsidiaries, the income/loss adjusted amount distributed to the participant under any of these plans, theaccount credit and the income/loss adjusted amount distributed to the participant under the Restoration Planand any other nonqualified retirement plans sponsored by HCA Inc. or one of its subsidiaries.
The “actuarial factors” include (a) interest at the long term Applicable Federal Rate underSection 1274(d) of the Code or any successor thereto as of the first day of November preceding the plan yearin which the participant’s retirement, death, disability, or termination with benefit rights under Section 5.3 or6.2 occurs, and (b) mortality being the applicable Section 417(e)(3) of the Code mortality table, as specifiedand changed by the U.S. Treasury Department.
Credited service does not include any amount other than service with HCA Inc. or one of its subsidiaries.
Assumptions
The Present Value of Accumulated Benefit is based on a measurement date of December 31, 2010. Themeasurement date for valuing plan liabilities on the Company’s balance sheet is December 31, 2010.
The assumption is made that there is no probability of pre-retirement death or termination. Retirementage is assumed to be the Normal Retirement Age as defined in the SERP for all named executive officers, asadjusted by the provisions relating to change in control, or age 60. Age 60 also represents the earliest date thenamed executive officers are eligible to receive an unreduced benefit.
All other assumptions used in the calculations are the same as those used for the valuation of the planliabilities in the plan’s most recent annual valuation.
Supplemental Information
In the event a participant renders service to another health care organization within five years followingretirement or termination of employment, he or she forfeits his rights to any further payment, and must repayany benefits already paid. This non-competition provision is subject to waiver by the Committee with respectto the named executive officers.
133
2010 Nonqualified Deferred Compensation
Amounts shown in the table are attributable to the HCA Restoration Plan, an unfunded, nonqualifieddefined contribution plan designed to restore benefits under the HCA 401(k) Plan based on compensation inexcess of the Code Section 401(a)(17) compensation limit.
Name
ExecutiveContributions
in LastFiscal Year
RegistrantContributions
in LastFiscal Year
AggregateEarningsin Last
Fiscal Year
AggregateWithdrawals/Distributions
AggregateBalanceat Last
Fiscal Year End
Richard M. Bracken . . . . . . . . . . . . — — $206,549 — $1,624,946
R. Milton Johnson . . . . . . . . . . . . . — — $ 84,699 — $ 666,338
Samuel N. Hazen . . . . . . . . . . . . . . — — $113,066 — $ 889,505
Beverly B. Wallace . . . . . . . . . . . . . — — $ 69,780 — $ 548,966
W. Paul Rutledge . . . . . . . . . . . . . . — — $ 62,128 — $ 488,770
The following amounts from the column titled “Aggregate Balance at Last Fiscal Year” have beenreported in the Summary Compensation Tables in prior years:
Name 2001 2002 2003 2004 2005 2006 2007Restoration Contribution
Richard M. Bracken . . . . . . . . . $87,924 $146,549 $162,344 $192,858 $172,571 $409,933 $91,946
R. Milton Johnson . . . . . . . . . . — — — — $ 71,441 $212,109 $57,792
Samuel N. Hazen . . . . . . . . . . . — — $ 79,510 $101,488 $ 97,331 $247,060 $62,004
Beverly B. Wallace . . . . . . . . . . — — — — — — $52,250
Plan Provisions
Until 2008, hypothetical accounts for each participant were credited each year with a contributiondesigned to restore the HCA Retirement Plan based on compensation in excess of the Code Section 401(a)(17)compensation limit, based on years of service. Effective January 1, 2008, participants in the SERP are nolonger eligible for Restoration Plan contributions. However, the hypothetical accounts as of January 1, 2008will continue to be maintained and were increased or decreased with hypothetical investment returns based onthe actual investment return of the Mix B fund of the HCA 401(k) Plan through December 31, 2010.Subsequently, the hypothetical accounts as of December 31, 2010 will continue to be maintained but will notbe increased or decreased with hypothetical investment returns.
No employee deferrals are allowed under this or any other nonqualified deferred compensation plan.
Prior to April 30, 2009, eligible employees made a one-time election prior to participation (or prior toDecember 31, 2006, if earlier) regarding the form of distribution of the benefit. Participants chose between alump sum and five or ten-year installments. All distributions are paid in the form of a lump-sum distributionunless the participant submitted an installment payment election prior to April 30, 2009. Distributions are paid(or begin) during the July following the year of termination of employment or retirement. All balances notexceeding $500,000 are automatically paid as a lump sum, regardless of election.
Supplemental Information
In the event a named executive officer renders service to another health care organization within fiveyears following retirement or termination of employment, he or she forfeits the rights to any further payment,and must repay any payments already made. This non-competition provision is subject to waiver by theCommittee with respect to the named executive officers.
Potential Payments Upon Termination or Change in Control
The following tables show the estimated amount of potential cash severance payable to each of thenamed executive officers (based upon his or her 2010 base salary and PEP payment received in 2010 for 2009
134
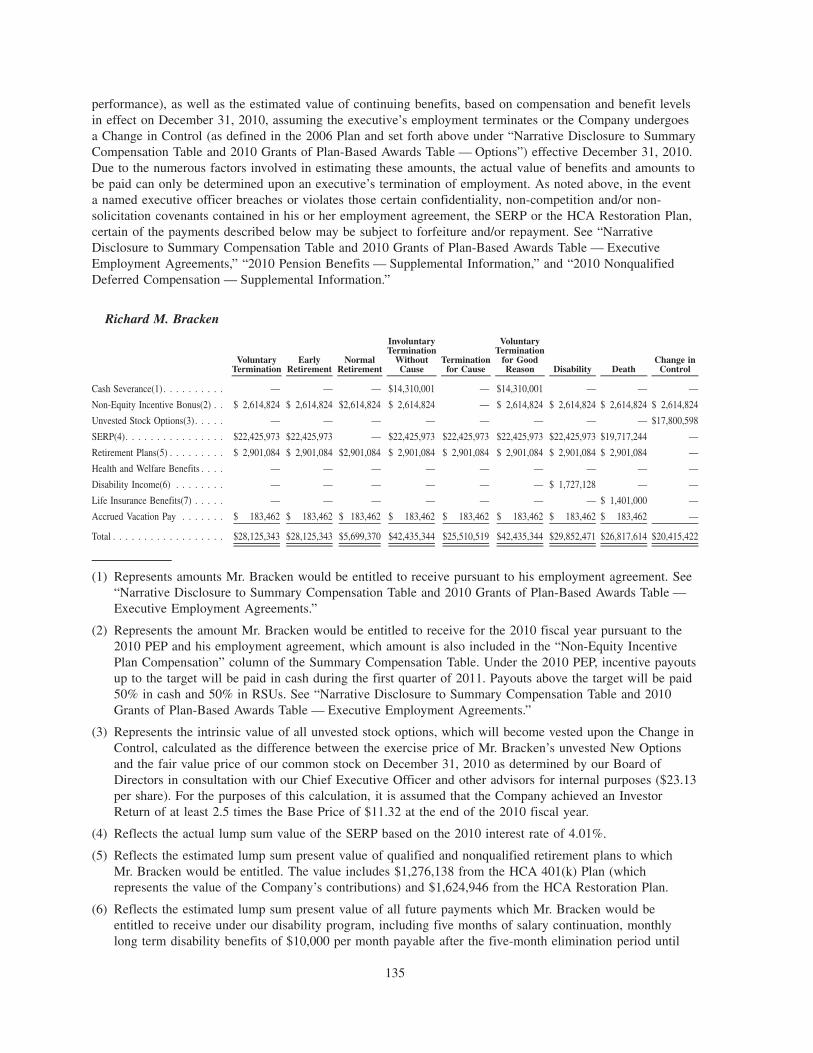
performance), as well as the estimated value of continuing benefits, based on compensation and benefit levelsin effect on December 31, 2010, assuming the executive’s employment terminates or the Company undergoesa Change in Control (as defined in the 2006 Plan and set forth above under “Narrative Disclosure to SummaryCompensation Table and 2010 Grants of Plan-Based Awards Table — Options”) effective December 31, 2010.Due to the numerous factors involved in estimating these amounts, the actual value of benefits and amounts tobe paid can only be determined upon an executive’s termination of employment. As noted above, in the eventa named executive officer breaches or violates those certain confidentiality, non-competition and/or non-solicitation covenants contained in his or her employment agreement, the SERP or the HCA Restoration Plan,certain of the payments described below may be subject to forfeiture and/or repayment. See “NarrativeDisclosure to Summary Compensation Table and 2010 Grants of Plan-Based Awards Table — ExecutiveEmployment Agreements,” “2010 Pension Benefits — Supplemental Information,” and “2010 NonqualifiedDeferred Compensation — Supplemental Information.”
Richard M. Bracken
VoluntaryTermination
EarlyRetirement
NormalRetirement
InvoluntaryTermination
WithoutCause
Terminationfor Cause
VoluntaryTermination
for GoodReason Disability Death
Change inControl
Cash Severance(1) . . . . . . . . . . — — — $14,310,001 — $14,310,001 — — —
Non-Equity Incentive Bonus(2) . . $ 2,614,824 $ 2,614,824 $2,614,824 $ 2,614,824 — $ 2,614,824 $ 2,614,824 $ 2,614,824 $ 2,614,824
Unvested Stock Options(3) . . . . . — — — — — — — — $17,800,598
SERP(4). . . . . . . . . . . . . . . . $22,425,973 $22,425,973 — $22,425,973 $22,425,973 $22,425,973 $22,425,973 $19,717,244 —
Retirement Plans(5) . . . . . . . . . $ 2,901,084 $ 2,901,084 $2,901,084 $ 2,901,084 $ 2,901,084 $ 2,901,084 $ 2,901,084 $ 2,901,084 —
Health and Welfare Benefits . . . . — — — — — — — — —
Disability Income(6) . . . . . . . . — — — — — — $ 1,727,128 — —
Life Insurance Benefits(7) . . . . . — — — — — — — $ 1,401,000 —
Accrued Vacation Pay . . . . . . . $ 183,462 $ 183,462 $ 183,462 $ 183,462 $ 183,462 $ 183,462 $ 183,462 $ 183,462 —
Total . . . . . . . . . . . . . . . . . . $28,125,343 $28,125,343 $5,699,370 $42,435,344 $25,510,519 $42,435,344 $29,852,471 $26,817,614 $20,415,422
(1) Represents amounts Mr. Bracken would be entitled to receive pursuant to his employment agreement. See“Narrative Disclosure to Summary Compensation Table and 2010 Grants of Plan-Based Awards Table —Executive Employment Agreements.”
(2) Represents the amount Mr. Bracken would be entitled to receive for the 2010 fiscal year pursuant to the2010 PEP and his employment agreement, which amount is also included in the “Non-Equity IncentivePlan Compensation” column of the Summary Compensation Table. Under the 2010 PEP, incentive payoutsup to the target will be paid in cash during the first quarter of 2011. Payouts above the target will be paid50% in cash and 50% in RSUs. See “Narrative Disclosure to Summary Compensation Table and 2010Grants of Plan-Based Awards Table — Executive Employment Agreements.”
(3) Represents the intrinsic value of all unvested stock options, which will become vested upon the Change inControl, calculated as the difference between the exercise price of Mr. Bracken’s unvested New Optionsand the fair value price of our common stock on December 31, 2010 as determined by our Board ofDirectors in consultation with our Chief Executive Officer and other advisors for internal purposes ($23.13per share). For the purposes of this calculation, it is assumed that the Company achieved an InvestorReturn of at least 2.5 times the Base Price of $11.32 at the end of the 2010 fiscal year.
(4) Reflects the actual lump sum value of the SERP based on the 2010 interest rate of 4.01%.
(5) Reflects the estimated lump sum present value of qualified and nonqualified retirement plans to whichMr. Bracken would be entitled. The value includes $1,276,138 from the HCA 401(k) Plan (whichrepresents the value of the Company’s contributions) and $1,624,946 from the HCA Restoration Plan.
(6) Reflects the estimated lump sum present value of all future payments which Mr. Bracken would beentitled to receive under our disability program, including five months of salary continuation, monthlylong term disability benefits of $10,000 per month payable after the five-month elimination period until
135
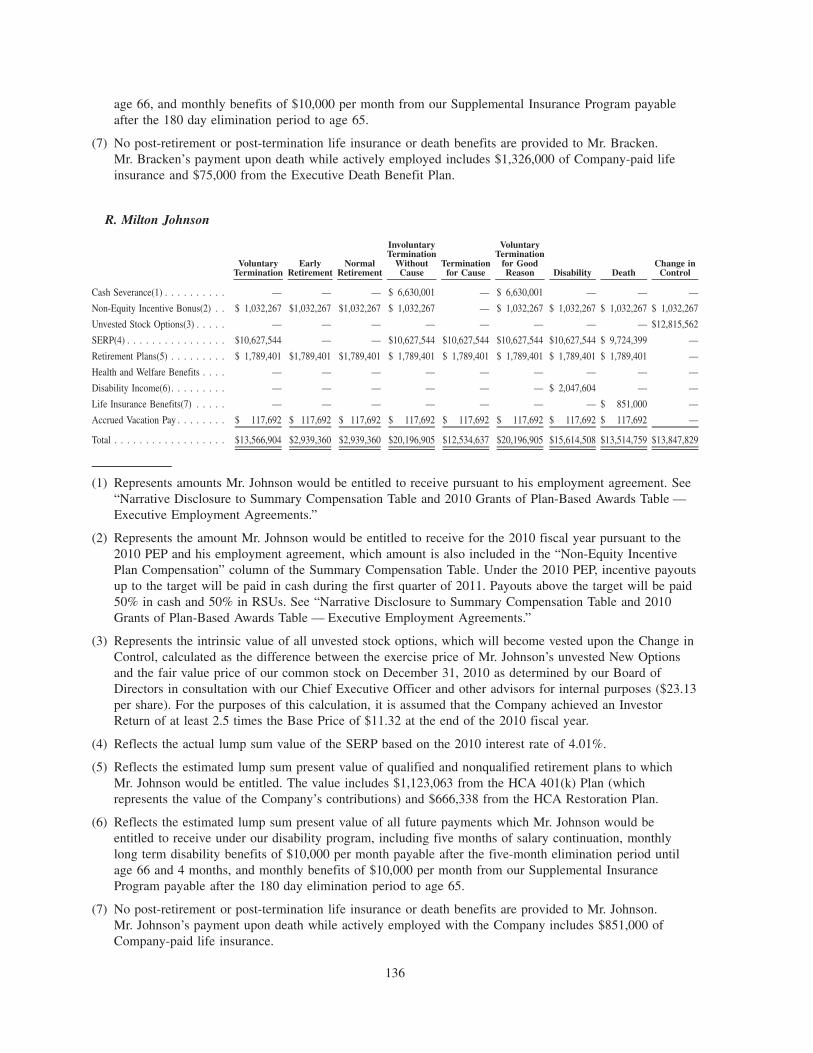
age 66, and monthly benefits of $10,000 per month from our Supplemental Insurance Program payableafter the 180 day elimination period to age 65.
(7) No post-retirement or post-termination life insurance or death benefits are provided to Mr. Bracken.Mr. Bracken’s payment upon death while actively employed includes $1,326,000 of Company-paid lifeinsurance and $75,000 from the Executive Death Benefit Plan.
R. Milton Johnson
VoluntaryTermination
EarlyRetirement
NormalRetirement
InvoluntaryTermination
WithoutCause
Terminationfor Cause
VoluntaryTermination
for GoodReason Disability Death
Change inControl
Cash Severance(1) . . . . . . . . . . — — — $ 6,630,001 — $ 6,630,001 — — —
Non-Equity Incentive Bonus(2) . . $ 1,032,267 $1,032,267 $1,032,267 $ 1,032,267 — $ 1,032,267 $ 1,032,267 $ 1,032,267 $ 1,032,267
Unvested Stock Options(3) . . . . . — — — — — — — — $12,815,562
SERP(4) . . . . . . . . . . . . . . . . $10,627,544 — — $10,627,544 $10,627,544 $10,627,544 $10,627,544 $ 9,724,399 —
Retirement Plans(5) . . . . . . . . . $ 1,789,401 $1,789,401 $1,789,401 $ 1,789,401 $ 1,789,401 $ 1,789,401 $ 1,789,401 $ 1,789,401 —
Health and Welfare Benefits . . . . — — — — — — — — —
Disability Income(6). . . . . . . . . — — — — — — $ 2,047,604 — —
Life Insurance Benefits(7) . . . . . — — — — — — — $ 851,000 —
Accrued Vacation Pay . . . . . . . . $ 117,692 $ 117,692 $ 117,692 $ 117,692 $ 117,692 $ 117,692 $ 117,692 $ 117,692 —
Total . . . . . . . . . . . . . . . . . . $13,566,904 $2,939,360 $2,939,360 $20,196,905 $12,534,637 $20,196,905 $15,614,508 $13,514,759 $13,847,829
(1) Represents amounts Mr. Johnson would be entitled to receive pursuant to his employment agreement. See“Narrative Disclosure to Summary Compensation Table and 2010 Grants of Plan-Based Awards Table —Executive Employment Agreements.”
(2) Represents the amount Mr. Johnson would be entitled to receive for the 2010 fiscal year pursuant to the2010 PEP and his employment agreement, which amount is also included in the “Non-Equity IncentivePlan Compensation” column of the Summary Compensation Table. Under the 2010 PEP, incentive payoutsup to the target will be paid in cash during the first quarter of 2011. Payouts above the target will be paid50% in cash and 50% in RSUs. See “Narrative Disclosure to Summary Compensation Table and 2010Grants of Plan-Based Awards Table — Executive Employment Agreements.”
(3) Represents the intrinsic value of all unvested stock options, which will become vested upon the Change inControl, calculated as the difference between the exercise price of Mr. Johnson’s unvested New Optionsand the fair value price of our common stock on December 31, 2010 as determined by our Board ofDirectors in consultation with our Chief Executive Officer and other advisors for internal purposes ($23.13per share). For the purposes of this calculation, it is assumed that the Company achieved an InvestorReturn of at least 2.5 times the Base Price of $11.32 at the end of the 2010 fiscal year.
(4) Reflects the actual lump sum value of the SERP based on the 2010 interest rate of 4.01%.
(5) Reflects the estimated lump sum present value of qualified and nonqualified retirement plans to whichMr. Johnson would be entitled. The value includes $1,123,063 from the HCA 401(k) Plan (whichrepresents the value of the Company’s contributions) and $666,338 from the HCA Restoration Plan.
(6) Reflects the estimated lump sum present value of all future payments which Mr. Johnson would beentitled to receive under our disability program, including five months of salary continuation, monthlylong term disability benefits of $10,000 per month payable after the five-month elimination period untilage 66 and 4 months, and monthly benefits of $10,000 per month from our Supplemental InsuranceProgram payable after the 180 day elimination period to age 65.
(7) No post-retirement or post-termination life insurance or death benefits are provided to Mr. Johnson.Mr. Johnson’s payment upon death while actively employed with the Company includes $851,000 ofCompany-paid life insurance.
136
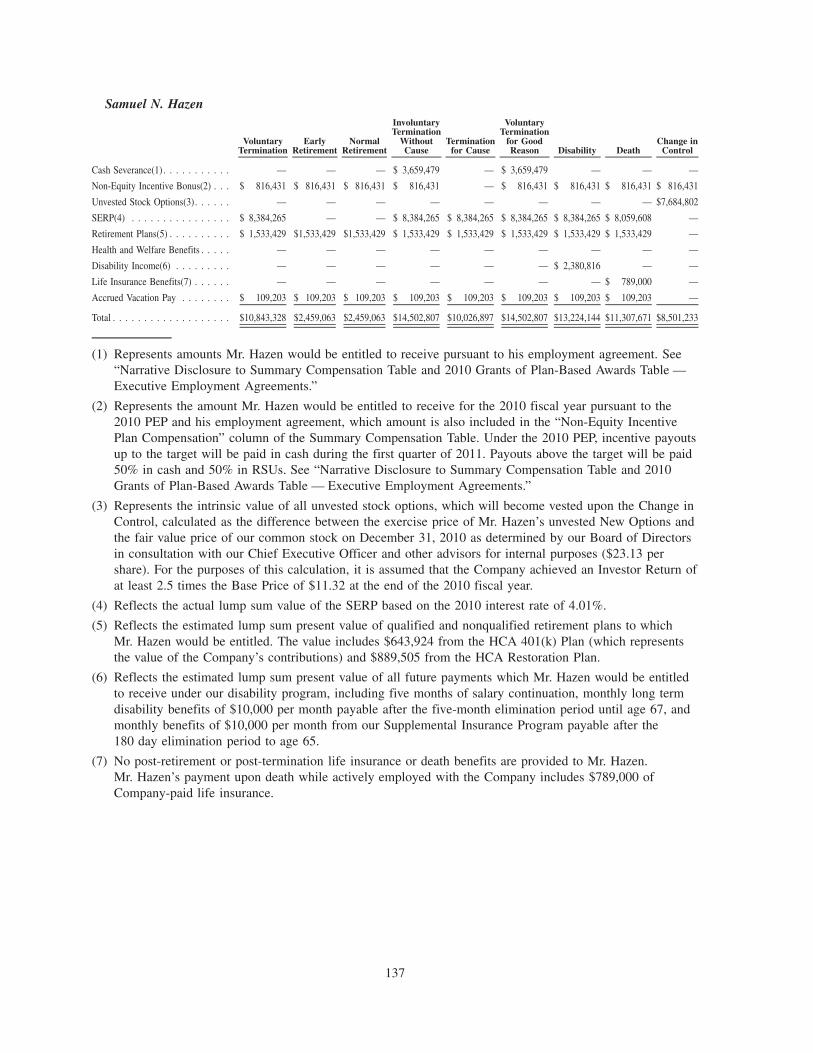
Samuel N. Hazen
VoluntaryTermination
EarlyRetirement
NormalRetirement
InvoluntaryTermination
WithoutCause
Terminationfor Cause
VoluntaryTermination
for GoodReason Disability Death
Change inControl
Cash Severance(1) . . . . . . . . . . . — — — $ 3,659,479 — $ 3,659,479 — — —
Non-Equity Incentive Bonus(2) . . . $ 816,431 $ 816,431 $ 816,431 $ 816,431 — $ 816,431 $ 816,431 $ 816,431 $ 816,431
Unvested Stock Options(3). . . . . . — — — — — — — — $7,684,802
SERP(4) . . . . . . . . . . . . . . . . $ 8,384,265 — — $ 8,384,265 $ 8,384,265 $ 8,384,265 $ 8,384,265 $ 8,059,608 —
Retirement Plans(5) . . . . . . . . . . $ 1,533,429 $1,533,429 $1,533,429 $ 1,533,429 $ 1,533,429 $ 1,533,429 $ 1,533,429 $ 1,533,429 —
Health and Welfare Benefits . . . . . — — — — — — — — —
Disability Income(6) . . . . . . . . . — — — — — — $ 2,380,816 — —
Life Insurance Benefits(7) . . . . . . — — — — — — — $ 789,000 —
Accrued Vacation Pay . . . . . . . . $ 109,203 $ 109,203 $ 109,203 $ 109,203 $ 109,203 $ 109,203 $ 109,203 $ 109,203 —
Total . . . . . . . . . . . . . . . . . . . $10,843,328 $2,459,063 $2,459,063 $14,502,807 $10,026,897 $14,502,807 $13,224,144 $11,307,671 $8,501,233
(1) Represents amounts Mr. Hazen would be entitled to receive pursuant to his employment agreement. See“Narrative Disclosure to Summary Compensation Table and 2010 Grants of Plan-Based Awards Table —Executive Employment Agreements.”
(2) Represents the amount Mr. Hazen would be entitled to receive for the 2010 fiscal year pursuant to the2010 PEP and his employment agreement, which amount is also included in the “Non-Equity IncentivePlan Compensation” column of the Summary Compensation Table. Under the 2010 PEP, incentive payoutsup to the target will be paid in cash during the first quarter of 2011. Payouts above the target will be paid50% in cash and 50% in RSUs. See “Narrative Disclosure to Summary Compensation Table and 2010Grants of Plan-Based Awards Table — Executive Employment Agreements.”
(3) Represents the intrinsic value of all unvested stock options, which will become vested upon the Change inControl, calculated as the difference between the exercise price of Mr. Hazen’s unvested New Options andthe fair value price of our common stock on December 31, 2010 as determined by our Board of Directorsin consultation with our Chief Executive Officer and other advisors for internal purposes ($23.13 pershare). For the purposes of this calculation, it is assumed that the Company achieved an Investor Return ofat least 2.5 times the Base Price of $11.32 at the end of the 2010 fiscal year.
(4) Reflects the actual lump sum value of the SERP based on the 2010 interest rate of 4.01%.
(5) Reflects the estimated lump sum present value of qualified and nonqualified retirement plans to whichMr. Hazen would be entitled. The value includes $643,924 from the HCA 401(k) Plan (which representsthe value of the Company’s contributions) and $889,505 from the HCA Restoration Plan.
(6) Reflects the estimated lump sum present value of all future payments which Mr. Hazen would be entitledto receive under our disability program, including five months of salary continuation, monthly long termdisability benefits of $10,000 per month payable after the five-month elimination period until age 67, andmonthly benefits of $10,000 per month from our Supplemental Insurance Program payable after the180 day elimination period to age 65.
(7) No post-retirement or post-termination life insurance or death benefits are provided to Mr. Hazen.Mr. Hazen’s payment upon death while actively employed with the Company includes $789,000 ofCompany-paid life insurance.
137
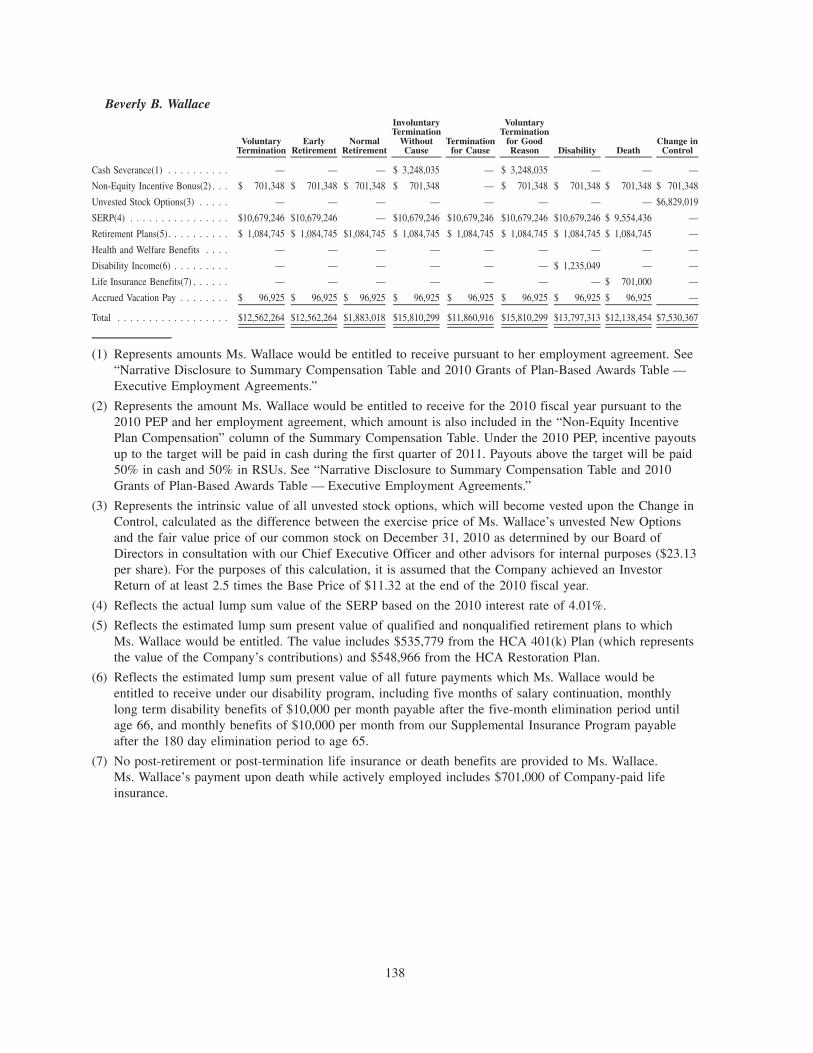
Beverly B. Wallace
VoluntaryTermination
EarlyRetirement
NormalRetirement
InvoluntaryTermination
WithoutCause
Terminationfor Cause
VoluntaryTermination
for GoodReason Disability Death
Change inControl
Cash Severance(1) . . . . . . . . . . — — — $ 3,248,035 — $ 3,248,035 — — —
Non-Equity Incentive Bonus(2) . . . $ 701,348 $ 701,348 $ 701,348 $ 701,348 — $ 701,348 $ 701,348 $ 701,348 $ 701,348
Unvested Stock Options(3) . . . . . — — — — — — — — $6,829,019
SERP(4) . . . . . . . . . . . . . . . . $10,679,246 $10,679,246 — $10,679,246 $10,679,246 $10,679,246 $10,679,246 $ 9,554,436 —
Retirement Plans(5). . . . . . . . . . $ 1,084,745 $ 1,084,745 $1,084,745 $ 1,084,745 $ 1,084,745 $ 1,084,745 $ 1,084,745 $ 1,084,745 —
Health and Welfare Benefits . . . . — — — — — — — — —
Disability Income(6) . . . . . . . . . — — — — — — $ 1,235,049 — —
Life Insurance Benefits(7) . . . . . . — — — — — — — $ 701,000 —
Accrued Vacation Pay . . . . . . . . $ 96,925 $ 96,925 $ 96,925 $ 96,925 $ 96,925 $ 96,925 $ 96,925 $ 96,925 —
Total . . . . . . . . . . . . . . . . . . $12,562,264 $12,562,264 $1,883,018 $15,810,299 $11,860,916 $15,810,299 $13,797,313 $12,138,454 $7,530,367
(1) Represents amounts Ms. Wallace would be entitled to receive pursuant to her employment agreement. See“Narrative Disclosure to Summary Compensation Table and 2010 Grants of Plan-Based Awards Table —Executive Employment Agreements.”
(2) Represents the amount Ms. Wallace would be entitled to receive for the 2010 fiscal year pursuant to the2010 PEP and her employment agreement, which amount is also included in the “Non-Equity IncentivePlan Compensation” column of the Summary Compensation Table. Under the 2010 PEP, incentive payoutsup to the target will be paid in cash during the first quarter of 2011. Payouts above the target will be paid50% in cash and 50% in RSUs. See “Narrative Disclosure to Summary Compensation Table and 2010Grants of Plan-Based Awards Table — Executive Employment Agreements.”
(3) Represents the intrinsic value of all unvested stock options, which will become vested upon the Change inControl, calculated as the difference between the exercise price of Ms. Wallace’s unvested New Optionsand the fair value price of our common stock on December 31, 2010 as determined by our Board ofDirectors in consultation with our Chief Executive Officer and other advisors for internal purposes ($23.13per share). For the purposes of this calculation, it is assumed that the Company achieved an InvestorReturn of at least 2.5 times the Base Price of $11.32 at the end of the 2010 fiscal year.
(4) Reflects the actual lump sum value of the SERP based on the 2010 interest rate of 4.01%.
(5) Reflects the estimated lump sum present value of qualified and nonqualified retirement plans to whichMs. Wallace would be entitled. The value includes $535,779 from the HCA 401(k) Plan (which representsthe value of the Company’s contributions) and $548,966 from the HCA Restoration Plan.
(6) Reflects the estimated lump sum present value of all future payments which Ms. Wallace would beentitled to receive under our disability program, including five months of salary continuation, monthlylong term disability benefits of $10,000 per month payable after the five-month elimination period untilage 66, and monthly benefits of $10,000 per month from our Supplemental Insurance Program payableafter the 180 day elimination period to age 65.
(7) No post-retirement or post-termination life insurance or death benefits are provided to Ms. Wallace.Ms. Wallace’s payment upon death while actively employed includes $701,000 of Company-paid lifeinsurance.
138
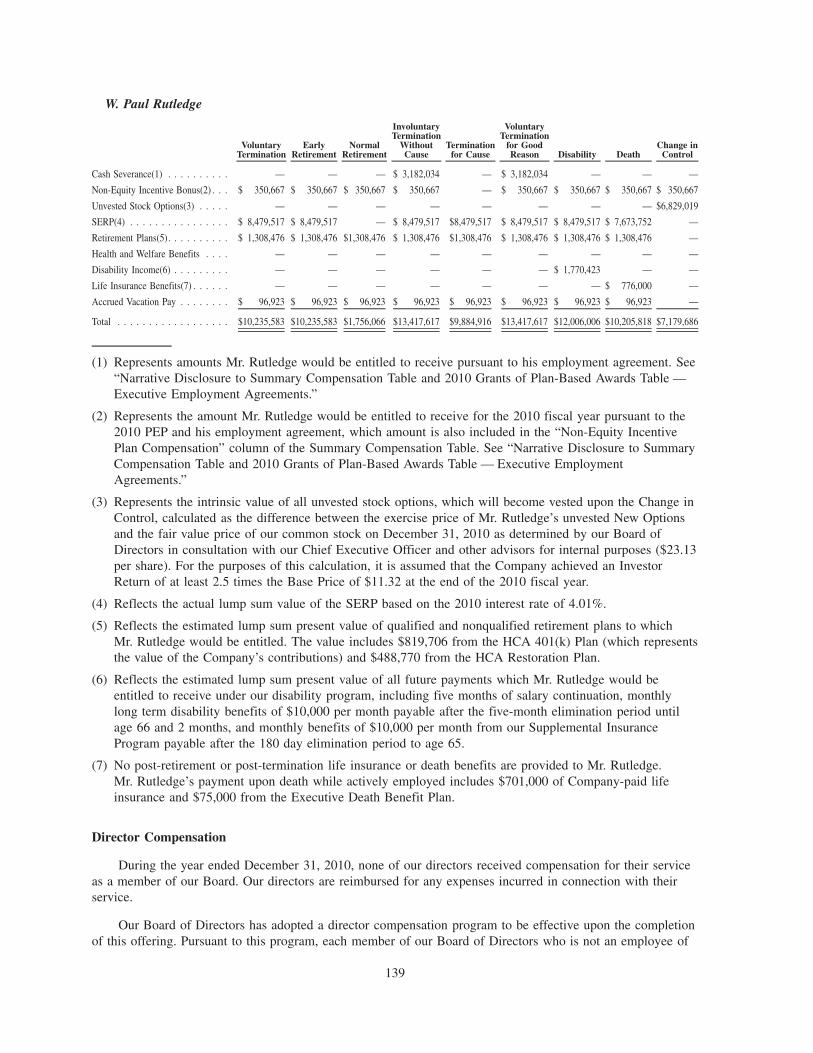
W. Paul Rutledge
VoluntaryTermination
EarlyRetirement
NormalRetirement
InvoluntaryTermination
WithoutCause
Terminationfor Cause
VoluntaryTermination
for GoodReason Disability Death
Change inControl
Cash Severance(1) . . . . . . . . . . — — — $ 3,182,034 — $ 3,182,034 — — —
Non-Equity Incentive Bonus(2) . . . $ 350,667 $ 350,667 $ 350,667 $ 350,667 — $ 350,667 $ 350,667 $ 350,667 $ 350,667
Unvested Stock Options(3) . . . . . — — — — — — — — $6,829,019
SERP(4) . . . . . . . . . . . . . . . . $ 8,479,517 $ 8,479,517 — $ 8,479,517 $8,479,517 $ 8,479,517 $ 8,479,517 $ 7,673,752 —
Retirement Plans(5). . . . . . . . . . $ 1,308,476 $ 1,308,476 $1,308,476 $ 1,308,476 $1,308,476 $ 1,308,476 $ 1,308,476 $ 1,308,476 —
Health and Welfare Benefits . . . . — — — — — — — — —
Disability Income(6) . . . . . . . . . — — — — — — $ 1,770,423 — —
Life Insurance Benefits(7) . . . . . . — — — — — — — $ 776,000 —
Accrued Vacation Pay . . . . . . . . $ 96,923 $ 96,923 $ 96,923 $ 96,923 $ 96,923 $ 96,923 $ 96,923 $ 96,923 —
Total . . . . . . . . . . . . . . . . . . $10,235,583 $10,235,583 $1,756,066 $13,417,617 $9,884,916 $13,417,617 $12,006,006 $10,205,818 $7,179,686
(1) Represents amounts Mr. Rutledge would be entitled to receive pursuant to his employment agreement. See“Narrative Disclosure to Summary Compensation Table and 2010 Grants of Plan-Based Awards Table —Executive Employment Agreements.”
(2) Represents the amount Mr. Rutledge would be entitled to receive for the 2010 fiscal year pursuant to the2010 PEP and his employment agreement, which amount is also included in the “Non-Equity IncentivePlan Compensation” column of the Summary Compensation Table. See “Narrative Disclosure to SummaryCompensation Table and 2010 Grants of Plan-Based Awards Table — Executive EmploymentAgreements.”
(3) Represents the intrinsic value of all unvested stock options, which will become vested upon the Change inControl, calculated as the difference between the exercise price of Mr. Rutledge’s unvested New Optionsand the fair value price of our common stock on December 31, 2010 as determined by our Board ofDirectors in consultation with our Chief Executive Officer and other advisors for internal purposes ($23.13per share). For the purposes of this calculation, it is assumed that the Company achieved an InvestorReturn of at least 2.5 times the Base Price of $11.32 at the end of the 2010 fiscal year.
(4) Reflects the actual lump sum value of the SERP based on the 2010 interest rate of 4.01%.
(5) Reflects the estimated lump sum present value of qualified and nonqualified retirement plans to whichMr. Rutledge would be entitled. The value includes $819,706 from the HCA 401(k) Plan (which representsthe value of the Company’s contributions) and $488,770 from the HCA Restoration Plan.
(6) Reflects the estimated lump sum present value of all future payments which Mr. Rutledge would beentitled to receive under our disability program, including five months of salary continuation, monthlylong term disability benefits of $10,000 per month payable after the five-month elimination period untilage 66 and 2 months, and monthly benefits of $10,000 per month from our Supplemental InsuranceProgram payable after the 180 day elimination period to age 65.
(7) No post-retirement or post-termination life insurance or death benefits are provided to Mr. Rutledge.Mr. Rutledge’s payment upon death while actively employed includes $701,000 of Company-paid lifeinsurance and $75,000 from the Executive Death Benefit Plan.
Director Compensation
During the year ended December 31, 2010, none of our directors received compensation for their serviceas a member of our Board. Our directors are reimbursed for any expenses incurred in connection with theirservice.
Our Board of Directors has adopted a director compensation program to be effective upon the completionof this offering. Pursuant to this program, each member of our Board of Directors who is not an employee of
139
the Company will receive quarterly payment of the following cash compensation, as applicable, for Boardservices:
• $100,000 annual retainer for service as a Board member (prorated for partial years);
• $15,000 annual retainer for service as a member of the Audit and Compliance Committee;
• $10,000 annual retainer for service as a member on each of the Compensation Committee, Nominatingand Corporate Governance Committee or Patient Safety and Quality of Care Committee;
• $20,000 annual retainer for service as Chairman of the Audit and Compliance Committee; and
• $12,500 annual retainer for service as Chairman on each of the Compensation Committee, Nominatingand Corporate Governance Committee or Patient Safety and Quality of Care Committee.
We expect that we will continue to reimburse our directors for their reasonable expenses incurred in theirservice as Board members.
In addition to the director compensation described above, we anticipate that each non-employee director,upon joining the Board of Directors, will receive a one-time initial equity award with a value of $150,000.These equity grants will consist of restricted stock units (“RSUs”) ultimately payable in shares of our commonstock. These RSUs will vest as to 100% of the award on the third anniversary of the grant date, subject to thedirector’s continued service on our Board of Directors. Each non-employee director will also receive an annualboard equity award with a value of $125,000, awarded upon joining the Board of Directors (prorated at thetime of hire for months of service) and at each annual meeting of the stockholders thereafter. These RSUs willvest as to 100% of the award on the subsequent annual meeting of the stockholders after each award wasgranted, each subject to the director’s continued service on our Board of Directors. We also anticipateallowing our directors to elect to defer receipt of shares under the RSUs.
Each non-employee director is expected to directly or indirectly acquire a number of shares of ourcommon stock with a value of three times the value of the annual cash retainer for a director’s service on theBoard of Directors within three years from the later of the Company’s listing on the NYSE or the date onwhich they are elected to the Board of Directors.
Compensation Committee Interlocks and Insider Participation
During 2010, the Compensation Committee of the Board of Directors was composed of John P.Connaughton, James D. Forbes and Michael W. Michelson. None of the members of the CompensationCommittee have at any time been an officer or employee of HCA or any of its subsidiaries. In addition, noneof our executive officers serves as a member of the board of directors or compensation committee of anyentity which has one or more executive officers serving as a member of our Board of Directors orCompensation Committee. Each member of the Compensation Committee is also a manager of HerculesHolding, and the Amended and Restated Limited Liability Company Agreement of Hercules Holding requiresthat the members of Hercules Holding take all necessary action to ensure that the persons who serve asmanagers of Hercules Holding also serve on our Board of Directors. Messrs. Michelson, Forbes andConnaughton are affiliated with KKR, BAML Capital Partners (the private equity division of Bank of AmericaCorporation) and Bain Capital Partners, LLC respectively, each of which is a party to the sponsor managementagreement with us. The Amended and Restated Limited Liability Company Agreement of Hercules Holding,the sponsor management agreement and certain transactions with affiliates of BAML Capital Partners andKKR are described in greater detail in “Certain Relationships and Related Party Transactions.”
140
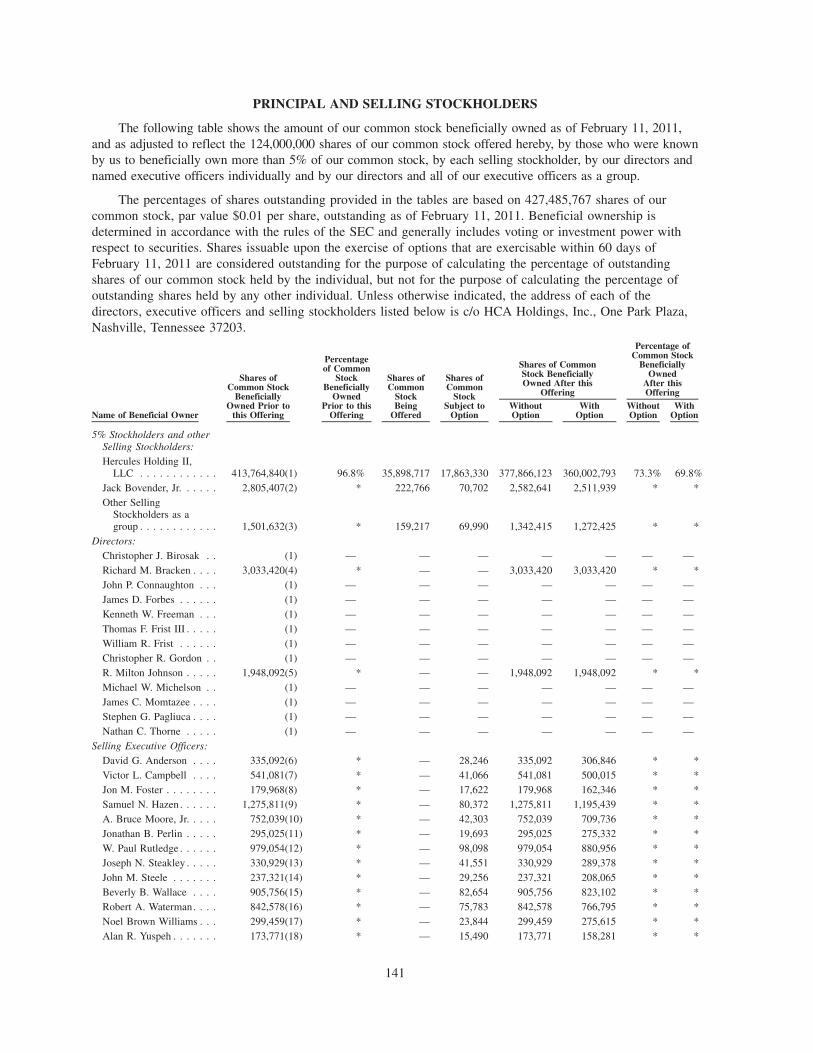
PRINCIPAL AND SELLING STOCKHOLDERS
The following table shows the amount of our common stock beneficially owned as of February 11, 2011,and as adjusted to reflect the 124,000,000 shares of our common stock offered hereby, by those who were knownby us to beneficially own more than 5% of our common stock, by each selling stockholder, by our directors andnamed executive officers individually and by our directors and all of our executive officers as a group.
The percentages of shares outstanding provided in the tables are based on 427,485,767 shares of ourcommon stock, par value $0.01 per share, outstanding as of February 11, 2011. Beneficial ownership isdetermined in accordance with the rules of the SEC and generally includes voting or investment power withrespect to securities. Shares issuable upon the exercise of options that are exercisable within 60 days ofFebruary 11, 2011 are considered outstanding for the purpose of calculating the percentage of outstandingshares of our common stock held by the individual, but not for the purpose of calculating the percentage ofoutstanding shares held by any other individual. Unless otherwise indicated, the address of each of thedirectors, executive officers and selling stockholders listed below is c/o HCA Holdings, Inc., One Park Plaza,Nashville, Tennessee 37203.
Name of Beneficial Owner
Shares ofCommon Stock
BeneficiallyOwned Prior to
this Offering
Percentageof Common
StockBeneficially
OwnedPrior to this
Offering
Shares ofCommon
StockBeing
Offered
Shares ofCommon
StockSubject to
OptionWithoutOption
WithOption
WithoutOption
WithOption
Shares of CommonStock BeneficiallyOwned After this
Offering
Percentage ofCommon Stock
BeneficiallyOwned
After thisOffering
5% Stockholders and otherSelling Stockholders:Hercules Holding II,
LLC . . . . . . . . . . . . 413,764,840(1) 96.8% 35,898,717 17,863,330 377,866,123 360,002,793 73.3% 69.8%Jack Bovender, Jr. . . . . . 2,805,407(2) * 222,766 70,702 2,582,641 2,511,939 * *Other Selling
Stockholders as agroup . . . . . . . . . . . . 1,501,632(3) * 159,217 69,990 1,342,415 1,272,425 * *
Directors:Christopher J. Birosak . . (1) — — — — — — —Richard M. Bracken . . . . 3,033,420(4) * — — 3,033,420 3,033,420 * *John P. Connaughton . . . (1) — — — — — — —James D. Forbes . . . . . . (1) — — — — — — —Kenneth W. Freeman . . . (1) — — — — — — —Thomas F. Frist III . . . . . (1) — — — — — — —William R. Frist . . . . . . (1) — — — — — — —Christopher R. Gordon . . (1) — — — — — — —R. Milton Johnson . . . . . 1,948,092(5) * — — 1,948,092 1,948,092 * *Michael W. Michelson . . (1) — — — — — — —James C. Momtazee . . . . (1) — — — — — — —Stephen G. Pagliuca . . . . (1) — — — — — — —Nathan C. Thorne . . . . . (1) — — — — — — —
Selling Executive Officers:David G. Anderson . . . . 335,092(6) * — 28,246 335,092 306,846 * *Victor L. Campbell . . . . 541,081(7) * — 41,066 541,081 500,015 * *Jon M. Foster . . . . . . . . 179,968(8) * — 17,622 179,968 162,346 * *Samuel N. Hazen . . . . . . 1,275,811(9) * — 80,372 1,275,811 1,195,439 * *A. Bruce Moore, Jr. . . . . 752,039(10) * — 42,303 752,039 709,736 * *Jonathan B. Perlin . . . . . 295,025(11) * — 19,693 295,025 275,332 * *W. Paul Rutledge . . . . . . 979,054(12) * — 98,098 979,054 880,956 * *Joseph N. Steakley . . . . . 330,929(13) * — 41,551 330,929 289,378 * *John M. Steele . . . . . . . 237,321(14) * — 29,256 237,321 208,065 * *Beverly B. Wallace . . . . 905,756(15) * — 82,654 905,756 823,102 * *Robert A. Waterman. . . . 842,578(16) * — 75,783 842,578 766,795 * *Noel Brown Williams . . . 299,459(17) * — 23,844 299,459 275,615 * *Alan R. Yuspeh . . . . . . . 173,771(18) * — 15,490 173,771 158,281 * *
141
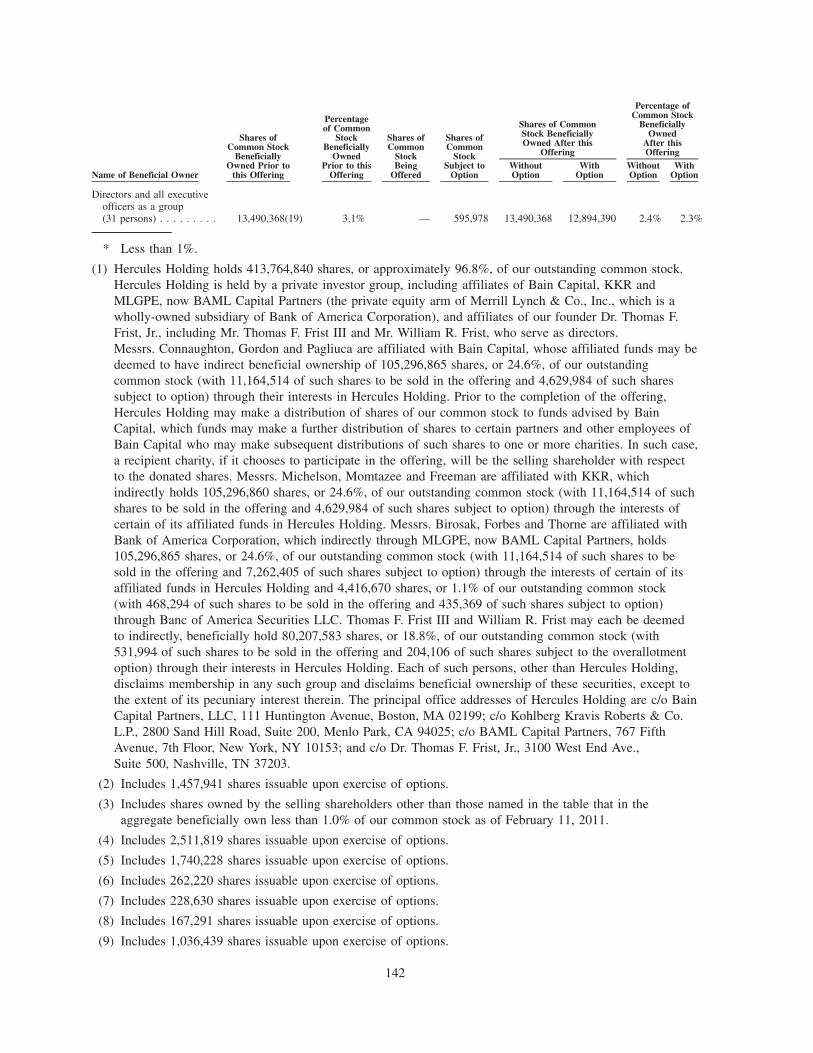
Name of Beneficial Owner
Shares ofCommon Stock
BeneficiallyOwned Prior to
this Offering
Percentageof Common
StockBeneficially
OwnedPrior to this
Offering
Shares ofCommon
StockBeing
Offered
Shares ofCommon
StockSubject to
OptionWithoutOption
WithOption
WithoutOption
WithOption
Shares of CommonStock BeneficiallyOwned After this
Offering
Percentage ofCommon Stock
BeneficiallyOwned
After thisOffering
Directors and all executiveofficers as a group(31 persons) . . . . . . . . . 13,490,368(19) 3.1% — 595,978 13,490,368 12,894,390 2.4% 2.3%
* Less than 1%.
(1) Hercules Holding holds 413,764,840 shares, or approximately 96.8%, of our outstanding common stock.Hercules Holding is held by a private investor group, including affiliates of Bain Capital, KKR andMLGPE, now BAML Capital Partners (the private equity arm of Merrill Lynch & Co., Inc., which is awholly-owned subsidiary of Bank of America Corporation), and affiliates of our founder Dr. Thomas F.Frist, Jr., including Mr. Thomas F. Frist III and Mr. William R. Frist, who serve as directors.Messrs. Connaughton, Gordon and Pagliuca are affiliated with Bain Capital, whose affiliated funds may bedeemed to have indirect beneficial ownership of 105,296,865 shares, or 24.6%, of our outstandingcommon stock (with 11,164,514 of such shares to be sold in the offering and 4,629,984 of such sharessubject to option) through their interests in Hercules Holding. Prior to the completion of the offering,Hercules Holding may make a distribution of shares of our common stock to funds advised by BainCapital, which funds may make a further distribution of shares to certain partners and other employees ofBain Capital who may make subsequent distributions of such shares to one or more charities. In such case,a recipient charity, if it chooses to participate in the offering, will be the selling shareholder with respectto the donated shares. Messrs. Michelson, Momtazee and Freeman are affiliated with KKR, whichindirectly holds 105,296,860 shares, or 24.6%, of our outstanding common stock (with 11,164,514 of suchshares to be sold in the offering and 4,629,984 of such shares subject to option) through the interests ofcertain of its affiliated funds in Hercules Holding. Messrs. Birosak, Forbes and Thorne are affiliated withBank of America Corporation, which indirectly through MLGPE, now BAML Capital Partners, holds105,296,865 shares, or 24.6%, of our outstanding common stock (with 11,164,514 of such shares to besold in the offering and 7,262,405 of such shares subject to option) through the interests of certain of itsaffiliated funds in Hercules Holding and 4,416,670 shares, or 1.1% of our outstanding common stock(with 468,294 of such shares to be sold in the offering and 435,369 of such shares subject to option)through Banc of America Securities LLC. Thomas F. Frist III and William R. Frist may each be deemedto indirectly, beneficially hold 80,207,583 shares, or 18.8%, of our outstanding common stock (with531,994 of such shares to be sold in the offering and 204,106 of such shares subject to the overallotmentoption) through their interests in Hercules Holding. Each of such persons, other than Hercules Holding,disclaims membership in any such group and disclaims beneficial ownership of these securities, except tothe extent of its pecuniary interest therein. The principal office addresses of Hercules Holding are c/o BainCapital Partners, LLC, 111 Huntington Avenue, Boston, MA 02199; c/o Kohlberg Kravis Roberts & Co.L.P., 2800 Sand Hill Road, Suite 200, Menlo Park, CA 94025; c/o BAML Capital Partners, 767 FifthAvenue, 7th Floor, New York, NY 10153; and c/o Dr. Thomas F. Frist, Jr., 3100 West End Ave.,Suite 500, Nashville, TN 37203.
(2) Includes 1,457,941 shares issuable upon exercise of options.
(3) Includes shares owned by the selling shareholders other than those named in the table that in theaggregate beneficially own less than 1.0% of our common stock as of February 11, 2011.
(4) Includes 2,511,819 shares issuable upon exercise of options.
(5) Includes 1,740,228 shares issuable upon exercise of options.
(6) Includes 262,220 shares issuable upon exercise of options.
(7) Includes 228,630 shares issuable upon exercise of options.
(8) Includes 167,291 shares issuable upon exercise of options.
(9) Includes 1,036,439 shares issuable upon exercise of options.
142

(10) Includes 639,106 shares issuable upon exercise of options.
(11) Includes 295,025 shares issuable upon exercise of options.
(12) Includes 831,516 shares issuable upon exercise of options.
(13) Includes 239,050 shares issuable upon exercise of options.
(14) Includes 195,416 shares issuable upon exercise of options.
(15) Includes 824,585 shares issuable upon exercise of options.
(16) Includes 359,260 shares issuable upon exercise of options.
(17) Includes 196,971 shares issuable upon exercise of options.
(18) Includes 173,771 shares issuable upon exercise of options.
(19) Includes 10,773,814 shares issuable upon exercise of options.
143
CERTAIN RELATIONSHIPS AND RELATED PARTY TRANSACTIONS
In accordance with its charter, our Audit and Compliance Committee reviews and approves all materialrelated party transactions. Prior to its approval of any material related party transaction, the Audit andCompliance Committee will discuss the proposed transaction with management and our independent auditor.In addition, our Code of Conduct requires that all of our employees, including our executive officers, remainfree of conflicts of interest in the performance of their responsibilities to the Company. An executive officerwho wishes to enter into a transaction in which their interests might conflict with ours must first receive theapproval of the Audit and Compliance Committee. The Amended and Restated Limited Liability CompanyAgreement of Hercules Holding generally requires that an Investor must obtain the prior written consent ofeach other Investor (other than the Sponsor Assignees) before it or any of its affiliates (including our directors)enter into any transaction with us.
Stockholder Agreements
On January 30, 2007, our Board of Directors awarded to members of management and certain keyemployees New Options to purchase shares of our common stock (the New Options together with the RolloverOptions, “Options”) pursuant to the 2006 Plan. Our Compensation Committee approved additional optionawards periodically throughout 2010, 2009, 2008 and 2007 to members of management and certain keyemployees in cases of promotions, significant contributions to the Company and new hires. In connection withtheir option awards, the participants under the 2006 Plan were required to enter into a ManagementStockholder’s Agreement, a Sale Participation Agreement, and an Option Agreement with respect to the NewOptions. In addition, in accordance with agreements entered into at the time of the Recapitalization, ournamed executive officers received the 2x Time Options. Below are brief summaries of the principal terms ofthe Management Stockholder’s Agreement and the Sale Participation Agreement, each of which are qualifiedin their entirety by reference to the agreements themselves, forms of which were filed as Exhibits 10.12 and10.13, respectively, to our annual report on Form 10-K for the fiscal year ended December 31, 2006 filed onMarch 27, 2007. The Management Stockholder’s Agreement was assumed by HCA Holdings, Inc. inconnection with the Corporate Reorganization. The terms of the Option Agreement with respect to 2x TimeOptions, New Options and the 2006 Plan, all of which were assumed by HCA Holdings, Inc. in connectionwith the Corporate Reorganization, are described in more detail in “Executive Compensation — CompensationDiscussion and Analysis — Elements of Compensation — Long-Term Equity Incentive Awards: Options.”
Management Stockholder’s Agreement
The Management Stockholder’s Agreement imposes significant restrictions on transfers of shares of ourcommon stock. Generally, shares will be nontransferable by any means at any time prior to the earlier of a“Change in Control” (as defined in the Management Stockholder’s Agreement) or the fifth anniversary of theclosing date of the Recapitalization, except (i) sales pursuant to an effective registration statement under theSecurities Act filed by the Company in accordance with the Management Stockholder’s Agreement, (ii) a salepursuant to the Sale Participation Agreement (described below), (iii) a sale to certain “Permitted Transferees”(as defined in the Management Stockholder’s Agreement), or (iv) as otherwise permitted by our Board ofDirectors or pursuant to a waiver of the restrictions on transfers given by unanimous agreement of theSponsors. On and after such fifth anniversary through the earlier of a Change in Control or the eighthanniversary of the closing date of the Recapitalization, a management stockholder will be able to transfershares of our common stock, but only to the extent that, on a cumulative basis, the management stockholdersin the aggregate do not transfer a greater percentage of their equity than the percentage of equity sold orotherwise disposed of by the Sponsors. In connection with this offering, we have agreed to waive such transferrestrictions for all employees subject to the Management Stockholder’s Agreement that were not permitted toparticipate in this offering with respect to the number of shares of our common stock equal to the number ofshares of common stock such employees could have required us to register in this offering had we elected togrant them “piggyback rights.” Effective upon the consummation of this offering, we intend to amend theManagement Stockholder’s Agreement so that shares acquired in the open market or through the directedshare program will not be subject to such transfer restrictions.
144
In the event that a management stockholder wishes to sell his or her stock at any time following the fifthanniversary of the closing date of the Recapitalization but prior to an initial public offering of our commonstock, the Management Stockholder’s Agreement provides the Company with a right of first offer on thoseshares upon the same terms and conditions pursuant to which the management stockholder would sell them toa third party. In the event that a registration statement is filed with respect to our common stock in the future,the Management Stockholder’s Agreement prohibits management stockholders from selling shares not includedin the registration statement from the time of receipt of notice until 180 days (in the case of an initial publicoffering) or 90 days (in the case of any other public offering) of the date of the registration statement. TheManagement Stockholder’s Agreement also provides for the management stockholder’s ability to cause us torepurchase their outstanding stock and options in the event of the management stockholder’s death ordisability, and for our ability to cause the management stockholder to sell their stock or options back to theCompany upon certain termination events.
The Management Stockholder’s Agreement provides that, in the event we propose to sell shares to theSponsors, certain members of senior management, including the executive officers (the “Senior ManagementStockholders”) have a preemptive right to purchase shares in the offering. The maximum shares a SeniorManagement Stockholder may purchase is a proportionate number of the shares offered to the percentage ofshares owned by the Senior Management Stockholder prior to the offering. Additionally, following the initialpublic offering of our common stock, the Senior Management Stockholders will have limited “piggyback”registration rights with respect to their shares of common stock. The maximum number of shares of CommonStock which a Senior Management Stockholder may register is generally proportionate with the percentage ofcommon stock being sold by the Sponsors (relative to their holdings thereof).
Sale Participation Agreement
The Sale Participation Agreement grants the Senior Management Stockholders the right to participate inany private direct or indirect sale of shares of common stock by the Sponsors (such right being referred toherein as the “Tag-Along Right”), and requires all management stockholders to participate in any such privatesale if so elected by the Sponsors in the event that the Sponsors are proposing to sell at least 50% of theoutstanding common stock held by the Sponsors, whether directly or through their interests in HerculesHolding (such right being referred to herein as the “Drag-Along Right”). The number of shares of commonstock which would be required to be sold by a management stockholder pursuant to the exercise of the Drag-Along Right will be the sum of the number of shares of common stock then owned by the managementstockholder and his affiliates plus all shares of common stock the management stockholder is entitled toacquire under any unexercised Options (to the extent such Options are exercisable or would becomeexercisable as a result of the consummation of the proposed sale), multiplied by a fraction (x) the numeratorof which shall be the aggregate number of shares of common stock proposed to be transferred by the Sponsorsin the proposed sale and (y) the denominator of which shall be the total number of shares of common stockowned by the Sponsors entitled to participate in the proposed sale. Management stockholders will bear theirpro rata share of any fees, commissions, adjustments to purchase price, expenses or indemnities in connectionwith any sale under the Sale Participation Agreement.
Amended and Restated Limited Liability Company Agreement of Hercules Holding II, LLC
The Investors and certain other investment funds who agreed to co-invest with them through a vehiclejointly controlled by the Investors to provide equity financing for the Recapitalization entered into a limitedliability company operating agreement in respect of Hercules Holding (the “LLC Agreement”). The LLCAgreement will be amended upon consummation of the offering and many of its operative provisions will bereplaced by the Stockholders’ Agreement described below.
A copy of the form of amended LLC Agreement that will be entered into has been filed as Exhibit 10.33to the registration statement of which this prospectus is a part.
145
Stockholders’ Agreement
Upon the consummation of this offering, we will enter into the Stockholders’ Agreement with HerculesHolding and the Investors (other than the Sponsor Assignees).
Board Composition. Upon the consummation of this offering, our Board of Directors will be comprisedof 15 members. Under the Stockholders’ Agreement, until we cease to be a “controlled company” within themeaning of the New York Stock Exchange rules, each of the Sponsors will have the right to nominate threedirectors to our Board of Directors and the Frist Entities will have the right to nominate two directors to ourboard of directors. Once we cease to be a “controlled company”, (i) each Sponsor will continue to have theright to nominate three directors to our Board of Directors; however, once a Sponsor owns less than 10% ofour outstanding shares of common stock, such Sponsor will only be entitled to nominate one director to ourBoard of Directors and a Sponsor will lose its right to nominate any directors to our Board of Directors oncesuch Sponsor owns less than 3% of our outstanding shares of common stock; and (ii) the Frist Entities willcontinue to have the right to nominate two directors to our Board of Directors; however, the Frist Entities willlose their right to nominate any directors to our Board of Directors once the Frist Entities own less than 3% ofour outstanding shares of common stock.
Board Committees. Under the Stockholders’ Agreement, until we cease to be a “controlled company”each of the Sponsors and the Frist Entities will have the right to designate one member of each committee ofour Board of Directors except to the extent that such a designee is not permitted to serve on a committeeunder applicable law, rule, regulation or listing standards. Once we cease to be a “controlled company”, theBoard of Directors will determine the composition of each committee of the board of directors.
Investor Approvals. Under the Stockholders’ Agreement, the following actions will require the requisiteapproval of the Investors (other than the Sponsor Assignees) for so long as Hercules Holding and/or theInvestors (other than the Sponsor Assignees) own at least 35% of our outstanding shares of common stock:
• any merger, consolidation, recapitalization, liquidation, or sale of us or all or substantially all of ourassets;
• initiating any liquidation, dissolution or winding up or other bankruptcy proceeding involving us or anyof our subsidiaries;
• we or any of our subsidiaries entering into any business or operations other than those businesses andoperations of a same or similar nature to those which are currently conducted by us or our subsidiaries.
For purposes of these approval rights, requisite approval means the approval of the Investors (other thanthe Sponsor Assignees) owning a majority of the shares of our common stock that are then owned by theInvestors (other than the Sponsor Assignees), including at all times for so long as there are at least twoSponsors that continue to own at least 20% of the shares of our common stock that are currently owned bysuch Sponsors, the approval of at least two Sponsors and at any time as there is only one Sponsor thatcontinues to own at least 20% of the shares of our common stock currently owned by such Sponsor, theapproval of such Sponsor.
A copy of the form of Stockholders’ Agreement that will be entered into has been filed as Exhibit 10.38to the registration statement of which this prospectus is a part.
Registration Rights Agreement
Hercules Holding and the Investors entered into a registration rights agreement with HCA Inc. uponcompletion of the Recapitalization. Pursuant to this agreement, the Investors (with certain exceptions as to theSponsor Assignees) can cause us to register shares of our common stock held by Hercules Holding under theSecurities Act and, if requested, to maintain a shelf registration statement effective with respect to such shares.The Investors are also entitled to participate on a pro rata basis in any registration of our common stock underthe Securities Act that we may undertake. In connection with the Corporate Reorganization, Hercules Holdingand the Investors entered into a registration rights agreement with HCA Holdings, Inc. that replaces and
146
supersedes the agreement with HCA Inc. but whose terms are substantively the same. A copy of thisagreement has been filed as Exhibit 4.21 to the registration statement of which this prospectus is a part.
Sponsor Management Agreement
In connection with the Recapitalization, we entered into a management agreement with affiliates of eachof the Sponsors and certain members of the Frist family, including Thomas F. Frist, Jr., M.D., Thomas F.Frist III and William R. Frist, pursuant to which such entities or their affiliates will provide managementservices to us. Pursuant to the agreement, in 2010, we paid management fees of $17.5 million and reimbursedout-of-pocket expenses incurred in connection with the provision of services pursuant to the agreement. Theagreement provides that the aggregate annual management fee, initially set at $15 million, increases annuallybeginning in 2008 at a rate equal to the percentage increase of Adjusted EBITDA (as defined in theManagement Agreement) in the applicable year compared to the preceding year. The agreement also providesthat we will pay a 1% fee in connection with certain subsequent financing, acquisition, disposition and changeof control transactions, as well as a termination fee based on the net present value of future paymentobligations under the management agreement, in the event of an initial public offering or under certain othercircumstances. No fees were paid under either of these provisions in 2010. The agreement includes customaryexculpation and indemnification provisions in favor of the Sponsors and their affiliates and the Frists. Thisagreement will be terminated pursuant to its terms upon completion of this offering, and the Sponsors andcertain members of the Frist family will be paid a final fee currently estimated at $208 million, consisting of$25 million for services performed in connection with this offering and $183 million for the remaining amountpayable under this agreement. A copy of this agreement has been filed as Exhibit 10.24 to the registrationstatement of which this prospectus is a part.
Other Relationships
In 2008, we paid approximately $25.5 million, to HCP, Inc. (NYSE: HCP), representing the aggregateannual lease payments for certain medical office buildings leased by the Company. Charles A. Elcan was anexecutive officer of HCP, Inc. until April 30, 2008 and is the son-in-law of Dr. Thomas F. Frist, Jr. (who was amember of our Board of Directors in 2008) and brother-in-law of Thomas F. Frist III and William R. Frist,who are members of our Board of Directors.
Christopher S. George serves as the chief executive officer of an HCA-affiliated hospital, and in 2009 and2008, Mr. George earned total compensation in respect of base salary and bonus of approximately $370,000and $440,000, respectively, for his services. Mr. George also received certain other benefits, including awardsof equity, customary to similar positions within the Company. Mr. George’s father, V. Carl George, was anexecutive officer of HCA until March 31, 2009.
Dustin A. Greene serves as the chief operating officer of an HCA-affiliated hospital, and in 2010,Mr. Greene earned a base salary of approximately $145,000 for his services. Mr. Greene’s bonus based upon2010 performance has not been determined at this time. In 2009 and 2008, Mr. Greene earned totalcompensation in respect of base salary and bonus of approximately $160,000 and $143,000, respectively, forhis services. Mr. Greene also received certain other benefits, including awards of equity, customary to similarpositions within the Company. Mr. Greene’s father-in-law, W. Paul Rutledge, is an executive officer of HCA.
Bank of America, N.A. acts as administrative agent and is a lender under each of our senior secured cashflow credit facility and our asset-based revolving credit facility. Affiliates of Bank of America indirectly ownapproximately 25.7% of the shares of the Company. We engaged Merrill Lynch, Pierce, Fenner & SmithIncorporated, an affiliate of Bank of America, as arranger and documentation agent in connection with certainamendments to our cash flow credit facility and our asset-based revolving credit facility in March 2009. Underthat engagement, upon such amendments becoming effective, we paid Merrill Lynch, Pierce, Fenner & SmithIncorporated aggregate fees of $6 million relating to the amendments to our senior secured credit facilities.Bank of America, N.A. also received its pro rata share of consent fees, amounting to $121,816, paid to thelenders under our senior secured cash flow credit facility in connection with certain amendments to thosefacilities in June 2009.
147
In addition, Merrill Lynch, Pierce, Fenner & Smith Incorporated acted as joint book-running manager anda representative of the initial purchasers of the 97⁄8% Senior Secured Notes due 2017 (the “outstanding 2017notes”) that HCA Inc. issued on February 19, 2009, the 81⁄2% senior secured notes due 2019 that HCA Inc.issued on April 22, 2009 (the “outstanding 2019 notes”), the 77⁄8% senior secured notes due 2020 that HCAInc. issued on August 11, 2009 (the “outstanding February 2020 notes”) and the 71⁄4% senior secured notesdue 2020 that HCA Inc. issued on March 10, 2010 (the “outstanding September 2020 notes”). The proceeds ofthe issuance of the outstanding 2017 notes, the outstanding 2019 notes, the outstanding February 2020 notesand the outstanding September 2020 notes were used to repay indebtedness under the senior secured creditfacilities, and Bank of America received its pro rata portion of such repayment. In addition, Merrill Lynch,Pierce, Fenner & Smith Incorporated received placement fees of $1.4 million in connection with the issuanceof the outstanding 2017 notes, placement fees of $8.0 million in connection with the issuance of theoutstanding 2019 notes and the outstanding February 2020 notes, and placement fees of $3.8 million inconnection with the issuance of the outstanding September 2020 notes.
Merrill Lynch, Pierce, Fenner & Smith Incorporated also acted as joint book-running manager and arepresentative of the initial purchasers of the 73⁄4% senior notes due 2021 (the “outstanding 2021 notes”) thatwe issued on November 23, 2010. The proceeds of the issuance of the outstanding 2021 notes were used tofund a distribution to our stockholders and holders of vested stock options, and affiliates of Bank of Americareceived their pro rata portion of such distribution. In addition, Merrill Lynch, Pierce, Fenner & SmithIncorporated received placement fees of $3.66 million in connection with the issuance of the outstanding 2021notes.
We also engaged Merrill Lynch, Pierce, Fenner & Smith Incorporated in connection with certainamendments to our senior secured cash flow credit facility in April 2010. Under that engagement, we paidMerrill Lynch, Pierce, Fenner & Smith Incorporated aggregate fees of approximately $2.0 million relating tothose amendments.
KKR Capital Markets LLC, one of the other initial purchasers of the outstanding 2017 notes, is anaffiliate of KKR, whose affiliates own approximately 24.7% of our shares, and received placement fees of$191,050 in connection with the issuance of the outstanding 2017 notes.
Merrill Lynch, Pierce, Fenner & Smith Incorporated, an affiliate of Bank of America, is acting as a jointbook-running manager for this offering and as a broker for our directed share program and the planadministrator for our equity incentive plans. See “Underwriting — Conflicts of Interest.”
Wells Fargo Shareowner Services acts as the transfer agent and registrar for our common stock and is anaffiliate of Wells Fargo Securities, LLC, one of the underwriters of this offering.
148
DESCRIPTION OF INDEBTEDNESS
The summaries set forth below are qualified in their entirety by the actual text of the applicableagreements and indentures, each of which has been filed as an exhibit to the registration statement, of whichthis prospectus is a part, or which may be obtained on publicly available websites at the addresses set forthunder “Where You Can Find More Information.”
Senior Secured Credit Facilities
The senior secured credit facilities provide senior secured financing of $16.800 billion, consisting of:
• $12.800 billion-equivalent in term loan facilities, comprised of a $2.750 billion senior secured termloan A facility maturing on November 17, 2012, a $8.800 billion senior secured term loan B facilityconsisting of a $6.800 billion senior secured term loan B-1 facility maturing on November 17, 2013and a $2.000 billion senior secured term loan B-2 facility maturing on March 31, 2017 and aA1.000 billion senior secured European term loan facility maturing on November 17, 2013; and
• $4.000 billion in revolving credit facilities, comprised of a $2.000 billion senior secured asset-basedrevolving credit facility available in dollars maturing on November 16, 2012 and a $2.000 billion seniorsecured revolving credit facility available in dollars, euros and pounds sterling currently maturing onNovember 17, 2012 and to be extended to November 17, 2015 pursuant to the amended and restatedjoinder agreement entered into on November 8, 2010 as described below. Availability under the asset-based revolving credit facility is subject to a borrowing base of 85% of eligible accounts receivable lesscustomary reserves.
We refer to these senior secured credit facilities, excluding the asset-based revolving credit facility, as the“cash flow credit facility” and, collectively with the asset-based revolving credit facility, the “senior securedcredit facilities.” The asset-based revolving credit facility is documented in a separate loan agreement from theother senior secured credit facilities.
HCA Inc. is the primary borrower under the senior secured credit facilities, except that a U.K. subsidiaryis the borrower under the European term loan facility. The revolving credit facilities include capacity availablefor the issuance of letters of credit and for borrowings on same-day notice, referred to as the swingline loans.A portion of the letter of credit availability under the cash-flow revolving credit facility is available in eurosand pounds sterling. Lenders under the cash flow credit facility are subject to a loss sharing agreementpursuant to which, upon the occurrence of certain events, including a bankruptcy event of default under thecash flow credit facility, each such lender will automatically be deemed to have exchanged its interest in aparticular tranche of the cash flow credit facility for a pro rata percentage in all of the tranches of the cashflow credit facility.
On February 16, 2007, the cash flow credit facility was amended to reduce the applicable margins withrespect to the term borrowings thereunder. On June 20, 2007, the asset-based revolving credit facility wasamended to reduce the applicable margin with respect to borrowings thereunder.
On March 2, 2009, the cash flow credit facility was amended to allow for one or more future issuances ofadditional secured notes, which may include notes that are secured on a pari passu basis or on a junior basiswith the obligations under the cash flow credit facility, so long as (1) such notes do not require, subject tocertain exceptions, scheduled repayments, payment of principal or redemption prior to the scheduled term loanB-1 maturity date, (2) the terms of such notes, taken as a whole, are not more restrictive than those in the cashflow credit facility and (3) no subsidiary of HCA Inc. that is not a U.S. guarantor is an obligor of suchadditional secured notes, and such notes are not secured by any European collateral securing the cash flowcredit facility. The U.S. security documents related to the cash flow credit facility were also amended andrestated in connection with the amendment in order to give effect to the security interests to be granted toholders of such additional secured notes.
On March 2, 2009, the asset-based revolving credit facility was amended to allow for one or more futureissuances of additional secured notes or loans, which may include notes or loans that are secured on a pari
149

passu basis or on a junior basis with the obligations under the cash flow credit facility, so long as (1) suchnotes or loans do not require, subject to certain exceptions, scheduled repayments, payment of principal orredemption prior to the scheduled term loan B-1 maturity date, (2) the terms of such notes or loans, asapplicable, taken as a whole, are not more restrictive than those in the cash flow credit facility and (3) nosubsidiary of HCA Inc. that is not a U.S. guarantor is an obligor of such additional secured notes. Theamendment to the asset-based revolving credit facility also altered the excess facility availability requirementto include a separate minimum facility availability requirement applicable to the asset-based revolving creditfacility and increased the applicable LIBOR and asset-based revolving margins for all borrowings under theasset-based revolving credit facility by 0.25% each.
On June 18, 2009, the cash flow credit facility was amended to permit unlimited refinancings of the termloans initially incurred in November 2006 under the cash flow credit facility (the “initial term loans”), as wellas any previously incurred refinancing term loans through the incurrence of new term loans under the cashflow credit facility (“refinancing term loans”), (collectively, with the initial term loans, the “then-existing termloans”), and to permit the establishment of one or more series of commitments under replacement cash flowrevolvers under the cash flow credit facility (“replacement revolver”) to replace all or a portion of therevolving commitments initially established in November 2006 under the cash flow credit facility (the “initialrevolver”) as well as any previously issued replacement revolvers (with no more than three series of revolvingcommitments to be outstanding at any time) in each case, subject to the terms described below. Theamendment to the cash flow credit facility further permits the maturity date of any then-existing term loan tobe extended (any such loans so extended, the “extended term loans”). The amendment to the cash flow creditfacility provides that:
• As to refinancing term loans, (1) the proceeds from such refinancing term loans be used to repay in fullthe initial term loans before being used to repay any previously issued refinancing term loans; (2) therefinancing term loans mature no earlier than the latest maturity date of any of the initial term loans;(3) the weighted average life to maturity for the refinancing term loans be no shorter than theremaining weighted average life to maturity of the tranche B term loan under the cash flow creditfacility measured at the time such refinancing term loans are incurred; and (4) refinancing term loanswill not share in mandatory prepayments resulting from the creation or issuance of extended term loansand/or first lien notes until the initial term loans are repaid in full but will share in other mandatoryprepayments such as those from asset sales.
• As to replacement revolvers, terms of such replacement revolver be substantially identical to thecommitments being replaced, other than with respect to maturity, size of any swingline loan and/orletter of credit subfacilities and pricing.
• As to extended term loans, (1) any offer to extend must be made to all lenders under the term loanbeing extended, and, if such offer is oversubscribed, the extension will be allocated ratably to thelenders according to the respective amounts then held by the accepting lenders; (2) each series ofextended term loans having the same interest margins, extension fees and amortization schedule shallbe a separate class of term loans; and (3) extended term loans will not share in mandatory prepaymentsresulting from the creation or issuance of refinancing term loans and/or first lien notes until the initialterm loans are repaid in full but will share in other mandatory prepayments such as those from assetsales.
• Any refinancing term loans and any obligations under replacement revolvers will have a pari passuclaim on the collateral securing the initial term loans and the initial revolver.
On April 6, 2010, the cash flow credit facility was amended to (i) extend the maturity date for$2.0 billion of the tranche B term loans from November 17, 2013 to March 31, 2017 and (ii) increase theABR margin and LIBOR margin with respect to such extended term loans to 2.25% and 3.25%, respectively.The maturity date, interest margins and fees, as applicable, with respect to all other loans, and allcommitments and letters of credit, outstanding under the cash flow credit facility remain unchanged.
150
On November 8, 2010, an amended and restated joinder agreement was entered into with respect to thecash flow credit facility to establish a new replacement revolving credit series, which will mature onNovember 17, 2015. The replacement revolving credit commitments will become effective upon the earlier of(i) our receipt of all or a portion of the proceeds (including by way of contribution) from an initial publicoffering of the common stock of HCA Inc. or its direct or indirect parent company (the “IPO ProceedsCondition”) and (ii) May 17, 2012, subject to the satisfaction of certain other conditions. If the IPO ProceedsCondition has not been satisfied, on May 17, 2012 or, if the IPO Proceeds Condition has been satisfied priorto May 17, 2012, on November 17, 2012, the applicable ABR and LIBOR margins with respect to thereplacement revolving loans will be increased from the applicable ABR and LIBOR margins of the existingrevolving loans based upon the achievement of a certain leverage ratio, which level will decrease from thelevels of the existing revolving loans.
See also “Certain Relationships and Related Party Transactions” for a description of certain relationshipsbetween us and Bank of America, N.A., the administrative agent under the cash flow credit facility and theasset-based revolving credit facility.
Interest Rate and Fees
Borrowings under the senior secured credit facilities bear interest at a rate equal to, at HCA Inc.’s option,either (a) LIBOR for deposits in the applicable currency plus an applicable margin or (b) the higher of (1) theprime rate of Bank of America, N.A. and (2) the federal funds effective rate plus 0.50%, plus an applicablemargin. The applicable margins in effect for borrowings as of December 31, 2010 are (u) under the asset-based revolving credit facility, 0.50% with respect to base rate borrowings and 1.50% with respect to LIBORborrowings, (v) under the senior secured revolving credit facility, 0.75% with respect to base rate borrowingsand 1.75% with respect to LIBOR borrowings, (w) under the term loan A facility, 0.50% with respect to baserate borrowings and 1.50% with respect to LIBOR borrowings, (x) under the term loan B-1 facility, 1.25%with respect to base rate borrowings and 2.25% with respect to LIBOR borrowings, (y) under the term loanB-2 facility, 2.25% with respect to base rate borrowings and 3.25% with respect to LIBOR borrowings, and(z) under the European term loan facility, 2.00% with respect to LIBOR borrowings. Certain of the applicablemargins may be reduced or increased depending on HCA Inc.’s leverage ratios.
In addition to paying interest on outstanding principal under the senior secured credit facilities, HCA Inc.is required to pay a commitment fee to the lenders under the revolving credit facilities in respect of theunutilized commitments thereunder. The commitment fee rate as of December 31, 2010 is 0.375% per annumfor the revolving credit facility and the asset-based revolving credit facility. The commitment fee rates mayfluctuate due to changes in specified leverage ratios. HCA Inc. must also pay customary letter of credit fees.
Prepayments
The cash flow credit facility requires HCA Inc. to prepay outstanding term loans, subject to certainexceptions, with:
• 50% (which percentage will be reduced to 25% if HCA Inc.’s total leverage ratio is 5.50x or less and to0% if HCA Inc.’s total leverage ratio is 5.00x or less) of HCA Inc.’s annual excess cash flow;
• 100% of the compensation for any casualty event, proceeds from permitted sale-leasebacks and the netcash proceeds of all nonordinary course asset sales or other dispositions of property, other than theReceivables Collateral, as defined below, if HCA Inc. does not (1) reinvest or commit to reinvest thoseproceeds in assets to be used in our business or to make certain other permitted investments within15 months as long as, in the case of any such commitment to reinvest or make certain other permittedinvestments, such investment is completed within such 15-month period or, if later, within 180 daysafter such commitment is made or (2) apply such proceeds within 15 months to repay debt of HCA Inc.that was outstanding on the effective date of the Recapitalization scheduled to mature prior to theearliest final maturity of the senior secured credit facilities then outstanding; and
151

• 100% of the net cash proceeds of any incurrence of debt, other than proceeds from the receivablesfacilities and other debt permitted under the senior secured credit facilities.
The foregoing mandatory prepayments are applied among the term loan facilities (1) during the first threeyears after the effective date of the Recapitalization, pro rata to such facilities based on the respectiveaggregate amounts of unpaid principal installments thereof due during such period, with amounts allocated toeach facility being applied to the remaining installments thereof in direct order of maturity and (2) thereafter,pro rata to such facilities, with amounts allocated to each facility being applied pro rata among the term loanA facility, the term loan B-1 facility, the term loan B-2 facility and the European term loan facility based uponthe applicable remaining repayment amounts due thereunder. Notwithstanding the foregoing, (i) proceeds ofasset sales by foreign subsidiaries are applied solely to prepay European term loans until such term loans havebeen repaid in full and (ii) HCA Inc. is not required to prepay loans under the term loan A facility or the termloan B facility with net cash proceeds of asset sales or with excess cash flow, in each case attributable toforeign subsidiaries, to the extent that the repatriation of such amounts is prohibited or delayed by applicablelocal law or would result in material adverse tax consequences.
The asset-based revolving credit facility requires HCA Inc. to prepay outstanding loans if borrowingsexceed the borrowing base.
HCA Inc. may voluntarily repay outstanding loans under the senior secured credit facilities at any timewithout premium or penalty, other than customary “breakage” costs with respect to LIBOR loans.
Amortization
HCA Inc. is required to repay the loans under the term loan facilities as follows:
• the term loan A facility amortizes in quarterly installments such that the aggregate amount of theoriginal funded principal amount of such facility repaid pursuant to such amortization payments in eachyear, commencing with the year ending December 31, 2007, is equal to $112.5 million in years 1 and2, $225 million in years 3 and 4, $450 million in year 5 and $1.625 billion in year 6;
• each of the term loan B-1 facility and the European term loan facility amortizes in equal quarterlyinstallments that commenced on March 31, 2007 in aggregate annual amounts equal to 1% of theoriginal funded principal amount of such facility, with the balance being payable on the final maturitydate of such term loans; and
• the term loan B-2 facility amortizes in equal quarterly installments commencing December 31, 2013 inaggregate annual amounts equal to 1% of the original funded principal amount of such facility, with thebalance payable on the final maturity date of such term loans.
Due to prior mandatory prepayments, amortization payments under the term loan A facility are notrequired until June 30, 2011, and no further amortization payments are required for either the term loan Bfacility or the European term loan. Principal amounts outstanding under the revolving credit facilities are dueand payable in full at maturity.
Guarantee and Security
All obligations under the senior secured credit facilities are unconditionally guaranteed by substantiallyall existing and future, direct and indirect, wholly-owned material domestic subsidiaries that are unrestrictedsubsidiaries under the 1993 Indenture (except for certain special purpose subsidiaries that only guarantee andpledge their assets under the asset-based revolving credit facility), and the obligations under the Europeanterm loan facility are also unconditionally guaranteed by HCA Inc. and each of its existing and future wholly-owned material subsidiaries formed under the laws of England and Wales, subject, in each of the foregoingcases, to any applicable legal, regulatory or contractual constraints and to the requirement that such guaranteedoes not cause adverse tax consequences.
All obligations under the asset-based revolving credit facility, and the guarantees of those obligations, aresecured, subject to permitted liens and other exceptions, by a first-priority lien on substantially all of the
152

receivables of the borrowers and each guarantor under such asset-based revolving credit facility (the“Receivables Collateral”).
All obligations under the cash flow credit facility and the guarantees of such obligations, are secured,subject to permitted liens and other exceptions, by:
• a first-priority lien on the capital stock owned by HCA Inc. or by any U.S. guarantor in each of theirrespective first-tier subsidiaries (limited, in the case of foreign subsidiaries, to 65% of the voting stockof such subsidiaries);
• a first-priority lien on substantially all present and future assets of HCA Inc. and of each U.S. guarantorother than (i) “Principal Properties” (as defined in the 1993 Indenture), except for certain “PrincipalProperties” the aggregate amount of indebtedness secured thereby in respect of the cash flow creditfacility and the first lien notes and any future first lien obligations, taken as a whole, do not exceed10% of “Consolidated Net Tangible Assets” (as defined under the 1993 Indenture), (ii) certain otherreal properties and (iii) deposit accounts, other bank or securities accounts, cash, leaseholds, motor-vehicles and certain other exceptions (such collateral under this and the preceding bullet, the “Non-Receivables Collateral”); and
• a second-priority lien on certain of the Receivables Collateral (such portion of the ReceivablesCollateral, the “Shared Receivables Collateral”; the Receivables Collateral that does not secure suchcash flow credit facility on a second-priority basis is referred to as the “Separate ReceivablesCollateral”).
The obligations of the borrowers and the guarantors under the European term loan facility are alsosecured by substantially all present and future assets of the European subsidiary borrower and each Europeanguarantor (the “European Collateral”), subject to permitted liens and other exceptions (including, withoutlimitation, exceptions for deposit accounts, other bank or securities accounts, cash, leaseholds, motor-vehiclesand certain other exceptions) and subject to such security interests otherwise being permitted by applicablelaw and contract and not resulting in adverse tax consequences. Neither our first lien notes nor our second liennotes are secured by any of the European Collateral.
Certain Covenants and Events of Default
The senior secured credit facilities contain a number of covenants that, among other things, restrict,subject to certain exceptions, HCA Inc.’s ability and the ability of its restricted subsidiaries to:
• incur additional indebtedness;
• create liens;
• enter into sale and leaseback transactions;
• engage in mergers or consolidations;
• sell or transfer assets;
• pay dividends and distributions or repurchase capital stock;
• make investments, loans or advances;
• prepay certain subordinated indebtedness, the second lien notes and certain other indebtedness existingon the effective date of the Recapitalization (“Retained Indebtedness”), subject to exceptions, includingfor repayments of Retained Indebtedness maturing prior to the senior secured credit facilities and, incertain cases, to satisfaction of a maximum first lien leverage condition;
• make certain acquisitions;
• engage in certain transactions with affiliates;
153

• make certain material amendments to agreements governing certain subordinated indebtedness, thesecond lien notes or Retained Indebtedness; and
• change lines of business.
In addition, the senior secured credit facilities require the following financial covenants to be maintained:
• in the case of the asset-based revolving credit facility, a minimum interest coverage ratio (applicableonly when availability under such facility is less than 10% of the borrowing base thereunder); and
• in the case of the other senior secured credit facilities, a maximum total leverage ratio.
The senior secured credit facilities also contain certain customary affirmative covenants and events ofdefault, including a change of control.
Senior Secured Notes
In connection with the Corporate Reorganization, HCA Holdings, Inc. became a guarantor of HCA Inc.’ssenior secured notes described below but is not subject to the covenants that apply to HCA Inc. or HCA Inc.’srestricted subsidiaries under those notes.
Overview of Senior Secured First Lien Notes
As of December 31, 2010, HCA Inc. had $4.150 billion aggregate principal amount of senior secured firstlien notes consisting of:
• $1.500 billion aggregate principal amount of 81⁄2% senior secured notes due 2019 issued on April 22,2009 at a price of 96.755% of their face value, resulting in $1.451 billion of gross proceeds;
• $1.250 billion aggregate principal amount of 77⁄8% senior secured notes due 2020 issued on August 11,2009 at a price of 98.254% of their face value, resulting in $1.228 billion of gross proceeds; and
• $1.400 billion aggregate principal amount of 71⁄4% senior secured first lien notes due 2020 issued onMarch 10, 2010 at a price of 99.095% of their face value, resulting in $1.387 billion of gross proceeds.
We refer to these notes issued on April 22, 2009, August 11, 2009 and March 10, 2010 as the “first liennotes” and the indentures governing the first lien notes as the “first lien indentures.”
The first lien notes and the related guarantees are secured by first-priority liens, subject to permittedliens, on HCA Inc.’s subsidiary guarantors’ assets, subject to certain exceptions, that secure HCA Inc.’s cashflow credit facility on a first-priority basis and are secured by second-priority liens, subject to permitted liens,on HCA Inc.’s subsidiary guarantors’ assets that secure HCA Inc.’s asset-based revolving credit facility on afirst-priority basis and HCA Inc.’s cash flow credit facility on a second-priority basis.
Overview of Senior Secured Second Lien Notes
As of December 31, 2010, HCA Inc. had $6.088 billion aggregate principal amount of senior securedsecond lien notes consisting of:
• $4.200 billion of second lien notes (comprised of $1.000 billion of 91⁄8% notes due 2014 and$3.200 billion of 91⁄4% notes due 2016) and $1.578 billion of 95⁄8% cash/103⁄8% pay-in-kind second lientoggle notes due 2016 (which toggle notes allow us, at HCA Inc.’s option, to pay interest in-kind duringthe first five years at the higher interest rate of 103⁄8%). HCA Inc. elected in November 2008 to payinterest in-kind in the amount of $78 million for the interest period ending in May 2009.
• $310 million aggregate principal amount of 97⁄8% senior secured notes due 2017.
We refer to these notes as the “second lien notes” and, together with the first lien notes, the “securednotes.” We refer to the indentures governing the second lien notes as the “second lien indentures” and,together with the first lien indentures, the “indentures governing the secured notes.”
154
These second lien notes and the related guarantees are secured by second-priority liens, subject topermitted liens, on HCA Inc.’s subsidiary guarantors’ assets, subject to certain exceptions, that secure the cashflow credit facility on a first-priority basis and are secured by third-priority liens, subject to permitted liens, onHCA Inc.’s and its subsidiary guarantors’ assets that secure the asset-based revolving credit facility on a first-priority basis and the cash flow credit facility on a second-priority basis.
Optional Redemption
The indentures governing the secured notes permit HCA Inc. to redeem some or all of the secured notesat any time at redemption prices described or set forth in the respective indenture. In particular, in the event ofan equity offering, HCA Inc. may, for approximately three years following the date of issuance of that series,redeem up to 35% of the principal amount of such series at a redemption price equal to 100% plus the amountof the respective coupon, using the net cash proceeds raised in the equity offering.
Change of Control
In addition, the indentures governing the secured notes provide that, upon the occurrence of a change ofcontrol as defined therein, each holder of secured notes has the right to require us to repurchase some or all ofsuch holder’s secured notes at a purchase price in cash equal to 101% of the principal amount thereof, plusaccrued and unpaid interest, if any, to the repurchase date.
Covenants
The indentures governing the secured notes contain covenants limiting, among other things, HCA Inc.’sability and the ability of its restricted subsidiaries to, subject to certain exceptions:
• incur additional debt or issue certain preferred stock;
• pay dividends on or make certain distributions of our capital stock or make other restricted payments;
• create certain liens or encumbrances;
• sell certain assets;
• enter into certain transactions with affiliates;
• make certain investments; and
• consolidate, merge, sell or otherwise dispose of all or substantially all of our assets.
The indentures governing the secured notes also contain a covenant limiting HCA Inc.’s ability to prepaycertain series of unsecured notes based on the maturity of those unsecured notes. In particular, the indenturegoverning the first lien notes issued in April 2009 permits HCA Inc. to prepay only those unsecured notesmaturing on or prior to April 15, 2019, the indenture governing the first lien notes issued in August 2009permits HCA Inc. to prepay only those unsecured notes maturing on or prior to February 15, 2020 and theindentures governing the notes issued in November 2006 and in February 2009 permit HCA Inc. to prepayonly those unsecured notes maturing on or prior to November 15, 2016.
Events of Default
The indentures governing the secured notes also provide for events of default which, if any of themoccurs, would permit or require the principal of and accrued interest on the secured notes to become or to bedeclared due and payable.
Other Secured Indebtedness
As of December 31, 2010, HCA Inc. had approximately $322 million of capital leases and other secureddebt outstanding.
155
Under the lease with HRT of Roanoke, Inc., effective December 20, 2005, HCA Inc. makes annualpayments for rent and additional expenses for the use of premises in Roanoke and Salem, Virginia. The rentpayments will increase each year beginning January 1, 2007 by the lesser of 3% or the change in theConsumer Price Index. The lease is for a fixed term of 12 years with the option to extend the lease for anotherten years.
Under the lease with Medical City Dallas Limited, effective March 18, 2004, HCA Inc. makes annualpayments for rent for the use of premises that are a part of a complex known as “Medical City Dallas” locatedin Dallas, Texas. The rent payment is adjusted yearly based on the fair market value of the premises and acapitalization rate. The initial term is 240 months with the option to extend for two more terms of 240 monthseach.
Unsecured Indebtedness of HCA Inc.
As of December 31, 2010, HCA Inc. had outstanding an aggregate principal amount of $5.853 billion,consisting of the following series:
• $273,321,000 aggregate principal amount of 7.875% Senior Notes due 2011;
• $402,499,000 aggregate principal amount of 6.95% Senior Notes due 2012;
• $500,000,000 aggregate principal amount of 6.30% Senior Notes due 2012;
• $500,000,000 aggregate principal amount of 6.25% Senior Notes due 2013;
• $500,000,000 aggregate principal amount of 6.75% Senior Notes due 2013;
• $500,000,000 aggregate principal amount of 5.75% Senior Notes due 2014;
• $750,000,000 aggregate principal amount of 6.375% Senior Notes due 2015;
• $1,000,000,000 aggregate principal amount of 6.50% Senior Notes due 2016;
• $291,436,000 aggregate principal amount of 7.69% Notes due 2025;
• $250,000,000 aggregate principal amount of 7.50% Senior Notes due 2033;
• $150,000,000 aggregate principal amount of 7.19% Debentures due 2015;
• $135,645,000 aggregate principal amount of 7.50% Debentures due 2023;
• $150,000,000 aggregate principal amount of 8.36% Debentures due 2024;
• $150,000,000 aggregate principal amount of 7.05% Debentures due 2027;
• $100,000,000 aggregate principal amount of 7.75% Debentures due 2036; and
• $200,000,000 aggregate principal amount of 7.50% Debentures due 2095.
As of December 31, 2010, HCA Inc. also had outstanding $121,110,000 aggregate principal amount ofHCA Inc.’s 9.00% Medium Term Notes due 2014 and $125,000,000 aggregate principal amount of HCA Inc.’s7.58% Medium Term Notes due 2025.
All of HCA Inc.’s outstanding series of senior notes, debentures and medium term notes, which we referto collectively as the “unsecured notes,” were issued under an indenture, which we refer to as the “1993Indenture.”
Optional Redemption
If permitted by the respective supplemental indenture, HCA Inc. is permitted to redeem some or all ofthat series of unsecured notes at any time at redemption prices described or set forth in such supplementalindenture.
156
Covenants
The 1993 Indenture contains covenants limiting, among other things, HCA Inc.’s ability and/or the abilityof HCA Inc.’s restricted subsidiaries to (subject to certain exceptions):
• assume or guarantee indebtedness or obligation secured by mortgages, liens, pledges or otherencumbrances;
• enter into sale and lease-back transactions with respect to any “Principal Property” (as such term isdefined in the 1993 Indenture);
• create, incur, issue, assume or otherwise become liable with respect to, extend the maturity of, orbecome responsible for the payment of, any debt or preferred stock; and
• consolidate, merge, sell or otherwise dispose of all or substantially all of HCA Inc.’s assets.
In addition, the 1993 Indenture provides that the aggregate amount of all other indebtedness of HCA Inc.secured by mortgages on “Principal Properties” (as such term is defined in the 1993 Indenture) together withthe aggregate principal amount of all indebtedness of restricted subsidiaries (as such term is defined in the1993 Indenture) and the attributable debt in respect of sale-leasebacks of Principal Properties, may not exceed15% of the consolidated net tangible assets of HCA Inc. and its consolidated subsidiaries, subject toexceptions for certain permitted mortgages and debt.
Events of Default
The 1993 Indenture contains certain events of default, which, if any of them occurs, would permit orrequire the principal of and accrued interest on such series to become or to be declared due and payable.
Unsecured Indebtedness of HCA Holdings, Inc.
Overview
On November 23, 2010, HCA Holdings, Inc. issued $1.525 billion aggregate principal amount of73⁄4% senior notes due 2021 at a price of 100% of their face value, resulting in $1.525 billion of grossproceeds. We refer to these notes as the “outstanding 2021 notes” and the indenture governing the outstanding2021 notes as the “2021 notes indenture.”
Ranking
The outstanding 2021 notes are our senior unsecured obligations and rank equally in right of paymentwith all of our future unsecured and unsubordinated indebtedness, rank senior in right of payment to any ofour future subordinated indebtedness, and are structurally subordinated in right of payment to indebtedness ofour subsidiaries. The outstanding 2021 notes are not guaranteed by any of our subsidiaries. Our future securedindebtedness and other future secured obligations will be effectively senior to the outstanding 2021 notes tothe extent of the value of the assets securing such other indebtedness and other obligations.
Optional Redemption
The 2021 notes indenture permits us to redeem some or all of the outstanding 2021 notes at any time atredemption prices described or set forth in the respective indenture. In particular, in the event of an equityoffering, we may, until November 15, 2013, redeem up to 35% of the principal amount of the outstanding2021 notes at a redemption price equal to 107.750%, using the net cash proceeds raised in the equity offering.
Change of Control
Upon the occurrence of a change of control, which is defined in the 2021 notes indenture, each holder ofthe outstanding 2021 notes has the right to require us to repurchase some or all of such holder’s notes at apurchase price in cash equal to 101% of the principal amount thereof, plus accrued and unpaid interest, if any,to the repurchase date.
157

Covenants
The 2021 notes indenture contains covenants limiting, among other things, HCA Holdings, Inc.’s abilityand the ability of HCA Holdings, Inc.’s restricted subsidiaries to (subject to certain exceptions):
• pay dividends on or make other distributions in respect of our capital stock or make other restrictedpayments;
• create liens on certain assets to secure debt;
• enter into certain sale and lease-back transactions; and
• consolidate, merge, sell or otherwise dispose of all or substantially all of HCA Holdings, Inc.’s assets.
The covenant limiting the payment of dividends or making other distributions in respect of our capitalstock or making other restricted payments will no longer be in effect following certain initial public offerings,including this offering.
Events of Default
The 2021 notes indenture contains certain events of default, which, if any of them occurs, would permitor require the principal of and accrued interest on the outstanding 2021 notes to become or to be declared dueand payable.
158

DESCRIPTION OF CAPITAL STOCK
The following is a description of the material terms of our amended and restated certificate ofincorporation and amended and restated bylaws as each is anticipated to be in effect upon the consummationof this offering. We also refer you to our amended and restated certificate of incorporation and amended andrestated bylaws, copies of which are filed as exhibits to the registration statement of which this prospectusforms a part.
Authorized Capital
At the time of the consummation of this offering, our authorized capital stock will consist of:
• 1,800,000,000 shares of common stock, par value $.01 per share, of which 427,485,800 shares wereissued and outstanding as of February 11, 2011, and;
• 200,000,000 shares of preferred stock, of which no shares are issued and outstanding.
As of February 11, 2011, there were 671 holders of record of our common stock.
Immediately following the consummation of this offering, there are expected to be 515,205,100 shares ofcommon stock issued and outstanding and no shares of preferred stock outstanding.
Common Stock
Voting Rights. Under the terms of the Amended and Restated Certificate of Incorporation, each holderof the common stock will be entitled to one vote for each share on all matters submitted to a vote of thestockholders, including the election of directors. Our stockholders will not have cumulative voting rights.Because of this, the holders of a majority of the shares of common stock entitled to vote and present in personor by proxy at any annual meeting of stockholders will be able to elect all of the directors standing forelection, if they should so choose.
Dividends. Subject to preferences that may be applicable to any then outstanding preferred stock,holders of common stock will be entitled to receive ratably those dividends, if any, as may be declared fromtime to time by the Board of Directors out of legally available assets or funds.
Liquidation. In the event of our liquidation, dissolution, or winding up, holders of common stock willbe entitled to share ratably in the net assets legally available for distribution to stockholders after the paymentof all of our debts and other liabilities and the satisfaction of any liquidation preference granted to the holdersof any outstanding shares of preferred stock.
Rights and Preferences. Holders of common stock will have no preemptive or conversion rights, andthere will be no redemption or sinking fund provisions applicable to the common stock. The rights,preferences, and privileges of the holders of common stock are subject to, and may be adversely affected by,the rights of the holders of shares of any series of preferred stock, which we may designate in the future.
Preferred Stock
The Amended and Restated Certificate of Incorporation will authorize our Board of Directors, withoutfurther action by the stockholders, to issue up to 200,000,000 shares of preferred stock, par value $.01 pershare, in one or more classes or series, to establish from time to time the number of shares to be included ineach such class or series, to fix the rights, powers and preferences of the shares of each such class or seriesand any qualifications, limitations, or restrictions thereon.
Stock Split
The Amended and Restated Certificate of Incorporation will provide that, upon the filing andeffectiveness of the Amended and Restated Certificate of Incorporation with the Secretary of State of the Stateof Delaware (the “Effective Time”), a forward split (the “Forward Split”) of our issued and outstandingcommon stock will occur whereby each outstanding share of common stock of the Company (the “Old
159

Common Stock”), including treasury shares, will be automatically split up, reclassified and converted into4.505 shares of common stock (the “New Common Stock”).
The Forward Split will occur without any further action on the part of the Company or the holders ofshares of Old Common Stock or New Common Stock and whether or not certificates representing suchholders’ shares prior to the Forward Split are surrendered for cancellation. No fractional interest in a share ofNew Common Stock will be deliverable upon the Forward Split. Stockholders who otherwise would have beenentitled to receive any fractional interests in the New Common Stock, in lieu of receipt of such fractionalinterest, will be entitled to receive from the Company an amount in cash equal to the fair value of suchfractional interest as of the Effective Time.
The Forward Split will be effected on a stockholder-by-stockholder (as opposed tocertificate-by-certificate) basis. Certificates dated, or book-entry holdings, as of a date prior to the EffectiveTime representing outstanding shares of Old Common Stock shall, immediately after the Effective Time,represent a number of shares equal to the same number of shares of New Common Stock as is reflected on theface of such certificates or book-entry records, multiplied by 4.505 and rounded down to the nearest wholenumber. The Company may, but shall not be obliged to issue new certificates evidencing the shares of NewCommon Stock outstanding as a result of the Forward Split unless and until the certificates evidencing theshares held by a holder prior to the Forward Split are either delivered to the Company or its transfer agent, orthe holder notifies the Company or its transfer agent that such certificates have been lost, stolen or destroyedand executes an agreement satisfactory to the Company to indemnify the Company from any loss incurred byit in connection with such certificates.
Board of Directors
The Amended and Restated Certificate of Incorporation will provide for a Board of Directors of not lessthan three members, the exact number to be determined from time to time by resolution adopted by theaffirmative vote of a majority of the total number of directors then in office. The Amended and RestatedCertificate of Incorporation will provide that directors will be elected to hold office for a term expiring at thenext annual meeting of stockholders and until a successor is duly elected and qualified or until his or herearlier death, resignation, disqualification or removal. Newly created directorships and vacancies may be filled,so long as there is at least one remaining director, only by the Board of Directors.
Amendment to Bylaws
The Amended and Restated Certificate of Incorporation and Amended and Restated Bylaws will providethat the Board of Directors is expressly authorized to make, alter, amend, change, add to or repeal the Bylawsof the Company by the affirmative vote of a majority of the total number of directors then in office. Prior tothe Trigger Date (as defined below), any amendment, alteration, change, addition or repeal of the Bylaws ofthe Company by the stockholders of the Company will require the affirmative vote of the holders of a majorityof the outstanding shares of the Company entitled to vote on such amendment, alteration, change, addition orrepeal. On or following the Trigger Date, any amendment, alteration, change, addition or repeal of the Bylawsof the Company by the stockholders of the Company shall require the affirmative vote of the holders of atleast seventy-five percent (75%) of the outstanding shares of the Company, voting together as a class, entitledto vote on such amendment, alteration, change, addition or repeal.
For purposes of the Amended and Restated Certificate of Incorporation and Amended and RestatedBylaws, (i) “Trigger Date” is defined as the first date on which Hercules Holding (or its successor) ceases, orin the event of a liquidation, or other distribution of shares of common stock by, of Hercules Holding, theEquity Sponsors (as defined below) and their affiliates, collectively, cease, to beneficially own (directly orindirectly) shares representing a majority of the then issued and outstanding common stock of the Company (itbeing understood that the retention of either direct or indirect beneficial ownership of a majority of the thenissued and outstanding shares of common stock by Hercules Holding (or its successor) or the Equity Sponsorsand their affiliates, as applicable, shall mean that the Trigger Date has not occurred) and (ii) the “EquitySponsors” shall mean each of Bain Capital, KKR, BAML Capital Partners, Citigroup, Bank of America
160
Corporation, and Dr. Thomas F. Frist Jr. and their respective affiliates, subsidiaries, successors and assignees(other than the Company and its subsidiaries).
Special Meetings of Stockholders
The Amended and Restated Certificate of Incorporation will provide that special meetings of stockholdersof the Company may be called only by either the Board of Directors, pursuant to a resolution adopted by theaffirmative vote of the majority of the total number of directors then in office, or by the Chairman of theBoard or the Chief Executive Officer of the Company; provided that, prior to the Trigger Date, specialmeetings of stockholders of the Company may also be called by the secretary of the Company at the requestof the holders of a majority of the outstanding shares of common stock.
Action on Written Consent
Pursuant to the Amended and Restated Certificate of Incorporation and Amended and Restated Bylaws,prior to the Trigger Date, stockholders will be able to take action by written consent; however, following theTrigger Date, any action required or permitted to be taken at an annual or special meeting of stockholders ofthe Company may be taken only upon the vote of the stockholders at an annual or special meeting duly calledand may not be taken by written consent of the stockholders.
Corporate Opportunities
The Amended and Restated Certificate of Incorporation will provide that we renounce any interest orexpectancy of the Company in the business opportunities of the Investors and of their officers, directors,agents, shareholders, members, partners, affiliates and subsidiaries and each such party shall not have anyobligation to offer us those opportunities unless presented to a director or officer of the Company in his or hercapacity as a director or officer of the Company.
Amendment to Amended and Restated Certificate of Incorporation
The Amended and Restated Certificate of Incorporation will provide that on or following the TriggerDate, the affirmative vote of the holders of at least seventy-five percent (75%) of the voting power of alloutstanding shares of the Company entitled to vote generally in the election of directors, voting together in asingle class, will be required to adopt any provision inconsistent with, to amend or repeal any provision of, orto adopt a bylaw inconsistent with certain specified provisions of the Amended and Restated Certificate ofIncorporation.
Advance Notice Requirements for Stockholder Proposals and Director Nominations
Our Amended and Restated Bylaws will provide that stockholders seeking to nominate candidates forelection as directors or to bring business before an annual or special meeting of stockholders must providetimely notice of their proposal in writing to the secretary of the Company. Generally, to be timely, astockholder’s notice must be delivered to, mailed or received at our principal executive offices, addressed tothe secretary of the Company, and within the following time periods:
• in the case of an annual meeting, no earlier than 120 days and no later than 90 days prior to the firstanniversary of the date of the preceding year’s annual meeting; provided, however, that if (A) theannual meeting is advanced by more than 30 days, or delayed by more than 60 days, from the firstanniversary of the preceding year’s annual meeting, or (B) no annual meeting was held during thepreceding year, to be timely the stockholder notice must be received no earlier than 120 days beforesuch annual meeting and no later than the later of 90 days before such annual meeting or the tenth dayafter the day on which public disclosure of the date of such meeting is first made; and
• in the case of a nomination of a person or persons for election to the Board of Directors at a specialmeeting of the stockholders called for the purpose of electing directors, no earlier than 120 days before
161
such special meeting and no later than the later of 90 days before such annual or special meeting or thetenth day after the day on which public disclosure of the date of such meeting is first made.
In no event shall an adjournment, postponement or deferral, or public disclosure of an adjournment,postponement or deferral, of a meeting of the stockholders commence a new time period (or extend any timeperiod) for the giving of the stockholder notice.
Authorized but Unissued Capital Stock
Delaware law does not require stockholder approval for any issuance of authorized shares. However, thelisting requirements of the New York Stock Exchange, which would apply as long as our common stock islisted on the New York Stock Exchange, require stockholder approval of certain issuances equal to orexceeding 20% of the then outstanding voting power or then outstanding number of shares of common stock.These additional shares may be used for a variety of corporate purposes, including future public offerings, toraise additional capital or to facilitate acquisitions.
One of the effects of the existence of unissued and unreserved common stock or preferred stock may beto enable our Board of Directors to issue shares to persons friendly to current management, which issuancecould render more difficult or discourage an attempt to obtain control of our company by means of a merger,tender offer, proxy contest or otherwise, and thereby protect the continuity of our management and possiblydeprive the stockholder of opportunities to sell their shares of common stock at prices higher than prevailingmarket prices.
Limitation on Directors’ Liability and Indemnification
Section 145(a) of the General Corporation Law of the State of Delaware (the “DGCL”) grants eachcorporation organized thereunder the power to indemnify any person who was or is a party or is threatened tobe made a party to any threatened, pending or completed action, suit or proceeding, whether civil, criminal,administrative or investigative (other than an action by or in the right of the corporation) by reason of the factthat the person is or was a director, officer, employee or agent of the corporation, or is or was serving at therequest of the corporation as a director, officer, employee or agent of another corporation, partnership, jointventure, trust or other enterprise, against expenses (including attorneys’ fees), judgments, fines and amountspaid in settlement actually and reasonably incurred by the person in connection with such action, suit orproceeding if the person acted in good faith and in a manner the person reasonably believed to be in or notopposed to the best interests of the corporation, and, with respect to any criminal action or proceeding, had noreasonable cause to believe the person’s conduct was unlawful.
Section 145(b) of the DGCL grants each corporation organized thereunder the power to indemnify anyperson who was or is a party or is threatened to be made a party to any threatened, pending or completedaction or suit by or in the right of the corporation to procure a judgment in its favor by reason of the fact thatthe person is or was a director, officer, employee or agent of the corporation, or is or was serving at therequest of the corporation as a director, officer, employee or agent of another corporation, partnership, jointventure, trust or other enterprise against expenses (including attorneys’ fees) actually and reasonably incurredby the person in connection with the defense or settlement of such action or suit if the person acted in goodfaith and in a manner the person reasonably believed to be in or not opposed to the best interests of thecorporation and except that no indemnification shall be made pursuant to Section 145(b) of the DGCL inrespect of any claim, issue or matter as to which such person shall have been adjudged to be liable to thecorporation unless and only to the extent that the Delaware Court of Chancery or the court in which suchaction or suit was brought shall determine upon application that, despite the adjudication of liability but inview of all the circumstances of the case, such person is fairly and reasonably entitled to indemnity for suchexpenses which the Court of Chancery or such other court shall deem proper.
Section 102(b)(7) of the DGCL enables a corporation in its certificate of incorporation, or an amendmentthereto, to eliminate or limit the personal liability of a director to the corporation or its stockholders ofmonetary damages for violations of the directors’ fiduciary duty of care as a director, except (i) for any breachof the director’s duty of loyalty to the corporation or its stockholders, (ii) for acts or omissions not in good
162
faith or that involve intentional misconduct or a knowing violation of law, (iii) pursuant to Section 174 of theDGCL (providing for liability of directors for unlawful payment of dividends or unlawful stock purchases orredemptions) or (iv) for any transaction from which a director derived an improper personal benefit.
Our Amended and Restated Certificate of Incorporation indemnifies the directors and officers to the fullextent of the DGCL and also allow the Board of Directors to indemnify all other employees. Such right ofindemnification is not exclusive of any right to which such officer or director may be entitled as a matter oflaw and shall extend and apply to the estates of deceased officers and directors.
We maintain a directors’ and officers’ insurance policy. The policy insures directors and officers againstunindemnified losses arising from certain wrongful acts in their capacities as directors and officers andreimburses us for those losses for which we have lawfully indemnified the directors and officers. The policycontains various exclusions that are normal and customary for policies of this type.
On November 1, 2009, we entered into an indemnification priority and information sharing agreementwith the Sponsors and certain of their affiliated funds to clarify the priority of advancement andindemnification obligations among us and any of our directors appointed by the Sponsors and other relatedmatters.
The foregoing summaries are subject to the complete text of our Amended and Restated Certificate ofIncorporation and Amended and Restated Bylaws and the DGCL and are qualified in their entirety byreference thereto.
We believe that our Amended and Restated Certificate of Incorporation, Amended and Restated Bylawsand insurance are necessary to attract and retain qualified persons as directors and officers.
The limitation of liability and indemnification provisions in our Amended and Restated Certificate ofIncorporation and Amended and Restated Bylaws may discourage stockholders from bringing a lawsuit againstdirectors for breach of their fiduciary duty. They may also reduce the likelihood of derivative litigation againstdirectors and officers, even though an action, if successful, might benefit us and other stockholders.Furthermore, a stockholder’s investment may be adversely affected to the extent we pay the costs of settlementand damage awards against directors and officers as required or allowed by these indemnification provisions.
At present, we are not aware of any pending litigation or proceeding involving any of our directors orofficers in which indemnification is required or permitted and we are not aware of any threatened litigation orproceeding that may result in a claim for indemnification.
Insofar as indemnification for liabilities arising under the Securities Act may be permitted to directors,officers or persons controlling us pursuant to the foregoing provisions or any other provisions described in thisprospectus, we have been informed that in the opinion of the Securities and Exchange Commission suchindemnification is against public policy as expressed in the Securities Act and is therefore unenforceable.
Delaware Anti-Takeover Statutes
Certain Delaware law provisions may make it more difficult for someone to acquire us through a tenderoffer, proxy contest or otherwise.
Section 203 of the DGCL, provides that, subject to certain stated exceptions, an “interested stockholder”is any person (other than the corporation and any direct or indirect majority-owned subsidiary) who owns 15%or more of the outstanding voting stock of the corporation or is an affiliate or associate of the corporation andwas the owner of 15% or more of the outstanding voting stock of the corporation at any time within the three-year period immediately prior to the date of determination, and the affiliates and associates of such person. Acorporation may not engage in a business combination with any interested stockholder for a period of threeyears following the time that such stockholder became an interested stockholder unless:
• prior to such time the board of directors of the corporation approved either the business combination ortransaction which resulted in the stockholder becoming an interested stockholder;
163
• upon consummation of the transaction which resulted in the stockholder becoming an interestedstockholder, the interested stockholder owned at least 85% of the voting stock of the corporationoutstanding at the time the transaction commenced, excluding shares owned by persons who aredirectors and also officers and employee stock plans in which participants do not have the right todetermine confidentially whether shares held subject to the plan will be tendered in a tender orexchange offer; or
• at or subsequent to such time, the business combination is approved by the board of directors andauthorized at an annual or special meeting of stockholders, and not by written consent, by theaffirmative vote of 662⁄3% of the outstanding voting stock which is not owned by the interestedstockholder.
The effect of these provisions may make a change in control of our business more difficult by delaying,deferring or preventing a tender offer or other takeover attempt that a stockholder might consider in its bestinterest. This includes attempts that might result in the payment of a premium to stockholders over the marketprice for their shares. These provisions also may promote the continuity of our management by making itmore difficult for a person to remove or change the incumbent members of the board of directors.
Transfer Agent and Registrar
Wells Fargo Shareowner Services is the transfer agent and registrar for our common stock.
Listing
We have applied to list our common stock on the New York Stock Exchange under the symbol “HCA.”
164
SHARES ELIGIBLE FOR FUTURE SALE
After our Recapitalization and prior to this offering, there has not been a public market for our commonstock, and we cannot predict what effect, if any, market sales of shares of common stock or the availability ofshares of common stock for sale will have on the market price of our common stock prevailing from time totime. Nevertheless, sales of substantial amounts of common stock, including shares issued upon the exercise ofoutstanding options, in the public market, or the perception that such sales could occur, could materially andadversely affect the market price of our common stock and could impair our future ability to raise capitalthrough the sale of our equity or equity-related securities at a time and price that we deem appropriate.
Upon the consummation of this offering, we will have outstanding an aggregate of approximately515,205,100 shares of common stock. In addition, options to purchase an aggregate of approximately50,525,942 shares of our common stock will be outstanding as of the consummation of this offering. Of theseoptions, 23,834,766 will have vested at or prior to the consummation of this offering and approximately 26,691,176could vest over the next three to six years. Of the outstanding shares, the shares sold in this offering will be freelytradable without restriction or further registration under the Securities Act, except that any shares held by ouraffiliates, as that term is defined under Rule 144 of the Securities Act, may be sold only in compliance with thelimitations described below. The remaining outstanding shares of common stock will be deemed restrictedsecurities, as defined under Rule 144. Restricted securities may be sold in the public market only if registered or ifthey qualify for an exemption from registration under Rule 144 under the Securities Act, which we summarizebelow.
Subject to the transfer restrictions described below, the restricted shares and the shares held by ouraffiliates will be available for sale in the public market as follows:
• 8,155,275 shares will be eligible for sale at various times after the date of this prospectus pursuant toRule 144; and
• 383,049,792 shares subject to the lock-up agreements will be eligible for sale at various timesbeginning 180 days after the date of this prospectus pursuant to Rule 144.
All of our management stockholders are subject to a management stockholder’s agreement that restricts,subject to certain exceptions, including pursuant to an effective registration statement, transfers of stock for aperiod of five years beginning November 17, 2006, and limits the amount of stock that can be transferred by amanagement stockholder for an additional three years after that five year period ends. See “CertainRelationships and Related Party Transactions — Management Stockholder’s Agreement.” In connection withthis offering, we have agreed to waive such transfer restrictions for all employees subject to the ManagementStockholder’s Agreement that were not permitted to participate in this offering with respect to the number ofshares of our common stock equal to the number of shares of common stock such employees could haverequired us to register in this offering had we elected to grant them “piggyback rights.”
The Amended and Restated Limited Liability Company Agreement of Hercules Holding containsrestrictions on the transfer of interests by the Investors in us. See “Certain Relationships and Related PartyTransactions — Amended and Restated Limited Liability Company Agreement of Hercules Holding II, LLC.”
Rule 144
In general, under Rule 144 as in effect on the date of this prospectus, a person who is not one of ouraffiliates at any time during the three months preceding a sale, and who has beneficially owned shares of ourcommon stock for at least six months, would be entitled to sell an unlimited number of shares of our commonstock provided current public information about us is available and, after owning such shares for at least oneyear, would be entitled to sell an unlimited number of shares of our common stock without restriction. Ouraffiliates who have beneficially owned shares of our common stock for at least six months are entitled to sellwithin any three-month period a number of shares that does not exceed the greater of:
• 1% of the number of shares of our common stock then outstanding, which was equal to approximately4,274,588 shares as of December 31, 2010; or
165

• the average weekly trading volume of our common stock on the New York Stock Exchange during thefour calendar weeks preceding the filing of a notice on Form 144 with respect to the sale.
Sales under Rule 144 by our affiliates are also subject to manner of sale provisions and noticerequirements and to the availability of current public information about us.
Lock-Up Agreements
In connection with this offering, we, our executive officers and directors, the selling stockholders and theInvestors have agreed with the underwriters, subject to certain exceptions, not to sell, dispose of or hedge any ofour common stock or securities convertible into or exchangeable for shares of common stock, during the periodending 180 days after the date of this prospectus, except with the prior written consent of two of therepresentatives of the underwriters. Pursuant to this agreement, we may issue our common stock in connection withthe acquisition of, or joint venture with, another entity so long as the aggregate number of shares issued,considered individually and together with all acquisitions or joint ventures announced during the 180-day restrictedperiod, shall not exceed 5% of our common stock issued and outstanding as of the date of such acquisition and/orjoint venture agreement. This agreement does not apply to any existing employee benefit plans.
The 180-day restricted period described in the preceding paragraph will be automatically extended if:
• during the last 17 days of the 180-day restricted period we issue an earnings release or material newsor a material event relating to us occurs; or
• prior to the expiration of the 180-day restricted period, we announce that we will release earningsresults or become aware that material news or a material event will occur during the 16-day periodbeginning on the last day of the 180-day period,
in which case the restrictions described in this paragraph will continue to apply until the expiration of the18-day period beginning on the issuance of the earnings release or the occurrence of the material news ormaterial event. See “Underwriting.”
Registration on Form S-8
We have filed a registration statement on Form S-8 under the Securities Act to register shares of commonstock issuable under our 2006 Plan. As a result, shares issued pursuant to such stock incentive plan, includingupon exercise of stock options, will be eligible for resale in the public market without restriction, subject tothe Rule 144 limitations applicable to affiliates and the restrictions described under “Certain Relationships andRelated Party Transactions — Management Stockholder’s Agreement.”
As of December 31, 2010, 47,419,234 shares (and, following the offering, an additional 40,000,000, for atotal of 87,419,234 shares) of common stock were reserved pursuant to our stock incentive plans for futureissuance in connection with the exercise of outstanding options awarded under this plan. Options with respect to19,230,877 of these shares were vested as of December 31, 2010 and additional options to purchase26,691,176 shares of common stock could vest subsequent to December 31, 2010.
Registration Rights
Pursuant to a registration rights agreement, we have granted the Investors the right to cause us, in certaininstances, at our expense, to file registration statements under the Securities Act covering resales of ourcommon stock held by them. These shares will represent approximately 73.3% of our outstanding commonstock after this offering (69.8% if the overallotment option is exercised in full). These shares also may be soldunder Rule 144 under the Securities Act, depending on their holding period and subject to restrictions in thecase of shares held by persons deemed to be our affiliates. Following the initial public offering of our commonstock, the Senior Management Stockholders will have limited “piggyback” registration rights with respect totheir shares of common stock.
For a description of rights some holders of common stock have to require us to register the shares ofcommon stock they own, see “Certain Relationships and Related Party Transactions.”
166

MATERIAL UNITED STATES FEDERAL INCOME AND ESTATE TAX CONSEQUENCESTO NON-U.S. HOLDERS
The following is a summary of the material United States federal income and estate tax consequences ofthe purchase, ownership and disposition of our common stock as of the date hereof. Except where noted, thissummary deals only with common stock purchased in this offering that is held as a capital asset by anon-U.S. holder.
Except as modified for estate tax purposes, a “non-U.S. holder” means a beneficial owner of our commonstock that is not, for United States federal income tax purposes, any of the following:
• an individual who is a citizen or resident of the United States;
• a corporation (or any other entity treated as a corporation for United States federal income taxpurposes) created or organized in or under the laws of the United States, any state thereof or theDistrict of Columbia;
• a partnership (including any entity or arrangement treated as a partnership for United States federalincome tax purposes);
• an estate the income of which is subject to United States federal income taxation regardless of itssource; or
• a trust if it (1) is subject to the primary supervision of a court within the United States and one or moreUnited States persons have the authority to control all substantial decisions of the trust or (2) has avalid election in effect under applicable United States Treasury regulations to be treated as a UnitedStates person.
This summary is based upon provisions of the Internal Revenue Code of 1986, as amended (the “Code”),and regulations, rulings and judicial decisions as of the date hereof. Those authorities may be changed,perhaps retroactively, so as to result in United States federal income and estate tax consequences differentfrom those summarized below. This summary does not address all aspects of United States federal income andestate taxes and does not deal with foreign, state, local or other tax considerations that may be relevant tonon-U.S. holders in light of their particular circumstances. In addition, it does not represent a detaileddescription of the United States federal income or estate tax consequences applicable to you if you are subjectto special treatment under the United States federal income or estate tax laws (including if you are a financialinstitution, United States expatriate, “controlled foreign corporation,” “passive foreign investment company,”person subject to the alternative minimum tax, dealer in securities, broker, person who has acquired ourcommon stock as part of a straddle, hedge, conversion transaction or other integrated investment, or apartnership or other pass-through entity for United States federal income tax purposes (or an investor in such apass-through entity)). We cannot assure you that a change in law will not alter significantly the taxconsiderations that we describe in this summary.
We have not and will not seek any rulings from the IRS regarding the matters discussed below. There canbe no assurance that the IRS will not take positions concerning the tax consequences of the purchase,ownership or disposition of shares of our common stock that are different from those discussed below.
If any entity or arrangement treated as a partnership for United States federal income tax purposes holdsour common stock, the tax treatment of a partner will generally depend upon the status of the partner and theactivities of the partnership and upon certain determinations made at the partner level. If you are a partner of apartnership holding our common stock, you should consult your tax advisors.
If you are considering the purchase of our common stock, you should consult your own tax advisorsconcerning the particular United States federal income and estate tax consequences to you of thepurchase, ownership and disposition of our common stock, as well as the consequences to you arisingunder the laws of any other applicable taxing jurisdiction, in light of your particular circumstances.
167

This discussion assumes that a non-U.S. holder will structure its ownership of our common stock so as tonot be subject to the newly enacted withholding tax discussed below under “Additional WithholdingRequirements.”
Dividends
We do not intend to pay any cash dividends on our common stock in the foreseeable future. See“Dividend Policy.” However, if we do make distributions on our common stock, those payments will constitutedividends for United States federal income tax purposes to the extent paid from our current or accumulatedearnings and profits, as determined under United States federal income tax principles. To the extent thosedistributions exceed both our current and our accumulated earnings and profits, they will constitute a return ofcapital and will first reduce your basis in our common stock (determined on a share by share basis), but notbelow zero, and then will be treated as gain from the sale of stock.
In the event that we pay dividends on our common stock, the dividends paid to a non-U.S. holdergenerally will be subject to withholding of United States federal income tax at a 30% rate, or such lower rateas may be specified by an applicable income tax treaty, of the gross amount of the dividends paid. However,dividends that are effectively connected with the conduct of a trade or business by the non-U.S. holder withinthe United States generally are not subject to the withholding tax, provided certain certification and disclosurerequirements are satisfied. Instead, such dividends are generally subject to United States federal income tax ona net income basis in the same manner as if the non-U.S. holder were a United States person as defined underthe Code (unless an applicable income tax treaty provides otherwise). A foreign corporation may be subject toan additional “branch profits tax” at a 30% rate (or such lower rate as may be specified by an applicableincome tax treaty) on its effectively connected earnings and profits attributable to such dividends.
A non-U.S. holder of our common stock who wishes to claim the benefit of an applicable treaty rate andavoid backup withholding, as discussed below, for dividends generally will be required (a) to complete IRSForm W-8BEN (or other applicable form) and certify under penalty of perjury that such holder is not a UnitedStates person as defined under the Code and is eligible for treaty benefits or (b) if our common stock is heldthrough certain foreign intermediaries, to satisfy the relevant certification requirements of applicable UnitedStates Treasury regulations. Special certification and other requirements apply to certain non-U.S. holders thatare pass-through entities rather than corporations or individuals.
A non-U.S. holder of our common stock eligible for a reduced rate of United States withholding taxpursuant to an income tax treaty may obtain a refund of any excess amounts withheld by timely filing anappropriate claim for refund with the IRS.
Gain on Disposition of Common Stock
Any gain realized by a non-U.S. holder on the disposition of our common stock generally will not besubject to United States federal income tax unless:
• the gain is effectively connected with a trade or business of the non-U.S. holder in the United States;
• the non-U.S. holder is an individual who is present in the United States for 183 days or more in thetaxable year of that disposition, and certain other conditions are met; or
• we are or have been a “United States real property holding corporation” for United States federalincome tax purposes at any time during the shorter of the five-year period ending on the date of thedisposition or the period that the non-U.S. holder held our common stock.
In the case of a non-U.S. holder described in the first bullet point immediately above, the gain will be subjectto United States federal income tax a net income basis generally in the same manner as if the non-U.S. holderwere a United States person as defined under the Code (unless an applicable income tax treaty provides otherwise),and a non-U.S. holder that is a foreign corporation may be subject to a branch profits tax equal to 30% of itseffectively connected earnings and profits attributable to such gain (or at such lower rate as may be specified by anapplicable income tax treaty). In the case of an individual non-U.S. holder described in the second bullet point
168
immediately above, except as otherwise provided by an applicable income tax treaty, the gain, which may be offsetby United States source capital losses, will be subject to a flat 30% tax even though the individual is notconsidered a resident of the United States under the Code.
We believe we are not and do not anticipate becoming a “United States real property holdingcorporation” for United States federal income tax purposes. If, however, we are or become a “United Statesreal property holding corporation,” so long as our common stock is regularly traded on an establishedsecurities market, only a non-U.S. holder who actually or constructively holds or held (at any time during theshorter of the five year period ending on the date of disposition or the non-U.S. holder’s holding period) morethan 5% of our common stock will be subject to United States federal income tax on the disposition of ourcommon stock. You should consult your own advisor about the consequences that could result if we are, orbecome, a “United States real property holding corporation.”
Information Reporting and Backup Withholding
We must report annually to the IRS and to each non-U.S. holder the amount of dividends paid to suchholder and the tax withheld with respect to such dividends, regardless of whether withholding was required.Copies of the information returns reporting such dividends and withholding may also be made available to thetax authorities in the country in which the non-U.S. holder resides under the provisions of an applicableincome tax treaty or agreement.
A non-U.S. holder will be subject to backup withholding for dividends paid to such holder unless such holdercertifies under penalty of perjury that it is a non-U.S. holder (and the payer does not have actual knowledge orreason to know that such holder is a United States person as defined under the Code), or such holder otherwiseestablishes an exemption.
Information reporting and, depending on the circumstances, backup withholding will apply to theproceeds of a sale of our common stock within the United States or conducted through certain United States-related financial intermediaries, unless the beneficial owner certifies under penalty of perjury that it is anon-U.S. holder (and the payer does not have actual knowledge or reason to know that the beneficial owner isa United States person as defined under the Code), or such owner otherwise establishes an exemption.
Any amounts withheld under the backup withholding rules may be allowed as a refund or a credit againsta non-U.S. holder’s United States federal income tax liability provided the required information is timelyfurnished to the IRS.
Additional Withholding Requirements
Under recently enacted legislation, the relevant withholding agent may be required to withhold 30% ofany dividends and the proceeds of a sale of our common stock paid after December 31, 2012 to (i) a foreignfinancial institution (whether holding stock for its own account or on behalf of its account holders/investors)unless such foreign financial institution agrees to verify, report and disclose its U.S. account holders and meetscertain other specified requirements or (ii) a non-financial foreign entity that is the beneficial owner of thepayment (or who holds stock on behalf of another non-financial foreign entity that is the beneficial owner)unless the beneficial owner certifies that it does not have any substantial United States owners or provides thename, address and taxpayer identification number of each substantial United States owner and meets certainother specified requirements. Non-U.S. holders should consult their own tax advisors regarding the effect ofthis newly enacted legislation.
Federal Estate Tax
Our common stock that is owned (or treated as owned) by an individual who is not a citizen or residentof the United States (as specially defined for United States federal estate tax purposes) at the time of deathwill be included in such individual’s gross estate for United States federal estate tax purposes, unless anapplicable estate or other tax treaty provides otherwise, and, therefore, may be subject to United States federalestate tax.
169
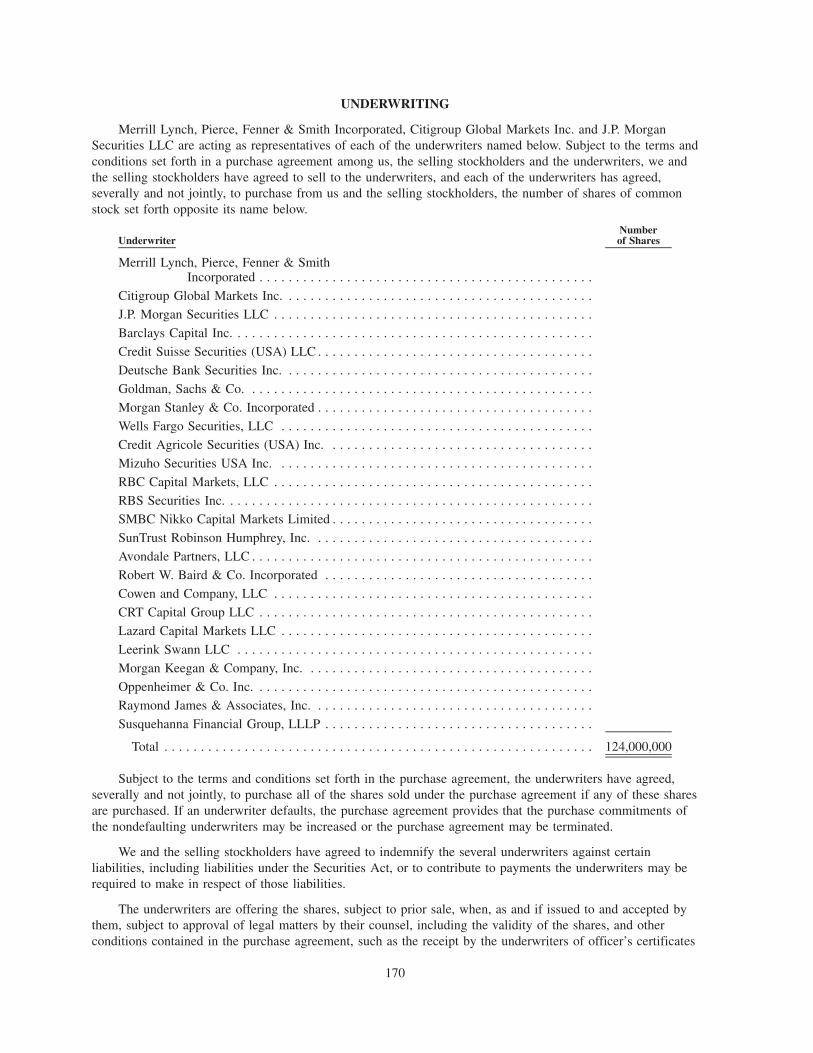
UNDERWRITING
Merrill Lynch, Pierce, Fenner & Smith Incorporated, Citigroup Global Markets Inc. and J.P. MorganSecurities LLC are acting as representatives of each of the underwriters named below. Subject to the terms andconditions set forth in a purchase agreement among us, the selling stockholders and the underwriters, we andthe selling stockholders have agreed to sell to the underwriters, and each of the underwriters has agreed,severally and not jointly, to purchase from us and the selling stockholders, the number of shares of commonstock set forth opposite its name below.
UnderwriterNumberof Shares
Merrill Lynch, Pierce, Fenner & SmithIncorporated . . . . . . . . . . . . . . . . . . . . . . . . . . . . . . . . . . . . . . . . . . . . . .
Citigroup Global Markets Inc. . . . . . . . . . . . . . . . . . . . . . . . . . . . . . . . . . . . . . . . . . .
J.P. Morgan Securities LLC . . . . . . . . . . . . . . . . . . . . . . . . . . . . . . . . . . . . . . . . . . . .
Barclays Capital Inc. . . . . . . . . . . . . . . . . . . . . . . . . . . . . . . . . . . . . . . . . . . . . . . . . .
Credit Suisse Securities (USA) LLC . . . . . . . . . . . . . . . . . . . . . . . . . . . . . . . . . . . . . .
Deutsche Bank Securities Inc. . . . . . . . . . . . . . . . . . . . . . . . . . . . . . . . . . . . . . . . . . .
Goldman, Sachs & Co. . . . . . . . . . . . . . . . . . . . . . . . . . . . . . . . . . . . . . . . . . . . . . . .
Morgan Stanley & Co. Incorporated . . . . . . . . . . . . . . . . . . . . . . . . . . . . . . . . . . . . . .
Wells Fargo Securities, LLC . . . . . . . . . . . . . . . . . . . . . . . . . . . . . . . . . . . . . . . . . . .
Credit Agricole Securities (USA) Inc. . . . . . . . . . . . . . . . . . . . . . . . . . . . . . . . . . . . .
Mizuho Securities USA Inc. . . . . . . . . . . . . . . . . . . . . . . . . . . . . . . . . . . . . . . . . . . .
RBC Capital Markets, LLC . . . . . . . . . . . . . . . . . . . . . . . . . . . . . . . . . . . . . . . . . . . .
RBS Securities Inc. . . . . . . . . . . . . . . . . . . . . . . . . . . . . . . . . . . . . . . . . . . . . . . . . . .SMBC Nikko Capital Markets Limited . . . . . . . . . . . . . . . . . . . . . . . . . . . . . . . . . . . .
SunTrust Robinson Humphrey, Inc. . . . . . . . . . . . . . . . . . . . . . . . . . . . . . . . . . . . . . .
Avondale Partners, LLC . . . . . . . . . . . . . . . . . . . . . . . . . . . . . . . . . . . . . . . . . . . . . . .
Robert W. Baird & Co. Incorporated . . . . . . . . . . . . . . . . . . . . . . . . . . . . . . . . . . . . .
Cowen and Company, LLC . . . . . . . . . . . . . . . . . . . . . . . . . . . . . . . . . . . . . . . . . . . .
CRT Capital Group LLC . . . . . . . . . . . . . . . . . . . . . . . . . . . . . . . . . . . . . . . . . . . . . .
Lazard Capital Markets LLC . . . . . . . . . . . . . . . . . . . . . . . . . . . . . . . . . . . . . . . . . . .
Leerink Swann LLC . . . . . . . . . . . . . . . . . . . . . . . . . . . . . . . . . . . . . . . . . . . . . . . . .
Morgan Keegan & Company, Inc. . . . . . . . . . . . . . . . . . . . . . . . . . . . . . . . . . . . . . . .
Oppenheimer & Co. Inc. . . . . . . . . . . . . . . . . . . . . . . . . . . . . . . . . . . . . . . . . . . . . . .
Raymond James & Associates, Inc. . . . . . . . . . . . . . . . . . . . . . . . . . . . . . . . . . . . . . .
Susquehanna Financial Group, LLLP . . . . . . . . . . . . . . . . . . . . . . . . . . . . . . . . . . . . .
Total . . . . . . . . . . . . . . . . . . . . . . . . . . . . . . . . . . . . . . . . . . . . . . . . . . . . . . . . . . . 124,000,000
Subject to the terms and conditions set forth in the purchase agreement, the underwriters have agreed,severally and not jointly, to purchase all of the shares sold under the purchase agreement if any of these sharesare purchased. If an underwriter defaults, the purchase agreement provides that the purchase commitments ofthe nondefaulting underwriters may be increased or the purchase agreement may be terminated.
We and the selling stockholders have agreed to indemnify the several underwriters against certainliabilities, including liabilities under the Securities Act, or to contribute to payments the underwriters may berequired to make in respect of those liabilities.
The underwriters are offering the shares, subject to prior sale, when, as and if issued to and accepted bythem, subject to approval of legal matters by their counsel, including the validity of the shares, and otherconditions contained in the purchase agreement, such as the receipt by the underwriters of officer’s certificates
170

and legal opinions. The underwriters reserve the right to withdraw, cancel or modify offers to the public and toreject orders in whole or in part.
Commissions and Discounts
The representatives have advised us and the selling stockholders that the underwriters propose initially tooffer the shares to the public at the public offering price set forth on the cover page of this prospectus and todealers at that price less a concession not in excess of $ per share. After the initial offering, the publicoffering price, concession or any other term of the offering may be changed.
The following table shows the public offering price, underwriting discount and proceeds before expensesto us and the selling stockholders. The information assumes either no exercise or full exercise by theunderwriters of their overallotment option.
Per Share Without Option With Option
Public offering price . . . . . . . . . . . . . . . . . . . . . . . . . . . . . $ $ $Underwriting discount. . . . . . . . . . . . . . . . . . . . . . . . . . . . $ $ $Proceeds, before expenses, to HCA Holdings, Inc. . . . . . . $ $ $Proceeds, before expenses, to the selling stockholders . . . . $ $ $
The expenses of the offering, not including the underwriting discount, are estimated at $7.0 million andare payable by us and the selling stockholders.
Overallotment Option
The selling stockholders have granted an option to the underwriters to purchase up to18,600,000 additional shares at the public offering price, less the underwriting discount. The underwriters mayexercise this option for 30 days from the date of this prospectus solely to cover any overallotments. If theunderwriters exercise this option, each will be obligated, subject to conditions contained in the purchaseagreement, to purchase a number of additional shares proportionate to that underwriter’s initial amountreflected in the above table.
Reserved Shares
At our request, the underwriters have reserved for sale, at the initial public offering price, up to 5% of theshares offered by this prospectus for sale to some of our directors, officers, employees and certain otherpersons who are otherwise associated with us through a directed share program. If these persons purchasereserved shares, this will reduce the number of shares available for sale to the general public. Any reservedshares that are not so purchased will be offered by the underwriters to the general public on the same terms asthe other shares offered by this prospectus.
No Sales of Similar Securities
We and the selling stockholders, our executive officers and directors and the Investors have agreed not tosell or transfer any common stock or securities convertible into, exchangeable for, exercisable for, or repayablewith common stock, for 180 days after the date of this prospectus without first obtaining the written consentof two of the representatives. Specifically, we and these other persons have agreed, with certain limitedexceptions, not to directly or indirectly
• offer, pledge, sell or contract to sell any common stock,
• sell any option or contract to purchase any common stock,
• purchase any option or contract to sell any common stock,
• grant any option, right or warrant for the sale of any common stock,
• lend or otherwise dispose of or transfer any common stock,
171
• request or demand that we file a registration statement related to the common stock, or
• enter into any swap or other agreement that transfers, in whole or in part, the economic consequence ofownership of any common stock whether any such swap or transaction is to be settled by delivery ofshares or other securities, in cash or otherwise.
This lock-up provision applies to common stock and to securities convertible into or exchangeable orexercisable for or repayable with common stock. It also applies to common stock owned now or acquired laterby the person executing the agreement or for which the person executing the agreement later acquires thepower of disposition. In the event that either (x) during the last 17 days of the lock-up period referred toabove, we issue an earnings release or material news or a material event relating to us occurs or (y) prior tothe expiration of the lock-up period, we announce that we will release earnings results or become aware thatmaterial news or a material event will occur during the 16-day period beginning on the last day of the lock-upperiod, the restrictions described above shall continue to apply until the expiration of the 18-day periodbeginning on the issuance of the earnings release or the occurrence of the material news or material event.
New York Stock Exchange Listing
We have applied to list our common stock on the New York Stock Exchange under the symbol “HCA.”In order to meet the requirements for listing on that exchange, the underwriters have undertaken to sell aminimum number of shares to a minimum number of beneficial owners as required by that exchange.
After our Recapitalization and prior to the offering, there has been no public market for our commonstock. The initial public offering price will be determined through negotiations among us, the sellingstockholders and the representatives. In addition to prevailing market conditions, the factors to be consideredin determining the initial public offering price are
• the valuation multiples of publicly traded companies that the representatives believe to be comparableto us,
• our financial information,
• the history of, and the prospects for, the Company and the industry in which we compete,
• an assessment of our management, its past and present operations, and the prospects for, and timing of,our future revenues,
• the present state of our development, and
• the above factors in relation to market values and various valuation measures of other companiesengaged in activities similar to ours.
An active trading market for the shares may not develop. It is also possible that after the offering theshares will not trade in the public market at or above the initial public offering price.
The underwriters do not expect to sell more than 5% of the shares in the aggregate to accounts overwhich they exercise discretionary authority. The underwriters have informed us that they do not intend toconfirm sales to discretionary accounts without prior written approval of the customer.
Price Stabilization, Short Positions and Penalty Bids
Until the distribution of the shares is completed, SEC rules may limit underwriters and selling groupmembers from bidding for and purchasing our common stock. However, Citigroup Global Markets Inc., onbehalf of the underwriters, may engage in transactions that stabilize the price of the common stock, such asbids or purchases to peg, fix or maintain that price.
In connection with the offering, the underwriters may purchase and sell our common stock in the openmarket. These transactions may include short sales, purchases on the open market to cover positions createdby short sales and stabilizing transactions. Short sales involve the sale by the underwriters of a greater numberof shares than they are required to purchase in the offering. “Covered” short sales are sales made in an amount
172
not greater than the underwriters’ overallotment option described above. The underwriters may close out anycovered short position by either exercising their overallotment option or purchasing shares in the open market.In determining the source of shares to close out the covered short position, the underwriters will consider,among other things, the price of shares available for purchase in the open market as compared to the price atwhich they may purchase shares through the overallotment option. “Naked” short sales are sales in excess ofthe overallotment option. The underwriters must close out any naked short position by purchasing shares inthe open market. A naked short position is more likely to be created if the underwriters are concerned thatthere may be downward pressure on the price of our common stock in the open market after pricing that couldadversely affect investors who purchase in the offering. Stabilizing transactions consist of various bids for orpurchases of shares of common stock made by the underwriters in the open market prior to the completion ofthe offering.
The underwriters may also impose a penalty bid. This occurs when a particular underwriter repays to theunderwriters a portion of the underwriting discount received by it because the representatives have repurchasedshares sold by or for the account of such underwriter in stabilizing or short covering transactions.
Similar to other purchase transactions, the underwriters’ purchases to cover the syndicate short sales mayhave the effect of raising or maintaining the market price of our common stock or preventing or retarding adecline in the market price of our common stock. As a result, the price of our common stock may be higherthan the price that might otherwise exist in the open market. The underwriters may conduct these transactionson the New York Stock Exchange, in the over-the-counter market or otherwise.
Neither we nor any of the underwriters make any representation or prediction as to the direction ormagnitude of any effect that the transactions described above may have on the price of our common stock. Inaddition, neither we nor any of the underwriters make any representation that the representatives will engagein these transactions or that these transactions, once commenced, will not be discontinued without notice.
Electronic Offer, Sale and Distribution of Shares
In connection with the offering, certain of the underwriters or securities dealers may distributeprospectuses by electronic means, such as e-mail. In addition, the representatives may facilitate Internetdistribution for this offering to certain of its Internet subscription customers. The representatives may allocatea limited number of shares for sale to its online brokerage customers. An electronic prospectus is available onInternet web sites maintained by the representatives. Other than the prospectus in electronic format, theinformation on the web sites of the representatives is not part of this prospectus.
Conflicts of Interest
Merrill Lynch, Pierce, Fenner & Smith Incorporated and/or its affiliates indirectly owns in excess of 10%of our issued and outstanding common stock, and is therefore be deemed to be our “affiliate” and have a“conflict of interest” within the meaning of Rule 5121 of the Financial Industry Regulatory Authority, Inc.(“FINRA Rule 5121”). Additionally, because we expect that more than 5% of the net proceeds of this offeringmay be received by certain underwriters in this offering or their affiliates that are lenders under the seniorsecured credit facilities, this offering is being conducted in accordance with FINRA Rule 5121 regarding theunderwriting of securities. In addition, affiliates of certain of the other underwriters may also own (directly oras a designee of a selling stockholder) a portion of our issued and outstanding common stock that may be soldon a pro rata basis in this offering. FINRA Rule 5121 requires that a “qualified independent underwriter”(“QIU”) participate in the preparation of the registration statement of which this prospectus is a part andperform its usual standard of due diligence with respect thereto. Barclays Capital Inc. has agreed to serve asthe QIU. In addition, in accordance with FINRA Rule 5121, if Merrill Lynch, Pierce, Fenner & SmithIncorporated and/or any of its affiliates receives more than 5% of the net proceeds from this offering, it willnot confirm sales to discretionary accounts without the prior written consent of its customers. We have agreedto indemnify against liabilities incurred in connection with acting as QIU, including liabilities under theSecurities Act.
173
Affiliates of one or more of the underwriters are lenders and/or agents under the senior secured creditfacilities and as such are entitled to be repaid with the proceeds that are used to repay the senior securedcredit facilities and will receive their pro rata portion of such repayment. In addition, Merrill Lynch, Pierce,Fenner & Smith Incorporated and/or its affiliate Bank of America, N.A., the administrative agent under oursenior secured credit facilities, as well as affiliates of certain of the other underwriters that are lenders and/oragents under our senior secured credit facilities, received fees in connection with the amendments to the seniorsecured credit facilities. See “Certain Relationships and Related Party Transactions — Other Relationships.”Affiliates of Merrill Lynch, Pierce, Fenner & Smith Incorporated indirectly own approximately 25.8% of ourshares and are entitled to seats on our Board of Directors. Certain of our directors are directors of othercompanies that are affiliates of certain of the underwriters.
Affiliates of or funds sponsored by Bain Capital Partners, LLC, KKR, BAMLCP and certain members ofthe Frist family provide management and advisory services to us and our affiliates pursuant to a managementagreement we executed in connection with our Recapitalization. Upon the consummation of this offering,pursuant to our management agreement, we will pay a fee of approximately $208 million to Bain CapitalPartners, LLC, KKR, BAMLCP and certain members of the Frist family party to the management agreementin connection with this offering and termination of the agreement.
Affiliates of Merrill Lynch, Pierce, Fenner & Smith Incorporated, whose parent company, Bank ofAmerica Corporation, is also the parent company of one of our Investors, BAML Capital Partners, thesuccessor organization to Merrill Lynch Global Private Equity, are permitted to elect three members to ourboard of directors pursuant to the LLC Agreement. Christopher J. Birosak, James D. Forbes and Nathan C.Thorne currently serve on our board of directors. Mr. Birosak is a managing director of BAML CapitalPartners, Mr. Forbes is the head of Bank of America’s Global Principal Investments Division, and Mr. Thorneis a consultant for Merrill Lynch Global Private Equity, Inc., a wholly-owned subsidiary of Bank of AmericaCorporation. Merrill Lynch, Pierce, Fenner & Smith Incorporated is also the broker for our directed shareprogram and the plan administrator for our equity incentive plans.
Dr. Thomas F. Frist Jr. is a member of the Advisory Board of Avondale Partners, LLC, a position forwhich he receives no financial compensation or remuneration.
Wells Fargo Shareowner Services acts as the transfer agent and registrar for our common stock and is anaffiliate of Wells Fargo Securities, LLC, one of the underwriters of this offering.
Other Relationships
The underwriters and their respective affiliates are full service financial institutions engaged in variousactivities, which may include securities trading, commercial and investment banking, financial advisory,investment management, investment research, principal investment, hedging, financing and brokerageactivities. Certain of the underwriters and their respective affiliates have, from time to time, performed, andmay in the future perform, various financial advisory, investment banking, commercial banking and otherservices for us for which they received or will receive customary fees and expenses. In addition, certain of theunderwriters or their affiliates have in the past sold or leased, and may in the future sell or lease, equipment tous in the ordinary course of business. Furthermore, certain of the underwriters and their respective affiliatesmay, from time to time, enter into arms-length transactions with us in the ordinary course of their business.
In the ordinary course of their various business activities, the underwriters and their respective affiliatesmay make or hold a broad array of investments and actively trade debt and equity securities (or relatedderivative securities) and financial instruments (including bank loans) for their own account and for theaccounts of their customers, and such investment and securities activities may involve securities and/orinstruments of the issuer. The underwriters and their respective affiliates may also make investmentrecommendations and/or publish or express
174
independent research views in respect of such securities or instruments and may at any time hold, orrecommend to clients that they acquire, long and/or short positions in such securities and instruments.
SMBC Nikko Capital Markets Limited is not a U.S. registered broker-dealer and, therefore, intends toparticipate in the offering outside of the United States and, to the extent that the offering is within theUnited States, as facilitated by an affiliated U.S. registered broker-dealer, SMBC Nikko Securities America, Inc.(“SMBC Nikko-SI”), as permitted under applicable law. To that end, SMBC Nikko Capital Markets Limited andSMBC Nikko-SI have entered into an agreement pursuant to which SMBC Nikko-SI provides certain advisoryand/or other services with respect to this offering. In return for the provision of such services by SMBC Nikko-SI, SMBC Nikko Capital Markets Limited will pay to SMBC Nikko-SI a mutually agreed fee.
Lazard Frères & Co. LLC referred this transaction to Lazard Capital Markets LLC and will receive areferral fee from Lazard Capital Markets LLC in connection therewith.
Notice to Prospective Investors in the EEA
In relation to each Member State of the European Economic Area which has implemented the ProspectusDirective (each, a “Relevant Member State”) an offer to the public of any shares which are the subject of theoffering contemplated by this prospectus may not be made in that Relevant Member State, except that an offerto the public in that Relevant Member State of any shares may be made at any time under the followingexemptions under the Prospectus Directive, if they have been implemented in that Relevant Member State:
(a) to legal entities which are authorized or regulated to operate in the financial markets or, if not soauthorized or regulated, whose corporate purpose is solely to invest in securities;
(b) to any legal entity which has two or more of (1) an average of at least 250 employees during thelast financial year; (2) a total balance sheet of more than A43,000,000 and (3) an annual net turnover ofmore than A50,000,000, as shown in its last annual or consolidated accounts;
(c) by the underwriters to fewer than 100 natural or legal persons (other than “qualified investors” asdefined in the Prospectus Directive) subject to obtaining the prior consent of the representatives for anysuch offer; or
(d) in any other circumstances falling within Article 3(2) of the Prospectus Directive;
provided that no such offer of shares shall result in a requirement for the publication by us or anyrepresentative of a prospectus pursuant to Article 3 of the Prospectus Directive.
Any person making or intending to make any offer of shares within the EEA should only do so incircumstances in which no obligation arises for us or any of the underwriters to produce a prospectus for suchoffer. Neither we nor the underwriters have authorized, nor do they authorize, the making of any offer ofshares through any financial intermediary, other than offers made by the underwriters which constitute thefinal offering of shares contemplated in this prospectus.
For the purposes of this provision, and your representation below, the expression an “offer to the public”in relation to any shares in any Relevant Member State means the communication in any form and by anymeans of sufficient information on the terms of the offer and any shares to be offered so as to enable aninvestor to decide to purchase any shares, as the same may be varied in that Relevant Member State by anymeasure implementing the Prospectus Directive in that Relevant Member State and the expression “ProspectusDirective” means Directive 2003/71/EC and includes any relevant implementing measure in each RelevantMember State.
Each person in a Relevant Member State who receives any communication in respect of, or who acquiresany shares under, the offer of shares contemplated by this prospectus will be deemed to have represented,warranted and agreed to and with us and each underwriter that:
(A) it is a “qualified investor” within the meaning of the law in that Relevant Member Stateimplementing Article 2(1)(e) of the Prospectus Directive; and
175
(B) in the case of any shares acquired by it as a financial intermediary, as that term is used inArticle 3(2) of the Prospectus Directive, (i) the shares acquired by it in the offering have not beenacquired on behalf of, nor have they been acquired with a view to their offer or resale to, persons in anyRelevant Member State other than “qualified investors” (as defined in the Prospectus Directive), or incircumstances in which the prior consent of the representatives has been given to the offer or resale; or(ii) where shares have been acquired by it on behalf of persons in any Relevant Member State other thanqualified investors, the offer of those shares to it is not treated under the Prospectus Directive as havingbeen made to such persons.
In addition, in the United Kingdom, this document is being distributed only to, and is directed only at,and any offer subsequently made may only be directed at persons who are “qualified investors” (as defined inthe Prospectus Directive) (i) who have professional experience in matters relating to investments falling withinArticle 19 (5) of the Financial Services and Markets Act 2000 (Financial Promotion) Order 2005, as amended(the “Order”) and/or (ii) who are high net worth companies (or persons to whom it may otherwise be lawfullycommunicated) falling within Article 49(2)(a) to (d) of the Order (all such persons together being referred toas “relevant persons”). This document must not be acted on or relied on in the United Kingdom by personswho are not relevant persons. In the United Kingdom, any investment or investment activity to which thisdocument relates is only available to, and will be engaged in with, relevant persons.
Notice to Prospective Investors in Switzerland
This document, as well as any other material relating to the shares which are the subject of the offeringcontemplated by this prospectus, do not constitute an issue prospectus pursuant to Article 652a and/or 1156 ofthe Swiss Code of Obligations. The shares will not be listed on the SIX Swiss Exchange and, therefore, thedocuments relating to the shares, including, but not limited to, this document, do not claim to comply with thedisclosure standards of the listing rules of SIX Swiss Exchange and corresponding prospectus schemesannexed to the listing rules of the SIX Swiss Exchange. The shares are being offered in Switzerland by way ofa private placement, i.e., to a small number of selected investors only, without any public offer and only toinvestors who do not purchase the shares with the intention to distribute them to the public. The investors willbe individually approached by the issuer from time to time. This document, as well as any other materialrelating to the shares, is personal and confidential and do not constitute an offer to any other person. Thisdocument may only be used by those investors to whom it has been handed out in connection with theoffering described herein and may neither directly nor indirectly be distributed or made available to otherpersons without express consent of the issuer. It may not be used in connection with any other offer and shallin particular not be copied and/or distributed to the public in (or from) Switzerland.
Notice to Prospective Investors in the Dubai International Financial Centre
This document relates to an exempt offer in accordance with the Offered Securities Rules of the DubaiFinancial Services Authority. This document is intended for distribution only to persons of a type specified inthose rules. It must not be delivered to, or relied on by, any other person. The Dubai Financial ServicesAuthority has no responsibility for reviewing or verifying any documents in connection with exempt offers.The Dubai Financial Services Authority has not approved this document nor taken steps to verify theinformation set out in it, and has no responsibility for it. The shares which are the subject of the offeringcontemplated by this prospectus may be illiquid and/or subject to restrictions on their resale. Prospectivepurchasers of the shares offered should conduct their own due diligence on the shares. If you do notunderstand the contents of this document you should consult an authorised financial adviser.
Notice to Prospective Investors in Hong Kong
This prospectus has not been approved by or registered with the Securities and Futures Commission ofHong Kong or the Registrar of Companies of Hong Kong. The shares will not be offered or sold in HongKong other than (a) to “professional investors” as defined in the Securities and Futures Ordinance (Cap. 571)of Hong Kong and any rules made under that Ordinance; or (b) in other circumstances which do not result inthe document being a “prospectus” as defined in the Companies Ordinance (Cap. 32) of Hong Kong or which
176
do not constitute an offer to the public within the meaning of that Ordinance. No advertisement, invitation ordocument relating to the shares which is directed at, or the contents of which are likely to be accessed or readby, the public of Hong Kong (except if permitted to do so under the securities laws of Hong Kong) has beenissued or will be issued in Hong Kong or elsewhere other than with respect to shares which are or areintended to be disposed of only to persons outside Hong Kong or only to “professional investors” as defined inthe Securities and Futures Ordinance and any rules made under that Ordinance.
Notice to Prospective Investors in Singapore
This prospectus has not been registered as a prospectus with the Monetary Authority of Singapore.Accordingly, this prospectus and any other document or material in connection with the offer or sale, orinvitation for subscription or purchase, of the shares may not be circulated or distributed, nor may the shares beoffered or sold, or be made the subject of an invitation for subscription or purchase, whether directly orindirectly, to persons in Singapore other than (i) to an institutional investor under Section 274 of the Securitiesand Futures Act (Chapter 289) (the “SFA”), (ii) to a relevant person, or any person pursuant to Section 275(1A),and in accordance with the conditions, specified in Section 275 of the SFA or (iii) otherwise pursuant to, and inaccordance with the conditions of, any other applicable provision of the SFA. Where the shares are subscribed orpurchased under Section 275 by a relevant person which is: (a) a corporation (which is not an accreditedinvestor) the sole business of which is to hold investments and the entire share capital of which is owned by oneor more individuals, each of whom is an accredited investor; or (b) a trust (where the trustee is not an accreditedinvestor) whose sole purpose is to hold investments and each beneficiary is an accredited investor, then shares,debentures and units of shares and debentures of that corporation or the beneficiaries’ rights and interest in thattrust shall not be transferable for 6 months after that corporation or that trust has acquired the shares underSection 275 except: (i) to an institutional investor under Section 274 of the SFA or to a relevant person, or anyperson pursuant to Section 275(1A), and in accordance with the conditions, specified in Section 275 of the SFA;(ii) where no consideration is given for the transfer; or (iii) by operation of law.
Notice to Prospective Investors in Japan
The shares have not been and will not be registered under the Financial Instruments and Exchange Lawof Japan (Law No. 25 of 1948, as amended) and, accordingly, will not be offered or sold, directly orindirectly, in Japan, or for the benefit of any Japanese Person or to others for re-offering or resale, directly orindirectly, in Japan or to any Japanese Person, except in compliance with all applicable laws, regulations andministerial guidelines promulgated by relevant Japanese governmental or regulatory authorities in effect at therelevant time. For the purposes of this paragraph, “Japanese Person” shall mean any person resident in Japan,including any corporation or other entity organized under the laws of Japan.
177
LEGAL MATTERS
Certain legal matters in connection with the offering will be passed upon for us and certain sellingstockholders by Simpson Thacher & Bartlett LLP, New York, New York and Bass, Berry & Sims PLC,Nashville, Tennessee, and certain health care regulatory matters will be passed upon for us by Bass, Berry &Sims PLC, Nashville, Tennessee. Certain legal matters in connection with the offering will be passed upon forthe underwriters by Cahill Gordon & Reindel LLP, New York, New York and certain health care regulatorymatters will be passed on for the underwriters by Winston & Strawn LLP, Washington, D.C. An investmentvehicle comprised of several partners of Simpson Thacher & Bartlett LLP, members of their families, relatedpersons and others own interests representing less than 1% of the capital commitments of the KKRMillennium Fund, L.P. and KKR 2006 Fund L.P.
EXPERTS
The consolidated financial statements of HCA Holdings, Inc. as of December 31, 2010 and 2009, and foreach of the three years in the period ended December 31, 2010, appearing in this prospectus and registrationstatement, and the effectiveness of HCA Holdings, Inc.’s internal control over financial reporting as ofDecember 31, 2010, have been audited by Ernst & Young LLP, independent registered public accounting firm,as set forth in its reports thereon included elsewhere herein. Such consolidated financial statements and HCAHoldings, Inc. management’s assessment of the effectiveness of internal control over financial reporting as ofDecember 31, 2010 are included in reliance upon such reports given on the authority of such firm as expertsin accounting and auditing.
178
WHERE YOU CAN FIND MORE INFORMATION
We file certain reports with the Securities and Exchange Commission (the “SEC”), including annualreports on Form 10-K, quarterly reports on Form 10-Q and current reports on Form 8-K. The public may readand copy any materials we file with the SEC at the SEC’s Public Reference Room at 100 F Street, N.E.,Washington, DC 20549. The public may obtain information on the operation of the Public Reference Room bycalling the SEC at 1-800-SEC-0330. We are an electronic filer, and the SEC maintains an Internet site athttp://www.sec.gov that contains the reports, proxy and information statements and other information we fileelectronically with the SEC. Our website address is www.hcahealthcare.com. Please note that our websiteaddress is provided as an inactive textual reference only. We make available free of charge, through ourwebsite, our annual report on Form 10-K, quarterly reports on Form 10-Q, current reports on Form 8-K and allamendments to those reports filed or furnished pursuant to Section 13(a) or 15(d) of the Exchange Act, assoon as reasonably practicable after such material is electronically filed with or furnished to the SEC. Theinformation provided on our website is not part of this prospectus, and is therefore not incorporated byreference unless such information is specifically referenced elsewhere in this prospectus.
Our Code of Conduct is available free of charge upon request to our Corporate Secretary, HCA Holdings,Inc., One Park Plaza, Nashville, Tennessee 37203.
179
HCA HOLDINGS, INC.
INDEX TO CONSOLIDATED FINANCIAL STATEMENTSPage
Management’s Report on Internal Control Over Financial Reporting . . . . . . . . . . . . . . . . . . . . . . . . . . . F-2
Reports of the Independent Registered Public Accounting Firm. . . . . . . . . . . . . . . . . . . . . . . . . . . . . . . F-3
Consolidated Income Statements for the years ended December 31, 2010, 2009 and 2008 . . . . . . . . . . . F-5
Consolidated Balance Sheets as of December 31, 2010 and 2009 . . . . . . . . . . . . . . . . . . . . . . . . . . . . . F-6
Consolidated Statements of Stockholders’ Deficit for the years ended December 31, 2010, 2009 and2008 . . . . . . . . . . . . . . . . . . . . . . . . . . . . . . . . . . . . . . . . . . . . . . . . . . . . . . . . . . . . . . . . . . . . . . . . F-7
Consolidated Statements of Cash Flows for the years ended December 31, 2010, 2009 and 2008 . . . . . . F-8
Notes to Consolidated Financial Statements . . . . . . . . . . . . . . . . . . . . . . . . . . . . . . . . . . . . . . . . . . . . . F-9
Quarterly Consolidated Financial Information (Unaudited) . . . . . . . . . . . . . . . . . . . . . . . . . . . . . . . . . . F-47
F-1

MANAGEMENT’S REPORT ON INTERNAL CONTROL OVER FINANCIAL REPORTING
Our management is responsible for establishing and maintaining effective internal control over financialreporting, as such term is defined in Exchange Act Rule 13a-15(f). Because of its inherent limitations, internalcontrol over financial reporting may not prevent or detect misstatements. Therefore, even those systemsdetermined to be effective, can provide only reasonable assurance with respect to financial statementpreparation and presentation.
Under the supervision and with the participation of our management, including our principal executiveofficer and principal financial officer, we conducted an assessment of the effectiveness of our internal controlover financial reporting based on the framework in Internal Control — Integrated Framework issued by theCommittee of Sponsoring Organizations of the Treadway Commission. Based on our assessment under theframework in Internal Control — Integrated Framework, our management concluded that our internal controlover financial reporting was effective as of December 31, 2010.
Ernst & Young, LLP, the independent registered public accounting firm that audited our consolidatedfinancial statements, has issued a report on our internal control over financial reporting, which is includedherein.
F-2
REPORT OF INDEPENDENT REGISTERED PUBLIC ACCOUNTING FIRM
The Board of Directors and StockholdersHCA Holdings, Inc.
We have audited HCA Holdings, Inc.’s internal control over financial reporting as of December 31, 2010,based on criteria established in Internal Control — Integrated Framework issued by the Committee ofSponsoring Organizations of the Treadway Commission (the COSO criteria). HCA Holdings, Inc.’smanagement is responsible for maintaining effective internal control over financial reporting, and for itsassessment of the effectiveness of internal control over financial reporting included in the accompanyingManagement’s Report on Internal Control Over Financial Reporting. Our responsibility is to express anopinion on the company’s internal control over financial reporting based on our audit.
We conducted our audit in accordance with the standards of the Public Company Accounting OversightBoard (United States). Those standards require that we plan and perform the audit to obtain reasonableassurance about whether effective internal control over financial reporting was maintained in all materialrespects. Our audit included obtaining an understanding of internal control over financial reporting, assessingthe risk that a material weakness exists, testing and evaluating the design and operating effectiveness ofinternal control based on the assessed risk, and performing such other procedures as we considered necessaryin the circumstances. We believe that our audit provides a reasonable basis for our opinion.
A company’s internal control over financial reporting is a process designed to provide reasonableassurance regarding the reliability of financial reporting and the preparation of financial statements for externalpurposes in accordance with generally accepted accounting principles. A company’s internal control overfinancial reporting includes those policies and procedures that (1) pertain to the maintenance of records that,in reasonable detail, accurately and fairly reflect the transactions and dispositions of the assets of thecompany; (2) provide reasonable assurance that transactions are recorded as necessary to permit preparation offinancial statements in accordance with generally accepted accounting principles, and that receipts andexpenditures of the company are being made only in accordance with authorizations of management anddirectors of the company; and (3) provide reasonable assurance regarding prevention or timely detection ofunauthorized acquisition, use, or disposition of the company’s assets that could have a material effect on thefinancial statements.
Because of its inherent limitations, internal control over financial reporting may not prevent or detectmisstatements. Also, projections of any evaluation of effectiveness to future periods are subject to the risk thatcontrols may become inadequate because of changes in conditions, or that the degree of compliance with thepolicies or procedures may deteriorate.
In our opinion, HCA Holdings, Inc. maintained, in all material respects, effective internal control overfinancial reporting as of December 31, 2010, based on the COSO criteria.
We also have audited, in accordance with the standards of the Public Company Accounting OversightBoard (United States), the consolidated balance sheets of HCA Holdings, Inc. as of December 31, 2010 and2009, and the related consolidated statements of income, stockholders’ deficit, and cash flows for each of thethree years in the period ended December 31, 2010 and our report dated February 17, 2011 expressed anunqualified opinion thereon.
/s/ Ernst & Young LLP
Nashville, TennesseeFebruary 17, 2011
F-3
REPORT OF INDEPENDENT REGISTERED PUBLIC ACCOUNTING FIRM
The Board of Directors and StockholdersHCA Holdings, Inc.
We have audited the accompanying consolidated balance sheets of HCA Holdings, Inc. as ofDecember 31, 2010 and 2009, and the related consolidated statements of income, stockholders’ deficit, andcash flows for each of the three years in the period ended December 31, 2010. These financial statements arethe responsibility of the Company’s management. Our responsibility is to express an opinion on these financialstatements based on our audits.
We conducted our audits in accordance with the standards of the Public Company Accounting OversightBoard (United States). Those standards require that we plan and perform the audit to obtain reasonableassurance about whether the financial statements are free of material misstatement. An audit includesexamining, on a test basis, evidence supporting the amounts and disclosures in the financial statements. Anaudit also includes assessing the accounting principles used and significant estimates made by management, aswell as evaluating the overall financial statement presentation. We believe that our audits provide a reasonablebasis for our opinion.
In our opinion, the financial statements referred to above, present fairly, in all material respects, theconsolidated financial position of HCA Holdings, Inc. at December 31, 2010 and 2009, and the consolidatedresults of its operations and its cash flows for each of the three years in the period ended December 31, 2010,in conformity with U.S. generally accepted accounting principles.
We also have audited, in accordance with the standards of the Public Company Accounting OversightBoard (United States), HCA Holdings, Inc.’s internal control over financial reporting as of December 31,2010, based on criteria established in Internal Control — Integrated Framework issued by the Committee ofSponsoring Organizations of the Treadway Commission and our report dated February 17, 2011 expressed anunqualified opinion thereon.
Nashville, TennesseeFebruary 17, 2011, except as to Note 18, as to which the date is , 2011
The foregoing report is in the form that will be signed upon the completion of the 2011 stock split andincrease in authorized shares described in Note 18 to the consolidated financial statements.
/s/ Ernst & Young LLP
Nashville, TNFebruary 22, 2011
F-4
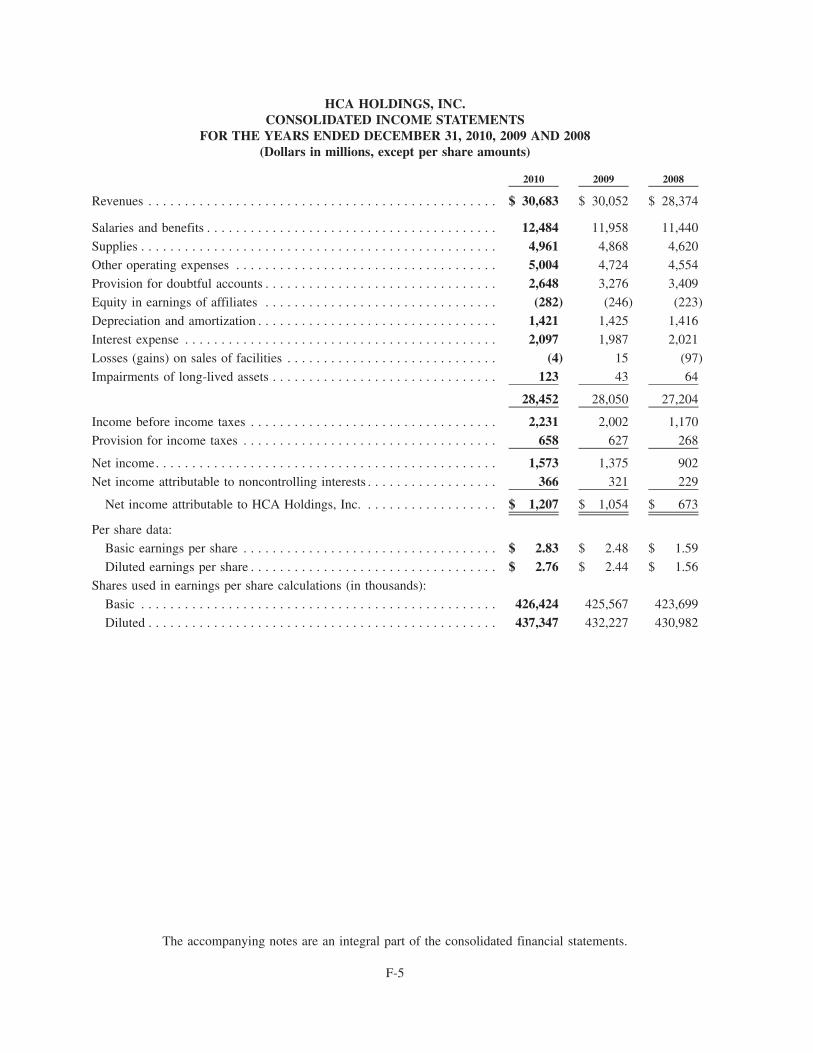
HCA HOLDINGS, INC.CONSOLIDATED INCOME STATEMENTS
FOR THE YEARS ENDED DECEMBER 31, 2010, 2009 AND 2008(Dollars in millions, except per share amounts)
2010 2009 2008
Revenues . . . . . . . . . . . . . . . . . . . . . . . . . . . . . . . . . . . . . . . . . . . . . . . . $ 30,683 $ 30,052 $ 28,374
Salaries and benefits . . . . . . . . . . . . . . . . . . . . . . . . . . . . . . . . . . . . . . . . 12,484 11,958 11,440
Supplies . . . . . . . . . . . . . . . . . . . . . . . . . . . . . . . . . . . . . . . . . . . . . . . . . 4,961 4,868 4,620
Other operating expenses . . . . . . . . . . . . . . . . . . . . . . . . . . . . . . . . . . . . 5,004 4,724 4,554
Provision for doubtful accounts . . . . . . . . . . . . . . . . . . . . . . . . . . . . . . . . 2,648 3,276 3,409
Equity in earnings of affiliates . . . . . . . . . . . . . . . . . . . . . . . . . . . . . . . . (282) (246) (223)
Depreciation and amortization . . . . . . . . . . . . . . . . . . . . . . . . . . . . . . . . . 1,421 1,425 1,416
Interest expense . . . . . . . . . . . . . . . . . . . . . . . . . . . . . . . . . . . . . . . . . . . 2,097 1,987 2,021
Losses (gains) on sales of facilities . . . . . . . . . . . . . . . . . . . . . . . . . . . . . (4) 15 (97)
Impairments of long-lived assets . . . . . . . . . . . . . . . . . . . . . . . . . . . . . . . 123 43 64
28,452 28,050 27,204
Income before income taxes . . . . . . . . . . . . . . . . . . . . . . . . . . . . . . . . . . 2,231 2,002 1,170
Provision for income taxes . . . . . . . . . . . . . . . . . . . . . . . . . . . . . . . . . . . 658 627 268
Net income. . . . . . . . . . . . . . . . . . . . . . . . . . . . . . . . . . . . . . . . . . . . . . . 1,573 1,375 902
Net income attributable to noncontrolling interests . . . . . . . . . . . . . . . . . . 366 321 229
Net income attributable to HCA Holdings, Inc. . . . . . . . . . . . . . . . . . . $ 1,207 $ 1,054 $ 673
Per share data:
Basic earnings per share . . . . . . . . . . . . . . . . . . . . . . . . . . . . . . . . . . . $ 2.83 $ 2.48 $ 1.59
Diluted earnings per share . . . . . . . . . . . . . . . . . . . . . . . . . . . . . . . . . . $ 2.76 $ 2.44 $ 1.56
Shares used in earnings per share calculations (in thousands):
Basic . . . . . . . . . . . . . . . . . . . . . . . . . . . . . . . . . . . . . . . . . . . . . . . . . 426,424 425,567 423,699
Diluted . . . . . . . . . . . . . . . . . . . . . . . . . . . . . . . . . . . . . . . . . . . . . . . . 437,347 432,227 430,982
The accompanying notes are an integral part of the consolidated financial statements.
F-5
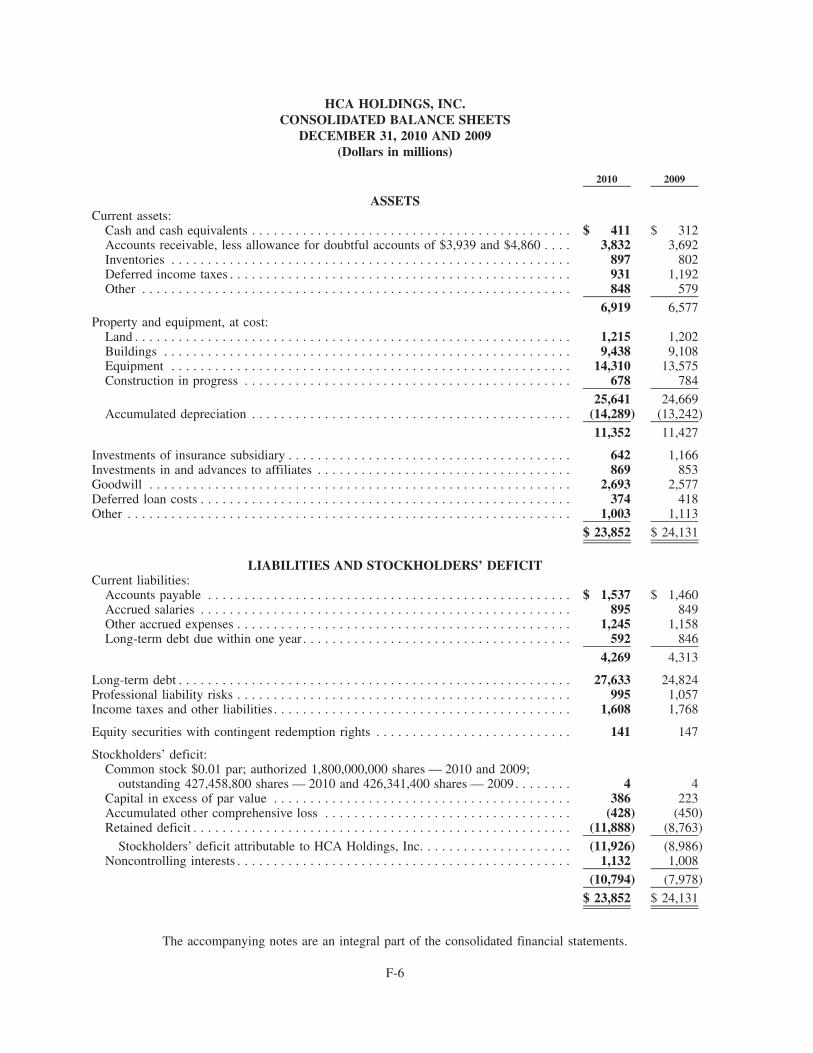
HCA HOLDINGS, INC.CONSOLIDATED BALANCE SHEETS
DECEMBER 31, 2010 AND 2009(Dollars in millions)
2010 2009
ASSETSCurrent assets:
Cash and cash equivalents . . . . . . . . . . . . . . . . . . . . . . . . . . . . . . . . . . . . . . . . . . . . $ 411 $ 312Accounts receivable, less allowance for doubtful accounts of $3,939 and $4,860 . . . . 3,832 3,692Inventories . . . . . . . . . . . . . . . . . . . . . . . . . . . . . . . . . . . . . . . . . . . . . . . . . . . . . . . 897 802Deferred income taxes . . . . . . . . . . . . . . . . . . . . . . . . . . . . . . . . . . . . . . . . . . . . . . . 931 1,192Other . . . . . . . . . . . . . . . . . . . . . . . . . . . . . . . . . . . . . . . . . . . . . . . . . . . . . . . . . . . 848 579
6,919 6,577Property and equipment, at cost:
Land . . . . . . . . . . . . . . . . . . . . . . . . . . . . . . . . . . . . . . . . . . . . . . . . . . . . . . . . . . . . 1,215 1,202Buildings . . . . . . . . . . . . . . . . . . . . . . . . . . . . . . . . . . . . . . . . . . . . . . . . . . . . . . . . 9,438 9,108Equipment . . . . . . . . . . . . . . . . . . . . . . . . . . . . . . . . . . . . . . . . . . . . . . . . . . . . . . . 14,310 13,575Construction in progress . . . . . . . . . . . . . . . . . . . . . . . . . . . . . . . . . . . . . . . . . . . . . 678 784
25,641 24,669Accumulated depreciation . . . . . . . . . . . . . . . . . . . . . . . . . . . . . . . . . . . . . . . . . . . . (14,289) (13,242)
11,352 11,427
Investments of insurance subsidiary . . . . . . . . . . . . . . . . . . . . . . . . . . . . . . . . . . . . . . . 642 1,166Investments in and advances to affiliates . . . . . . . . . . . . . . . . . . . . . . . . . . . . . . . . . . . 869 853Goodwill . . . . . . . . . . . . . . . . . . . . . . . . . . . . . . . . . . . . . . . . . . . . . . . . . . . . . . . . . . 2,693 2,577Deferred loan costs . . . . . . . . . . . . . . . . . . . . . . . . . . . . . . . . . . . . . . . . . . . . . . . . . . . 374 418Other . . . . . . . . . . . . . . . . . . . . . . . . . . . . . . . . . . . . . . . . . . . . . . . . . . . . . . . . . . . . . 1,003 1,113
$ 23,852 $ 24,131
LIABILITIES AND STOCKHOLDERS’ DEFICITCurrent liabilities:
Accounts payable . . . . . . . . . . . . . . . . . . . . . . . . . . . . . . . . . . . . . . . . . . . . . . . . . . $ 1,537 $ 1,460Accrued salaries . . . . . . . . . . . . . . . . . . . . . . . . . . . . . . . . . . . . . . . . . . . . . . . . . . . 895 849Other accrued expenses . . . . . . . . . . . . . . . . . . . . . . . . . . . . . . . . . . . . . . . . . . . . . . 1,245 1,158Long-term debt due within one year . . . . . . . . . . . . . . . . . . . . . . . . . . . . . . . . . . . . . 592 846
4,269 4,313
Long-term debt . . . . . . . . . . . . . . . . . . . . . . . . . . . . . . . . . . . . . . . . . . . . . . . . . . . . . . 27,633 24,824Professional liability risks . . . . . . . . . . . . . . . . . . . . . . . . . . . . . . . . . . . . . . . . . . . . . . 995 1,057Income taxes and other liabilities . . . . . . . . . . . . . . . . . . . . . . . . . . . . . . . . . . . . . . . . . 1,608 1,768
Equity securities with contingent redemption rights . . . . . . . . . . . . . . . . . . . . . . . . . . . 141 147
Stockholders’ deficit:Common stock $0.01 par; authorized 1,800,000,000 shares — 2010 and 2009;
outstanding 427,458,800 shares — 2010 and 426,341,400 shares — 2009. . . . . . . . 4 4Capital in excess of par value . . . . . . . . . . . . . . . . . . . . . . . . . . . . . . . . . . . . . . . . . 386 223Accumulated other comprehensive loss . . . . . . . . . . . . . . . . . . . . . . . . . . . . . . . . . . (428) (450)Retained deficit . . . . . . . . . . . . . . . . . . . . . . . . . . . . . . . . . . . . . . . . . . . . . . . . . . . . (11,888) (8,763)
Stockholders’ deficit attributable to HCA Holdings, Inc. . . . . . . . . . . . . . . . . . . . . (11,926) (8,986)Noncontrolling interests . . . . . . . . . . . . . . . . . . . . . . . . . . . . . . . . . . . . . . . . . . . . . . 1,132 1,008
(10,794) (7,978)
$ 23,852 $ 24,131
The accompanying notes are an integral part of the consolidated financial statements.
F-6
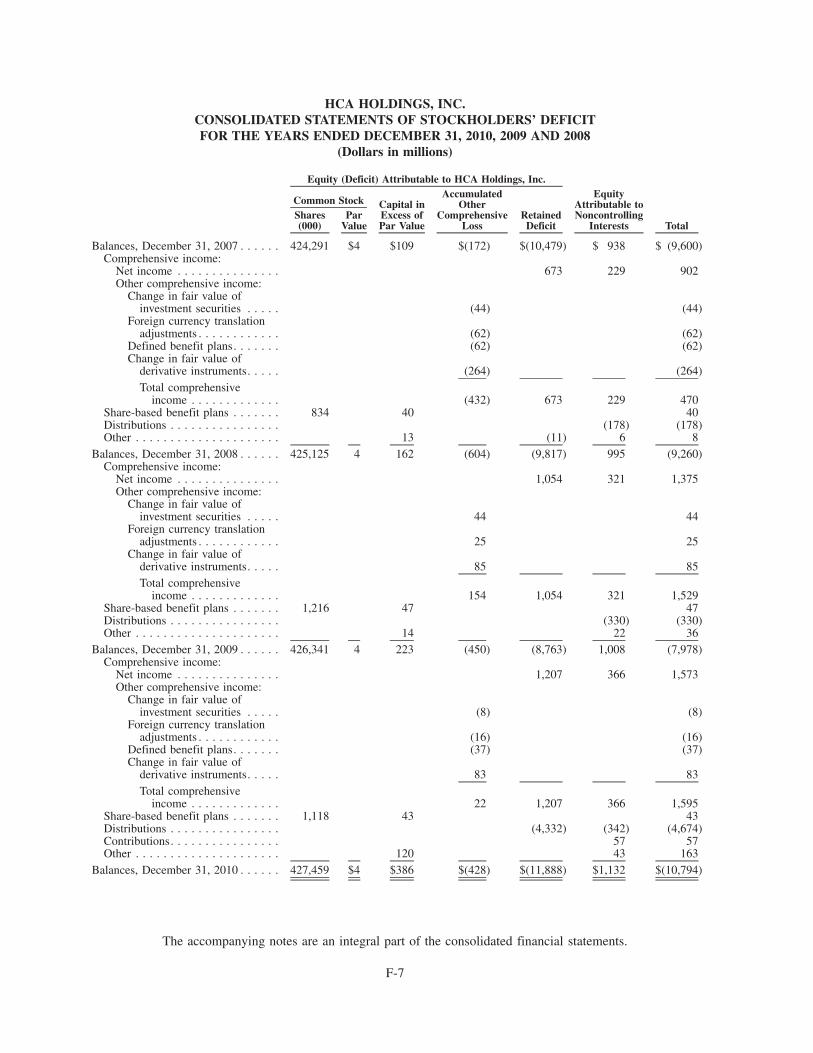
HCA HOLDINGS, INC.CONSOLIDATED STATEMENTS OF STOCKHOLDERS’ DEFICITFOR THE YEARS ENDED DECEMBER 31, 2010, 2009 AND 2008
(Dollars in millions)
Shares(000)
ParValue
Capital inExcess ofPar Value
AccumulatedOther
ComprehensiveLoss
RetainedDeficit
EquityAttributable toNoncontrolling
Interests Total
Common Stock
Equity (Deficit) Attributable to HCA Holdings, Inc.
Balances, December 31, 2007 . . . . . . 424,291 $4 $109 $(172) $(10,479) $ 938 $ (9,600)Comprehensive income:
Net income . . . . . . . . . . . . . . . 673 229 902Other comprehensive income:
Change in fair value ofinvestment securities . . . . . (44) (44)
Foreign currency translationadjustments . . . . . . . . . . . . (62) (62)
Defined benefit plans. . . . . . . (62) (62)Change in fair value of
derivative instruments. . . . . (264) (264)Total comprehensive
income . . . . . . . . . . . . . (432) 673 229 470Share-based benefit plans . . . . . . . 834 40 40Distributions . . . . . . . . . . . . . . . . (178) (178)Other . . . . . . . . . . . . . . . . . . . . . 13 (11) 6 8
Balances, December 31, 2008 . . . . . . 425,125 4 162 (604) (9,817) 995 (9,260)Comprehensive income:
Net income . . . . . . . . . . . . . . . 1,054 321 1,375Other comprehensive income:
Change in fair value ofinvestment securities . . . . . 44 44
Foreign currency translationadjustments . . . . . . . . . . . . 25 25
Change in fair value ofderivative instruments. . . . . 85 85Total comprehensive
income . . . . . . . . . . . . . 154 1,054 321 1,529Share-based benefit plans . . . . . . . 1,216 47 47Distributions . . . . . . . . . . . . . . . . (330) (330)Other . . . . . . . . . . . . . . . . . . . . . 14 22 36
Balances, December 31, 2009 . . . . . . 426,341 4 223 (450) (8,763) 1,008 (7,978)Comprehensive income:
Net income . . . . . . . . . . . . . . . 1,207 366 1,573Other comprehensive income:
Change in fair value ofinvestment securities . . . . . (8) (8)
Foreign currency translationadjustments . . . . . . . . . . . . (16) (16)
Defined benefit plans. . . . . . . (37) (37)Change in fair value of
derivative instruments. . . . . 83 83Total comprehensive
income . . . . . . . . . . . . . 22 1,207 366 1,595Share-based benefit plans . . . . . . . 1,118 43 43Distributions . . . . . . . . . . . . . . . . (4,332) (342) (4,674)Contributions. . . . . . . . . . . . . . . . 57 57Other . . . . . . . . . . . . . . . . . . . . . 120 43 163
Balances, December 31, 2010 . . . . . . 427,459 $4 $386 $(428) $(11,888) $1,132 $(10,794)
The accompanying notes are an integral part of the consolidated financial statements.
F-7
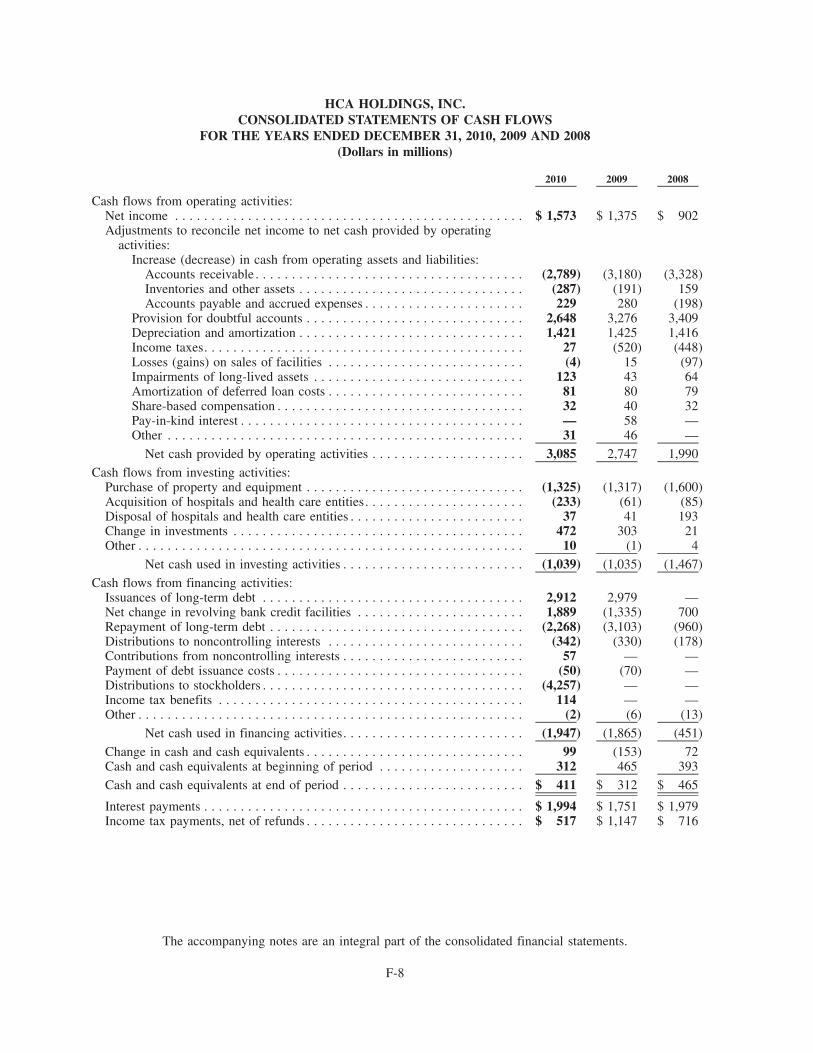
HCA HOLDINGS, INC.CONSOLIDATED STATEMENTS OF CASH FLOWS
FOR THE YEARS ENDED DECEMBER 31, 2010, 2009 AND 2008(Dollars in millions)
2010 2009 2008
Cash flows from operating activities:Net income . . . . . . . . . . . . . . . . . . . . . . . . . . . . . . . . . . . . . . . . . . . . . . . . $ 1,573 $ 1,375 $ 902Adjustments to reconcile net income to net cash provided by operating
activities:Increase (decrease) in cash from operating assets and liabilities:
Accounts receivable . . . . . . . . . . . . . . . . . . . . . . . . . . . . . . . . . . . . . (2,789) (3,180) (3,328)Inventories and other assets . . . . . . . . . . . . . . . . . . . . . . . . . . . . . . . (287) (191) 159Accounts payable and accrued expenses . . . . . . . . . . . . . . . . . . . . . . 229 280 (198)
Provision for doubtful accounts . . . . . . . . . . . . . . . . . . . . . . . . . . . . . . 2,648 3,276 3,409Depreciation and amortization . . . . . . . . . . . . . . . . . . . . . . . . . . . . . . . 1,421 1,425 1,416Income taxes. . . . . . . . . . . . . . . . . . . . . . . . . . . . . . . . . . . . . . . . . . . . 27 (520) (448)Losses (gains) on sales of facilities . . . . . . . . . . . . . . . . . . . . . . . . . . . (4) 15 (97)Impairments of long-lived assets . . . . . . . . . . . . . . . . . . . . . . . . . . . . . 123 43 64Amortization of deferred loan costs . . . . . . . . . . . . . . . . . . . . . . . . . . . 81 80 79Share-based compensation . . . . . . . . . . . . . . . . . . . . . . . . . . . . . . . . . . 32 40 32Pay-in-kind interest . . . . . . . . . . . . . . . . . . . . . . . . . . . . . . . . . . . . . . . — 58 —Other . . . . . . . . . . . . . . . . . . . . . . . . . . . . . . . . . . . . . . . . . . . . . . . . . 31 46 —
Net cash provided by operating activities . . . . . . . . . . . . . . . . . . . . . 3,085 2,747 1,990
Cash flows from investing activities:Purchase of property and equipment . . . . . . . . . . . . . . . . . . . . . . . . . . . . . . (1,325) (1,317) (1,600)Acquisition of hospitals and health care entities. . . . . . . . . . . . . . . . . . . . . . (233) (61) (85)Disposal of hospitals and health care entities . . . . . . . . . . . . . . . . . . . . . . . . 37 41 193Change in investments . . . . . . . . . . . . . . . . . . . . . . . . . . . . . . . . . . . . . . . . 472 303 21Other . . . . . . . . . . . . . . . . . . . . . . . . . . . . . . . . . . . . . . . . . . . . . . . . . . . . . 10 (1) 4
Net cash used in investing activities . . . . . . . . . . . . . . . . . . . . . . . . . (1,039) (1,035) (1,467)
Cash flows from financing activities:Issuances of long-term debt . . . . . . . . . . . . . . . . . . . . . . . . . . . . . . . . . . . . 2,912 2,979 —Net change in revolving bank credit facilities . . . . . . . . . . . . . . . . . . . . . . . 1,889 (1,335) 700Repayment of long-term debt . . . . . . . . . . . . . . . . . . . . . . . . . . . . . . . . . . . (2,268) (3,103) (960)Distributions to noncontrolling interests . . . . . . . . . . . . . . . . . . . . . . . . . . . (342) (330) (178)Contributions from noncontrolling interests . . . . . . . . . . . . . . . . . . . . . . . . . 57 — —Payment of debt issuance costs . . . . . . . . . . . . . . . . . . . . . . . . . . . . . . . . . . (50) (70) —Distributions to stockholders . . . . . . . . . . . . . . . . . . . . . . . . . . . . . . . . . . . . (4,257) — —Income tax benefits . . . . . . . . . . . . . . . . . . . . . . . . . . . . . . . . . . . . . . . . . . 114 — —Other . . . . . . . . . . . . . . . . . . . . . . . . . . . . . . . . . . . . . . . . . . . . . . . . . . . . . (2) (6) (13)
Net cash used in financing activities. . . . . . . . . . . . . . . . . . . . . . . . . (1,947) (1,865) (451)
Change in cash and cash equivalents . . . . . . . . . . . . . . . . . . . . . . . . . . . . . . 99 (153) 72Cash and cash equivalents at beginning of period . . . . . . . . . . . . . . . . . . . . 312 465 393
Cash and cash equivalents at end of period . . . . . . . . . . . . . . . . . . . . . . . . . $ 411 $ 312 $ 465
Interest payments . . . . . . . . . . . . . . . . . . . . . . . . . . . . . . . . . . . . . . . . . . . . $ 1,994 $ 1,751 $ 1,979Income tax payments, net of refunds . . . . . . . . . . . . . . . . . . . . . . . . . . . . . . $ 517 $ 1,147 $ 716
The accompanying notes are an integral part of the consolidated financial statements.
F-8
HCA HOLDINGS, INC.
NOTES TO CONSOLIDATED FINANCIAL STATEMENTS
NOTE 1 — ACCOUNTING POLICIES
Reporting Entity and Corporate Reorganization
On November 17, 2006, HCA Inc. completed its merger (the “Merger”) with Hercules AcquisitionCorporation, pursuant to which the Company was acquired by Hercules Holding II, LLC (“HerculesHolding”), a Delaware limited liability company owned by a private investor group comprised of affiliates of,or funds sponsored by, Bain Capital Partners, LLC, Kohlberg Kravis Roberts & Co., BAML Capital Partners(formerly Merrill Lynch Global Private Equity) (each a “Sponsor”), affiliates of Citigroup Inc. and Bank ofAmerica Corporation (the “Sponsor Assignees”) and affiliates of HCA founder, Dr. Thomas F. Frist Jr., (the“Frist Entities,” and together with the Sponsors and the Sponsor Assignees, the “Investors”), and by membersof management and certain other investors. The Merger, the financing transactions related to the Merger andother related transactions are collectively referred to herein as the “Recapitalization.” The Merger wasaccounted for as a recapitalization in our financial statements, with no adjustments to the historical basis ofour assets and liabilities. As a result of the Recapitalization, our outstanding capital stock is owned by theInvestors, certain members of management and key employees. On April 29, 2008, HCA Inc.’s common stockwas registered pursuant to Section 12(g) of the Securities Exchange Act of 1934, as amended, thus subjectingus to the reporting requirements of Section 13(a) of the Securities Exchange Act of 1934, as amended (the“Exchange Act”). Our common stock is not traded on a national securities exchange.
On November 22, 2010, HCA Inc. reorganized by creating a new holding company structure (the“Corporate Reorganization”). HCA Holdings, Inc. became the new parent company, and HCA Inc. is nowHCA Holdings, Inc.’s wholly-owned direct subsidiary. As part of the Corporate Reorganization, HCA Inc.’soutstanding shares of common stock were automatically converted, on a share for share basis, into identicalshares of HCA Holdings, Inc.’s common stock. HCA Holdings, Inc.’s amended and restated certificate ofincorporation, amended and restated bylaws, executive officers and board of directors are the same as HCAInc.’s in effect immediately prior to the Corporate Reorganization, and the rights, privileges and interests ofHCA Inc.’s stockholders remain the same with respect to HCA Holdings, Inc., as the new holding company.Additionally, as a result of the Corporate Reorganization, HCA Holdings, Inc. was deemed the successorregistrant to HCA Inc. under the Securities and Exchange Act of 1934, as amended, and shares of HCAHoldings, Inc.’s common stock are deemed registered under Section 12(g) of the Exchange Act.
HCA Holdings, Inc. is a holding company whose affiliates own and operate hospitals and related healthcare entities. The term “affiliates” includes direct and indirect subsidiaries of HCA Holdings, Inc. andpartnerships and joint ventures in which such subsidiaries are partners. At December 31, 2010, these affiliatesowned and operated 156 hospitals, 97 freestanding surgery centers and provided extensive outpatient andancillary services. Affiliates of HCA Holdings, Inc. are also partners in joint ventures that own and operateeight hospitals and nine freestanding surgery centers, which are accounted for using the equity method. HCAHoldings, Inc.’s facilities are located in 20 states and England. The terms “Company,” “HCA,” “we,” “our” or“us,” as used herein and unless otherwise stated or indicated by context, refer to HCA Inc. and its affiliatesprior to the Corporate Reorganization and to HCA Holdings, Inc. and its affiliates after the CorporateReorganization. The term “facilities” or “hospitals” refer to entities owned and operated by affiliates of HCAand the term “employees” refers to employees of affiliates of HCA.
Basis of Presentation
The preparation of financial statements in conformity with generally accepted accounting principlesrequires management to make estimates and assumptions that affect the amounts reported in the consolidatedfinancial statements and accompanying notes. Actual results could differ from those estimates.
The consolidated financial statements include all subsidiaries and entities controlled by HCA. Wegenerally define “control” as ownership of a majority of the voting interest of an entity. The consolidated
F-9
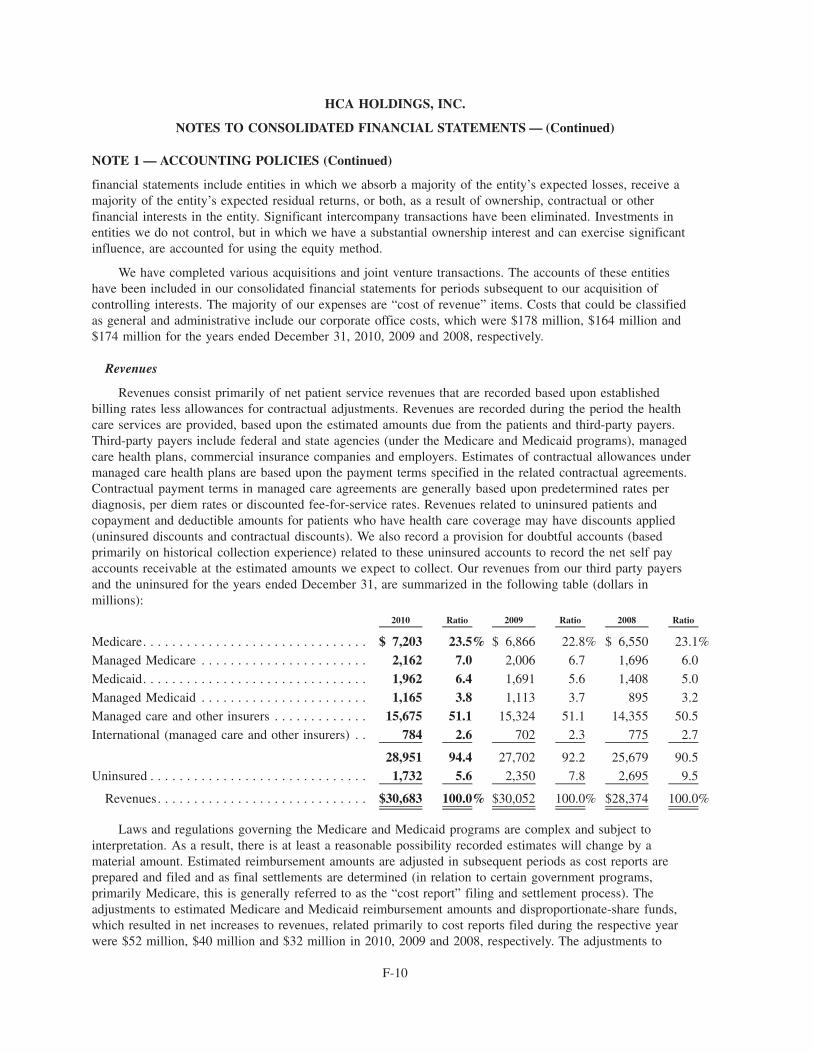
NOTE 1 — ACCOUNTING POLICIES (Continued)
financial statements include entities in which we absorb a majority of the entity’s expected losses, receive amajority of the entity’s expected residual returns, or both, as a result of ownership, contractual or otherfinancial interests in the entity. Significant intercompany transactions have been eliminated. Investments inentities we do not control, but in which we have a substantial ownership interest and can exercise significantinfluence, are accounted for using the equity method.
We have completed various acquisitions and joint venture transactions. The accounts of these entitieshave been included in our consolidated financial statements for periods subsequent to our acquisition ofcontrolling interests. The majority of our expenses are “cost of revenue” items. Costs that could be classifiedas general and administrative include our corporate office costs, which were $178 million, $164 million and$174 million for the years ended December 31, 2010, 2009 and 2008, respectively.
Revenues
Revenues consist primarily of net patient service revenues that are recorded based upon establishedbilling rates less allowances for contractual adjustments. Revenues are recorded during the period the healthcare services are provided, based upon the estimated amounts due from the patients and third-party payers.Third-party payers include federal and state agencies (under the Medicare and Medicaid programs), managedcare health plans, commercial insurance companies and employers. Estimates of contractual allowances undermanaged care health plans are based upon the payment terms specified in the related contractual agreements.Contractual payment terms in managed care agreements are generally based upon predetermined rates perdiagnosis, per diem rates or discounted fee-for-service rates. Revenues related to uninsured patients andcopayment and deductible amounts for patients who have health care coverage may have discounts applied(uninsured discounts and contractual discounts). We also record a provision for doubtful accounts (basedprimarily on historical collection experience) related to these uninsured accounts to record the net self payaccounts receivable at the estimated amounts we expect to collect. Our revenues from our third party payersand the uninsured for the years ended December 31, are summarized in the following table (dollars inmillions):
2010 Ratio 2009 Ratio 2008 Ratio
Medicare. . . . . . . . . . . . . . . . . . . . . . . . . . . . . . . $ 7,203 23.5% $ 6,866 22.8% $ 6,550 23.1%
Managed Medicare . . . . . . . . . . . . . . . . . . . . . . . 2,162 7.0 2,006 6.7 1,696 6.0
Medicaid. . . . . . . . . . . . . . . . . . . . . . . . . . . . . . . 1,962 6.4 1,691 5.6 1,408 5.0
Managed Medicaid . . . . . . . . . . . . . . . . . . . . . . . 1,165 3.8 1,113 3.7 895 3.2
Managed care and other insurers . . . . . . . . . . . . . 15,675 51.1 15,324 51.1 14,355 50.5
International (managed care and other insurers) . . 784 2.6 702 2.3 775 2.7
28,951 94.4 27,702 92.2 25,679 90.5Uninsured . . . . . . . . . . . . . . . . . . . . . . . . . . . . . . 1,732 5.6 2,350 7.8 2,695 9.5
Revenues. . . . . . . . . . . . . . . . . . . . . . . . . . . . . $30,683 100.0% $30,052 100.0% $28,374 100.0%
Laws and regulations governing the Medicare and Medicaid programs are complex and subject tointerpretation. As a result, there is at least a reasonable possibility recorded estimates will change by amaterial amount. Estimated reimbursement amounts are adjusted in subsequent periods as cost reports areprepared and filed and as final settlements are determined (in relation to certain government programs,primarily Medicare, this is generally referred to as the “cost report” filing and settlement process). Theadjustments to estimated Medicare and Medicaid reimbursement amounts and disproportionate-share funds,which resulted in net increases to revenues, related primarily to cost reports filed during the respective yearwere $52 million, $40 million and $32 million in 2010, 2009 and 2008, respectively. The adjustments to
F-10
HCA HOLDINGS, INC.
NOTES TO CONSOLIDATED FINANCIAL STATEMENTS — (Continued)
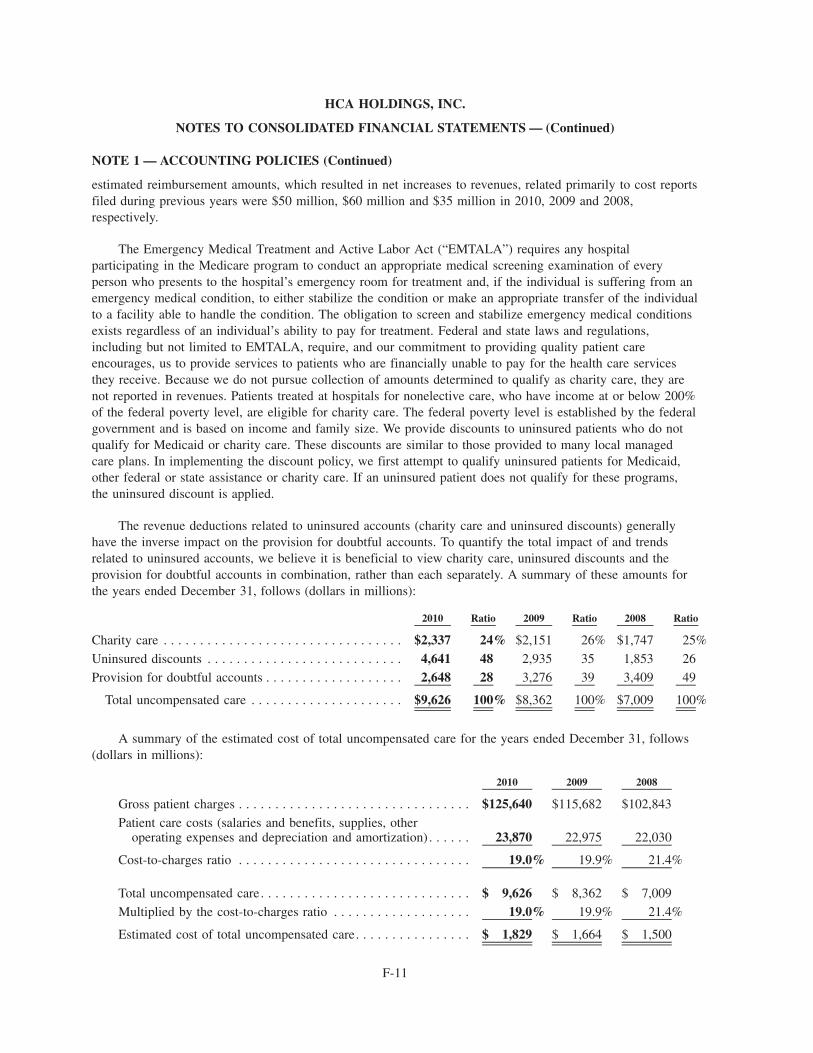
NOTE 1 — ACCOUNTING POLICIES (Continued)
estimated reimbursement amounts, which resulted in net increases to revenues, related primarily to cost reportsfiled during previous years were $50 million, $60 million and $35 million in 2010, 2009 and 2008,respectively.
The Emergency Medical Treatment and Active Labor Act (“EMTALA”) requires any hospitalparticipating in the Medicare program to conduct an appropriate medical screening examination of everyperson who presents to the hospital’s emergency room for treatment and, if the individual is suffering from anemergency medical condition, to either stabilize the condition or make an appropriate transfer of the individualto a facility able to handle the condition. The obligation to screen and stabilize emergency medical conditionsexists regardless of an individual’s ability to pay for treatment. Federal and state laws and regulations,including but not limited to EMTALA, require, and our commitment to providing quality patient careencourages, us to provide services to patients who are financially unable to pay for the health care servicesthey receive. Because we do not pursue collection of amounts determined to qualify as charity care, they arenot reported in revenues. Patients treated at hospitals for nonelective care, who have income at or below 200%of the federal poverty level, are eligible for charity care. The federal poverty level is established by the federalgovernment and is based on income and family size. We provide discounts to uninsured patients who do notqualify for Medicaid or charity care. These discounts are similar to those provided to many local managedcare plans. In implementing the discount policy, we first attempt to qualify uninsured patients for Medicaid,other federal or state assistance or charity care. If an uninsured patient does not qualify for these programs,the uninsured discount is applied.
The revenue deductions related to uninsured accounts (charity care and uninsured discounts) generallyhave the inverse impact on the provision for doubtful accounts. To quantify the total impact of and trendsrelated to uninsured accounts, we believe it is beneficial to view charity care, uninsured discounts and theprovision for doubtful accounts in combination, rather than each separately. A summary of these amounts forthe years ended December 31, follows (dollars in millions):
2010 Ratio 2009 Ratio 2008 Ratio
Charity care . . . . . . . . . . . . . . . . . . . . . . . . . . . . . . . . . $2,337 24% $2,151 26% $1,747 25%
Uninsured discounts . . . . . . . . . . . . . . . . . . . . . . . . . . . 4,641 48 2,935 35 1,853 26
Provision for doubtful accounts . . . . . . . . . . . . . . . . . . . 2,648 28 3,276 39 3,409 49
Total uncompensated care . . . . . . . . . . . . . . . . . . . . . $9,626 100% $8,362 100% $7,009 100%
A summary of the estimated cost of total uncompensated care for the years ended December 31, follows(dollars in millions):
2010 2009 2008
Gross patient charges . . . . . . . . . . . . . . . . . . . . . . . . . . . . . . . . $125,640 $115,682 $102,843
Patient care costs (salaries and benefits, supplies, otheroperating expenses and depreciation and amortization) . . . . . . 23,870 22,975 22,030
Cost-to-charges ratio . . . . . . . . . . . . . . . . . . . . . . . . . . . . . . . . 19.0% 19.9% 21.4%
Total uncompensated care. . . . . . . . . . . . . . . . . . . . . . . . . . . . . $ 9,626 $ 8,362 $ 7,009
Multiplied by the cost-to-charges ratio . . . . . . . . . . . . . . . . . . . 19.0% 19.9% 21.4%
Estimated cost of total uncompensated care. . . . . . . . . . . . . . . . $ 1,829 $ 1,664 $ 1,500
F-11
HCA HOLDINGS, INC.
NOTES TO CONSOLIDATED FINANCIAL STATEMENTS — (Continued)
NOTE 1 — ACCOUNTING POLICIES (Continued)
The sum of charity care, uninsured discounts and the provision for doubtful accounts, as a percentage ofthe sum of revenues, uninsured discounts and charity care increased from 21.9% for 2008, to 23.8% for 2009and to 25.6% for 2010.
The trend of the three components of uncompensated care indicate that our decision to increase ouruninsured discounts has resulted in the provision for doubtful accounts declining from 49% of totaluncompensated care for 2008 to 28% of total uncompensated care for 2010, and uninsured discounts haveincreased from 26% of total uncompensated care for 2008 to 48% of total uncompensated care for 2010.
Cash and Cash Equivalents
Cash and cash equivalents include highly liquid investments with a maturity of three months or less whenpurchased. Our insurance subsidiary’s cash equivalent investments in excess of the amounts required to payestimated professional liability claims during the next twelve months are not included in cash and cashequivalents as these funds are not available for general corporate purposes. Carrying values of cash and cashequivalents approximate fair value due to the short-term nature of these instruments.
Our cash management system provides for daily investment of available balances and the funding ofoutstanding checks when presented for payment. Outstanding, but unpresented, checks totaling $384 millionand $392 million at December 31, 2010 and 2009, respectively, have been included in “accounts payable” inthe consolidated balance sheets. Upon presentation for payment, these checks are funded through availablecash balances or our credit facility.
Accounts Receivable
We receive payments for services rendered from federal and state agencies (under the Medicare andMedicaid programs), managed care health plans, commercial insurance companies, employers and patients. Werecognize that revenues and receivables from government agencies are significant to our operations, but do notbelieve there are significant credit risks associated with these government agencies. We do not believe thereare any other significant concentrations of revenues from any particular payer that would subject us to anysignificant credit risks in the collection of our accounts receivable.
Additions to the allowance for doubtful accounts are made by means of the provision for doubtfulaccounts. Accounts written off as uncollectible are deducted from the allowance for doubtful accounts andsubsequent recoveries are added. The amount of the provision for doubtful accounts is based uponmanagement’s assessment of historical and expected net collections, business and economic conditions, trendsin federal, state and private employer health care coverage and other collection indicators. The provision fordoubtful accounts and the allowance for doubtful accounts relate to “uninsured” amounts (includingcopayment and deductible amounts from patients who have health care coverage) due directly from patients.Accounts are written off when all reasonable internal and external collection efforts have been performed. Weconsider the return of an account from the secondary external collection agency to be the culmination of ourreasonable collection efforts and the timing basis for writing off the account balance. Writeoffs are based uponspecific identification and the writeoff process requires a writeoff adjustment entry to the patient accountingsystem. Management relies on the results of detailed reviews of historical writeoffs and recoveries at facilitiesthat represent a majority of our revenues and accounts receivable (the “hindsight analysis”) as a primarysource of information to utilize in estimating the collectibility of our accounts receivable. We perform thehindsight analysis quarterly, utilizing rolling twelve-months accounts receivable collection and writeoff data.At December 31, 2010 and 2009, the allowance for doubtful accounts represented approximately 93% and94%, respectively, of the $4.249 billion and $5.176 billion, respectively, patient due accounts receivablebalance. The patient due accounts receivable balance represents the estimated uninsured portion of our
F-12
HCA HOLDINGS, INC.
NOTES TO CONSOLIDATED FINANCIAL STATEMENTS — (Continued)
NOTE 1 — ACCOUNTING POLICIES (Continued)
accounts receivable. The estimated uninsured portion of Medicaid pending and uninsured discount pendingaccounts is included in our patient due accounts receivable balance. Days revenues in accounts receivable were46 days, 45 days and 49 days at December 31, 2010, 2009 and 2008, respectively. Adverse changes in generaleconomic conditions, patient accounting service center operations, payer mix or trends in federal or stategovernmental health care coverage could affect our collection of accounts receivable, cash flows and results ofoperations.
Inventories
Inventories are stated at the lower of cost (first-in, first-out) or market.
Property and Equipment and Amortizable Intangibles
Depreciation expense, computed using the straight-line method, was $1.416 billion in 2010,$1.419 billion in 2009 and $1.412 billion in 2008. Buildings and improvements are depreciated over estimateduseful lives ranging generally from 10 to 40 years. Estimated useful lives of equipment vary generally fromfour to 10 years.
Debt issuance costs are amortized based upon the terms of the respective debt obligations. The grosscarrying amount of deferred loan costs at December 31, 2010 and 2009 was $712 million and $689 million,respectively, and accumulated amortization was $338 million and $271 million, respectively. Amortization ofdeferred loan costs is included in interest expense and was $81 million, $80 million and $79 million for 2010,2009 and 2008, respectively.
When events, circumstances or operating results indicate the carrying values of certain long-lived assetsand related identifiable intangible assets (excluding goodwill) expected to be held and used, might beimpaired, we prepare projections of the undiscounted future cash flows expected to result from the use of theassets and their eventual disposition. If the projections indicate the recorded amounts are not expected to berecoverable, such amounts are reduced to estimated fair value. Fair value may be estimated based uponinternal evaluations that include quantitative analyses of revenues and cash flows, reviews of recent sales ofsimilar facilities and independent appraisals.
Long-lived assets to be disposed of are reported at the lower of their carrying amounts or fair value lesscosts to sell or close. The estimates of fair value are usually based upon recent sales of similar assets andmarket responses based upon discussions with and offers received from potential buyers.
Investments of Insurance Subsidiary
At December 31, 2010 and 2009, the investments of our wholly-owned insurance subsidiary wereclassified as “available-for-sale” as defined in Accounting Standards Codification (“ASC”) No. 320,Investments — Debt and Equity Securities and are recorded at fair value. The investment securities are held forthe purpose of providing the funding source to pay professional liability claims covered by the insurancesubsidiary. We perform a quarterly assessment of individual investment securities to determine whetherdeclines in market value are temporary or other-than-temporary. Our investment securities evaluation processinvolves multiple subjective judgments, often involves estimating the outcome of future events, and requires asignificant level of professional judgment in determining whether an impairment has occurred. We evaluate,among other things, the financial position and near term prospects of the issuer, conditions in the issuer’sindustry, liquidity of the investment, changes in the amount or timing of expected future cash flows from theinvestment, and recent downgrades of the issuer by a rating agency, to determine if, and when, a decline in thefair value of an investment below amortized cost is considered other-than-temporary. The length of time andextent to which the fair value of the investment is less than amortized cost and our ability and intent to retain
F-13
HCA HOLDINGS, INC.
NOTES TO CONSOLIDATED FINANCIAL STATEMENTS — (Continued)
NOTE 1 — ACCOUNTING POLICIES (Continued)
the investment, to allow for any anticipated recovery of the investment’s fair value, are important componentsof our investment securities evaluation process.
Goodwill
Goodwill is not amortized, but is subject to annual impairment tests. In addition to the annual impairmentreview, impairment reviews are performed whenever circumstances indicate a possible impairment may exist.Impairment testing for goodwill is done at the reporting unit level. Reporting units are one level below thebusiness segment level, and our impairment testing is performed at the operating division or market level. Wecompare the fair value of the reporting unit assets to the carrying amount, on at least an annual basis, todetermine if there is potential impairment. If the fair value of the reporting unit assets is less than theircarrying value, we compare the fair value of the goodwill to its carrying value. If the fair value of thegoodwill is less than its carrying value, an impairment loss is recognized. Fair value of goodwill is estimatedbased upon internal evaluations of the related long-lived assets for each reporting unit that include quantitativeanalyses of revenues and cash flows and reviews of recent sales of similar facilities. We recognized goodwillimpairments of $14 million, $19 million and $48 million during 2010, 2009 and 2008, respectively.
During 2010, goodwill increased by $125 million related to acquisitions, declined by $14 million relatedto impairments and increased by $5 million related to foreign currency translation and other adjustments.During 2009, goodwill increased by $5 million related to acquisitions, decreased by $19 million related toimpairments and increased by $11 million related to foreign currency translation and other adjustments.
Since January 1, 2000, we have recognized total goodwill impairments of $102 million in the aggregate.None of the goodwill impairments related to evaluations of goodwill at the reporting unit level, as allrecognized goodwill impairments during this period related to goodwill allocated to asset disposal groups.
Physician Recruiting Agreements
In order to recruit physicians to meet the needs of our hospitals and the communities they serve, we enterinto minimum revenue guarantee arrangements to assist the recruited physicians during the period they arerelocating and establishing their practices. A guarantor is required to recognize, at the inception of aguarantee, a liability for the fair value of the stand-ready obligation undertaken in issuing the guarantee. Weexpense the total estimated guarantee liability amount at the time the physician recruiting agreement becomeseffective as we are not able to justify recording a contract-based asset based upon our analysis of the relatedcontrol, regulatory and legal considerations.
The physician recruiting liability amounts of $15 million and $24 million at December 31, 2010 and2009, respectively, represent the amount of expense recognized in excess of payments made throughDecember 31, 2010 and 2009, respectively. At December 31, 2010 the maximum amount we could have topay under all effective minimum revenue guarantees was $48 million.
Professional Liability Claims
Reserves for professional liability risks were $1.262 billion and $1.322 billion at December 31, 2010 and2009, respectively. The current portion of the reserves, $268 million and $265 million at December 31, 2010and 2009, respectively, is included in “other accrued expenses” in the consolidated balance sheets. Provisionsfor losses related to professional liability risks were $222 million, $211 million and $175 million for 2010,2009 and 2008, respectively, and are included in “other operating expenses” in our consolidated incomestatements. Provisions for losses related to professional liability risks are based upon actuarially determinedestimates. Loss and loss expense reserves represent the estimated ultimate net cost of all reported andunreported losses incurred through the respective consolidated balance sheet dates. The reserves for unpaid
F-14
HCA HOLDINGS, INC.
NOTES TO CONSOLIDATED FINANCIAL STATEMENTS — (Continued)
NOTE 1 — ACCOUNTING POLICIES (Continued)
losses and loss expenses are estimated using individual case-basis valuations and actuarial analyses. Thoseestimates are subject to the effects of trends in loss severity and frequency. The estimates are continuallyreviewed and adjustments are recorded as experience develops or new information becomes known.Adjustments to the estimated reserve amounts are included in current operating results. The reserves forprofessional liability risks cover approximately 2,700 and 2,600 individual claims at December 31, 2010 and2009, respectively, and estimates for unreported potential claims. The time period required to resolve theseclaims can vary depending upon the jurisdiction and whether the claim is settled or litigated. During 2010 and2009, $243 million and $272 million, respectively, of net payments were made for professional and generalliability claims. The estimation of the timing of payments beyond a year can vary significantly. Althoughconsiderable variability is inherent in professional liability reserve estimates, we believe the reserves for lossesand loss expenses are adequate; however, there can be no assurance the ultimate liability will not exceed ourestimates.
A portion of our professional liability risks is insured through a wholly-owned insurance subsidiary.Subject to a $5 million per occurrence self-insured retention, our facilities are insured by our wholly-ownedinsurance subsidiary for losses up to $50 million per occurrence. The insurance subsidiary has obtainedreinsurance for professional liability risks generally above a retention level of $15 million per occurrence. Wealso maintain professional liability insurance with unrelated commercial carriers for losses in excess ofamounts insured by our insurance subsidiary.
The obligations covered by reinsurance contracts are included in the reserves for professional liabilityrisks, as the insurance subsidiary remains liable to the extent the reinsurers do not meet their obligations underthe reinsurance contracts. The amounts receivable under the reinsurance contracts include $11 million and$28 million at December 31, 2010 and 2009, respectively, recorded in “other assets” and $3 million and$25 million at December 31, 2010 and 2009, respectively, recorded in “other current assets”.
Financial Instruments
Derivative financial instruments are employed to manage risks, including interest rate and foreigncurrency exposures, and are not used for trading or speculative purposes. We recognize derivative instruments,such as interest rate swap agreements and foreign exchange contracts, in the consolidated balance sheets atfair value. Changes in the fair value of derivatives are recognized periodically either in earnings or instockholders’ equity, as a component of other comprehensive income (loss), depending on whether thederivative financial instrument qualifies for hedge accounting, and if so, whether it qualifies as a fair valuehedge or a cash flow hedge. Generally, changes in fair values of derivatives accounted for as fair value hedgesare recorded in earnings, along with the changes in the fair value of the hedged items related to the hedgedrisk. Gains and losses on derivatives designated as cash flow hedges, to the extent they are effective, arerecorded in other comprehensive income (loss), and subsequently reclassified to earnings to offset the impactof the forecasted transactions when they occur. In the event the forecasted transaction to which a cash flowhedge relates is no longer likely, the amount in other comprehensive income (loss) is recognized in earningsand generally the derivative is terminated. Changes in the fair value of derivatives not qualifying as hedges,and for any portion of a hedge that is ineffective, are reported in earnings.
The net interest paid or received on interest rate swaps is recognized as interest expense. Gains and lossesresulting from the early termination of interest rate swap agreements are deferred and amortized asadjustments to interest expense over the remaining term of the debt originally covered by the terminated swap.
F-15
HCA HOLDINGS, INC.
NOTES TO CONSOLIDATED FINANCIAL STATEMENTS — (Continued)
NOTE 1 — ACCOUNTING POLICIES (Continued)
Noncontrolling Interests in Consolidated Entities
The consolidated financial statements include all assets, liabilities, revenues and expenses of less than100% owned entities that we control. Accordingly, we have recorded noncontrolling interests in the earningsand equity of such entities.
Related Party Transactions — Management Agreement
Affiliates of the Investors entered into a management agreement with us pursuant to which such affiliateswill provide us with management services. Under the management agreement, the affiliates of the Investorsare entitled to receive an aggregate annual management fee of $15 million, which amount increases annuallyat a rate equal to the percentage increase in Adjusted EBITDA (as defined in the Management Agreement) inthe applicable year compared to the preceding year, and reimbursement of out-of-pocket expenses incurred inconnection with the provision of services pursuant to the agreement. The annual management fee was$18 million for 2010 and $15 million for both 2009 and 2008. The management agreement has an initial termexpiring on December 31, 2016, provided that the term will be extended annually for one additional yearunless we or the Investors provide notice to the other of their desire not to automatically extend the term. Inaddition, the management agreement provides that the affiliates of the Investors are entitled to receive a feeequal to 1% of the gross transaction value in connection with certain financing, acquisition, disposition, andchange of control transactions, as well as a termination fee based on the net present value of future paymentobligations under the management agreement in the event of an initial public offering or under certain othercircumstances. The agreement also contains customary exculpation and indemnification provisions in favor ofthe Investors and their affiliates.
NOTE 2 — SHARE-BASED COMPENSATION
Certain management holders of outstanding HCA stock options retained certain of their stock options (the“Rollover Options”) in lieu of receiving the Merger consideration. The Rollover Options remain outstanding inaccordance with the terms of the governing stock incentive plans and grant agreements pursuant to which theholder originally received the stock option grants, except the exercise price and number of shares subject tothe rollover option agreement were adjusted so that the aggregate intrinsic value for each applicable optionholder was maintained and the exercise price for substantially all the options was adjusted to $2.83 per option.Pursuant to the rollover option agreement, 49,408,100 prerecapitalization HCA stock options were convertedinto 10,294,500 Rollover Options, of which 4,603,500 are outstanding and exercisable at December 31, 2010.
2006 Stock Incentive Plan
The 2006 Stock Incentive Plan for Key Employees of HCA Holdings Inc. and its Affiliates (the “2006Plan”) is designed to promote the long term financial interests and growth of the Company and its subsidiariesby attracting and retaining management and other personnel and key service providers and to motivatemanagement personnel by means of incentives to achieve long range goals and further the alignment ofinterests of participants with those of our stockholders through opportunities for increased stock, or stock-based, ownership in the Company. A portion of the options under the 2006 Plan vests solely based uponcontinued employment over a specific period of time, and a portion of the options vests based both uponcontinued employment over a specific period of time and upon the achievement of predetermined financialand Investor return targets over time. We granted 964,000 and 8,044,600 options under the 2006 Plan during2010 and 2009, respectively. As of December 31, 2010, 20,247,500 options granted under the 2006 Plan havevested, of which 19,231,300 are outstanding and exercisable, and there were 1,497,200 shares available forfuture grants under the 2006 Plan.
F-16
HCA HOLDINGS, INC.
NOTES TO CONSOLIDATED FINANCIAL STATEMENTS — (Continued)
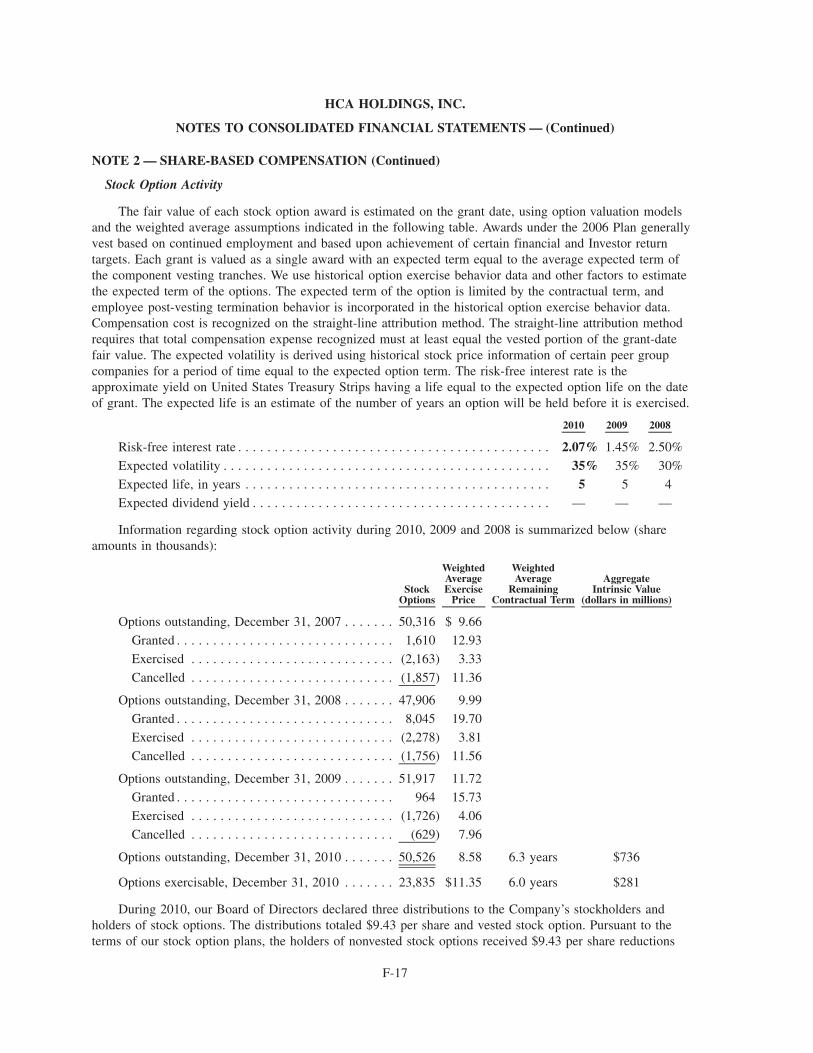
NOTE 2 — SHARE-BASED COMPENSATION (Continued)
Stock Option Activity
The fair value of each stock option award is estimated on the grant date, using option valuation modelsand the weighted average assumptions indicated in the following table. Awards under the 2006 Plan generallyvest based on continued employment and based upon achievement of certain financial and Investor returntargets. Each grant is valued as a single award with an expected term equal to the average expected term ofthe component vesting tranches. We use historical option exercise behavior data and other factors to estimatethe expected term of the options. The expected term of the option is limited by the contractual term, andemployee post-vesting termination behavior is incorporated in the historical option exercise behavior data.Compensation cost is recognized on the straight-line attribution method. The straight-line attribution methodrequires that total compensation expense recognized must at least equal the vested portion of the grant-datefair value. The expected volatility is derived using historical stock price information of certain peer groupcompanies for a period of time equal to the expected option term. The risk-free interest rate is theapproximate yield on United States Treasury Strips having a life equal to the expected option life on the dateof grant. The expected life is an estimate of the number of years an option will be held before it is exercised.
2010 2009 2008
Risk-free interest rate . . . . . . . . . . . . . . . . . . . . . . . . . . . . . . . . . . . . . . . . . . . 2.07% 1.45% 2.50%
Expected volatility . . . . . . . . . . . . . . . . . . . . . . . . . . . . . . . . . . . . . . . . . . . . . 35% 35% 30%
Expected life, in years . . . . . . . . . . . . . . . . . . . . . . . . . . . . . . . . . . . . . . . . . . 5 5 4
Expected dividend yield . . . . . . . . . . . . . . . . . . . . . . . . . . . . . . . . . . . . . . . . . — — —
Information regarding stock option activity during 2010, 2009 and 2008 is summarized below (shareamounts in thousands):
StockOptions
WeightedAverageExercise
Price
WeightedAverage
RemainingContractual Term
AggregateIntrinsic Value
(dollars in millions)
Options outstanding, December 31, 2007 . . . . . . . 50,316 $ 9.66
Granted . . . . . . . . . . . . . . . . . . . . . . . . . . . . . . 1,610 12.93
Exercised . . . . . . . . . . . . . . . . . . . . . . . . . . . . (2,163) 3.33
Cancelled . . . . . . . . . . . . . . . . . . . . . . . . . . . . (1,857) 11.36
Options outstanding, December 31, 2008 . . . . . . . 47,906 9.99Granted . . . . . . . . . . . . . . . . . . . . . . . . . . . . . . 8,045 19.70
Exercised . . . . . . . . . . . . . . . . . . . . . . . . . . . . (2,278) 3.81
Cancelled . . . . . . . . . . . . . . . . . . . . . . . . . . . . (1,756) 11.56
Options outstanding, December 31, 2009 . . . . . . . 51,917 11.72
Granted . . . . . . . . . . . . . . . . . . . . . . . . . . . . . . 964 15.73
Exercised . . . . . . . . . . . . . . . . . . . . . . . . . . . . (1,726) 4.06
Cancelled . . . . . . . . . . . . . . . . . . . . . . . . . . . . (629) 7.96
Options outstanding, December 31, 2010 . . . . . . . 50,526 8.58 6.3 years $736
Options exercisable, December 31, 2010 . . . . . . . 23,835 $11.35 6.0 years $281
During 2010, our Board of Directors declared three distributions to the Company’s stockholders andholders of stock options. The distributions totaled $9.43 per share and vested stock option. Pursuant to theterms of our stock option plans, the holders of nonvested stock options received $9.43 per share reductions
F-17
HCA HOLDINGS, INC.
NOTES TO CONSOLIDATED FINANCIAL STATEMENTS — (Continued)
NOTE 2 — SHARE-BASED COMPENSATION (Continued)
(subject to certain tax related limitations for certain stock options that resulted in deferred distributions for aportion of the declared distribution, which will be paid upon the vesting of the applicable stock options) to theexercise price of the share-based awards.
The weighted average fair values of stock options granted during 2010, 2009 and 2008 were $7.13, $3.54and $3.11 per share, respectively. The total intrinsic value of stock options exercised in the year endedDecember 31, 2010 was $32 million. As of December 31, 2010, the unrecognized compensation cost relatedto nonvested awards was $44 million.
NOTE 3 — ACQUISITIONS AND DISPOSITIONS
During 2010, we paid $163 million to acquire two hospitals and $70 million to acquire other health careentities. During 2009, we paid $61 million to acquire nonhospital health care entities. During 2008, we paid$18 million to acquire one hospital and $67 million to acquire other health care entities. Purchase priceamounts have been allocated to the related assets acquired and liabilities assumed based upon their respectivefair values. The purchase price paid in excess of the fair value of identifiable net assets of acquired entitiesaggregated $125 million, $5 million and $43 million in 2010, 2009 and 2008, respectively. The consolidatedfinancial statements include the accounts and operations of the acquired entities subsequent to the respectiveacquisition dates. The pro forma effects of the acquired entities on our results of operations for periods priorto the respective acquisition dates were not significant.
During 2010, we received proceeds of $37 million and recognized a net pretax gain of $4 million($2 million after tax) from sales of nonhospital health care entities and real estate investments. During 2009,we received proceeds of $3 million and recognized a net pretax loss of $8 million ($5 million after tax) on thesales of three hospitals. We also received proceeds of $38 million and recognized a net pretax loss of$7 million ($4 million after tax) from sales of other health care entities and real estate investments. During2008, we received proceeds of $143 million and recognized a net pretax gain of $81 million ($48 million aftertax) from the sales of two hospitals. We also received proceeds of $50 million and recognized a net pretaxgain of $16 million ($10 million after tax) from sales of other health care entities and real estate investments.
NOTE 4 — IMPAIRMENTS OF LONG-LIVED ASSETS
During 2010, we recorded pretax charges of $123 million to reduce the carrying value of identified assetsto estimated fair value. The $123 million asset impairment includes $57 million related to a hospital facility inour Central Group, $5 million related to other health care entity investments in our Eastern Group, $17 millionrelated to a hospital facility in our Western Group and $44 million related to Corporate and other, whichincludes $35 million for the writeoff of capitalized engineering and design costs related to certain buildingsafety requirements (California earthquake standards) that have been revised. During 2009, we recorded pretaxcharges of $43 million to reduce the carrying value of identified assets to estimated fair value. The$43 million asset impairment includes $15 million related to certain hospital facilities and other health careentity investments in our Central Group, $14 million related to other health care entity investments in ourEastern Group and $14 million related to certain hospital facilities in our Western Group. During 2008, werecorded pretax charges of $64 million to reduce the carrying value of identified assets to estimated fair value.The $64 million asset impairment includes $55 million related to other health care entity investments in ourEastern Group and $9 million related to certain hospital facilities in our Central Group.
The asset impairment charges did not have a significant impact on our operations or cash flows and arenot expected to significantly impact cash flows for future periods. The impairment charges affected ourproperty and equipment asset category by $109 million, $24 million and $16 million in 2010, 2009 and 2008,respectively.
F-18
HCA HOLDINGS, INC.
NOTES TO CONSOLIDATED FINANCIAL STATEMENTS — (Continued)
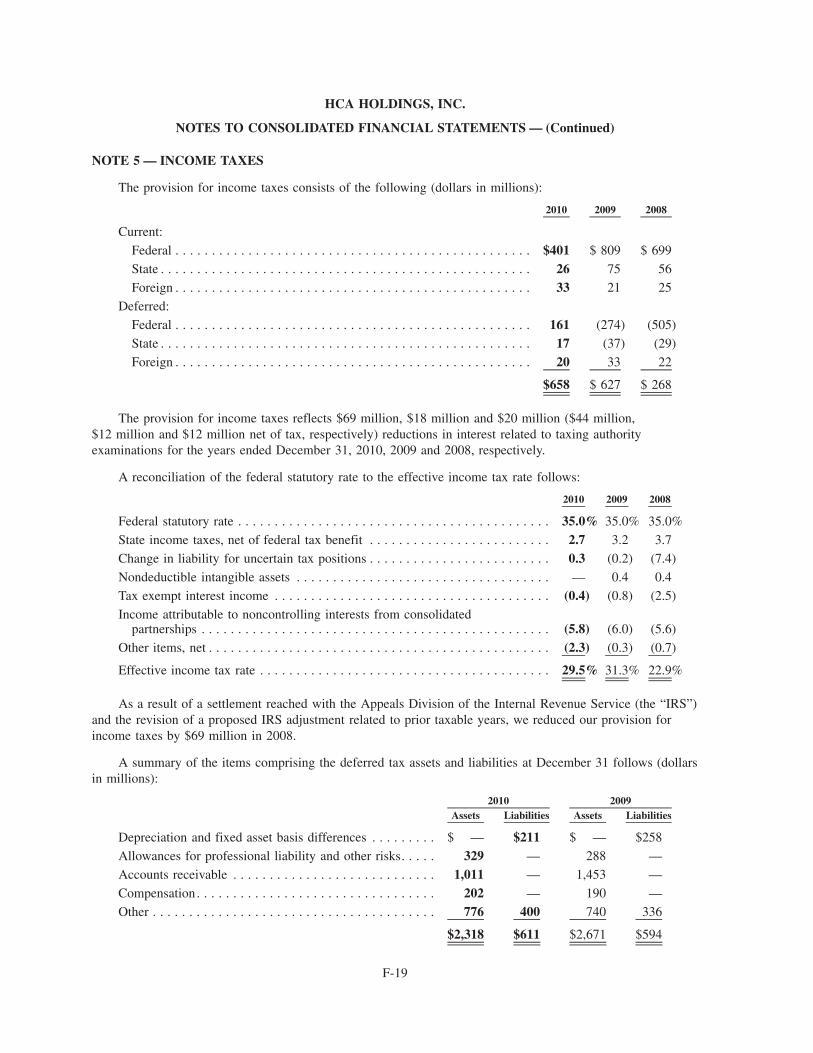
NOTE 5 — INCOME TAXES
The provision for income taxes consists of the following (dollars in millions):
2010 2009 2008
Current:
Federal . . . . . . . . . . . . . . . . . . . . . . . . . . . . . . . . . . . . . . . . . . . . . . . . . $401 $ 809 $ 699
State . . . . . . . . . . . . . . . . . . . . . . . . . . . . . . . . . . . . . . . . . . . . . . . . . . . 26 75 56
Foreign . . . . . . . . . . . . . . . . . . . . . . . . . . . . . . . . . . . . . . . . . . . . . . . . . 33 21 25
Deferred:
Federal . . . . . . . . . . . . . . . . . . . . . . . . . . . . . . . . . . . . . . . . . . . . . . . . . 161 (274) (505)
State . . . . . . . . . . . . . . . . . . . . . . . . . . . . . . . . . . . . . . . . . . . . . . . . . . . 17 (37) (29)
Foreign . . . . . . . . . . . . . . . . . . . . . . . . . . . . . . . . . . . . . . . . . . . . . . . . . 20 33 22
$658 $ 627 $ 268
The provision for income taxes reflects $69 million, $18 million and $20 million ($44 million,$12 million and $12 million net of tax, respectively) reductions in interest related to taxing authorityexaminations for the years ended December 31, 2010, 2009 and 2008, respectively.
A reconciliation of the federal statutory rate to the effective income tax rate follows:
2010 2009 2008
Federal statutory rate . . . . . . . . . . . . . . . . . . . . . . . . . . . . . . . . . . . . . . . . . . . 35.0% 35.0% 35.0%
State income taxes, net of federal tax benefit . . . . . . . . . . . . . . . . . . . . . . . . . 2.7 3.2 3.7
Change in liability for uncertain tax positions . . . . . . . . . . . . . . . . . . . . . . . . . 0.3 (0.2) (7.4)
Nondeductible intangible assets . . . . . . . . . . . . . . . . . . . . . . . . . . . . . . . . . . . — 0.4 0.4
Tax exempt interest income . . . . . . . . . . . . . . . . . . . . . . . . . . . . . . . . . . . . . . (0.4) (0.8) (2.5)
Income attributable to noncontrolling interests from consolidatedpartnerships . . . . . . . . . . . . . . . . . . . . . . . . . . . . . . . . . . . . . . . . . . . . . . . . (5.8) (6.0) (5.6)
Other items, net . . . . . . . . . . . . . . . . . . . . . . . . . . . . . . . . . . . . . . . . . . . . . . . (2.3) (0.3) (0.7)
Effective income tax rate . . . . . . . . . . . . . . . . . . . . . . . . . . . . . . . . . . . . . . . . 29.5% 31.3% 22.9%
As a result of a settlement reached with the Appeals Division of the Internal Revenue Service (the “IRS”)and the revision of a proposed IRS adjustment related to prior taxable years, we reduced our provision forincome taxes by $69 million in 2008.
A summary of the items comprising the deferred tax assets and liabilities at December 31 follows (dollarsin millions):
Assets Liabilities Assets Liabilities2010 2009
Depreciation and fixed asset basis differences . . . . . . . . . $ — $211 $ — $258
Allowances for professional liability and other risks. . . . . 329 — 288 —
Accounts receivable . . . . . . . . . . . . . . . . . . . . . . . . . . . . 1,011 — 1,453 —
Compensation. . . . . . . . . . . . . . . . . . . . . . . . . . . . . . . . . 202 — 190 —
Other . . . . . . . . . . . . . . . . . . . . . . . . . . . . . . . . . . . . . . . 776 400 740 336
$2,318 $611 $2,671 $594
F-19
HCA HOLDINGS, INC.
NOTES TO CONSOLIDATED FINANCIAL STATEMENTS — (Continued)
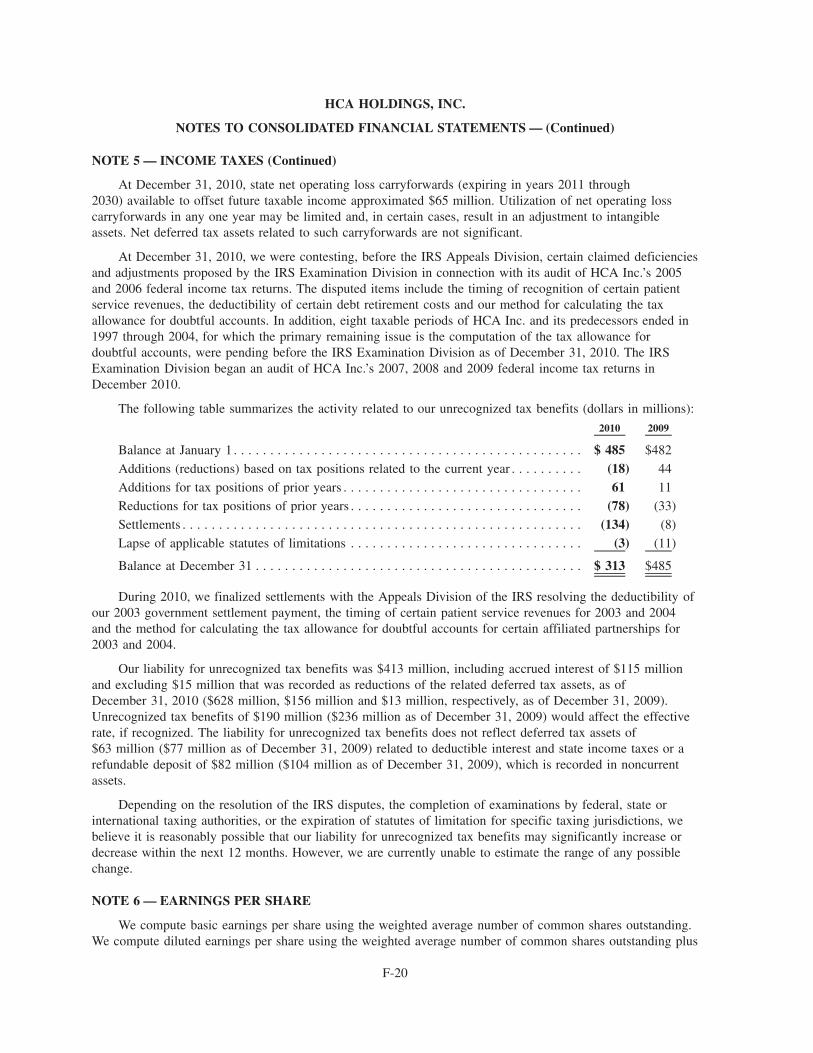
NOTE 5 — INCOME TAXES (Continued)
At December 31, 2010, state net operating loss carryforwards (expiring in years 2011 through2030) available to offset future taxable income approximated $65 million. Utilization of net operating losscarryforwards in any one year may be limited and, in certain cases, result in an adjustment to intangibleassets. Net deferred tax assets related to such carryforwards are not significant.
At December 31, 2010, we were contesting, before the IRS Appeals Division, certain claimed deficienciesand adjustments proposed by the IRS Examination Division in connection with its audit of HCA Inc.’s 2005and 2006 federal income tax returns. The disputed items include the timing of recognition of certain patientservice revenues, the deductibility of certain debt retirement costs and our method for calculating the taxallowance for doubtful accounts. In addition, eight taxable periods of HCA Inc. and its predecessors ended in1997 through 2004, for which the primary remaining issue is the computation of the tax allowance fordoubtful accounts, were pending before the IRS Examination Division as of December 31, 2010. The IRSExamination Division began an audit of HCA Inc.’s 2007, 2008 and 2009 federal income tax returns inDecember 2010.
The following table summarizes the activity related to our unrecognized tax benefits (dollars in millions):
2010 2009
Balance at January 1 . . . . . . . . . . . . . . . . . . . . . . . . . . . . . . . . . . . . . . . . . . . . . . . . $ 485 $482
Additions (reductions) based on tax positions related to the current year . . . . . . . . . . (18) 44
Additions for tax positions of prior years . . . . . . . . . . . . . . . . . . . . . . . . . . . . . . . . . 61 11
Reductions for tax positions of prior years . . . . . . . . . . . . . . . . . . . . . . . . . . . . . . . . (78) (33)
Settlements . . . . . . . . . . . . . . . . . . . . . . . . . . . . . . . . . . . . . . . . . . . . . . . . . . . . . . . (134) (8)
Lapse of applicable statutes of limitations . . . . . . . . . . . . . . . . . . . . . . . . . . . . . . . . (3) (11)
Balance at December 31 . . . . . . . . . . . . . . . . . . . . . . . . . . . . . . . . . . . . . . . . . . . . . $ 313 $485
During 2010, we finalized settlements with the Appeals Division of the IRS resolving the deductibility ofour 2003 government settlement payment, the timing of certain patient service revenues for 2003 and 2004and the method for calculating the tax allowance for doubtful accounts for certain affiliated partnerships for2003 and 2004.
Our liability for unrecognized tax benefits was $413 million, including accrued interest of $115 millionand excluding $15 million that was recorded as reductions of the related deferred tax assets, as ofDecember 31, 2010 ($628 million, $156 million and $13 million, respectively, as of December 31, 2009).Unrecognized tax benefits of $190 million ($236 million as of December 31, 2009) would affect the effectiverate, if recognized. The liability for unrecognized tax benefits does not reflect deferred tax assets of$63 million ($77 million as of December 31, 2009) related to deductible interest and state income taxes or arefundable deposit of $82 million ($104 million as of December 31, 2009), which is recorded in noncurrentassets.
Depending on the resolution of the IRS disputes, the completion of examinations by federal, state orinternational taxing authorities, or the expiration of statutes of limitation for specific taxing jurisdictions, webelieve it is reasonably possible that our liability for unrecognized tax benefits may significantly increase ordecrease within the next 12 months. However, we are currently unable to estimate the range of any possiblechange.
NOTE 6 — EARNINGS PER SHARE
We compute basic earnings per share using the weighted average number of common shares outstanding.We compute diluted earnings per share using the weighted average number of common shares outstanding plus
F-20
HCA HOLDINGS, INC.
NOTES TO CONSOLIDATED FINANCIAL STATEMENTS — (Continued)
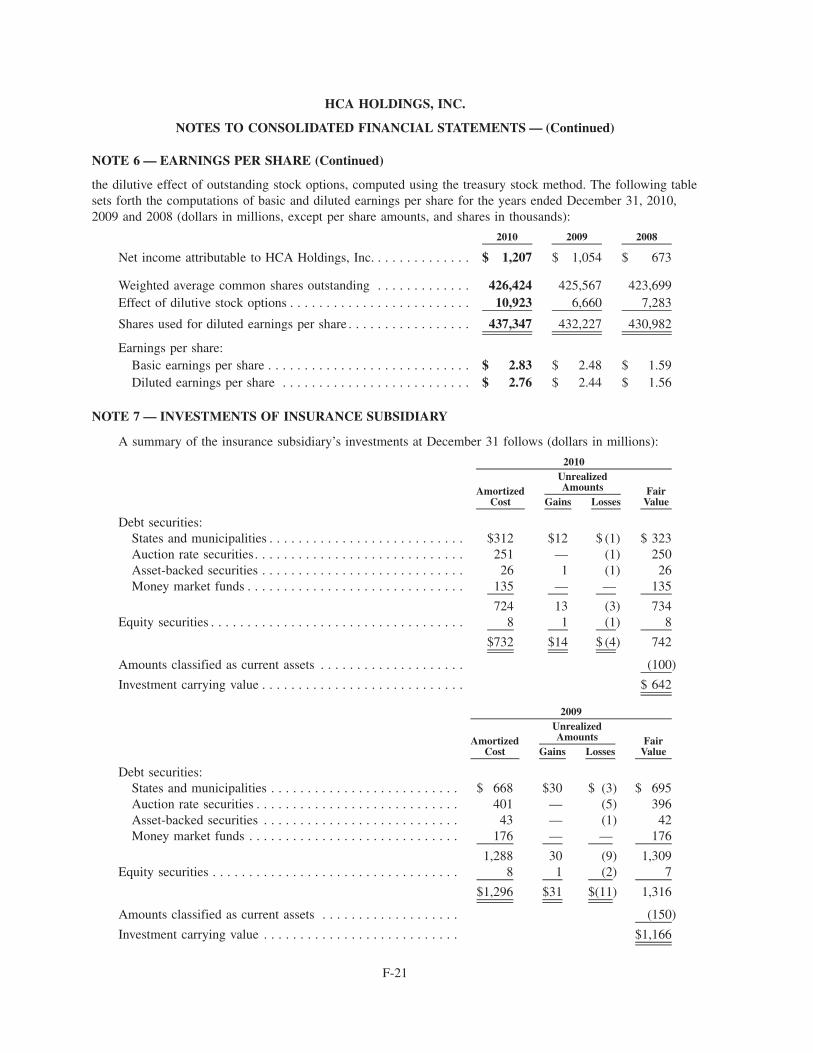
NOTE 6 — EARNINGS PER SHARE (Continued)
the dilutive effect of outstanding stock options, computed using the treasury stock method. The following tablesets forth the computations of basic and diluted earnings per share for the years ended December 31, 2010,2009 and 2008 (dollars in millions, except per share amounts, and shares in thousands):
2010 2009 2008
Net income attributable to HCA Holdings, Inc. . . . . . . . . . . . . . $ 1,207 $ 1,054 $ 673
Weighted average common shares outstanding . . . . . . . . . . . . . 426,424 425,567 423,699Effect of dilutive stock options . . . . . . . . . . . . . . . . . . . . . . . . . 10,923 6,660 7,283
Shares used for diluted earnings per share . . . . . . . . . . . . . . . . . 437,347 432,227 430,982
Earnings per share:Basic earnings per share . . . . . . . . . . . . . . . . . . . . . . . . . . . . $ 2.83 $ 2.48 $ 1.59Diluted earnings per share . . . . . . . . . . . . . . . . . . . . . . . . . . $ 2.76 $ 2.44 $ 1.56
NOTE 7 — INVESTMENTS OF INSURANCE SUBSIDIARY
A summary of the insurance subsidiary’s investments at December 31 follows (dollars in millions):
AmortizedCost Gains Losses
FairValue
UnrealizedAmounts
2010
Debt securities:States and municipalities . . . . . . . . . . . . . . . . . . . . . . . . . . . $312 $12 $ (1) $ 323Auction rate securities. . . . . . . . . . . . . . . . . . . . . . . . . . . . . 251 — (1) 250Asset-backed securities . . . . . . . . . . . . . . . . . . . . . . . . . . . . 26 1 (1) 26Money market funds . . . . . . . . . . . . . . . . . . . . . . . . . . . . . . 135 — — 135
724 13 (3) 734Equity securities . . . . . . . . . . . . . . . . . . . . . . . . . . . . . . . . . . . 8 1 (1) 8
$732 $14 $ (4) 742
Amounts classified as current assets . . . . . . . . . . . . . . . . . . . . (100)
Investment carrying value . . . . . . . . . . . . . . . . . . . . . . . . . . . . $ 642
AmortizedCost Gains Losses
FairValue
UnrealizedAmounts
2009
Debt securities:States and municipalities . . . . . . . . . . . . . . . . . . . . . . . . . . $ 668 $30 $ (3) $ 695Auction rate securities . . . . . . . . . . . . . . . . . . . . . . . . . . . . 401 — (5) 396Asset-backed securities . . . . . . . . . . . . . . . . . . . . . . . . . . . 43 — (1) 42Money market funds . . . . . . . . . . . . . . . . . . . . . . . . . . . . . 176 — — 176
1,288 30 (9) 1,309Equity securities . . . . . . . . . . . . . . . . . . . . . . . . . . . . . . . . . . 8 1 (2) 7
$1,296 $31 $(11) 1,316
Amounts classified as current assets . . . . . . . . . . . . . . . . . . . (150)
Investment carrying value . . . . . . . . . . . . . . . . . . . . . . . . . . . $1,166
F-21
HCA HOLDINGS, INC.
NOTES TO CONSOLIDATED FINANCIAL STATEMENTS — (Continued)
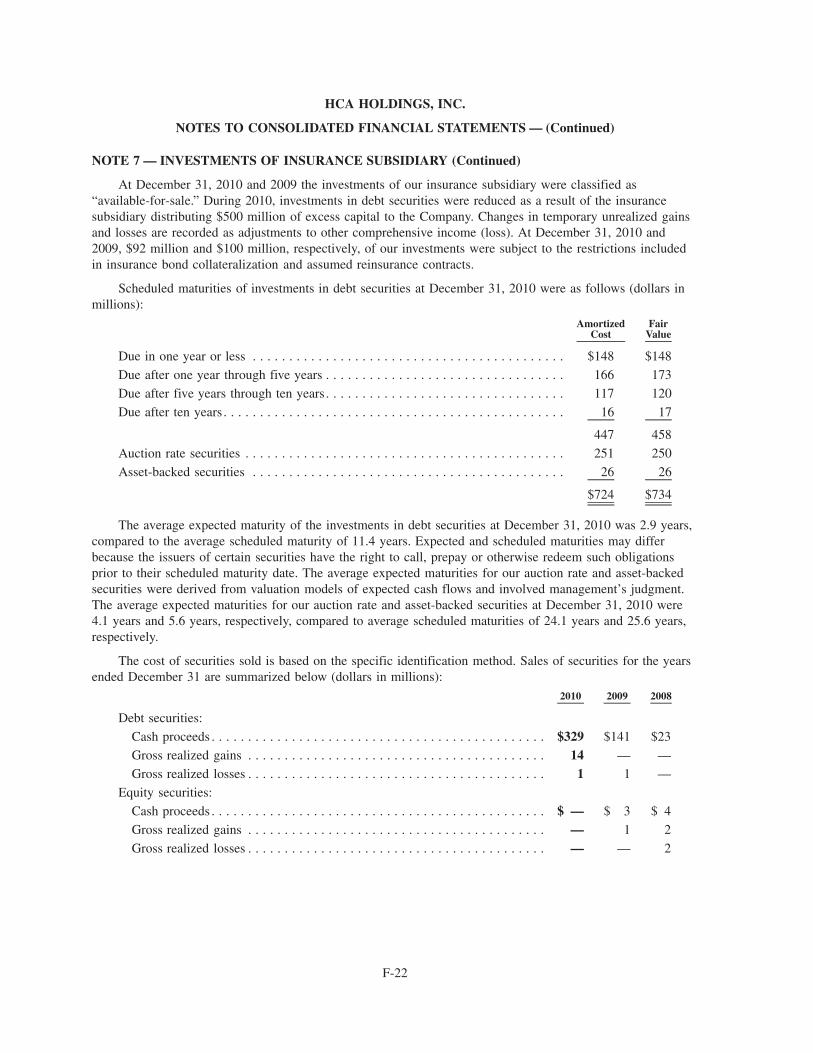
NOTE 7 — INVESTMENTS OF INSURANCE SUBSIDIARY (Continued)
At December 31, 2010 and 2009 the investments of our insurance subsidiary were classified as“available-for-sale.” During 2010, investments in debt securities were reduced as a result of the insurancesubsidiary distributing $500 million of excess capital to the Company. Changes in temporary unrealized gainsand losses are recorded as adjustments to other comprehensive income (loss). At December 31, 2010 and2009, $92 million and $100 million, respectively, of our investments were subject to the restrictions includedin insurance bond collateralization and assumed reinsurance contracts.
Scheduled maturities of investments in debt securities at December 31, 2010 were as follows (dollars inmillions):
AmortizedCost
FairValue
Due in one year or less . . . . . . . . . . . . . . . . . . . . . . . . . . . . . . . . . . . . . . . . . . . $148 $148
Due after one year through five years . . . . . . . . . . . . . . . . . . . . . . . . . . . . . . . . . 166 173
Due after five years through ten years. . . . . . . . . . . . . . . . . . . . . . . . . . . . . . . . . 117 120
Due after ten years. . . . . . . . . . . . . . . . . . . . . . . . . . . . . . . . . . . . . . . . . . . . . . . 16 17
447 458
Auction rate securities . . . . . . . . . . . . . . . . . . . . . . . . . . . . . . . . . . . . . . . . . . . . 251 250
Asset-backed securities . . . . . . . . . . . . . . . . . . . . . . . . . . . . . . . . . . . . . . . . . . . 26 26
$724 $734
The average expected maturity of the investments in debt securities at December 31, 2010 was 2.9 years,compared to the average scheduled maturity of 11.4 years. Expected and scheduled maturities may differbecause the issuers of certain securities have the right to call, prepay or otherwise redeem such obligationsprior to their scheduled maturity date. The average expected maturities for our auction rate and asset-backedsecurities were derived from valuation models of expected cash flows and involved management’s judgment.The average expected maturities for our auction rate and asset-backed securities at December 31, 2010 were4.1 years and 5.6 years, respectively, compared to average scheduled maturities of 24.1 years and 25.6 years,respectively.
The cost of securities sold is based on the specific identification method. Sales of securities for the yearsended December 31 are summarized below (dollars in millions):
2010 2009 2008
Debt securities:
Cash proceeds . . . . . . . . . . . . . . . . . . . . . . . . . . . . . . . . . . . . . . . . . . . . . . $329 $141 $23
Gross realized gains . . . . . . . . . . . . . . . . . . . . . . . . . . . . . . . . . . . . . . . . . 14 — —
Gross realized losses . . . . . . . . . . . . . . . . . . . . . . . . . . . . . . . . . . . . . . . . . 1 1 —
Equity securities:
Cash proceeds . . . . . . . . . . . . . . . . . . . . . . . . . . . . . . . . . . . . . . . . . . . . . . $ — $ 3 $ 4
Gross realized gains . . . . . . . . . . . . . . . . . . . . . . . . . . . . . . . . . . . . . . . . . — 1 2
Gross realized losses . . . . . . . . . . . . . . . . . . . . . . . . . . . . . . . . . . . . . . . . . — — 2
F-22
HCA HOLDINGS, INC.
NOTES TO CONSOLIDATED FINANCIAL STATEMENTS — (Continued)
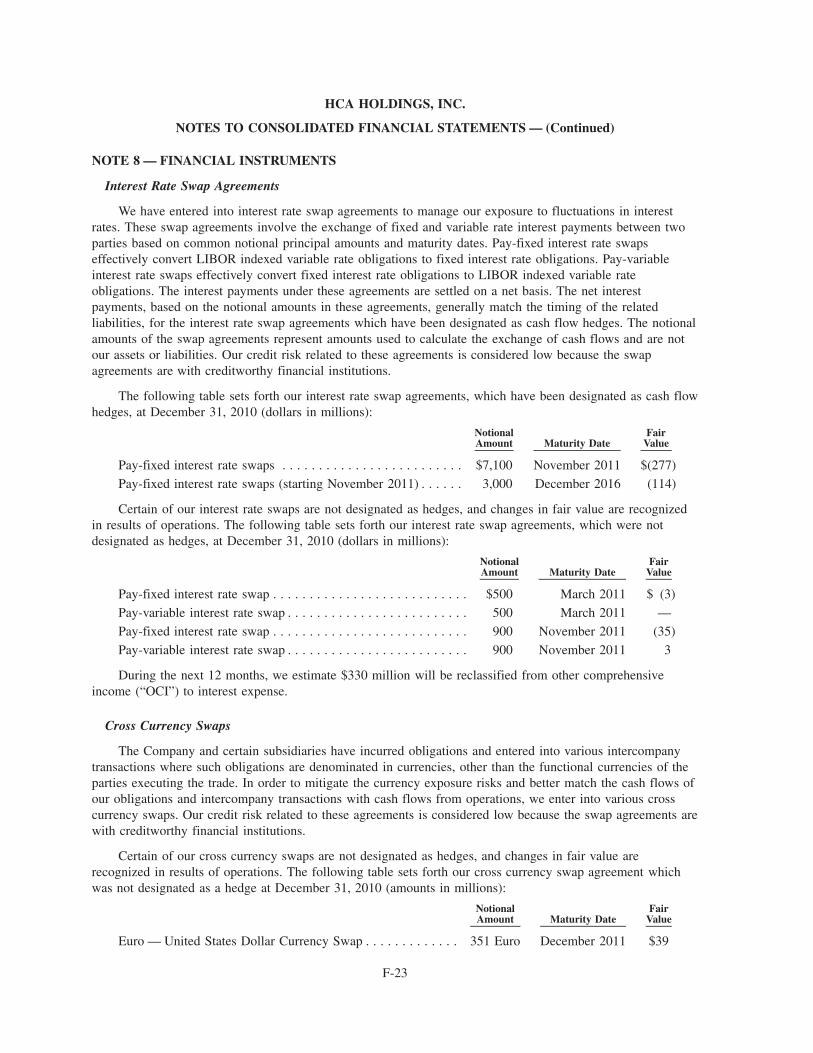
NOTE 8 — FINANCIAL INSTRUMENTS
Interest Rate Swap Agreements
We have entered into interest rate swap agreements to manage our exposure to fluctuations in interestrates. These swap agreements involve the exchange of fixed and variable rate interest payments between twoparties based on common notional principal amounts and maturity dates. Pay-fixed interest rate swapseffectively convert LIBOR indexed variable rate obligations to fixed interest rate obligations. Pay-variableinterest rate swaps effectively convert fixed interest rate obligations to LIBOR indexed variable rateobligations. The interest payments under these agreements are settled on a net basis. The net interestpayments, based on the notional amounts in these agreements, generally match the timing of the relatedliabilities, for the interest rate swap agreements which have been designated as cash flow hedges. The notionalamounts of the swap agreements represent amounts used to calculate the exchange of cash flows and are notour assets or liabilities. Our credit risk related to these agreements is considered low because the swapagreements are with creditworthy financial institutions.
The following table sets forth our interest rate swap agreements, which have been designated as cash flowhedges, at December 31, 2010 (dollars in millions):
NotionalAmount Maturity Date
FairValue
Pay-fixed interest rate swaps . . . . . . . . . . . . . . . . . . . . . . . . . $7,100 November 2011 $(277)
Pay-fixed interest rate swaps (starting November 2011) . . . . . . 3,000 December 2016 (114)
Certain of our interest rate swaps are not designated as hedges, and changes in fair value are recognizedin results of operations. The following table sets forth our interest rate swap agreements, which were notdesignated as hedges, at December 31, 2010 (dollars in millions):
NotionalAmount Maturity Date
FairValue
Pay-fixed interest rate swap . . . . . . . . . . . . . . . . . . . . . . . . . . . $500 March 2011 $ (3)
Pay-variable interest rate swap . . . . . . . . . . . . . . . . . . . . . . . . . 500 March 2011 —
Pay-fixed interest rate swap . . . . . . . . . . . . . . . . . . . . . . . . . . . 900 November 2011 (35)
Pay-variable interest rate swap . . . . . . . . . . . . . . . . . . . . . . . . . 900 November 2011 3
During the next 12 months, we estimate $330 million will be reclassified from other comprehensiveincome (“OCI”) to interest expense.
Cross Currency Swaps
The Company and certain subsidiaries have incurred obligations and entered into various intercompanytransactions where such obligations are denominated in currencies, other than the functional currencies of theparties executing the trade. In order to mitigate the currency exposure risks and better match the cash flows ofour obligations and intercompany transactions with cash flows from operations, we enter into various crosscurrency swaps. Our credit risk related to these agreements is considered low because the swap agreements arewith creditworthy financial institutions.
Certain of our cross currency swaps are not designated as hedges, and changes in fair value arerecognized in results of operations. The following table sets forth our cross currency swap agreement whichwas not designated as a hedge at December 31, 2010 (amounts in millions):
NotionalAmount Maturity Date
FairValue
Euro — United States Dollar Currency Swap . . . . . . . . . . . . . 351 Euro December 2011 $39
F-23
HCA HOLDINGS, INC.
NOTES TO CONSOLIDATED FINANCIAL STATEMENTS — (Continued)
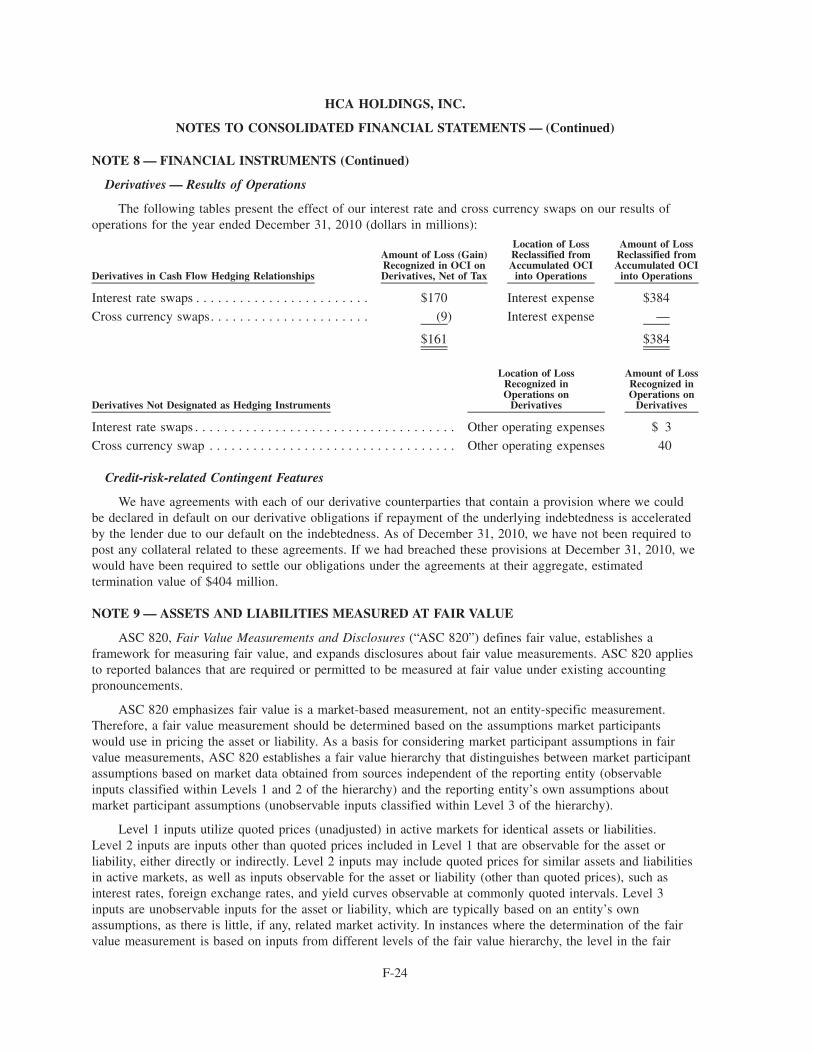
NOTE 8 — FINANCIAL INSTRUMENTS (Continued)
Derivatives — Results of Operations
The following tables present the effect of our interest rate and cross currency swaps on our results ofoperations for the year ended December 31, 2010 (dollars in millions):
Derivatives in Cash Flow Hedging Relationships
Amount of Loss (Gain)Recognized in OCI onDerivatives, Net of Tax
Location of LossReclassified fromAccumulated OCI
into Operations
Amount of LossReclassified fromAccumulated OCI
into Operations
Interest rate swaps . . . . . . . . . . . . . . . . . . . . . . . . $170 Interest expense $384
Cross currency swaps. . . . . . . . . . . . . . . . . . . . . . (9) Interest expense —
$161 $384
Derivatives Not Designated as Hedging Instruments
Location of LossRecognized inOperations on
Derivatives
Amount of LossRecognized inOperations on
Derivatives
Interest rate swaps . . . . . . . . . . . . . . . . . . . . . . . . . . . . . . . . . . . . Other operating expenses $ 3
Cross currency swap . . . . . . . . . . . . . . . . . . . . . . . . . . . . . . . . . . Other operating expenses 40
Credit-risk-related Contingent Features
We have agreements with each of our derivative counterparties that contain a provision where we couldbe declared in default on our derivative obligations if repayment of the underlying indebtedness is acceleratedby the lender due to our default on the indebtedness. As of December 31, 2010, we have not been required topost any collateral related to these agreements. If we had breached these provisions at December 31, 2010, wewould have been required to settle our obligations under the agreements at their aggregate, estimatedtermination value of $404 million.
NOTE 9 — ASSETS AND LIABILITIES MEASURED AT FAIR VALUE
ASC 820, Fair Value Measurements and Disclosures (“ASC 820”) defines fair value, establishes aframework for measuring fair value, and expands disclosures about fair value measurements. ASC 820 appliesto reported balances that are required or permitted to be measured at fair value under existing accountingpronouncements.
ASC 820 emphasizes fair value is a market-based measurement, not an entity-specific measurement.Therefore, a fair value measurement should be determined based on the assumptions market participantswould use in pricing the asset or liability. As a basis for considering market participant assumptions in fairvalue measurements, ASC 820 establishes a fair value hierarchy that distinguishes between market participantassumptions based on market data obtained from sources independent of the reporting entity (observableinputs classified within Levels 1 and 2 of the hierarchy) and the reporting entity’s own assumptions aboutmarket participant assumptions (unobservable inputs classified within Level 3 of the hierarchy).
Level 1 inputs utilize quoted prices (unadjusted) in active markets for identical assets or liabilities.Level 2 inputs are inputs other than quoted prices included in Level 1 that are observable for the asset orliability, either directly or indirectly. Level 2 inputs may include quoted prices for similar assets and liabilitiesin active markets, as well as inputs observable for the asset or liability (other than quoted prices), such asinterest rates, foreign exchange rates, and yield curves observable at commonly quoted intervals. Level 3inputs are unobservable inputs for the asset or liability, which are typically based on an entity’s ownassumptions, as there is little, if any, related market activity. In instances where the determination of the fairvalue measurement is based on inputs from different levels of the fair value hierarchy, the level in the fair
F-24
HCA HOLDINGS, INC.
NOTES TO CONSOLIDATED FINANCIAL STATEMENTS — (Continued)
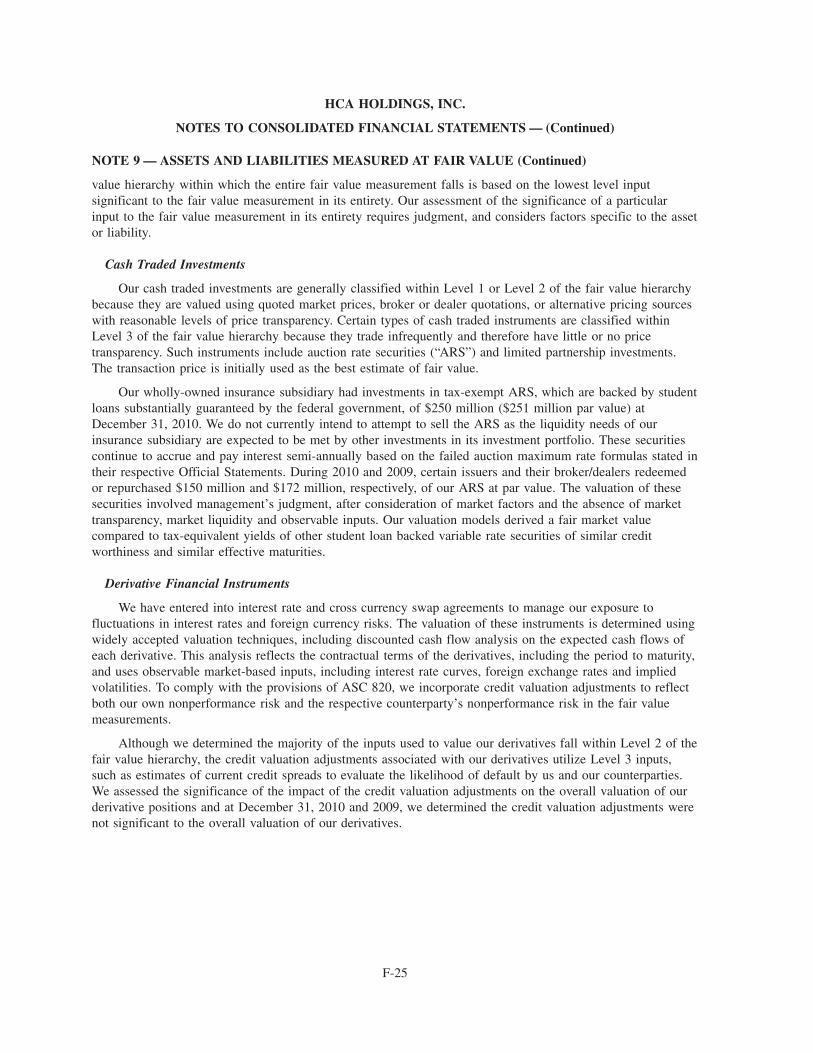
NOTE 9 — ASSETS AND LIABILITIES MEASURED AT FAIR VALUE (Continued)
value hierarchy within which the entire fair value measurement falls is based on the lowest level inputsignificant to the fair value measurement in its entirety. Our assessment of the significance of a particularinput to the fair value measurement in its entirety requires judgment, and considers factors specific to the assetor liability.
Cash Traded Investments
Our cash traded investments are generally classified within Level 1 or Level 2 of the fair value hierarchybecause they are valued using quoted market prices, broker or dealer quotations, or alternative pricing sourceswith reasonable levels of price transparency. Certain types of cash traded instruments are classified withinLevel 3 of the fair value hierarchy because they trade infrequently and therefore have little or no pricetransparency. Such instruments include auction rate securities (“ARS”) and limited partnership investments.The transaction price is initially used as the best estimate of fair value.
Our wholly-owned insurance subsidiary had investments in tax-exempt ARS, which are backed by studentloans substantially guaranteed by the federal government, of $250 million ($251 million par value) atDecember 31, 2010. We do not currently intend to attempt to sell the ARS as the liquidity needs of ourinsurance subsidiary are expected to be met by other investments in its investment portfolio. These securitiescontinue to accrue and pay interest semi-annually based on the failed auction maximum rate formulas stated intheir respective Official Statements. During 2010 and 2009, certain issuers and their broker/dealers redeemedor repurchased $150 million and $172 million, respectively, of our ARS at par value. The valuation of thesesecurities involved management’s judgment, after consideration of market factors and the absence of markettransparency, market liquidity and observable inputs. Our valuation models derived a fair market valuecompared to tax-equivalent yields of other student loan backed variable rate securities of similar creditworthiness and similar effective maturities.
Derivative Financial Instruments
We have entered into interest rate and cross currency swap agreements to manage our exposure tofluctuations in interest rates and foreign currency risks. The valuation of these instruments is determined usingwidely accepted valuation techniques, including discounted cash flow analysis on the expected cash flows ofeach derivative. This analysis reflects the contractual terms of the derivatives, including the period to maturity,and uses observable market-based inputs, including interest rate curves, foreign exchange rates and impliedvolatilities. To comply with the provisions of ASC 820, we incorporate credit valuation adjustments to reflectboth our own nonperformance risk and the respective counterparty’s nonperformance risk in the fair valuemeasurements.
Although we determined the majority of the inputs used to value our derivatives fall within Level 2 of thefair value hierarchy, the credit valuation adjustments associated with our derivatives utilize Level 3 inputs,such as estimates of current credit spreads to evaluate the likelihood of default by us and our counterparties.We assessed the significance of the impact of the credit valuation adjustments on the overall valuation of ourderivative positions and at December 31, 2010 and 2009, we determined the credit valuation adjustments werenot significant to the overall valuation of our derivatives.
F-25
HCA HOLDINGS, INC.
NOTES TO CONSOLIDATED FINANCIAL STATEMENTS — (Continued)
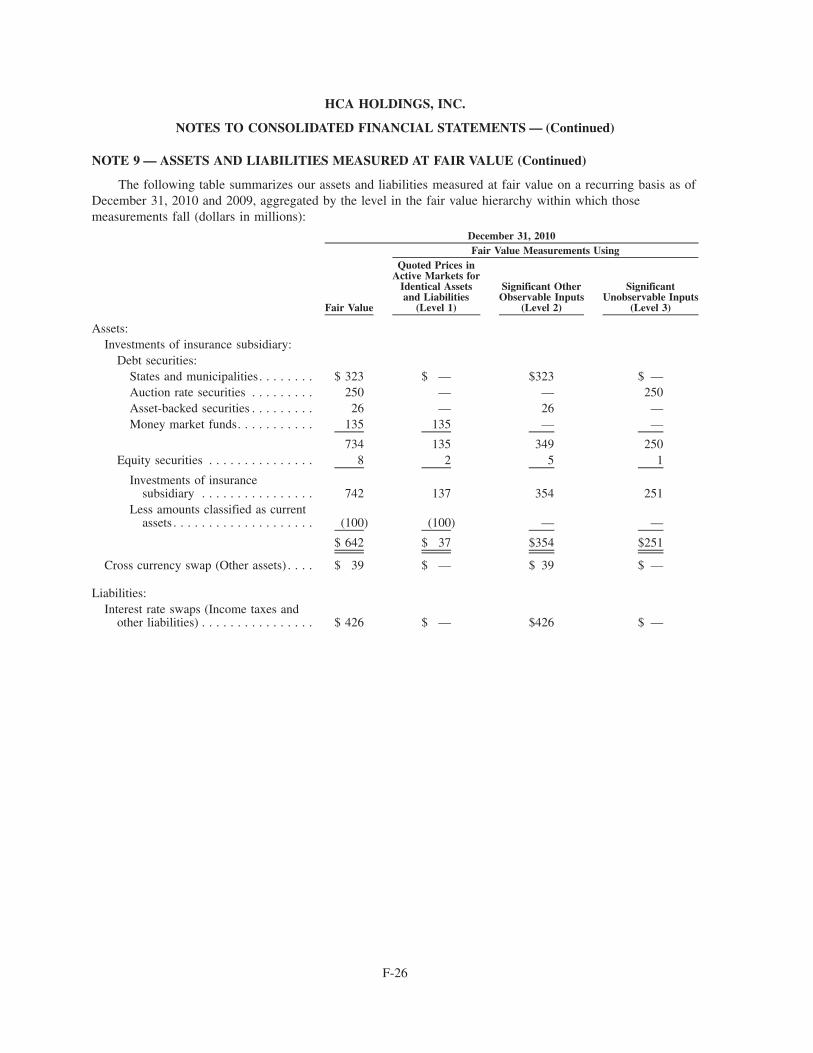
NOTE 9 — ASSETS AND LIABILITIES MEASURED AT FAIR VALUE (Continued)
The following table summarizes our assets and liabilities measured at fair value on a recurring basis as ofDecember 31, 2010 and 2009, aggregated by the level in the fair value hierarchy within which thosemeasurements fall (dollars in millions):
Fair Value
Quoted Prices inActive Markets for
Identical Assetsand Liabilities
(Level 1)
Significant OtherObservable Inputs
(Level 2)
SignificantUnobservable Inputs
(Level 3)
Fair Value Measurements UsingDecember 31, 2010
Assets:Investments of insurance subsidiary:
Debt securities:States and municipalities. . . . . . . . $ 323 $ — $323 $ —Auction rate securities . . . . . . . . . 250 — — 250Asset-backed securities . . . . . . . . . 26 — 26 —Money market funds. . . . . . . . . . . 135 135 — —
734 135 349 250Equity securities . . . . . . . . . . . . . . . 8 2 5 1
Investments of insurancesubsidiary . . . . . . . . . . . . . . . . 742 137 354 251
Less amounts classified as currentassets . . . . . . . . . . . . . . . . . . . . (100) (100) — —
$ 642 $ 37 $354 $251
Cross currency swap (Other assets) . . . . $ 39 $ — $ 39 $ —
Liabilities:Interest rate swaps (Income taxes and
other liabilities) . . . . . . . . . . . . . . . . $ 426 $ — $426 $ —
F-26
HCA HOLDINGS, INC.
NOTES TO CONSOLIDATED FINANCIAL STATEMENTS — (Continued)
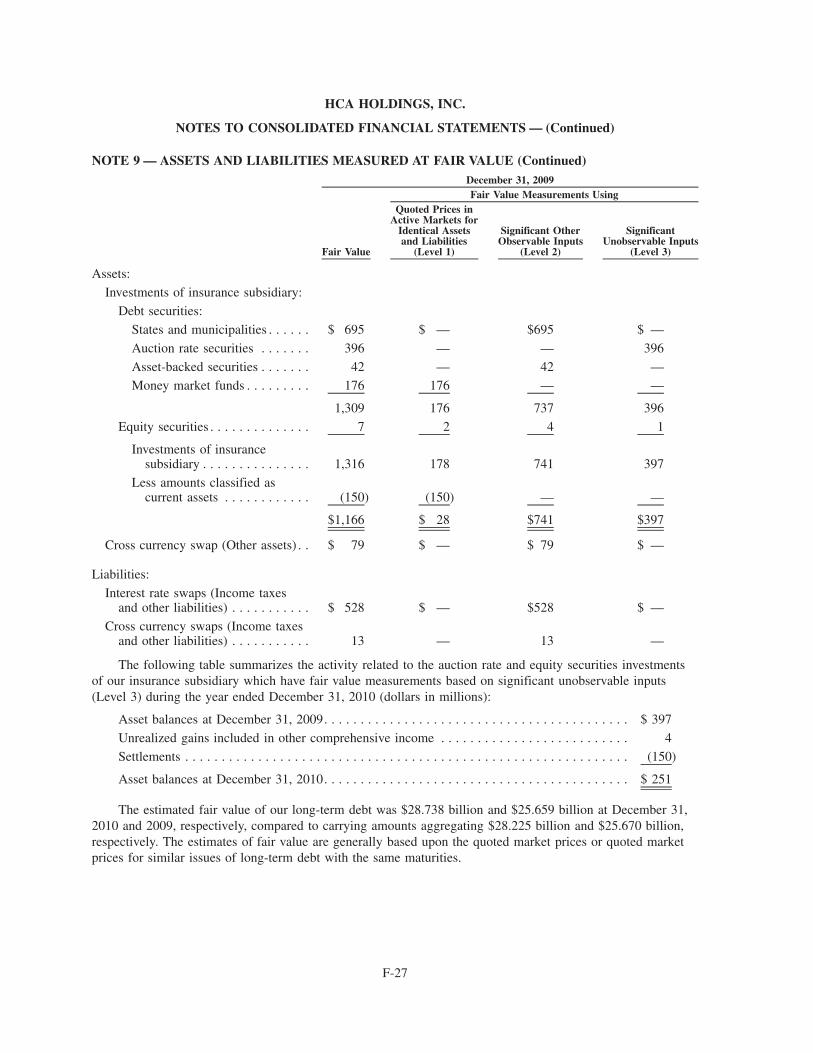
NOTE 9 — ASSETS AND LIABILITIES MEASURED AT FAIR VALUE (Continued)
Fair Value
Quoted Prices inActive Markets for
Identical Assetsand Liabilities
(Level 1)
Significant OtherObservable Inputs
(Level 2)
SignificantUnobservable Inputs
(Level 3)
Fair Value Measurements UsingDecember 31, 2009
Assets:
Investments of insurance subsidiary:
Debt securities:
States and municipalities . . . . . . $ 695 $ — $695 $ —
Auction rate securities . . . . . . . 396 — — 396
Asset-backed securities . . . . . . . 42 — 42 —
Money market funds . . . . . . . . . 176 176 — —
1,309 176 737 396
Equity securities . . . . . . . . . . . . . . 7 2 4 1
Investments of insurancesubsidiary . . . . . . . . . . . . . . . 1,316 178 741 397
Less amounts classified ascurrent assets . . . . . . . . . . . . (150) (150) — —
$1,166 $ 28 $741 $397
Cross currency swap (Other assets) . . $ 79 $ — $ 79 $ —
Liabilities:
Interest rate swaps (Income taxesand other liabilities) . . . . . . . . . . . $ 528 $ — $528 $ —
Cross currency swaps (Income taxesand other liabilities) . . . . . . . . . . . 13 — 13 —
The following table summarizes the activity related to the auction rate and equity securities investmentsof our insurance subsidiary which have fair value measurements based on significant unobservable inputs(Level 3) during the year ended December 31, 2010 (dollars in millions):
Asset balances at December 31, 2009. . . . . . . . . . . . . . . . . . . . . . . . . . . . . . . . . . . . . . . . . . $ 397
Unrealized gains included in other comprehensive income . . . . . . . . . . . . . . . . . . . . . . . . . . 4
Settlements . . . . . . . . . . . . . . . . . . . . . . . . . . . . . . . . . . . . . . . . . . . . . . . . . . . . . . . . . . . . . (150)
Asset balances at December 31, 2010. . . . . . . . . . . . . . . . . . . . . . . . . . . . . . . . . . . . . . . . . . $ 251
The estimated fair value of our long-term debt was $28.738 billion and $25.659 billion at December 31,2010 and 2009, respectively, compared to carrying amounts aggregating $28.225 billion and $25.670 billion,respectively. The estimates of fair value are generally based upon the quoted market prices or quoted marketprices for similar issues of long-term debt with the same maturities.
F-27
HCA HOLDINGS, INC.
NOTES TO CONSOLIDATED FINANCIAL STATEMENTS — (Continued)
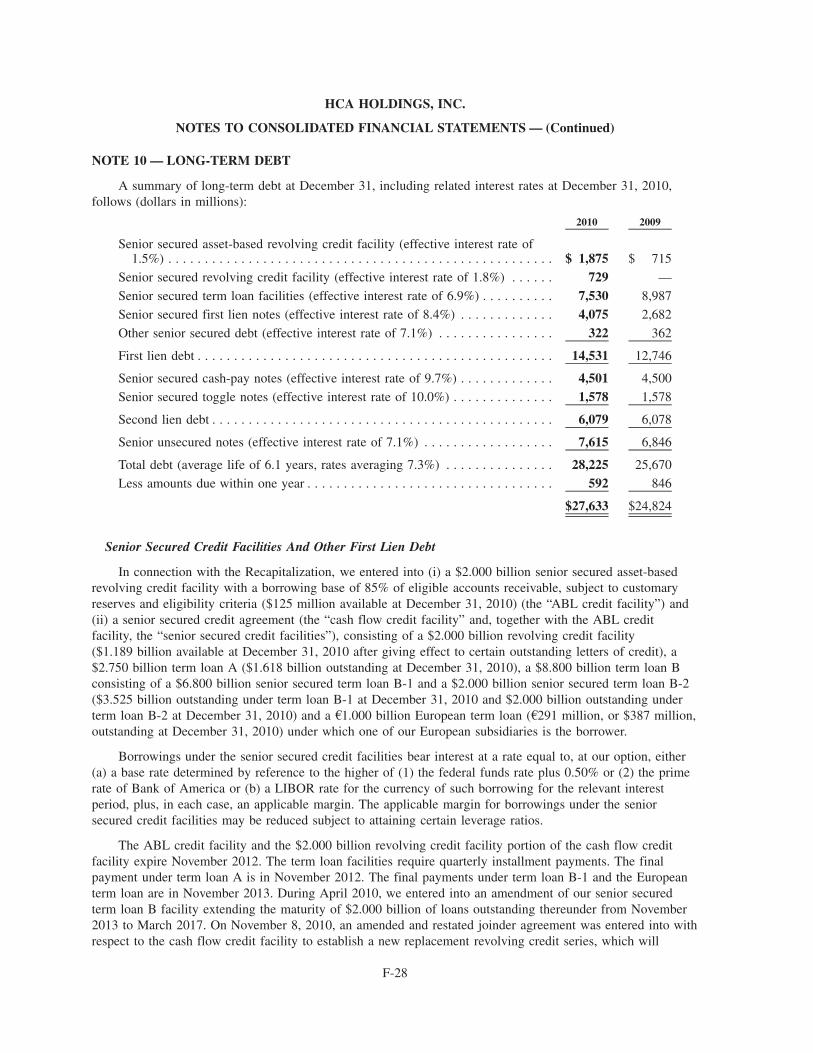
NOTE 10 — LONG-TERM DEBT
A summary of long-term debt at December 31, including related interest rates at December 31, 2010,follows (dollars in millions):
2010 2009
Senior secured asset-based revolving credit facility (effective interest rate of1.5%) . . . . . . . . . . . . . . . . . . . . . . . . . . . . . . . . . . . . . . . . . . . . . . . . . . . . . $ 1,875 $ 715
Senior secured revolving credit facility (effective interest rate of 1.8%) . . . . . . 729 —
Senior secured term loan facilities (effective interest rate of 6.9%) . . . . . . . . . . 7,530 8,987
Senior secured first lien notes (effective interest rate of 8.4%) . . . . . . . . . . . . . 4,075 2,682
Other senior secured debt (effective interest rate of 7.1%) . . . . . . . . . . . . . . . . 322 362
First lien debt . . . . . . . . . . . . . . . . . . . . . . . . . . . . . . . . . . . . . . . . . . . . . . . . . 14,531 12,746
Senior secured cash-pay notes (effective interest rate of 9.7%) . . . . . . . . . . . . . 4,501 4,500
Senior secured toggle notes (effective interest rate of 10.0%) . . . . . . . . . . . . . . 1,578 1,578
Second lien debt . . . . . . . . . . . . . . . . . . . . . . . . . . . . . . . . . . . . . . . . . . . . . . . 6,079 6,078
Senior unsecured notes (effective interest rate of 7.1%) . . . . . . . . . . . . . . . . . . 7,615 6,846
Total debt (average life of 6.1 years, rates averaging 7.3%) . . . . . . . . . . . . . . . 28,225 25,670
Less amounts due within one year . . . . . . . . . . . . . . . . . . . . . . . . . . . . . . . . . . 592 846
$27,633 $24,824
Senior Secured Credit Facilities And Other First Lien Debt
In connection with the Recapitalization, we entered into (i) a $2.000 billion senior secured asset-basedrevolving credit facility with a borrowing base of 85% of eligible accounts receivable, subject to customaryreserves and eligibility criteria ($125 million available at December 31, 2010) (the “ABL credit facility”) and(ii) a senior secured credit agreement (the “cash flow credit facility” and, together with the ABL creditfacility, the “senior secured credit facilities”), consisting of a $2.000 billion revolving credit facility($1.189 billion available at December 31, 2010 after giving effect to certain outstanding letters of credit), a$2.750 billion term loan A ($1.618 billion outstanding at December 31, 2010), a $8.800 billion term loan Bconsisting of a $6.800 billion senior secured term loan B-1 and a $2.000 billion senior secured term loan B-2($3.525 billion outstanding under term loan B-1 at December 31, 2010 and $2.000 billion outstanding underterm loan B-2 at December 31, 2010) and a A1.000 billion European term loan (A291 million, or $387 million,outstanding at December 31, 2010) under which one of our European subsidiaries is the borrower.
Borrowings under the senior secured credit facilities bear interest at a rate equal to, at our option, either(a) a base rate determined by reference to the higher of (1) the federal funds rate plus 0.50% or (2) the primerate of Bank of America or (b) a LIBOR rate for the currency of such borrowing for the relevant interestperiod, plus, in each case, an applicable margin. The applicable margin for borrowings under the seniorsecured credit facilities may be reduced subject to attaining certain leverage ratios.
The ABL credit facility and the $2.000 billion revolving credit facility portion of the cash flow creditfacility expire November 2012. The term loan facilities require quarterly installment payments. The finalpayment under term loan A is in November 2012. The final payments under term loan B-1 and the Europeanterm loan are in November 2013. During April 2010, we entered into an amendment of our senior securedterm loan B facility extending the maturity of $2.000 billion of loans outstanding thereunder from November2013 to March 2017. On November 8, 2010, an amended and restated joinder agreement was entered into withrespect to the cash flow credit facility to establish a new replacement revolving credit series, which will
F-28
HCA HOLDINGS, INC.
NOTES TO CONSOLIDATED FINANCIAL STATEMENTS — (Continued)
NOTE 10 — LONG-TERM DEBT (Continued)
mature on November 17, 2015. Under the amended and restated joinder agreement, these replacementrevolving credit commitments will become effective, subject to certain conditions, upon the earlier of (i) theinitial public offering of our common stock and (ii) May 17, 2012. The senior secured credit facilities containa number of covenants that restrict, subject to certain exceptions, our (and some or all of our subsidiaries’)ability to incur additional indebtedness, repay subordinated indebtedness, create liens on assets, sell assets,make investments, loans or advances, engage in certain transactions with affiliates, pay dividends anddistributions, and enter into sale and leaseback transactions. In addition, we are required to satisfy andmaintain a maximum total leverage ratio covenant under the cash flow credit facility and, in certain situationsunder the ABL credit facility, a minimum interest coverage ratio covenant.
During April 2009, we issued $1.500 billion aggregate principal amount of 81⁄2% senior secured first liennotes due 2019 at a price of 96.755% of their face value, resulting in $1.451 billion of gross proceeds. DuringAugust 2009, we issued $1.250 billion aggregate principal amount of 77⁄8% senior secured first lien notes due2020 at a price of 98.254% of their face value, resulting in $1.228 billion of gross proceeds. During March2010, we issued $1.400 billion aggregate principal amount of 71⁄4% senior secured first lien notes due 2020 ata price of 99.095% of their face value, resulting in $1.387 billion of gross proceeds. After the payment ofrelated fees and expenses, we used the proceeds from these debt issuances to repay outstanding indebtednessunder our senior secured term loan facilities.
We use interest rate swap agreements to manage the variable rate exposure of our debt portfolio. AtDecember 31, 2010, we had entered into effective interest rate swap agreements, in a total notional amount of$7.100 billion, in order to hedge a portion of our exposure to variable rate interest payments associated withthe senior secured credit facility. The effect of the interest rate swaps is reflected in the effective interest ratesfor the senior secured credit facilities.
Senior Secured Notes And Other Second Lien Debt
During November 2006, we issued $4.200 billion of senior secured notes (comprised of $1.000 billion of91⁄8% notes due 2014 and $3.200 billion of 91⁄4% notes due 2016), and $1.500 billion of 95⁄8% cash/103⁄8% in-kind senior secured toggle notes (which allow us, at our option, to pay interest in-kind during the first fiveyears) due 2016, which are subject to certain standard covenants. We made the interest payment for theinterest period ended in May 2009 by paying in-kind ($78 million) instead of paying interest in cash.
During February 2009, we issued $310 million aggregate principal amount of 97⁄8% senior secured secondlien notes due 2017 at a price of 96.673% of their face value, resulting in $300 million of gross proceeds.After the payment of related fees and expenses, we used the proceeds to repay outstanding indebtedness underour senior secured term loan facilities.
Senior Unsecured Notes
During November 2010, we issued $1.525 billion aggregate principal amount of 73⁄4% senior unsecurednotes due 2021 (the “2021 Notes”) at a price of 100% of their face value, resulting in $1.525 billion of grossproceeds. After the payment of related fees and expenses, we used the proceeds to make a distribution to ourstockholders and optionholders.
General Debt Information
The senior secured credit facilities and senior secured notes are fully and unconditionally guaranteed bysubstantially all existing and future, direct and indirect, wholly-owned material domestic subsidiaries that are“Unrestricted Subsidiaries” under our Indenture (the “1993 Indenture”) dated December 16, 1993 (except forcertain special purpose subsidiaries that only guarantee and pledge their assets under our ABL credit facility).
F-29
HCA HOLDINGS, INC.
NOTES TO CONSOLIDATED FINANCIAL STATEMENTS — (Continued)

NOTE 10 — LONG-TERM DEBT (Continued)
In addition, borrowings under the European term loan are guaranteed by all material, wholly-owned Europeansubsidiaries.
All obligations under the ABL credit facility, and the guarantees of those obligations, are secured, subjectto permitted liens and other exceptions, by a first-priority lien on substantially all of the receivables of theborrowers and each guarantor under such ABL credit facility (the “Receivables Collateral”).
All obligations under the cash flow credit facility and the guarantees of such obligations are secured,subject to permitted liens and other exceptions, by:
• a first-priority lien on the capital stock owned by HCA Inc., or by any U.S. guarantor, in each of theirrespective first-tier subsidiaries;
• a first-priority lien on substantially all present and future assets of HCA Inc. and of each U.S. guarantorother than (i) “Principal Properties” (as defined in the 1993 Indenture), (ii) certain other real propertiesand (iii) deposit accounts, other bank or securities accounts, cash, leaseholds, motor-vehicles andcertain other exceptions; and
• a second-priority lien on certain of the Receivables Collateral.
Our senior secured first lien notes and the related guarantees are secured by first-priority liens, subject topermitted liens, on our and our subsidiary guarantors’ assets, subject to certain exceptions, that secure our cashflow credit facility on a first-priority basis and are secured by second priority liens, subject to permitted liens,on our and our subsidiary guarantors’ assets that secure our ABL credit facility on a first priority basis andour other cash flow credit facility on a second-priority basis.
Our second lien debt and the related guarantees are secured by second-priority liens, subject to permittedliens, on our and our subsidiary guarantors’ assets, subject to certain exceptions, that secure our cash flowcredit facility on a first-priority basis and are secured by third-priority liens, subject to permitted liens, on ourand our subsidiary guarantors’ assets that secure our asset-based revolving credit facility on a first prioritybasis and our other cash flow credit facility on a second-priority basis.
Maturities of long-term debt in years 2012 through 2015 are $4.195 billion, $4.952 billion, $1.681 billionand $1.676 billion, respectively.
NOTE 11 — CONTINGENCIES
We operate in a highly regulated and litigious industry. As a result, various lawsuits, claims and legal andregulatory proceedings have been and can be expected to be instituted or asserted against us. The resolution ofany such lawsuits, claims or legal and regulatory proceedings could have a material, adverse effect on ourresults of operations or financial position.
Health care companies are subject to numerous investigations by various governmental agencies. Underthe federal false claims act (“FCA”) private parties have the right to bring qui tam, or “whistleblower,” suitsagainst companies that submit false claims for payments to, or improperly retain overpayments from, thegovernment. Some states have adopted similar state whistleblower and false claims provisions. Certain of ourindividual facilities have received government inquiries from federal and state agencies and our facilities mayreceive such inquiries in future periods. Depending on whether the underlying conduct in these or futureinquiries or investigations could be considered systemic, their resolution could have a material, adverse effecton our results of operations or financial position.
We are subject to claims and suits arising in the ordinary course of business, including claims forpersonal injuries or wrongful restriction of, or interference with, physicians’ staff privileges. In certain of these
F-30
HCA HOLDINGS, INC.
NOTES TO CONSOLIDATED FINANCIAL STATEMENTS — (Continued)
NOTE 11 — CONTINGENCIES (Continued)
actions the claimants may seek punitive damages against us which may not be covered by insurance. It ismanagement’s opinion that the ultimate resolution of these pending claims and legal proceedings will not havea material, adverse effect on our results of operations or financial position.
The Civil Division of the Department of Justice (“DOJ”) has contacted us in connection with itsnationwide review of whether, in certain cases, hospital charges to the federal government relating toimplantable cardio-defibrillators (“ICDs”) met the Centers for Medicare & Medicaid Services’ criteria. Inconnection with this nationwide review, the DOJ has indicated it will be reviewing certain ICD billing andmedical records at 95 HCA hospitals; the review covers the period from October 2003 to the present. Thereview could potentially give rise to claims against us under the federal FCA or other statutes, regulations orlaws. At this time, we cannot predict what effect, if any, this review or any resulting claims could have on us.
NOTE 12 — CAPITAL STOCK
The amended and restated certificate of incorporation authorizes the Company to issue up to1,800,000,000 shares of common stock, and our amended and restated bylaws set the number of directorsconstituting the board of directors of the Company at not less than one nor more than 15.
Distributions
During 2010, our Board of Directors declared three distributions to its stockholders and holders of stockoptions. The distributions totaled $9.43 per share and vested stock option, or $4.332 billion in the aggregate.The distributions were funded using funds available under our senior secured credit facilities, proceeds fromthe 2021 Notes offering and cash on hand. Pursuant to the terms of our stock option plans, the holders ofnonvested stock options received $9.43 per share reductions (subject to certain tax related limitations forcertain stock options that resulted in deferred distributions for a portion of the declared distribution, which willbe paid upon the vesting of the applicable stock options) to the exercise price of their share-based awards.
Registration Statement Filings
On May 5, 2010, HCA Inc.’s Board of Directors granted approval for HCA Inc. to file with the Securitiesand Exchange Commission (“SEC”) a registration statement on Form S-1 relating to a proposed initial publicoffering of its common stock. The Form S-1 was filed on May 7, 2010.
In connection with the Corporate Reorganization, on December 15, 2010, HCA Holdings, Inc.’s Board ofDirectors granted approval for the Company to file with the SEC a registration statement on Form S-1 relatingto a proposed initial public offering of its common stock. The Form S-1 was filed on December 22, 2010, andHCA Inc. filed a request to withdraw its registration statement on Form S-1 at the same time.
Stockholder Agreements and Equity Securities with Contingent Redemption Rights
The stockholder agreements, among other things, contain agreements among the parties with respect torestrictions on the transfer of shares, including tag along rights and drag along rights, registration rights(including customary indemnification provisions) and other rights. Pursuant to the management stockholderagreements, the applicable employees can elect to have the Company redeem their common stock and vestedstock options in the events of death or permanent disability, prior to the consummation of the initial publicoffering of common stock by the Company. At December 31, 2010, there were 9,984,900 common shares and23,834,800 vested stock options that were subject to these contingent redemption terms.
F-31
HCA HOLDINGS, INC.
NOTES TO CONSOLIDATED FINANCIAL STATEMENTS — (Continued)

NOTE 13 — EMPLOYEE BENEFIT PLANS
We maintain contributory, defined contribution benefit plans that are available to employees who meetcertain minimum requirements. Certain of the plans require that we match specified percentages of participantcontributions up to certain maximum levels (generally, 100% of the first 3% to 9%, depending upon years ofvesting service, of compensation deferred by participants for periods subsequent to March 31, 2008, and 50%of the first 3% of compensation deferred by participants for periods prior to April 1, 2008). The cost of theseplans totaled $307 million for 2010, $283 million for 2009 and $233 million for 2008. Our contributions arefunded periodically during each year.
We maintained a noncontributory, defined contribution retirement plan which covered substantially allemployees. Benefits were determined as a percentage of a participant’s salary and vest over specified periodsof employee service. Benefits expense was $46 million for 2008. There was no expense for 2010 and 2009 asthe noncontributory plan and the related participant account balances were merged into the contributory HCA401(k) Plan effective April 1, 2008.
We maintain the noncontributory, nonqualified Restoration Plan to provide certain retirement benefits foreligible employees. Eligibility for the Restoration Plan is based upon earning eligible compensation in excessof the Social Security Wage Base and attaining 1,000 or more hours of service during the plan year. Companycredits to participants’ account balances (the Restoration Plan is not funded) depend upon participants’compensation, years of vesting service and certain IRS limitations related to the HCA 401(k) plan. Benefitsexpense under this plan was $19 million for 2010, $26 million for 2009 and $2 million for 2008. Accruedbenefits liabilities under this plan totaled $84 million at December 31, 2010 and $73 million at December 31,2009.
We maintain a Supplemental Executive Retirement Plan (“SERP”) for certain executives. The plan isdesigned to ensure that upon retirement the participant receives the value of a prescribed life annuity from thecombination of the SERP and our other benefit plans. Benefits expense under the plan was $27 million for2010, $24 million for 2009 and $20 million for 2008. Accrued benefits liabilities under this plan totaled$197 million at December 31, 2010 and $152 million at December 31, 2009.
We maintain defined benefit pension plans which resulted from certain hospital acquisitions in prioryears. Benefits expense under these plans was $30 million for 2010, $39 million for 2009, and $24 million for2008. Accrued benefits liabilities under these plans totaled $131 million at December 31, 2010 and$115 million at December 31, 2009.
NOTE 14 — SEGMENT AND GEOGRAPHIC INFORMATION
We operate in one line of business, which is operating hospitals and related health care entities. Duringthe years ended December 31, 2010, 2009 and 2008, approximately 23.5%, 22.8% and 23.1%, respectively, ofour revenues related to patients participating in the fee-for-service Medicare program.
Our operations are structured into three geographically organized groups: the Eastern Group includes 48consolidating hospitals located in the Eastern United States, the Central Group includes 46 consolidatinghospitals located in the Central United States and the Western Group includes 56 consolidating hospitalslocated in the Western United States. We also operate six consolidating hospitals in England, and thesefacilities are included in the Corporate and other group.
Adjusted segment EBITDA is defined as income before depreciation and amortization, interest expense,losses (gains) on sales of facilities, impairments of long-lived assets, income taxes and net income attributableto noncontrolling interests. We use adjusted segment EBITDA as an analytical indicator for purposes ofallocating resources to geographic areas and assessing performance. Adjusted segment EBITDA is commonlyused as an analytical indicator within the health care industry, and also serves as a measure of leverage
F-32
HCA HOLDINGS, INC.
NOTES TO CONSOLIDATED FINANCIAL STATEMENTS — (Continued)
NOTE 14 — SEGMENT AND GEOGRAPHIC INFORMATION (Continued)
capacity and debt service ability. Adjusted segment EBITDA should not be considered as a measure offinancial performance under generally accepted accounting principles, and the items excluded from adjustedsegment EBITDA are significant components in understanding and assessing financial performance. Becauseadjusted segment EBITDA is not a measurement determined in accordance with generally accepted accountingprinciples and is thus susceptible to varying calculations, adjusted segment EBITDA, as presented, may not becomparable to other similarly titled measures of other companies.
F-33
HCA HOLDINGS, INC.
NOTES TO CONSOLIDATED FINANCIAL STATEMENTS — (Continued)
NOTE 14 — SEGMENT AND GEOGRAPHIC INFORMATION (Continued)
The geographic distributions of our revenues, equity in earnings of affiliates, adjusted segment EBITDA,depreciation and amortization, assets and goodwill are summarized in the following table (dollars in millions):
2010 2009 2008For the Years Ended December 31,
Revenues:
Eastern Group . . . . . . . . . . . . . . . . . . . . . . . . . . . . . . . . . . . . . . $ 9,006 $ 8,807 $ 8,570
Central Group . . . . . . . . . . . . . . . . . . . . . . . . . . . . . . . . . . . . . . 7,222 7,225 6,740
Western Group. . . . . . . . . . . . . . . . . . . . . . . . . . . . . . . . . . . . . . 13,467 13,140 12,118
Corporate and other . . . . . . . . . . . . . . . . . . . . . . . . . . . . . . . . . . 988 880 946
$30,683 $30,052 $28,374
Equity in earnings of affiliates:
Eastern Group . . . . . . . . . . . . . . . . . . . . . . . . . . . . . . . . . . . . . . $ (3) $ (3) $ (2)
Central Group . . . . . . . . . . . . . . . . . . . . . . . . . . . . . . . . . . . . . . (1) (2) (2)
Western Group. . . . . . . . . . . . . . . . . . . . . . . . . . . . . . . . . . . . . . (278) (241) (219)
Corporate and other . . . . . . . . . . . . . . . . . . . . . . . . . . . . . . . . . . — — —
$ (282) $ (246) $ (223)
Adjusted segment EBITDA:
Eastern Group . . . . . . . . . . . . . . . . . . . . . . . . . . . . . . . . . . . . . . $ 1,580 $ 1,469 $ 1,288
Central Group . . . . . . . . . . . . . . . . . . . . . . . . . . . . . . . . . . . . . . 1,272 1,325 1,061
Western Group. . . . . . . . . . . . . . . . . . . . . . . . . . . . . . . . . . . . . . 3,107 2,867 2,270
Corporate and other . . . . . . . . . . . . . . . . . . . . . . . . . . . . . . . . . . (91) (189) (45)
$ 5,868 $ 5,472 $ 4,574
Depreciation and amortization:
Eastern Group . . . . . . . . . . . . . . . . . . . . . . . . . . . . . . . . . . . . . . $ 354 $ 364 $ 358
Central Group . . . . . . . . . . . . . . . . . . . . . . . . . . . . . . . . . . . . . . 352 352 359
Western Group. . . . . . . . . . . . . . . . . . . . . . . . . . . . . . . . . . . . . . 581 578 552
Corporate and other . . . . . . . . . . . . . . . . . . . . . . . . . . . . . . . . . . 134 131 147
$ 1,421 $ 1,425 $ 1,416
Adjusted segment EBITDA . . . . . . . . . . . . . . . . . . . . . . . . . . . . . . $ 5,868 $ 5,472 $ 4,574
Depreciation and amortization . . . . . . . . . . . . . . . . . . . . . . . . . . 1,421 1,425 1,416
Interest expense . . . . . . . . . . . . . . . . . . . . . . . . . . . . . . . . . . . . . 2,097 1,987 2,021
Losses (gains) on sales of facilities . . . . . . . . . . . . . . . . . . . . . . . (4) 15 (97)
Impairments of long-lived assets . . . . . . . . . . . . . . . . . . . . . . . . . 123 43 64
Income before income taxes. . . . . . . . . . . . . . . . . . . . . . . . . . . . . . $ 2,231 $ 2,002 $ 1,170
F-34
HCA HOLDINGS, INC.
NOTES TO CONSOLIDATED FINANCIAL STATEMENTS — (Continued)
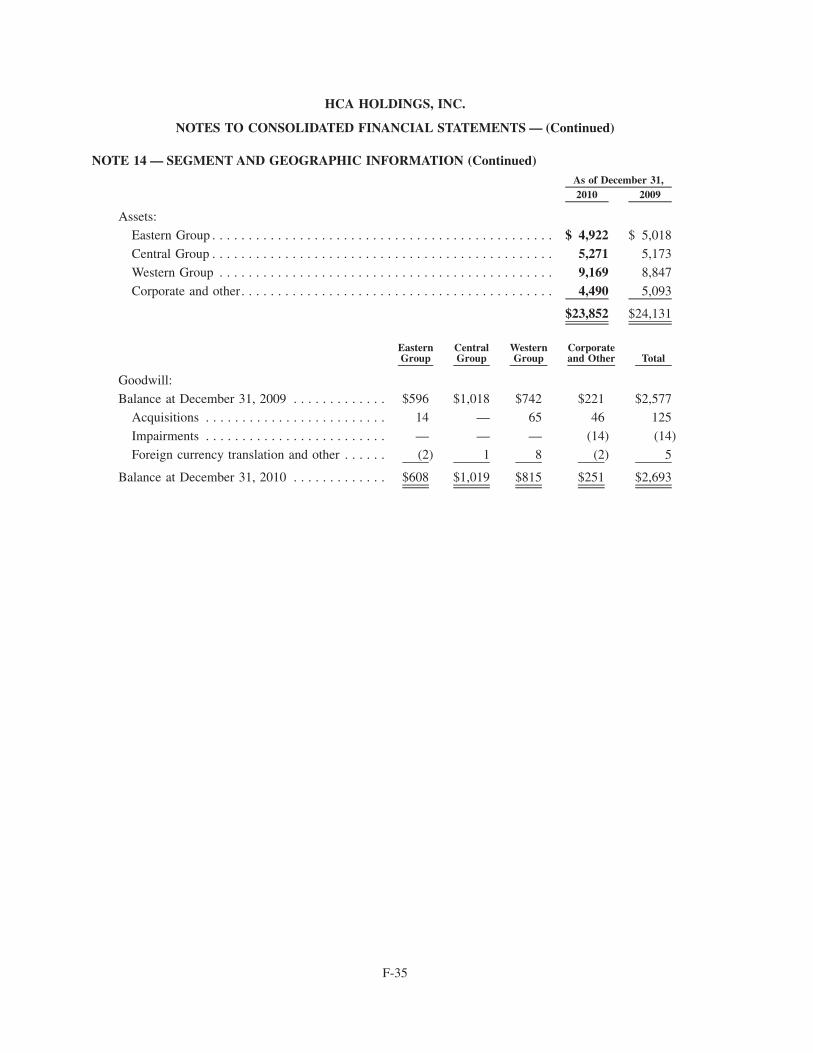
NOTE 14 — SEGMENT AND GEOGRAPHIC INFORMATION (Continued)
2010 2009As of December 31,
Assets:
Eastern Group . . . . . . . . . . . . . . . . . . . . . . . . . . . . . . . . . . . . . . . . . . . . . . . $ 4,922 $ 5,018
Central Group . . . . . . . . . . . . . . . . . . . . . . . . . . . . . . . . . . . . . . . . . . . . . . . 5,271 5,173
Western Group . . . . . . . . . . . . . . . . . . . . . . . . . . . . . . . . . . . . . . . . . . . . . . 9,169 8,847
Corporate and other. . . . . . . . . . . . . . . . . . . . . . . . . . . . . . . . . . . . . . . . . . . 4,490 5,093
$23,852 $24,131
EasternGroup
CentralGroup
WesternGroup
Corporateand Other Total
Goodwill:
Balance at December 31, 2009 . . . . . . . . . . . . . $596 $1,018 $742 $221 $2,577Acquisitions . . . . . . . . . . . . . . . . . . . . . . . . . 14 — 65 46 125
Impairments . . . . . . . . . . . . . . . . . . . . . . . . . — — — (14) (14)
Foreign currency translation and other . . . . . . (2) 1 8 (2) 5
Balance at December 31, 2010 . . . . . . . . . . . . . $608 $1,019 $815 $251 $2,693
F-35
HCA HOLDINGS, INC.
NOTES TO CONSOLIDATED FINANCIAL STATEMENTS — (Continued)
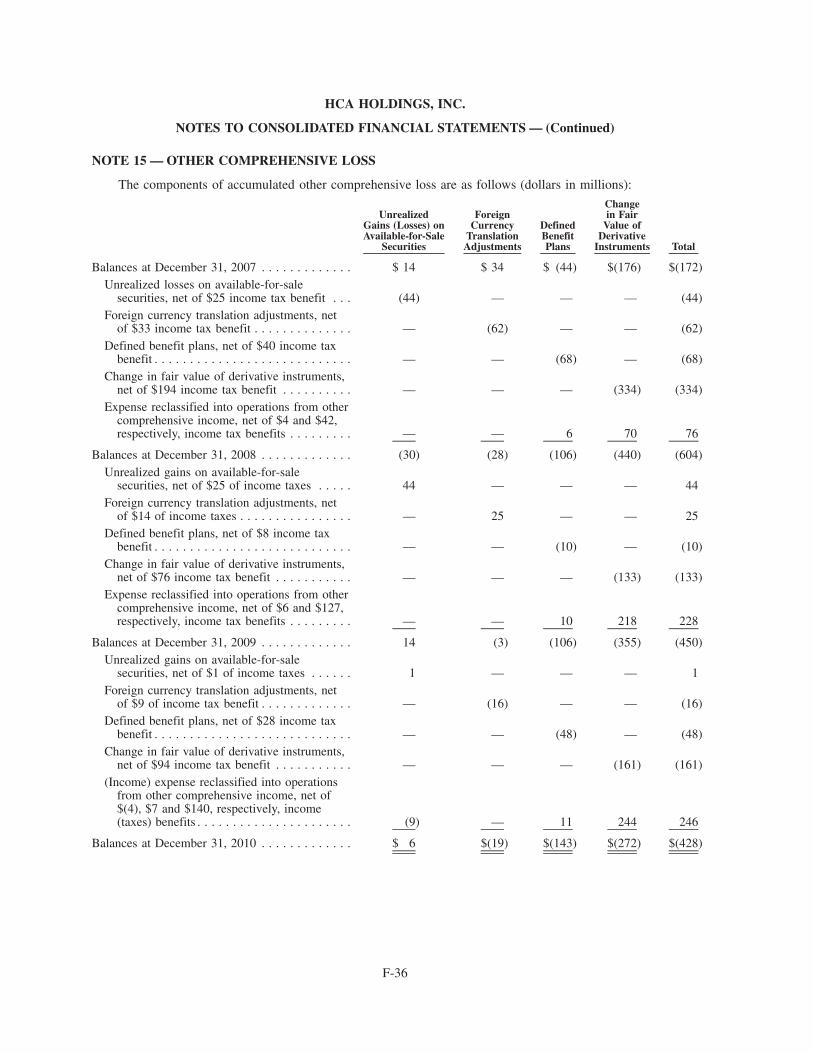
NOTE 15 — OTHER COMPREHENSIVE LOSS
The components of accumulated other comprehensive loss are as follows (dollars in millions):
UnrealizedGains (Losses) onAvailable-for-Sale
Securities
ForeignCurrency
TranslationAdjustments
DefinedBenefitPlans
Changein Fair
Value ofDerivative
Instruments Total
Balances at December 31, 2007 . . . . . . . . . . . . . $ 14 $ 34 $ (44) $(176) $(172)Unrealized losses on available-for-sale
securities, net of $25 income tax benefit . . . (44) — — — (44)Foreign currency translation adjustments, net
of $33 income tax benefit . . . . . . . . . . . . . . — (62) — — (62)Defined benefit plans, net of $40 income tax
benefit . . . . . . . . . . . . . . . . . . . . . . . . . . . . — — (68) — (68)Change in fair value of derivative instruments,
net of $194 income tax benefit . . . . . . . . . . — — — (334) (334)Expense reclassified into operations from other
comprehensive income, net of $4 and $42,respectively, income tax benefits . . . . . . . . . — — 6 70 76
Balances at December 31, 2008 . . . . . . . . . . . . . (30) (28) (106) (440) (604)Unrealized gains on available-for-sale
securities, net of $25 of income taxes . . . . . 44 — — — 44Foreign currency translation adjustments, net
of $14 of income taxes . . . . . . . . . . . . . . . . — 25 — — 25Defined benefit plans, net of $8 income tax
benefit . . . . . . . . . . . . . . . . . . . . . . . . . . . . — — (10) — (10)Change in fair value of derivative instruments,
net of $76 income tax benefit . . . . . . . . . . . — — — (133) (133)Expense reclassified into operations from other
comprehensive income, net of $6 and $127,respectively, income tax benefits . . . . . . . . . — — 10 218 228
Balances at December 31, 2009 . . . . . . . . . . . . . 14 (3) (106) (355) (450)Unrealized gains on available-for-sale
securities, net of $1 of income taxes . . . . . . 1 — — — 1Foreign currency translation adjustments, net
of $9 of income tax benefit . . . . . . . . . . . . . — (16) — — (16)Defined benefit plans, net of $28 income tax
benefit . . . . . . . . . . . . . . . . . . . . . . . . . . . . — — (48) — (48)Change in fair value of derivative instruments,
net of $94 income tax benefit . . . . . . . . . . . — — — (161) (161)(Income) expense reclassified into operations
from other comprehensive income, net of$(4), $7 and $140, respectively, income(taxes) benefits . . . . . . . . . . . . . . . . . . . . . . (9) — 11 244 246
Balances at December 31, 2010 . . . . . . . . . . . . . $ 6 $(19) $(143) $(272) $(428)
F-36
HCA HOLDINGS, INC.
NOTES TO CONSOLIDATED FINANCIAL STATEMENTS — (Continued)
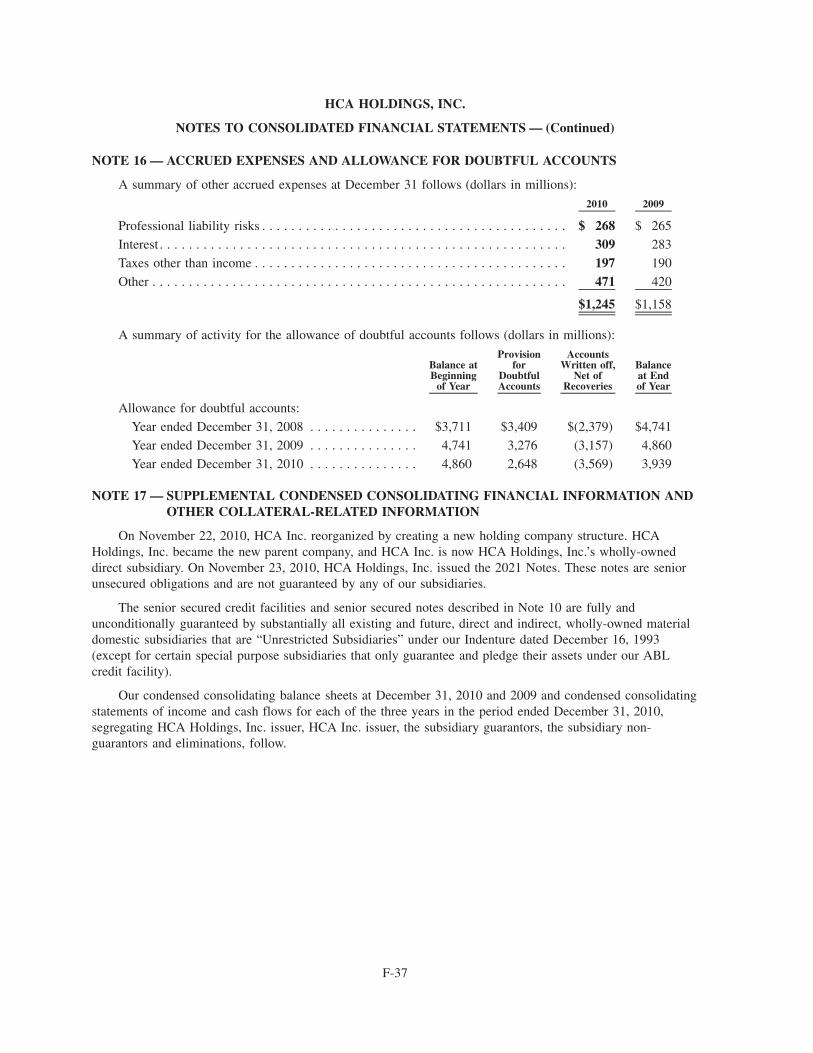
NOTE 16 — ACCRUED EXPENSES AND ALLOWANCE FOR DOUBTFUL ACCOUNTS
A summary of other accrued expenses at December 31 follows (dollars in millions):
2010 2009
Professional liability risks . . . . . . . . . . . . . . . . . . . . . . . . . . . . . . . . . . . . . . . . . . $ 268 $ 265
Interest . . . . . . . . . . . . . . . . . . . . . . . . . . . . . . . . . . . . . . . . . . . . . . . . . . . . . . . . 309 283
Taxes other than income . . . . . . . . . . . . . . . . . . . . . . . . . . . . . . . . . . . . . . . . . . . 197 190
Other . . . . . . . . . . . . . . . . . . . . . . . . . . . . . . . . . . . . . . . . . . . . . . . . . . . . . . . . . 471 420
$1,245 $1,158
A summary of activity for the allowance of doubtful accounts follows (dollars in millions):
Balance atBeginning
of Year
Provisionfor
DoubtfulAccounts
AccountsWritten off,
Net ofRecoveries
Balanceat Endof Year
Allowance for doubtful accounts:
Year ended December 31, 2008 . . . . . . . . . . . . . . . $3,711 $3,409 $(2,379) $4,741
Year ended December 31, 2009 . . . . . . . . . . . . . . . 4,741 3,276 (3,157) 4,860
Year ended December 31, 2010 . . . . . . . . . . . . . . . 4,860 2,648 (3,569) 3,939
NOTE 17 — SUPPLEMENTAL CONDENSED CONSOLIDATING FINANCIAL INFORMATION ANDOTHER COLLATERAL-RELATED INFORMATION
On November 22, 2010, HCA Inc. reorganized by creating a new holding company structure. HCAHoldings, Inc. became the new parent company, and HCA Inc. is now HCA Holdings, Inc.’s wholly-owneddirect subsidiary. On November 23, 2010, HCA Holdings, Inc. issued the 2021 Notes. These notes are seniorunsecured obligations and are not guaranteed by any of our subsidiaries.
The senior secured credit facilities and senior secured notes described in Note 10 are fully andunconditionally guaranteed by substantially all existing and future, direct and indirect, wholly-owned materialdomestic subsidiaries that are “Unrestricted Subsidiaries” under our Indenture dated December 16, 1993(except for certain special purpose subsidiaries that only guarantee and pledge their assets under our ABLcredit facility).
Our condensed consolidating balance sheets at December 31, 2010 and 2009 and condensed consolidatingstatements of income and cash flows for each of the three years in the period ended December 31, 2010,segregating HCA Holdings, Inc. issuer, HCA Inc. issuer, the subsidiary guarantors, the subsidiary non-guarantors and eliminations, follow.
F-37
HCA HOLDINGS, INC.
NOTES TO CONSOLIDATED FINANCIAL STATEMENTS — (Continued)
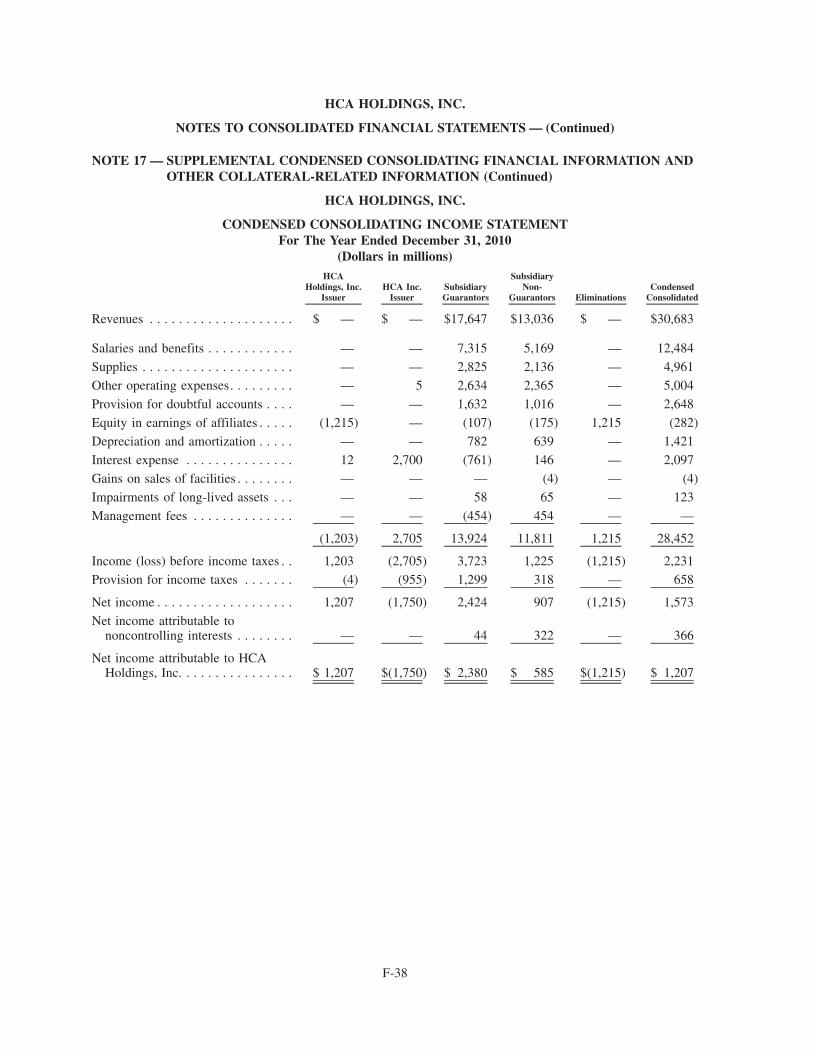
NOTE 17 — SUPPLEMENTAL CONDENSED CONSOLIDATING FINANCIAL INFORMATION ANDOTHER COLLATERAL-RELATED INFORMATION (Continued)
HCA HOLDINGS, INC.
CONDENSED CONSOLIDATING INCOME STATEMENTFor The Year Ended December 31, 2010
(Dollars in millions)HCA
Holdings, Inc.Issuer
HCA Inc.Issuer
SubsidiaryGuarantors
SubsidiaryNon-
Guarantors EliminationsCondensed
Consolidated
Revenues . . . . . . . . . . . . . . . . . . . . $ — $ — $17,647 $13,036 $ — $30,683
Salaries and benefits . . . . . . . . . . . . — — 7,315 5,169 — 12,484
Supplies . . . . . . . . . . . . . . . . . . . . . — — 2,825 2,136 — 4,961
Other operating expenses. . . . . . . . . — 5 2,634 2,365 — 5,004
Provision for doubtful accounts . . . . — — 1,632 1,016 — 2,648
Equity in earnings of affiliates . . . . . (1,215) — (107) (175) 1,215 (282)
Depreciation and amortization . . . . . — — 782 639 — 1,421
Interest expense . . . . . . . . . . . . . . . 12 2,700 (761) 146 — 2,097
Gains on sales of facilities . . . . . . . . — — — (4) — (4)
Impairments of long-lived assets . . . — — 58 65 — 123
Management fees . . . . . . . . . . . . . . — — (454) 454 — —
(1,203) 2,705 13,924 11,811 1,215 28,452
Income (loss) before income taxes . . 1,203 (2,705) 3,723 1,225 (1,215) 2,231Provision for income taxes . . . . . . . (4) (955) 1,299 318 — 658
Net income . . . . . . . . . . . . . . . . . . . 1,207 (1,750) 2,424 907 (1,215) 1,573
Net income attributable tononcontrolling interests . . . . . . . . — — 44 322 — 366
Net income attributable to HCAHoldings, Inc. . . . . . . . . . . . . . . . $ 1,207 $(1,750) $ 2,380 $ 585 $(1,215) $ 1,207
F-38
HCA HOLDINGS, INC.
NOTES TO CONSOLIDATED FINANCIAL STATEMENTS — (Continued)
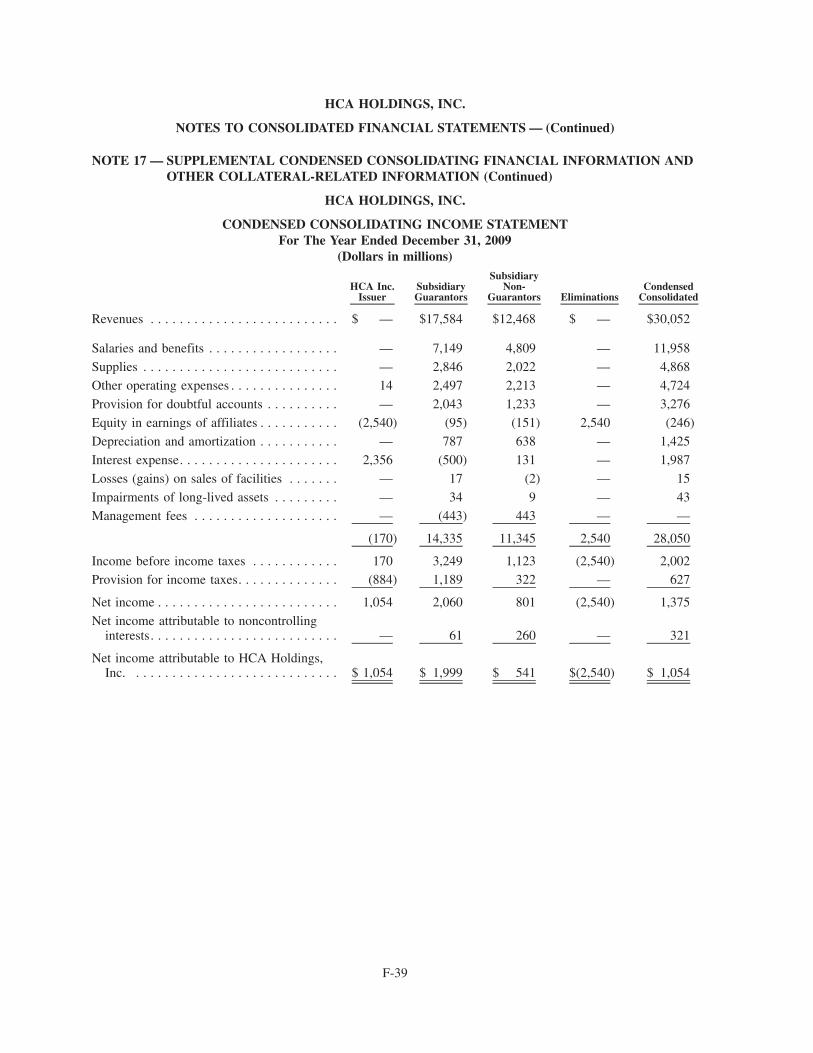
NOTE 17 — SUPPLEMENTAL CONDENSED CONSOLIDATING FINANCIAL INFORMATION ANDOTHER COLLATERAL-RELATED INFORMATION (Continued)
HCA HOLDINGS, INC.
CONDENSED CONSOLIDATING INCOME STATEMENTFor The Year Ended December 31, 2009
(Dollars in millions)
HCA Inc.Issuer
SubsidiaryGuarantors
SubsidiaryNon-
Guarantors EliminationsCondensed
Consolidated
Revenues . . . . . . . . . . . . . . . . . . . . . . . . . . $ — $17,584 $12,468 $ — $30,052
Salaries and benefits . . . . . . . . . . . . . . . . . . — 7,149 4,809 — 11,958
Supplies . . . . . . . . . . . . . . . . . . . . . . . . . . . — 2,846 2,022 — 4,868
Other operating expenses . . . . . . . . . . . . . . . 14 2,497 2,213 — 4,724
Provision for doubtful accounts . . . . . . . . . . — 2,043 1,233 — 3,276
Equity in earnings of affiliates . . . . . . . . . . . (2,540) (95) (151) 2,540 (246)
Depreciation and amortization . . . . . . . . . . . — 787 638 — 1,425
Interest expense. . . . . . . . . . . . . . . . . . . . . . 2,356 (500) 131 — 1,987
Losses (gains) on sales of facilities . . . . . . . — 17 (2) — 15
Impairments of long-lived assets . . . . . . . . . — 34 9 — 43
Management fees . . . . . . . . . . . . . . . . . . . . — (443) 443 — —
(170) 14,335 11,345 2,540 28,050
Income before income taxes . . . . . . . . . . . . 170 3,249 1,123 (2,540) 2,002Provision for income taxes. . . . . . . . . . . . . . (884) 1,189 322 — 627
Net income . . . . . . . . . . . . . . . . . . . . . . . . . 1,054 2,060 801 (2,540) 1,375
Net income attributable to noncontrollinginterests. . . . . . . . . . . . . . . . . . . . . . . . . . — 61 260 — 321
Net income attributable to HCA Holdings,Inc. . . . . . . . . . . . . . . . . . . . . . . . . . . . . $ 1,054 $ 1,999 $ 541 $(2,540) $ 1,054
F-39
HCA HOLDINGS, INC.
NOTES TO CONSOLIDATED FINANCIAL STATEMENTS — (Continued)
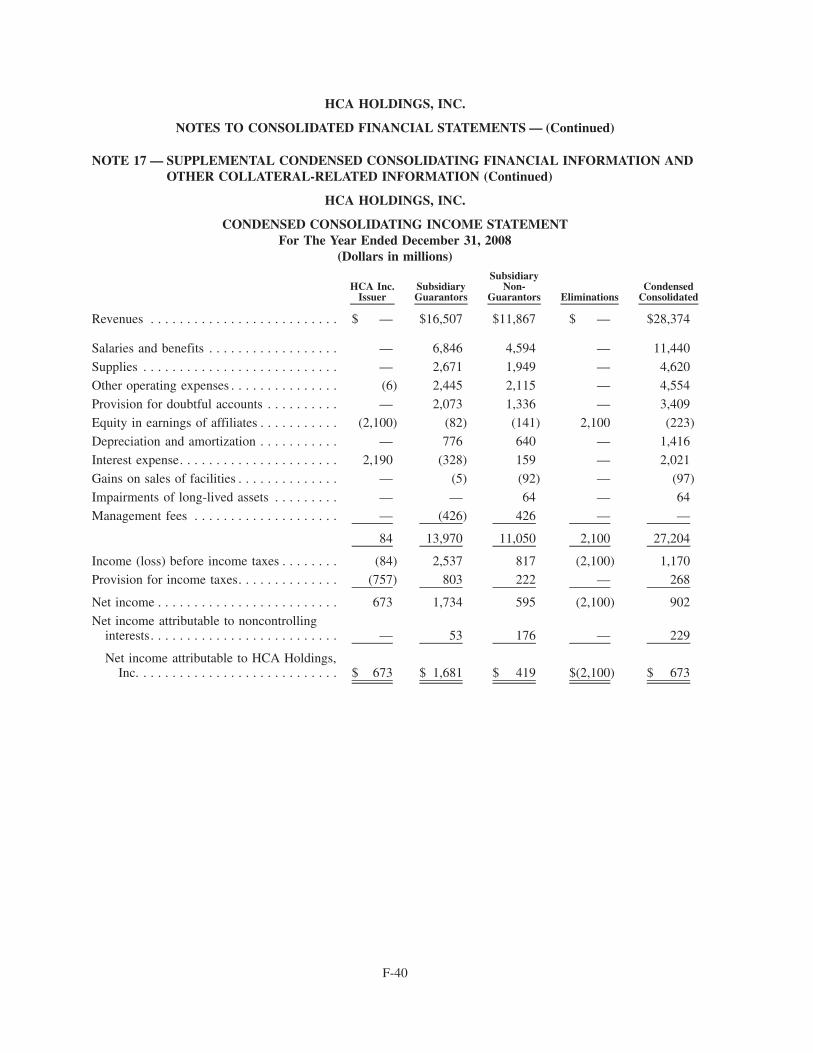
NOTE 17 — SUPPLEMENTAL CONDENSED CONSOLIDATING FINANCIAL INFORMATION ANDOTHER COLLATERAL-RELATED INFORMATION (Continued)
HCA HOLDINGS, INC.
CONDENSED CONSOLIDATING INCOME STATEMENTFor The Year Ended December 31, 2008
(Dollars in millions)
HCA Inc.Issuer
SubsidiaryGuarantors
SubsidiaryNon-
Guarantors EliminationsCondensed
Consolidated
Revenues . . . . . . . . . . . . . . . . . . . . . . . . . . $ — $16,507 $11,867 $ — $28,374
Salaries and benefits . . . . . . . . . . . . . . . . . . — 6,846 4,594 — 11,440
Supplies . . . . . . . . . . . . . . . . . . . . . . . . . . . — 2,671 1,949 — 4,620
Other operating expenses . . . . . . . . . . . . . . . (6) 2,445 2,115 — 4,554
Provision for doubtful accounts . . . . . . . . . . — 2,073 1,336 — 3,409
Equity in earnings of affiliates . . . . . . . . . . . (2,100) (82) (141) 2,100 (223)
Depreciation and amortization . . . . . . . . . . . — 776 640 — 1,416
Interest expense. . . . . . . . . . . . . . . . . . . . . . 2,190 (328) 159 — 2,021
Gains on sales of facilities . . . . . . . . . . . . . . — (5) (92) — (97)
Impairments of long-lived assets . . . . . . . . . — — 64 — 64
Management fees . . . . . . . . . . . . . . . . . . . . — (426) 426 — —
84 13,970 11,050 2,100 27,204
Income (loss) before income taxes . . . . . . . . (84) 2,537 817 (2,100) 1,170Provision for income taxes. . . . . . . . . . . . . . (757) 803 222 — 268
Net income . . . . . . . . . . . . . . . . . . . . . . . . . 673 1,734 595 (2,100) 902
Net income attributable to noncontrollinginterests. . . . . . . . . . . . . . . . . . . . . . . . . . — 53 176 — 229
Net income attributable to HCA Holdings,Inc. . . . . . . . . . . . . . . . . . . . . . . . . . . . $ 673 $ 1,681 $ 419 $(2,100) $ 673
F-40
HCA HOLDINGS, INC.
NOTES TO CONSOLIDATED FINANCIAL STATEMENTS — (Continued)
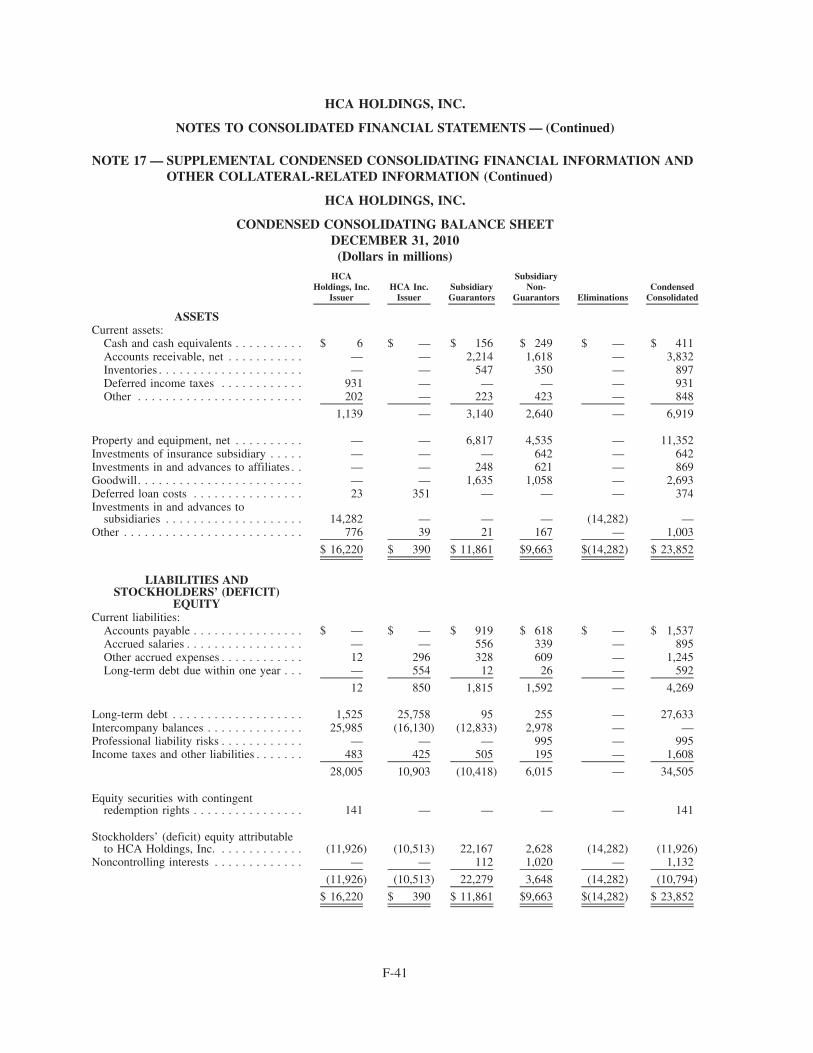
NOTE 17 — SUPPLEMENTAL CONDENSED CONSOLIDATING FINANCIAL INFORMATION ANDOTHER COLLATERAL-RELATED INFORMATION (Continued)
HCA HOLDINGS, INC.
CONDENSED CONSOLIDATING BALANCE SHEETDECEMBER 31, 2010
(Dollars in millions)HCA
Holdings, Inc.Issuer
HCA Inc.Issuer
SubsidiaryGuarantors
SubsidiaryNon-
Guarantors EliminationsCondensed
Consolidated
ASSETSCurrent assets:
Cash and cash equivalents . . . . . . . . . . $ 6 $ — $ 156 $ 249 $ — $ 411Accounts receivable, net . . . . . . . . . . . — — 2,214 1,618 — 3,832Inventories . . . . . . . . . . . . . . . . . . . . . — — 547 350 — 897Deferred income taxes . . . . . . . . . . . . 931 — — — — 931Other . . . . . . . . . . . . . . . . . . . . . . . . 202 — 223 423 — 848
1,139 — 3,140 2,640 — 6,919
Property and equipment, net . . . . . . . . . . — — 6,817 4,535 — 11,352Investments of insurance subsidiary . . . . . — — — 642 — 642Investments in and advances to affiliates . . — — 248 621 — 869Goodwill. . . . . . . . . . . . . . . . . . . . . . . . — — 1,635 1,058 — 2,693Deferred loan costs . . . . . . . . . . . . . . . . 23 351 — — — 374Investments in and advances to
subsidiaries . . . . . . . . . . . . . . . . . . . . 14,282 — — — (14,282) —Other . . . . . . . . . . . . . . . . . . . . . . . . . . 776 39 21 167 — 1,003
$ 16,220 $ 390 $ 11,861 $9,663 $(14,282) $ 23,852
LIABILITIES ANDSTOCKHOLDERS’ (DEFICIT)
EQUITYCurrent liabilities:
Accounts payable . . . . . . . . . . . . . . . . $ — $ — $ 919 $ 618 $ — $ 1,537Accrued salaries . . . . . . . . . . . . . . . . . — — 556 339 — 895Other accrued expenses . . . . . . . . . . . . 12 296 328 609 — 1,245Long-term debt due within one year . . . — 554 12 26 — 592
12 850 1,815 1,592 — 4,269
Long-term debt . . . . . . . . . . . . . . . . . . . 1,525 25,758 95 255 — 27,633Intercompany balances . . . . . . . . . . . . . . 25,985 (16,130) (12,833) 2,978 — —Professional liability risks . . . . . . . . . . . . — — — 995 — 995Income taxes and other liabilities . . . . . . . 483 425 505 195 — 1,608
28,005 10,903 (10,418) 6,015 — 34,505
Equity securities with contingentredemption rights . . . . . . . . . . . . . . . . 141 — — — — 141
Stockholders’ (deficit) equity attributableto HCA Holdings, Inc. . . . . . . . . . . . . (11,926) (10,513) 22,167 2,628 (14,282) (11,926)
Noncontrolling interests . . . . . . . . . . . . . — — 112 1,020 — 1,132
(11,926) (10,513) 22,279 3,648 (14,282) (10,794)
$ 16,220 $ 390 $ 11,861 $9,663 $(14,282) $ 23,852
F-41
HCA HOLDINGS, INC.
NOTES TO CONSOLIDATED FINANCIAL STATEMENTS — (Continued)
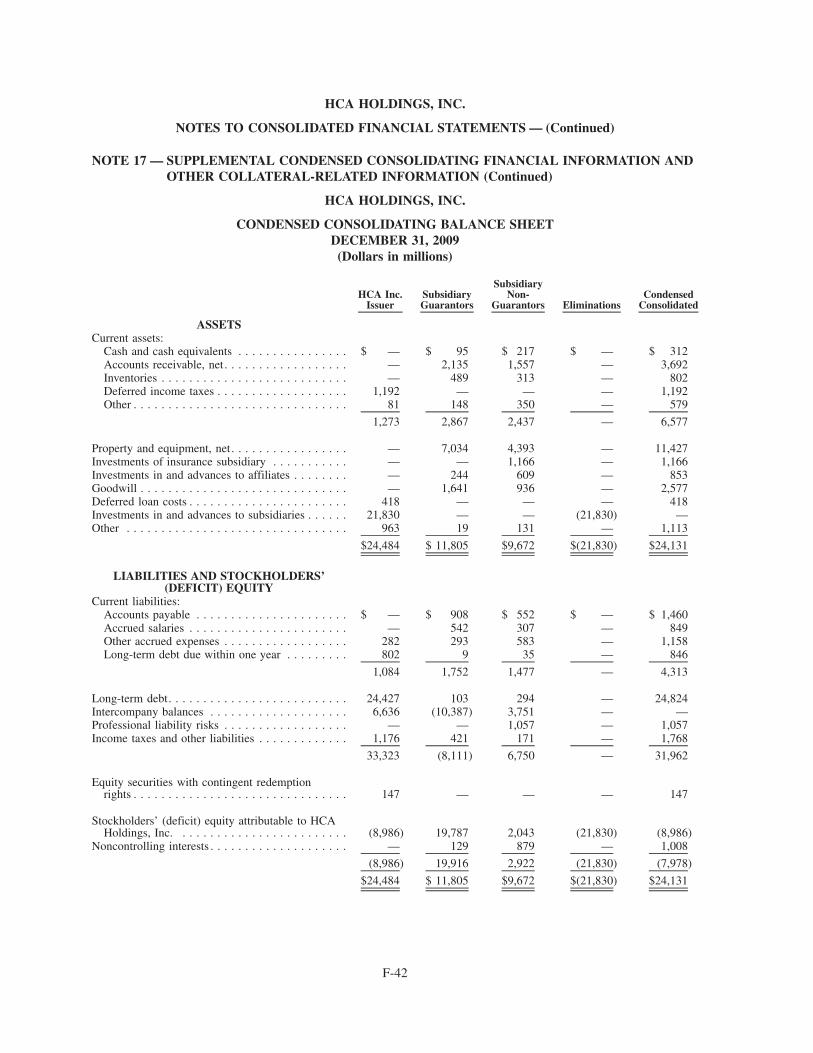
NOTE 17 — SUPPLEMENTAL CONDENSED CONSOLIDATING FINANCIAL INFORMATION ANDOTHER COLLATERAL-RELATED INFORMATION (Continued)
HCA HOLDINGS, INC.
CONDENSED CONSOLIDATING BALANCE SHEETDECEMBER 31, 2009
(Dollars in millions)
HCA Inc.Issuer
SubsidiaryGuarantors
SubsidiaryNon-
Guarantors EliminationsCondensed
Consolidated
ASSETSCurrent assets:
Cash and cash equivalents . . . . . . . . . . . . . . . . $ — $ 95 $ 217 $ — $ 312Accounts receivable, net. . . . . . . . . . . . . . . . . . — 2,135 1,557 — 3,692Inventories . . . . . . . . . . . . . . . . . . . . . . . . . . . — 489 313 — 802Deferred income taxes . . . . . . . . . . . . . . . . . . . 1,192 — — — 1,192Other . . . . . . . . . . . . . . . . . . . . . . . . . . . . . . . 81 148 350 — 579
1,273 2,867 2,437 — 6,577
Property and equipment, net. . . . . . . . . . . . . . . . . — 7,034 4,393 — 11,427Investments of insurance subsidiary . . . . . . . . . . . — — 1,166 — 1,166Investments in and advances to affiliates . . . . . . . . — 244 609 — 853Goodwill . . . . . . . . . . . . . . . . . . . . . . . . . . . . . . — 1,641 936 — 2,577Deferred loan costs . . . . . . . . . . . . . . . . . . . . . . . 418 — — — 418Investments in and advances to subsidiaries . . . . . . 21,830 — — (21,830) —Other . . . . . . . . . . . . . . . . . . . . . . . . . . . . . . . . 963 19 131 — 1,113
$24,484 $ 11,805 $9,672 $(21,830) $24,131
LIABILITIES AND STOCKHOLDERS’(DEFICIT) EQUITY
Current liabilities:Accounts payable . . . . . . . . . . . . . . . . . . . . . . $ — $ 908 $ 552 $ — $ 1,460Accrued salaries . . . . . . . . . . . . . . . . . . . . . . . — 542 307 — 849Other accrued expenses . . . . . . . . . . . . . . . . . . 282 293 583 — 1,158Long-term debt due within one year . . . . . . . . . 802 9 35 — 846
1,084 1,752 1,477 — 4,313
Long-term debt. . . . . . . . . . . . . . . . . . . . . . . . . . 24,427 103 294 — 24,824Intercompany balances . . . . . . . . . . . . . . . . . . . . 6,636 (10,387) 3,751 — —Professional liability risks . . . . . . . . . . . . . . . . . . — — 1,057 — 1,057Income taxes and other liabilities . . . . . . . . . . . . . 1,176 421 171 — 1,768
33,323 (8,111) 6,750 — 31,962
Equity securities with contingent redemptionrights . . . . . . . . . . . . . . . . . . . . . . . . . . . . . . . 147 — — — 147
Stockholders’ (deficit) equity attributable to HCAHoldings, Inc. . . . . . . . . . . . . . . . . . . . . . . . . (8,986) 19,787 2,043 (21,830) (8,986)
Noncontrolling interests . . . . . . . . . . . . . . . . . . . . — 129 879 — 1,008
(8,986) 19,916 2,922 (21,830) (7,978)
$24,484 $ 11,805 $9,672 $(21,830) $24,131
F-42
HCA HOLDINGS, INC.
NOTES TO CONSOLIDATED FINANCIAL STATEMENTS — (Continued)
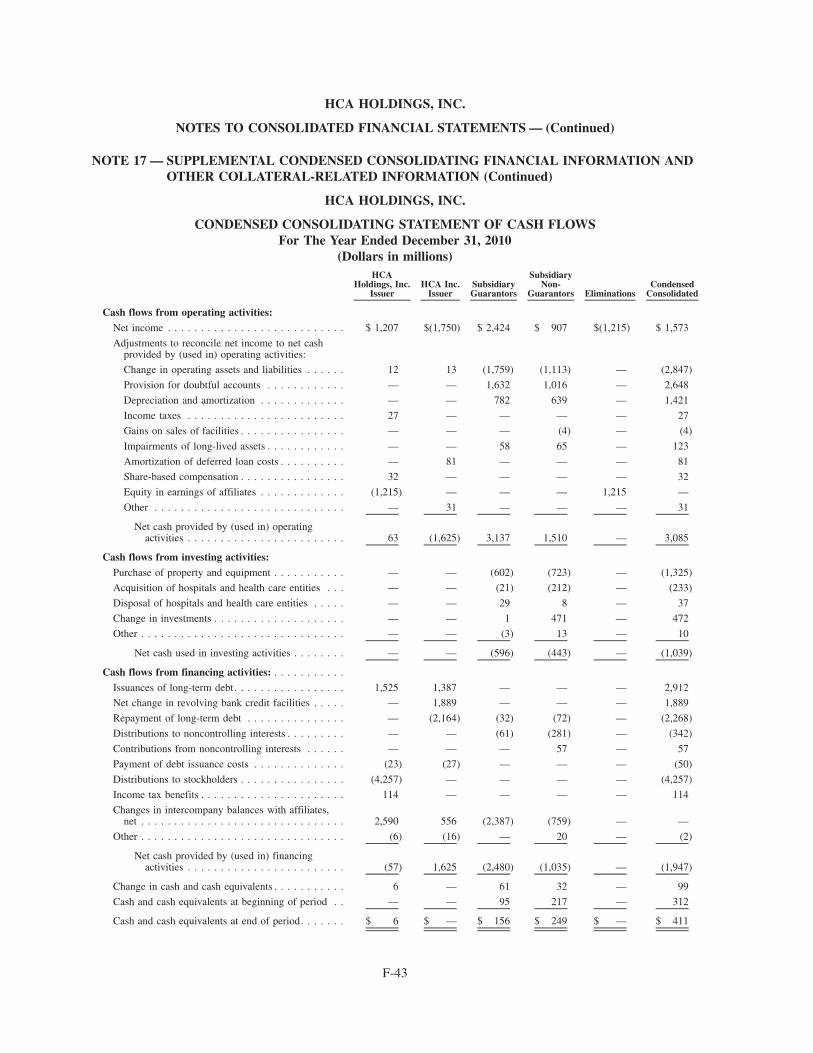
NOTE 17 — SUPPLEMENTAL CONDENSED CONSOLIDATING FINANCIAL INFORMATION ANDOTHER COLLATERAL-RELATED INFORMATION (Continued)
HCA HOLDINGS, INC.
CONDENSED CONSOLIDATING STATEMENT OF CASH FLOWSFor The Year Ended December 31, 2010
(Dollars in millions)HCA
Holdings, Inc.Issuer
HCA Inc.Issuer
SubsidiaryGuarantors
SubsidiaryNon-
Guarantors EliminationsCondensed
Consolidated
Cash flows from operating activities:Net income . . . . . . . . . . . . . . . . . . . . . . . . . . . $ 1,207 $(1,750) $ 2,424 $ 907 $(1,215) $ 1,573
Adjustments to reconcile net income to net cashprovided by (used in) operating activities:
Change in operating assets and liabilities . . . . . . 12 13 (1,759) (1,113) — (2,847)
Provision for doubtful accounts . . . . . . . . . . . . — — 1,632 1,016 — 2,648
Depreciation and amortization . . . . . . . . . . . . . — — 782 639 — 1,421
Income taxes . . . . . . . . . . . . . . . . . . . . . . . . 27 — — — — 27
Gains on sales of facilities . . . . . . . . . . . . . . . . — — — (4) — (4)
Impairments of long-lived assets . . . . . . . . . . . . — — 58 65 — 123
Amortization of deferred loan costs . . . . . . . . . . — 81 — — — 81
Share-based compensation . . . . . . . . . . . . . . . . 32 — — — — 32
Equity in earnings of affiliates . . . . . . . . . . . . . (1,215) — — — 1,215 —
Other . . . . . . . . . . . . . . . . . . . . . . . . . . . . . — 31 — — — 31
Net cash provided by (used in) operatingactivities . . . . . . . . . . . . . . . . . . . . . . . . 63 (1,625) 3,137 1,510 — 3,085
Cash flows from investing activities:Purchase of property and equipment . . . . . . . . . . . — — (602) (723) — (1,325)
Acquisition of hospitals and health care entities . . . — — (21) (212) — (233)
Disposal of hospitals and health care entities . . . . . — — 29 8 — 37
Change in investments . . . . . . . . . . . . . . . . . . . . — — 1 471 — 472
Other . . . . . . . . . . . . . . . . . . . . . . . . . . . . . . . — — (3) 13 — 10
Net cash used in investing activities . . . . . . . . — — (596) (443) — (1,039)
Cash flows from financing activities: . . . . . . . . . . .
Issuances of long-term debt. . . . . . . . . . . . . . . . . 1,525 1,387 — — — 2,912
Net change in revolving bank credit facilities . . . . . — 1,889 — — — 1,889
Repayment of long-term debt . . . . . . . . . . . . . . . — (2,164) (32) (72) — (2,268)
Distributions to noncontrolling interests . . . . . . . . . — — (61) (281) — (342)
Contributions from noncontrolling interests . . . . . . — — — 57 — 57
Payment of debt issuance costs . . . . . . . . . . . . . . (23) (27) — — — (50)
Distributions to stockholders . . . . . . . . . . . . . . . . (4,257) — — — — (4,257)
Income tax benefits . . . . . . . . . . . . . . . . . . . . . . 114 — — — — 114
Changes in intercompany balances with affiliates,net . . . . . . . . . . . . . . . . . . . . . . . . . . . . . . . 2,590 556 (2,387) (759) — —
Other . . . . . . . . . . . . . . . . . . . . . . . . . . . . . . . (6) (16) — 20 — (2)
Net cash provided by (used in) financingactivities . . . . . . . . . . . . . . . . . . . . . . . . (57) 1,625 (2,480) (1,035) — (1,947)
Change in cash and cash equivalents . . . . . . . . . . . 6 — 61 32 — 99
Cash and cash equivalents at beginning of period . . — — 95 217 — 312
Cash and cash equivalents at end of period. . . . . . . $ 6 $ — $ 156 $ 249 $ — $ 411
F-43
HCA HOLDINGS, INC.
NOTES TO CONSOLIDATED FINANCIAL STATEMENTS — (Continued)
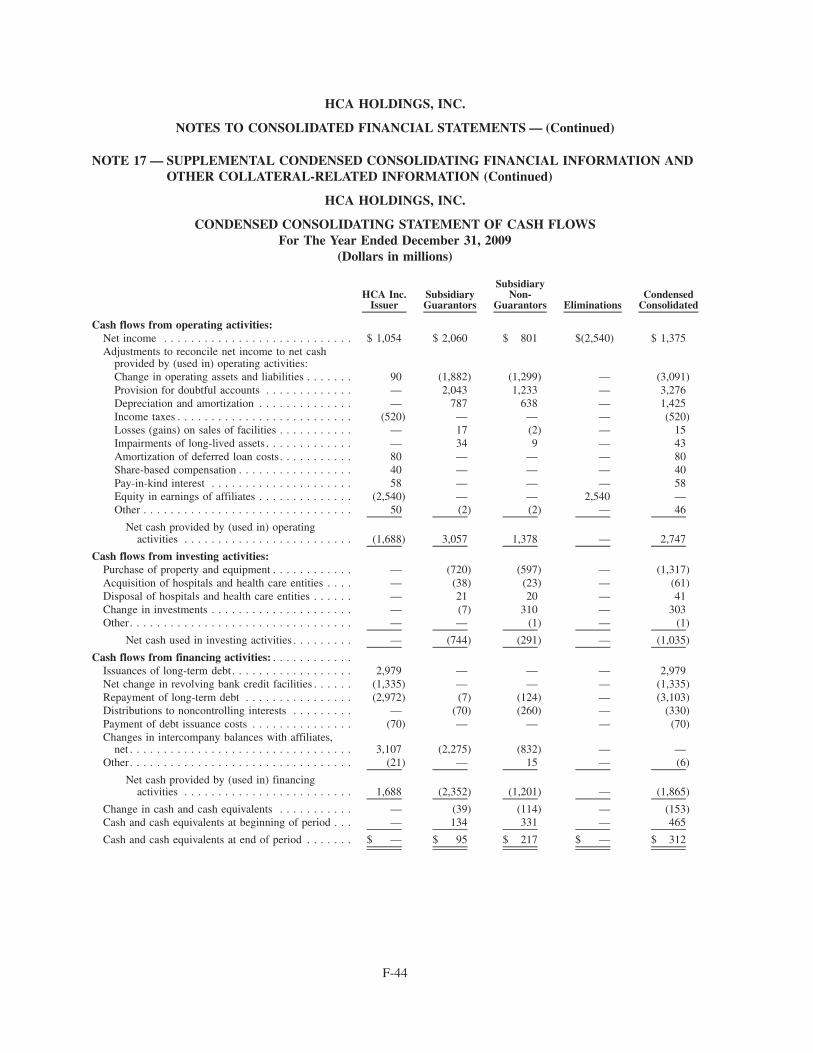
NOTE 17 — SUPPLEMENTAL CONDENSED CONSOLIDATING FINANCIAL INFORMATION ANDOTHER COLLATERAL-RELATED INFORMATION (Continued)
HCA HOLDINGS, INC.
CONDENSED CONSOLIDATING STATEMENT OF CASH FLOWSFor The Year Ended December 31, 2009
(Dollars in millions)
HCA Inc.Issuer
SubsidiaryGuarantors
SubsidiaryNon-
Guarantors EliminationsCondensed
Consolidated
Cash flows from operating activities:Net income . . . . . . . . . . . . . . . . . . . . . . . . . . . . $ 1,054 $ 2,060 $ 801 $(2,540) $ 1,375Adjustments to reconcile net income to net cash
provided by (used in) operating activities:Change in operating assets and liabilities . . . . . . . 90 (1,882) (1,299) — (3,091)Provision for doubtful accounts . . . . . . . . . . . . . — 2,043 1,233 — 3,276Depreciation and amortization . . . . . . . . . . . . . . — 787 638 — 1,425Income taxes . . . . . . . . . . . . . . . . . . . . . . . . . . (520) — — — (520)Losses (gains) on sales of facilities . . . . . . . . . . . — 17 (2) — 15Impairments of long-lived assets . . . . . . . . . . . . . — 34 9 — 43Amortization of deferred loan costs. . . . . . . . . . . 80 — — — 80Share-based compensation . . . . . . . . . . . . . . . . . 40 — — — 40Pay-in-kind interest . . . . . . . . . . . . . . . . . . . . . 58 — — — 58Equity in earnings of affiliates . . . . . . . . . . . . . . (2,540) — — 2,540 —Other . . . . . . . . . . . . . . . . . . . . . . . . . . . . . . . 50 (2) (2) — 46
Net cash provided by (used in) operatingactivities . . . . . . . . . . . . . . . . . . . . . . . . . (1,688) 3,057 1,378 — 2,747
Cash flows from investing activities:Purchase of property and equipment . . . . . . . . . . . . — (720) (597) — (1,317)Acquisition of hospitals and health care entities . . . . — (38) (23) — (61)Disposal of hospitals and health care entities . . . . . . — 21 20 — 41Change in investments . . . . . . . . . . . . . . . . . . . . . — (7) 310 — 303Other. . . . . . . . . . . . . . . . . . . . . . . . . . . . . . . . . — — (1) — (1)
Net cash used in investing activities . . . . . . . . . — (744) (291) — (1,035)
Cash flows from financing activities: . . . . . . . . . . . .Issuances of long-term debt. . . . . . . . . . . . . . . . . . 2,979 — — — 2,979Net change in revolving bank credit facilities . . . . . . (1,335) — — — (1,335)Repayment of long-term debt . . . . . . . . . . . . . . . . (2,972) (7) (124) — (3,103)Distributions to noncontrolling interests . . . . . . . . . — (70) (260) — (330)Payment of debt issuance costs . . . . . . . . . . . . . . . (70) — — — (70)Changes in intercompany balances with affiliates,
net . . . . . . . . . . . . . . . . . . . . . . . . . . . . . . . . . 3,107 (2,275) (832) — —Other. . . . . . . . . . . . . . . . . . . . . . . . . . . . . . . . . (21) — 15 — (6)
Net cash provided by (used in) financingactivities . . . . . . . . . . . . . . . . . . . . . . . . . 1,688 (2,352) (1,201) — (1,865)
Change in cash and cash equivalents . . . . . . . . . . . — (39) (114) — (153)Cash and cash equivalents at beginning of period . . . — 134 331 — 465
Cash and cash equivalents at end of period . . . . . . . $ — $ 95 $ 217 $ — $ 312
F-44
HCA HOLDINGS, INC.
NOTES TO CONSOLIDATED FINANCIAL STATEMENTS — (Continued)
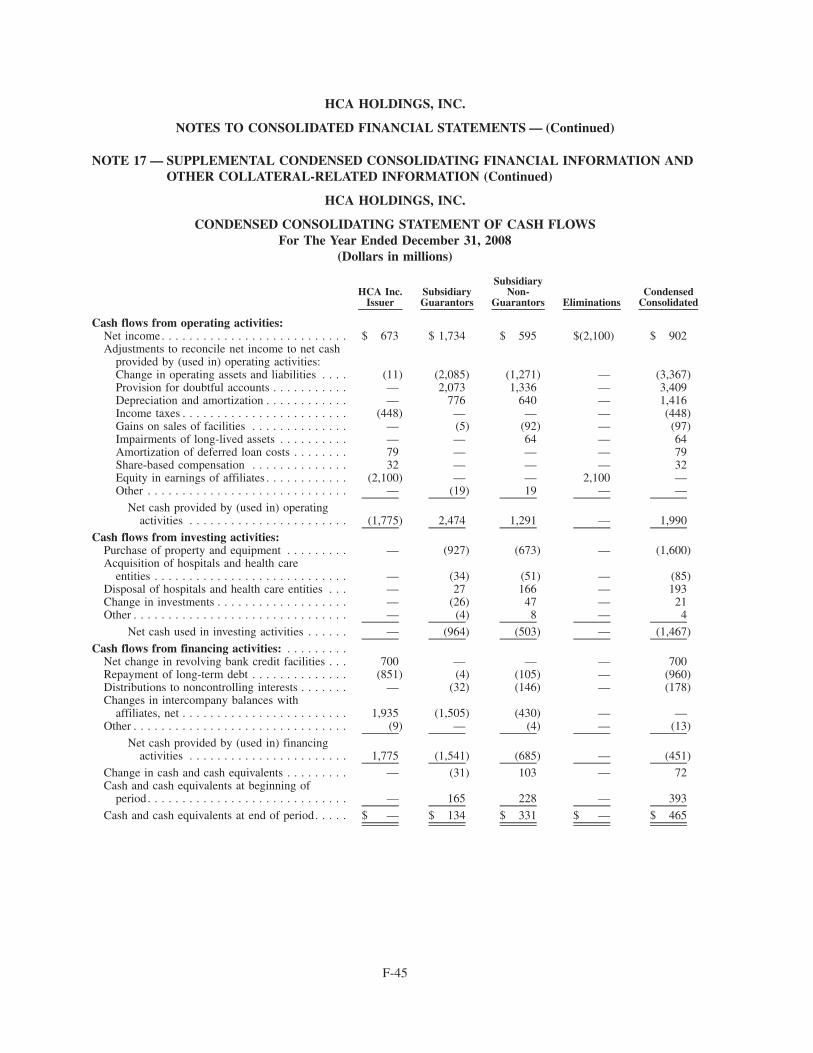
NOTE 17 — SUPPLEMENTAL CONDENSED CONSOLIDATING FINANCIAL INFORMATION ANDOTHER COLLATERAL-RELATED INFORMATION (Continued)
HCA HOLDINGS, INC.
CONDENSED CONSOLIDATING STATEMENT OF CASH FLOWSFor The Year Ended December 31, 2008
(Dollars in millions)
HCA Inc.Issuer
SubsidiaryGuarantors
SubsidiaryNon-
Guarantors EliminationsCondensed
Consolidated
Cash flows from operating activities:Net income. . . . . . . . . . . . . . . . . . . . . . . . . . . $ 673 $ 1,734 $ 595 $(2,100) $ 902Adjustments to reconcile net income to net cash
provided by (used in) operating activities:Change in operating assets and liabilities . . . . (11) (2,085) (1,271) — (3,367)Provision for doubtful accounts . . . . . . . . . . . — 2,073 1,336 — 3,409Depreciation and amortization . . . . . . . . . . . . — 776 640 — 1,416Income taxes . . . . . . . . . . . . . . . . . . . . . . . . (448) — — — (448)Gains on sales of facilities . . . . . . . . . . . . . . — (5) (92) — (97)Impairments of long-lived assets . . . . . . . . . . — — 64 — 64Amortization of deferred loan costs . . . . . . . . 79 — — — 79Share-based compensation . . . . . . . . . . . . . . 32 — — — 32Equity in earnings of affiliates . . . . . . . . . . . . (2,100) — — 2,100 —Other . . . . . . . . . . . . . . . . . . . . . . . . . . . . . — (19) 19 — —
Net cash provided by (used in) operatingactivities . . . . . . . . . . . . . . . . . . . . . . . (1,775) 2,474 1,291 — 1,990
Cash flows from investing activities:Purchase of property and equipment . . . . . . . . . — (927) (673) — (1,600)Acquisition of hospitals and health care
entities . . . . . . . . . . . . . . . . . . . . . . . . . . . . — (34) (51) — (85)Disposal of hospitals and health care entities . . . — 27 166 — 193Change in investments . . . . . . . . . . . . . . . . . . . — (26) 47 — 21Other . . . . . . . . . . . . . . . . . . . . . . . . . . . . . . . — (4) 8 — 4
Net cash used in investing activities . . . . . . — (964) (503) — (1,467)
Cash flows from financing activities: . . . . . . . . .Net change in revolving bank credit facilities . . . 700 — — — 700Repayment of long-term debt . . . . . . . . . . . . . . (851) (4) (105) — (960)Distributions to noncontrolling interests . . . . . . . — (32) (146) — (178)Changes in intercompany balances with
affiliates, net . . . . . . . . . . . . . . . . . . . . . . . . 1,935 (1,505) (430) — —Other . . . . . . . . . . . . . . . . . . . . . . . . . . . . . . . (9) — (4) — (13)
Net cash provided by (used in) financingactivities . . . . . . . . . . . . . . . . . . . . . . . 1,775 (1,541) (685) — (451)
Change in cash and cash equivalents . . . . . . . . . — (31) 103 — 72Cash and cash equivalents at beginning of
period. . . . . . . . . . . . . . . . . . . . . . . . . . . . . — 165 228 — 393
Cash and cash equivalents at end of period. . . . . $ — $ 134 $ 331 $ — $ 465
F-45
HCA HOLDINGS, INC.
NOTES TO CONSOLIDATED FINANCIAL STATEMENTS — (Continued)
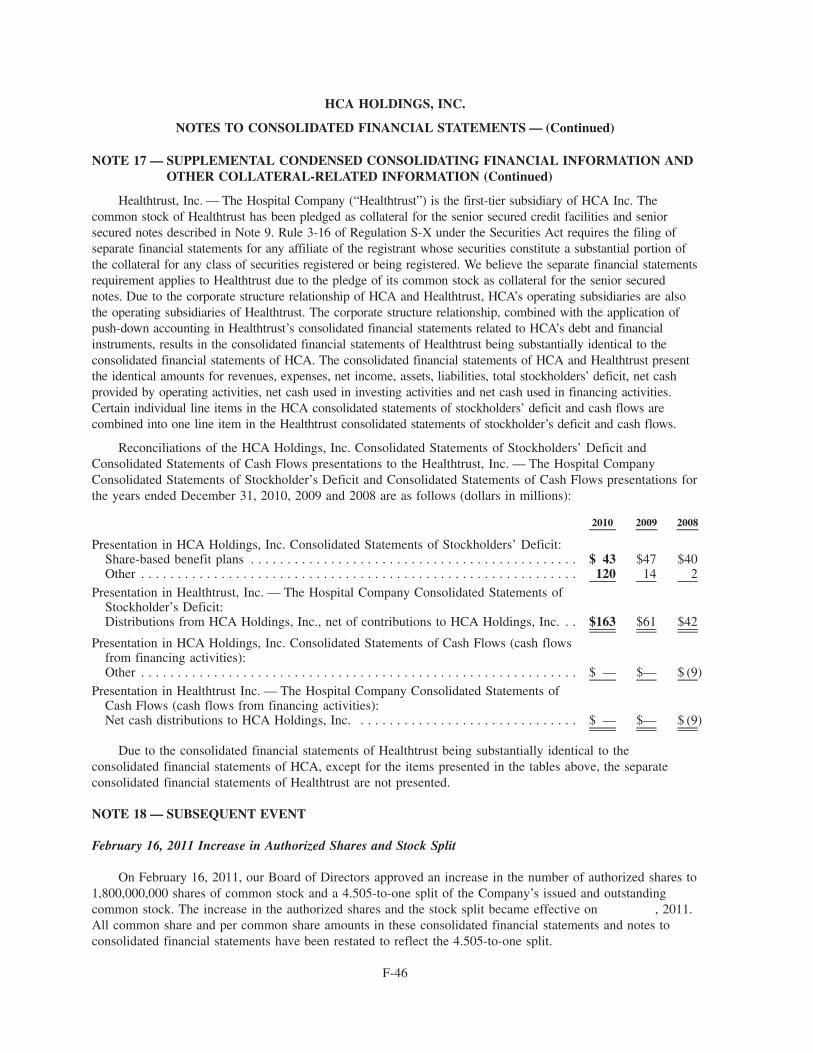
NOTE 17 — SUPPLEMENTAL CONDENSED CONSOLIDATING FINANCIAL INFORMATION ANDOTHER COLLATERAL-RELATED INFORMATION (Continued)
Healthtrust, Inc. — The Hospital Company (“Healthtrust”) is the first-tier subsidiary of HCA Inc. Thecommon stock of Healthtrust has been pledged as collateral for the senior secured credit facilities and seniorsecured notes described in Note 9. Rule 3-16 of Regulation S-X under the Securities Act requires the filing ofseparate financial statements for any affiliate of the registrant whose securities constitute a substantial portion ofthe collateral for any class of securities registered or being registered. We believe the separate financial statementsrequirement applies to Healthtrust due to the pledge of its common stock as collateral for the senior securednotes. Due to the corporate structure relationship of HCA and Healthtrust, HCA’s operating subsidiaries are alsothe operating subsidiaries of Healthtrust. The corporate structure relationship, combined with the application ofpush-down accounting in Healthtrust’s consolidated financial statements related to HCA’s debt and financialinstruments, results in the consolidated financial statements of Healthtrust being substantially identical to theconsolidated financial statements of HCA. The consolidated financial statements of HCA and Healthtrust presentthe identical amounts for revenues, expenses, net income, assets, liabilities, total stockholders’ deficit, net cashprovided by operating activities, net cash used in investing activities and net cash used in financing activities.Certain individual line items in the HCA consolidated statements of stockholders’ deficit and cash flows arecombined into one line item in the Healthtrust consolidated statements of stockholder’s deficit and cash flows.
Reconciliations of the HCA Holdings, Inc. Consolidated Statements of Stockholders’ Deficit andConsolidated Statements of Cash Flows presentations to the Healthtrust, Inc. — The Hospital CompanyConsolidated Statements of Stockholder’s Deficit and Consolidated Statements of Cash Flows presentations forthe years ended December 31, 2010, 2009 and 2008 are as follows (dollars in millions):
2010 2009 2008
Presentation in HCA Holdings, Inc. Consolidated Statements of Stockholders’ Deficit:Share-based benefit plans . . . . . . . . . . . . . . . . . . . . . . . . . . . . . . . . . . . . . . . . . . . . . $ 43 $47 $40Other . . . . . . . . . . . . . . . . . . . . . . . . . . . . . . . . . . . . . . . . . . . . . . . . . . . . . . . . . . . . 120 14 2
Presentation in Healthtrust, Inc. — The Hospital Company Consolidated Statements ofStockholder’s Deficit:Distributions from HCA Holdings, Inc., net of contributions to HCA Holdings, Inc. . . $163 $61 $42
Presentation in HCA Holdings, Inc. Consolidated Statements of Cash Flows (cash flowsfrom financing activities):Other . . . . . . . . . . . . . . . . . . . . . . . . . . . . . . . . . . . . . . . . . . . . . . . . . . . . . . . . . . . . $ — $— $ (9)
Presentation in Healthtrust Inc. — The Hospital Company Consolidated Statements ofCash Flows (cash flows from financing activities):Net cash distributions to HCA Holdings, Inc. . . . . . . . . . . . . . . . . . . . . . . . . . . . . . . $ — $— $ (9)
Due to the consolidated financial statements of Healthtrust being substantially identical to theconsolidated financial statements of HCA, except for the items presented in the tables above, the separateconsolidated financial statements of Healthtrust are not presented.
NOTE 18 — SUBSEQUENT EVENT
February 16, 2011 Increase in Authorized Shares and Stock Split
On February 16, 2011, our Board of Directors approved an increase in the number of authorized shares to1,800,000,000 shares of common stock and a 4.505-to-one split of the Company’s issued and outstandingcommon stock. The increase in the authorized shares and the stock split became effective on , 2011.All common share and per common share amounts in these consolidated financial statements and notes toconsolidated financial statements have been restated to reflect the 4.505-to-one split.
F-46
HCA HOLDINGS, INC.
NOTES TO CONSOLIDATED FINANCIAL STATEMENTS — (Continued)
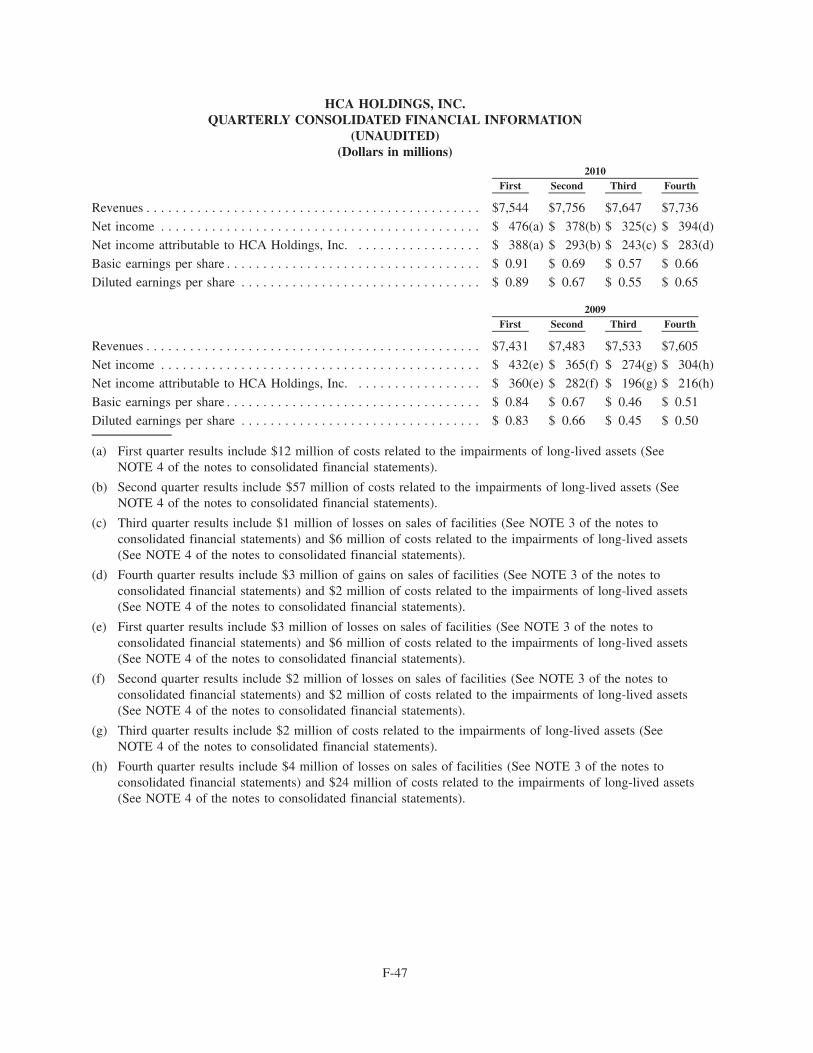
HCA HOLDINGS, INC.QUARTERLY CONSOLIDATED FINANCIAL INFORMATION
(UNAUDITED)(Dollars in millions)
First Second Third Fourth2010
Revenues . . . . . . . . . . . . . . . . . . . . . . . . . . . . . . . . . . . . . . . . . . . . . . $7,544 $7,756 $7,647 $7,736
Net income . . . . . . . . . . . . . . . . . . . . . . . . . . . . . . . . . . . . . . . . . . . . $ 476(a) $ 378(b) $ 325(c) $ 394(d)
Net income attributable to HCA Holdings, Inc. . . . . . . . . . . . . . . . . . $ 388(a) $ 293(b) $ 243(c) $ 283(d)
Basic earnings per share . . . . . . . . . . . . . . . . . . . . . . . . . . . . . . . . . . . $ 0.91 $ 0.69 $ 0.57 $ 0.66
Diluted earnings per share . . . . . . . . . . . . . . . . . . . . . . . . . . . . . . . . . $ 0.89 $ 0.67 $ 0.55 $ 0.65
First Second Third Fourth2009
Revenues . . . . . . . . . . . . . . . . . . . . . . . . . . . . . . . . . . . . . . . . . . . . . . $7,431 $7,483 $7,533 $7,605
Net income . . . . . . . . . . . . . . . . . . . . . . . . . . . . . . . . . . . . . . . . . . . . $ 432(e) $ 365(f) $ 274(g) $ 304(h)
Net income attributable to HCA Holdings, Inc. . . . . . . . . . . . . . . . . . $ 360(e) $ 282(f) $ 196(g) $ 216(h)
Basic earnings per share . . . . . . . . . . . . . . . . . . . . . . . . . . . . . . . . . . . $ 0.84 $ 0.67 $ 0.46 $ 0.51
Diluted earnings per share . . . . . . . . . . . . . . . . . . . . . . . . . . . . . . . . . $ 0.83 $ 0.66 $ 0.45 $ 0.50
(a) First quarter results include $12 million of costs related to the impairments of long-lived assets (SeeNOTE 4 of the notes to consolidated financial statements).
(b) Second quarter results include $57 million of costs related to the impairments of long-lived assets (SeeNOTE 4 of the notes to consolidated financial statements).
(c) Third quarter results include $1 million of losses on sales of facilities (See NOTE 3 of the notes toconsolidated financial statements) and $6 million of costs related to the impairments of long-lived assets(See NOTE 4 of the notes to consolidated financial statements).
(d) Fourth quarter results include $3 million of gains on sales of facilities (See NOTE 3 of the notes toconsolidated financial statements) and $2 million of costs related to the impairments of long-lived assets(See NOTE 4 of the notes to consolidated financial statements).
(e) First quarter results include $3 million of losses on sales of facilities (See NOTE 3 of the notes toconsolidated financial statements) and $6 million of costs related to the impairments of long-lived assets(See NOTE 4 of the notes to consolidated financial statements).
(f) Second quarter results include $2 million of losses on sales of facilities (See NOTE 3 of the notes toconsolidated financial statements) and $2 million of costs related to the impairments of long-lived assets(See NOTE 4 of the notes to consolidated financial statements).
(g) Third quarter results include $2 million of costs related to the impairments of long-lived assets (SeeNOTE 4 of the notes to consolidated financial statements).
(h) Fourth quarter results include $4 million of losses on sales of facilities (See NOTE 3 of the notes toconsolidated financial statements) and $24 million of costs related to the impairments of long-lived assets(See NOTE 4 of the notes to consolidated financial statements).
F-47
Through and including , 2011 (the 25th day after the date of this prospectus), all dealers effectingtransactions in these securities, whether or not participating in this offering, may be required to deliver aprospectus. This is in addition to the dealers’ obligation to deliver a prospectus when acting as underwritersand with respect to their unsold allotments or subscriptions.
124,000,000 Shares
Common Stock
PROSPECTUS
BofA Merrill LynchCiti
J.P. MorganBarclays Capital
Credit SuisseDeutsche Bank Securities
Goldman, Sachs & Co.Morgan Stanley
Wells Fargo SecuritiesCredit Agricole CIB
Mizuho Securities USA Inc.RBC Capital Markets
RBSSMBC Nikko
SunTrust Robinson HumphreyAvondale Partners
BairdCowen and Company
CRT Capital Group LLCLazard Capital Markets
Leerink SwannMorgan Keegan
Oppenheimer & Co.Raymond James
Susquehanna Financial Group, LLLP