Gold and PGE indicator mineral methods in mineral exploration · • Inclusion abundance may...
31
Gold and PGE indicator mineral methods in mineral exploration M.Beth McClenaghan Geological Survey of Canada Workshop B: Indicator Mineral Methods in Mineral Exploration 24th International Applied Geochemistry Symposium May 31, 2009
-
Upload
nguyennguyet -
Category
Documents
-
view
218 -
download
0
Transcript of Gold and PGE indicator mineral methods in mineral exploration · • Inclusion abundance may...
Gold and PGE indicator mineral methodsin mineral exploration
M.Beth McClenaghanGeological Survey of Canada
Workshop B: Indicator Mineral Methods in Mineral Exploration24th International Applied Geochemistry Symposium
May 31, 2009
Presentation Outline
• Gold deposit indicator minerals- gold grain morphology- gold grain compositions and inclusions- examples
• Platinum Group element deposit indicator minerals- PGM grain compositions- PGM morphology- examples
• Processing methods for gold and PGE indicator minerals

Gold Indicator Minerals
• Gold grains are the best indicator mineral for detecting thepresence of gold deposits
• Sulphides (e.g., pyrite, pyrrhotite, arsenopyrite, chalcopyrite,sphalerite, galena)
• Platinum Group Minerals (PGM)
• Tellurides
• Scheelite, rutile
• Secondary minerals (e.g., jarosite, limonite, goethite, pyrolusite)

Gold Grain Characteristics
• Gold grain abundance and grain characteristics been appliedsystematically in the past 35 years in the search for sources
• Most common characteristics used: size, shape and chemicalcomposition
• Because gold is malleable (H=2.5-3), gold grain shape and surfacefeatures will change as they are transported; changes function ofdistance and mode of transport
(P.Sarala)(D. Kelley)

• Grain shapes in streams are usually described in terms of their flatness,roundness, folding, and surface texture and these characteristics can be used toestimate the distance of transport• Shape factor: Cailleux Flatness Index FI = a+b/2c(a=long axis, b= intermediate axis, c= short axis dimensions of a grain)• Flatness Index gradually increases with increasing transport distancedownstream,FI = 2 typical of bedrock deposits or gold grains close to sourceFI = 45 grains transported several 10s km• Software available to carry out automated morphological analysis of gold grains
Gold Grain Morphology
• Alcoholic beverages available to study gold flake morphology
gold flakes in sakegold flakes in champagnegold flakes in volkagold flakes in schnapps

• Hammering and abrasion processes control grain shape and increasegrain roundness• Particle rounding results mainly from abrasion of particle edges and in-folding of delicate protrusions• Roundness can be a more sensitive estimator for distances <5 km andless reliable than flatness for distances >5 to 10 km• Gold grains in bedrock lateritic terrain change shape due to progressivechemical weathering over time, from primary grains of irregular, dendriticand prismatic forms with sharp edges to grains with rounded edges andcorrosion pits
Gold Grain Morphology
(D. Kelley 2007)

Gold Grain Morphology
(Marquez-Zavalia et al. 2004)
300 µm
Rounded folded leaf of gold
distorted octahedra of gold
wire gold
goldcrystal
Placer gold grains, San Luis Range, Argentina Placer gold grains, East Sudetic Foreland, Poland
(Wierchowiec, 2002)
Irregular
Abrasion marks
Rod shaped Rounded
Gold plate
Rod shaped
folded rounded

• DiLabio (1990) classification scheme describes conditions andsurface textures of gold grains related to glacial transport distance
• Pristine gold grains:- Primary shapes and surface textures- Appear not to have been damaged in transport- Angular wires, rods and delicate leaves that once filled in fractures, occurred as crystals with grain molds, and as inclusions in sulphides
• Modified gold grains:- Some primary surface textures- Edges and protrusions have been damaged during transport- Commonly striated.- Irregular edges and protrusions are crumpled, folded and curled- Grain molds and primary surface textures preserved on protected faces of grains
• Reshaped gold grains:- Primary surface textures destroyed- Original grain shape no longer discernible- Flattened to rounded resulting from folding of leaves, wires, rods- Surfaces may be pitted from impact marks from other grains- Surfaces are not leached of silver in most cases in glaciated terrain
Gold Grain MorphologyPristinePristine
ModifiedModified
Increasing transport distance
(McClenaghan 2001)
ReshapedReshaped
10 µm
10 µm
10 µm

Gold Grain Composition• Compositional studies identify different populations within/between samples and potentialbedrock sources
• Compositions most commonly characterized using EMP analysis for Au, Ag, Pt, Pd, Cu, Hg, Pb, BiAs, Fe, and Te. Gold content expressed at wt.% or fineness in parts per thousand (e.g. 985)
• Large numbers of grains should be analyzed to characterize compositional variation; differentdeposit types do not always have unique signatures
• Large volumes of gold grain compositional data have been published for various types of lode andplacer deposits worldwide (see reference list)
• Trace element analysis by gold grains by LA ICP-MS for elements such as Mo, Bi, Te, Sb, and Snallows for more specific fingerprinting of groups of gold grains or deposit types
• Placer gold grains exhibit Au-enriched, Ag-depleted rims typically 1 to 20 µm thick that surroundthe grain core; may form by the leaching of Ag or by overgrowth of higher fineness goldsubsequent to deposition
(Townley et al. 2003)
Composition of Au from different deposit types

Gold Grain Composition
(Grant et al. 1991)
Owl Creek Au Mine, Timmins, Canada
Gold grain core compositions in bedrock and till down-ice
Stream placers, Ivory Coast
Gold grain core and rim compositions in bedrock and local placers
Grain core
Grain rim

Gold Grain Inclusions• Micro-inclusions in gold grains can provide information on ore and gangue minerals present in thebedrock source and thus provide a signature of the deposit type or even a specific gold deposit
• For example, enargite inclusions may indicate a high sulphidation epithermal source; argentiteinclusions may indicate mesothermal gold
• Inclusion abundance may decrease due to post depositional alteration/ weathering in thesurficial environment and/or due to physical grain degradation with increasing transport
• Inclusion mineralogy (stable versus unstable in surface weathering environment) may indicatedistance of transport
)
100 µmankerite
sericite
10 µm
chalcopyrite
(D. Kelley, 2007)
Placer deposit, French Guiana:Presence of unstable primary inclusions andgangue minerals in gold grains indicates grains actively being shed from local bedrocksource

Gold Grain Characteristics
(Townley et al. 2003)
Gold grains in stream sediments, Antena District, Chile
Increasing distance from source

Glaciated terrain:Waddy Lake, Central Canada
Gold
NativeCopper
Pyromorphite(Pb oxide)
EP Gold Zone, EP Gold Zone, Waddy Waddy Lake, SaskatchewanLake, Saskatchewan• Lode gold hosted in quartz veins, in places supergene cover• Exploration challenge: thick (up to 15 m) glacial sediment cover•• Discovered using gold grains in till; initially panned grains Discovered using gold grains in till; initially panned grains from till, follow up with overburden drilling & systematic till samplingfrom till, follow up with overburden drilling & systematic till sampling•• >400 m >400 m r ribbon-shaped train defined by indicator minerals ibbon-shaped train defined by indicator minerals and till geochemistryand till geochemistry•• I Indicator minerals: gold, native copper, galena, ndicator minerals: gold, native copper, galena, chalcocite- chalcocite- galena,galena,pyromorphitepyromorphite, , bornitebornite, , molybdenitemolybdenite

Glaciated terrain:Timmins, central Canada
Pamour Au Mine, Timmins, Canada
• Lode gold in quartz veins, associatedwith shear zone• Exploration challenge: thick (10-30 m)glacial sediment cover, till overlain bythick glaciolacustrine clay
• Gold grain abundance, shape and sizerange in till proximal to bedrock sourcedocumented• Maximum 880 gold grains/10 kg + pyrite• Most gold grains pristine shape• Most gold grains <50 µm• Strong till geochemical signature
(McClenaghan, 1999)
0.083 oz/ton
till
clay

Glaciated terrain:Contact Lake, Canada
• Lode gold in quartz veins, associated withshear zone• Exploration challenge: thick glacial sedimentcover; 2 phases of ice flow and 2 till units
• Regional till survey to follow-up gold lakesediment anomalies• Gold grain abundance in till defined glacialdispersal train down-ice• Highest concentration near bedrock source• up to 2751 gold grains/6 kg• pristine to reshaped grains• grains 20 to 400 µm in size, most < 100 µm• 2.5 km transport distance• Lake sediment and till sampling results led todiscovery of deposit 3 years later
(Chapman et al., 1990)
Bakos Au deposit, La Ronge Belt,Saskatchewan

Brazil
Venezuela
Guyana
Suriname French Guiana
Wayamagaand Cokioco
Atlantic Ocean
Tropical Terrain: French Guiana
Cokioco and Wayamaga gold placers, NW French Guiana
Brazil
Unstable primaryminerals
Stable or entrainedgrains
Inclusions
Thin rim/absent(988)
Complete (1000)Leaching of Ag
50-150 um125-300 umGrain Size
Modified/reshapedFully reshapedGrain Morphology
WayamagaCokioco(R. Brommecker, 2003; D. Kelley, 2007)
Exploration Challenges: • Location of lode sources unknown• Extensive vertical weathering and erosion • Geomorphology of region is dynamic• Lode source may not be in current placer drainage
• Detailed gold grain study- shape, size, fineness, inclusions• Actively shedding lode source likely proximal to Wayamaga• Cokioco source likely very far or eroded away

• Gold is best indicator of its own deposits• Recovered from broad range of sediment types: eolian, stream, lateritic soil, glacial• Size range: 10 µm to 2.0 mm routinely recovered
• Recovery methods: panning, table, jig, spiral, Knelson concentrator
• Composition: varies with deposit type, mainly Au and Ag - trace element concentrations used to fingerprint source - characterized by EMP and LA ICP-MS- inclusion mineralogy provides clues to source and distance of transport• Surface features and shape: provide information on transport distance• Reference list
Gold Deposit Indicator Mineral Summary
(D. Kelley, 2007)

Indicator Mineral Chemical Composition Indicator Elements
hercynite FeAl2O4 Al
olivine (Mg,Fe)SiO4 Mg
orthopyroxene (Mg,Fe)2Si2O6 Mg
low Cr-diopside Ca(Mg,Cr)Si2O6 Mg, Cr
chromite (Fe,Mg)(Cr, Al)2O4 Cr, Mg, Al (-/+Zn)
uvarovite Ca3Cr2Si3O12 Cr
Cr-rutile (Ti, Cr)O2 Cr
chalcopyrite CuFeS2 Cu, S
loellingite FeAs2 As
rammelsbergite NiAs2 Ni, As
sperrylite PtAs2 Pt, As
PGE alloys PGE PGE
* occur in other unmineralized ultramafic rocks
**
*
(Averill, 2001)
Common heavy indicator minerals for Ni-Cu-PGE mineralization:
PGE Deposit Indicator Minerals
Stu Averill’s talk
This talkThis talk

PGE Deposit Indicator Minerals
• Platinum Group Minerals (PGM) and goldare important indicators of PGE deposits
• List of the more common PGM documentedin lode deposits and placers (Cabri et al. 1996)
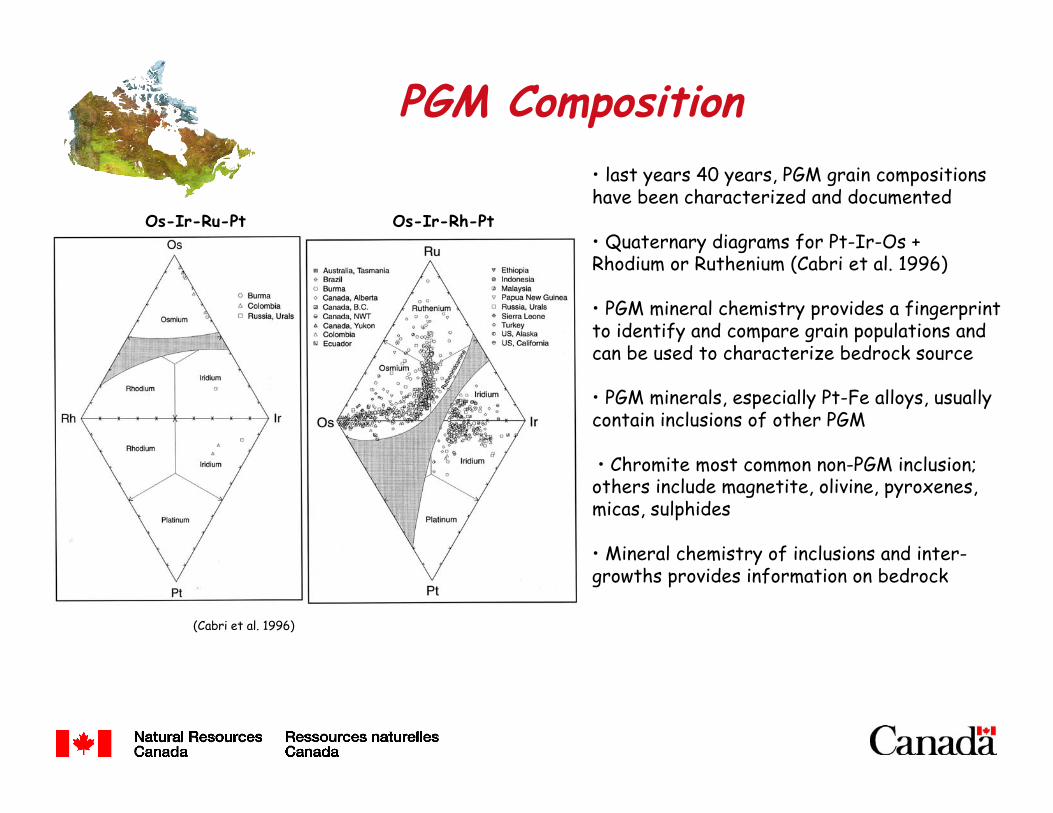
PGM Composition
Os-Ir-Ru-Pt
(Cabri et al. 1996)
Os-Ir-Rh-Pt
• last years 40 years, PGM grain compositions have been characterized and documented
• Quaternary diagrams for Pt-Ir-Os + Rhodium or Ruthenium (Cabri et al. 1996)
• PGM mineral chemistry provides a fingerprint to identify and compare grain populations and can be used to characterize bedrock source
• PGM minerals, especially Pt-Fe alloys, usually contain inclusions of other PGM
• Chromite most common non-PGM inclusion; others include magnetite, olivine, pyroxenes, micas, sulphides
• Mineral chemistry of inclusions and inter-growths provides information on bedrock
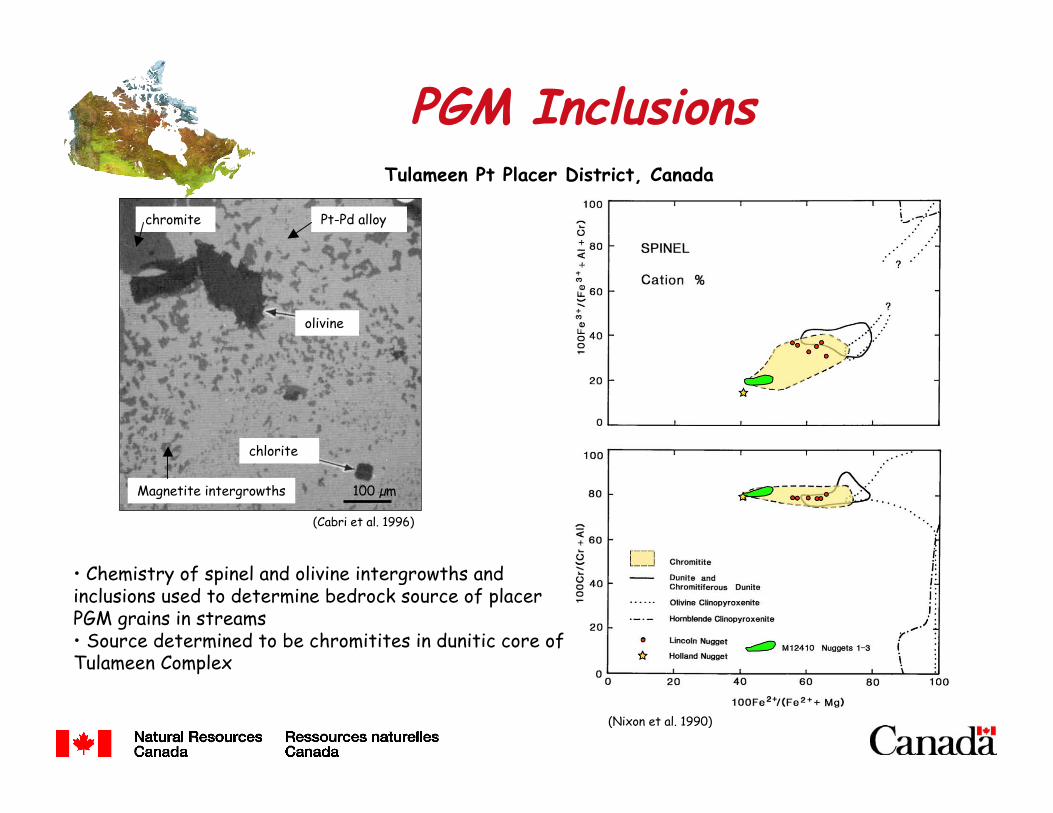
PGM Inclusions
100 µm
olivine
chlorite
Pt-Pd alloychromite
Magnetite intergrowths
(Cabri et al. 1996)
Tulameen Pt Placer District, Canada
(Nixon et al. 1990)
• Chemistry of spinel and olivine intergrowths and inclusions used to determine bedrock source of placerPGM grains in streams • Source determined to be chromitites in dunitic core of Tulameen Complex
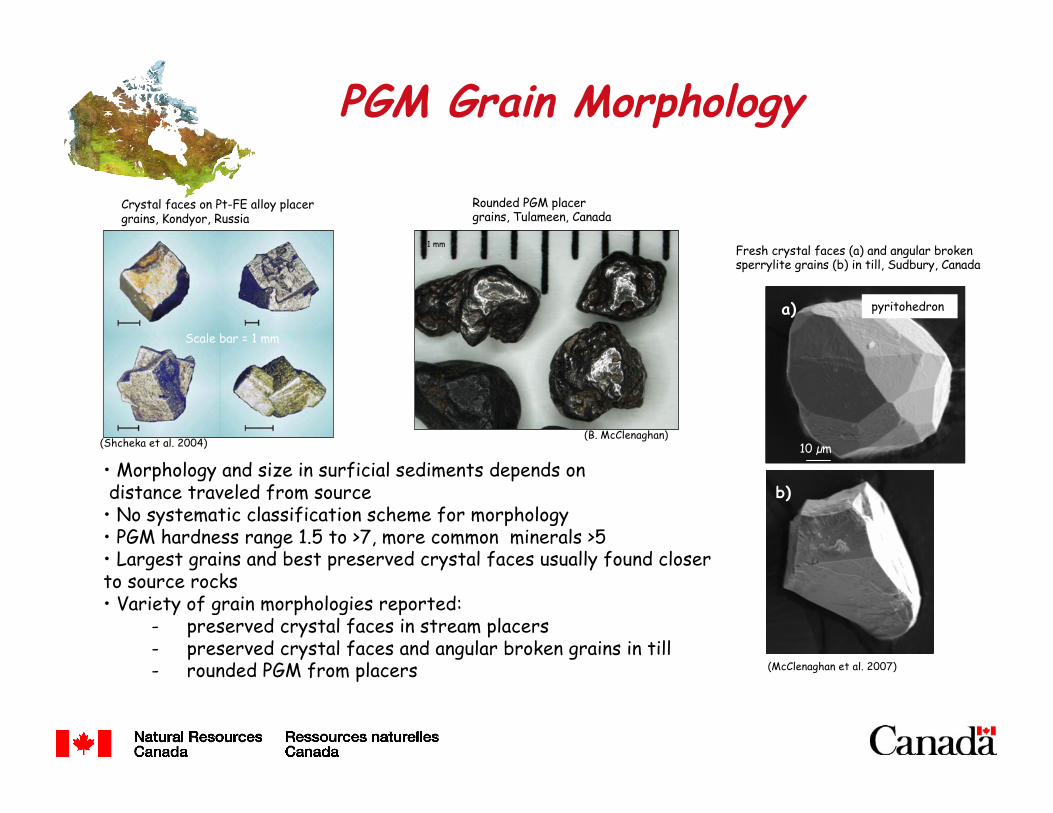
PGM Grain Morphology
(McClenaghan et al. 2007)
10 µm
10 µm
• Morphology and size in surficial sediments depends on distance traveled from source• No systematic classification scheme for morphology• PGM hardness range 1.5 to >7, more common minerals >5• Largest grains and best preserved crystal faces usually found closer to source rocks • Variety of grain morphologies reported:
- preserved crystal faces in stream placers - preserved crystal faces and angular broken grains in till - rounded PGM from placers
Crystal faces on Pt-FE alloy placer grains, Kondyor, Russia
Rounded PGM placer grains, Tulameen, Canada
Fresh crystal faces (a) and angular broken sperrylite grains (b) in till, Sudbury, Canada
a)
b)
(Shcheka et al. 2004)(B. McClenaghan)
Scale bar = 1 mm
1 mm
pyritohedron

PGM Grain Morphology
(Shcheka et al. 2004)
Rounded PGM grains, Simonovsky Brook gold placer, Salair Range, Russia
Rounded Pt-Fe alloy grainsChoco region, NW Columbia
b)
(Podlipsky et al. 2007)
(Cabri et al. 1996)
Scale bar = 1 mm
Ferroan-platinum grains from the Darya river, Russia

PGM Grains in Glacial Sediments
b)
• Historically, report of PGM in glacial sediments (till) rare
• Where found, usually included only a few grains from samples collected <500 m from source
• Presence of as few as two PGM grains in a till sample is significant; likely indicates nearby (<500 m)PGE mineralization
• Recent years, much improved recovery and recognition of PGM grains in till
• Geochemical assay of till matrix (fire assay/ICP-MS) useful check on PGM content of sample
Some Recent Examples:• Sudbury Ni-Cu-PGE deposits (Bajc & Hall 2000)• Broken Hammer Cu-(Ni)-PGE deposit, Sudbury (McClenaghan et al. 2007)• Magmatic Ni-Cu deposits, Thompson Nickel Belt (TNB) (talk, June 1 Plenary Session)• Peregrine Diamonds’ 2007 discovery of sperrylite grains in till, Baffin Island, Canadian Arctic

Glaciated terrain:Thompson Ni Belt, central Canada
Thompson and PipeThompson and Pipe mmagmatic agmatic Ni-Cu depositsNi-Cu deposits
•• Exploration challenge: thick glacial sediments, tillExploration challenge: thick glacial sediments, till overlain overlain by by glaciolacustrine glaciolacustrine clayclay•• >300 km >300 km plume plume defined by indicator minerals in till defined by indicator minerals in till•• Indicator minerals: Indicator minerals: Cr-diopsideCr-diopside, , chromitechromite, , forsteriteforsterite, , enstatiteenstatite, , sulphidessulphides, , sperrylitesperrylite
(Matile & Thorliefson, 1997; Thorliefson & Garrett, 1993)
Pentlandite Chalcopyrite
(McClenaghan et al., 2007; 2009)
Forsterite
Pyrite Cr-diopside
Ice flow
Chromite
Talk: Monday, June 1 Plenary session

Glaciated terrain: Sudbury, Canada
Chalcopyrite
Pyrite
Gold
Sperrylite
Broken Hammer footwall Cu-PGE depositBroken Hammer footwall Cu-PGE deposit
•• Exploration challenge: thin till covered terrainExploration challenge: thin till covered terrain•• > >150 m150 m dispersal, dispersal, defined by indicator minerals and till geochemistry defined by indicator minerals and till geochemistry• Indicator minerals: Indicator minerals: sperrylite sperrylite (PtAs(PtAs22), gold, chalcopyrite, pyrite,), gold, chalcopyrite, pyrite, others to be determined others to be determined……
(McClenaghan et al., 2007)
Ice flow
Sand-sizedSilt-sized
Mineralized vein
gabbro
Quartz monzonite
Sudbury breccia
Highest value: 714 grains/10 kg

Glaciated terrain:Lac des Isles, Canada
Cr-andradite (Cr-garnet)
(Averill, 2007)
Barnet & Averill, in pressSearcy, 2001
Lac des Lac des Iles Iles PGE DepositsPGE Deposits
•• Exploration challenge: till covered region Exploration challenge: till covered region•• >5 km>5 km r ribbon-shaped dispersal train defined byibbon-shaped dispersal train defined byindicator minerals and till geochemistryindicator minerals and till geochemistry•• Background = zero Background = zero chromite chromite grainsgrains•• Maximum 235 Maximum 235 chromite chromite grainsgrains•• Indicator minerals: Cr-andradite, Indicator minerals: Cr-andradite, chromitechromite,, sperrylite sperrylite (PtAs(PtAs22)), , stillwaterite stillwaterite ((Pd8As3), native Pt, native Pt
Chromite in 0.25-0.5 mm fraction tillChromite
Ice flow

• PGM and gold are important indicators of PGE deposits• In addition, suite of oxides, silicate and metallic minerals (Averill and others)• Recovered from broad range of sediment types: eolian, stream, lateritic soil, glacial• Size range: 10 µm to 2.0 mm routinely recovered
• Recovery methods: panning, table, jig, spiral, Knelson concentrator
• Composition:- broad range of minerals in PGM suite- characterized by EMP and LA ICP-MS- inclusion mineralogy provides clues to source and distance of transport• Surface features and morphology: may provide information on relative transportdistance, no systematic classification scheme• Reference list
PGE Deposit Indicator Mineral Summary

Common indicator minerals:• Magmatic Ni-Cu-PGE minerals• Platinum Group minerals• Gold grains• Kimberlite indicator minerals• Sulphide minerals• Metamorphosed massive sulphide
minerals- e.g. gahnite• Native copper• Scheelite• Cassiterite• Cinnabar• Fluorite, topaz• Uraninite, thorianite
Gold, native copper, pyromorphite
Chlalcopyrite
Gahnite
Kimberlite indicator minerals
• PGE indicator mineral suite identified• Indicator minerals for a broad spectrum of commodities• Recovered from same heavy mineral concentrate• Use in combination with till geochemistry
Recommendations for Exploration
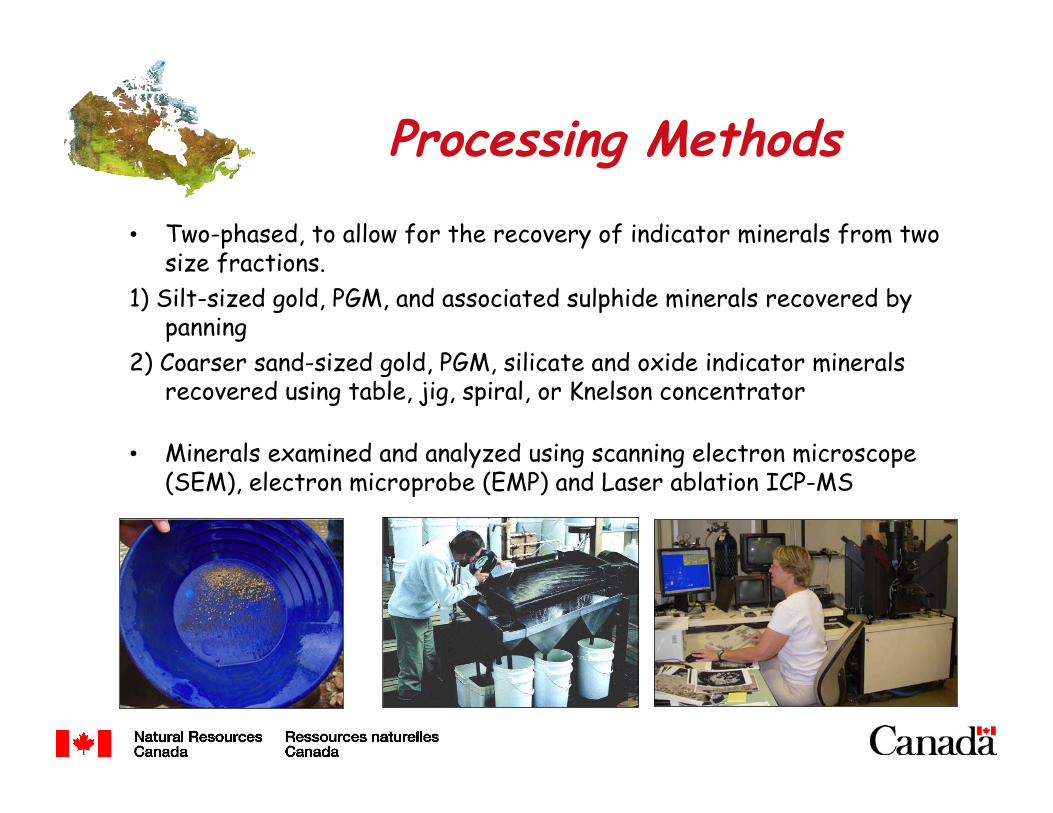
Processing Methods
• Two-phased, to allow for the recovery of indicator minerals from twosize fractions.
1) Silt-sized gold, PGM, and associated sulphide minerals recovered bypanning
2) Coarser sand-sized gold, PGM, silicate and oxide indicator mineralsrecovered using table, jig, spiral, or Knelson concentrator
• Minerals examined and analyzed using scanning electron microscope(SEM), electron microprobe (EMP) and Laser ablation ICP-MS

• Dave Kelley, Oz Minerals• Stu Averill, Overburden Drilling Management Ltd.• Pertti Sarala, Geological Survey of Finland
Acknowledgements