
Global Mobile Trends 2020 - GSMAi Research & analysis
91
gsmaintelligence.com @GSMAi Global Mobile Trends 2020 New decade, new industry?
Transcript of Global Mobile Trends 2020 - GSMAi Research & analysis
gsmaintelligence.com @GSMAi
Global Mobile Trends 2020 New decade, new industry?

The GSMA represents the interests of mobile operators worldwide, uniting more than 750 operators with nearly 400 companies in the broader mobile ecosystem, including handset and device makers, software companies, equipment providers and internet companies, as well as organisations in adjacent industry sectors. The GSMA also produces the industry-leading MWC events held annually in Barcelona, Los Angeles and Shanghai, as well as the Mobile 360 Series of regional conferences.
For more information, please visit the GSMA corporate website at www.gsma.com
Follow the GSMA on Twitter: @GSMA
GSMA Intelligence is the definitive source of global mobile operator data, analysis and forecasts, and publisher of authoritative industry reports and research. Our data covers every operator group, network and MVNO in every country worldwide – from Afghanistan to Zimbabwe. It is the most accurate and complete set of industry metrics available, comprising tens of millions of individual data points, updated daily.
GSMA Intelligence is relied on by leading operators, vendors, regulators, financial institutions and third-party industry players, to support strategic decision-making and long-term investment planning. The data is used as an industry reference point and is frequently cited by the media and by the industry itself.
Our team of analysts and experts produce regular thought-leading research reports across a range of industry topics.
www.gsmaintelligence.com
3The Big 5
GLOBAL MOBILE TRENDS
The Big 5Trends shaping the future of mobile and TMT
Predictions for the next 10 years
View from the top
Future of devices
Implications of the 5G era
Enterprise IoT and Industry 4.0
Media and content
Financial performance
Regional outlooks
4The Big 5
Telecoms (mobile + fixed) Non-telecoms (pay-TV + other services) Total
Améric
a Móvil
Telst
ra
AT&T
NTT Doco
moKT
Telenor
Singtel
SK Teleco
m
Verizon
KDDI
SoftBank
China Teleco
m
Telefó
nica
China Mobile
Turk
cell
China
Unicom
-10%
0%
10%
20%
30%
40%
50%
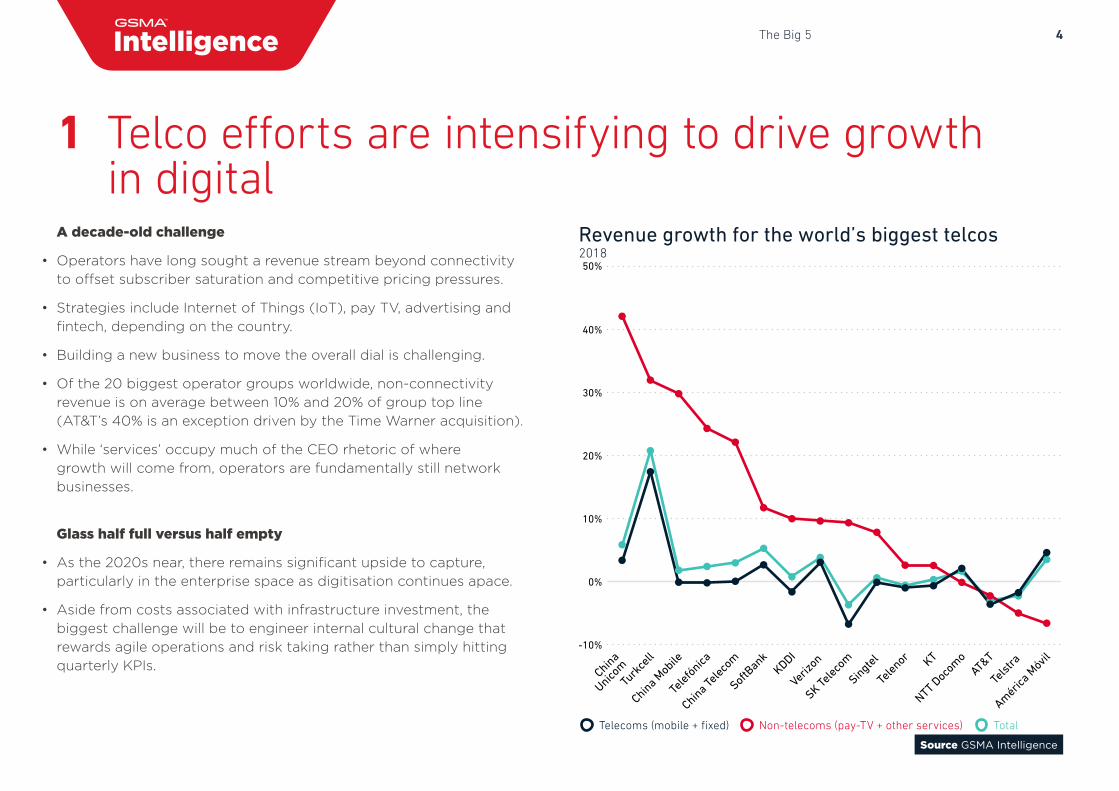
A decade-old challenge
• Operators have long sought a revenue stream beyond connectivityto offset subscriber saturation and competitive pricing pressures.
• Strategies include Internet of Things (IoT), pay TV, advertising andfintech, depending on the country.
• Building a new business to move the overall dial is challenging.
• Of the 20 biggest operator groups worldwide, non-connectivityrevenue is on average between 10% and 20% of group top line(AT&T’s 40% is an exception driven by the Time Warner acquisition).
• While ‘services’ occupy much of the CEO rhetoric of wheregrowth will come from, operators are fundamentally still networkbusinesses.
Glass half full versus half empty
• As the 2020s near, there remains significant upside to capture,particularly in the enterprise space as digitisation continues apace.
• Aside from costs associated with infrastructure investment, thebiggest challenge will be to engineer internal cultural change thatrewards agile operations and risk taking rather than simply hittingquarterly KPIs.
Revenue growth for the world’s biggest telcos 2018
Source GSMA Intelligence
1 Telco efforts are intensifying to drive growth in digital
5The Big 5
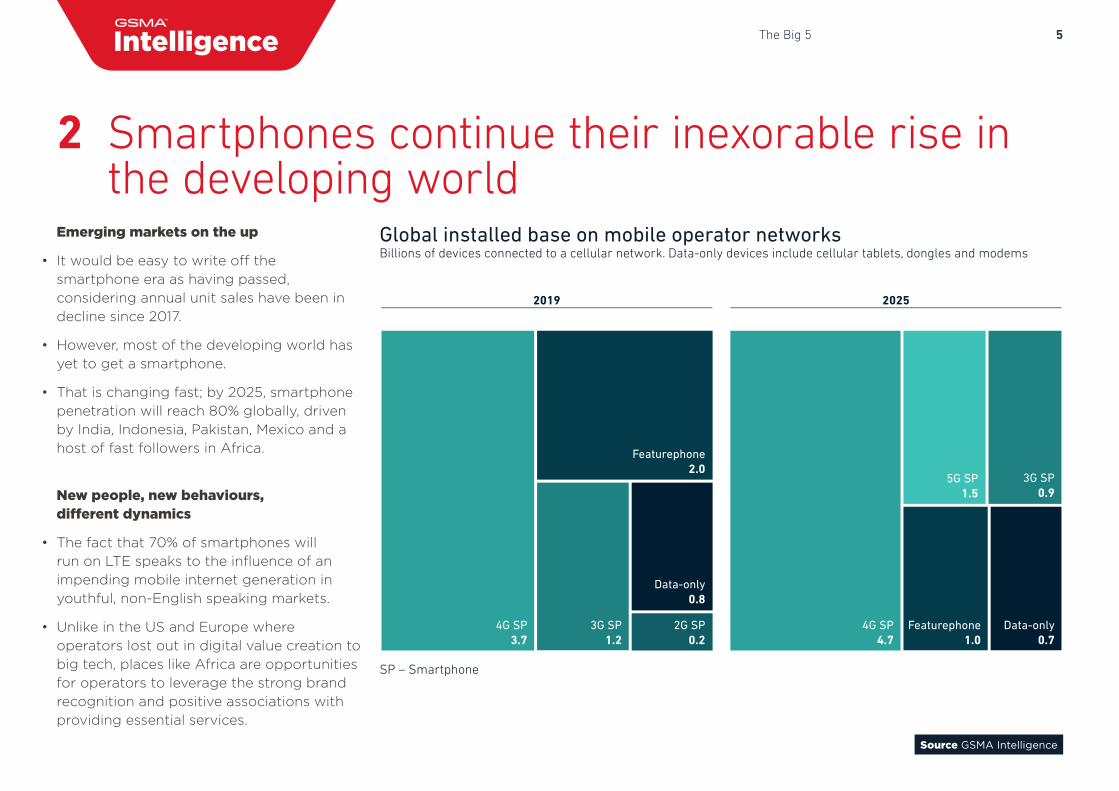
4G SP3.7
3G SP1.2
2G SP0.2
Data-only0.8
Featurephone2.0
4G SP4.7
Featurephone1.0
5G SP1.5
Data-only0.7
3G SP0.9
20252019
Emerging markets on the up
• It would be easy to write off the smartphone era as having passed, considering annual unit sales have been in decline since 2017.
• However, most of the developing world has yet to get a smartphone.
• That is changing fast; by 2025, smartphone penetration will reach 80% globally, driven by India, Indonesia, Pakistan, Mexico and a host of fast followers in Africa.
New people, new behaviours, different dynamics
• The fact that 70% of smartphones will run on LTE speaks to the influence of an impending mobile internet generation in youthful, non-English speaking markets.
• Unlike in the US and Europe where operators lost out in digital value creation to big tech, places like Africa are opportunities for operators to leverage the strong brand recognition and positive associations with providing essential services.
Global installed base on mobile operator networks Billions of devices connected to a cellular network. Data-only devices include cellular tablets, dongles and modems
Source GSMA Intelligence
2 Smartphones continue their inexorable rise in the developing world
SP – Smartphone
6The Big 5
Apple
App
le
Google Amazon Other Android
Samsung
Samsung HTC Oculus Sony
Non-Samsung Android
Smartphones
VR headsets
Smart speakers
Smartphones
VR headsets
Smart speakers
0% 10% 20% 30% 40% 50% 60% 70% 80% 90% 100%
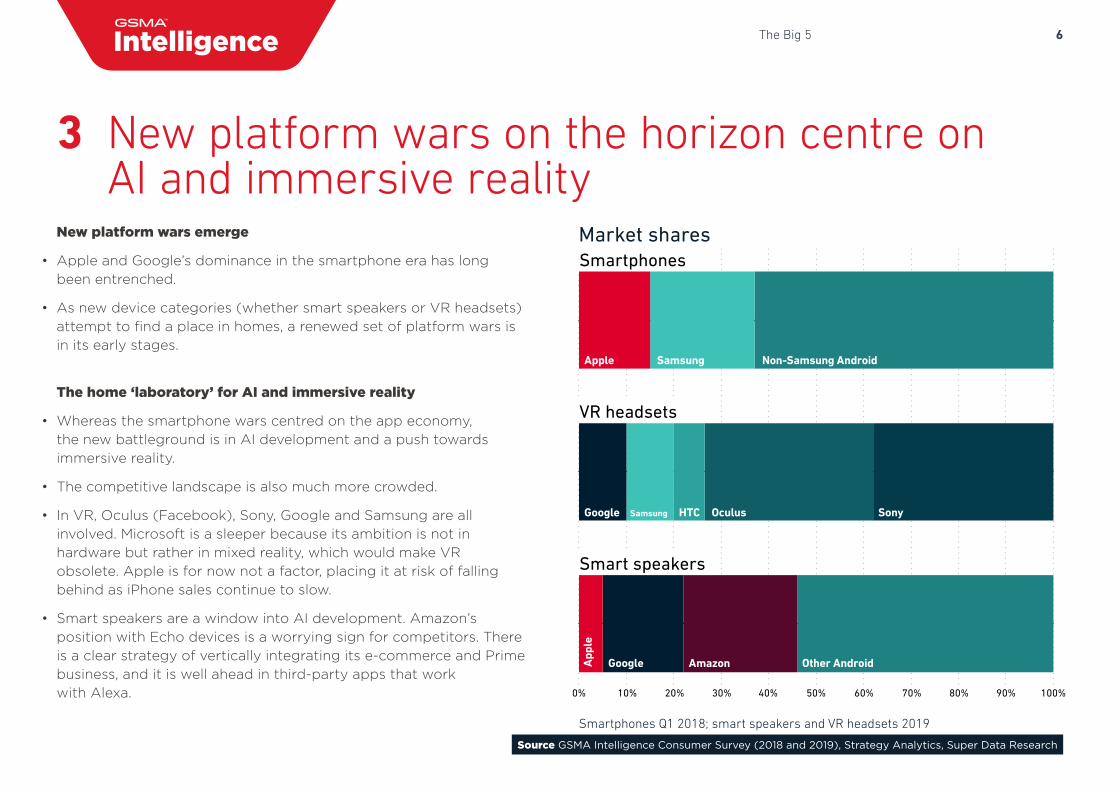
New platform wars emerge
• Apple and Google’s dominance in the smartphone era has long been entrenched.
• As new device categories (whether smart speakers or VR headsets)attempt to find a place in homes, a renewed set of platform wars isin its early stages.
The home ‘laboratory’ for AI and immersive reality
• Whereas the smartphone wars centred on the app economy, the new battleground is in AI development and a push towardsimmersive reality.
• The competitive landscape is also much more crowded.
• In VR, Oculus (Facebook), Sony, Google and Samsung are allinvolved. Microsoft is a sleeper because its ambition is not inhardware but rather in mixed reality, which would make VRobsolete. Apple is for now not a factor, placing it at risk of falling behind as iPhone sales continue to slow.
• Smart speakers are a window into AI development. Amazon’sposition with Echo devices is a worrying sign for competitors. Thereis a clear strategy of vertically integrating its e-commerce and Primebusiness, and it is well ahead in third-party apps that workwith Alexa.
Market shares
Source GSMA Intelligence Consumer Survey (2018 and 2019), Strategy Analytics, Super Data Research
3 New platform wars on the horizon centre on AI and immersive reality
Smartphones Q1 2018; smart speakers and VR headsets 2019
7The Big 5
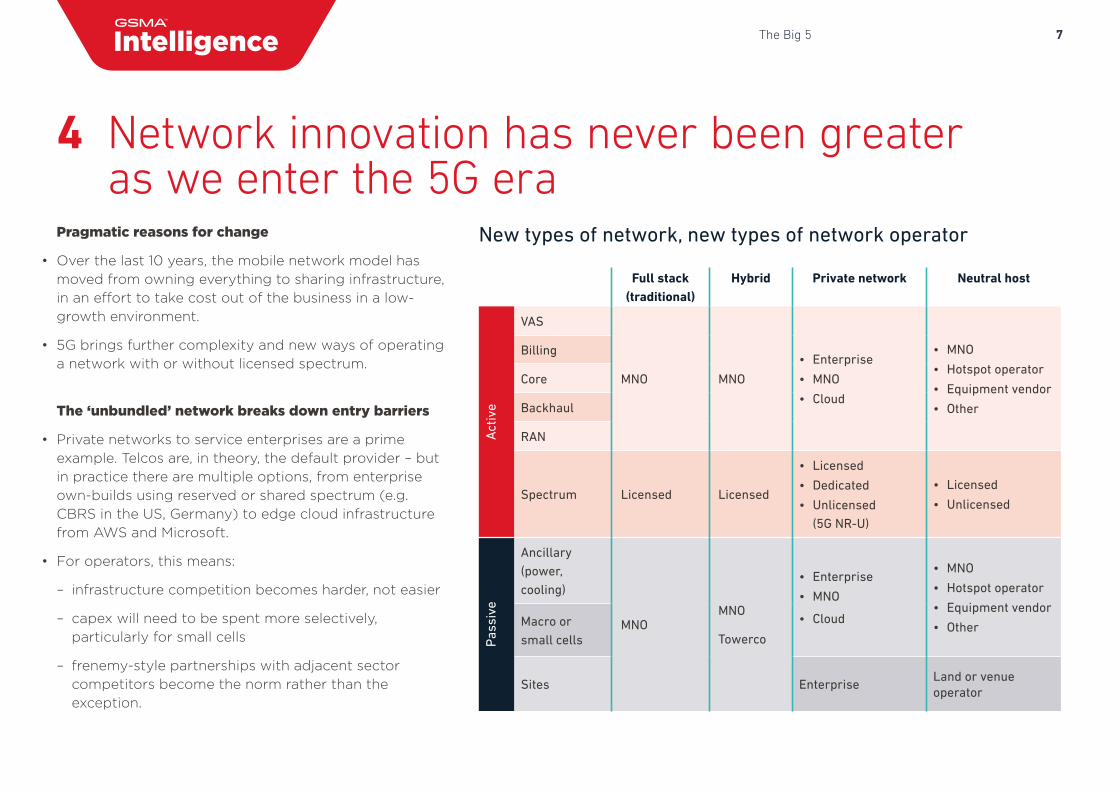
Pragmatic reasons for change
• Over the last 10 years, the mobile network model hasmoved from owning everything to sharing infrastructure,in an effort to take cost out of the business in a low-growth environment.
• 5G brings further complexity and new ways of operatinga network with or without licensed spectrum.
The ‘unbundled’ network breaks down entry barriers
• Private networks to service enterprises are a primeexample. Telcos are, in theory, the default provider – butin practice there are multiple options, from enterpriseown-builds using reserved or shared spectrum (e.g.CBRS in the US, Germany) to edge cloud infrastructurefrom AWS and Microsoft.
• For operators, this means:
– infrastructure competition becomes harder, not easier
– capex will need to be spent more selectively,particularly for small cells
– frenemy-style partnerships with adjacent sectorcompetitors become the norm rather than theexception.
New types of network, new types of network operator
4 Network innovation has never been greater as we enter the 5G era
Full stack (traditional)
Hybrid Private network Neutral host
Act
ive
VAS
MNO MNO
• Enterprise
• MNO
• Cloud
• MNO
• Hotspot operator
• Equipment vendor
• Other
Billing
Core
Backhaul
RAN
Spectrum Licensed Licensed
• Licensed
• Dedicated
• Unlicensed(5G NR-U)
• Licensed
• UnlicensedP
assi
ve
Ancillary (power, cooling)
MNOMNO
Towerco
• Enterprise
• MNO
• Cloud
• MNO
• Hotspot operator
• Equipment vendor
• OtherMacro or small cells
Sites EnterpriseLand or venue operator
8The Big 5
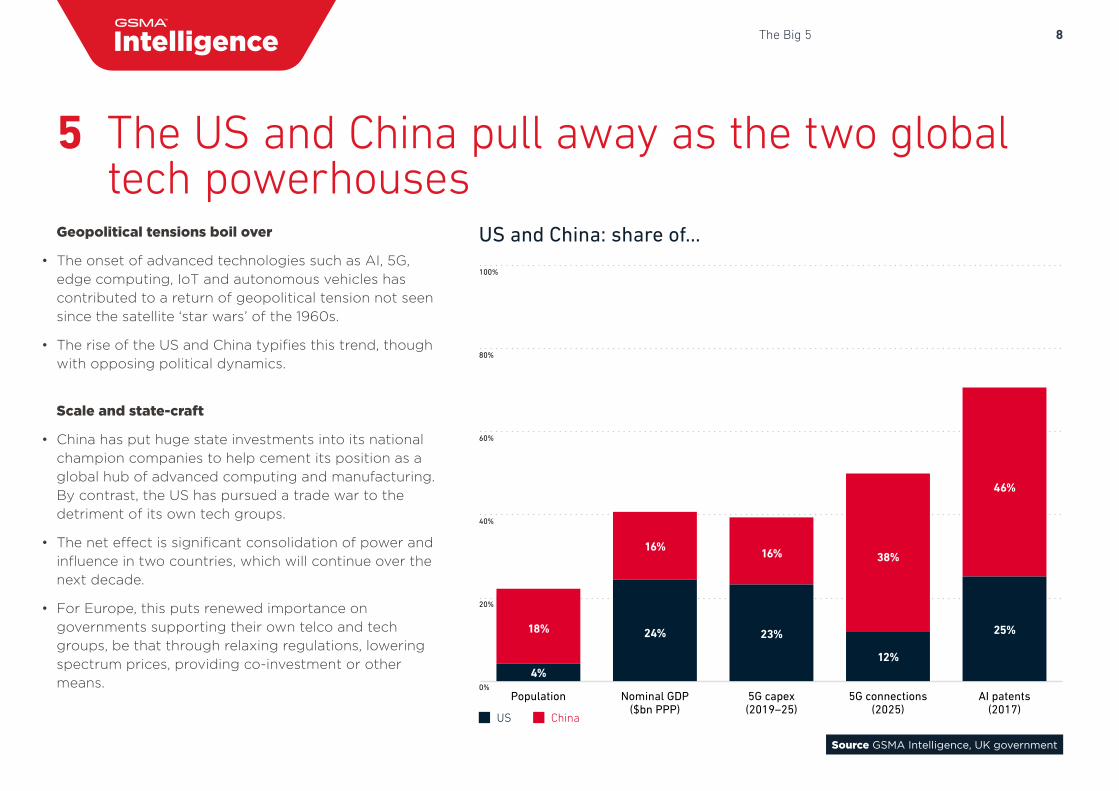
Geopolitical tensions boil over
• The onset of advanced technologies such as AI, 5G,edge computing, IoT and autonomous vehicles hascontributed to a return of geopolitical tension not seensince the satellite ‘star wars’ of the 1960s.
• The rise of the US and China typifies this trend, thoughwith opposing political dynamics.
Scale and state-craft
• China has put huge state investments into its nationalchampion companies to help cement its position as aglobal hub of advanced computing and manufacturing.By contrast, the US has pursued a trade war to thedetriment of its own tech groups.
• The net effect is significant consolidation of power andinfluence in two countries, which will continue over thenext decade.
• For Europe, this puts renewed importance ongovernments supporting their own telco and techgroups, be that through relaxing regulations, loweringspectrum prices, providing co-investment or othermeans.
Source GSMA Intelligence, UK government
5 The US and China pull away as the two global tech powerhouses
ChinaUS
18%
4%
16%
24%
16%
23%
38%
12%
46%
25%
AI patents(2017)
5G connections(2025)
5G capex(2019–25)
Nominal GDP($bn PPP)
Population0%
20%
40%
60%
80%
100%
US and China: share of…

9Predictions for the next 10 years
GLOBAL MOBILE TRENDS
Predictions for the next 10 years
The Big 5
View from the top
Future of devices
Implications of the 5G era
Enterprise IoT and Industry 4.0
Media and content
Financial performance
Regional outlooks
10Predictions for the next 10 years
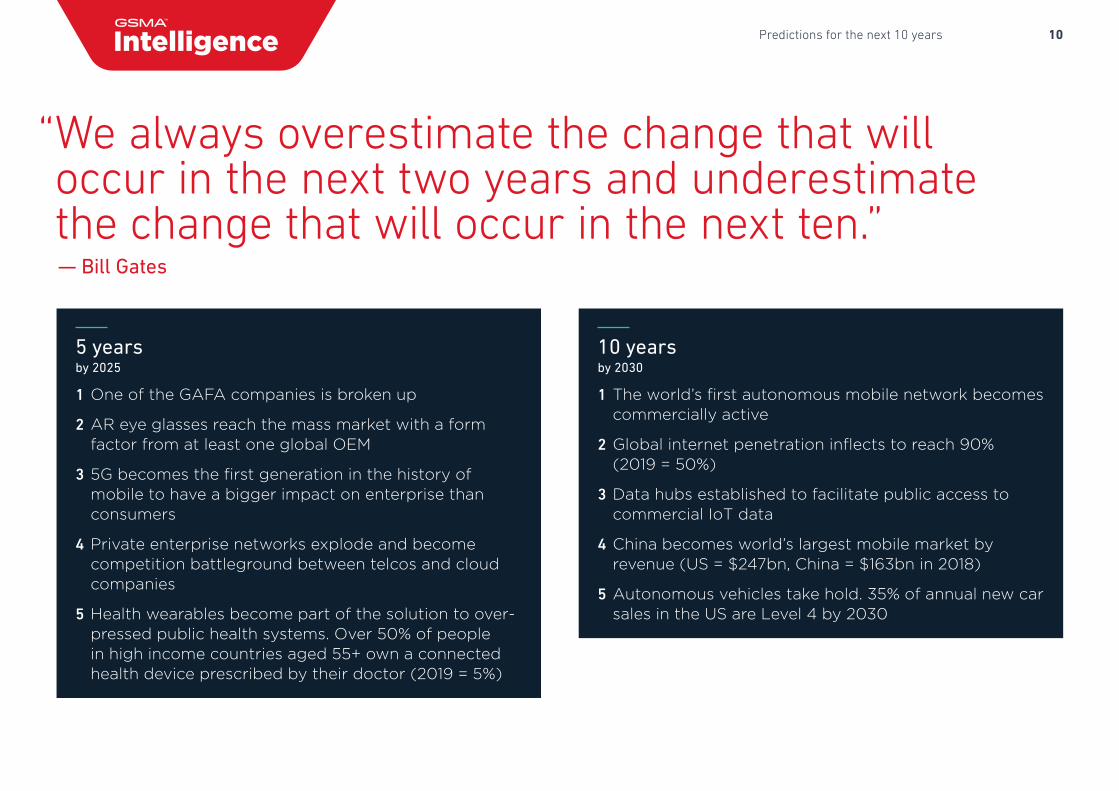
“ We always overestimate the change that will occur in the next two years and underestimate the change that will occur in the next ten.”
— Bill Gates
5 yearsby 2025
1 One of the GAFA companies is broken up
2 AR eye glasses reach the mass market with a form factor from at least one global OEM
3 5G becomes the first generation in the history of mobile to have a bigger impact on enterprise than consumers
4 Private enterprise networks explode and become competition battleground between telcos and cloud companies
5 Health wearables become part of the solution to over-pressed public health systems. Over 50% of people in high income countries aged 55+ own a connected health device prescribed by their doctor (2019 = 5%)
10 yearsby 2030
1 The world’s first autonomous mobile network becomes commercially active
2 Global internet penetration inflects to reach 90% (2019 = 50%)
3 Data hubs established to facilitate public access to commercial IoT data
4 China becomes world’s largest mobile market by revenue (US = $247bn, China = $163bn in 2018)
5 Autonomous vehicles take hold. 35% of annual new car sales in the US are Level 4 by 2030

11View from the top
View from the topState of play and outlook for mobile access
GLOBAL MOBILE TRENDS
The Big 5
Predictions for the next 10 years
Future of devices
Implications of the 5G era
Enterprise IoT and Industry 4.0
Media and content
Financial performance
Regional outlooks
12View from the top
Source GSMA Intelligence
5 billion people with an active mobilePopulation, million
Even the growth markets are starting to coolNet growth in mobile subscribers, million
No mobileMobile
0
2,000
4,000
6,000
8,000
10,000
202520192014
70%67%
59%
Europe China India Nigeria/Indonesia/Pakistan US
0
200
400
600
800
1,000
2020–252015–202010–15
38
115
61
64
194
155
436
241
98
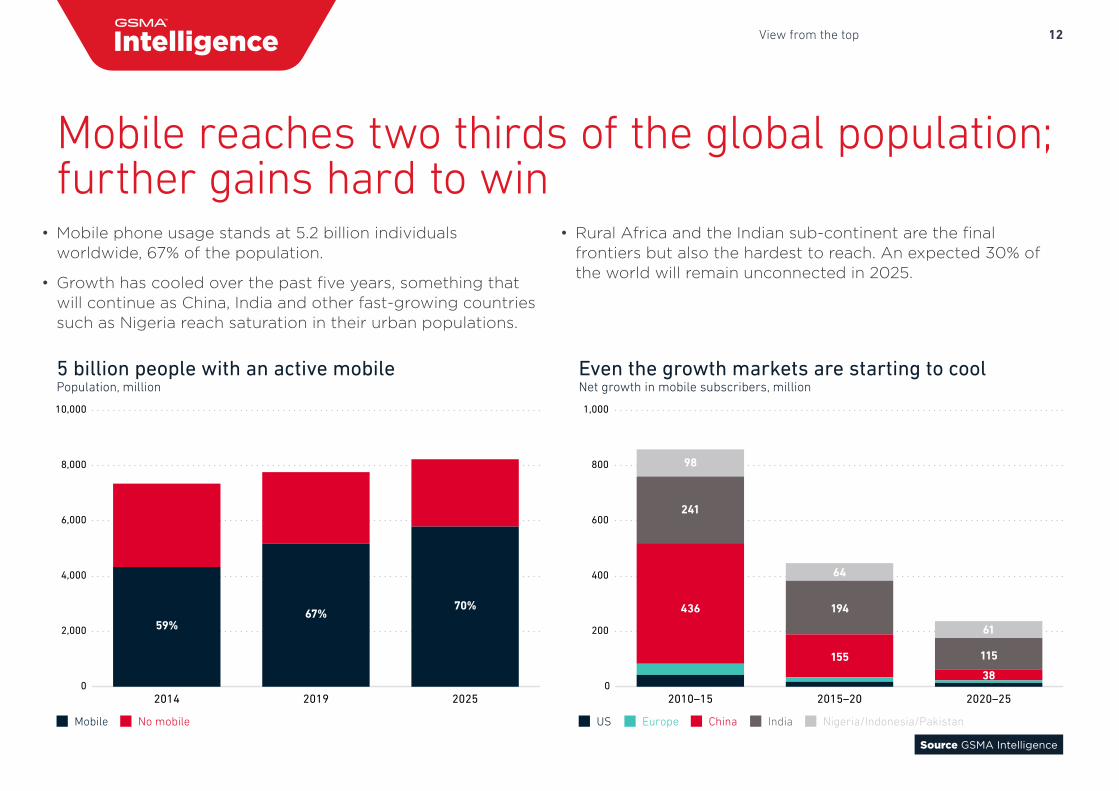
• Mobile phone usage stands at 5.2 billion individualsworldwide, 67% of the population.
• Growth has cooled over the past five years, something thatwill continue as China, India and other fast-growing countriessuch as Nigeria reach saturation in their urban populations.
• Rural Africa and the Indian sub-continent are the finalfrontiers but also the hardest to reach. An expected 30% ofthe world will remain unconnected in 2025.
Mobile reaches two thirds of the global population; further gains hard to win
13View from the top
Source GSMA IntelligencePC-only users not shown because they represent a very small share of the population (54 million in 2019)
Global population, million
+1bn
Internet – mobile onlyInternet – PC and mobile No internet
0
1,000
2,000
3,000
4,000
5,000
1,683
2,756
3,650
202520192014
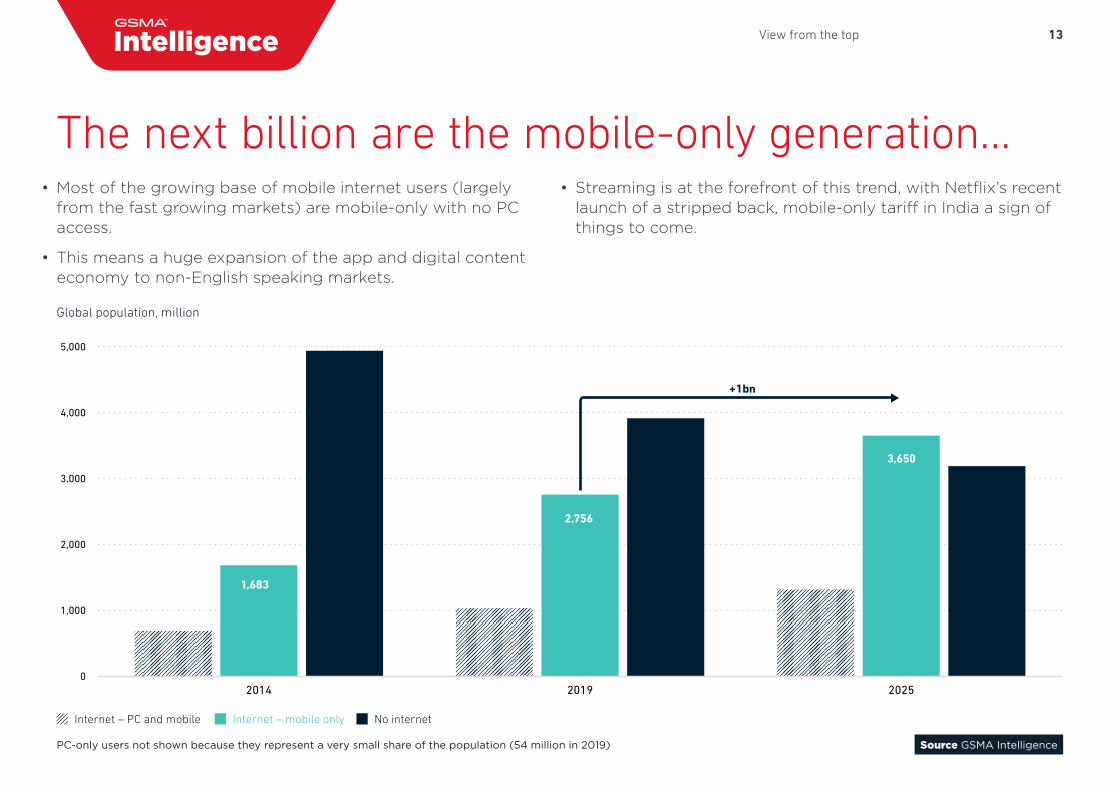
• Most of the growing base of mobile internet users (largely from the fast growing markets) are mobile-only with no PC access.
• This means a huge expansion of the app and digital content economy to non-English speaking markets.
• Streaming is at the forefront of this trend, with Netflix’s recent launch of a stripped back, mobile-only tariff in India a sign of things to come.
The next billion are the mobile-only generation…
14View from the top
Source GSMA IntelligenceSP = Smartphone. Data-only devices include cellular tablets, dongles and modems.
Installed base on mobile operator networksBillions
2015
Featurephone3.8
4G SP0.9
2G SP0.5
Data-only0.6
3G SP1.4
4G SP3.7
3G SP1.2
2G SP0.2
Data-only0.8
Featurephone2.0
20252019
4G SP4.7
Featurephone1.0
5G SP1.5
Data-only0.7
3G SP0.9
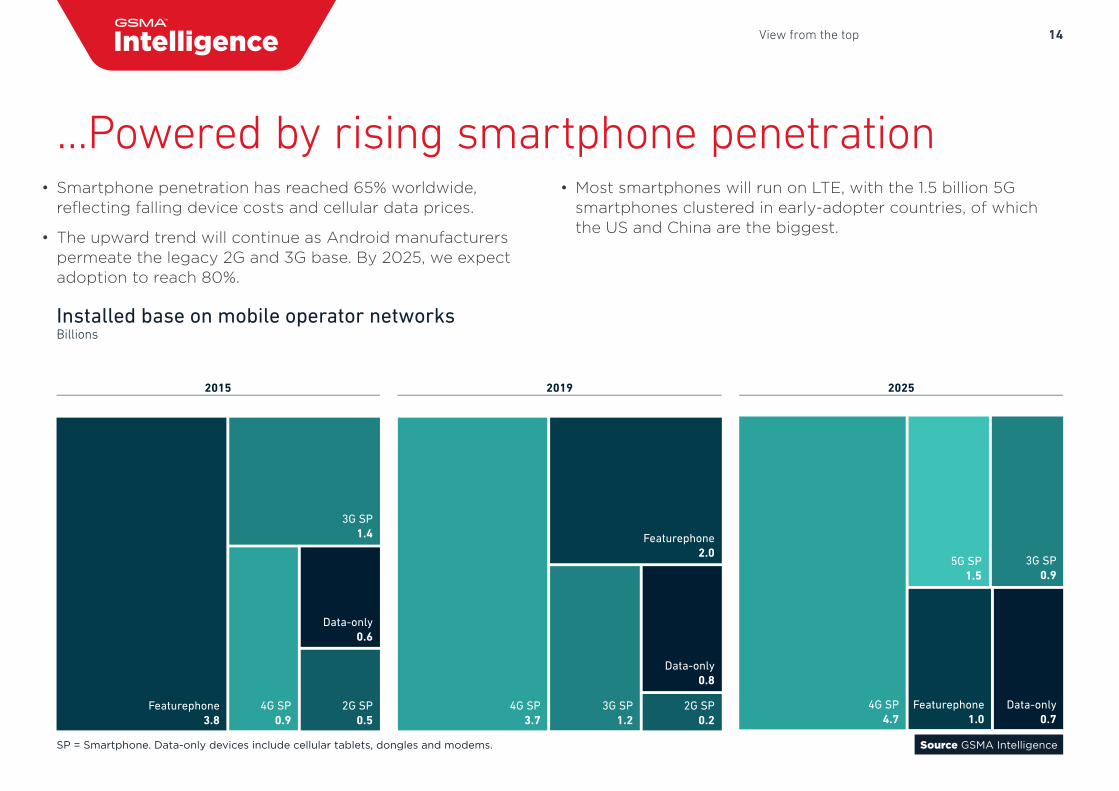
• Smartphone penetration has reached 65% worldwide,reflecting falling device costs and cellular data prices.
• The upward trend will continue as Android manufacturerspermeate the legacy 2G and 3G base. By 2025, we expectadoption to reach 80%.
• Most smartphones will run on LTE, with the 1.5 billion 5Gsmartphones clustered in early-adopter countries, of whichthe US and China are the biggest.
…Powered by rising smartphone penetration
15View from the top
Source GSMA Intelligence
0
5
10
15
20
25
dtacDiGiMegaFonAirtelTele2JioAISMaxisCelcomDNA
ThailandMalaysiaRussiaIndiaLithuaniaIndiaThailandMalaysiaMalaysiaFinland
9.810.4
10.911.011.111.211.412.0
15.2
24.3
Biggest users of mobile data: not the usual suspectsGB per customer per month, based on operators who have reported data traffic figures
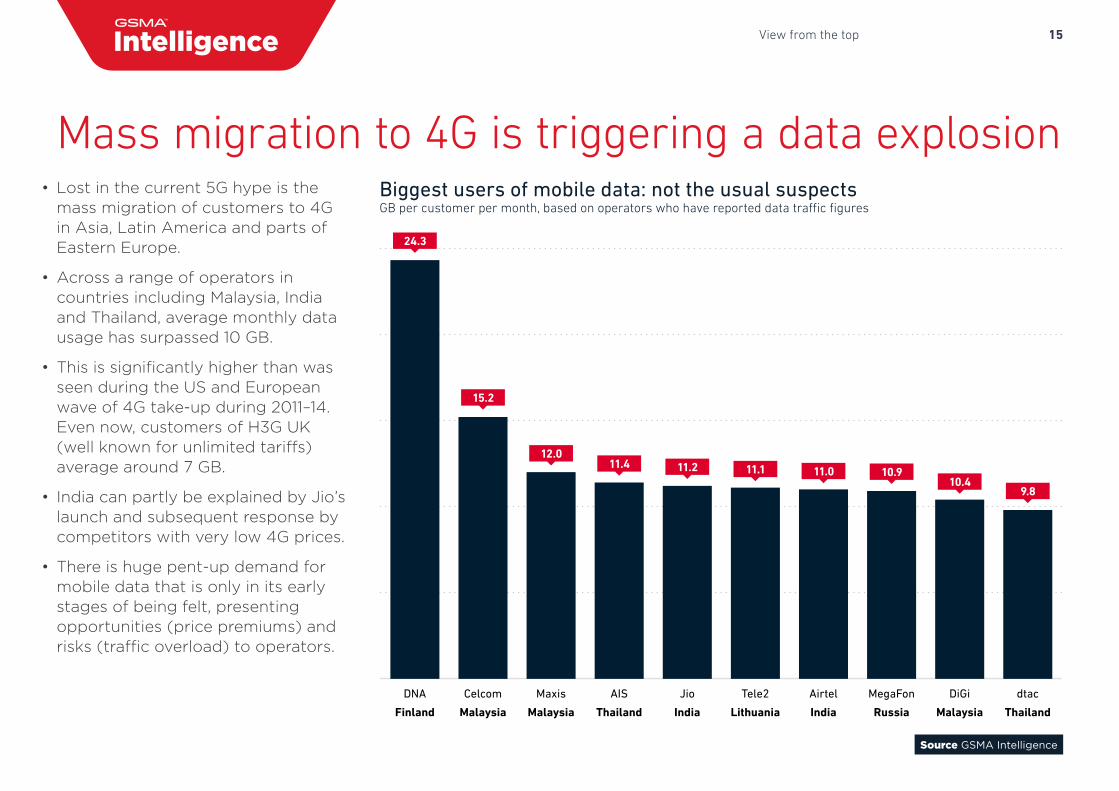
• Lost in the current 5G hype is themass migration of customers to 4Gin Asia, Latin America and parts ofEastern Europe.
• Across a range of operators incountries including Malaysia, Indiaand Thailand, average monthly datausage has surpassed 10 GB.
• This is significantly higher than wasseen during the US and Europeanwave of 4G take-up during 2011–14.Even now, customers of H3G UK(well known for unlimited tariffs)average around 7 GB.
• India can partly be explained by Jio’s launch and subsequent response by competitors with very low 4G prices.
• There is huge pent-up demand formobile data that is only in its earlystages of being felt, presentingopportunities (price premiums) andrisks (traffic overload) to operators.
Mass migration to 4G is triggering a data explosion
16View from the top
Source GSMA Intelligence
4%4%1%
Sub-SaharanAfrica
South AsiaMENALatin America& Caribbean
East Asia& Pacific
EuropeNorth America
Usage gap Coverage gapConnected
24%
46%
30%
33%
55%
12%
40%
49%
11%
53%
39%
7%
56%
41%
68%
28%
75%
24%
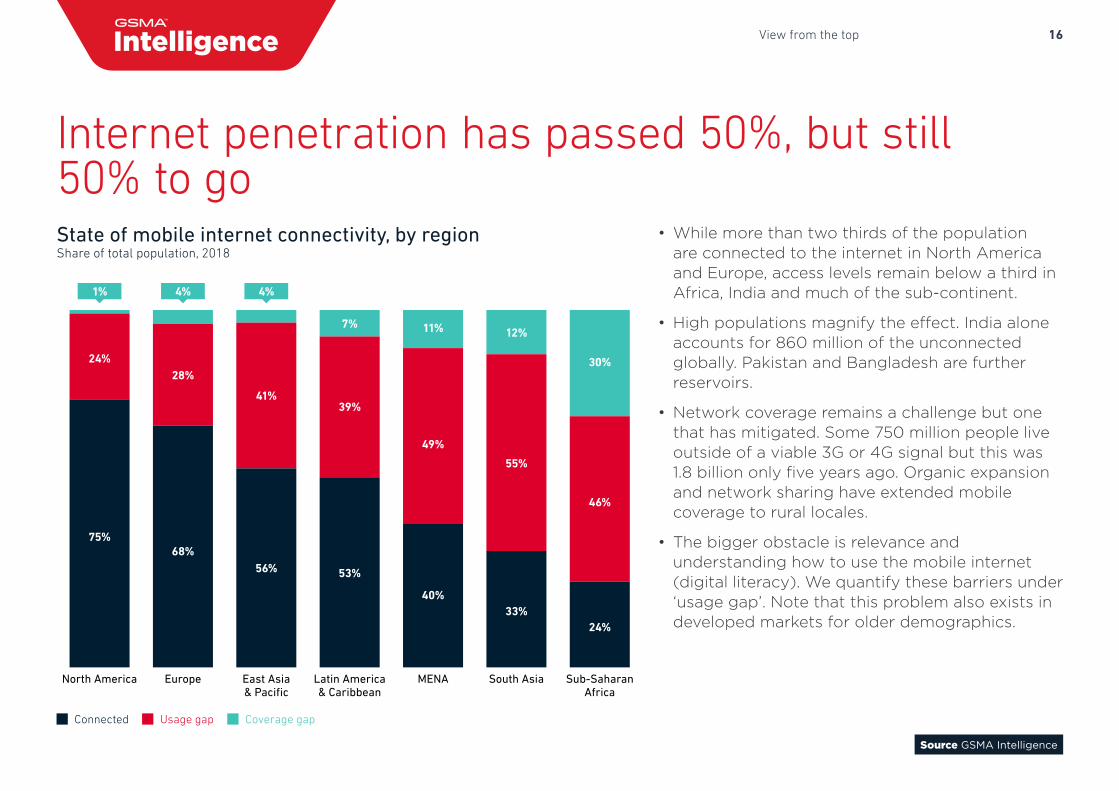
State of mobile internet connectivity, by region Share of total population, 2018
Internet penetration has passed 50%, but still 50% to go
• While more than two thirds of the population are connected to the internet in North America and Europe, access levels remain below a third in Africa, India and much of the sub-continent.
• High populations magnify the effect. India alone accounts for 860 million of the unconnected globally. Pakistan and Bangladesh are further reservoirs.
• Network coverage remains a challenge but one that has mitigated. Some 750 million people live outside of a viable 3G or 4G signal but this was 1.8 billion only five years ago. Organic expansion and network sharing have extended mobile coverage to rural locales.
• The bigger obstacle is relevance and understanding how to use the mobile internet (digital literacy). We quantify these barriers under ‘usage gap’. Note that this problem also exists in developed markets for older demographics.
17View from the top
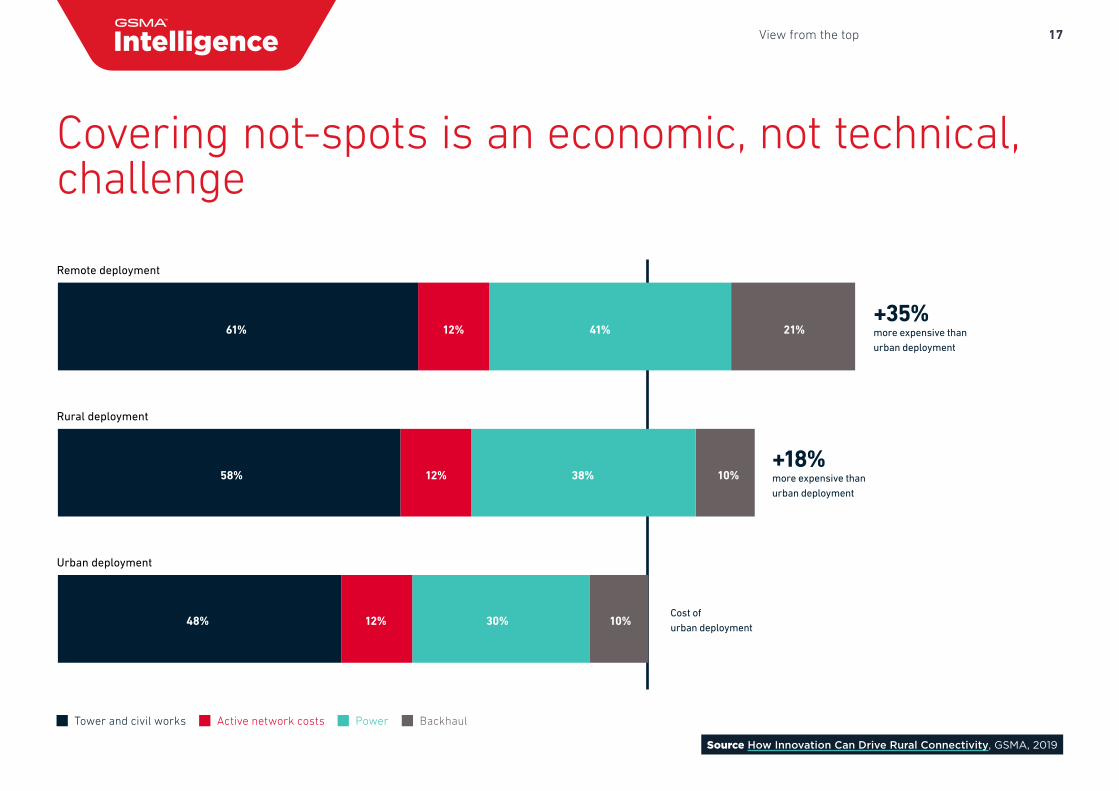
Active network costs Power BackhaulTower and civil works
Urban deployment
Rural deployment
Remote deployment
61% 12% 41% 21%
58% 12% 38% 10%
48% 12% 30% 10%
+35%more expensive thanurban deployment
+18%more expensive thanurban deployment
Cost ofurban deployment
Source How Innovation Can Drive Rural Connectivity, GSMA, 2019
Covering not-spots is an economic, not technical, challenge
18View from the top
Source GSMA Intelligence
SpaceX (Starlink) OneWeb Telesat Kuiper
1,6001,600
400
375
450
650
145
147
7841,296 1,156
400
600
800
1,000
1,200
1,400
1,600
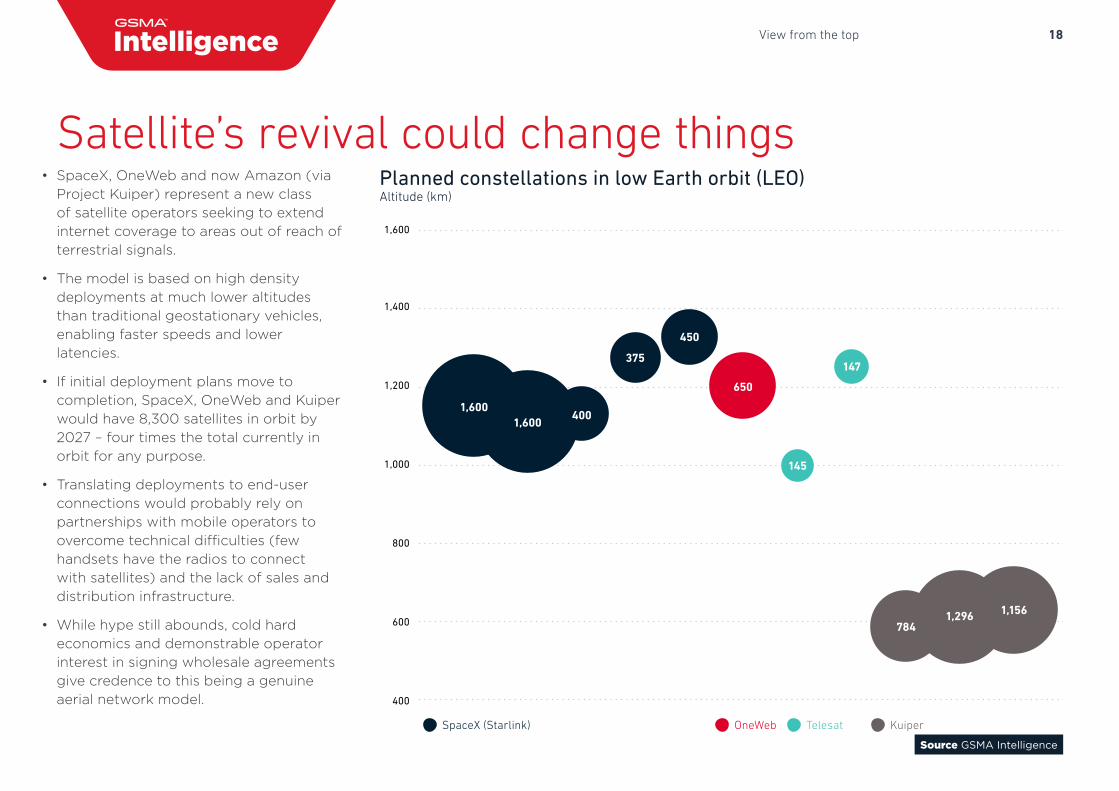
Planned constellations in low Earth orbit (LEO)Altitude (km)
• SpaceX, OneWeb and now Amazon (viaProject Kuiper) represent a new classof satellite operators seeking to extendinternet coverage to areas out of reach ofterrestrial signals.
• The model is based on high densitydeployments at much lower altitudesthan traditional geostationary vehicles,enabling faster speeds and lowerlatencies.
• If initial deployment plans move tocompletion, SpaceX, OneWeb and Kuiperwould have 8,300 satellites in orbit by2027 – four times the total currently inorbit for any purpose.
• Translating deployments to end-userconnections would probably rely onpartnerships with mobile operators toovercome technical difficulties (fewhandsets have the radios to connectwith satellites) and the lack of sales anddistribution infrastructure.
• While hype still abounds, cold hardeconomics and demonstrable operatorinterest in signing wholesale agreementsgive credence to this being a genuineaerial network model.
Satellite’s revival could change things
19View from the top
Source GSMA Intelligence
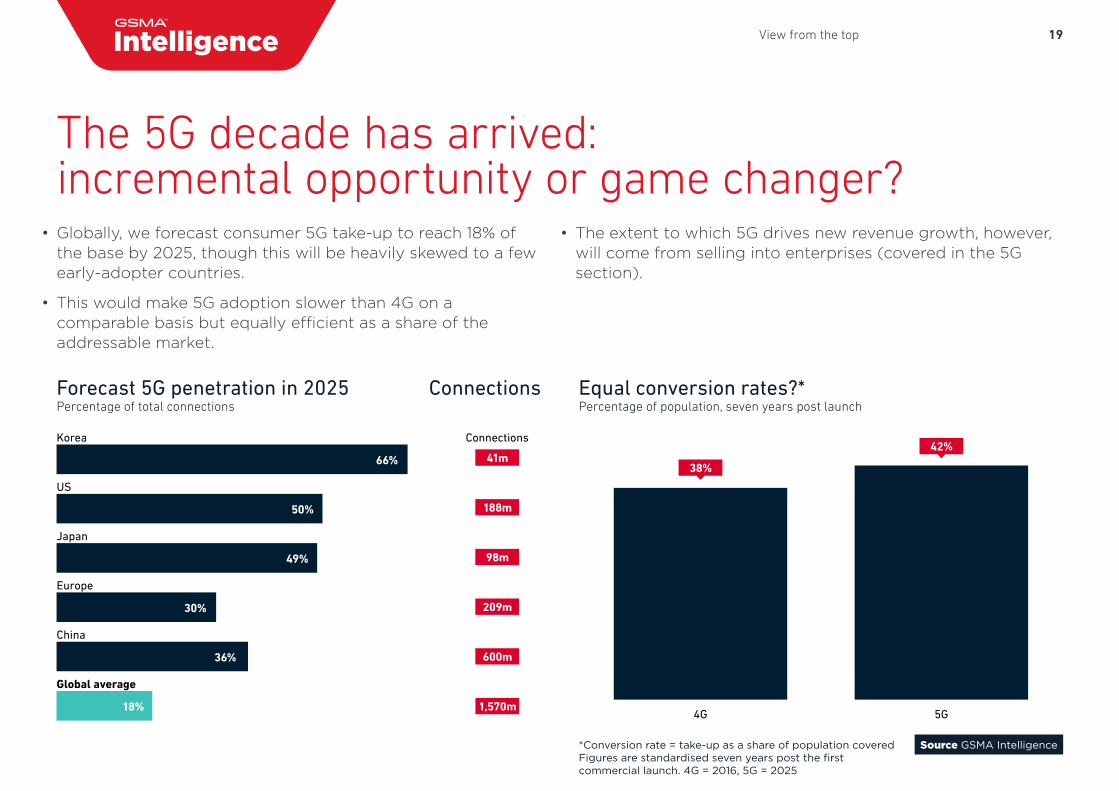
Forecast 5G penetration in 2025 ConnectionsPercentage of total connections
Equal conversion rates?*Percentage of population, seven years post launch
41m
188m
98m
209m
600m
0 10 20 30 40 50 60 70 80
Global average
China
Europe
Japan
US
Korea Connections
1,570m18%
36%
30%
49%
50%
66%
5G4G
42%
38%
• Globally, we forecast consumer 5G take-up to reach 18% of the base by 2025, though this will be heavily skewed to a few early-adopter countries.
• This would make 5G adoption slower than 4G on a comparable basis but equally efficient as a share of the addressable market.
• The extent to which 5G drives new revenue growth, however, will come from selling into enterprises (covered in the 5G section).
The 5G decade has arrived: incremental opportunity or game changer?
*Conversion rate = take-up as a share of population coveredFigures are standardised seven years post the first commercial launch. 4G = 2016, 5G = 2025
20View from the top
Source GSMA Intelligence
Average monthly tariff$
5G 4G
SwisscomKTVerizonSunriseSK TelecomLG UPlus
144
72
87
36
58
40
94
84
93
84
76
71
Unlim
ited plans
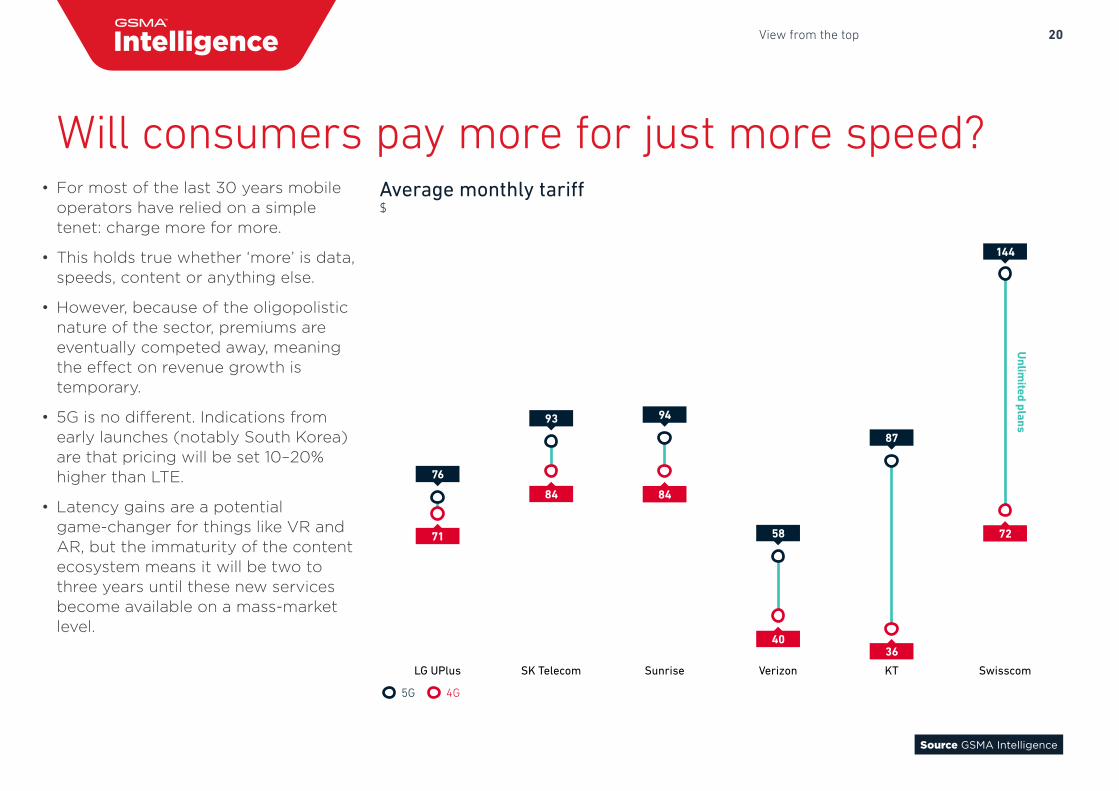
• For most of the last 30 years mobileoperators have relied on a simpletenet: charge more for more.
• This holds true whether ‘more’ is data,speeds, content or anything else.
• However, because of the oligopolisticnature of the sector, premiums areeventually competed away, meaningthe effect on revenue growth istemporary.
• 5G is no different. Indications fromearly launches (notably South Korea)are that pricing will be set 10–20%higher than LTE.
• Latency gains are a potentialgame-changer for things like VR andAR, but the immaturity of the contentecosystem means it will be two tothree years until these new servicesbecome available on a mass-marketlevel.
Will consumers pay more for just more speed?
21Future of devices
Future of devicesFollowing PCs and smartphones, a third wave is upon us
GLOBAL MOBILE TRENDS
The Big 5
Predictions for the next 10 years
View from the top
Implications of the 5G era
Enterprise IoT and Industry 4.0
Media and content
Financial performance
Regional outlooks
22Future of devices
Source GSMA Intelligence Consumer Insights Survey 2019
Which devices do you own? US consumers (2019)
Smartlighting
Home energy control (e.g. thermostat)
Smartspeaker
Health wearableSmartwatchFitness trackerLaptopVR headsetSmart TVTabletSmartphone
Smart homeWearablesPersonalcomputingSmart devices and entertainment
10%12%
27%
11%17%21%
78%
9%
35%
56%
91%
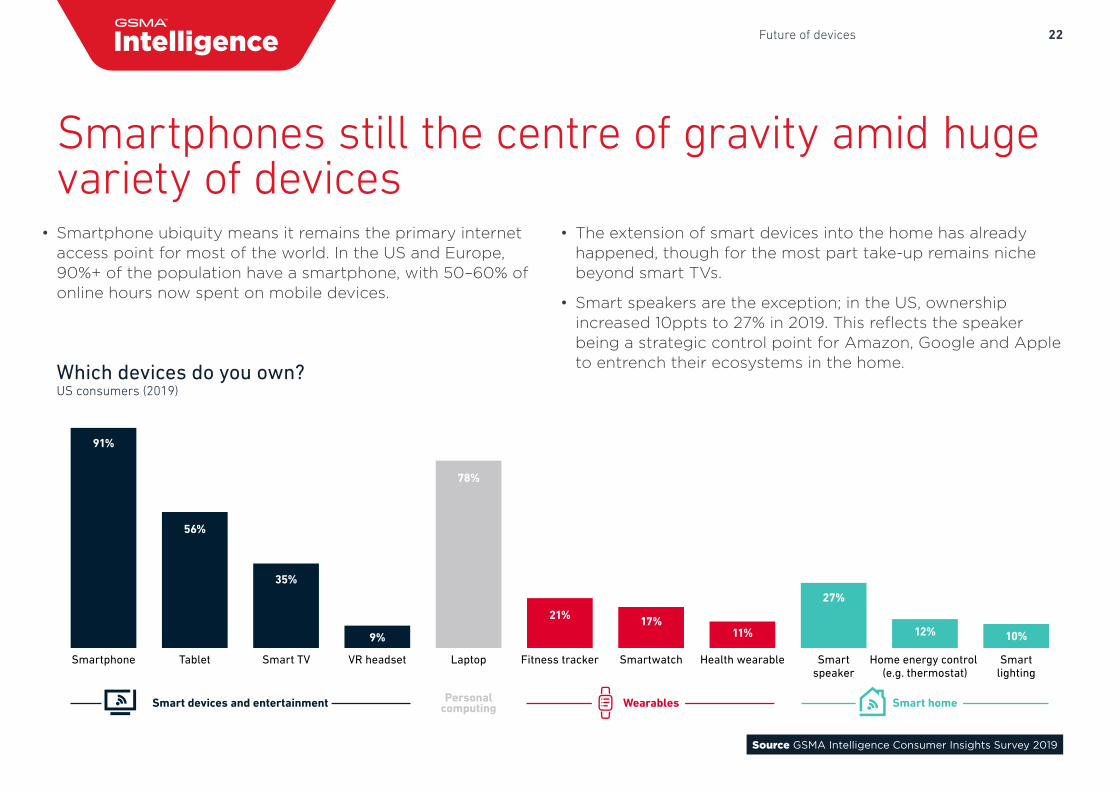
• Smartphone ubiquity means it remains the primary internetaccess point for most of the world. In the US and Europe,90%+ of the population have a smartphone, with 50–60% ofonline hours now spent on mobile devices.
• The extension of smart devices into the home has alreadyhappened, though for the most part take-up remains nichebeyond smart TVs.
• Smart speakers are the exception; in the US, ownershipincreased 10ppts to 27% in 2019. This reflects the speakerbeing a strategic control point for Amazon, Google and Appleto entrench their ecosystems in the home.
Smartphones still the centre of gravity amid huge variety of devices
23Future of devices
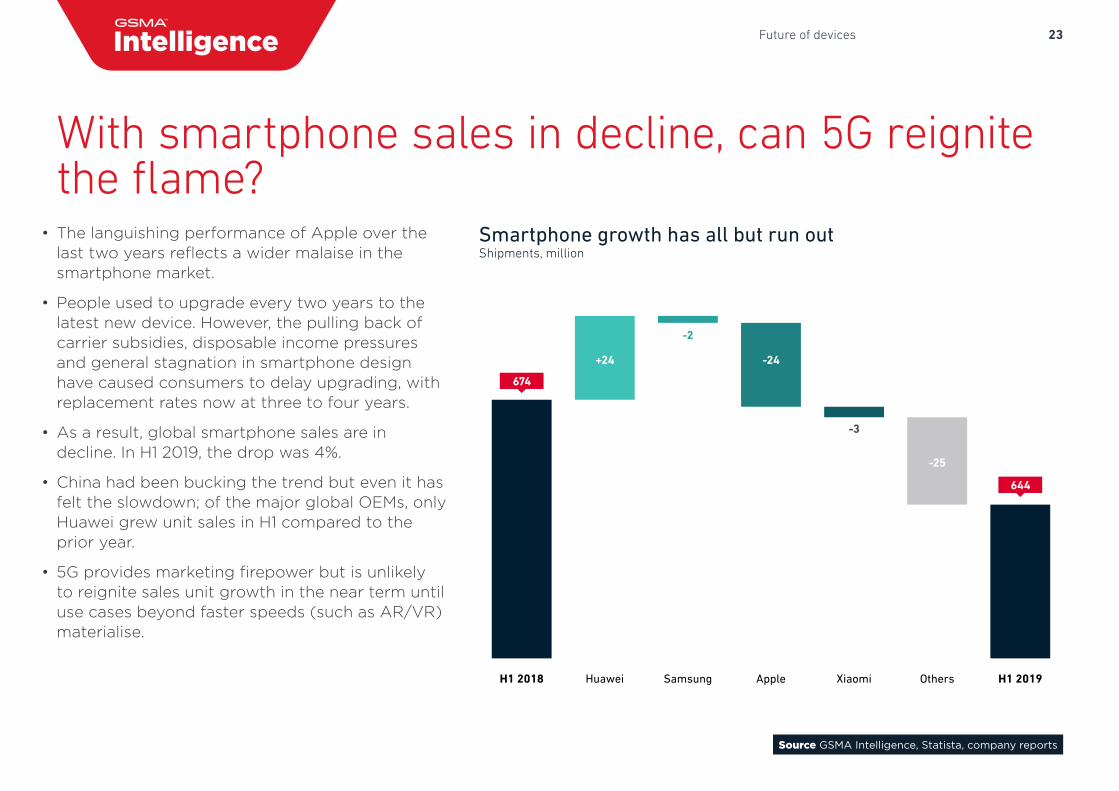
• The languishing performance of Apple over thelast two years reflects a wider malaise in thesmartphone market.
• People used to upgrade every two years to thelatest new device. However, the pulling back ofcarrier subsidies, disposable income pressuresand general stagnation in smartphone designhave caused consumers to delay upgrading, withreplacement rates now at three to four years.
• As a result, global smartphone sales are indecline. In H1 2019, the drop was 4%.
• China had been bucking the trend but even it hasfelt the slowdown; of the major global OEMs, onlyHuawei grew unit sales in H1 compared to theprior year.
• 5G provides marketing firepower but is unlikelyto reignite sales unit growth in the near term untiluse cases beyond faster speeds (such as AR/VR)materialise.
Source GSMA Intelligence, Statista, company reports
H1 2019OthersXiaomiAppleSamsungHuaweiH1 2018
674
644
+24 -24
-25
-3
-2
Smartphone growth has all but run outShipments, million
With smartphone sales in decline, can 5G reignite the flame?
24Future of devices
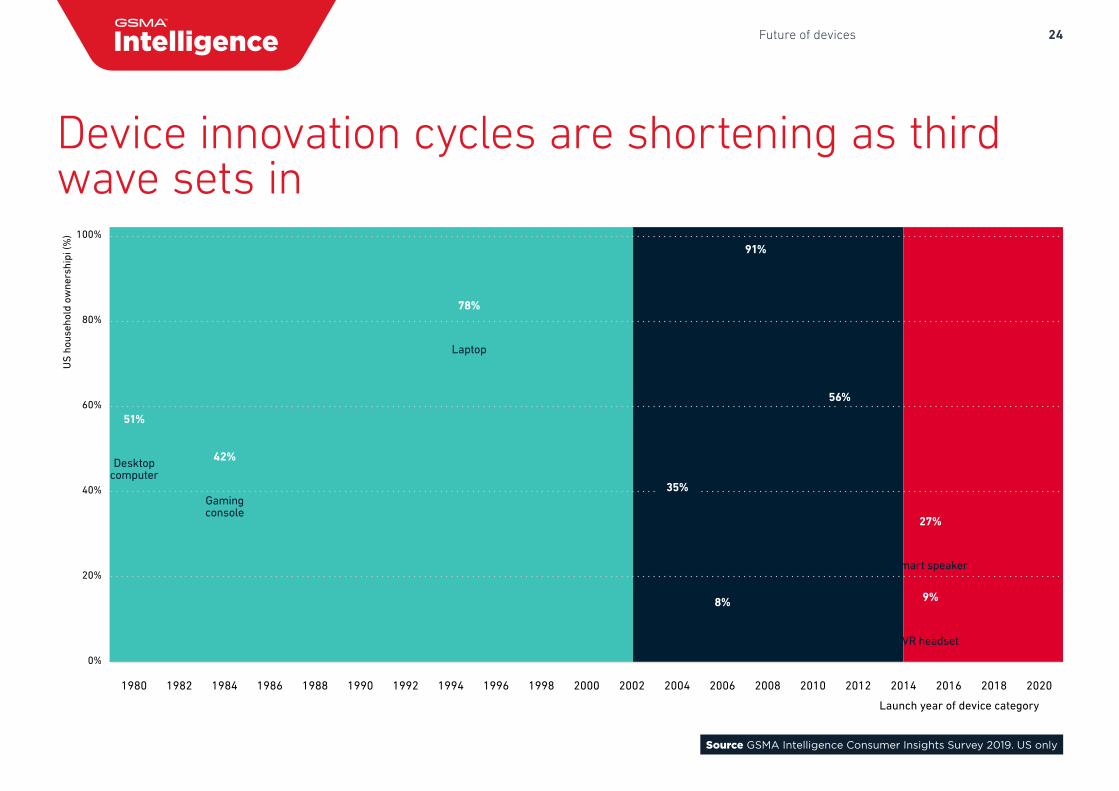
51%
42%
0%
20%
40%
60%
80%
100%
78%
91%
56%
35%
8%
27%
9%
Desktopcomputer
Gamingconsole
Laptop
Smartphone
Tablet
Smart TV
Dongle
Smart speaker
VR headset
Personalcomputing
Smartdevices
AI and immersion
US
hou
seho
ld o
wne
rshi
pi (%
)
Launch year of device category
202020182016201420122010200820062004200220001998199619941992199019881986198419821980
Source GSMA Intelligence Consumer Insights Survey 2019. US only
Device innovation cycles are shortening as third wave sets in
25Future of devices
Source GSMA Intelligence Consumer Insights Survey 2019
0%
2%
4%
6%
8%
10%
12%
14%
USUKGermanyAustralia
2018 20192017
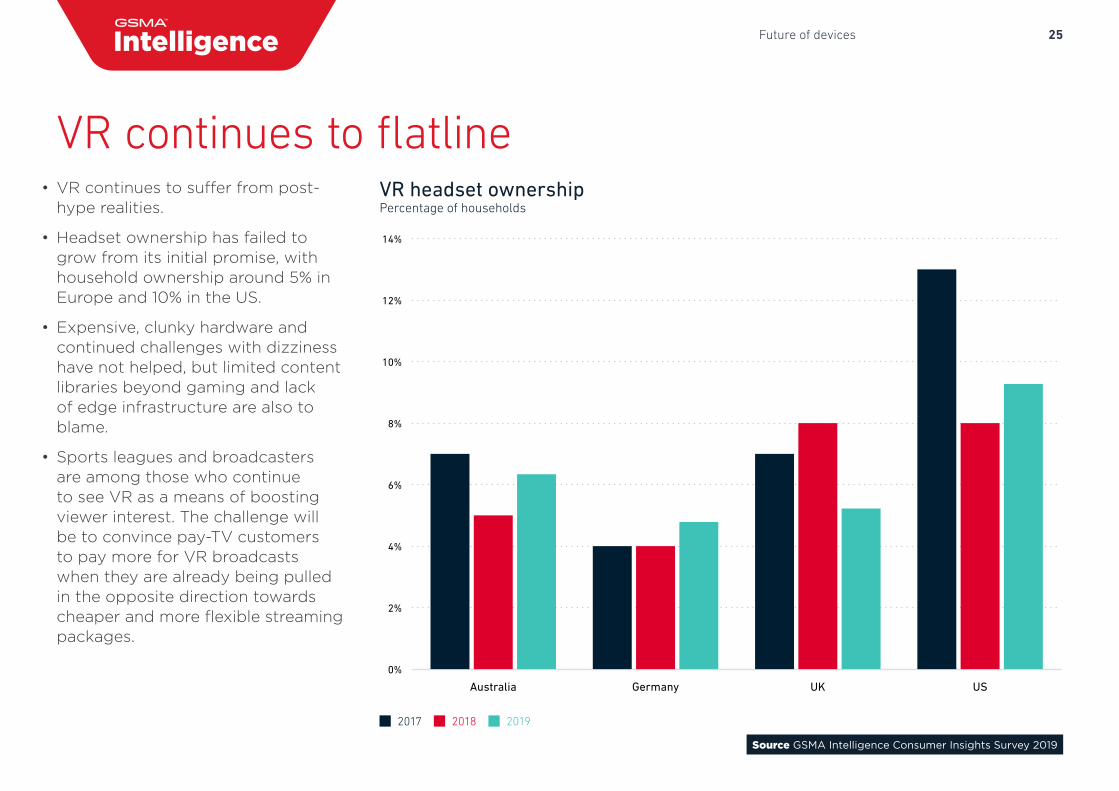
VR headset ownership Percentage of households
• VR continues to suffer from post-hype realities.
• Headset ownership has failed togrow from its initial promise, withhousehold ownership around 5% inEurope and 10% in the US.
• Expensive, clunky hardware andcontinued challenges with dizzinesshave not helped, but limited contentlibraries beyond gaming and lackof edge infrastructure are also toblame.
• Sports leagues and broadcastersare among those who continueto see VR as a means of boostingviewer interest. The challenge willbe to convince pay-TV customersto pay more for VR broadcastswhen they are already being pulledin the opposite direction towardscheaper and more flexible streamingpackages.
VR continues to flatline
26Future of devices
Source GSMA Intelligence Consumer Insights Survey (2018 and 2019), Strategy Analytics, Super Data Research
Apple
App
le
Google Amazon Other Android
Samsung
Samsung HTC Oculus Sony
Non-Samsung Android
Smartphones
VR headsets
Smart speakers
Smartphones
VR headsets
Smart speakers
0% 10% 20% 30% 40% 50% 60% 70% 80% 90% 100%
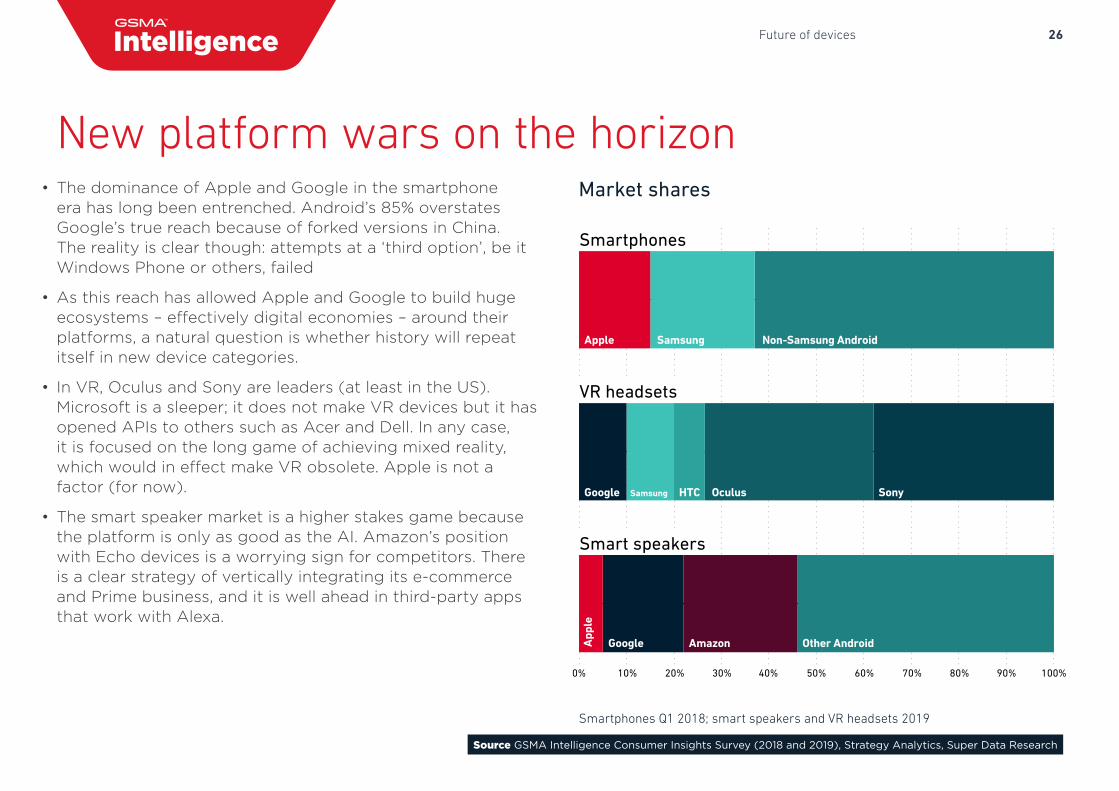
Market shares
Smartphones Q1 2018; smart speakers and VR headsets 2019
• The dominance of Apple and Google in the smartphoneera has long been entrenched. Android’s 85% overstatesGoogle’s true reach because of forked versions in China.The reality is clear though: attempts at a ‘third option’, be it Windows Phone or others, failed
• As this reach has allowed Apple and Google to build hugeecosystems – effectively digital economies – around theirplatforms, a natural question is whether history will repeatitself in new device categories.
• In VR, Oculus and Sony are leaders (at least in the US). Microsoft is a sleeper; it does not make VR devices but it has opened APIs to others such as Acer and Dell. In any case, it is focused on the long game of achieving mixed reality, which would in effect make VR obsolete. Apple is not a factor (for now).
• The smart speaker market is a higher stakes game becausethe platform is only as good as the AI. Amazon’s position with Echo devices is a worrying sign for competitors. There is a clear strategy of vertically integrating its e-commerce and Prime business, and it is well ahead in third-party apps that work with Alexa.
New platform wars on the horizon
27Implications of the 5G era
Implications of the 5G era
GLOBAL MOBILE TRENDS
The Big 5
Predictions for the next 10 years
View from the top
Future of devices
Enterprise IoT and Industry 4.0
Media and content
Financial performance
Regional outlooks
28Implications of the 5G era
Source GSMA Intelligence
Commercial mobile 5G network Planned commercial 5G network
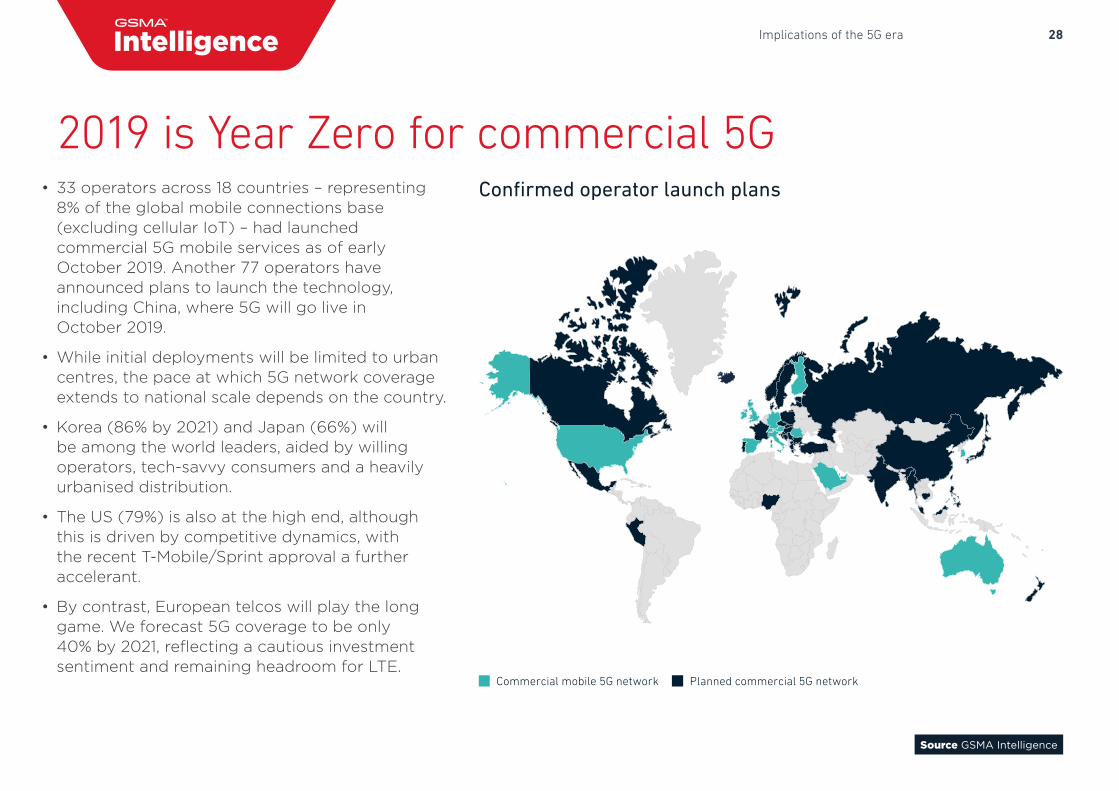
Confirmed operator launch plans• 33 operators across 18 countries – representing8% of the global mobile connections base(excluding cellular IoT) – had launchedcommercial 5G mobile services as of earlyOctober 2019. Another 77 operators haveannounced plans to launch the technology,including China, where 5G will go live inOctober 2019.
• While initial deployments will be limited to urbancentres, the pace at which 5G network coverageextends to national scale depends on the country.
• Korea (86% by 2021) and Japan (66%) willbe among the world leaders, aided by willingoperators, tech-savvy consumers and a heavilyurbanised distribution.
• The US (79%) is also at the high end, althoughthis is driven by competitive dynamics, withthe recent T-Mobile/Sprint approval a furtheraccelerant.
• By contrast, European telcos will play the longgame. We forecast 5G coverage to be only40% by 2021, reflecting a cautious investmentsentiment and remaining headroom for LTE.
2019 is Year Zero for commercial 5G
29Implications of the 5G era
Source GSMA Intelligence
2G 3G 4G 5G
59%
18%
18%
5%
20252024202320222021202020192018201720162015
Share (2025)
0%
10%
20%
30%
40%
50%
60%
70%
80%
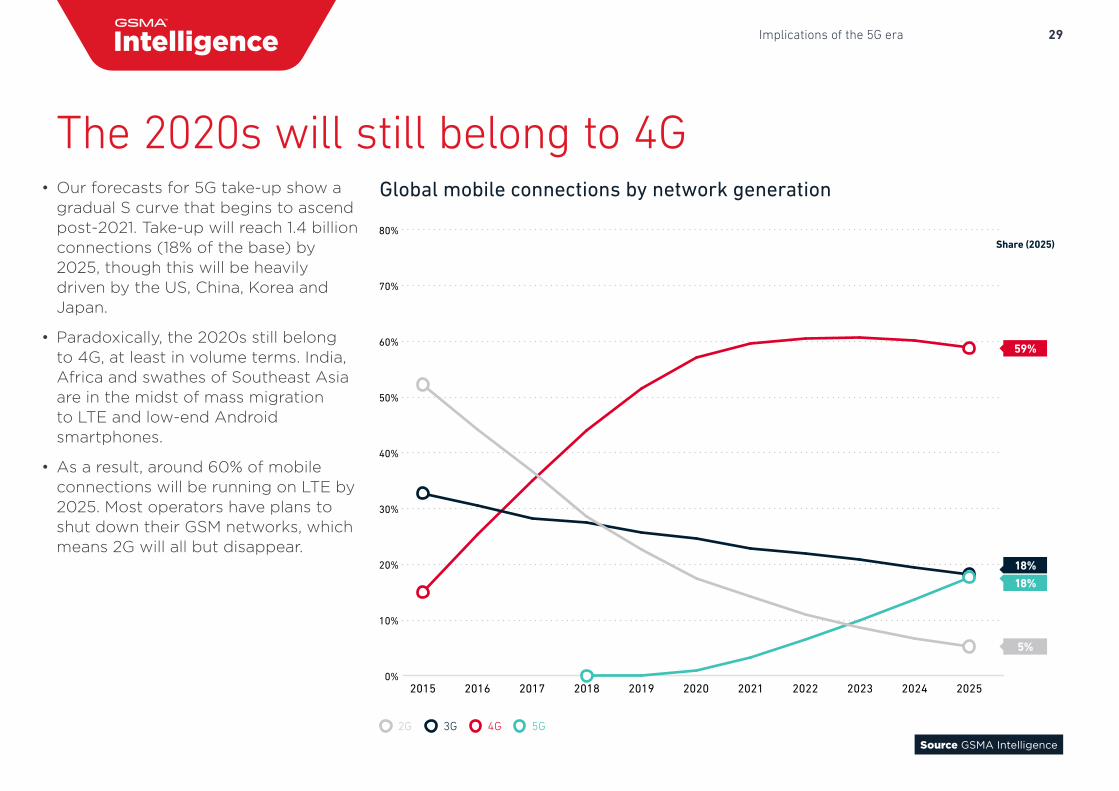
Global mobile connections by network generation• Our forecasts for 5G take-up show agradual S curve that begins to ascendpost-2021. Take-up will reach 1.4 billionconnections (18% of the base) by2025, though this will be heavilydriven by the US, China, Korea andJapan.
• Paradoxically, the 2020s still belongto 4G, at least in volume terms. India,Africa and swathes of Southeast Asiaare in the midst of mass migrationto LTE and low-end Androidsmartphones.
• As a result, around 60% of mobileconnections will be running on LTE by2025. Most operators have plans toshut down their GSM networks, whichmeans 2G will all but disappear.
The 2020s will still belong to 4G
30Implications of the 5G era
Source GSMA Intelligence
0 100 200 300 400 500 600
80%
60%
40%
20%
0%
5G s
hare
of m
obile
con
nect
ions
5G mobile connections (millions)
SOUTH KOREA
JAPAN
US
CHINA
EUROPE
REST OF APAC
MEA
LATAM
CIS
5G mobile connections: 2025 viewBubble size corresponds to forecast mobile revenue in 2025
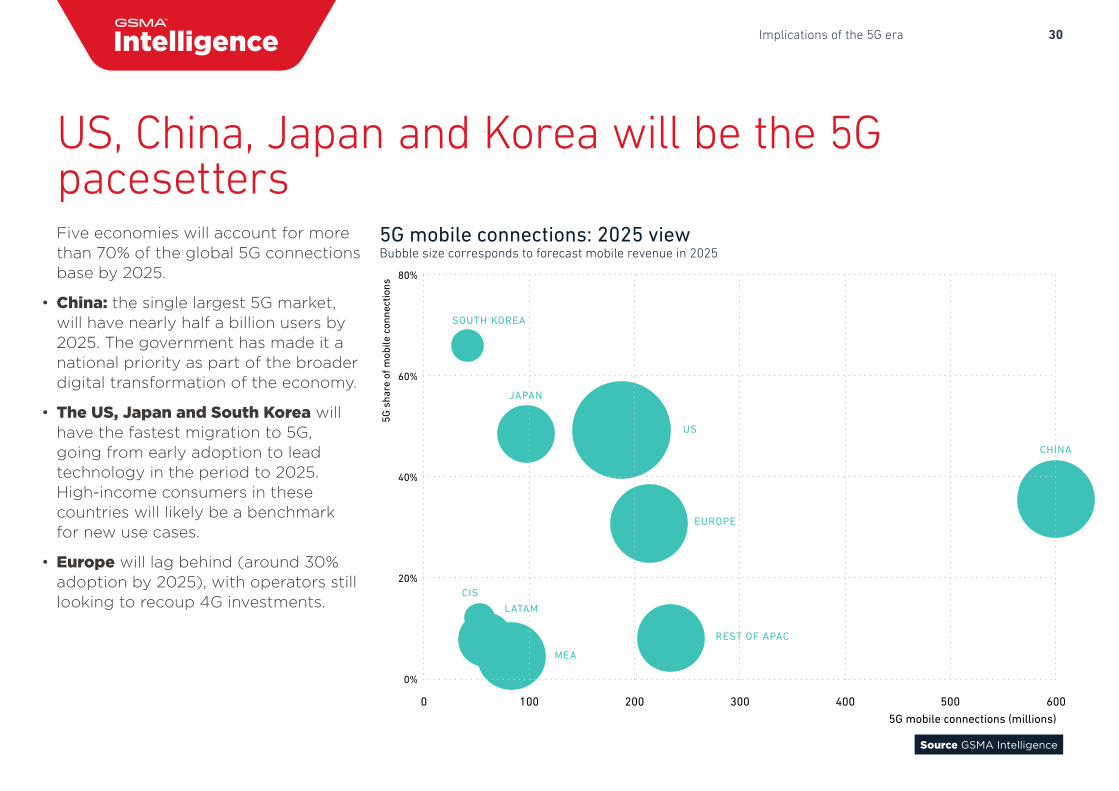
Five economies will account for more than 70% of the global 5G connections base by 2025.
• China: the single largest 5G market,will have nearly half a billion users by2025. The government has made it anational priority as part of the broaderdigital transformation of the economy.
• The US, Japan and South Korea willhave the fastest migration to 5G,going from early adoption to leadtechnology in the period to 2025.High-income consumers in thesecountries will likely be a benchmarkfor new use cases.
• Europe will lag behind (around 30%adoption by 2025), with operators stilllooking to recoup 4G investments.
US, China, Japan and Korea will be the 5G pacesetters
31Implications of the 5G era
Source GSMA Intelligence survey
20%22%
23%25%
41%
54%
24%
Don't knowConnectivityfor previously
unconnected devices
Lower servicecosts
Improvedfixed homebroadband
Innovativenew services
Improved mobileservice coverage
Improved mobile data speeds
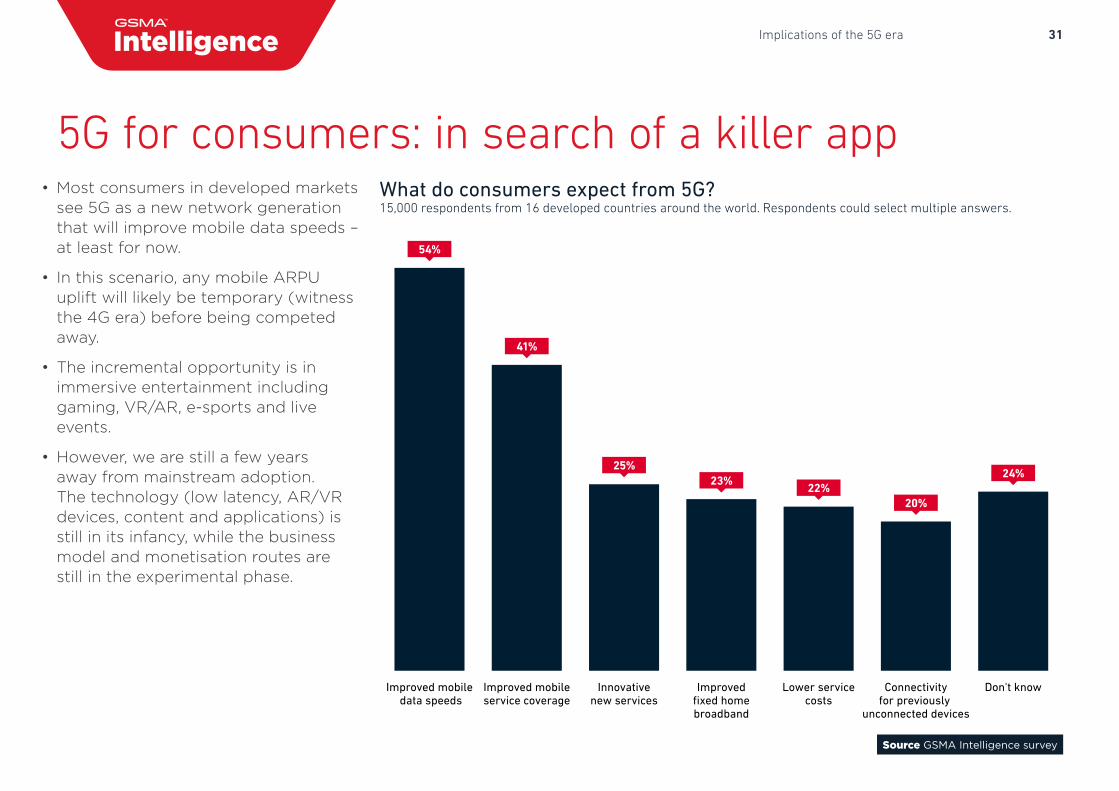
What do consumers expect from 5G? 15,000 respondents from 16 developed countries around the world. Respondents could select multiple answers.
• Most consumers in developed marketssee 5G as a new network generationthat will improve mobile data speeds –at least for now.
• In this scenario, any mobile ARPUuplift will likely be temporary (witnessthe 4G era) before being competedaway.
• The incremental opportunity is inimmersive entertainment includinggaming, VR/AR, e-sports and liveevents.
• However, we are still a few yearsaway from mainstream adoption.The technology (low latency, AR/VRdevices, content and applications) isstill in its infancy, while the businessmodel and monetisation routes arestill in the experimental phase.
5G for consumers: in search of a killer app
32Implications of the 5G era
Source GSMA Intelligence, Q1 2019 – Residential and business
0.0
0.2
0.4
0.6
0.8
1.0
FTTP/B xDSL OtherCable
BrazilAustraliaFranceUKSpainSouth KoreaChinaUS
Cable FTTP/B xDSL
100%
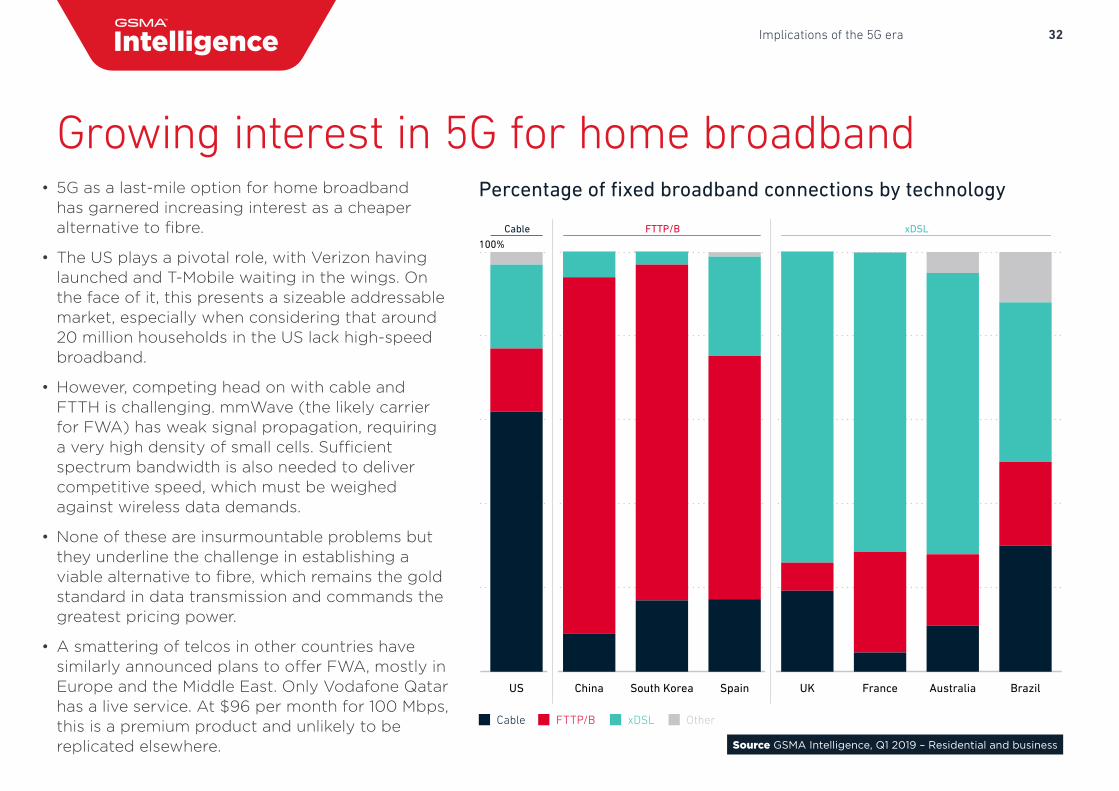
Percentage of fixed broadband connections by technology• 5G as a last-mile option for home broadbandhas garnered increasing interest as a cheaperalternative to fibre.
• The US plays a pivotal role, with Verizon havinglaunched and T-Mobile waiting in the wings. Onthe face of it, this presents a sizeable addressablemarket, especially when considering that around20 million households in the US lack high-speedbroadband.
• However, competing head on with cable andFTTH is challenging. mmWave (the likely carrierfor FWA) has weak signal propagation, requiring a very high density of small cells. Sufficientspectrum bandwidth is also needed to delivercompetitive speed, which must be weighedagainst wireless data demands.
• None of these are insurmountable problems butthey underline the challenge in establishing aviable alternative to fibre, which remains the gold standard in data transmission and commands the greatest pricing power.
• A smattering of telcos in other countries havesimilarly announced plans to offer FWA, mostly in Europe and the Middle East. Only Vodafone Qatar has a live service. At $96 per month for 100 Mbps, this is a premium product and unlikely to be replicated elsewhere.
Growing interest in 5G for home broadband
33Implications of the 5G era
Source GSMA Intelligence IoT Enterprise Survey, Q4 2018
ChinaAll
Low latency servicesEdge computingNetwork slicingHigher datatransfer speeds
31%
41%
49%
74%
42%
53%
67%
74%
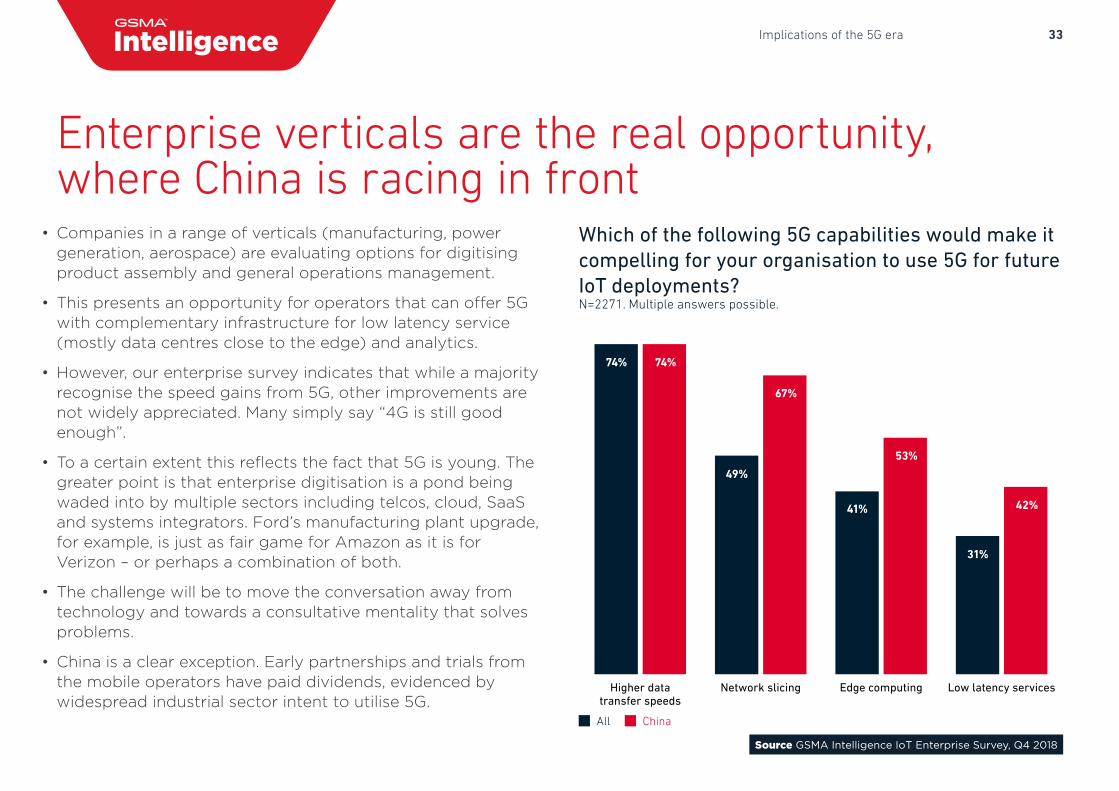
Which of the following 5G capabilities would make it compelling for your organisation to use 5G for future IoT deployments?N=2271. Multiple answers possible.
• Companies in a range of verticals (manufacturing, powergeneration, aerospace) are evaluating options for digitisingproduct assembly and general operations management.
• This presents an opportunity for operators that can offer 5Gwith complementary infrastructure for low latency service(mostly data centres close to the edge) and analytics.
• However, our enterprise survey indicates that while a majorityrecognise the speed gains from 5G, other improvements arenot widely appreciated. Many simply say “4G is still goodenough”.
• To a certain extent this reflects the fact that 5G is young. Thegreater point is that enterprise digitisation is a pond beingwaded into by multiple sectors including telcos, cloud, SaaSand systems integrators. Ford’s manufacturing plant upgrade,for example, is just as fair game for Amazon as it is forVerizon – or perhaps a combination of both.
• The challenge will be to move the conversation away fromtechnology and towards a consultative mentality that solvesproblems.
• China is a clear exception. Early partnerships and trials fromthe mobile operators have paid dividends, evidenced bywidespread industrial sector intent to utilise 5G.
Enterprise verticals are the real opportunity, where China is racing in front
34Implications of the 5G era
Source GSMA Intelligence
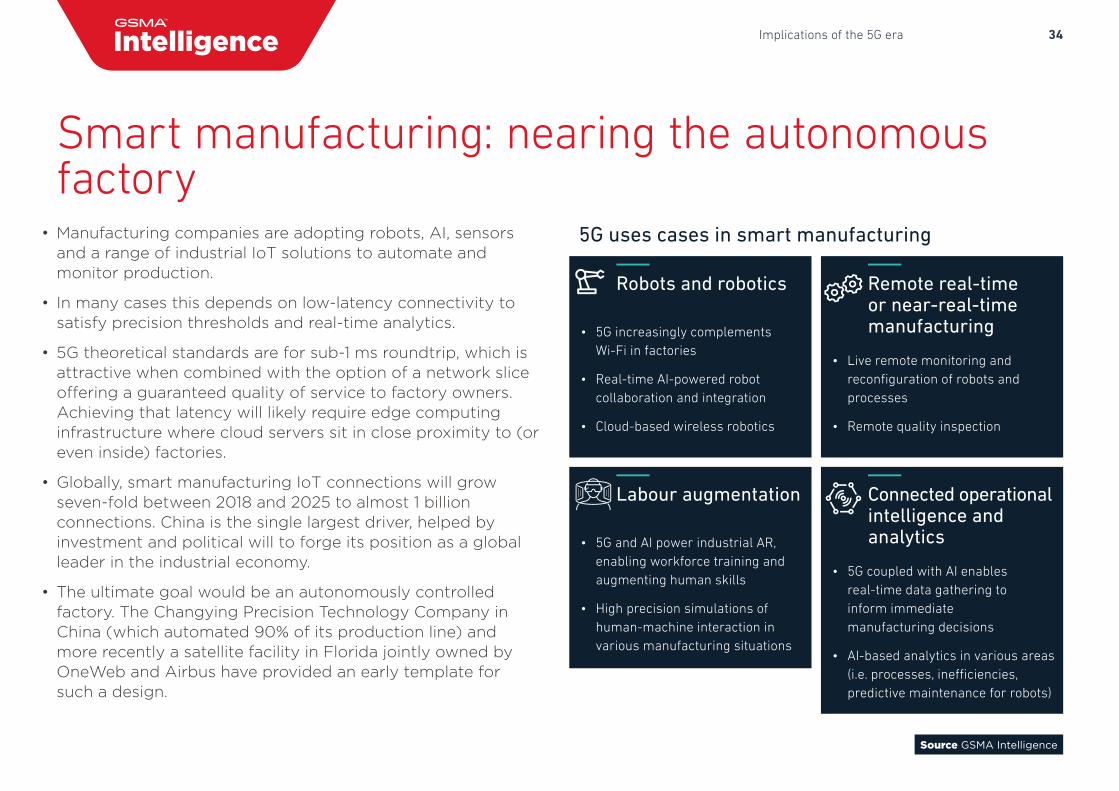
5G uses cases in smart manufacturing• Manufacturing companies are adopting robots, AI, sensorsand a range of industrial IoT solutions to automate andmonitor production.
• In many cases this depends on low-latency connectivity tosatisfy precision thresholds and real-time analytics.
• 5G theoretical standards are for sub-1 ms roundtrip, which isattractive when combined with the option of a network sliceoffering a guaranteed quality of service to factory owners.Achieving that latency will likely require edge computinginfrastructure where cloud servers sit in close proximity to (oreven inside) factories.
• Globally, smart manufacturing IoT connections will growseven-fold between 2018 and 2025 to almost 1 billionconnections. China is the single largest driver, helped byinvestment and political will to forge its position as a globalleader in the industrial economy.
• The ultimate goal would be an autonomously controlledfactory. The Changying Precision Technology Company inChina (which automated 90% of its production line) andmore recently a satellite facility in Florida jointly owned byOneWeb and Airbus have provided an early template forsuch a design.
Smart manufacturing: nearing the autonomous factory
Robots and robotics
Labour augmentation
Remote real-time or near-real-time manufacturing
Connected operational intelligence and analytics
• 5G increasingly complementsWi-Fi in factories
• Real-time AI-powered robotcollaboration and integration
• Cloud-based wireless robotics
• 5G and AI power industrial AR,enabling workforce training andaugmenting human skills
• High precision simulations ofhuman-machine interaction invarious manufacturing situations
• Live remote monitoring andreconfiguration of robots andprocesses
• Remote quality inspection
• 5G coupled with AI enablesreal-time data gathering toinform immediatemanufacturing decisions
• AI-based analytics in various areas(i.e. processes, inefficiencies,predictive maintenance for robots)
35Implications of the 5G era
Source GSMA Intelligence IoT Enterprise Survey
>500 devices<500 devices
MultinationalNationalCityLocation-specific(e.g. factory)
13%
38%
20%15%
13%
22%
11%
8%
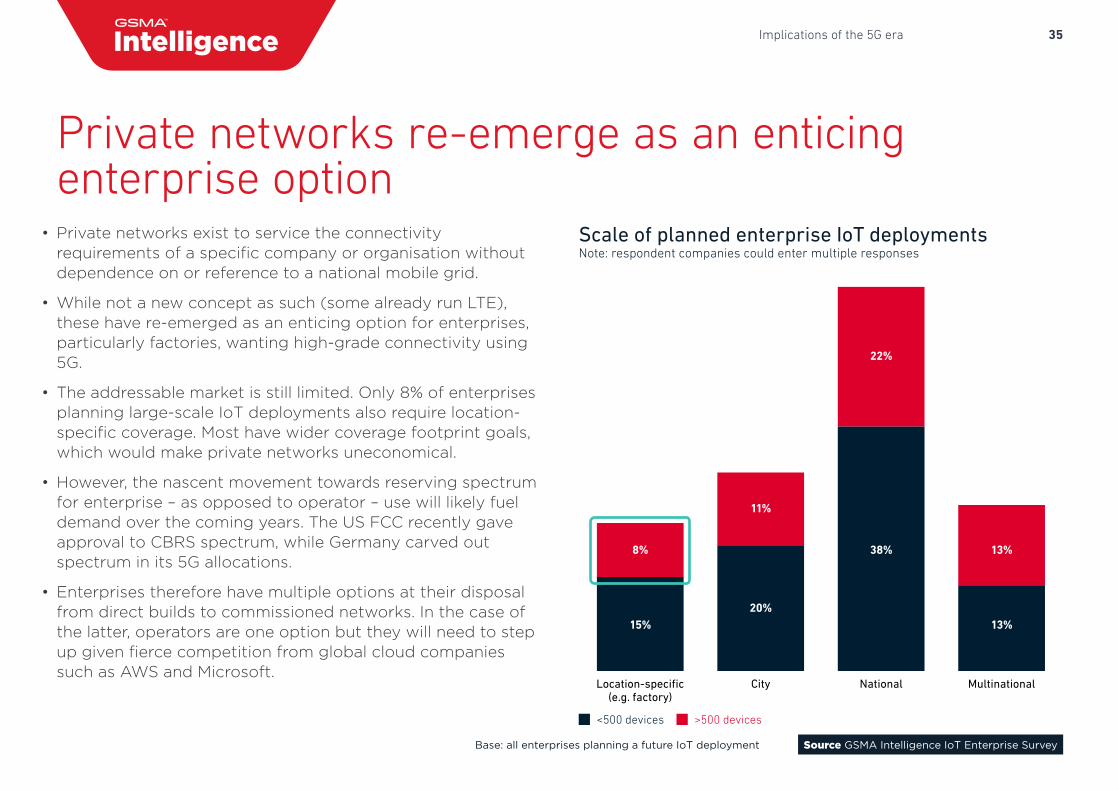
Scale of planned enterprise IoT deploymentsNote: respondent companies could enter multiple responses
• Private networks exist to service the connectivityrequirements of a specific company or organisation withoutdependence on or reference to a national mobile grid.
• While not a new concept as such (some already run LTE),these have re-emerged as an enticing option for enterprises,particularly factories, wanting high-grade connectivity using5G.
• The addressable market is still limited. Only 8% of enterprisesplanning large-scale IoT deployments also require location-specific coverage. Most have wider coverage footprint goals,which would make private networks uneconomical.
• However, the nascent movement towards reserving spectrumfor enterprise – as opposed to operator – use will likely fueldemand over the coming years. The US FCC recently gaveapproval to CBRS spectrum, while Germany carved outspectrum in its 5G allocations.
• Enterprises therefore have multiple options at their disposalfrom direct builds to commissioned networks. In the case ofthe latter, operators are one option but they will need to stepup given fierce competition from global cloud companiessuch as AWS and Microsoft.
Private networks re-emerge as an enticing enterprise option
Base: all enterprises planning a future IoT deployment
36Implications of the 5G era
Source GSMA Intelligence
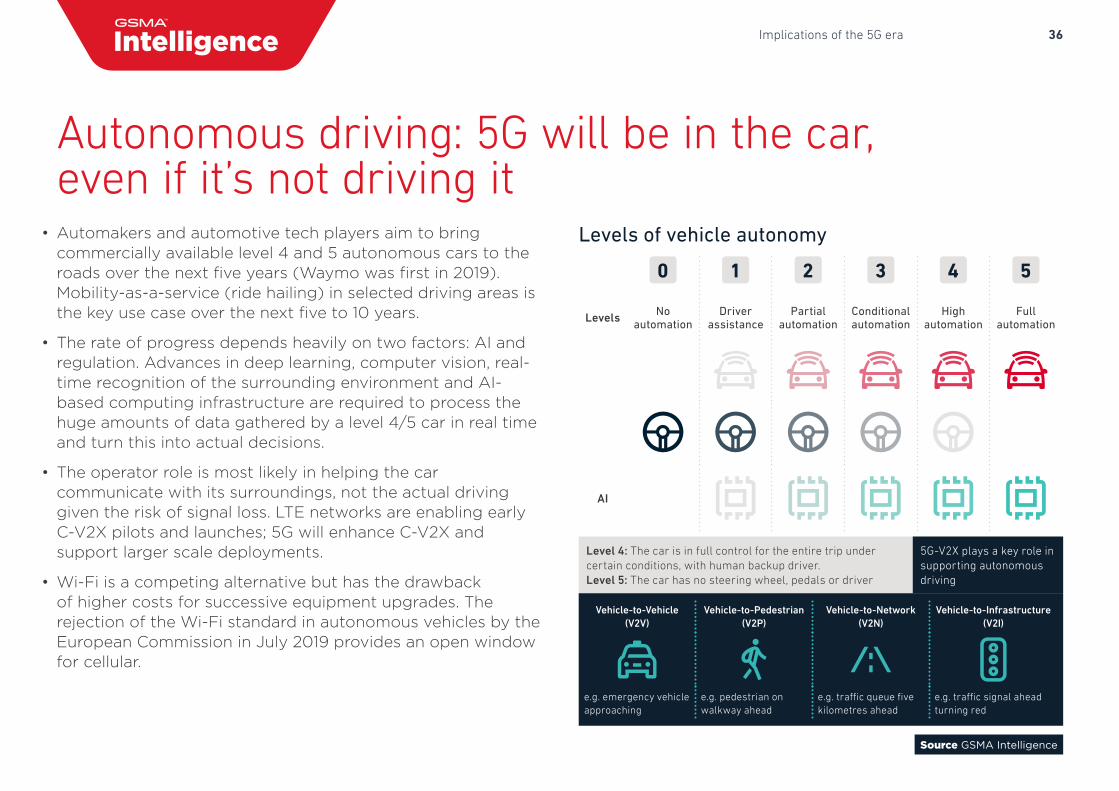
Levels of vehicle autonomy• Automakers and automotive tech players aim to bringcommercially available level 4 and 5 autonomous cars to theroads over the next five years (Waymo was first in 2019).Mobility-as-a-service (ride hailing) in selected driving areas isthe key use case over the next five to 10 years.
• The rate of progress depends heavily on two factors: AI andregulation. Advances in deep learning, computer vision, real-time recognition of the surrounding environment and AI-based computing infrastructure are required to process thehuge amounts of data gathered by a level 4/5 car in real timeand turn this into actual decisions.
• The operator role is most likely in helping the carcommunicate with its surroundings, not the actual drivinggiven the risk of signal loss. LTE networks are enabling earlyC-V2X pilots and launches; 5G will enhance C-V2X andsupport larger scale deployments.
• Wi-Fi is a competing alternative but has the drawbackof higher costs for successive equipment upgrades. Therejection of the Wi-Fi standard in autonomous vehicles by theEuropean Commission in July 2019 provides an open windowfor cellular.
Autonomous driving: 5G will be in the car, even if it’s not driving it
0 1 2 3 4 5
Levels No automation
Driver assistance
Partial automation
Conditional automation
High automation
Full automation
AI
Vehicle-to-Vehicle (V2V)
Vehicle-to-Pedestrian (V2P)
Vehicle-to-Network (V2N)
Vehicle-to-Infrastructure (V2I)
e.g. emergency vehicleapproaching
e.g. pedestrian on walkway ahead
e.g. traffic queue five kilometres ahead
e.g. traffic signal ahead turning red
Level 4: The car is in full control for the entire trip under certain conditions, with human backup driver. Level 5: The car has no steering wheel, pedals or driver
5G-V2X plays a key role in supporting autonomous driving
37Enterprise IoT and Industry 4.0
Enterprise IoT and Industry 4.0 Act now or lose later
GLOBAL MOBILE TRENDS
The Big 5
Predictions for the next 10 years
View from the top
Future of devices
Implications of the 5G era
Media and content
Financial performance
Regional outlooks
38Enterprise IoT and Industry 4.0
Source GSMA Intelligence
Enterprise/industrial will account for over half of IoT connections by 2025IoT connections (m)
Incremental value is in platforms and servicesIoT revenue ($m)
Consumer Enterprise
0
5,000
10,000
15,000
20,000
25,000
30,000
ENTERPRISE
30%
44%
54%
202520192010
IoT connectivity Professional servicesApplications, platforms and services
0
200,000
400,000
600,000
800,000
1,000,000
1,200,000
202520192010
27%
68%
5%
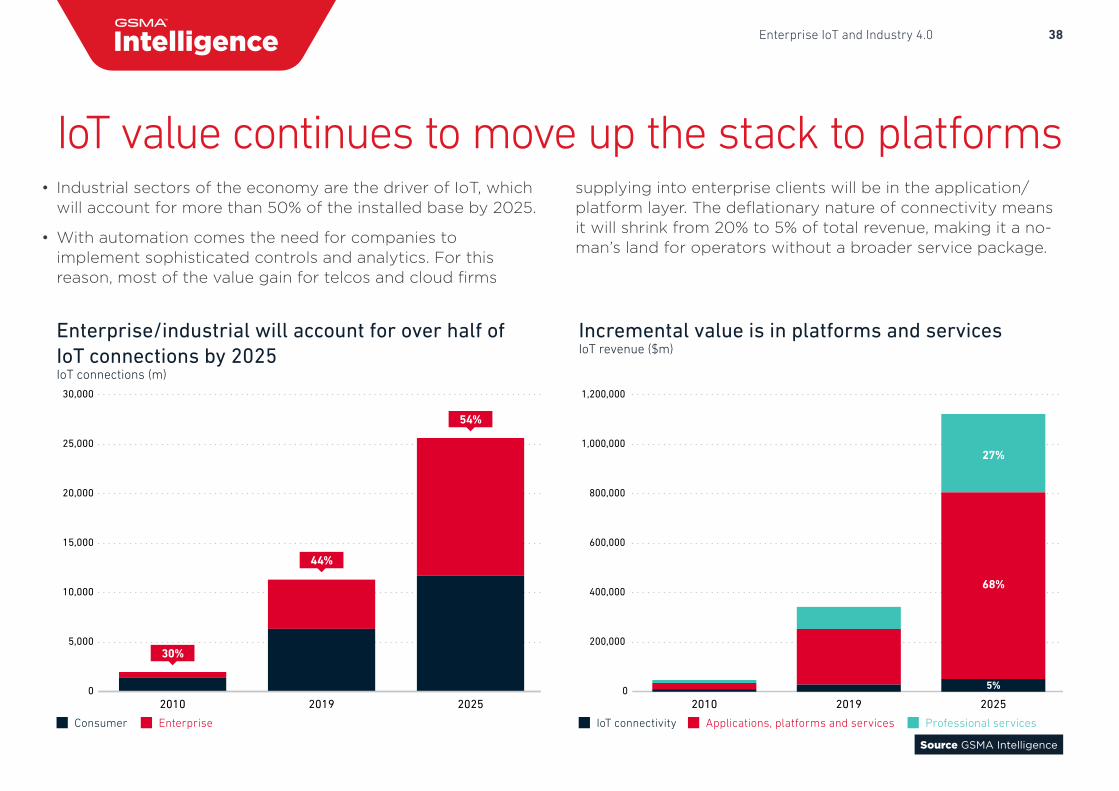
• Industrial sectors of the economy are the driver of IoT, whichwill account for more than 50% of the installed base by 2025.
• With automation comes the need for companies toimplement sophisticated controls and analytics. For thisreason, most of the value gain for telcos and cloud firms
supplying into enterprise clients will be in the application/platform layer. The deflationary nature of connectivity means it will shrink from 20% to 5% of total revenue, making it a no-man’s land for operators without a broader service package.
IoT value continues to move up the stack to platforms
39Enterprise IoT and Industry 4.0
Source GSMA Intelligence IoT Enterprise Survey Q4 2018
Two thirds of companies have adopted IoT Current IoT deployment size – small is big
Deployed – further plans Deployed – no further plans
Started but not finalised (incl. proof of concept) Have not deployed
���������ALLENTERPRISES 48%18%
17%
17%
���������10,000+
5,001–10,000
Unsure
1,001–5,000
501–1000
101–500
50–100
Less than 50
32%
24%
18%
12%
6%
3%
3%
2%
74% < 500 devices
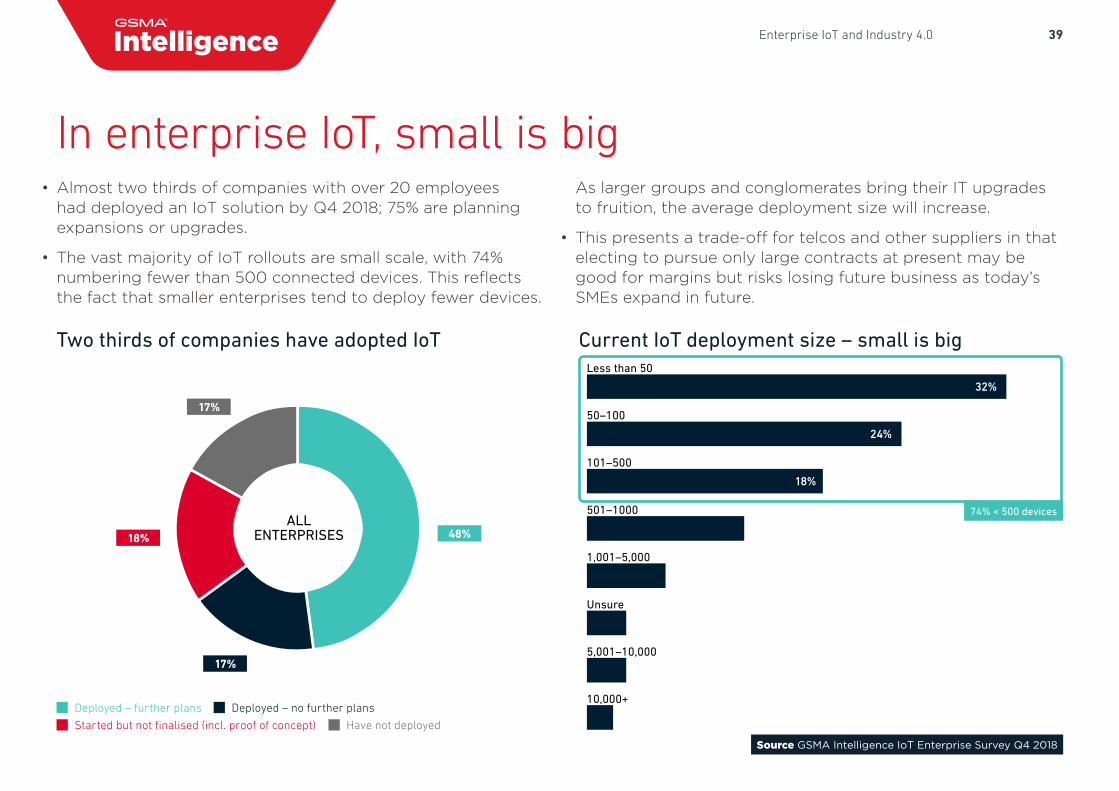
• Almost two thirds of companies with over 20 employeeshad deployed an IoT solution by Q4 2018; 75% are planningexpansions or upgrades.
• The vast majority of IoT rollouts are small scale, with 74%numbering fewer than 500 connected devices. This reflectsthe fact that smaller enterprises tend to deploy fewer devices.
As larger groups and conglomerates bring their IT upgrades to fruition, the average deployment size will increase.
• This presents a trade-off for telcos and other suppliers in thatelecting to pursue only large contracts at present may begood for margins but risks losing future business as today’sSMEs expand in future.
In enterprise IoT, small is big
40Enterprise IoT and Industry 4.0
Source GSMA IntelligenceSource GSMA Intelligence IoT Enterprise Survey Q4 2018
Cost savings attributable to IoT deployments% of respondents
IoT economic impact on business productivity$ billion
41–50% saving
31–40% saving
21–30% saving
16–20% saving
6–15% saving
0–5% saving
1%
0%
1%
2%
21%
73%0.34%
20252024202320222021202020192018
0.20%
175
371
GDP
GDP
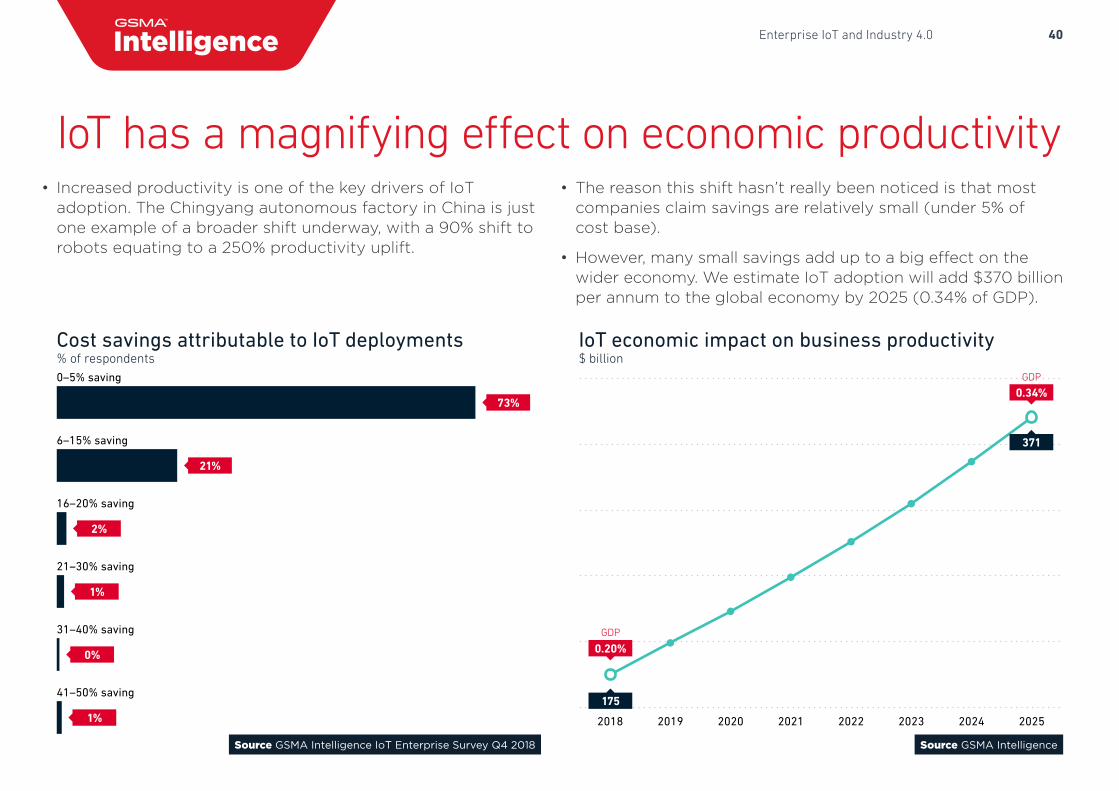
• Increased productivity is one of the key drivers of IoTadoption. The Chingyang autonomous factory in China is justone example of a broader shift underway, with a 90% shift torobots equating to a 250% productivity uplift.
• The reason this shift hasn’t really been noticed is that mostcompanies claim savings are relatively small (under 5% ofcost base).
• However, many small savings add up to a big effect on thewider economy. We estimate IoT adoption will add $370 billionper annum to the global economy by 2025 (0.34% of GDP).
IoT has a magnifying effect on economic productivity
41Enterprise IoT and Industry 4.0
Challenges organisations face in deploying IoT solutionsPercentage of respondents
No challengesUnclear RoIEmployee/internalresistance
A lack ofin-house skills
Cost ofimplementation
Security anddata privacy concerns
Integrating withexisting technology
22%
26%
43%45%46%47%
7%
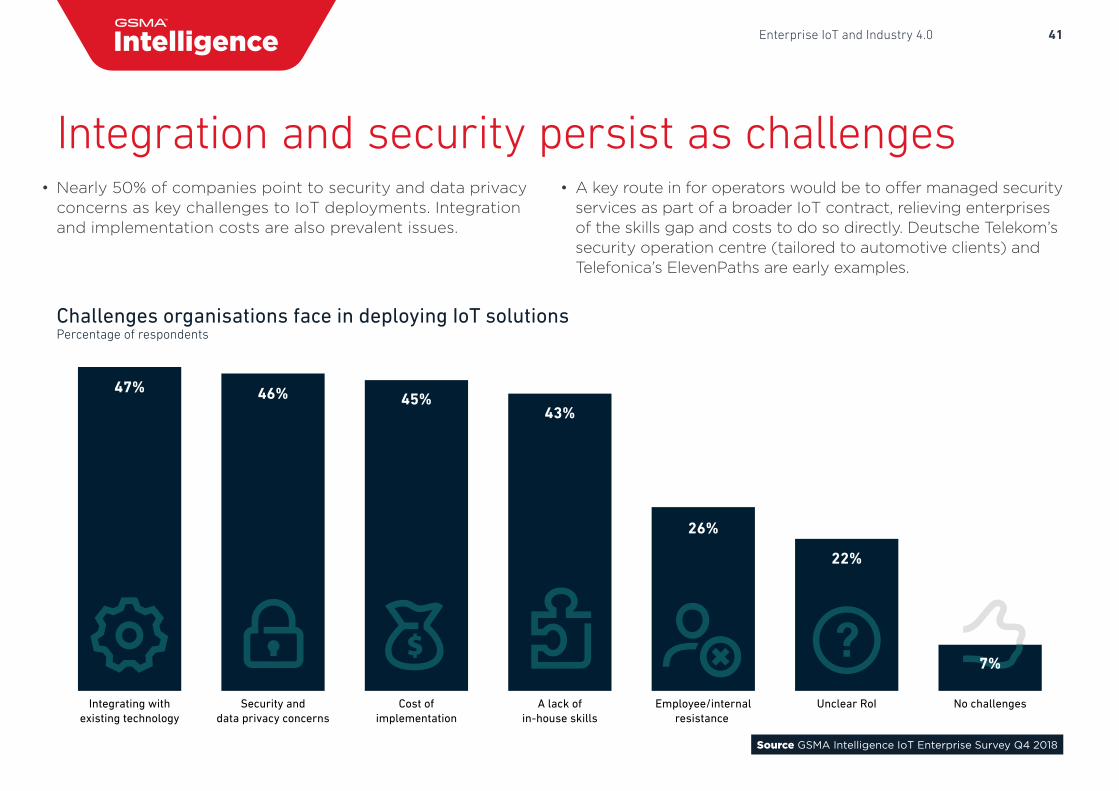
• Nearly 50% of companies point to security and data privacy concerns as key challenges to IoT deployments. Integration and implementation costs are also prevalent issues.
• A key route in for operators would be to offer managed security services as part of a broader IoT contract, relieving enterprises of the skills gap and costs to do so directly. Deutsche Telekom’s security operation centre (tailored to automotive clients) and Telefonica’s ElevenPaths are early examples.
Integration and security persist as challenges
Source GSMA Intelligence IoT Enterprise Survey Q4 2018
42Enterprise IoT and Industry 4.0
In-houseFully outsourceSupplement in-housecapabilities with external
O� the shelffrom one provider
IoT componentsfrom several providers
Custom-made productfrom one provider
32%
29%
18%
15%
4%
2%
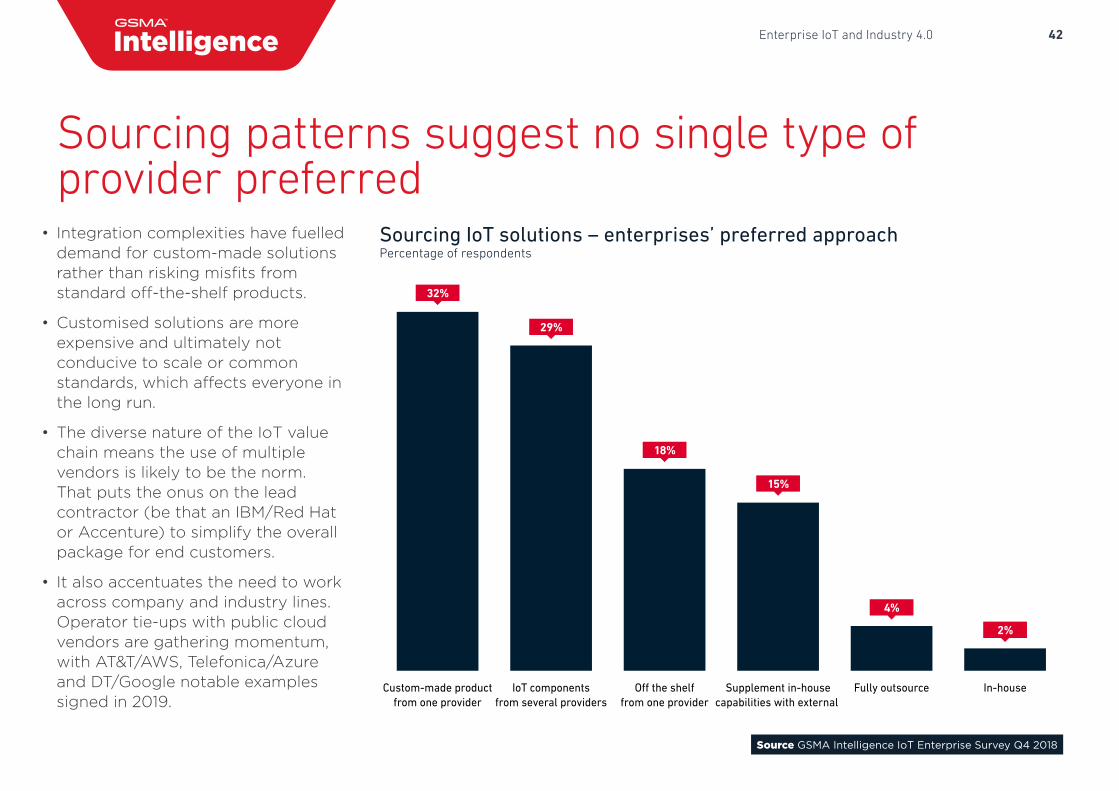
• Integration complexities have fuelleddemand for custom-made solutionsrather than risking misfits fromstandard off-the-shelf products.
• Customised solutions are moreexpensive and ultimately notconducive to scale or commonstandards, which affects everyone inthe long run.
• The diverse nature of the IoT valuechain means the use of multiplevendors is likely to be the norm.That puts the onus on the leadcontractor (be that an IBM/Red Hator Accenture) to simplify the overallpackage for end customers.
• It also accentuates the need to workacross company and industry lines.Operator tie-ups with public cloudvendors are gathering momentum,with AT&T/AWS, Telefonica/Azureand DT/Google notable examplessigned in 2019.
Source GSMA Intelligence IoT Enterprise Survey Q4 2018
Sourcing IoT solutions – enterprises’ preferred approach Percentage of respondents
Sourcing patterns suggest no single type of provider preferred
43Enterprise IoT and Industry 4.0
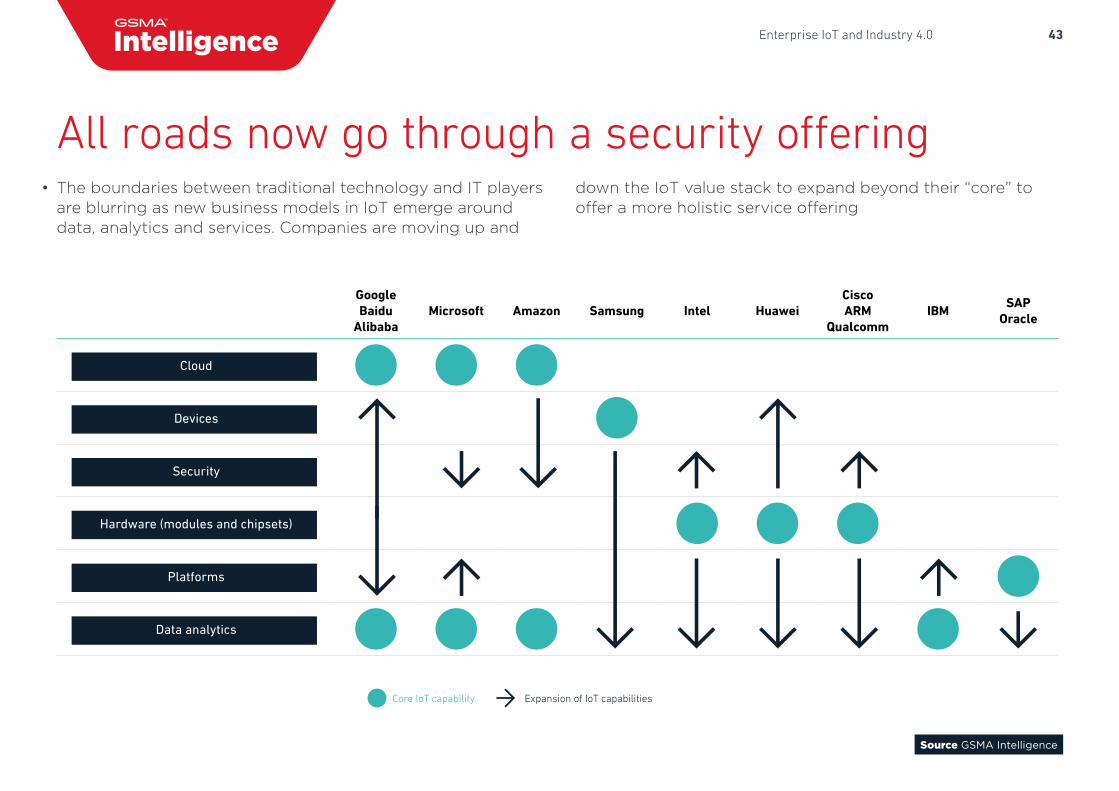
• The boundaries between traditional technology and IT playersare blurring as new business models in IoT emerge arounddata, analytics and services. Companies are moving up and
down the IoT value stack to expand beyond their “core” to offer a more holistic service offering
Source GSMA Intelligence
All roads now go through a security offering
Google Baidu
AlibabaMicrosoft Amazon Samsung Intel Huawei
CiscoARM
QualcommIBM
SAPOracle
Cloud
Devices
Security
Hardware (modules and chipsets)
Platforms
Data analytics
Core IoT capability Expansion of IoT capabilities
44Media and content
Media and content Streaming growth, defending pay TV, the value of local
GLOBAL MOBILE TRENDS
The Big 5
Predictions for the next 10 years
View from the top
Future of devices
Implications of the 5G era
Enterprise IoT and Industry 4.0
Financial performance
Regional outlooks
45Media and content
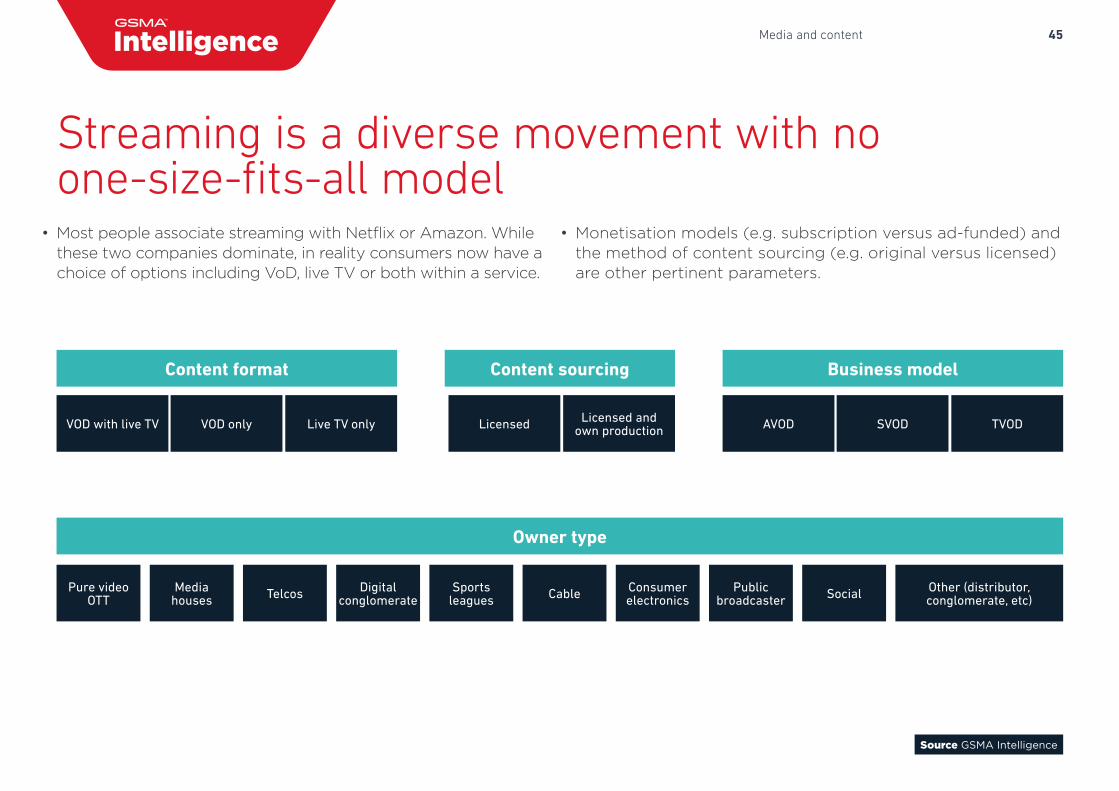
• Most people associate streaming with Netflix or Amazon. Whilethese two companies dominate, in reality consumers now have achoice of options including VoD, live TV or both within a service.
• Monetisation models (e.g. subscription versus ad-funded) andthe method of content sourcing (e.g. original versus licensed)are other pertinent parameters.
Source GSMA Intelligence
Streaming is a diverse movement with no one-size-fits-all model
VOD with live TV
Sports leagues Cable Consumer
electronicsPublic
broadcaster Social Other (distributor, conglomerate, etc)
Pure video OTT
Media houses Telcos Digital
conglomerate
AVODVOD only SVODLicensedLive TV only TVODLicensed and own production
Content format Content sourcing
Owner type
Business model
46Media and content
SVOD AVOD TVOD Free Other
0
5
10
15
20
25
30
35
40
45
OtherCableSports leaguesDigital conglomeratePure video OTTTelcosMedia houses
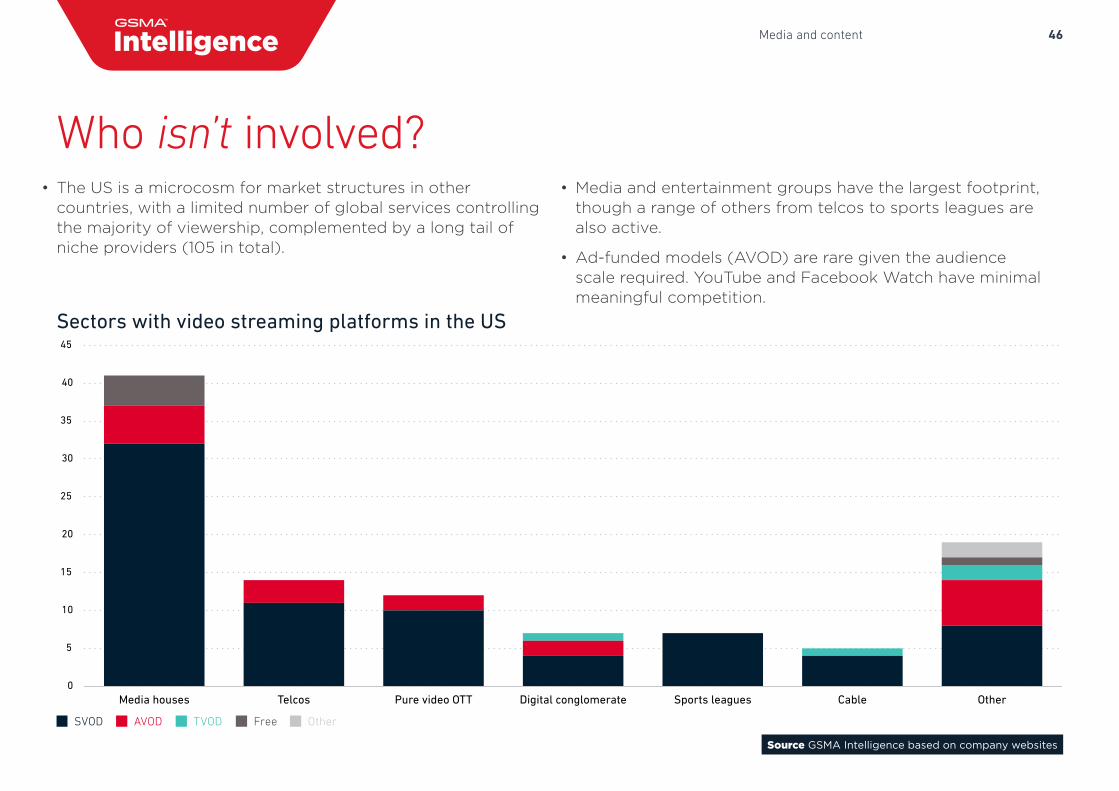
• The US is a microcosm for market structures in othercountries, with a limited number of global services controllingthe majority of viewership, complemented by a long tail ofniche providers (105 in total).
• Media and entertainment groups have the largest footprint,though a range of others from telcos to sports leagues arealso active.
• Ad-funded models (AVOD) are rare given the audiencescale required. YouTube and Facebook Watch have minimalmeaningful competition.
Source GSMA Intelligence based on company websites
Who isn’t involved?
Sectors with video streaming platforms in the US
47Media and content
Source GSMA Intelligence, company websites, Leichtman Research
Cable, streaming bundle and mobile contract prices as % of household income in the US
Streaming Mobile contractCable
0%
2%
4%
6%
8%
10%
12%
14%
16%
18%
20%
>200k150–200k100–150k75–100k50–75k35–50k25–35k15–25k<15k
Annual income ($)
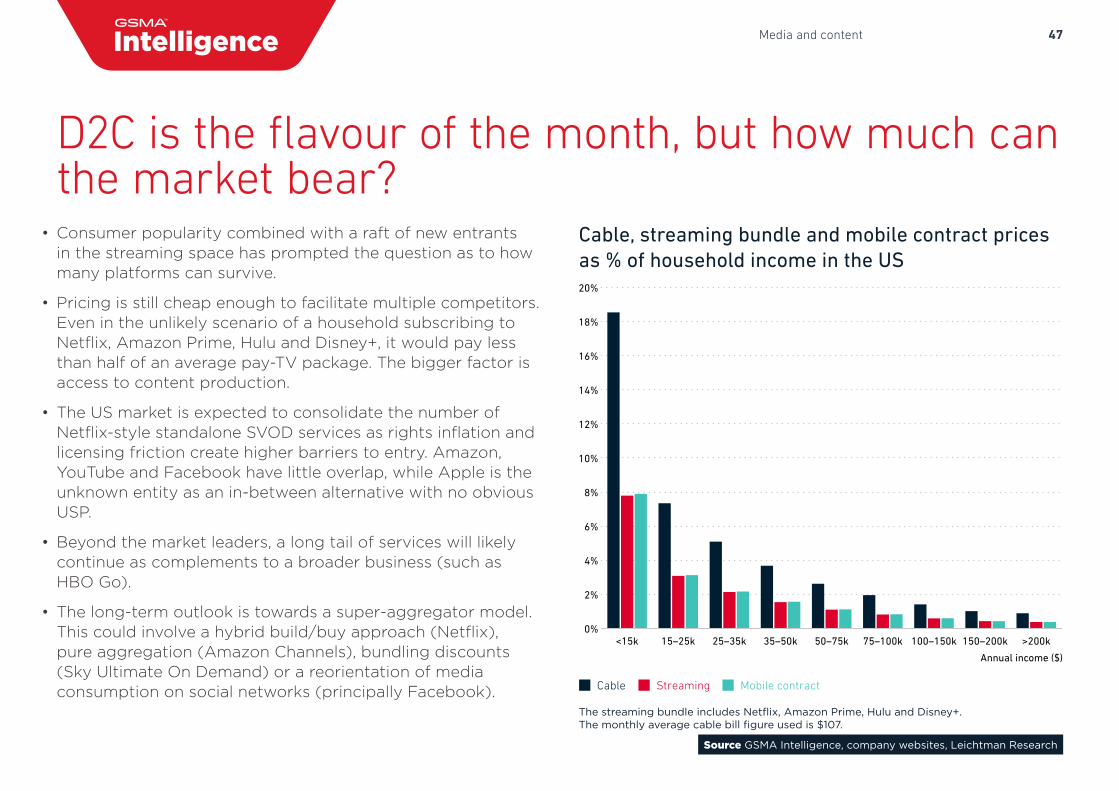
• Consumer popularity combined with a raft of new entrants in the streaming space has prompted the question as to how many platforms can survive.
• Pricing is still cheap enough to facilitate multiple competitors. Even in the unlikely scenario of a household subscribing to Netflix, Amazon Prime, Hulu and Disney+, it would pay less than half of an average pay-TV package. The bigger factor is access to content production.
• The US market is expected to consolidate the number of Netflix-style standalone SVOD services as rights inflation and licensing friction create higher barriers to entry. Amazon, YouTube and Facebook have little overlap, while Apple is the unknown entity as an in-between alternative with no obvious USP.
• Beyond the market leaders, a long tail of services will likely continue as complements to a broader business (such as HBO Go).
• The long-term outlook is towards a super-aggregator model. This could involve a hybrid build/buy approach (Netflix), pure aggregation (Amazon Channels), bundling discounts (Sky Ultimate On Demand) or a reorientation of media consumption on social networks (principally Facebook).
D2C is the flavour of the month, but how much can the market bear?
The streaming bundle includes Netflix, Amazon Prime, Hulu and Disney+. The monthly average cable bill figure used is $107.
48Media and content
Source GSMA Intelligence, Statista, media and business websites
FringeLost Hemlock GroveOrange is the
new black
Deadwood
Once upona time
House of Cards
American Crime Story
The TickBoardwalkEmpire
Frasier
AlteredCarbon
TheDefenders
The AlienistVinylStranger Things Jack Ryan
Star Trek: DiscoverySENSE8The Big Bang
TheoryMarco Polo
RomeFriends American GodsWestworldGame ofThrones
The Get Down
ER The Crown
Lord of the RingsThe Pacific
$3
$5
$7
$9
$11
$13
$15
$17
$19
$21
2000 2002 2004 2006 2008 2010 2012 2014 2016 2018 2020
OTTs (Netflix, Amazon) Networks (ABC, CBS, FOX, FX, HBO, NBC, Starz, TNT)
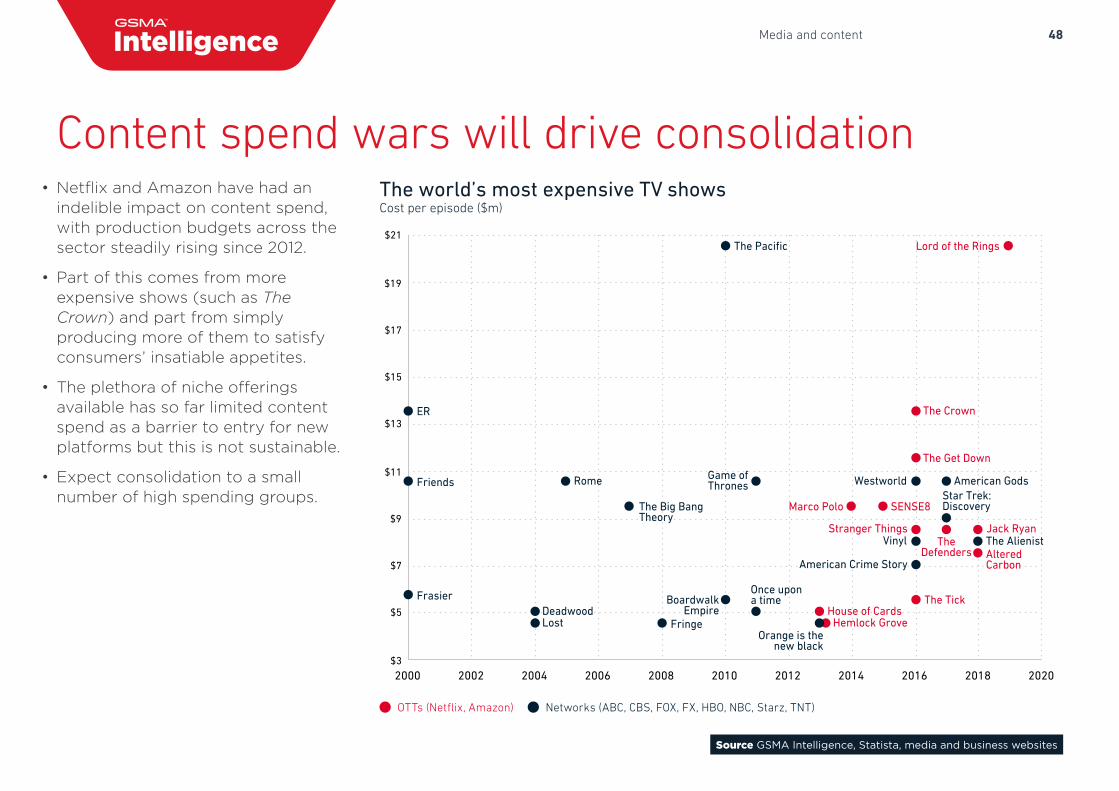
The world’s most expensive TV showsCost per episode ($m)
• Netflix and Amazon have had anindelible impact on content spend,with production budgets across thesector steadily rising since 2012.
• Part of this comes from moreexpensive shows (such as TheCrown) and part from simplyproducing more of them to satisfyconsumers’ insatiable appetites.
• The plethora of niche offeringsavailable has so far limited contentspend as a barrier to entry for newplatforms but this is not sustainable.
• Expect consolidation to a smallnumber of high spending groups.
Content spend wars will drive consolidation
49Media and content
Source GSMA Intelligence
Preferred pay-TV provider: OTT provider Traditional pay-TV provider
+0
+
Spend on video contentThe more a consumer spends on content, the more likely traditional pay-TVproviders will o�er more value-for-money than OTT providers
Num
ber
of s
ervi
ces
subs
crib
ed (f
rom
sin
gle
or m
ulit
ple
prov
ider
s)
The
mor
e se
rvic
es a
con
sum
er s
ubsc
ribe
s to
, the
gre
ater
the
conv
enie
nce
will
be
to d
eal w
ith a
sin
gle
prov
ider
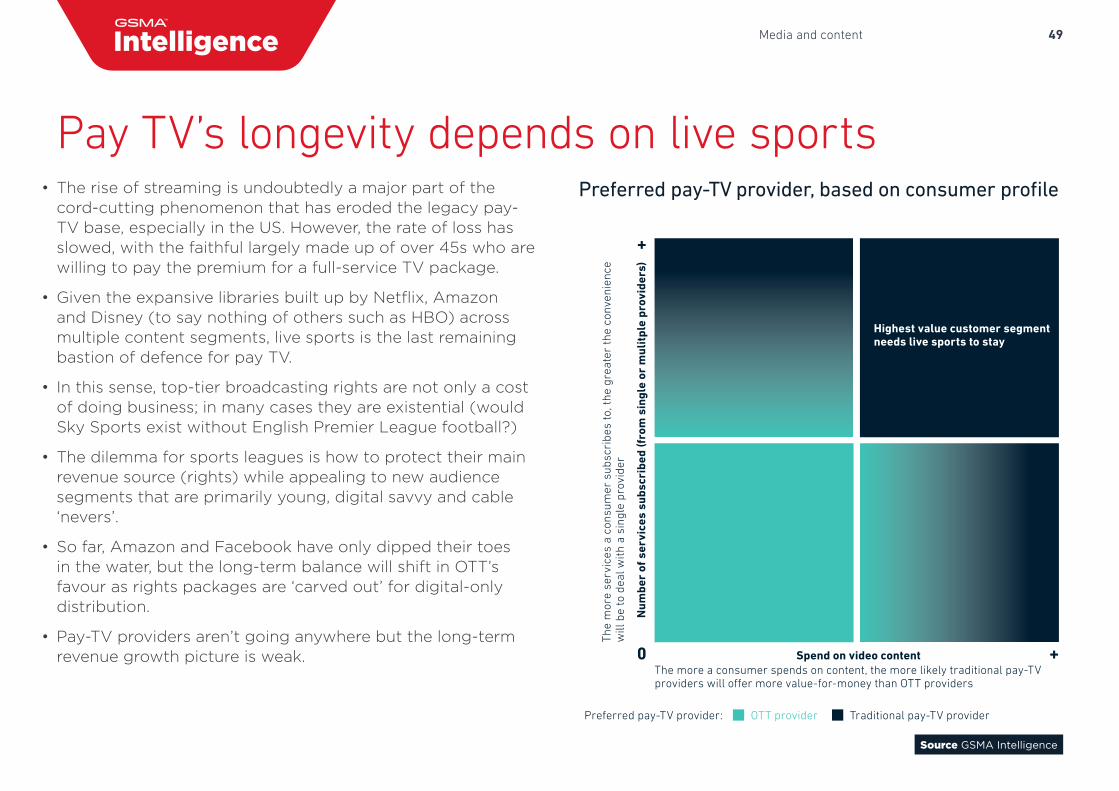
Highest value customer segmentneeds live sports to stay
Preferred pay-TV provider, based on consumer profile• The rise of streaming is undoubtedly a major part of thecord-cutting phenomenon that has eroded the legacy pay-TV base, especially in the US. However, the rate of loss hasslowed, with the faithful largely made up of over 45s who arewilling to pay the premium for a full-service TV package.
• Given the expansive libraries built up by Netflix, Amazonand Disney (to say nothing of others such as HBO) acrossmultiple content segments, live sports is the last remainingbastion of defence for pay TV.
• In this sense, top-tier broadcasting rights are not only a costof doing business; in many cases they are existential (wouldSky Sports exist without English Premier League football?)
• The dilemma for sports leagues is how to protect their mainrevenue source (rights) while appealing to new audiencesegments that are primarily young, digital savvy and cable‘nevers’.
• So far, Amazon and Facebook have only dipped their toesin the water, but the long-term balance will shift in OTT’sfavour as rights packages are ‘carved out’ for digital-onlydistribution.
• Pay-TV providers aren’t going anywhere but the long-termrevenue growth picture is weak.
Pay TV’s longevity depends on live sports
50Media and content
Belgium Netherlands Portugal Spain Switzerland
0%
10%
20%
30%
40%
50%
2018201720162015201420132012
42%
15%
8%
2%1%
26%
6%
20%
30%
30%
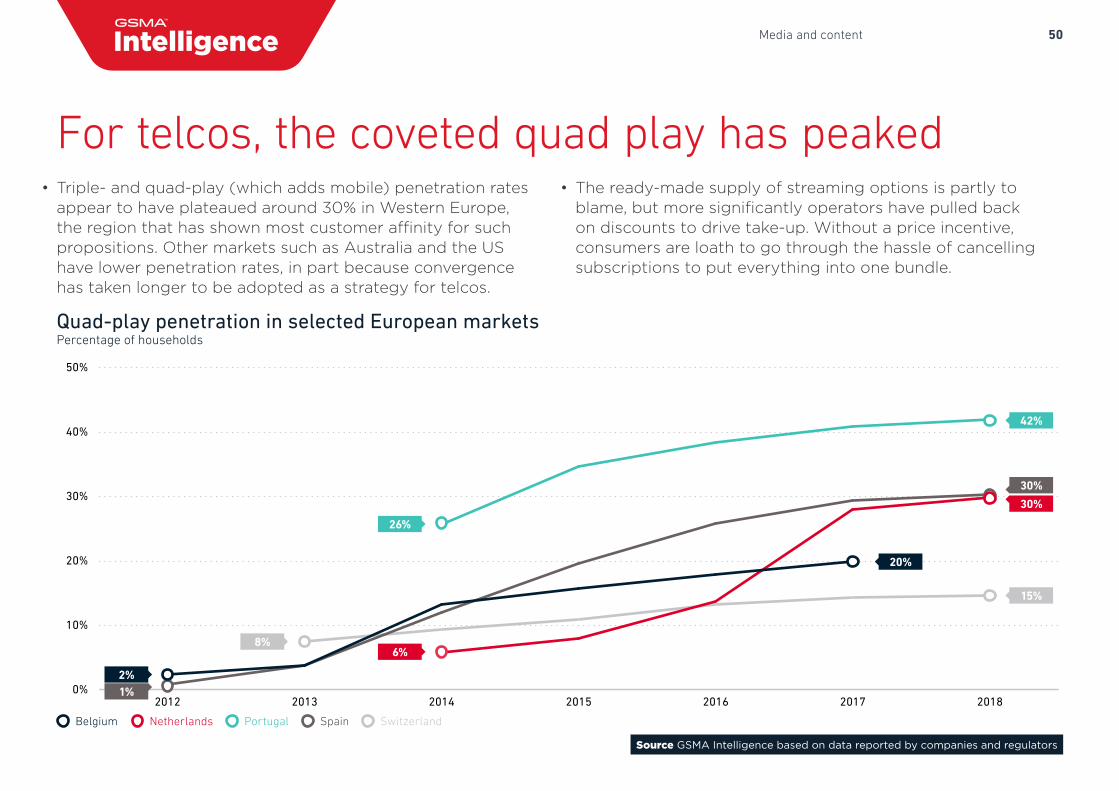
• Triple- and quad-play (which adds mobile) penetration rates appear to have plateaued around 30% in Western Europe, the region that has shown most customer affinity for such propositions. Other markets such as Australia and the US have lower penetration rates, in part because convergence has taken longer to be adopted as a strategy for telcos.
• The ready-made supply of streaming options is partly to blame, but more significantly operators have pulled back on discounts to drive take-up. Without a price incentive, consumers are loath to go through the hassle of cancelling subscriptions to put everything into one bundle.
Source GSMA Intelligence based on data reported by companies and regulators
For telcos, the coveted quad play has peaked
Quad-play penetration in selected European marketsPercentage of households
51Media and content
35%
25%
21%19%
GermanyUKAustraliaUS USUKGermanyAustralia
Netflix Amazon Prime YouTube Premium Hulu
0%
10%
20%
30%
40%
50%
60%
70%
80%
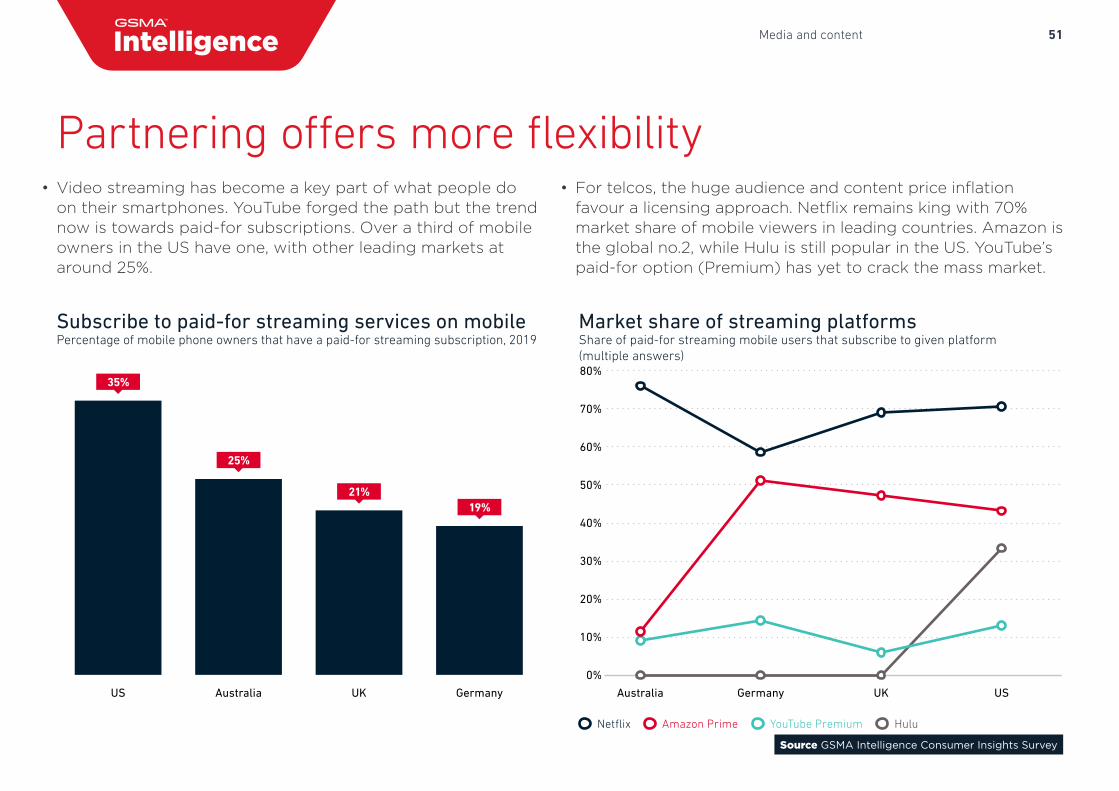
• Video streaming has become a key part of what people do on their smartphones. YouTube forged the path but the trend now is towards paid-for subscriptions. Over a third of mobile owners in the US have one, with other leading markets at around 25%.
• For telcos, the huge audience and content price inflation favour a licensing approach. Netflix remains king with 70% market share of mobile viewers in leading countries. Amazon is the global no.2, while Hulu is still popular in the US. YouTube’s paid-for option (Premium) has yet to crack the mass market.
Source GSMA Intelligence Consumer Insights Survey
Partnering offers more flexibility
Subscribe to paid-for streaming services on mobilePercentage of mobile phone owners that have a paid-for streaming subscription, 2019
Market share of streaming platforms Share of paid-for streaming mobile users that subscribe to given platform (multiple answers)
52Media and content
Base Growth doubles Growth halves
0
5
10
15
20
25
30
20242023202220212020201920182017201620152014201320122011
16
27
10
Base Growth doubles Growth halves
0
50
100
150
200
250
20242023202220212020201920182017201620152014201320122011
136
212
98
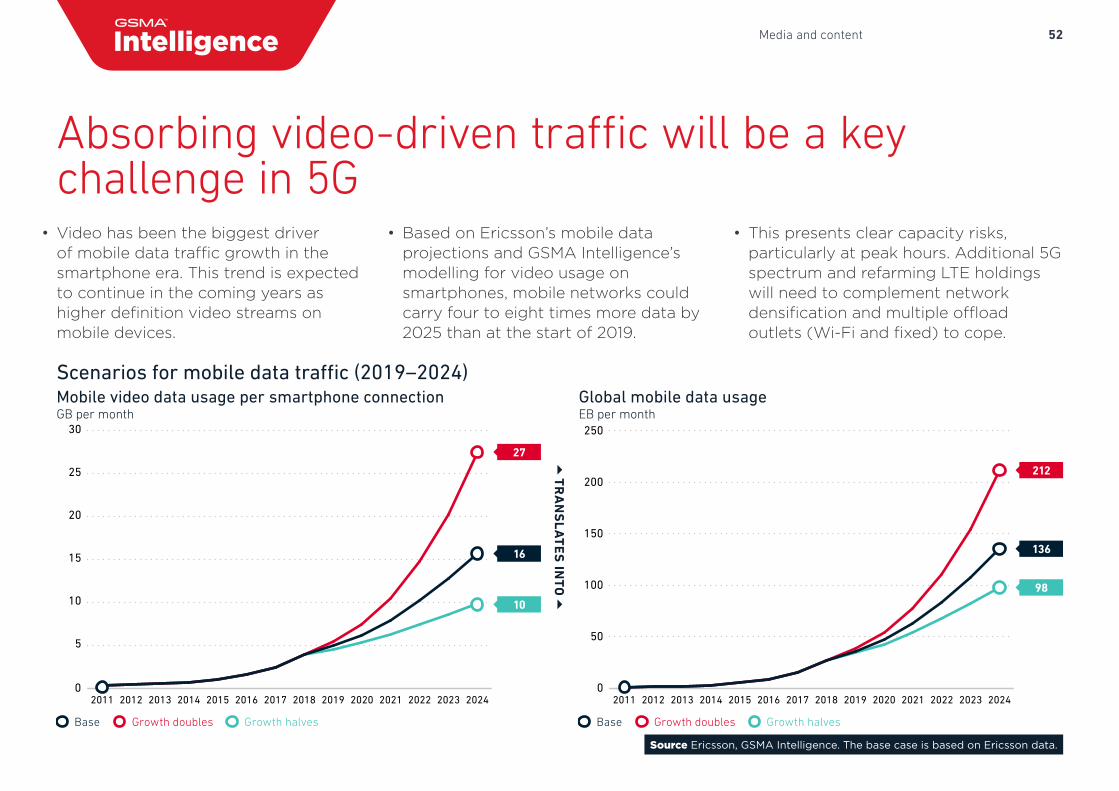
• Video has been the biggest driver of mobile data traffic growth in thesmartphone era. This trend is expectedto continue in the coming years ashigher definition video streams onmobile devices.
• Based on Ericsson’s mobile dataprojections and GSMA Intelligence’s modelling for video usage on smartphones, mobile networks could carry four to eight times more data by 2025 than at the start of 2019.
• This presents clear capacity risks,particularly at peak hours. Additional 5Gspectrum and refarming LTE holdingswill need to complement networkdensification and multiple offloadoutlets (Wi-Fi and fixed) to cope.
Source Ericsson, GSMA Intelligence. The base case is based on Ericsson data.
Absorbing video-driven traffic will be a key challenge in 5G
Mobile video data usage per smartphone connection GB per month
Global mobile data usage EB per month
Scenarios for mobile data traffic (2019–2024)
TR
AN
SL
AT
ES
INTO
53Media and content
Source GSMA Intelligence, World Bank. Household income is based on World Bank GNI per capita with two earning people assumed in a household
Source Netflix, IMDB
The increasing power of ‘local’ in non-English-speaking countries
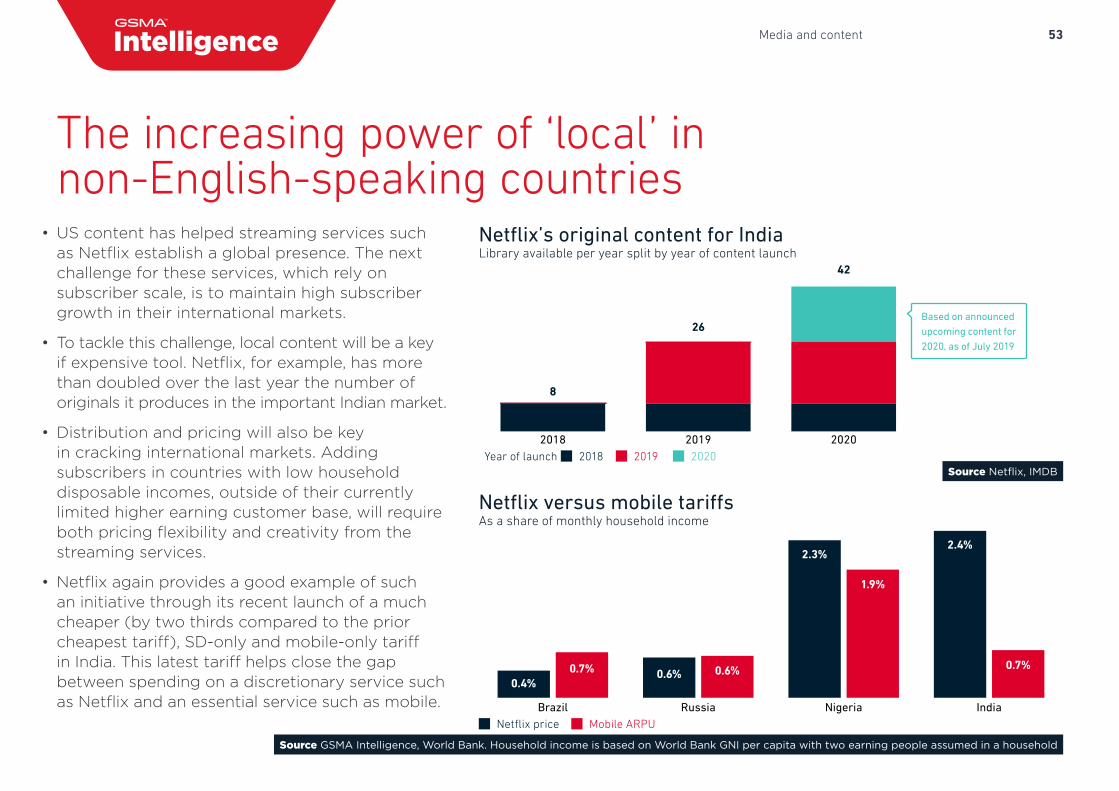
• US content has helped streaming services such as Netflix establish a global presence. The next challenge for these services, which rely on subscriber scale, is to maintain high subscriber growth in their international markets.
• To tackle this challenge, local content will be a key if expensive tool. Netflix, for example, has more than doubled over the last year the number of originals it produces in the important Indian market.
• Distribution and pricing will also be key in cracking international markets. Adding subscribers in countries with low household disposable incomes, outside of their currently limited higher earning customer base, will require both pricing flexibility and creativity from the streaming services.
• Netflix again provides a good example of such an initiative through its recent launch of a much cheaper (by two thirds compared to the prior cheapest tariff), SD-only and mobile-only tariff in India. This latest tariff helps close the gap between spending on a discretionary service such as Netflix and an essential service such as mobile.
2019 20202018Year of launch 202020192018
42
26
8
Based on announcedupcoming content for2020, as of July 2019
IndiaNigeriaRussiaBrazilMobile ARPUNetflix price
2.4%2.3%
0.6%0.4%
0.7%
1.9%
0.6%0.7%
Netflix’s original content for IndiaLibrary available per year split by year of content launch
Netflix versus mobile tariffsAs a share of monthly household income
54Media and content
Source GSMA Intelligence
Consumers
Content producers
Enhanced production
Streaminggaming platforms
Remote production Streaming
Interactive viewing
Mobile multi-player gaming
Improved service in crowded venues
Aggregators/Distributors
AR/MR
Enterprise
Sho
rt1–
2 ye
ars
Incr
easi
ng 5
G c
over
age
Med
ium
2–5
year
sLo
ng >5ye
ars
5G’s impact on the media value chainNote: coverage timeline is indicative and will vary by country
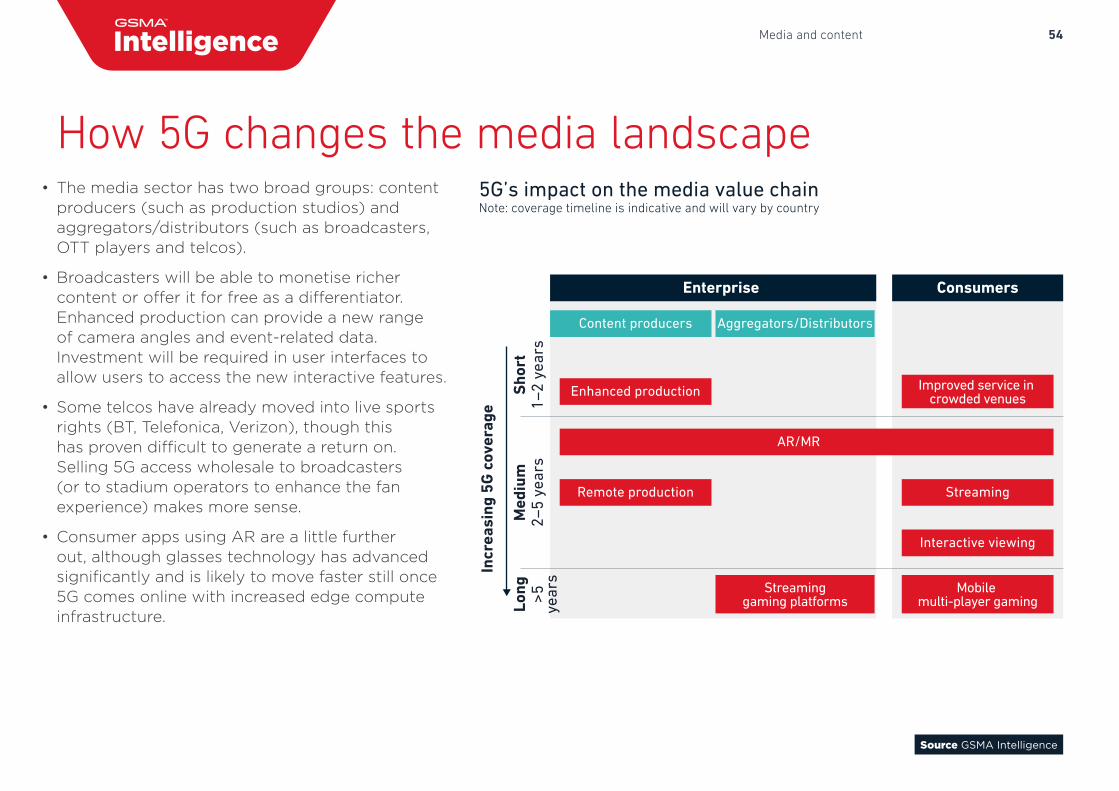
• The media sector has two broad groups: contentproducers (such as production studios) andaggregators/distributors (such as broadcasters,OTT players and telcos).
• Broadcasters will be able to monetise richercontent or offer it for free as a differentiator.Enhanced production can provide a new rangeof camera angles and event-related data.Investment will be required in user interfaces toallow users to access the new interactive features.
• Some telcos have already moved into live sportsrights (BT, Telefonica, Verizon), though thishas proven difficult to generate a return on.Selling 5G access wholesale to broadcasters(or to stadium operators to enhance the fanexperience) makes more sense.
• Consumer apps using AR are a little furtherout, although glasses technology has advancedsignificantly and is likely to move faster still once5G comes online with increased edge computeinfrastructure.
How 5G changes the media landscape

55Financial performance
Financial performance Telco growth prospects and investment projections
GLOBAL MOBILE TRENDS
The Big 5
Predictions for the next 10 years
View from the top
Future of devices
Implications of the 5G era
Enterprise IoT and Industry 4.0
Media and content
Regional outlooks
56Financial performance
Source GSMA Intelligence
Annual growth (yoy)Mobile revenue ($bn)
900
950
1000
1050
1100
1150
1200
20252024202320222021202020192018201720160.005
0.010
0.015
0.020
0.025
1,152
1,140
1,126
1,1111,099
1,0851,062
1,0591,065
1,0081.1%
1.2%1.2%1.2%
1.4%
2.1%
2.3%
1.4%
1.6%
0.7%
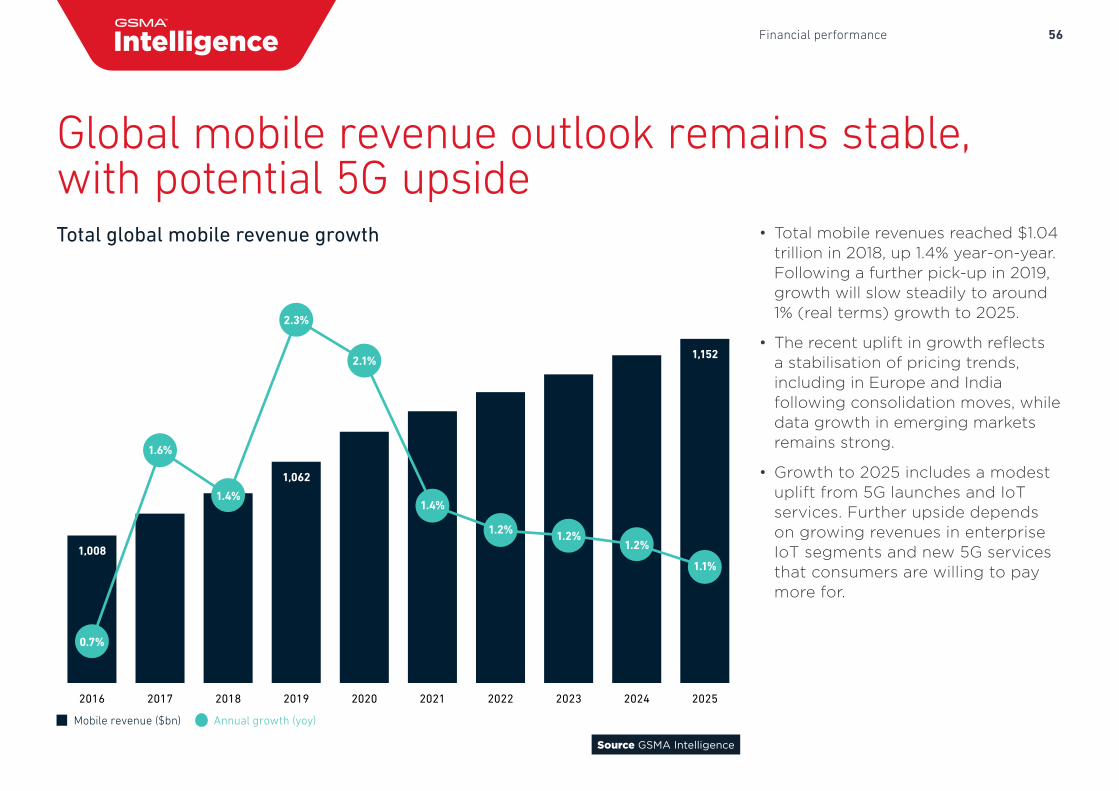
Total global mobile revenue growth • Total mobile revenues reached $1.04 trillion in 2018, up 1.4% year-on-year. Following a further pick-up in 2019, growth will slow steadily to around 1% (real terms) growth to 2025.
• The recent uplift in growth reflects a stabilisation of pricing trends, including in Europe and India following consolidation moves, while data growth in emerging markets remains strong.
• Growth to 2025 includes a modest uplift from 5G launches and IoT services. Further upside depends on growing revenues in enterprise IoT segments and new 5G services that consumers are willing to pay more for.
Global mobile revenue outlook remains stable, with potential 5G upside
57Financial performance
Source GSMA Intelligence
Europe India
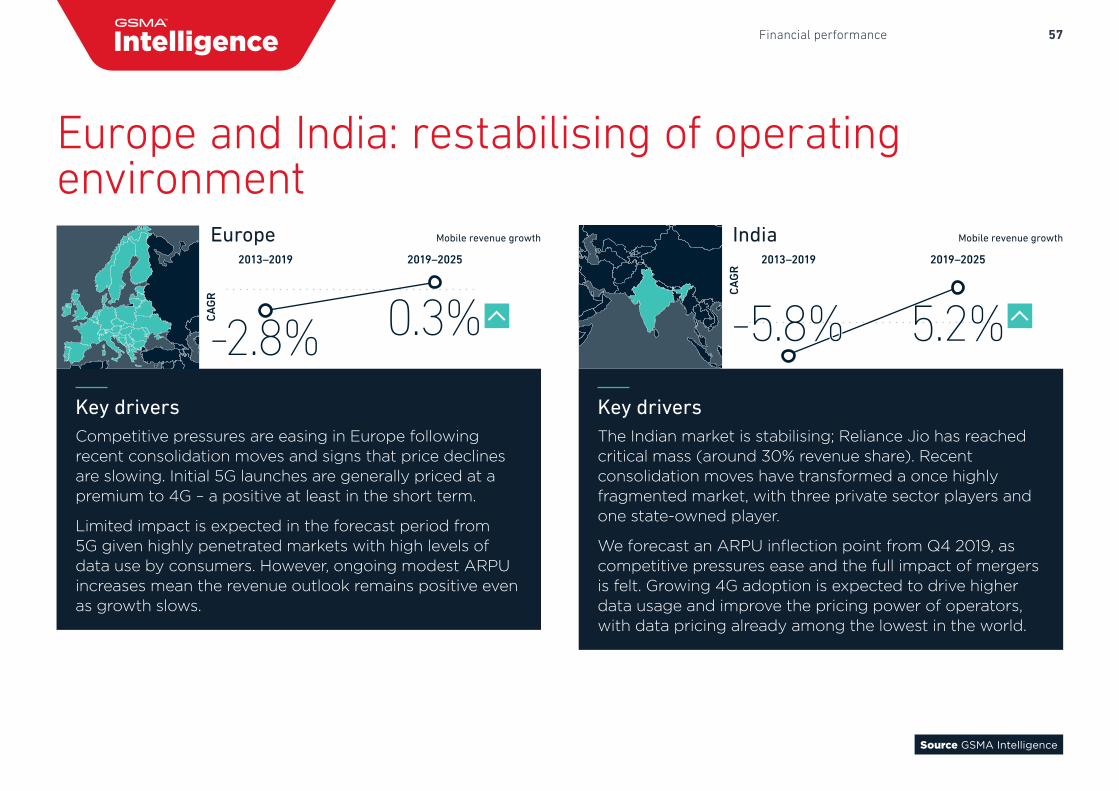
Europe and India: restabilising of operating environment
Key driversThe Indian market is stabilising; Reliance Jio has reached critical mass (around 30% revenue share). Recent consolidation moves have transformed a once highly fragmented market, with three private sector players and one state-owned player.
We forecast an ARPU inflection point from Q4 2019, as competitive pressures ease and the full impact of mergers is felt. Growing 4G adoption is expected to drive higher data usage and improve the pricing power of operators, with data pricing already among the lowest in the world.
Key driversCompetitive pressures are easing in Europe following recent consolidation moves and signs that price declines are slowing. Initial 5G launches are generally priced at a premium to 4G – a positive at least in the short term.
Limited impact is expected in the forecast period from 5G given highly penetrated markets with high levels of data use by consumers. However, ongoing modest ARPU increases mean the revenue outlook remains positive even as growth slows.
CAGR
2013–2019 2019–2025
-2.8% 0.3%
CAGR
2013–2019 2019–2025
5.2%-5.8%
India Mobile revenue growthEurope Mobile revenue growth
58Financial performance
Source GSMA Intelligence
Europe India
US and China: oiling the machines
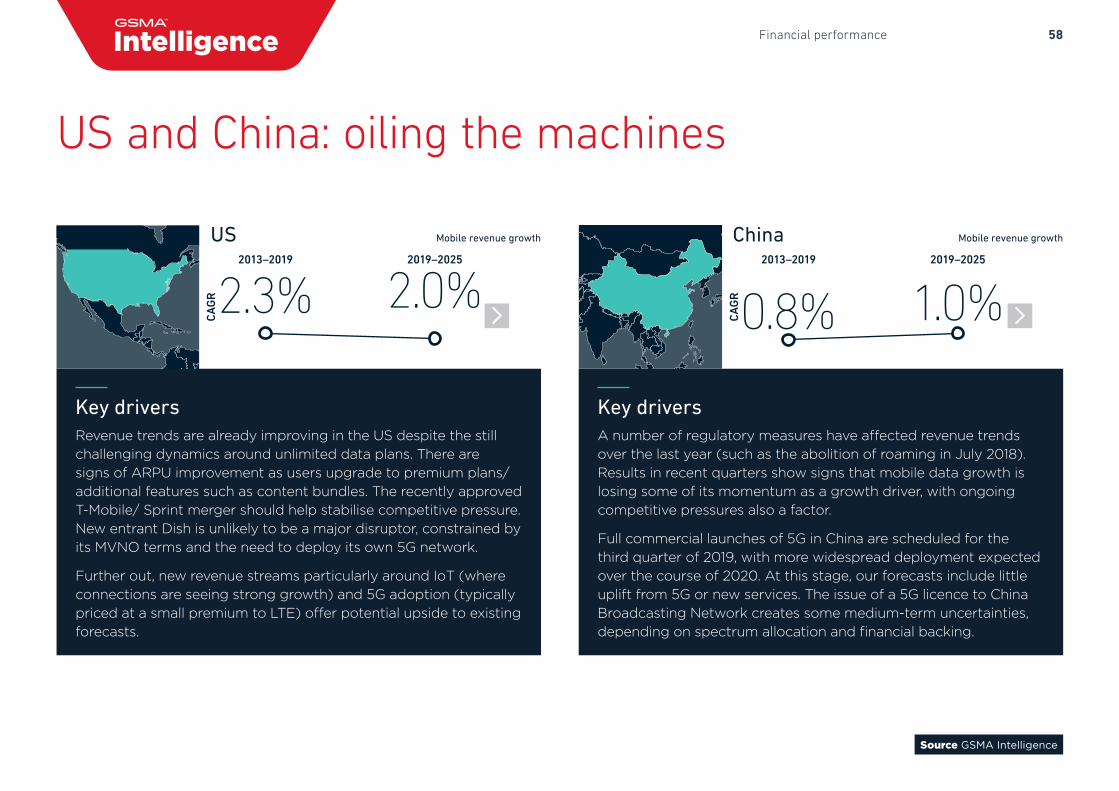
Key driversA number of regulatory measures have affected revenue trends over the last year (such as the abolition of roaming in July 2018). Results in recent quarters show signs that mobile data growth is losing some of its momentum as a growth driver, with ongoing competitive pressures also a factor.
Full commercial launches of 5G in China are scheduled for the third quarter of 2019, with more widespread deployment expected over the course of 2020. At this stage, our forecasts include little uplift from 5G or new services. The issue of a 5G licence to China Broadcasting Network creates some medium-term uncertainties, depending on spectrum allocation and financial backing.
Key driversRevenue trends are already improving in the US despite the still challenging dynamics around unlimited data plans. There are signs of ARPU improvement as users upgrade to premium plans/additional features such as content bundles. The recently approved T-Mobile/ Sprint merger should help stabilise competitive pressure. New entrant Dish is unlikely to be a major disruptor, constrained by its MVNO terms and the need to deploy its own 5G network.
Further out, new revenue streams particularly around IoT (where connections are seeing strong growth) and 5G adoption (typically priced at a small premium to LTE) offer potential upside to existing forecasts.
CAGR
2013–2019 2019–2025
2.3% 2.0%
CAGR
2013–2019 2019–2025
0.8% 1.0%
China Mobile revenue growthUS Mobile revenue growth
59Financial performance
Source GSMA Intelligence
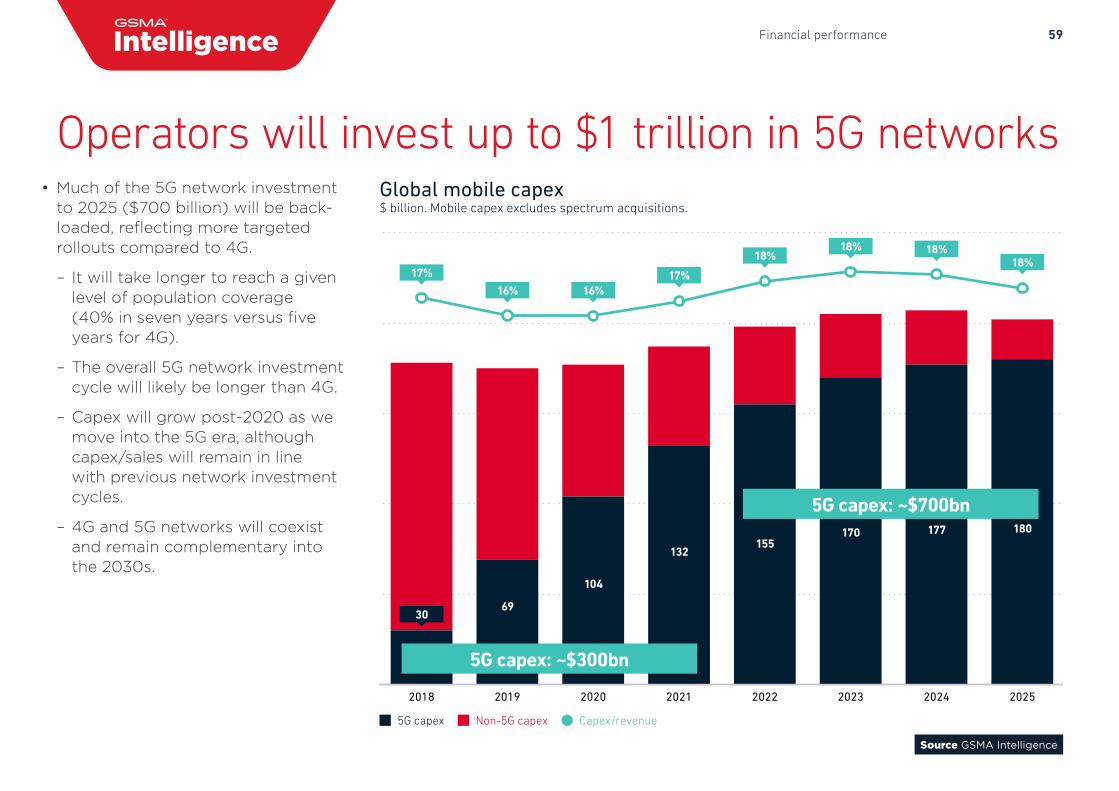
• Much of the 5G network investment to 2025 ($700 billion) will be back-loaded, reflecting more targeted rollouts compared to 4G.
– It will take longer to reach a given level of population coverage (40% in seven years versus five years for 4G).
– The overall 5G network investment cycle will likely be longer than 4G.
– Capex will grow post-2020 as we move into the 5G era, although capex/sales will remain in line with previous network investment cycles.
– 4G and 5G networks will coexist and remain complementary into the 2030s.
5G capex: ~$700bn
5G capex: ~$300bn
Non-5G capex Capex/revenue5G capex
20252024202320222021202020192018
17%
30
16%17%
18%18% 18%
18%
22
180
30
177
35
170
43
155
55
132
73
104
106
148
69
16%
Global mobile capex$ billion. Mobile capex excludes spectrum acquisitions.
Operators will invest up to $1 trillion in 5G networks
60Financial performance
Source GSMA Intelligence
Non-5G capex 5G capex
CIS
SSA
MENA
Latin America
Europe
North America
Asia Pacific
370
305
201
60
41
11
28
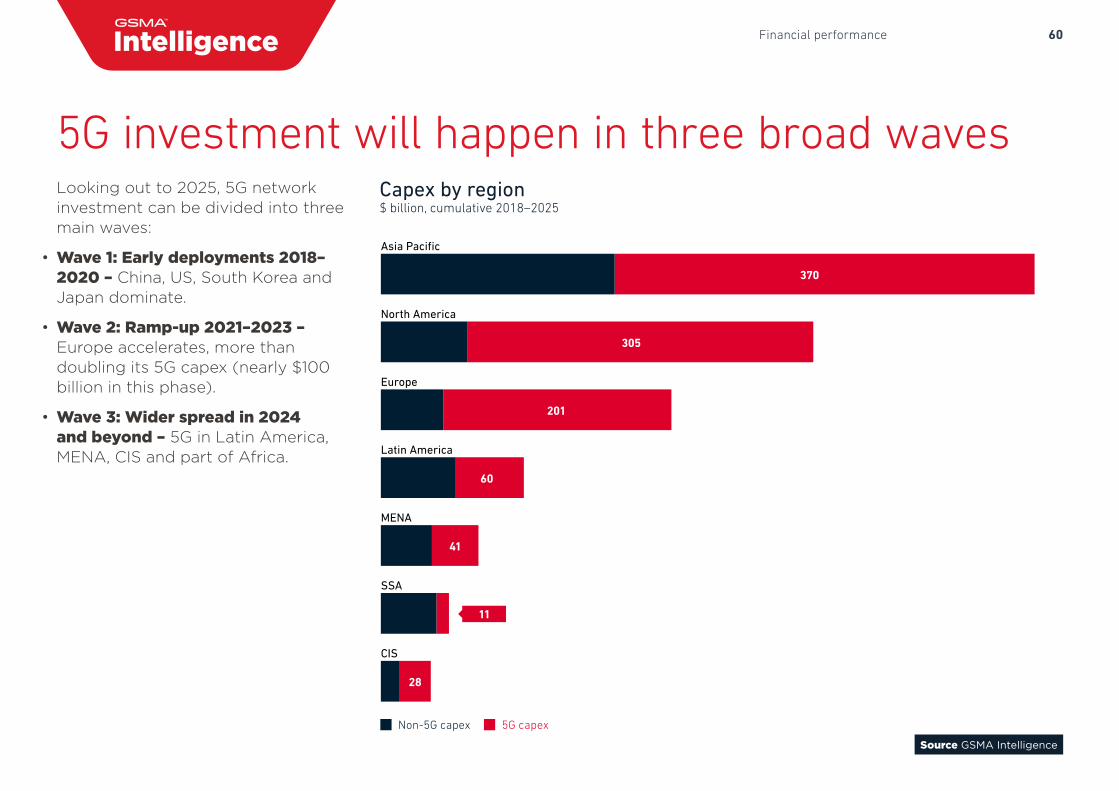
5G investment will happen in three broad wavesCapex by region$ billion, cumulative 2018–2025
Looking out to 2025, 5G network investment can be divided into three main waves:
• Wave 1: Early deployments 2018–2020 – China, US, South Korea and Japan dominate.
• Wave 2: Ramp-up 2021–2023 – Europe accelerates, more than doubling its 5G capex (nearly $100 billion in this phase).
• Wave 3: Wider spread in 2024 and beyond – 5G in Latin America, MENA, CIS and part of Africa.
61Financial performance
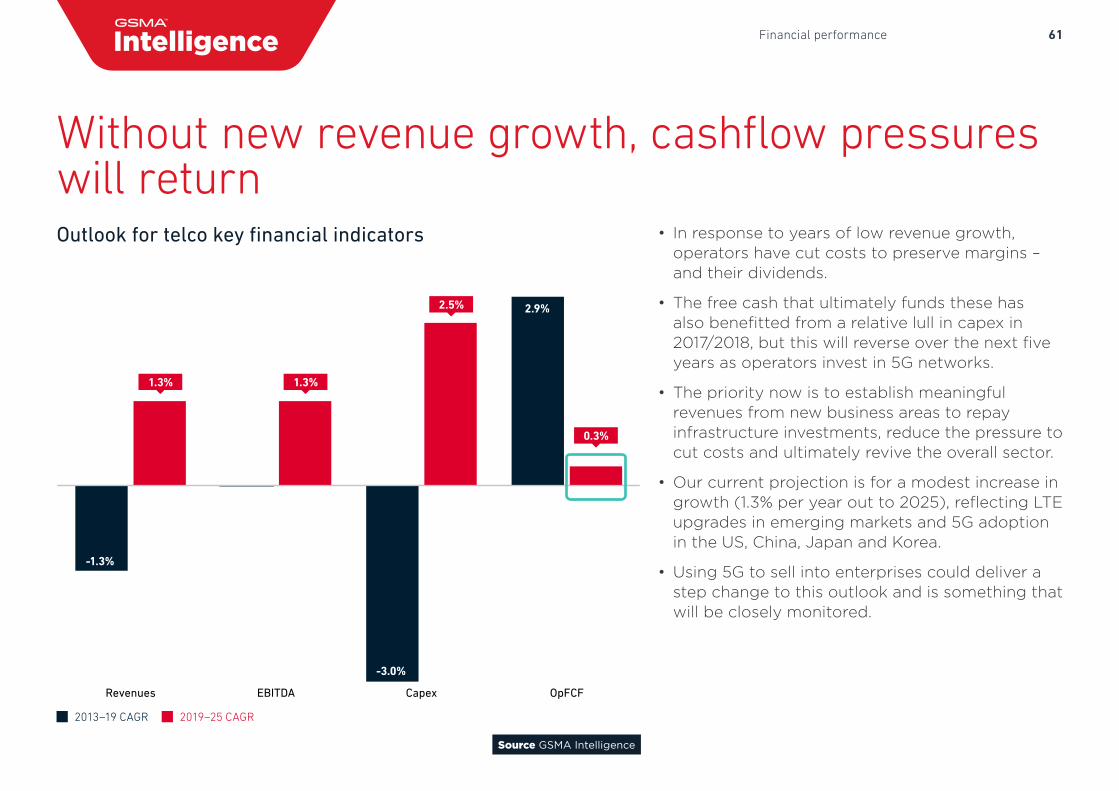
• In response to years of low revenue growth,operators have cut costs to preserve margins –and their dividends.
• The free cash that ultimately funds these hasalso benefitted from a relative lull in capex in2017/2018, but this will reverse over the next fiveyears as operators invest in 5G networks.
• The priority now is to establish meaningfulrevenues from new business areas to repayinfrastructure investments, reduce the pressure tocut costs and ultimately revive the overall sector.
• Our current projection is for a modest increase ingrowth (1.3% per year out to 2025), reflecting LTEupgrades in emerging markets and 5G adoptionin the US, China, Japan and Korea.
• Using 5G to sell into enterprises could deliver astep change to this outlook and is something thatwill be closely monitored.
2013–19 CAGR 2019–25 CAGR
OpFCFCapexEBITDARevenues
1.3%
-1.3%
-3.0%
2.9%
1.3%
2.5%
0.3%
Outlook for telco key financial indicators
Source GSMA Intelligence
Without new revenue growth, cashflow pressures will return
62Financial performance
Source Company figures at group level and GSMA Intelligence reclassifications and estimates.
-10% 0% 10% 20% 30% 40%
40%
35%
30%
25%
20%
15%
10%
5%
Rev
enue
bey
ond
core
tele
com
s (a
s %
of r
even
ue)
Revenue beyond core telecoms (YoY growth)
AT&T
TELSTRA
AMÉRICA MÓVIL
TELENOR
SINGTEL
VERIZON
TURKCELL
KT SOFTBANK
NTT DOCOMO
KDDI
SK TELECOM
TELEFÓNICA
CHINA MOBILECHINA UNICOM
CHINA TELECOM
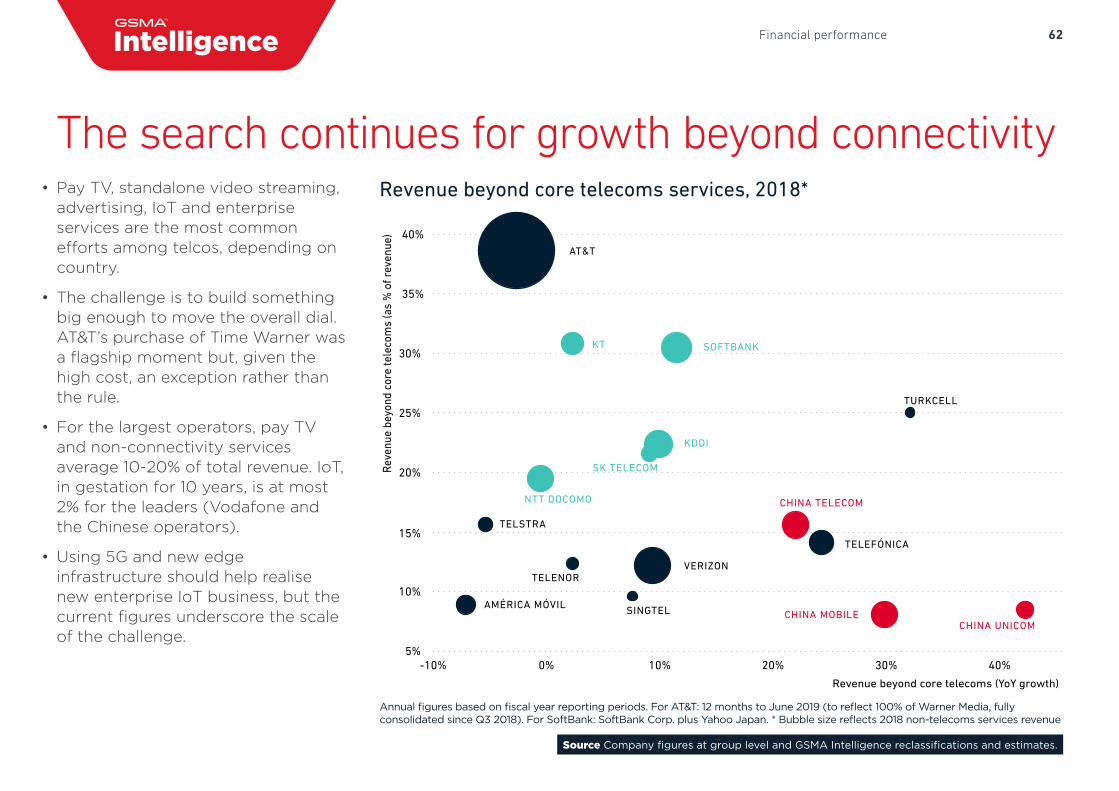
Revenue beyond core telecoms services, 2018*• Pay TV, standalone video streaming,advertising, IoT and enterpriseservices are the most commonefforts among telcos, depending oncountry.
• The challenge is to build somethingbig enough to move the overall dial.AT&T’s purchase of Time Warner wasa flagship moment but, given thehigh cost, an exception rather thanthe rule.
• For the largest operators, pay TVand non-connectivity servicesaverage 10-20% of total revenue. IoT,in gestation for 10 years, is at most2% for the leaders (Vodafone andthe Chinese operators).
• Using 5G and new edgeinfrastructure should help realisenew enterprise IoT business, but thecurrent figures underscore the scaleof the challenge.
The search continues for growth beyond connectivity
Annual figures based on fiscal year reporting periods. For AT&T: 12 months to June 2019 (to reflect 100% of Warner Media, fully consolidated since Q3 2018). For SoftBank: SoftBank Corp. plus Yahoo Japan. * Bubble size reflects 2018 non-telecoms services revenue
63Regional outlook: Europe
EuropeAt a crossroads
Smartphones
2018
489 million
73%
2025
570 million
83%
Connections
Adoption rate
Unique subscribers
2018
468 million
86%
2025
482 million
88%
Total
Penetration rate
Connections by technology
2018
16%
34%
50%
—
2025
1%
7%
61%
31%
2G
3G
4G
5G
Operator total revenues
2018
$169 billion
2025
$173 billion
0.3%CAGR
Capex
2018
$28 billion
2025
$34 billion
2.8%CAGR
GLOBAL MOBILE TRENDSREGIONAL OUTLOOK
US and Canada
China
India
Sub-Saharan Africa
Middle East and North Africa
Latin America
64Regional outlook: Europe
Source GSMA Intelligence
Commercial 5G launches in Europeto July 2019
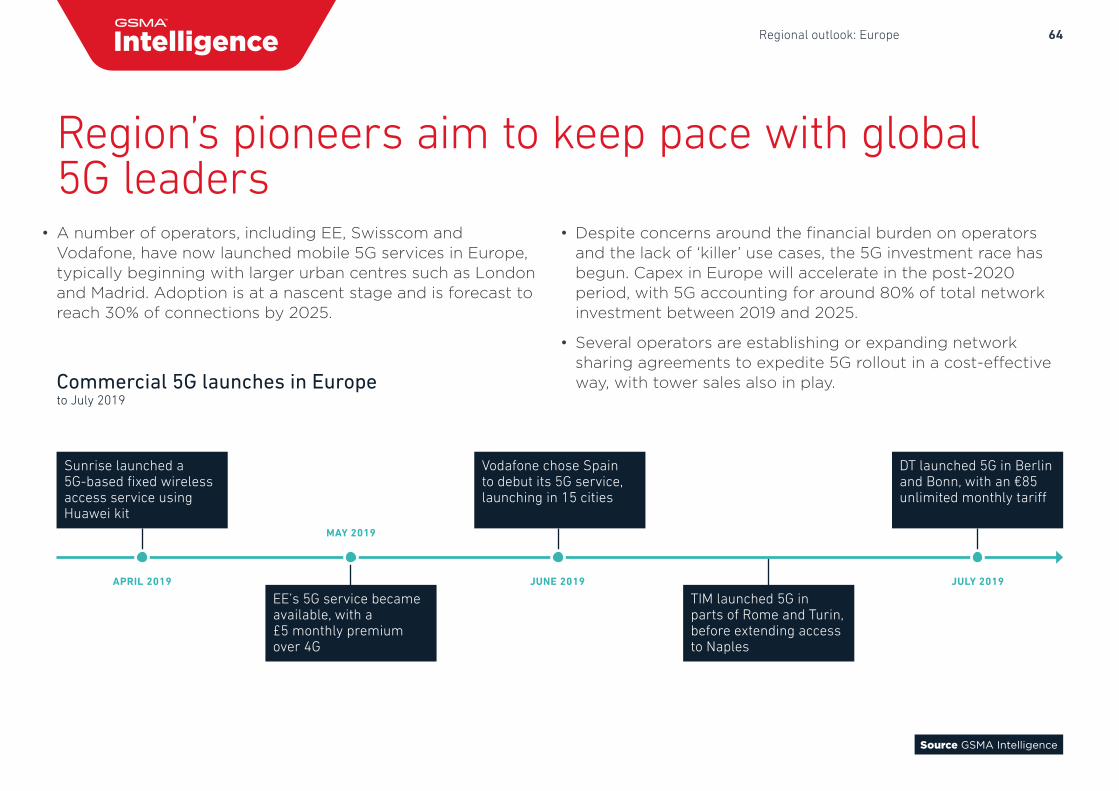
• A number of operators, including EE, Swisscom andVodafone, have now launched mobile 5G services in Europe,typically beginning with larger urban centres such as Londonand Madrid. Adoption is at a nascent stage and is forecast toreach 30% of connections by 2025.
• Despite concerns around the financial burden on operatorsand the lack of ‘killer’ use cases, the 5G investment race hasbegun. Capex in Europe will accelerate in the post-2020period, with 5G accounting for around 80% of total networkinvestment between 2019 and 2025.
• Several operators are establishing or expanding networksharing agreements to expedite 5G rollout in a cost-effectiveway, with tower sales also in play.
Region’s pioneers aim to keep pace with global 5G leaders
Sunrise launched a 5G-based fixed wireless access service using Huawei kit
Vodafone chose Spain to debut its 5G service, launching in 15 cities
EE’s 5G service became available, with a £5 monthly premium over 4G
TIM launched 5G in parts of Rome and Turin, before extending access to Naples
DT launched 5G in Berlin and Bonn, with an €85 unlimited monthly tariff
APRIL 2019
MAY 2019
JUNE 2019 JULY 2019
65Regional outlook: Europe
Source GSMA Intelligence
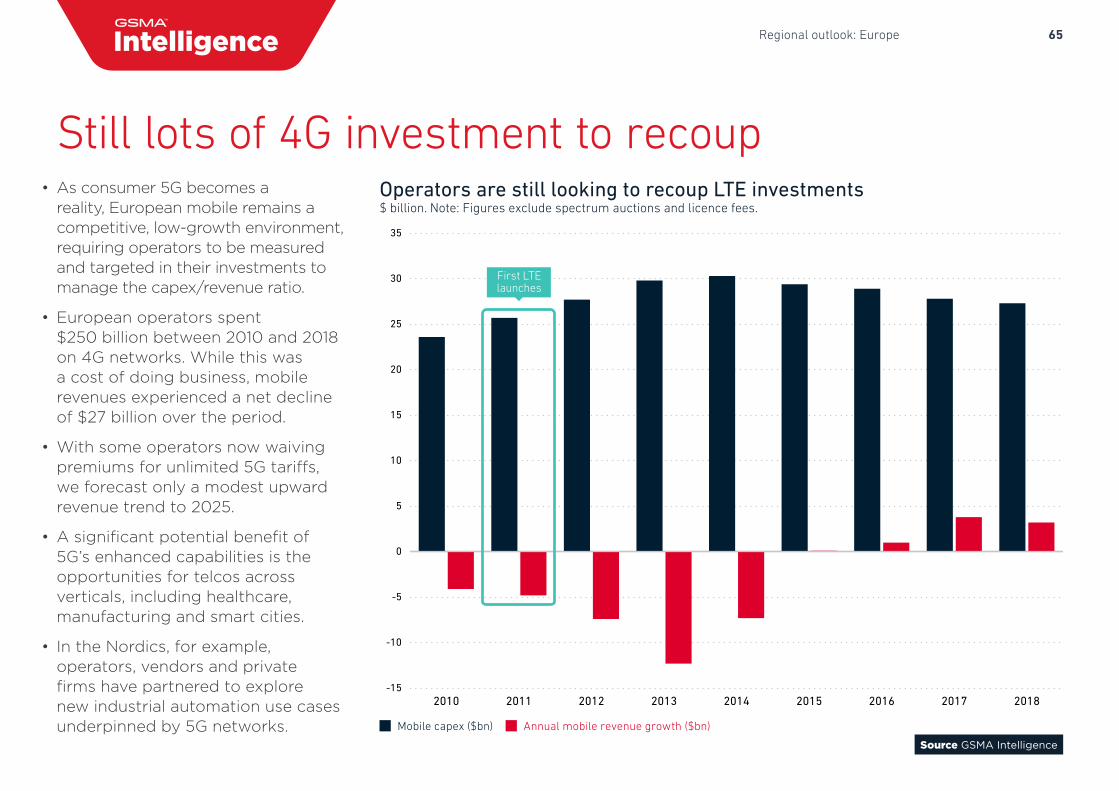
• As consumer 5G becomes areality, European mobile remains acompetitive, low-growth environment,requiring operators to be measuredand targeted in their investments tomanage the capex/revenue ratio.
• European operators spent$250 billion between 2010 and 2018on 4G networks. While this wasa cost of doing business, mobilerevenues experienced a net declineof $27 billion over the period.
• With some operators now waivingpremiums for unlimited 5G tariffs,we forecast only a modest upwardrevenue trend to 2025.
• A significant potential benefit of5G’s enhanced capabilities is theopportunities for telcos acrossverticals, including healthcare,manufacturing and smart cities.
• In the Nordics, for example,operators, vendors and privatefirms have partnered to explorenew industrial automation use casesunderpinned by 5G networks. Mobile capex ($bn) Annual mobile revenue growth ($bn)
-15
-10
-5
0
5
10
15
20
25
30
35
201820172016201520142013201220112010
First LTElaunches
Operators are still looking to recoup LTE investments$ billion. Note: Figures exclude spectrum auctions and licence fees.
Still lots of 4G investment to recoup
66Regional outlook: Europe
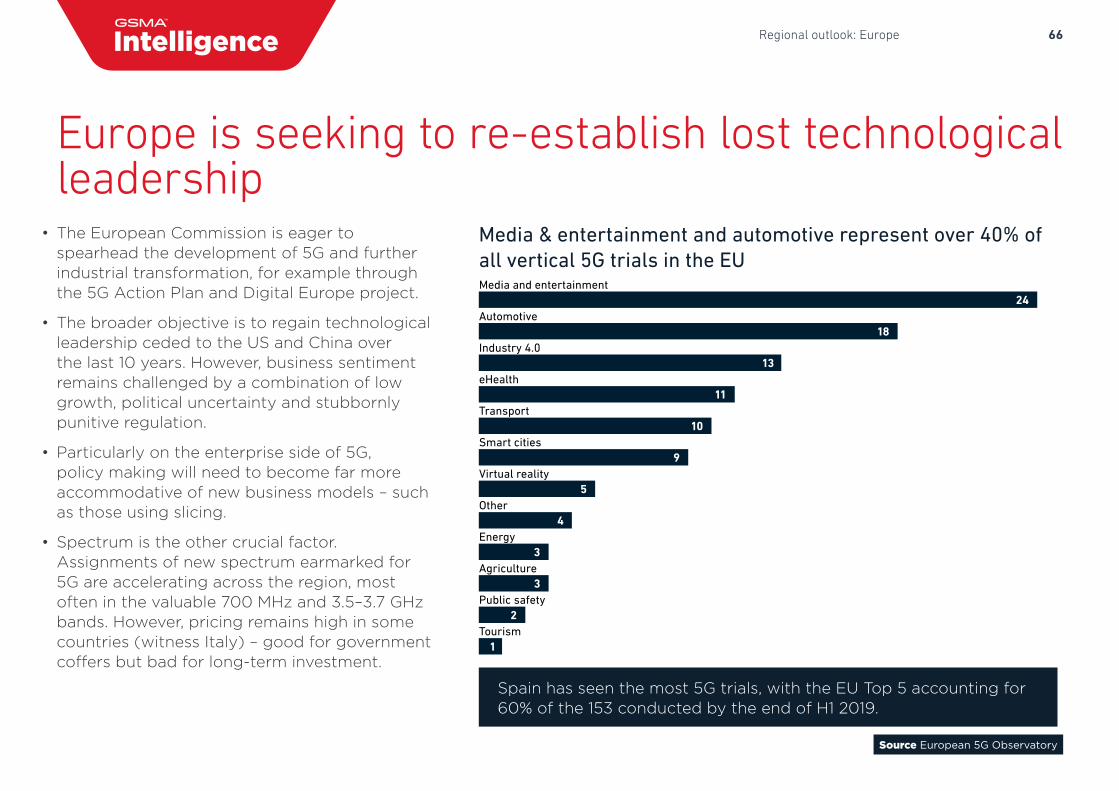
Media & entertainment and automotive represent over 40% of all vertical 5G trials in the EU
Tourism
Public safety
Agriculture
Energy
Other
Virtual reality
Smart cities
Transport
eHealth
Industry 4.0
Automotive
Media and entertainment24
18
13
11
10
9
5
4
3
3
2
1
• The European Commission is eager to spearhead the development of 5G and further industrial transformation, for example through the 5G Action Plan and Digital Europe project.
• The broader objective is to regain technological leadership ceded to the US and China over the last 10 years. However, business sentiment remains challenged by a combination of low growth, political uncertainty and stubbornly punitive regulation.
• Particularly on the enterprise side of 5G, policy making will need to become far more accommodative of new business models – such as those using slicing.
• Spectrum is the other crucial factor. Assignments of new spectrum earmarked for 5G are accelerating across the region, most often in the valuable 700 MHz and 3.5–3.7 GHz bands. However, pricing remains high in some countries (witness Italy) – good for government coffers but bad for long-term investment.
Source European 5G Observatory
Europe is seeking to re-establish lost technological leadership
Spain has seen the most 5G trials, with the EU Top 5 accounting for 60% of the 153 conducted by the end of H1 2019.
67Regional outlook: US and Canada
US and CanadaA new landscape just as 5G launches
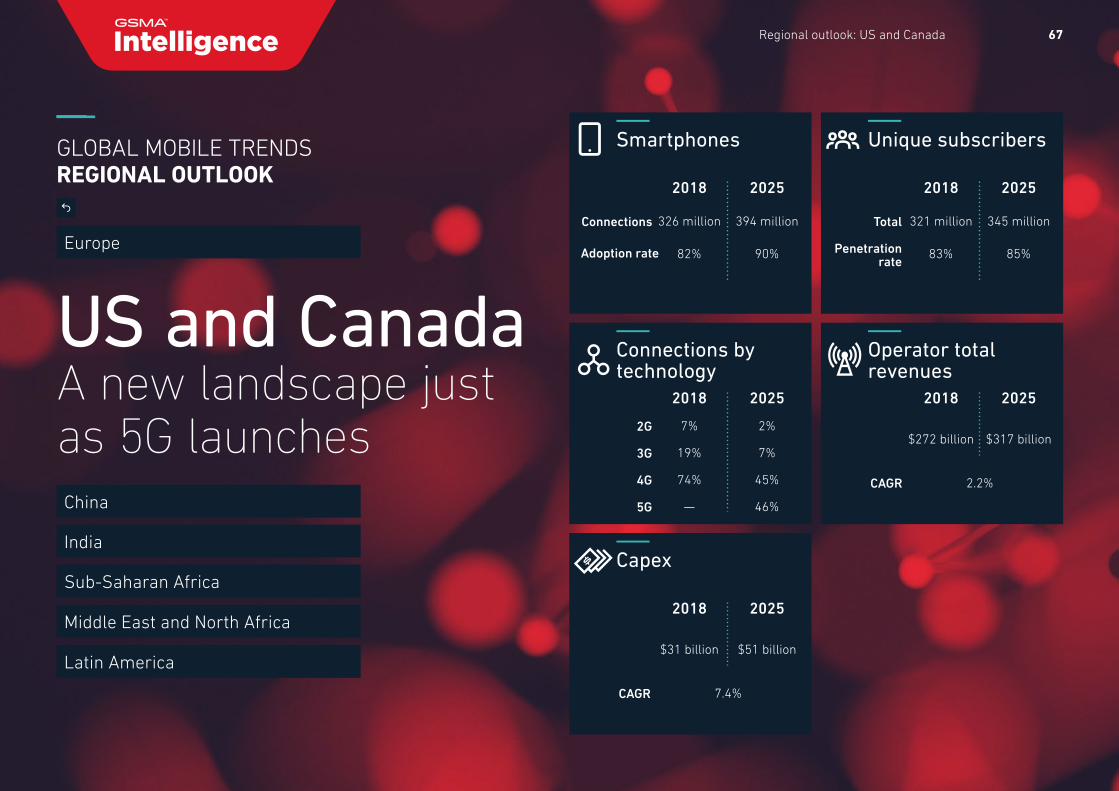
Smartphones
2018
326 million
82%
2025
394 million
90%
Connections
Adoption rate
Unique subscribers
2018
321 million
83%
2025
345 million
85%
Total
Penetration rate
Connections by technology
2018
7%
19%
74%
—
2025
2%
7%
45%
46%
2G
3G
4G
5G
Operator total revenues
2018
$272 billion
2025
$317 billion
2.2%CAGR
Capex
2018
$31 billion
2025
$51 billion
7.4%CAGR
GLOBAL MOBILE TRENDSREGIONAL OUTLOOK
Europe
China
India
Sub-Saharan Africa
Middle East and North Africa
Latin America
68Regional outlook: US and Canada
Sprint T-Mobile Verizon AT&T
mmWaveMid-band
Spectrum holdings< 1 GHzMobile subscribers
29%
35%
20%
9%
43%
25%
25%
24%
16%
16%
45%
25%
56%
19%
Source GSMA Intelligence
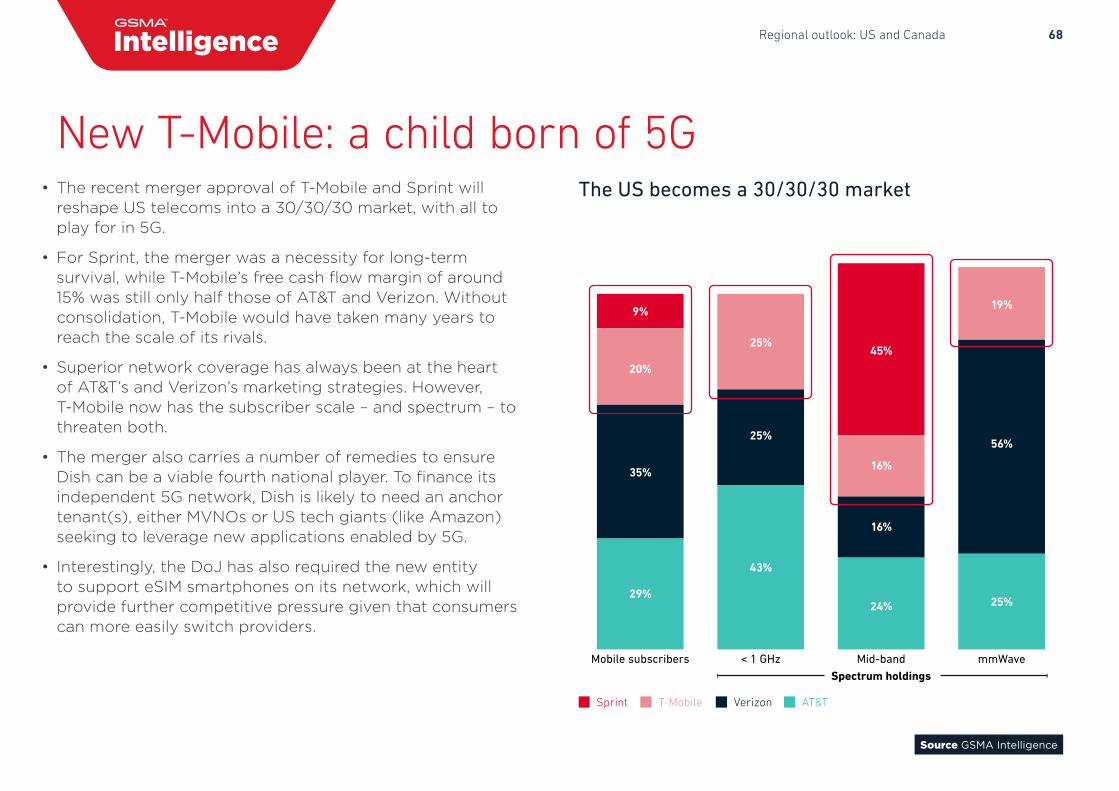
The US becomes a 30/30/30 market• The recent merger approval of T-Mobile and Sprint willreshape US telecoms into a 30/30/30 market, with all toplay for in 5G.
• For Sprint, the merger was a necessity for long-termsurvival, while T-Mobile’s free cash flow margin of around15% was still only half those of AT&T and Verizon. Withoutconsolidation, T-Mobile would have taken many years toreach the scale of its rivals.
• Superior network coverage has always been at the heartof AT&T’s and Verizon’s marketing strategies. However,T-Mobile now has the subscriber scale – and spectrum – tothreaten both.
• The merger also carries a number of remedies to ensureDish can be a viable fourth national player. To finance itsindependent 5G network, Dish is likely to need an anchortenant(s), either MVNOs or US tech giants (like Amazon)seeking to leverage new applications enabled by 5G.
• Interestingly, the DoJ has also required the new entityto support eSIM smartphones on its network, which willprovide further competitive pressure given that consumerscan more easily switch providers.
New T-Mobile: a child born of 5G
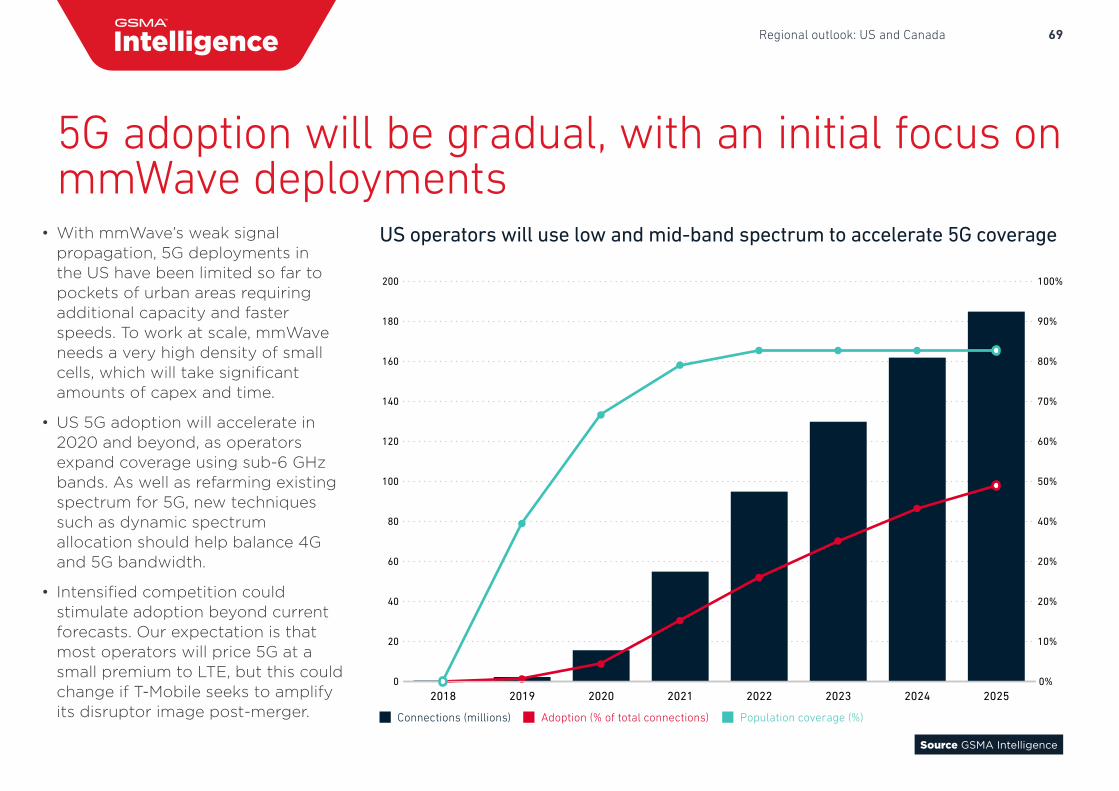
69Regional outlook: US and Canada
Connections (millions) Adoption (% of total connections) Population coverage (%)
0
20
40
60
80
100
120
140
160
180
200
202520242023202220212020201920180%
10%
20%
20%
40%
50%
60%
70%
80%
90%
100%
Source GSMA Intelligence
US operators will use low and mid-band spectrum to accelerate 5G coverage• With mmWave’s weak signalpropagation, 5G deployments inthe US have been limited so far topockets of urban areas requiringadditional capacity and fasterspeeds. To work at scale, mmWaveneeds a very high density of smallcells, which will take significantamounts of capex and time.
• US 5G adoption will accelerate in2020 and beyond, as operatorsexpand coverage using sub-6 GHzbands. As well as refarming existingspectrum for 5G, new techniquessuch as dynamic spectrumallocation should help balance 4Gand 5G bandwidth.
• Intensified competition couldstimulate adoption beyond currentforecasts. Our expectation is thatmost operators will price 5G at asmall premium to LTE, but this couldchange if T-Mobile seeks to amplifyits disruptor image post-merger.
5G adoption will be gradual, with an initial focus on mmWave deployments
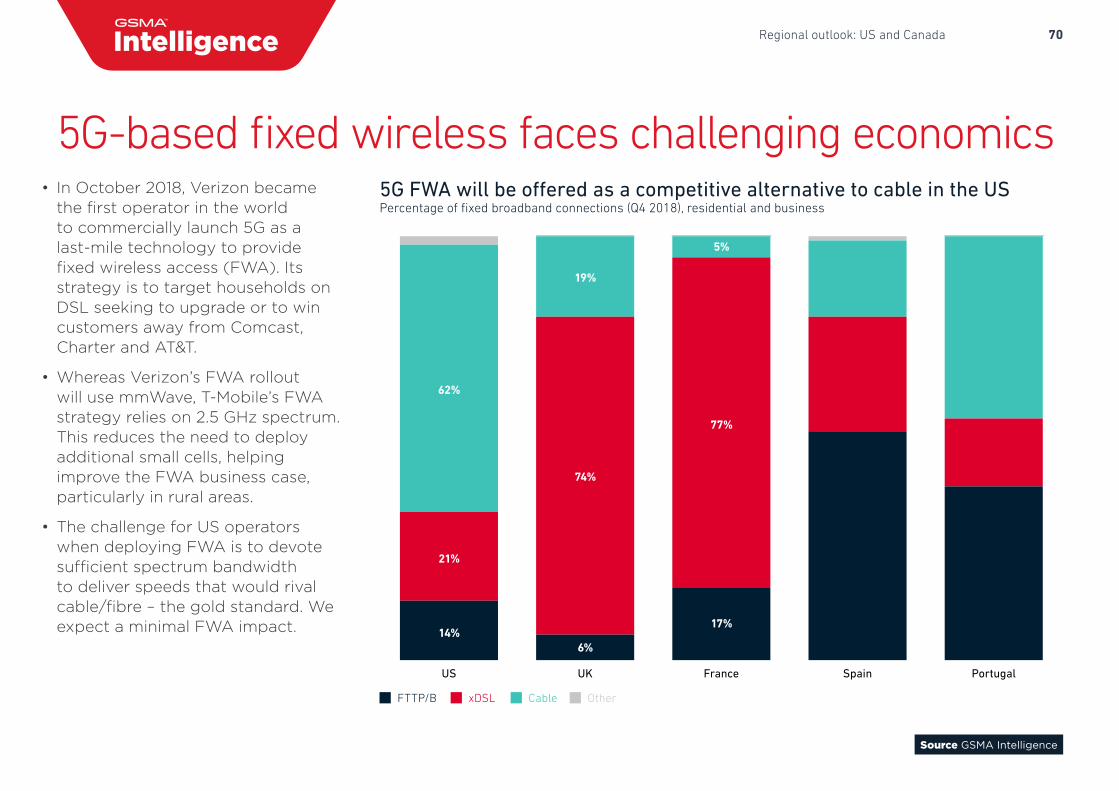
70Regional outlook: US and Canada
Source GSMA Intelligence
• In October 2018, Verizon becamethe first operator in the worldto commercially launch 5G as alast-mile technology to providefixed wireless access (FWA). Itsstrategy is to target households onDSL seeking to upgrade or to wincustomers away from Comcast,Charter and AT&T.
• Whereas Verizon’s FWA rolloutwill use mmWave, T-Mobile’s FWAstrategy relies on 2.5 GHz spectrum.This reduces the need to deployadditional small cells, helpingimprove the FWA business case,particularly in rural areas.
• The challenge for US operatorswhen deploying FWA is to devotesufficient spectrum bandwidthto deliver speeds that would rivalcable/fibre – the gold standard. Weexpect a minimal FWA impact.
FTTP/B xDSL Cable Other
14%
21%
62%
6%
74%
19%
17%
77%
5%
PortugalSpainFranceUKUS
5G FWA will be offered as a competitive alternative to cable in the USPercentage of fixed broadband connections (Q4 2018), residential and business
5G-based fixed wireless faces challenging economics
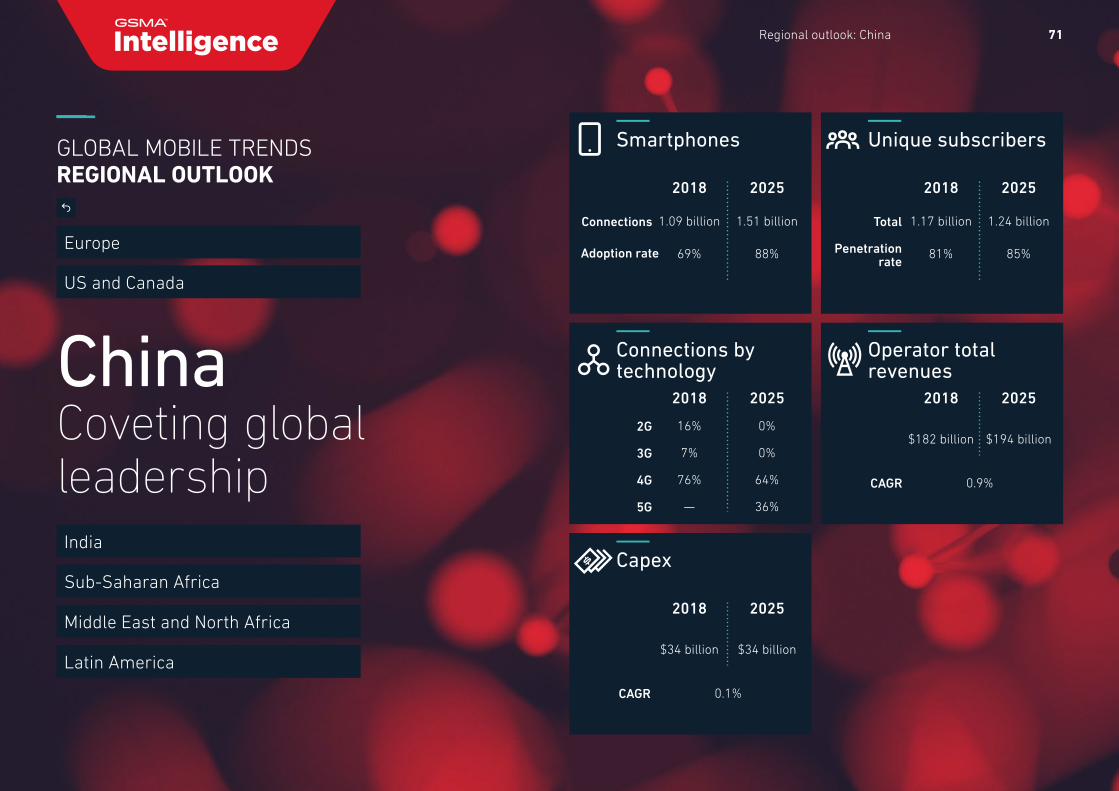
71Regional outlook: China
ChinaCoveting global leadership
Smartphones
2018
1.09 billion
69%
2025
1.51 billion
88%
Connections
Adoption rate
Unique subscribers
2018
1.17 billion
81%
2025
1.24 billion
85%
Total
Penetration rate
Connections by technology
2018
16%
7%
76%
—
2025
0%
0%
64%
36%
2G
3G
4G
5G
Operator total revenues
2018
$182 billion
2025
$194 billion
0.9%CAGR
Capex
2018
$34 billion
2025
$34 billion
0.1%CAGR
GLOBAL MOBILE TRENDSREGIONAL OUTLOOK
Europe
US and Canada
India
Sub-Saharan Africa
Middle East and North Africa
Latin America
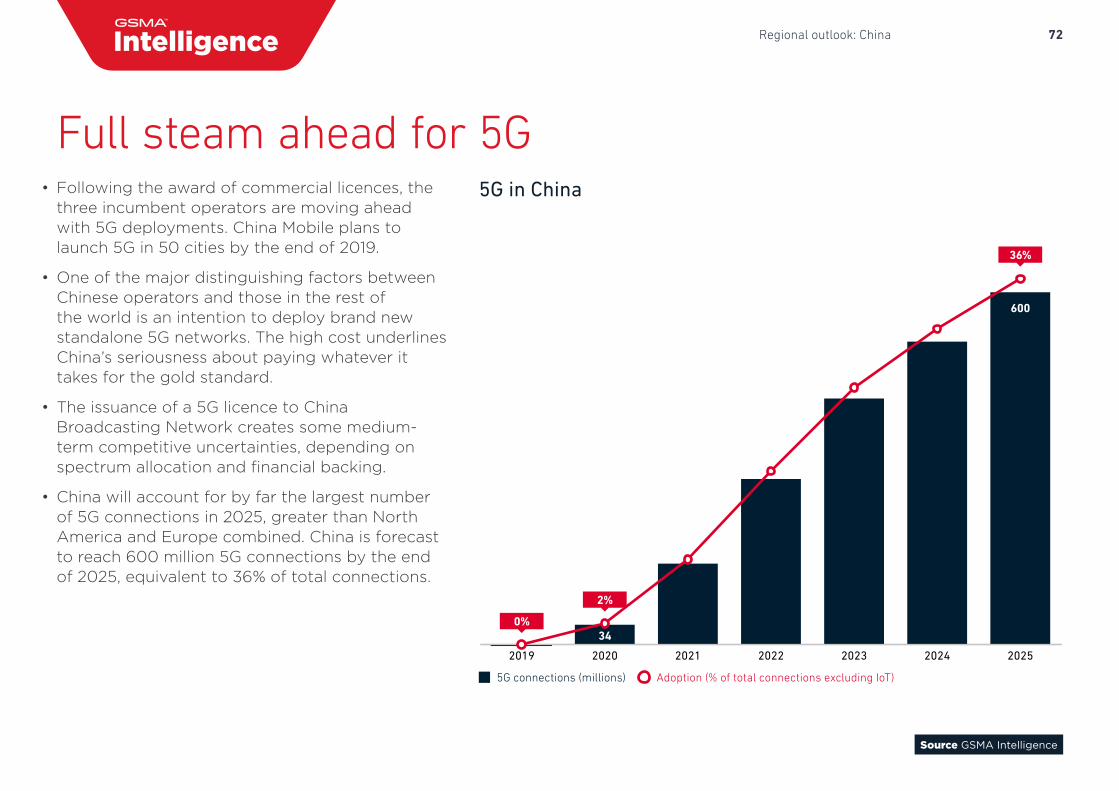
72Regional outlook: China
Full steam ahead for 5G• Following the award of commercial licences, the
three incumbent operators are moving aheadwith 5G deployments. China Mobile plans tolaunch 5G in 50 cities by the end of 2019.
• One of the major distinguishing factors betweenChinese operators and those in the rest ofthe world is an intention to deploy brand newstandalone 5G networks. The high cost underlinesChina’s seriousness about paying whatever ittakes for the gold standard.
• The issuance of a 5G licence to ChinaBroadcasting Network creates some medium-term competitive uncertainties, depending onspectrum allocation and financial backing.
• China will account for by far the largest numberof 5G connections in 2025, greater than NorthAmerica and Europe combined. China is forecastto reach 600 million 5G connections by the endof 2025, equivalent to 36% of total connections.
5G connections (millions) Adoption (% of total connections excluding IoT)
2025202420232022202120202019
600
516
419
282
138
34
36%
0%
2%
5G in China
Source GSMA Intelligence
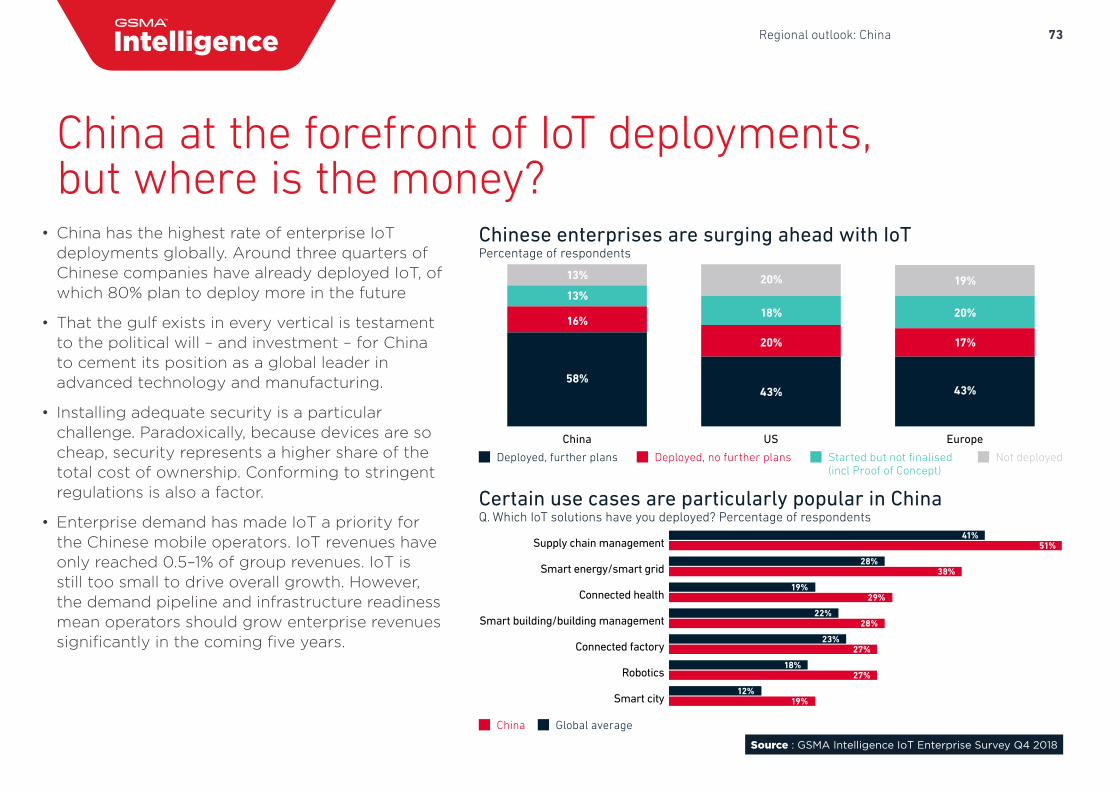
73Regional outlook: China
Source : GSMA Intelligence IoT Enterprise Survey Q4 2018
Deployed, further plans Deployed, no further plans Started but not finalised(incl Proof of Concept)
Not deployed
43% 43%58%
16%
20% 17%
20%18%13%
13% 20% 19%
EuropeUSChina
China Global average
Smart city
Robotics
Connected factory
Smart building/building management
Connected health
Smart energy/smart grid
Supply chain management41%
51%
28%38%
19%29%
22%28%
23%27%
18%27%
12%19%
Chinese enterprises are surging ahead with IoTPercentage of respondents
Certain use cases are particularly popular in ChinaQ. Which IoT solutions have you deployed? Percentage of respondents
• China has the highest rate of enterprise IoTdeployments globally. Around three quarters ofChinese companies have already deployed IoT, ofwhich 80% plan to deploy more in the future
• That the gulf exists in every vertical is testamentto the political will – and investment – for Chinato cement its position as a global leader inadvanced technology and manufacturing.
• Installing adequate security is a particularchallenge. Paradoxically, because devices are socheap, security represents a higher share of thetotal cost of ownership. Conforming to stringentregulations is also a factor.
• Enterprise demand has made IoT a priority forthe Chinese mobile operators. IoT revenues haveonly reached 0.5–1% of group revenues. IoT isstill too small to drive overall growth. However,the demand pipeline and infrastructure readinessmean operators should grow enterprise revenuessignificantly in the coming five years.
China at the forefront of IoT deployments, but where is the money?
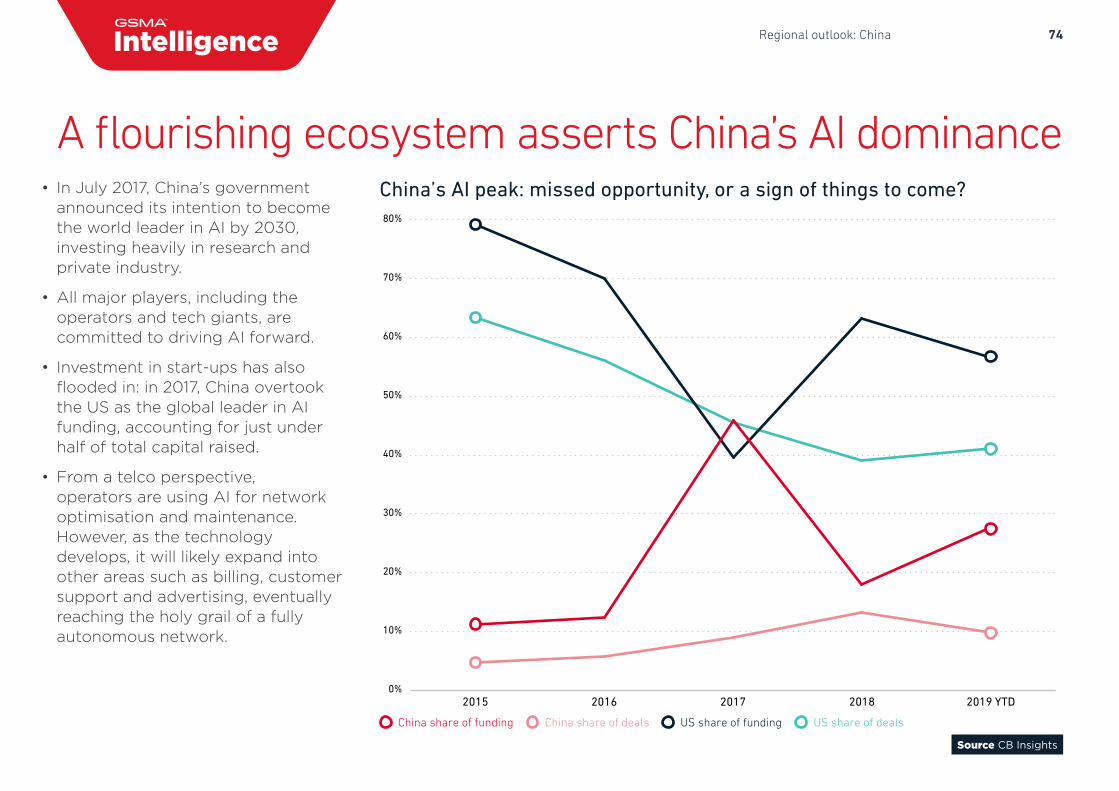
74Regional outlook: China
Source CB Insights
• In July 2017, China’s governmentannounced its intention to becomethe world leader in AI by 2030,investing heavily in research andprivate industry.
• All major players, including theoperators and tech giants, arecommitted to driving AI forward.
• Investment in start-ups has alsoflooded in: in 2017, China overtookthe US as the global leader in AIfunding, accounting for just underhalf of total capital raised.
• From a telco perspective,operators are using AI for networkoptimisation and maintenance.However, as the technologydevelops, it will likely expand intoother areas such as billing, customersupport and advertising, eventuallyreaching the holy grail of a fullyautonomous network.
China share of funding China share of deals US share of funding US share of deals
0%
10%
20%
30%
40%
50%
60%
70%
80%
2019 YTD2018201720162015
China’s AI peak: missed opportunity, or a sign of things to come?
A flourishing ecosystem asserts China’s AI dominance
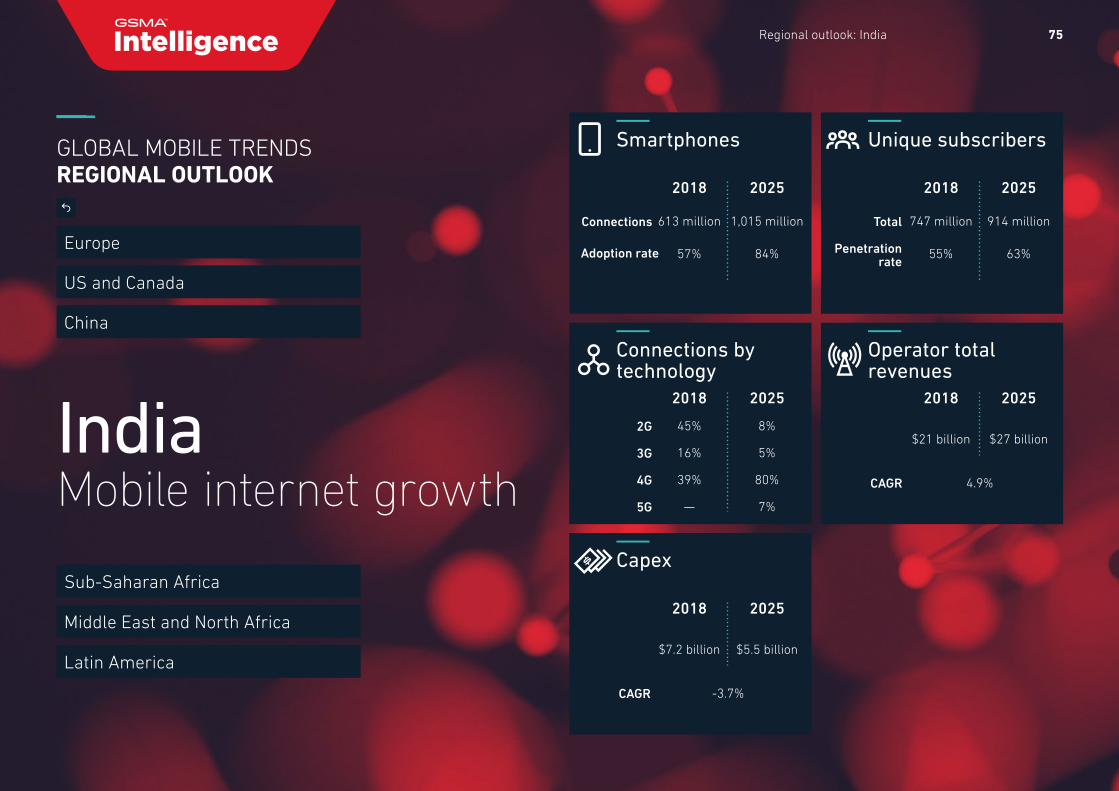
75Regional outlook: India
IndiaMobile internet growth
Smartphones
2018
613 million
57%
2025
1,015 million
84%
Connections
Adoption rate
Unique subscribers
2018
747 million
55%
2025
914 million
63%
Total
Penetration rate
Connections by technology
2018
45%
16%
39%
—
2025
8%
5%
80%
7%
2G
3G
4G
5G
Operator total revenues
2018
$21 billion
2025
$27 billion
4.9%CAGR
Capex
2018
$7.2 billion
2025
$5.5 billion
-3.7%CAGR
GLOBAL MOBILE TRENDSREGIONAL OUTLOOK
Europe
US and Canada
China
Sub-Saharan Africa
Middle East and North Africa
Latin America
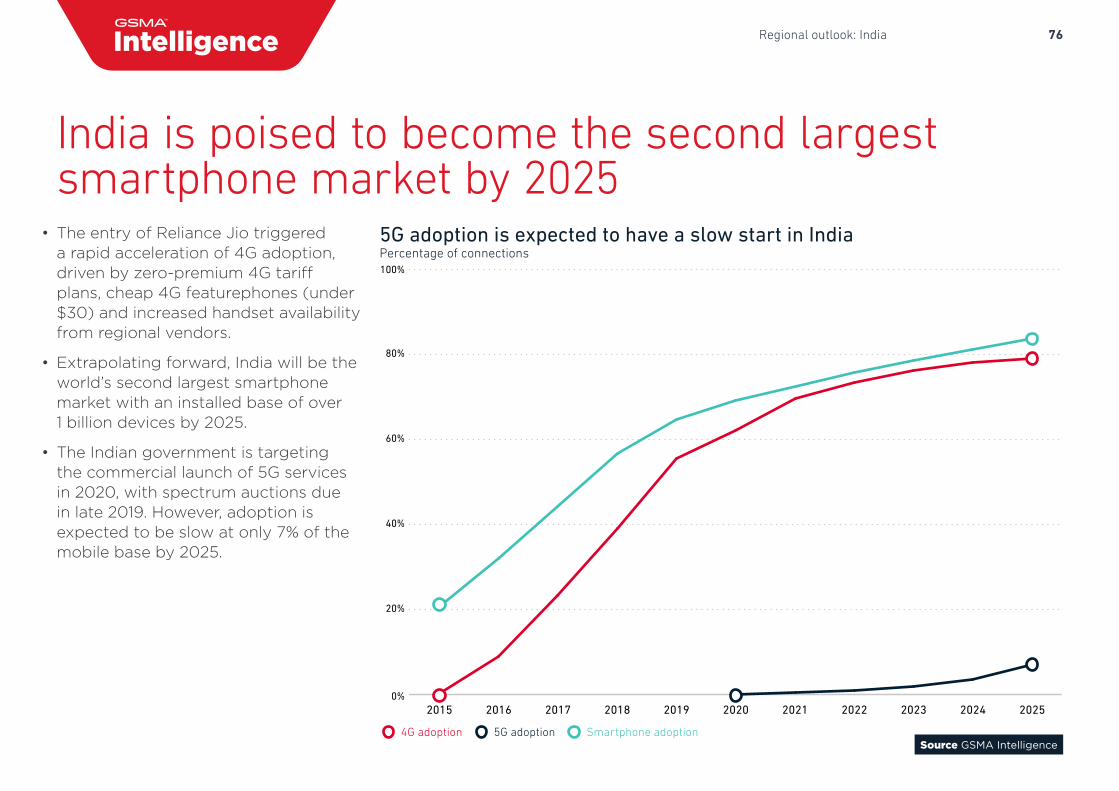
76Regional outlook: India
Source GSMA Intelligence
India is poised to become the second largest smartphone market by 2025
• The entry of Reliance Jio triggereda rapid acceleration of 4G adoption,driven by zero-premium 4G tariffplans, cheap 4G featurephones (under$30) and increased handset availabilityfrom regional vendors.
• Extrapolating forward, India will be theworld’s second largest smartphonemarket with an installed base of over1 billion devices by 2025.
• The Indian government is targetingthe commercial launch of 5G servicesin 2020, with spectrum auctions duein late 2019. However, adoption isexpected to be slow at only 7% of themobile base by 2025.
Smartphone adoption4G adoption 5G adoption
202520242023202220212020201920182017201620150%
20%
40%
60%
80%
100%
5G adoption is expected to have a slow start in IndiaPercentage of connections
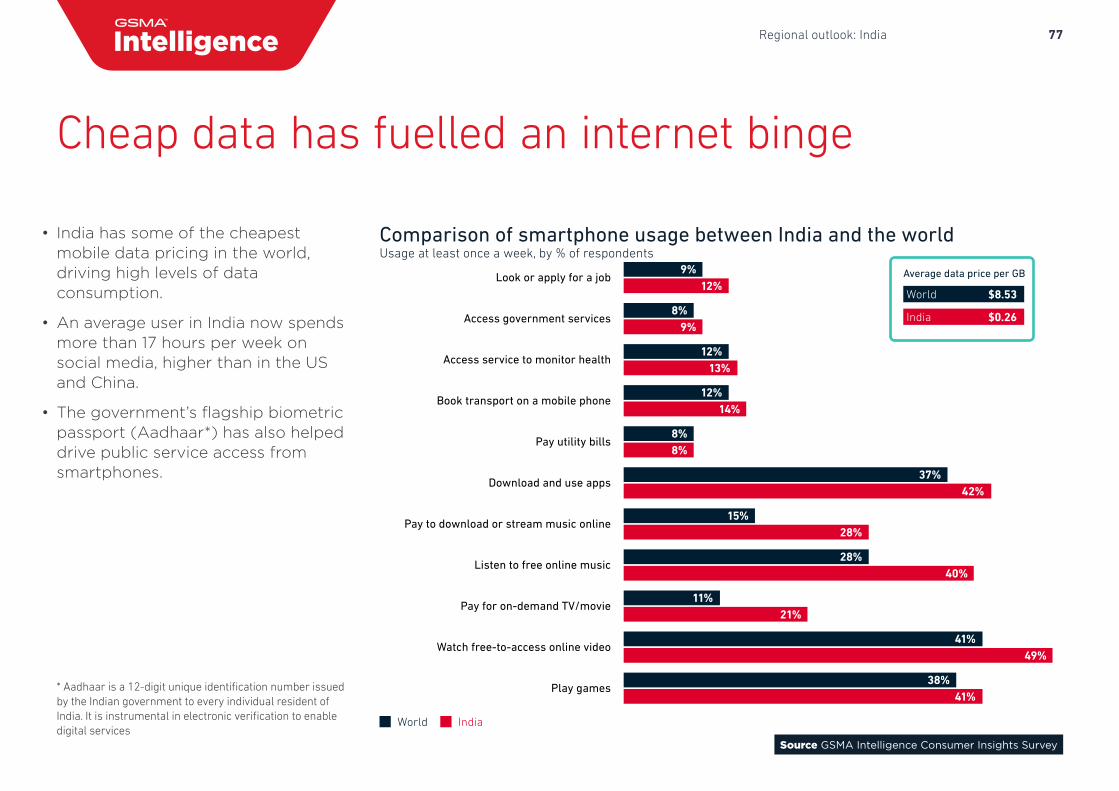
77Regional outlook: India
Average data price per GB
Play games
Watch free-to-access online video
Pay for on-demand TV/movie
Listen to free online music
Pay to download or stream music online
Download and use apps
Pay utility bills
Book transport on a mobile phone
Access service to monitor health
Access government services
Look or apply for a job
World India
38%
41%
11%
28%
15%
37%
8%
12%
12%
8%
9%
41%
49%
21%
40%
28%
42%
8%
14%
13%
9%
12%$8.53
$0.26
World
India
Source GSMA Intelligence Consumer Insights Survey
Comparison of smartphone usage between India and the worldUsage at least once a week, by % of respondents
• India has some of the cheapestmobile data pricing in the world,driving high levels of dataconsumption.
• An average user in India now spendsmore than 17 hours per week onsocial media, higher than in the USand China.
• The government’s flagship biometricpassport (Aadhaar*) has also helpeddrive public service access fromsmartphones.
Cheap data has fuelled an internet binge
* Aadhaar is a 12-digit unique identification number issuedby the Indian government to every individual resident ofIndia. It is instrumental in electronic verification to enabledigital services
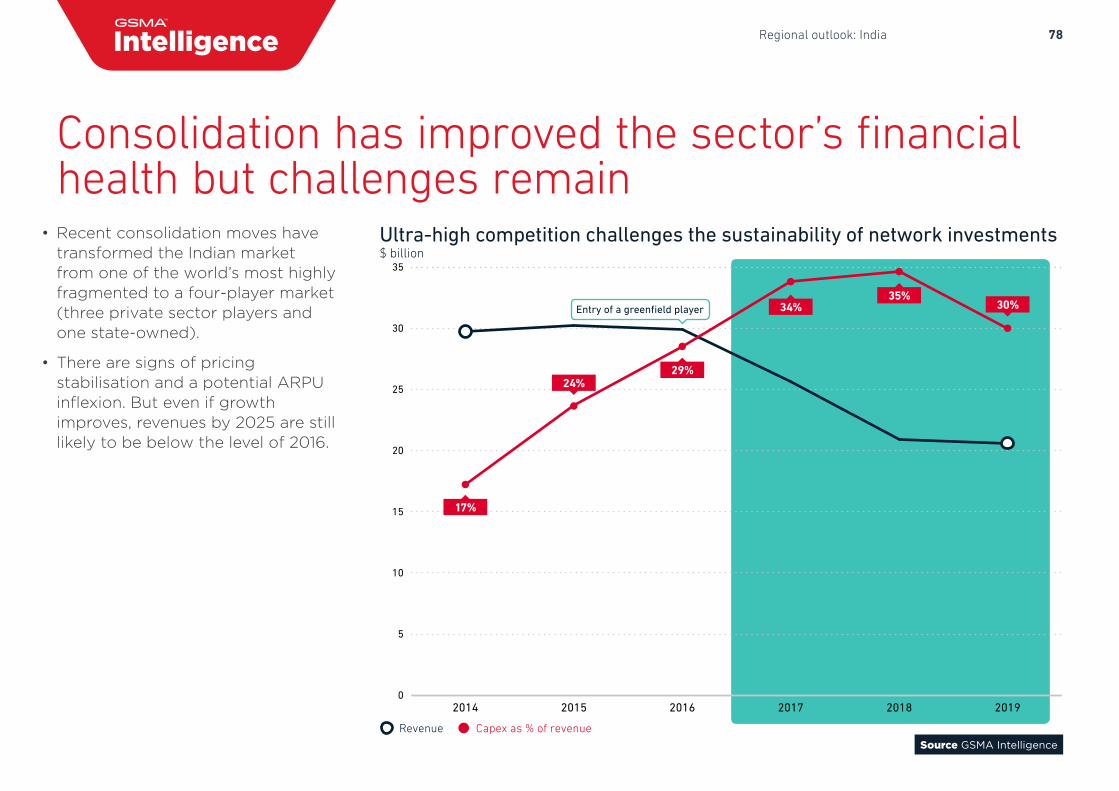
78Regional outlook: India
Revenue Capex as % of revenue
2019201820172016201520140
5
10
15
20
25
30
35
17%
24%29%
34%35%
30%Entry of a greenfield player
Source GSMA Intelligence
Ultra-high competition challenges the sustainability of network investments$ billion
• Recent consolidation moves havetransformed the Indian marketfrom one of the world’s most highlyfragmented to a four-player market(three private sector players andone state-owned).
• There are signs of pricingstabilisation and a potential ARPUinflexion. But even if growthimproves, revenues by 2025 are stilllikely to be below the level of 2016.
Consolidation has improved the sector’s financial health but challenges remain
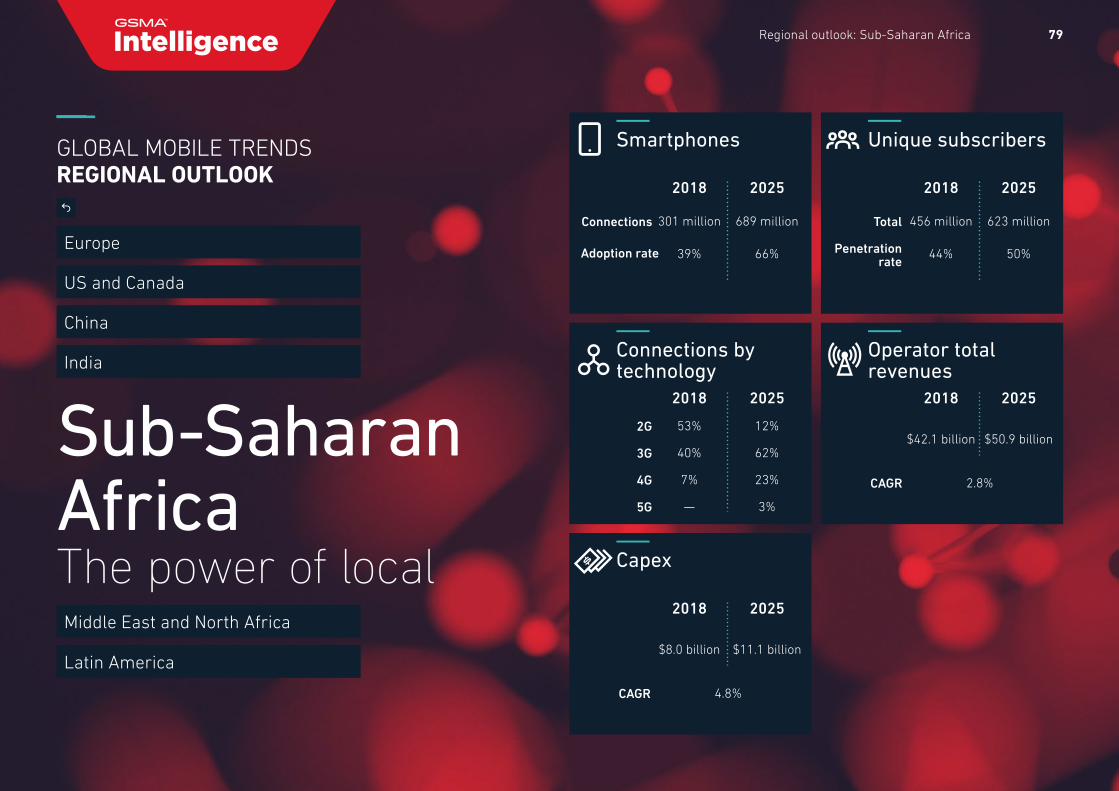
79Regional outlook: Sub-Saharan Africa
Sub-Saharan AfricaThe power of local
Smartphones
2018
301 million
39%
2025
689 million
66%
Connections
Adoption rate
Unique subscribers
2018
456 million
44%
2025
623 million
50%
Total
Penetration rate
Connections by technology
2018
53%
40%
7%
—
2025
12%
62%
23%
3%
2G
3G
4G
5G
Operator total revenues
2018
$42.1 billion
2025
$50.9 billion
2.8%CAGR
Capex
2018
$8.0 billion
2025
$11.1 billion
4.8%CAGR
GLOBAL MOBILE TRENDSREGIONAL OUTLOOK
Europe
US and Canada
China
India
Middle East and North Africa
Latin America
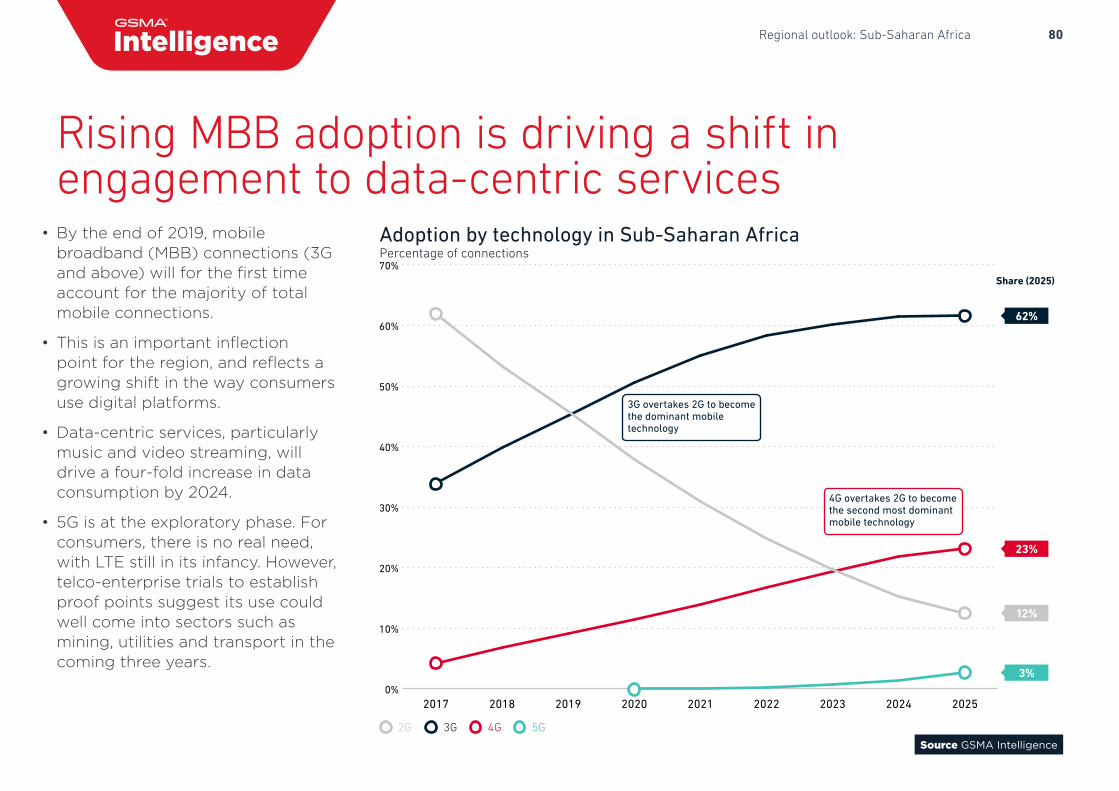
80Regional outlook: Sub-Saharan Africa
2G 3G 4G 5G
23%
62%
3%
12%
Share (2025)
0%
10%
20%
30%
40%
50%
60%
70%
202520242023202220212020201920182017
3G overtakes 2G to becomethe dominant mobiletechnology
4G overtakes 2G to becomethe second most dominant mobile technology
Source GSMA Intelligence
Adoption by technology in Sub-Saharan AfricaPercentage of connections
• By the end of 2019, mobilebroadband (MBB) connections (3Gand above) will for the first timeaccount for the majority of totalmobile connections.
• This is an important inflectionpoint for the region, and reflects agrowing shift in the way consumersuse digital platforms.
• Data-centric services, particularlymusic and video streaming, willdrive a four-fold increase in dataconsumption by 2024.
• 5G is at the exploratory phase. Forconsumers, there is no real need,with LTE still in its infancy. However,telco-enterprise trials to establishproof points suggest its use couldwell come into sectors such asmining, utilities and transport in thecoming three years.
Rising MBB adoption is driving a shift in engagement to data-centric services
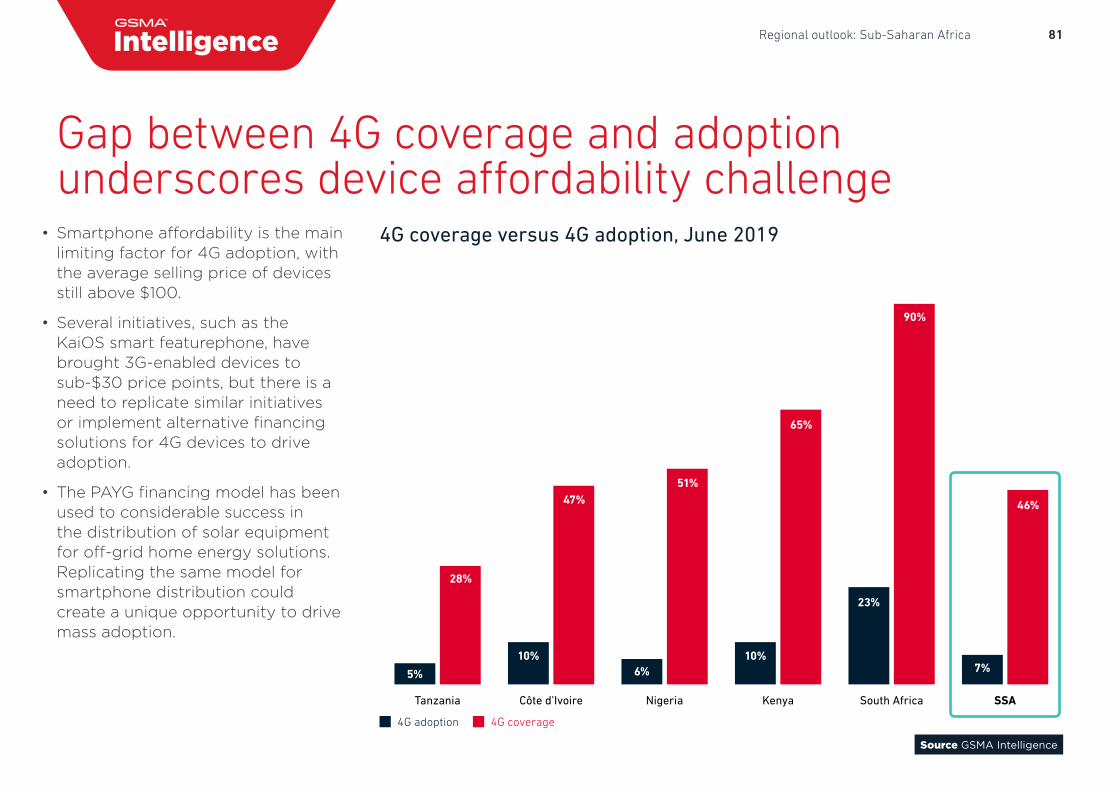
81Regional outlook: Sub-Saharan Africa
4G adoption 4G coverage
7%
23%
10%6%
10%
5%
46%
90%
65%
51%47%
28%
SSASouth AfricaKenyaNigeriaCôte d’IvoireTanzania
Source GSMA Intelligence
4G coverage versus 4G adoption, June 2019• Smartphone affordability is the mainlimiting factor for 4G adoption, withthe average selling price of devicesstill above $100.
• Several initiatives, such as theKaiOS smart featurephone, havebrought 3G-enabled devices tosub-$30 price points, but there is aneed to replicate similar initiativesor implement alternative financingsolutions for 4G devices to driveadoption.
• The PAYG financing model has beenused to considerable success inthe distribution of solar equipmentfor off-grid home energy solutions.Replicating the same model forsmartphone distribution couldcreate a unique opportunity to drivemass adoption.
Gap between 4G coverage and adoption underscores device affordability challenge
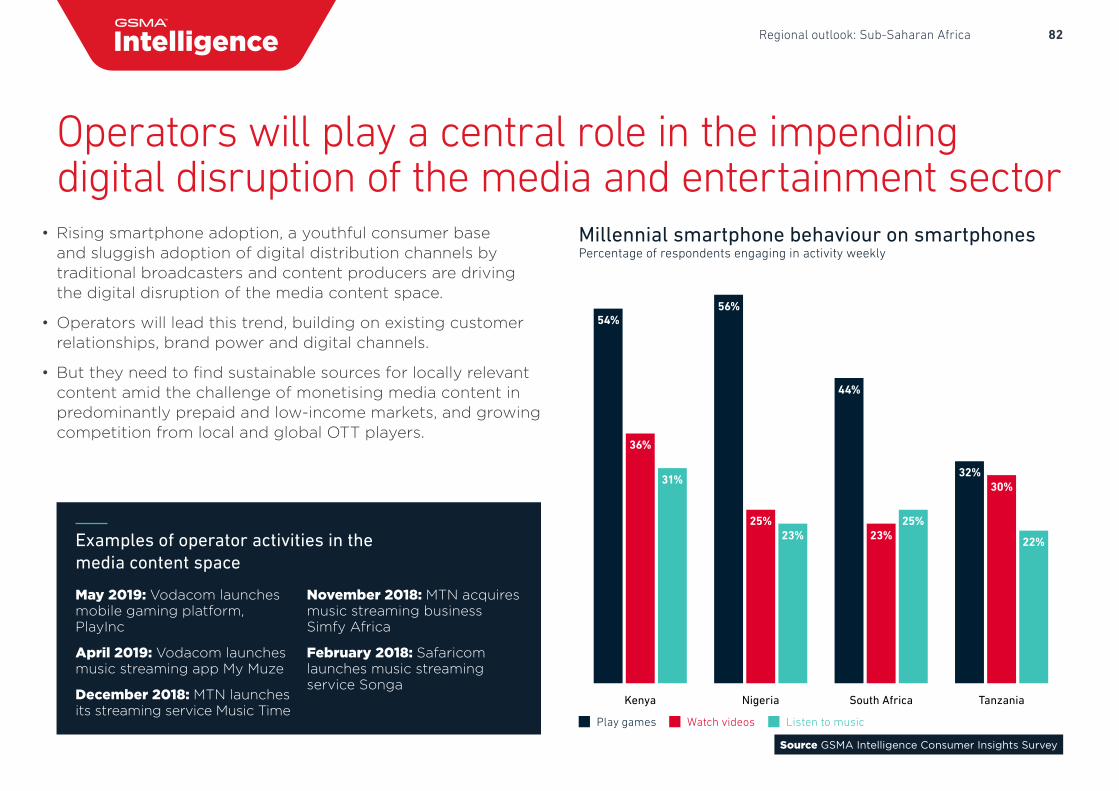
82Regional outlook: Sub-Saharan Africa
Play games Watch videos Listen to music
TanzaniaSouth AfricaNigeriaKenya
30%
23%25%
36%
22%
25%23%
31%32%
44%
56%54%
Source GSMA Intelligence Consumer Insights Survey
Millennial smartphone behaviour on smartphonesPercentage of respondents engaging in activity weekly
• Rising smartphone adoption, a youthful consumer baseand sluggish adoption of digital distribution channels bytraditional broadcasters and content producers are drivingthe digital disruption of the media content space.
• Operators will lead this trend, building on existing customerrelationships, brand power and digital channels.
• But they need to find sustainable sources for locally relevantcontent amid the challenge of monetising media content inpredominantly prepaid and low-income markets, and growingcompetition from local and global OTT players.
Operators will play a central role in the impending digital disruption of the media and entertainment sector
Examples of operator activities in the media content space
May 2019: Vodacom launches mobile gaming platform, PlayInc
April 2019: Vodacom launches music streaming app My Muze
December 2018: MTN launches its streaming service Music Time
November 2018: MTN acquires music streaming business Simfy Africa
February 2018: Safaricom launches music streaming service Songa
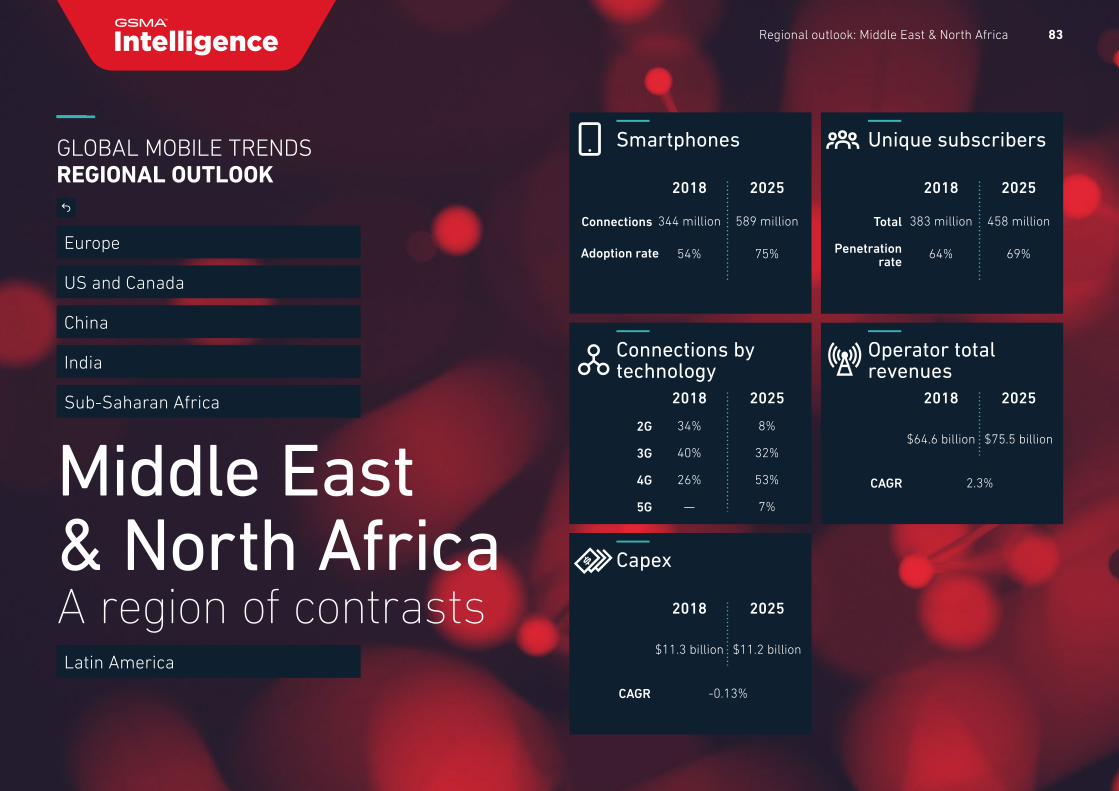
83Regional outlook: Middle East & North Africa
Middle East & North AfricaA region of contrasts
Smartphones
2018
344 million
54%
2025
589 million
75%
Connections
Adoption rate
Unique subscribers
2018
383 million
64%
2025
458 million
69%
Total
Penetration rate
Connections by technology
2018
34%
40%
26%
—
2025
8%
32%
53%
7%
2G
3G
4G
5G
Operator total revenues
2018
$64.6 billion
2025
$75.5 billion
2.3%CAGR
Capex
2018
$11.3 billion
2025
$11.2 billion
-0.13%CAGR
GLOBAL MOBILE TRENDSREGIONAL OUTLOOK
Europe
US and Canada
China
India
Sub-Saharan Africa
Latin America
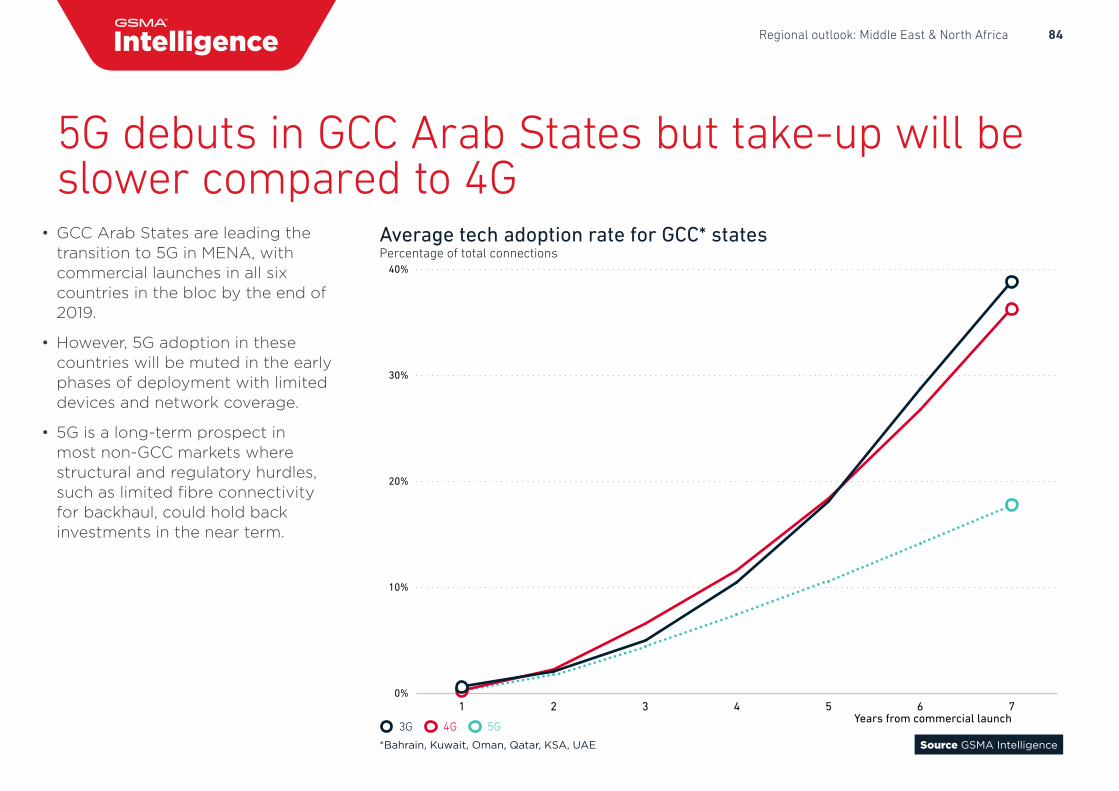
84Regional outlook: Middle East & North Africa
3G 4G 5G
76543210%
10%
20%
30%
40%
Years from commercial launch
Source GSMA Intelligence*Bahrain, Kuwait, Oman, Qatar, KSA, UAE
Average tech adoption rate for GCC* statesPercentage of total connections
• GCC Arab States are leading thetransition to 5G in MENA, withcommercial launches in all sixcountries in the bloc by the end of2019.
• However, 5G adoption in thesecountries will be muted in the earlyphases of deployment with limiteddevices and network coverage.
• 5G is a long-term prospect inmost non-GCC markets wherestructural and regulatory hurdles,such as limited fibre connectivityfor backhaul, could hold backinvestments in the near term.
5G debuts in GCC Arab States but take-up will be slower compared to 4G
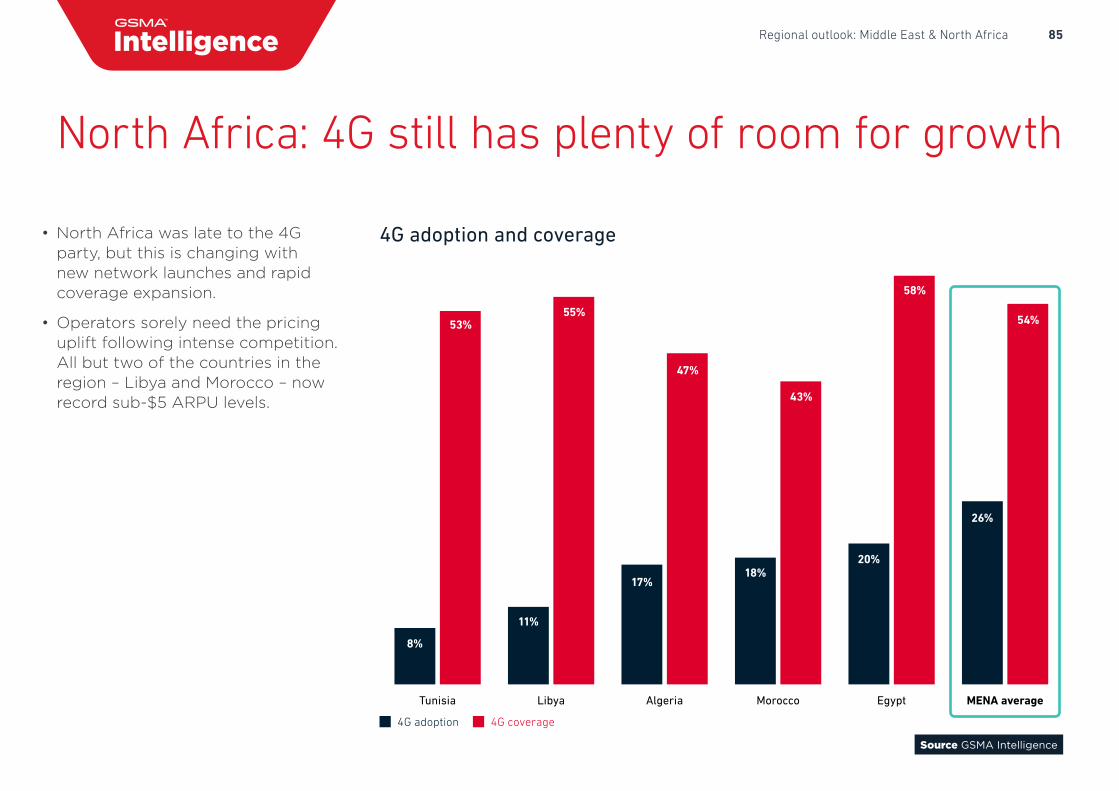
85Regional outlook: Middle East & North Africa
4G adoption and coverage
4G adoption 4G coverage
MENA averageEgyptMoroccoAlgeriaLibyaTunisia
26%
20%18%
17%
11%
8%
54%
58%
43%
47%
55%53%
Source GSMA Intelligence
North Africa: 4G still has plenty of room for growth
• North Africa was late to the 4Gparty, but this is changing withnew network launches and rapidcoverage expansion.
• Operators sorely need the pricinguplift following intense competition.All but two of the countries in theregion – Libya and Morocco – nowrecord sub-$5 ARPU levels.
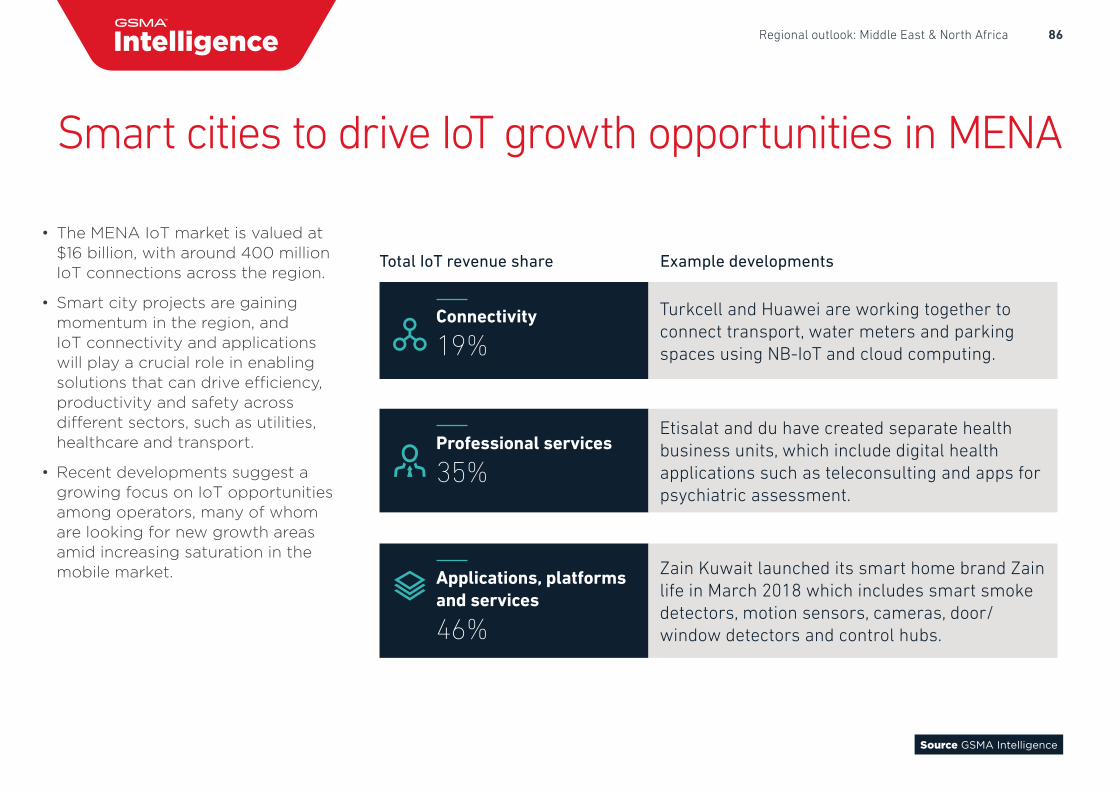
86Regional outlook: Middle East & North Africa
Total IoT revenue share Example developments
Source GSMA Intelligence
• The MENA IoT market is valued at$16 billion, with around 400 millionIoT connections across the region.
• Smart city projects are gainingmomentum in the region, andIoT connectivity and applicationswill play a crucial role in enablingsolutions that can drive efficiency,productivity and safety acrossdifferent sectors, such as utilities,healthcare and transport.
• Recent developments suggest agrowing focus on IoT opportunitiesamong operators, many of whomare looking for new growth areasamid increasing saturation in themobile market.
Smart cities to drive IoT growth opportunities in MENA
Connectivity
19%
Professional services
35%
Applications, platforms and services
46%
Turkcell and Huawei are working together to connect transport, water meters and parking spaces using NB-IoT and cloud computing.
Etisalat and du have created separate health business units, which include digital health applications such as teleconsulting and apps for psychiatric assessment.
Zain Kuwait launched its smart home brand Zain life in March 2018 which includes smart smoke detectors, motion sensors, cameras, door/window detectors and control hubs.
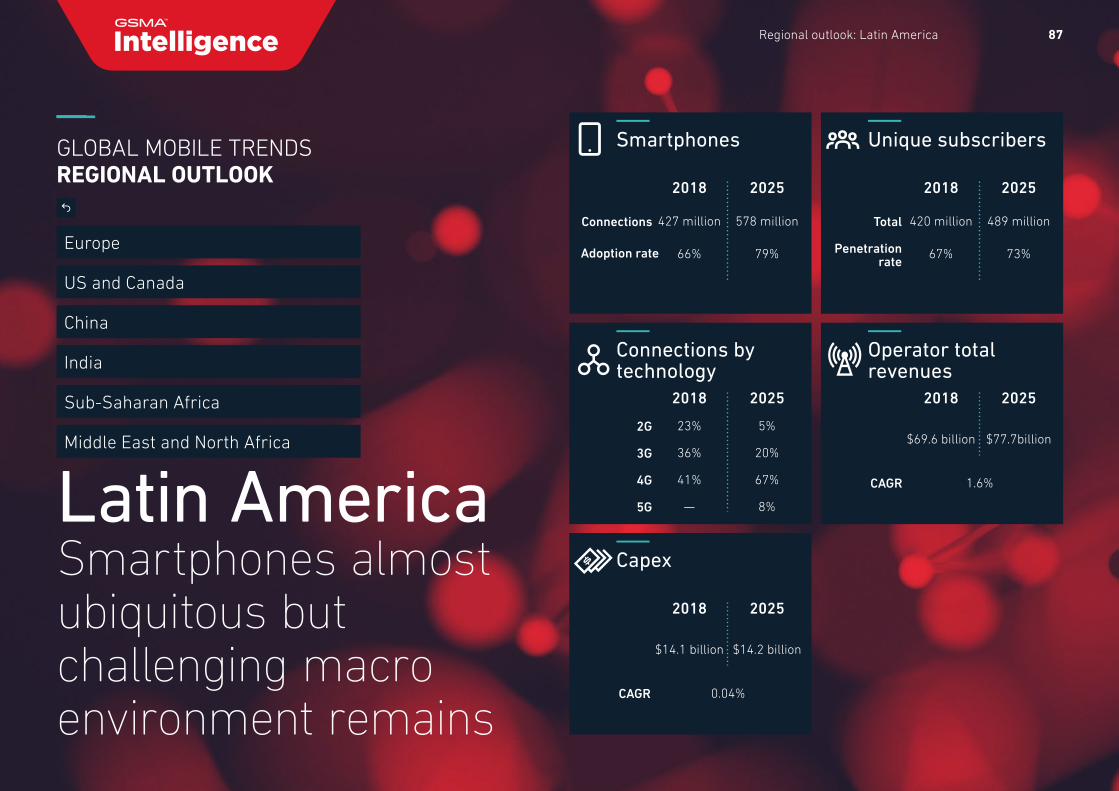
87Regional outlook: Latin America
Latin AmericaSmartphones almost ubiquitous but challenging macro environment remains
Smartphones
2018
427 million
66%
2025
578 million
79%
Connections
Adoption rate
Unique subscribers
2018
420 million
67%
2025
489 million
73%
Total
Penetration rate
Connections by technology
2018
23%
36%
41%
—
2025
5%
20%
67%
8%
2G
3G
4G
5G
Operator total revenues
2018
$69.6 billion
2025
$77.7billion
1.6%CAGR
Capex
2018
$14.1 billion
2025
$14.2 billion
0.04%CAGR
GLOBAL MOBILE TRENDSREGIONAL OUTLOOK
Europe
US and Canada
China
India
Sub-Saharan Africa
Middle East and North Africa
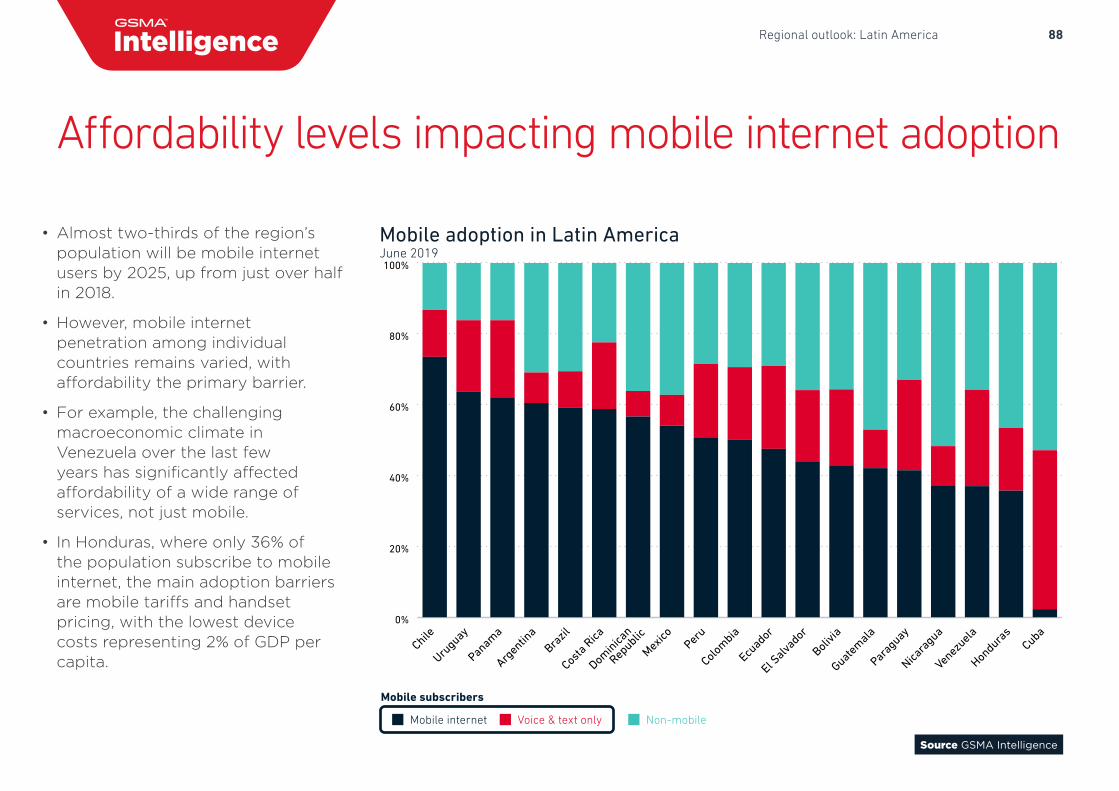
88Regional outlook: Latin America
Mobile internet
Mobile subscribers
Voice & text only Non-mobile
0%
20%
40%
60%
80%
100%
Cuba
Honduras
Venezuela
Nicara
gua
Paraguay
Guatem
ala
Bolivia
El Salva
dor
Ecuador
Colombia
Peru
Mexico
Dominica
n
Republic
Costa R
icaBra
zil
Argentin
a
Panama
Uruguay
Chile
Source GSMA Intelligence
Mobile adoption in Latin AmericaJune 2019
Affordability levels impacting mobile internet adoption
• Almost two-thirds of the region’spopulation will be mobile internetusers by 2025, up from just over halfin 2018.
• However, mobile internetpenetration among individualcountries remains varied, withaffordability the primary barrier.
• For example, the challengingmacroeconomic climate inVenezuela over the last fewyears has significantly affectedaffordability of a wide range ofservices, not just mobile.
• In Honduras, where only 36% ofthe population subscribe to mobileinternet, the main adoption barriersare mobile tariffs and handsetpricing, with the lowest devicecosts representing 2% of GDP percapita.
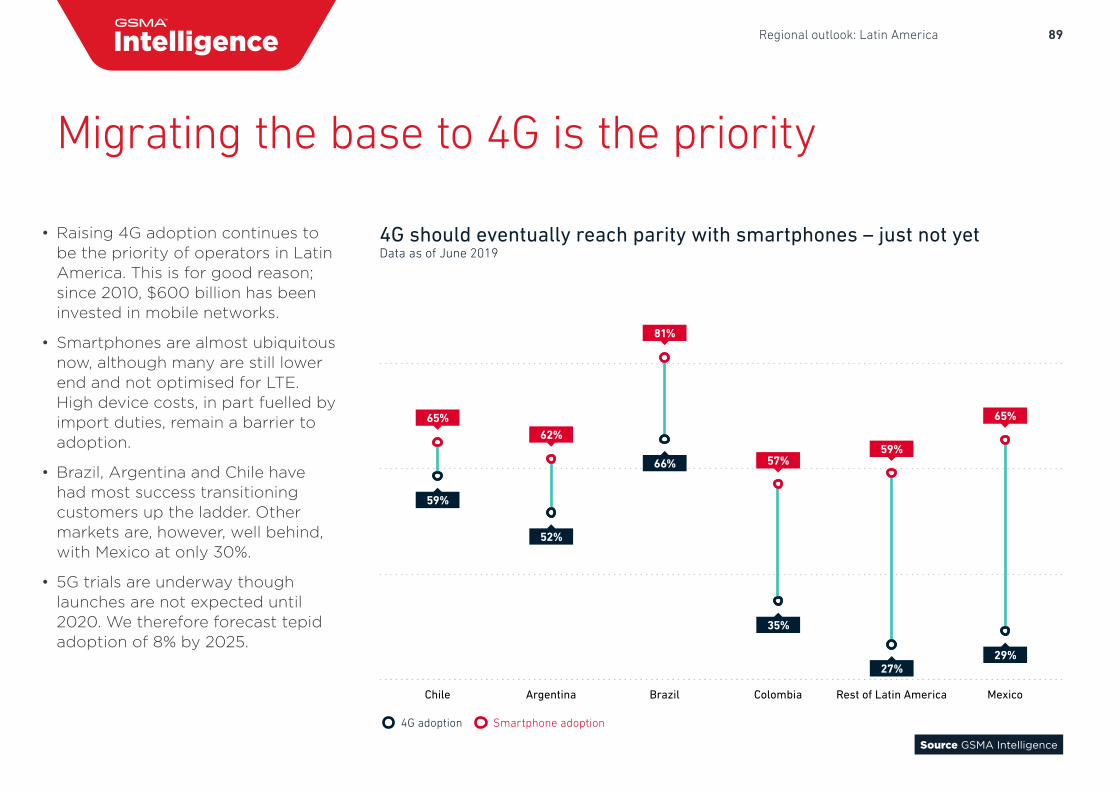
89Regional outlook: Latin America
4G adoption Smartphone adoption
MexicoRest of Latin AmericaColombiaBrazilArgentinaChile
65%
59%
52%
66%
35%
27%29%
62%
81%
57%59%
65%
Source GSMA Intelligence
4G should eventually reach parity with smartphones – just not yetData as of June 2019
Migrating the base to 4G is the priority
• Raising 4G adoption continues to be the priority of operators in Latin America. This is for good reason; since 2010, $600 billion has been invested in mobile networks.
• Smartphones are almost ubiquitous now, although many are still lower end and not optimised for LTE. High device costs, in part fuelled by import duties, remain a barrier to adoption.
• Brazil, Argentina and Chile have had most success transitioning customers up the ladder. Other markets are, however, well behind, with Mexico at only 30%.
• 5G trials are underway though launches are not expected until 2020. We therefore forecast tepid adoption of 8% by 2025.
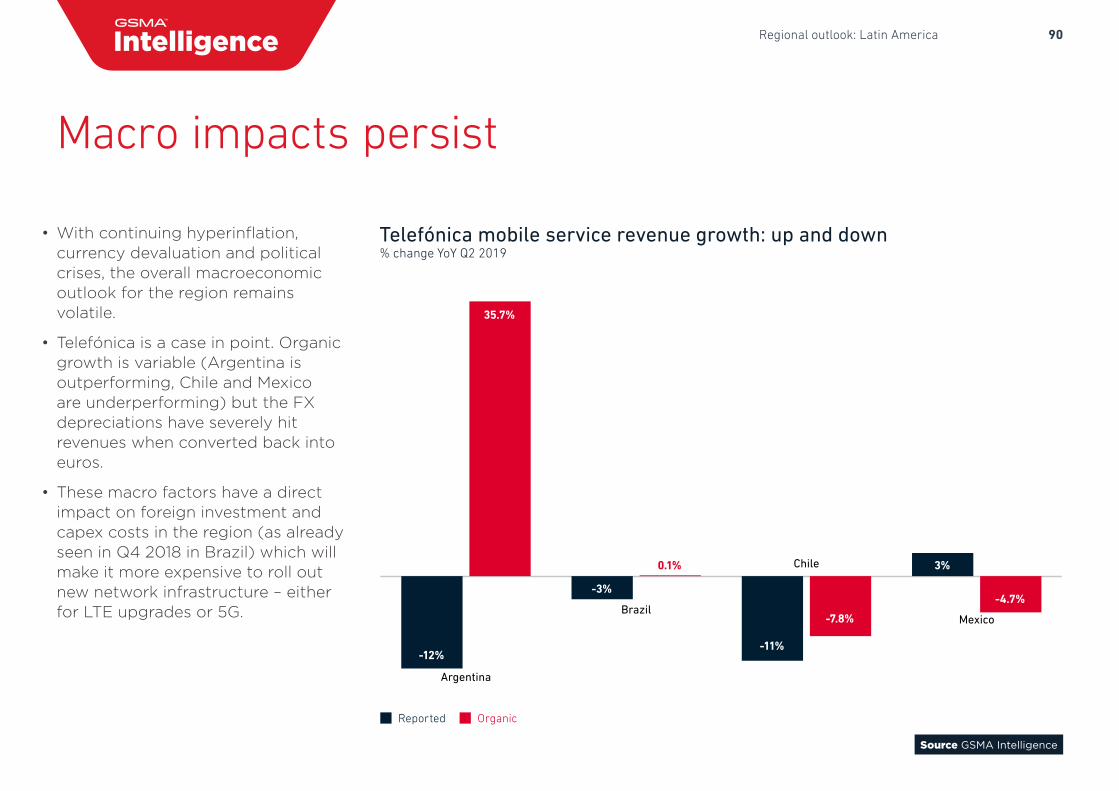
90Regional outlook: Latin America
Reported Organic
-0.15-0.10-0.050.000.050.100.150.200.250.300.350.40
Mexico
Chile
Brazil
Argentina
3%
-11%
-3%
-12%
-4.7%
-7.8%
0.1%
35.7%
Source GSMA Intelligence
Telefónica mobile service revenue growth: up and down% change YoY Q2 2019
Macro impacts persist
• With continuing hyperinflation,currency devaluation and political crises, the overall macroeconomic outlook for the region remainsvolatile.
• Telefónica is a case in point. Organic growth is variable (Argentina is outperforming, Chile and Mexico are underperforming) but the FX depreciations have severely hit revenues when converted back into euros.
• These macro factors have a direct impact on foreign investment and capex costs in the region (as already seen in Q4 2018 in Brazil) which will make it more expensive to roll out new network infrastructure – either for LTE upgrades or 5G.
Two line slide title
• Bullet
• Bullet
Fig titleUnits etc.
Source Source
91Regional outlook: Latin America
gsmaintelligence.com @GSMAiAuthors
Peter JarichHead of GSMA Intelligence
Tim Hatt Head of Research
Nuno Afonso Lead Analyst
Kalvin Bahia Principal Economist
David George Head of Consulting
Mark Giles Director of Ecosystem Data
Anshu Goel Senior Analyst
Pablo Iacopino Director of Ecosystem Research
James Joiner Analyst
Sylwia Kechiche Principal Analyst
Kenechi Okeleke Senior Manager
Christina Patsioura Senior Analyst
James Robinson Lead Analyst
Armita Satari Analyst
Jan Stryjak Senior Manager
Yiru Zhong Lead Analyst