
GLOBAL INVESTMENT TRENDS AND PROSPECTS · 2019-06-06 · 1. Global trends Global foreign direct...
32
CHAPTER I GLOBAL INVESTMENT TRENDS AND PROSPECTS
Transcript of GLOBAL INVESTMENT TRENDS AND PROSPECTS · 2019-06-06 · 1. Global trends Global foreign direct...
CHAPTER I
GLOBAL INVESTMENT TRENDS AND PROSPECTS

1. Global trends
Global foreign direct investment (FDI) flows continued their slide in 2018, falling by 13 per cent to $1.3 trillion from a revised $1.5 trillion in 2017 (figure I.1).1 The decline – the third consecutive fall in FDI – was mainly due to large repatriations of accumulated foreign earnings by United States multinational enterprises (MNEs) in the first two quarters of 2018, following tax reforms introduced at the end of 2017, and insufficient compensation from upward trends in the second half of the year.
The fall took place despite an 18 per cent rise in cross-border merger and acquisitions (M&As) (from $694 billion in 2017 to $816 billion in 2018). The negative trend is also in contrast to a 41 per cent jump in announced greenfield investment values (from $698 billion to $981 billion).
FDI flows declined sharply in developed countries and economies in transition while those to developing countries remained stable, rising by 2 per cent. As a result, developing economies accounted for a growing share of global FDI, at 54 per cent, from 46 per cent in 2017.
Repatriations of United States multinationals’ foreign earnings abated in the second half of 2018. The lifting of tax liabilities on accumulated foreign earnings of United States MNEs may have contributed to the M&A boom recorded in the last quarter, limiting the global FDI decline for the year, after projections based on the first six months had estimated that annual inflows would be down by more than 40 per cent.
A. CURRENT FDI TRENDS
FDI in�ows, global and by economic group, 2007–2018 (Billions of dollars and per cent)Figure I.1.
0
500
1 000
1 500
2 000
2 500
2007 2008 2009 2010 2011 2012 2013 2014 2015 2016 2017 2018
Developed economies
World total
Transition economies
Developing economies
34-28%
557-27%
$1297-13%
54% 706+2%
Source: UNCTAD, FDI/MNE database (www.unctad.org/fdistatistics).
2 World Investment Report 2019 Special Economic Zones

Even disregarding the fluctuations caused by the tax reform and the increase in cross-border M&As, the underlying FDI trend – which discounts the volatility caused by one-off transactions and swings in intra-firm financial flows – was still negative. Average annual growth in the underlying trend, which was above 10 per cent until a decade ago, has since stagnated at less than 1 per cent. That weak underlying trend will continue to affect FDI prospects (see section I.B.)
2. Trends by geography
a. FDI inflows
FDI flows to developed economies reached their lowest point since 2004, declining by 27 per cent (figure I.2). Flows to Europe more than halved to $172 billion while those to North America were more resilient, declining by 4 per cent to $291 billion. Although cross-border M&A deal making remained active, rising by 21 per cent in value, it was not enough to compensate for the negative outward FDI from the United States caused by the tax reforms.
In Europe, a few important host countries, such as Ireland and Switzerland, registered negative inflows of -$66 billion and -$87 billion, respectively. FDI flows to the United Kingdom also declined, by 36 per cent to $64 billion, as new equity investments halved. Despite the repatriations, the completion of a number of megadeals resulted in higher flows to the Netherlands (up 20 per cent to $70 billion) and Spain (where inflows doubled to $44 billion).
In the United States, FDI inflows declined by 9 per cent, to $252 billion, mainly due to a fall of one third in cross-border M&A sales. Australia’s FDI inflows reached $60 billion – a record level – as foreign affiliates reinvested a record $25 billion of their profits in the country.
FDI flows to developing economies remained stable, rising by 2 per cent to $706 billion, with significant differences among regions. Developing Asia and Africa recorded higher FDI inflows in 2018, while FDI contracted in Latin America and the Caribbean.
Developing Asia, already the largest recipient region of FDI flows, registered an FDI rise of 4 per cent to $512 billion in 2018, with positive growth occurring in all subregions. China, the largest developing-economy FDI recipient, attracted $139 billion, an increase of 4 per cent. Flows to South-East Asia rose – for the third consecutive year – by 3 per cent to a new record level ($149 billion).
FDI flows to Africa expanded by 11 per cent to $46 billion, still below the annual average of the last 10 years (at about $50 billion). The rise in flows was mainly due to the continuation of resource-seeking investments, slowly expanding diversified Source: UNCTAD, FDI/MNE database (www.unctad.org/fdistatistics).
FDI in�ows, by region, 2017–2018(Billions of dollars and per cent)
Figure I.2.
20172018
World
Developedeconomies
Europe
North America
Developingeconomies
Africa
Asia
Transitioneconomies
Latin America andthe Caribbean
Per cent
1 297
557
172
291
706
46
147
512
34
1 497
759
384
302
691
41
155
493
48
+4
-13
-27
-55
-4
+2
+11
-6
-28
Chapter I Global Investment Trends and Prospects 3
investments in a few economies, and a more than doubling of FDI flows to South Africa (from $2 billion to $5.3 billion).
FDI in Latin America and the Caribbean was 6 per cent lower ($147 billion) in 2018, failing to maintain momentum after the 2017 increase (which followed five years of negative growth). In South America, FDI declined due to lower flows to Brazil and Colombia; in Central America inflows remained stable.
After a plunge in 2017, FDI flows to transition economies continued their downward trend in 2018, declining by 28 per cent to $34 billion. The contraction was driven by a halving of flows to the Russian Federation, by far the biggest economy and largest FDI recipient in the group, from $26 billion to $13 billion. Part of the decline was due to re-domiciliation of overseas entities that hold assets in the Russian Federation.
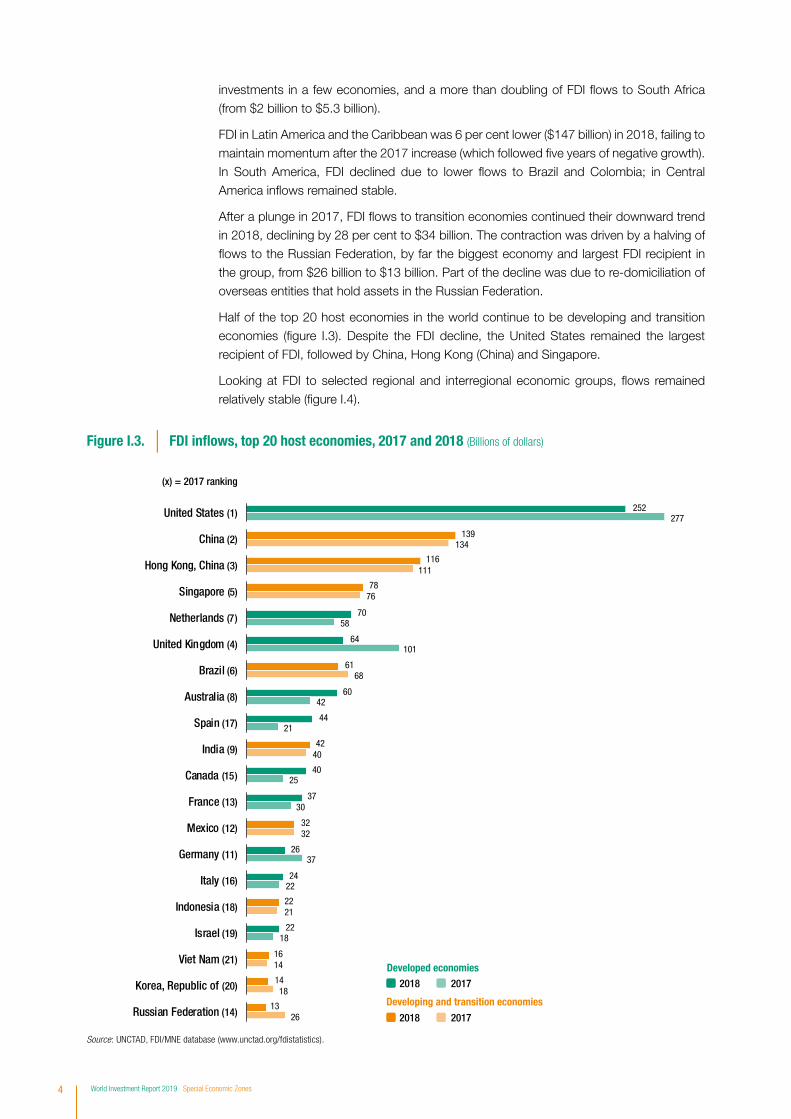
Half of the top 20 host economies in the world continue to be developing and transition economies (figure I.3). Despite the FDI decline, the United States remained the largest recipient of FDI, followed by China, Hong Kong (China) and Singapore.
Looking at FDI to selected regional and interregional economic groups, flows remained relatively stable (figure I.4).
Source: UNCTAD, FDI/MNE database (www.unctad.org/fdistatistics).
252
139
116
78
70
64
61
60
44
42
40
37
32
26
24
22
22
16
14
13
277
134
111
76
58
101
68
42
21
40
25
30
32
37
22
21
18
14
18
26
United States (1)
China (2)
Hong Kong, China (3)
Singapore (5)
Netherlands (7)
United Kingdom (4)
Brazil (6)
Australia (8)
Spain (17)
India (9)
Canada (15)
France (13)
Mexico (12)
Germany (11)
Italy (16)
Indonesia (18)
Israel (19)
Viet Nam (21)
Korea, Republic of (20)
Russian Federation (14)
FDI in�ows, top 20 host economies, 2017 and 2018 (Billions of dollars)Figure I.3.
Developed economies
Developing and transition economies
20172018
20172018
(x) = 2017 ranking
4 World Investment Report 2019 Special Economic Zones

b. FDI outflows
In 2018, MNEs from developed countries reduced their investments abroad by 40 per cent to $558 billion. As a result, their share in global outward FDI dropped to 55 per cent – the lowest ever recorded (figure I.5). The significant decline was less a reflection of real investment intentions than of the impact of the large-scale repatriations of accumulated foreign earnings by United States MNEs, which resulted in negative outflows. In the first half of 2018, the reinvested earnings of United States MNEs slumped by a net $367 billion and turned sharply negative, at -$200 billion, compared with a positive $168 billion in the same period in 2017. Although reinvested earnings in the second half of the year reverted to a positive value, FDI outflows from the United States for the full year still declined sharply, to -$64 billion, compared with $300 billion in 2017. In addition to the immediate repatriation effect, the tax reforms resolved the tax liability overhang on overseas assets, which may have contributed to a jump in cross-border M&A purchases by United States MNEs to $253 billion – a record high. Almost half of those purchases were registered in the fourth quarter of 2018. The majority of acquisitions took place in the EU, mainly in the United Kingdom and Germany, but also in India and Japan.
Outflows from European MNEs rose by 11 per cent to $418 billion. French MNEs invested more than 100 billion in 2018, all in equity investment, becoming the third largest investor country in the world. Outflows from Ireland and Switzerland, both of which had recorded negative outflows in 2017, turned positive, reaching $13 billion (up $52 billion) and $27 billion (up $62 billion) respectively.
In contrast, outflows from the United Kingdom declined to $50 billion from $118 billion in 2017 despite a significant rise in cross-border M&As. Investment from German MNEs also declined by 16 per cent to $77 billion. Although the value of their net M&A purchases more
Source: UNCTAD, FDI/MNE database (www.unctad.org/fdistatistics).
Note: Data for G20 do not include the European Union.
871
839
333
323
261
39
909
830
334
334
270
36
61 18 359
55 17 157
22 6 571
22 9 408
18 3 086
2 758
56
53
20
29
9
2
78
60
14
28
23
2
67 17 957
65 16 876
26 6 558
25 8 844
20 3 234
3 760
56
52
20
27
10
2
78
60
14
28
24
2
FDI in�ows to selected groups, 2017 and 2018 (Billions of dollars and per cent)Figure I.4.
2018 2017
FDI in�owsInward
FDI stockShare in worldFDI in�ows (%)
Share in worldinward FDI stock (%)
G20
APEC
USMCA
Commonwealth
BRICS
ACP
Selected groups Share of world
GDP (%)
Chapter I Global Investment Trends and Prospects 5

than doubled to $73 billion due to the merger of Bayer with Monsanto (United States) for $57 billion – the largest deal in 2018 – large negative flows of intracompany loans netted out much of the increase in equity investment.
Japanese MNEs became the largest investors in the world, despite a decline in outward FDI of 11 per cent to $143 billion. The slow-down in the overall M&A activity of Japanese MNEs was the result of a 40 per cent decline in their outward FDI in developed countries, mainly in the United States but also in the United Kingdom. Their investment in Asia increased by 31 per cent to $49 billion, mainly in China, India and the Republic of Korea.
Outward investment by MNEs from developing economies declined by 10 per cent to $418 billion. Outflows from developing Asia fell by 3 per cent to $401 billion. Investment from Chinese MNEs declined for the second consecutive year – by 18 per cent – to $130 billion, as a result of government policies to curb overseas investment, as well as increased screening of inward investment in the United States and Europe. The country, nonetheless, was the second largest investor in the world after Japan (figure I.6).
Outward FDI from West Asia reached a historic high of $49 billion in 2018, with MNEs from Saudi Arabia, the United Arab Emirates and Turkey mainly responsible for the increase. FDI from Saudi Arabia almost tripled to $21 billion, mainly in technology, finance and infrastructure activities. Turkish companies are increasingly investing in Africa.
Outward investment by Latin American MNEs plunged in 2018 to a record low of $7 billion, heavily influenced by negative outflows from Brazil and decreased investments from Chile. Outflows from Brazil fell to -$13 billion, as foreign affiliates continued funneling financial resources (often raised in overseas capital markets) back to their parents. MNEs from Mexico increased their outward FDI to $6.9 billion.
At $38 billion, FDI outflows from transition economies were unchanged in 2018. The Russian Federation accounts for the bulk of the outward FDI in this group (95 per cent). The country’s outflows rose by 7 per cent to $36 billion, driven mainly by reinvested earnings and the extension of intracompany loans to established affiliates.
Figure I.5. Developed economies: FDI out�ows, and share in world out�ows, 2005−2018 (Billions of dollars and per cent)
Value of out�ows Share in world out�ows
0
200
400
600
800
1 000
1 200
1 400
1 600
1 800
2 000
2005 2006 2007 2008 2009 2010 2011 2012 2013 2014 2015 2016 2017 2018
Value Share
0
10
20
30
40
50
60
70
80
90
Source: UNCTAD, FDI/MNE database (www.unctad.org/fdistatistics).
6 World Investment Report 2019 Special Economic Zones

3. Trends in cross-border M&As and greenfield projects by sector
In 2018, the values of net cross-border M&As and announced FDI greenfield projects increased (figure I.7). The value of net cross-border M&As rose 18 per cent to $816 billion, recovering ground after the 22 per cent fall in 2017. The increase was driven by large deal sizes, especially in the chemicals industry and the services sector, while the number of deals actually declined.
The value of announced greenfield projects rose by 41 per cent to $981 billion. Also here, the average project size was the main driver of the increase, as investment activity measured by the number of projects increased by only 7 per cent. The gains in value were mostly in extractive and processing industries, and in construction.
a. M&A trends
The value of global net M&As expressed as a percentage of FDI inflows reached 62 per cent, the highest level since the height of the dotcom boom in 2000. In developed economies,
143
130
102
85
77
59
50
50
39
37
36
32
27
217
21
20
18
18
15
13
160
158
41
87
92
28
80
118
34
44
34
40
-35
26
23
12
17
14
-39
FDI out�ows, top 20 home economies, 2017 and 2018 (Billions of dollars)Figure I.6.
(x) = 2017 ranking
Developed economies
Developing and transition economies
20172018
20172018
Japan (2)
China (3)
France (9)
Hong Kong, China (6)
Germany (5)
Netherlands (14)
Canada (7)
United Kingdom (4)
Korea, Republic of (13)
Singapore (8)
Russian Federation (12)
Spain (10)
Switzerland (156)
Saudi Arabia (28)
Italy (15)
Sweden (17)
Taiwan Province of China (21)
Thailand (18)
United Arab Emirates (20)
Ireland (157)
Source: UNCTAD, FDI/MNE database (www.unctad.org/fdistatistics).
Chapter I Global Investment Trends and Prospects 7

net M&A sales rose by 21 per cent to $689 billion, 84 per cent of the global total. In developing and transition economies, net M&A sales remained steady at $127 billion.
The increase was driven mainly by a doubling of acquisitions by United States MNEs, with the jump concentrated in the second half of 2018. The removal of tax liabilities on accumulated retained earnings overseas following the 2017 tax reforms may have contributed to the boom. Domestic M&A activity in the United States grew at an even faster pace than cross-border M&As.
In the primary sector, the largest deal was the acquisition of the oil and gas producer Maersk Olie og Gas (Denmark) by Total (France) for $7.4 billion as part of continued restructuring in the sector.
In manufacturing, net M&A sales at the global level remained close to the 2017 level. Deal making in the pharmaceutical industry, which reached $113 billion in 2015, declined for the third successive year to $28 billion. The chemical industry made up for the decline through megadeals, as M&A sales more than doubled to $149 billion. They included the merger of Bayer (Germany) with Monsanto (United States), worth $57 billion, and that of Praxair (United States) with the industrial gases group Linde (Germany), worth $32 billion.
In services, net M&A sales rose by over one third to $469 billion. The main driver was the increase in value of M&As in the financial industry, which almost doubled to $108 billion. Within this industry, M&As involving real estate investment trusts were particularly numerous. Separately, net M&A sales in real estate activities (part of business activities in table I.1) were worth $57 billion in 2018. Real estate-related investments thus formed a sizeable part of cross-border M&As in 2018. Almost all the deals in real estate investment trusts and three quarters of the deals in real estate targeted assets in developed economies.
b. Greenfield investment trends
The global total value of announced greenfield projects in the primary sector doubled to $41 billion (table I.2), mostly due to projects in metals mining, which trebled in value to $20 billion in 2018, the highest level since 2011. Karo Resources (Cyprus) announced a
Source: UNCTAD, cross-border M&A database (www.unctad.org/fdistatistics) and information from the Financial Times Ltd, fDi Markets (www.fDimarkets.com) for announced greenfield projects.
17 567
6 821
0
2 000
4 000
6 000
8 000
10 000
12 000
14 000
16 000
18 000
Value and number of net cross-border M&As and announced green�eld FDI projects, 2009–2018 (Billions of dollars and numbers)
Figure I.7.
981
816
0
200
400
600
800
1 000
1 200
1 400
2018
18%
41%
2018
7%
-2%
2009 2010 2011 2012 2013 2014 2015 2016 2017 2009 2010 2011 2012 2013 2014 2015 2016 2017
Number of net cross-border M&A deals
Number of announced FDI green�eld projectsValue of announced FDI green�eld projects
Value of net cross-border M&As
a. Value b. Number
8 World Investment Report 2019 Special Economic Zones

project worth $4.3 billion in a platinum mine in Zimbabwe, supported by the Africa Finance Corporation. Large projects were also announced in Chile and Peru.
Announced greenfield projects in manufacturing increased by 35 per cent to $466 billion. In line with higher investments in extractive industries, the processing of natural resources was a big driver of the increased investment in manufacturing. Projects in coke, petroleum products and nuclear fuel increased six-fold to $86 billlion. A project by Shell Canada, a joint venture of Shell, Petronas, PetroChina, Mitsubishi Corp. and Korea Gas, to build a liquefied natural gas export facility in Canada was the largest project, with planned capital expenditures totalling $30 billion.
Table I.1. Value and number of net cross-border M&As, by sector and selected industries, 2017–2018
Value (Billions of dollars) Growth rate
NumberGrowth rate
Sector/industry 2017 2018 (%) 2017 2018 (%)
Total 694 816 18 6 967 6 821 -2Primary 24 39 60 550 406 -26
Manufacturing 327 307 -6 1 690 1 600 -5
Services 343 469 37 4 727 4 815 2
Top 10 industries in value terms:Chemicals and chemical products 65 149 129 198 211 7
Business activities 107 112 5 1 817 1 848 2
Financial and insurance activities 59 108 84 617 599 -3
Information and communication 39 90 131 611 612 0.2
Food, beverages and tobacco 88 55 -37 227 205 -10
Transportation and storage 23 47 109 306 269 -12
Electrical and electronic equipment 26 42 65 307 257 -16
Mining, quarrying and petroleum 23 38 70 466 329 -29
Electricity, gas and water 54 38 -30 171 191 12
Trade 12 35 188 486 501 3
Source: UNCTAD, cross-border M&A database (www.unctad.org/fdistatistics).
Table I.2. Value and number of announced FDI green� eld projects, by sector and selected industries, 2017–2018
Value (Billions of dollars) Growth rate
NumberGrowth rate
Sector/industry 2017 2018 (%) 2017 2018 (%)
Total 698 981 41 16 350 17 567 7Primary 21 41 101 83 122 47
Manufacturing 345 466 35 7 855 8 049 2
Services 332 473 43 8 412 9 396 12
Top 10 industries in value terms:Construction 61 113 84 279 475 70
Electricity, gas and water 90 111 23 302 429 42
Coke and refi ned petroleum products 15 86 480 75 87 16
Business services 61 78 28 4 419 4 686 6
Motor vehicles and other transport equipment 61 74 20 1 123 1 131 1
Chemicals and chemical products 54 66 21 588 569 -3
Electrical and electronic equipment 60 58 -3 996 1 046 5
Hotels and restaurants 17 49 189 163 422 159
Transport, storage and communications 39 48 24 936 1 018 9
Mining, quarrying and petroleum 20 41 102 79 118 49
Source: UNCTAD, based on information from the Financial Times Ltd, fDi Markets (www.fDimarkets.com).
Chapter I Global Investment Trends and Prospects 9

In developing economies, the value of announced projects in manufacturing – of critical importance for industrial development – rose by 68 per cent to $271 billion, halting the downward trend of recent years (figure I.8). However, projects remained concentrated in Asia, where announced greenfield investments in manufacturing doubled to $212 billion. In a positive sign, manufacturing investments also jumped 60 per cent in Africa, to $33 billion. However, those in Latin America and the Caribbean declined.
The number of manufacturing projects in developing countries rose by a more modest 12 per cent, suggesting that announcements of relatively few large-scale projects explain the increase in value. For instance, the five largest manufacturing projects in China had a combined value of $33 billion, accounting for much of the value of announced projects in China, which doubled from 2017 to $80 billion. The largest announced project was the plan by BASF (Germany) to invest $10 billion in a new chemical manufacturing base in Zhanjiang. In the same industry, ExxonMobil (United States) announced plans to build a $7 billion ethylene plant in Zhoushan.
In East Asia, the largest increases in greenfield projects were in higher-skilled industries. In addition to the mega projects in the chemicals industry, a series of projects in automotive manufacturing as well as in electrical and electronic equipment boosted the value of announced projects in China. In East Asia as a whole, the value of projects in the chemicals industry trebled to $24 billion, that in electrical and electronic equipment rose by half to $25 billion, and that in motor vehicles and other transport equipment also trebled to $25 billion.
The processing of natural resources was a key part of the upturn in West Asia and South-East Asia and, to a lesser extent, South Asia. In Saudi Arabia, for example, Total (France) signed a memorandum of understanding with Saudi Aramco to develop a petrochemical complex in Jubail in a project worth $9 billion. In India, CPC (Taiwan Province of China) announced its plan to invest $6.6 billion in a petrochemical project in Paradip. As a result, projects in this industry almost quadrupled to $25 billion in West Asia, those in South Asia
Latin America andthe Caribbean
0
20
40
60
80
100
120
140
160
180
200
220
Figure I.8. Value of announced FDI green�eld projects in manufacturing, 2005–2018(Billions of dollars and per cent)
Africa
2005–2014 2015–2017 2018
84%
Natural resources-related industriesHigher-skill industries Lower-skill industries
2005–2014 2015–2017 2018
-16%
Asia
2005–2014 2015–2017 2018
70%
Source: UNCTAD, based on information from the Financial Times Ltd, fDi Markets (www.fDimarkets.com).
Note: Natural resources-related industries include (i) coke, petroleum products and nuclear fuel; (ii) metals and metal products; (iii) non-metallic mineral products; and (iv) wood and wood products. Lower-skill industries include (i) food, beverages and tobacco and (ii) textiles, clothing and leather; higher-skill industries include all other manufacturing industries.
10 World Investment Report 2019 Special Economic Zones

increased to $8 billion. In South-East Asia, metal processing attracted investment, more than doubling the value of announced projects to $12 billion from the value in 2017.
In contrast to the higher-skill and natural resource-related industries, the trend in announced projects in lower-skill industries was generally lacklustre, not only in Asia but also in other developing regions. While the value of projects in food, beverages and tobacco in developing economies rose by 29 per cent to $16 billion, those in textiles declined by 36 per cent to $7 billion. For low-income countries, especially in Africa, the decline in projects in typical early-industrialization industries is a concern. The need for developing countries to attract more FDI in these industries to support their structural transformation remains urgent, explaining the proliferation of industrial policies (WIR18) and special economic zones (SEZs; see chapter IV).
The global total of announced greenfield projects in services rose by 43 per cent to $473 billion. There were large increases in both construction and power generation. Projects in construction rose by 84 per cent to $113 billion. Projects in industrial building were subdued after the 2008 economic crisis, but there has been a revival since the mid-2010s. Some of these projects are related to the construction of SEZs. For instance, in 2015, Thailand-based Rojana Industrial Park, a subsidiary of Nippon Steel and Sumikin Bussan (Japan), announced the project to develop the Dawei Special Economic Zone in Myanmar. In 2016, Wei Yu Engineering (Taiwan Province of China) announced plans to invest $2.5 billion in the Vung Ang Economic Zone in Viet Nam to construct docks with logistics areas and agricultural areas. In 2018, the textile manufacturer Shandong Ruyi Technology (China) announced its project to invest $830 million to establish a textile industrial zone in the Suez Canal Economic Zone in Egypt.
Greenfield projects in power generation rose by 23 per cent in 2018, to $110 billion, accounting for almost all projects in utilities. Whereas total investment, including domestic investment, in power generation is only slowly reducing its reliance on fossil fuels, international investment through greenfield FDI is focused predominantly on renewable energy. In the past decade, the value of greenfield projects in renewable electricity exceeded that of fossil fuel-based electricity generation every year. In 2018, announced capital expenditures in renewable electricity totalled $78 billion and in fossil fuel-based electricity only $27 billion (see chapter II.C). The positive trend in international greenfield investment in this sector should be put in context. In developing economies, announced greenfield capital expenditures on power generation projects (all types) came to $70 billion. This compares with an annual investment gap of over $500 billion to achieve the United Nations SDGs, as estimated in WIR14.
4. FDI and other cross-border capital flows
The decline in global FDI flows was in line with the trend in other cross-border capital flows. Together FDI, portfolio flows and other investment (mostly bank loans) amounted to $5 trillion, or 5.9 per cent of global GDP in 2018, a decline of more than 20 per cent from 2017 (figure I.9).
Figure I.9. Global cross-border capital �ows, 2014–2018 (Per cent of GDP)
FDI Portfolio investment Other investment(mainly bank loans)
2014
2015
2016 2017 2018
2.4
3.5
1.6
4.1
2.0
-0.9
3.2
1.0
1.7
2.3
3.4
2.3
2.0
1.9
2.0
Source: UNCTAD, based on IMF World Economic Outlook Database.
Note: The percentages presented here are based on available data from 187 economies. The IMF World Economic Outlook database tracks FDI flows measured according to the asset/liability principle. Hence, the value of FDI flows is not directly comparable with UNCTAD’s FDI data presented elsewhere in this report.
Chapter I Global Investment Trends and Prospects 11

While all three categories of capital flows fell, the decline was the largest in portfolio investment (down 40 per cent). Portfolio flows are closely linked to financial market performance, as well as interest rate and currency movements. They are also more sensitive to geopolitical tensions and country-specific political uncertainty.
Developing economies received just over one third of global cross-border capital flows. Compared with flows to developed economies, which declined by 27 per cent, flows to developing economies were more resilient, declining by only 8 per cent, because FDI – the more stable type of finance – represents a larger share of their capital inflows. Portfolio inflows and other investment in developing economies declined by 30 per cent and 14 per cent, respectively. Declines in portfolio flows were particularly large in Latin America and in West Asia. Policy uncertainty and currency instability in major regional recipients of portfolio flows, including Argentina, Mexico and Turkey, contributed to the declines. In those countries, too, FDI inflows proved more stable and actually increased in 2018 (chapter II).
The size and relative stability of FDI makes it the most importance source of external finance for developing economies (figure I.10). Preliminary data for official development assistance (ODA) (bilateral and multilateral) show an increase of 1.5 per cent to $149 billion. Preliminary data for remittances show an increase of 9.6 per cent to $529 billion.
However, capital flows to developing economies remain concentrated in a relatively small number of countries. Asia receives three quarters of capital flows to developing economies. Portfolio investment and other investment flows are even more skewed towards that region. The least developed countries (LDCs), with a combined population of 1 billion, receive just 3 per cent of those cross-border capital flows. For these countries, remittances remain substantially higher than FDI. They increased by 11 per cent to $40 billion in 2018, compared with FDI inflows worth $24 billion.
Developing economies: sources of external �nance, 2009–2018(Billions of dollars)
Figure I.10.
-400
-200
0
200
400
600
800
FDI (directional)
Portfolio investment
Other investment
ODA
Remittances
2009 2010 2011 2012 2013 2014 2015 2016 2017 2018
Source: UNCTAD, based on KNOMAD (for remittances), UNCTAD (for FDI), IMF World Economic Dataset (for portfolio investment and other investment) and OECD (for ODA).
Note: Remittances and ODA are approximated by flows to low- and middle-income countries, as grouped by the World Bank.
12 World Investment Report 2019 Special Economic Zones

Global investment is expected to see a modest recovery of 10 per cent in 2019. This expectation is based on current forecasts for a number of macroeconomic indicators, UNCTAD’s econometric forecasting model of FDI inflows and its underlying trend analysis, and preliminary 2019 data for cross-border M&As and announced greenfield projects. It is complemented by UNCTAD’s survey of investment promotion agencies (IPAs).
1. Short-term prospects
Projections for FDI in 2019 point to a 10 per cent increase to almost $1.5 trillion – still below the average of the last 10 years. The main factor driving up expectations is the likely rebound from anomalously low levels of FDI in developed countries in 2018. Following the subsiding of repatriations of foreign earnings of United States multinationals in the second half of 2018, developed-country inflows are likely to revert to prior levels, implying a significant jump in some countries that normally receive sizeable inflows. The expected increase of FDI flows in 2019 is also apparent in the 41 per cent jump in greenfield project announcements (planned expenditures) from their low levels in 2017.
Despite these upward-pointing signs the size of the expected increase in FDI is relatively limited because the long-term underlying FDI trend remains weak (section I.B.2). M&A data for the first four months of 2019 confirm the need for caution; the value of cross-border M&As was about $180 billion, 10 per cent lower than the same period in 2018.
The likelihood of an increase in global FDI is further tempered by a series of risk factors. Geopolitical risks, trade tensions and concerns about a shift towards more protectionist policies could have a negative impact on FDI in 2019. Moreover, longer-term forecasts for macroeconomic variables contain important downsides (table I.3).
The projected increase of FDI flows is highest in developed economies, with Europe expected to see an increase of more than 60 per cent (recovering but remaining at only about half of 2016 values) (table I.4). Flows to developing economies are expected to hold steady, with projections showing a marginal increase of about 5 per cent. Among developing regions, FDI in Africa is likely to increase by 15 per cent, in view of an expected acceleration of economic growth and advances in regional integration. Prospects for developing Asia are cautiously optimistic, especially in South-East Asia and South Asia, with flows rising
B. FDI PROSPECTS
Table I.3. Real growth rates of GDP and gross � xed capital formation (GFCF), 2016–2020 (Per cent)
Variable Region 2016 2017 2018 2019 2020
World 3.4 3.8 3.6 3.3 3.6
GDP growth rate Advanced economiesa 1.7 2.4 2.2 1.8 1.7
Emerging and developing economiesa 4.6 4.8 4.5 4.4 4.8
World 2.8 4.1 4.0 3.7 4.1
GFCF growth rate Advanced economiesa 2.0 3.8 3.1 2.5 2.4
Emerging and developing economiesa 3.3 4.3 4.6 4.5 5.3
Source: UNCTAD, based on IMF (2019).Note: GFCF = gross fi xed capital formation.a IMF’s classifi cations of advanced, emerging and developing economies are not the same as the United Nations’ classifi cations of developed and developing economies.
Chapter I Global Investment Trends and Prospects 13

slightly (by 5 per cent) thanks to a favourable economic outlook and improving investment climate. Flows to Latin America and the Caribbean are expected to remain relatively stable, with a projected decline of about 5 per cent, while in transition economies flows are likely to see a recovery in 2019, reaching $50 billion.
2. Long-term trends
The relatively modest increase in global FDI projected for 2019 is in line with the slow growth over recent years in the underlying trend. That trend – net of fluctuations driven by one-off factors such as tax reforms, megadeals and volatile financial flows included in FDI – has shown anemic growth since the global financial crisis (figure I.11). Key drivers for the long-term slowdown in FDI include policy, economic and business factors.
Policy factors. The gradual opening of emerging markets worldwide that spurred FDI growth until the late 2000s is no longer fueling FDI to the same extent. In the last few years, restrictions on foreign ownership, based on national security considerations or strategic technologies, have again been front of mind for policymakers (chapter III). Uncertainty over the development of the international policy frameworks for trade and investment is also not supporting investor confidence.
Economic factors. Declining rates of return on FDI are a key factor behind the long-term slowdown (table I.5). In 2018, the global rate of return on inward FDI was down to 6.8 per cent, from 8 per cent in 2010. Although rates of return remain higher on average in developing and transition economies, most regions have not escaped the erosion. In Africa, for example, return on investment dropped from 11.9 per cent in 2010 to 6.5 per cent in 2018.
Table I.4.FDI in� ows, projections, by group of economies and region, 2016–2018, and projections, 2019 (Billions of dollars and per cent)
Group of economies/regionProjections
2016 2017 2018 2019
World 1 919 1 497 1 297 1 370 to 1 500
Developed economies 1 198 759 557 640 to 720
Europe 612 384 172 330
North America 508 302 291 310
Developing economies 656 691 706 700 to 740
Africa 46 41 46 52
Asia 473 493 512 530
Latin America and the Caribbean 135 155 147 140
Transition economies 65 48 34 45 to 55
Memorandum: annual growth rate (per cent)
World -6 -22 -13 (5 to 15)
Developed economies -6 -37 -27 (15 to 30)
Europe -14 -37 -55 ~ 65
North America -1 -41 -4 ~ 5
Developing economies -10 5 2 (0 to 5)
Africa -18 -11 11 ~ 15
Asia -8 4 4 ~ 5
Latin America and the Caribbean -13 15 -6 ~ -5
Transition economies 78 -26 -28 (40 to 50)
Source: UNCTAD, FDI/MNE database (www.unctad.org/fdistatistics).Note: Percentages are rounded.
14 World Investment Report 2019 Special Economic Zones

Business factors. Structural changes in the nature of international production are also at work. The adoption of digital technologies in global supply chains across many industries is causing a shift towards intangibles and increasingly asset-light forms of international production, as reaching global markets and exploiting efficiencies from cross-border operations no longer requires heavy asset footprints (WIR17). The trend is visible in the divergence of key international production indicators – on a scale from tangible to intangible – with a substantially flat trend for FDI and trade in goods and much faster growth for both trade in services and international payments for intangibles (royalties and licensing fees) (figure I.12).
FDI in�ows and the underlying trend, 1990–2018 (Indexed, 2010 = 100)Figure I.11.
1990s: 21% Post-crisis: 1%
0
50
100
150
1990 2000 2008 2018
FDI underlying trend
FDI
2000–2007: 8%FDI underlying trend,
average annual growth rate
Source: UNCTAD, FDI/MNE database (www.unctad.org/fdistatistics); UNCTAD estimates.
Note: The FDI underlying trend is a composite index (incorporating balance of payments and other variables), constructed by removing the effect on FDI of fluctuations in M&As, intracompany loans and offshore financial flows through appropriate smoothing techniques.
Table I.5. Inward FDI rates of return, 2010–2018 (Per cent)
Region 2010 2011 2012 2013 2014 2015 2016 2017 2018
World 8.0 8.5 7.7 7.5 7.6 6.9 6.8 6.8 6.8
Developed economies 6.4 6.7 6.1 5.9 6.4 6.0 5.9 5.9 6.0
Developing economies 11.0 11.5 10.1 9.9 9.5 8.4 8.2 8.1 7.8
Africa 11.9 12.0 11.7 11.4 9.6 6.5 5.0 6.0 6.5
Latin America and the Caribbean 9.7 9.8 8.5 7.0 6.3 4.5 5.4 6.2 6.2
Asia 11.4 12.2 10.6 10.8 10.7 10.0 9.6 9.0 8.5
East and South-East Asia 12.5 13.4 11.6 11.9 11.8 11.1 10.4 9.9 9.4
South Asia 8.9 7.6 7.2 6.7 6.1 5.5 6.4 5.6 5.3
West Asia 6.0 6.8 5.6 5.5 5.0 4.7 4.8 3.5 3.4
Transition economies 12.1 14.8 14.6 13.2 13.2 9.0 10.2 11.6 12.4
Source: UNCTAD based on data from IMF Balance of Payments database.Note: Annual rates of return are measured as annual FDI income for year t divided by the average of the end-of-year FDI positions for years t and t - 1 at book values.
Chapter I Global Investment Trends and Prospects 15

3. IPAs’ expectations
Despite the third consecutive decrease in global FDI in 2018 and the weak underlying trend, UNCTAD’s survey of investment promotion agencies (IPAs) shows continued optimism on the part of IPAs. Their expectations for FDI flows into their own countries to 2021 remain high. However, expectations were more tempered at the global level (figure I.13). Only 45 per cent of respondents expect global FDI flows to increase, indicating that IPAs acknowledge the challenges of and competition for the attraction of FDI in the current global investment climate.
Comparing IPAs’ perceptions for global FDI prospects between 2016 and 2019 shows that expectations have been progressively less optimistic in every year of the survey (figure I.14).
IPAs rank the United States and China – in joint first place – as the most likely sources of foreign investment to their countries. Three large European economies – the United Kingdom, Germany and France – were considered the next most important sources of FDI. India and the United Arab Emirates, not traditionally in the top 20 outward investor countries, were also considered as among the top 10 most important sources of FDI for the 2019 to 2021 period.
IPAs in developed economies expect most investment to go to information and communications industries, followed by professional services, and finance and insurance. In developing and transition economies, IPAs expect more investment in agriculture, followed
Indicators of international production, tangible and intangible, 2010–2018 (Indexed, 2010 = 100)Figure I.12.
2010 2011 2012 2013 2014 2015 2016 2017 2018
FDI underlying trend
Trade in goods
Trade in services
Royalties and licensing fees
Tangible
Intangible
60
80
100
120
140
160
180
Source: UNCTAD.
IPAs’ expectations for changes in FDI, 2019–2021 (Percentage of respondents)
Figure I.13.
Decrease
No change
Increase
Globally For own country
12
12
76
30
25
45
Source: UNCTAD Investment Promotion Agencies Survey.
Note: The survey was conducted from February to April 2019. Results are based on information from 114 respondents.
16 World Investment Report 2019 Special Economic Zones

by food and beverages, and information and communication (figure I.15). More and more countries are looking to attract investment in digital technologies and innovation as key drivers of economic growth. The high ranking of the ICT sector for FDI prospects is also a reflection of the investment promotion efforts of IPAs in this sector. The selection of agriculture and food processing among the most promising sectors in developing and transition economies indicates that IPAs in those economies expect a significant share of FDI to remain connected to natural resources for the foreseeable future.
Figure I.14.IPAs expecting an increase in global FDI �ows, 2016–2019 (Per cent of respondents)
2019201820172016
455661
75
Source: UNCTAD Investment Promotion Agencies Surveys (2016–2019).
Note: Percentages reflect survey results of each year.
Source: Source: UNCTAD, Investment Promotion Agencies Survey.
IPAs’ selection of most promising industry for attracting FDI in their own economy, by region, 2018 (Per cent of respondents)
Figure I.15.
22
25
25
46
46
75
Real estate
Food and beverages
Manufacture of chemicals
Finance and insurance
Professional services
Information and communication
29
29
31
40
41
45
Mining
Construction
Accommodation and food services
Information and communication
Food and beverages
Agriculture
Developed economiesDeveloping and
transition economies
Chapter I Global Investment Trends and Prospects 17

1. Key indicators of international production
International production continues to expand. Estimated values for sales and value added of MNEs’ foreign affiliates rose in 2018 by 3 per cent and 8 per cent, respectively. Employment of foreign affiliates reached 76 million, at an annual growth rate of about 3 per cent (table I.6).
Relatively fast growth in value added, compared with sales, suggest that foreign affiliates of MNEs are able to extract increasing value from their operations. At the same time, more modest growth in employment appears to indicate a gradual shift in the distribution of value added between production factors towards capital rather than labour. This is consistent with the ongoing trend of international production shifting towards digital and intangible activity (see WIR17).
Intangibles also play an important role in the significant growth of foreign assets over the past decades. The trend towards asset-light operations documented in WIR17 and the increasing importance of non-equity modes of international operations (including licensing
C. INTERNATIONAL PRODUCTION
Table I.6. Selected indicators of FDI and international production, 2018 and selected years
ItemValue at current prices (Billions of dollars)
19902005–2007
(pre-crisis average)2015 2016 2017 2018
FDI infl ows 205 1 414 2 034 1 919 1 497 1 297FDI outfl ows 244 1 451 1 683 1 550 1 425 1 014FDI inward stock 2 196 14 475 26 313 28 243 32 624 32 272FDI outward stock 2 255 15 182 26 260 27 621 32 383 30 975Income on inward FDIa 82 1 028 1 513 1 553 1 691 1 799
Rate of return on inward FDI b 5.3 8.6 6.9 6.8 6.8 6.8Income on outward FDIa 128 1 102 1 476 1 478 1 661 1 792
Rate of return on outward FDI b 8.0 9.6 6.3 6.1 6.3 6.4Net cross-border M&As 98 729 735 887 694 816
Sales of foreign affi liates 7 136 24 621 26 019 25 649 26 580c 27 247c
Value added (product) of foreign affi liates 1 335 5 325 6 002 5 919 6 711c 7 257c
Total assets of foreign affi liates 6 202 50 747 91 261 95 540 104 915c 110 468c
Employment by foreign affi liates (thousands) 28 558 59 011 69 533 70 470 73 571c 75 897c
MemorandumGDPd 23 439 52 366 74 664 75 709 80 118 84 713Gross fi xed capital formationd 5 820 12 472 18 731 18 781 20 039 21 378Royalties and licence fee receipts 31 174 321 325 355 370
Source: UNCTAD.Note: Not included in this table are the value of worldwide sales by foreign affiliates associated with their parent firms through non-equity relationships and of the sales of the parent
firms themselves. Worldwide sales, gross product, total assets, exports and employment of foreign affiliates are estimated by extrapolating the worldwide data of foreign affiliates of MNEs from Australia, Austria, Belgium, Canada, Czechia, Finland, France, Germany, Greece, Israel, Italy, Japan, Latvia, Lithuania, Luxembourg, Portugal, Slovenia, Sweden, and the United States for sales; those from Czechia, France, Israel, Japan, Portugal, Slovenia, Sweden, and the United States for value-added (product); those from Austria, Germany, Japan and the United States for assets; and those from Australia, Austria, Belgium, Canada, Czechia, Finland, France, Germany, Italy, Japan, Latvia, Lithuania, Luxembourg, Macao (China), Portugal, Slovenia, Sweden, Switzerland, and the United States for employment, on the basis of three-year average shares of those countries in worldwide outward FDI stock.
a Based on data from 165 countries for income on inward FDI and 144 countries for income on outward FDI in 2018, in both cases representing more than 90 per cent of global inward and outward stocks.
b Calculated only for countries with both FDI income and stock data. c Data for 2017 and 2018 are estimated based on a fixed-effects panel regression of each variable against outward stock and a lagged dependent variable for the period 1980–2016.d Data from IMF (2019).
18 World Investment Report 2019 Special Economic Zones

and contract manufacturing) suggests that fixed assets are not the driver of this growth. The growth of total assets relative to sales over the last decade is in line with the trend in assets-to-sales ratios of the S&P500.
The rate of return on inward FDI generated by foreign affiliates in host economies remained at 6.8 per cent in 2018. After a pronounced gradual decline since 2010 it appears to have reached a plateau in the last three years, at 6.8 per cent of total FDI stock.
2. Internationalization trends of the largest MNEs
In 2018, seven companies entered the UNCTAD ranking of the top 100 MNEs. Three companies entered following cross-border mergers: Atlantia Spa (Italy), a construction company, which bought Spanish competitor Albertis; the new Linde Plc (United Kingdom), which emerged from the merger of two industrial gas companies, Praxair (United States) and Linde AG (Germany); and Takeda Pharmaceuticals (Japan), which acquired Shire Plc (Ireland). Four MNEs from developing countries entered the list: three Chinese State-owned MNEs (SO-MNEs), Chem China, State Grid and China MinMetals, and Tata Motors from India. Broadcom Inc exited the top 100 because of its decision to move its headquarters from Singapore to the United States, where most of its operations are based. A second MNE exited because of financial difficulties: HNA Group (China) entered a severe liquidity crisis in the second half of 2017 and has since shed more than $40 billion in assets as it tried to pay off debt accumulated during a spree of acquisitions in the preceding years. Other companies at the bottom of the ranking slid out as the threshold of foreign assets continued to increase.
The average level of internationalization of the top 100 MNEs (the ratio of foreign over domestic assets) decreased in 2018 (table I.7). This was caused by the new Chinese entries (with large domestic operations), by a number of mergers that boosted domestic operations, and by the divestment of foreign operations by a few MNEs.
The presence of technology companies in the top 100 MNEs from developing countries is increasing. New entries in 2017 included the electrical appliance manufacturer Midea Group (China), following three major acquisitions in 2016: the home appliances business of Toshiba (Japan), the German robotics company KUKA, and Eureka, a floorcare brand, from Electrolux (Sweden). During 2018, many semiconductor MNEs from emerging economies entered joint ventures or increased investment in production capacity, with some poised to enter the list next year (e.g. SK Hynix, ASE Technologies, TWC). SK Hynix (Republic of Korea) plans to invest almost $150 billion over the next 10 years into its semiconductor business to maintain its position as one of the world’s largest chipmakers. Also, last year, Advanced Semiconductor Engineering (Taiwan Province of China) and Siliconware Precision Industries formed a new holding company, as part of the consolidation in the global semiconductor industry.
The top 100 MNEs from developing and transition economies also saw the relative growth of their foreign operations slow, on average, although the absolute growth of their foreign sales, assets and employees remained significantly higher than that of the firms in the global top 100. For both top 100 groups, foreign sales are growing faster than foreign assets and employees, in line with the increasing importance of intangibles, asset-light operations and non-equity modes of international production.
Since 2010 the number of (non-automotive) industrial MNEs in the top 100 ranking has dropped by half, from 20 to 10 in 2018. Figure I.16 shows the acquisitions and divestments of top industrial corporations (excluding automotive firms, which saw little
Chapter I Global Investment Trends and Prospects 19

change) that were in the top 100 ranking in 2010, those that are still in the ranking (above the line) and those that dropped out (below the line).
The decline in the number of industrial MNEs in the ranking is only partly the result of the growing presence of technology and digital companies. It is also driven by the scaling-down of industrial conglomerates. Industrial MNEs disappearing from the top ranking or losing positions are often undergoing restructuring programmes to focus on their core business. Of those that left the ranking, ThyssenKrupp (Germany) – after a series of divestments – announced that it will spin off its lift business. Similarly, ABB (Switzerland) announced the sale of its power-grid division to Hitachi (Japan) in December.
Other industrial MNEs are still in the 2018 ranking, often as a result of M&As. Examples of mergers between traditional industrial companies include the new Linde Plc (United Kingdom), DowDuPont (United States) and LafargeHolcim (Switzerland). Others acquired major competitors: in 2018 Bayer Ag (Germany) purchased Monsanto (United States), and United Technologies Corp (United States) bought Rockwell Collins (United States). Post-merger moves to shed non-core businesses or to realize synergies could negatively affect the ranking in the top 100 of these companies. For example, United Technologies already announced it will split into three companies, with the aviation business remaining the largest. Similarly, DowDuPont (merged in 2017) is splitting this year into three more focused companies. LafargeHolcim (merged in 2015) has already sold its business in Indonesia and plans to sell assets in South-East Asia for $2 billion over the next five years.
The downsizing of industrial MNEs appears to be a general trend. For example, Siemens (Germany) floated its medical equipment business to attract investors for businesses outside its core industrial engineering operations, and it separated its wind power operations. In 2018, Siemens announced that it will spin off its gas and power operations into an independent company to be listed next year. The most dramatic restructuring is
Table I.7.Internationalization statistics of the top 100 non-� nancial MNEs, global and from developing and transition economies, 2016 and 2017 (Billions of dollars, thousands of employees and per cent)
VariableGlobal top 100 MNEs
Top 100 MNEs from developing and transition economies
2016a 2017a 2016–2017 Change (%)
2018b 2017–2018 Change (%)
2016a 2017 Change (%)
Assets (billions of dollars)
Foreign 8 337 8 996 7.9 9 231 2.8 1 895 2 119 11.8
Domestic 4 894 5 538 13.2 6 262 14.8 5 100 5 613 10.1
Total 13 231 14 534 9.8 15 492 7.2 6 995 7 732 10.5
Foreign as share of total (%) 63 62 -1.1 60 -2.3 27 27 0.3
Sales (billions of dollars)
Foreign 4 765 5 200 9.1 5 587 8.1 1 535 1 897 23.6
Domestic 2 737 2 817 2.9 3 790 35.5 2 066 2 537 22.8
Total 7 502 8 017 6.9 9 377 18.1 3 601 4 433 23.1
Foreign as share of total (%) 64 65 1.3 60 -5.3 43 43 0.2
Employment (thousands)
Foreign 9 535 9 662 1.3 9 611 0.8 4 618 4 521 -2.1
Domestic 6 920 7 037 1.7 7 876 13.8 8 622 8 652 0.4
Total 16 455 16 699 1.5 17 488 6.3 13 240 13 174 -0.5
Foreign as share of total (%) 58 58 -0.1 55 -2.9 35 34 -0.6
Source: UNCTAD.Note: Data refer to fi scal year results reported between 1 April of the base year and 31 March of the following year. Complete 2018 data for the top 100 MNEs from developing and
transition economies are not yet available.a Revised resultsb Preliminary results
20 World Investment Report 2019 Special Economic Zones

represented by General Electric (United States), which was at the top of the ranking for many years and is now sliding down the list following a series of divestments totalling more than $120 billion at the end of 2018. These divestments started in 2016 with its financial services division, which until then provided about half of the group’s profits, and will ultimately reduce the company’s sectors of operation from more than 10 to just two: aviation and power.
The shedding of non-core businesses by industrial conglomerates in the top 100 has also been the result of pressure from shareholders. Conglomerates’ shares are no longer commanding a premium as in the past but are trading at a discount. Active hedge fund managers have been playing a key role behind the trend, as in the case of Cevian pushing for the break-up of ThyssenKrupp, and ABB and Third Point influencing United Technologies.
In 2018, top global companies invested more than $350 billion in R&D, representing over a third of business-funded R&D worldwide. The top 100 list includes global leaders
Source: UNCTAD, based on information from Refinitiv Eikon.
Note: The figure lists non-automotive industrial firms in the 2010 ranking of the global top 100 MNEs. Firms above the line are still in the 2019 ranking. In 2010, in place of the three merged companies there were either one company (Dow Chemical, Linde AG) or two (Lafarge and Holcim). Caterpillar Inc (United States) and ABB Ltd (Switzerland) exited the ranking despite acquisitions as these were either domestic or not large enough to stay above the threshold level of foreign assets for the top 100 list.
Top industrial MNEs’ total divestments and investments (foreign and domestic), cumulative 2010–2018 (Billions of dollars)
Figure I.16.
General Electric Co
Bayer AG
United Technologies Corp
Johnson Controls International Plc
Siemens AG
Air Liquide International SA
Cie de Saint-Gobain SA
DowDuPont (since 2017)
LafargeHolcim (since 2015)
Linde PLC (since 2018)
Hewlett Packard Enterprise Co
Alstom SA
Ferrovial SA
ThyssenKrupp AG
Cemex SAB de CV
Koninklijke Philips NV
Caterpillar Inc
ABB Ltd
BAE Systems Plc
-30 0 30 60 90 120
OUT
INMerged MNEs
Divestments Acquisitions
-120
Chapter I Global Investment Trends and Prospects 21
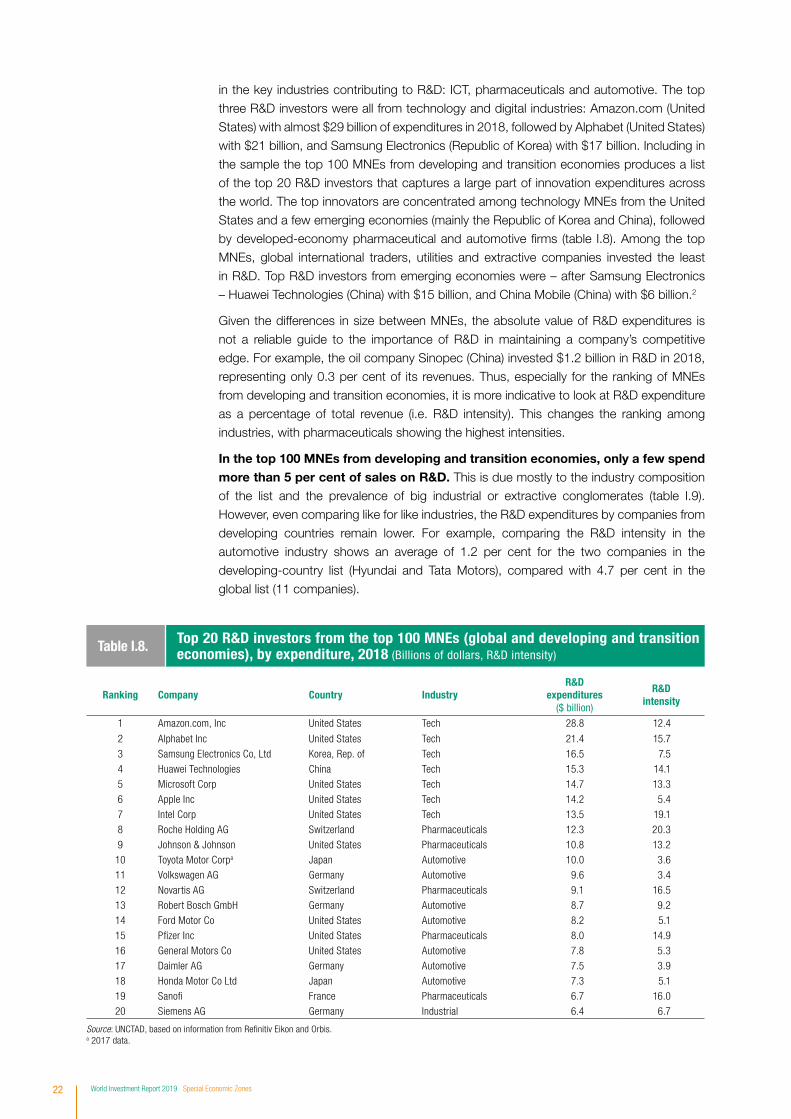
in the key industries contributing to R&D: ICT, pharmaceuticals and automotive. The top three R&D investors were all from technology and digital industries: Amazon.com (United States) with almost $29 billion of expenditures in 2018, followed by Alphabet (United States) with $21 billion, and Samsung Electronics (Republic of Korea) with $17 billion. Including in the sample the top 100 MNEs from developing and transition economies produces a list of the top 20 R&D investors that captures a large part of innovation expenditures across the world. The top innovators are concentrated among technology MNEs from the United States and a few emerging economies (mainly the Republic of Korea and China), followed by developed-economy pharmaceutical and automotive firms (table I.8). Among the top MNEs, global international traders, utilities and extractive companies invested the least in R&D. Top R&D investors from emerging economies were – after Samsung Electronics – Huawei Technologies (China) with $15 billion, and China Mobile (China) with $6 billion.2
Given the differences in size between MNEs, the absolute value of R&D expenditures is not a reliable guide to the importance of R&D in maintaining a company’s competitive edge. For example, the oil company Sinopec (China) invested $1.2 billion in R&D in 2018, representing only 0.3 per cent of its revenues. Thus, especially for the ranking of MNEs from developing and transition economies, it is more indicative to look at R&D expenditure as a percentage of total revenue (i.e. R&D intensity). This changes the ranking among industries, with pharmaceuticals showing the highest intensities.
In the top 100 MNEs from developing and transition economies, only a few spend more than 5 per cent of sales on R&D. This is due mostly to the industry composition of the list and the prevalence of big industrial or extractive conglomerates (table I.9). However, even comparing like for like industries, the R&D expenditures by companies from developing countries remain lower. For example, comparing the R&D intensity in the automotive industry shows an average of 1.2 per cent for the two companies in the developing-country list (Hyundai and Tata Motors), compared with 4.7 per cent in the global list (11 companies).
Ranking Company Country IndustryR&D
expenditures ($ billion)
R&D intensity
1 Amazon.com, Inc United States Tech 28.8 12.4
2 Alphabet Inc United States Tech 21.4 15.7
3 Samsung Electronics Co, Ltd Korea, Rep. of Tech 16.5 7.5
4 Huawei Technologies China Tech 15.3 14.1
5 Microsoft Corp United States Tech 14.7 13.3
6 Apple Inc United States Tech 14.2 5.4
7 Intel Corp United States Tech 13.5 19.1
8 Roche Holding AG Switzerland Pharmaceuticals 12.3 20.3
9 Johnson & Johnson United States Pharmaceuticals 10.8 13.2
10 Toyota Motor Corpa Japan Automotive 10.0 3.6
11 Volkswagen AG Germany Automotive 9.6 3.4
12 Novartis AG Switzerland Pharmaceuticals 9.1 16.5
13 Robert Bosch GmbH Germany Automotive 8.7 9.2
14 Ford Motor Co United States Automotive 8.2 5.1
15 Pfi zer Inc United States Pharmaceuticals 8.0 14.9
16 General Motors Co United States Automotive 7.8 5.3
17 Daimler AG Germany Automotive 7.5 3.9
18 Honda Motor Co Ltd Japan Automotive 7.3 5.1
19 Sanofi France Pharmaceuticals 6.7 16.0
20 Siemens AG Germany Industrial 6.4 6.7
Source: UNCTAD, based on information from Refi nitiv Eikon and Orbis.a 2017 data.
Table I.8. Top 20 R&D investors from the top 100 MNEs (global and developing and transition economies), by expenditure, 2018 (Billions of dollars, R&D intensity)
22 World Investment Report 2019 Special Economic Zones

FDI in R&D activities is growing. MNEs establish R&D activities abroad to locate close to markets, to access pools of skilled resources, or to cluster near knowledge centres. R&D-related greenfield investment projects are significant in number and growing. During the last five years 5,300 R&D projects were announced, representing about 6 per cent of all investment projects, and up from 4,000 in the previous five years. For pharmaceutical companies, R&D-related projects can account for as much as 17 per cent of all greenfield projects (figure I.17). Software and IT services follow, with about 15 per cent of their greenfield projects related to R&D.
Ranking Company Country Industry R&D expenditures R&D intensity1 Huawei China Tech 15 300 14.1
2 United Microelectronics Corp Taiwan Province of China Tech 424 8.5
3 Samsung Electronics Co, Ltd Korea, Rep. of Tech 16 451 7.5
4 Tencent Holdings Ltd China Tech 3 465 7.3
5 China Mobile Ltd China Telecom 6 421 5.9
6 SK Hynix Inc Korea, Rep. of Tech 2 047 5.6
7 Cheng Shin Rubber Industry Co, Ltd Taiwan Province of China Industrial 173 4.8
8 Advanced Semiconductor Engineering Inc Taiwan Province of China Tech 394 4.0
9 Midea Group Co Ltd China Tech 1 218 3.1
10 Lenovo Group Ltd China Tech 1 274 2.8
11 Qingdao Haier Co Ltd China Industrial 739 2.7
12 Oil and Natural Gas Corp Ltd India Extractives 1 236 2.2
13 POU Chen Corp Taiwan Province of China Industrial 203 2.1
14 China Communications Construction Co Ltd China Construction 1 457 2.0
15 Wistron Corp Taiwan Province of China Tech 469 1.6
Source: UNCTAD, based on information from Refi nitiv Eikon and Orbis.
Table I.9. Top 15 R&D investors among the top 100 MNEs from developing and transition economies, 2017 (Millions of dollars, R&D intensity)
R&D-related projects as a share of total announced projects, by industry, 2010–2018 (Per cent of projects)
Figure I.17.
17
15
14
11
9
6
6
5
5
4
3
2
Pharmaceutical
Software and IT services
Chemicals
Electrical and electronics
Automotive and aerospace
Average
Machinery and equipment
Food, beverages and tobacco
Rubber and plastic
Other manufacturing
Extractives
Services, non-tech
Source: UNCTAD, based on information from Financial Times Ltd fDi Markets, (www.fdimarkets.com).
Chapter I Global Investment Trends and Prospects 23

The majority of R&D-related FDI projects is in relatively lower value added design, development and testing activities, rather than basic research. These activities are also driving most of the growth in R&D projects abroad. Such projects may seek to access lower-cost skilled resources or to locate closer to markets where the research phase is aimed at adapting products to different consumer needs.
Developing and transition economies capture 45 per cent of all innovation-related FDI. Projects in developing Asia are transforming some economies, including Singapore, Hong Kong (China), India and Malaysia, into global hubs of applied research. The share of R&D projects directed towards other developing regions is smaller (figure I.18).
3. State-owned multinational enterprises
The total number of SO-MNEs3 is stable. The 2019 update of UNCTAD’s database of SO-MNEs includes close to 1,500 firms, as in 2017. Last year, three new SO-MNEs – ChemChina, State Grid of China and China Minmetals – entered the top 100 MNEs ranking, bringing the number of SO-MNEs in the top 100 to 16 in all, one more than in 2017. These SO-MNEs include five from China and 11 with developed-country shareholdings (table I.10).
Overall, about 10 per cent of companies in the database are new entrants. In the majority of cases, the new entrants are SO-MNEs from major emerging markets that have newly opened subsidiaries abroad. These have replaced an equal number of SO-MNEs that left the data set for various reasons:
• State ownership shrank below 10 per cent. An example is the French utilities company Veolia Environment.
• The SO-MNE dissolved or went bankrupt. Examples include Italian terminal services company Alitalia Servizi and Russian aircraft company Oboronprom.
• The SO-MNE merged or was taken over by other companies. For example, CPFL Energia from Brazil was acquired by another SO-MNE, State Grid of China. Another
Source: UNCTAD, based on Financial Times Ltd, fDi Markets (www.fdimarkets.com).
Figure I.18. R&D-related announced green�eld FDI projects, by type and region,cumulative 2010–2018 (Number and per cent)
136 169
Developedcountries
Africa DevelopingAsia
Latin Americaand the Caribbean
Transitioneconomies
Design, development and testing R&D Share of R&D projects in total
6 2 7 4 3
3 992
767
18
2 537
404
424
7938
24 World Investment Report 2019 Special Economic Zones

Ranking in WIR19
Ranking in WIR17 Company Home economy Industry
6 (6) Volkswagen Group Germany Motor vehicles
18 (18) Enel SpA Italy Electricity, gas and water
28 (27) Deutsche Telekom AG Germany Telecommunication
30 (33) EDF SA France Electricity, gas and water
32 (23) Eni SpA Italy Petroleum refi ning and related industries
40 (81) China COSCO Shipping Corp Ltd China Transport and storage
42 (54) Nippon Telegraph & Telephone Corp Japan Telecommunication
50 (46) Airbus SE France Aircraft
51 (37) Engie France Electricity, gas and water
52 (52) Orange SA France Telecommunication
56 (44) China National Offshore Oil Corp (CNOOC) China Mining, quarrying and petroleum
59 (55) Equinor ASA Norway Petroleum refi ning and related industries
62 (..) State Grid Corp of China China Electricity, gas and water
67 (..) China National Chemical Corp (ChemChina) China Chemicals and allied products
69 (68) Renault SA France Motor vehicles
97 (..) China Minmetals Corp (CMC) China Metals and metal products
Source: UNCTAD.
Table I.10. SO-MNEs in the UNCTAD ranking of the top 100 MNEs, 2017 and 2019
Figure I.19. Distribution of SO-MNEs by ownership, governance and size, 2018 (Per cent)
Largemajority owned
Smallmajority owned
18 23
509
Minority Majority
OwnershipSize
Dire
ctIn
dire
ct
Gove
rnan
ce
Share of SO-MNEs
Other developingeconomies
24
492
431
11
35 26
7 10
Europe
Other developed economies
China
Transition economies
Source: UNCTAD.
Note: Majority-owned shares in voting rights greater than 50 per cent; minority includes golden shares; large have total assets over $5 billion.
example involves Tri-ring Group, a Chinese provincial SO-MNE, which was purchased by a private company, the Wuhan Kingold Industrial Group.
The resulting geographical distribution of SO-MNEs did not change significantly compared with that reported in WIR17. European SO-MNEs accounted for a little more than a third of all SO-MNEs, and another 45 per cent were in China and other developing Asian economies.
SO-MNEs vary considerably:
Ownership: The influence governments can exercise on companies varies significantly according to their shareholding, from minority participation (or golden share) to majority (or total ownership). Although it is possible for governments holding a minority stake or a golden
Chapter I Global Investment Trends and Prospects 25

share to exercise significant control over SOEs, their influence is felt more when they hold a majority shareholding; 73 per cent of SO-MNEs are majority owned (figure I.19).
Governance: State ownership can be exercised either directly through share ownership by the government, or indirectly when shares are held by State-owned entities such as sovereign wealth funds, government pension funds or central banks. Indirect participations are often smaller. In some cases, such as in Malaysia, Singapore and West Asian countries, sovereign wealth or investment funds can own majority participations. Some sovereign wealth funds, such as Norway’s Government Pension Fund Global, can be very influential even through minor shareholdings (Cuervo-Cazurra, 2018). Finally, State ownership is increasingly exercised through multiple shareholders, combining sovereign wealth funds, pension funds and other SOEs.
Size and transnationality: Many smaller SO-MNEs have few foreign affiliates, often in neighbouring countries, and their overseas presence remains stable over time. Large SO-MNEs have in recent years more actively invested and expanded abroad. The geographical distribution of SO-MNEs changes significantly depending on their size and on the level of participation held by the State. SO-MNEs from emerging economies are, on average, predominantly majority owned and large. The nine SO-MNEs in the top 100 with a minority State participation are all from developed countries. In Europe, many relatively small utility, transportation or bank SOEs – often owned at the subnational level – maintain a few affiliates in neighbouring countries due to the integrated nature of the region’s economies and small national territories. These SOEs account for almost half of majority-owned SO-MNEs with assets under $5 billion. In developed countries, many large SO-MNEs were (partially or fully) privatized in the 1990s. As a result, SO-MNEs in developed economies are split among small but majority-held SO-MNEs and a few large but minority-controlled SO-MNEs.
SO-MNEs’ M&A activity is slowing down. Until 2012, the growth in cross-border deals was in line with the growth in the number of SO-MNEs, with increasing numbers of emerging-markets SO-MNEs internationalizing their operations (figure I.20). In the last five years, however, cross-border acquisitions from emerging markets have been on a downward trend, mostly due to increasing concerns about competition and foreign State ownership of
Figure I.20. Cross-border acquisitions by majority-owned SO-MNEs, number and share of total valueby home region, 1995–2018 (Number and per cent)
Developing and transition economiesDeveloped economies Combined share of value of total cross-border deals
0
50
100
150
200
250
0
5
10
15
20
25
1996 1998 2000 2002 2004 2006 2008 2010 2012 2014 2016 2018
Number Share
Source: UNCTAD, based on information from Refinitiv Eikon.
26 World Investment Report 2019 Special Economic Zones

domestic assets and mounting scrutiny of acquisitions, especially in the United States and Europe. (See also chapter III on investment measures related to national security.)
The number of SO-MNEs’ cross-border acquisitions has never accounted for more than 2 per cent of the total number of deals, but such deals are typically larger than the average value of international deals. The value of SO-MNEs’ cross-border acquisitions accounted for less than 7 per cent of the total in the last five years, down from almost 10 per cent between 2009 and 2013. The spike in 2009 was due to a general decline in all cross-border deals, but the spikes recorded in 2002, 2013 and 2017 are all explained by very large single transactions. In 2002, Swedish majority State-owned Telia AB merged with Finnish majority State-owned Sonera Corp to create a single telecommunication group worth $6.3 billion. In 2013, Russian oil company Rosneft purchased TNK-BP Ltd for $55 billion. And in 2017, Chinese chemical giant ChemChina purchased Swiss group Syngenta for almost $42 billion.
Over the 2010–2018 period, the highest numbers of acquisitions by SO-MNEs occurred in utilities, followed by the hydrocarbon and mining industries. These three industries together attracted almost half of all deals (figure I.21). Other attractive industries were financial services and real estate. High-technology industries, including both hardware providers and software and IT services, accounted for 5 per cent of the acquisitions. This industry breakdown largely holds across SO-MNE home regions, except in the mining industry, where SO-MNEs from emerging markets target foreign mining companies more often than SO-MNEs from developed economies do.
SO-MNEs’ cross-border acquisitions by industry, cumulative 2010–2018 (Per cent of all SO-MNE deals)
Figure I.21.
Primary
Secondary
Tertiary
13
11
5
4
3
2
2
2
1
5
20
11
9
4
2
7
Oil and gas
Mining
High technology
Food and beverages
Chemicals
Machinery
Pharmaceutical and health
Automotive
Aerospace and defence
Other secondary
Utilities
Financial services
Real estate
Telecommunication
Construction
Other services
Source: UNCTAD, based on information from Refinitiv Eikon.
Chapter I Global Investment Trends and Prospects 27
A new view on bilateral investment relationships. Bilateral FDI stock data from the balance of payments focus on direct investment relationships among countries. They provide a granular and detailed map of the relative positions of countries in the global investment network, showing where financial claims and liabilities are created and where they are held. (Bilateral FDI data are accessible at UNCTAD Stat.)
The direct investor perspective is significantly affected by financial centres and investment hubs, which play a systemic role in global FDI. An alternative view by ultimate investor reveals some key underlying patterns – where the investment decision is made, where the capital is originated, who bears the risks and reaps the benefits of the investment – that can be more relevant in the analysis of international production. In the special case of round-tripping, the ultimate investor perspective unveils the underlying domestic nature of a foreign direct investment.
UNCTAD has created a new database of bilateral investment positions by ultimate investors for more than 100 recipient countries, covering about 95 per cent of total FDI stock and including many developing countries (box I.1). In addition to its analytical value for mapping international production, a comprehensive picture of the global FDI network by ultimate investors can provide important policy insights. Such information can inform policy areas such as the coverage of international investment treaties, national policies to attract and facilitate foreign investment and ongoing efforts to reform the international tax system (WIR15 and WIR16).
UNCTAD FDI estimates by ultimate investing country (UIC) highlight the leading role of large industrial economies in global investment (table I.11). The rankings of bilateral FDI links based on UIC versus direct investors are considerably different: only two of the top 10 FDI links based on UIC appeared in the top 10 ranking based on direct investors in 2017. This difference highlights the prominent role that investment hubs now play as a tool for investors.
Comparing the current picture based on ultimate investors with the picture based on direct investors as of 2005 shows that the difference then was not as pronounced. That indicates that investors’ reliance on investment hubs to channel their FDI has become far more significant over the past decade. The discrepancy between the two rankings – by direct and by ultimate investor – could narrow over the next few years, however, as a result of initiatives to tackle tax avoidance.
Table I.11 reveals that cross-border investment from the United States to China is far more significant than direct investment data would suggest. Based on estimates by ultimate investors, FDI by United States MNEs in China features among the 10 largest bilateral investment stocks worldwide, accounting for some 10 per cent of total Chinese inward FDI. Yet according to official FDI data, that share is only 3 per cent, as much of the FDI from United States MNEs has been channeled through (mainly regional) investment hubs, including Singapore and Hong Kong (China). FDI estimates based on UICs thus provide a more accurate perspective on the bilateral investment relationship between the United States and China, as well as intra-firm trade between United States MNEs and their Chinese foreign affiliates.
D. THE GLOBAL FDI NETWORK
28 World Investment Report 2019 Special Economic Zones

The ultimate investor perspective, when applied to FDI from the European Union to the United Kingdom (relevant to the current discussion on Brexit), results in the opposite effect. The share of EU firms as ultimate investors in the United Kingdom remains sizeable at 33 per cent, but it is nonetheless lower than the 47 per cent measured by standard bilateral FDI data. Official data are affected by major investments hubs located within the EU, which channel FDI from UICs located elsewhere.
Regional integration. According to standard bilateral FDI data, cross-border investment within the same geographic region accounts for about half of total FDI stock (figure I.22). This share has been stable since 2005 (46 per cent of total stock in 2017, compared with 49 per cent in 2005). Such intraregional investment is particularly high in Europe and Asia, accounting for 81 and 47 per cent of these regions’ total inward FDI, respectively. In Africa, this share is only 10 per cent, similar to the ratio in Latin America and the Caribbean (11 per cent). The regional proportion of total GVC flows is also low in Africa, as well as in Latin America and the Caribbean (see WIR13, figure IV.10).4 Modest intraregional FDI and GVC flows in these regions suggest that regional economic cooperation initiatives still have significant potential to promote regional trade and investment links.
Yet the share of intraregional investment in global FDI decreases from 46 to 38 per cent when bilateral FDI is based on UICs. This illustrates the outsized role that regional investment hubs play in intraregional investment flow. For example, the Netherlands and Luxembourg in Europe, as well as Hong Kong (China) and Singapore in Asia, are often gateways for investment in the region. In Africa, Mauritius
Table I.11. Top 10 FDI links by ultimate investor, estimated bilateral inward stock, 2017
Bilateral FDI by ultimate investor (estimates) Bilateral FDI by direct investor (data)
Rank 2017 Investor Recipient Rank 2017 Rank 2005
1 United Kingdom United States 6 1
2 Hong Kong, China China 1 2
3 Japan United States 11 5
4 Canada United States 12 7
5 United States United Kingdom 15 3
6 Germany United States 20 6
7 United States Canada 18 4
8 Switzerland United States 21 12
9 France United States 27 13
10 United States China 30+ 30+
Source: Bilateral FDI by ultimate investing countries: UNCTAD estimates. Bilateral FDI by direct investing countries: UNCTAD bilateral FDI database (complemented by data on investment from and to special purpose entities).
Intraregional investment, bilateral inward stock, 2017 (Per cent of regional FDI in total FDI)
Figure I.22.
Total
Developed economies
Europe
North America
Developing economies
Asia
Africa
Latin America and the Caribbean
Transition economies
4638
5346
8167
1720
3624
4733
107
118
68
Direct investors Ultimate investors
Source: Bilateral FDI by ultimate investing countries: UNCTAD estimates. Bilateral FDI by direct investing countries: UNCTAD bilateral FDI database (complemented by data on investment from and to special purpose entities).
Chapter I Global Investment Trends and Prospects 29

Source: Bilateral FDI by ultimate investing countries: UNCTAD estimates. Bilateral FDI by direct investing countries: UNCTAD bilateral FDI database (complemented by data on investment from and to special purpose entities).
Investment in developing economies, bilateral inward stock, 2017 (Per cent)
Figure I.23.
4728
5371
1
By origin ofdirect investor
By origin ofultimate investor
Developing economies (South-South)
Developed economies
Transition economies
Source: Bilateral FDI by ultimate investing countries: UNCTAD estimates. Bilateral FDI by direct investing countries: UNCTAD bilateral FDI database (complemented by data on investment from and to special purpose entities).
Intraregional investment in selected economic groupings, share of inward stock, 2017 (Per cent)Figure I.24.
By direct investing country By ultimate investing country
9
24
AfCFTA
ASEAN
6
19
20USMCA 24
16CPTPP 17
plays the same regional hub role, although on a smaller scale.
In developed economies, the correction is relatively small (from 53 to 46 per cent), as the situations in North America and Europe balance each other. In Europe, regional hubs inflate intraregional FDI in official data. In North America, in contrast, FDI based on UICs reveals a stronger regionalization than in official data, highlighting that part of the investment between the United States and Canada is channeled through investment hubs. In developing countries, however, the correction is more significant: the share of intraregional investment drops from 36 per cent (based on official FDI data) to 24 per cent (according to UNCTAD’s estimates by ultimate investors). This
is mostly driven by developing Asia (from 47 to 33 per cent). In relative terms, however, the reduction is sizeable in Africa (from 10 to 7 per cent), as well as Latin America and the Caribbean (from 11 to 8 per cent). Transition economies, by contrast, register a higher proportion of intraregional investment when taking ultimate investors into account.
South–South FDI. Behind regional gateways to developing economies are often ultimate investors based in the developed world. The share of South–South investment in total investment to developing economies plummets from almost 50 per cent (when measured based on standard FDI data) to 28 per cent when based on UICs (figure I.23). Although the rise of investment in developing economies from other developing economies, such as China or India, is an important trend in the global investment landscape, FDI estimates by UICs reveal that it is nonetheless less significant than what official data indicate. As a result, South–South FDI is likely to take longer than expected to reshape the global production landscape. A thorough assessment of the investment links between developing economies is especially important in the year of the Buenos Aires Conference on South–South Cooperation.
The coverage of international investment agreements. The gap between immediate and ultimate investors generated by indirect FDI has implications for the coverage of international agreements and regional economic cooperation frameworks (see also WIR16). The share of investment covered by an agreement in the total inward investment to member countries may change significantly depending on the view (figure I.24). The UIC perspective highlights the multilateralizing effect of indirect FDI. For some treaties and economic groupings, such as the African Continental Free Trade Area (AfCTA) and the Association of Southeast Asian Nations (ASEAN), in which regional hubs (Mauritius and Singapore, respectively) have a relevant role, the share of direct investment covered by the
30 World Investment Report 2019 Special Economic Zones

treaties is higher than the share of investment by UICs. For others, the opposite is true: the treaty’s weight is more relevant under the ultimate investor perspective. This occurs when the agreement includes major industrial partners, as is the case of the United States–Mexico–Canada Agreement (USMCA) and the Comprehensive and Progressive Agreement for Trans-Pacific Partnership (CPTPP).
The large and growing divergence between bilateral FDI positions held by direct investors (as reported by standard bilateral FDI data) and by ultimate investors is one of the main issues affecting FDI statistics. According to 2016 FDI statistics reported by Germany, for example, Luxembourg and the Netherlands account for a combined 41 per cent of total bilateral inward FDI in Germany, and the United States for only 8 per cent. FDI positions by ultimate investors (reported by Germany and few other developed countries) radically modify this picture, however: the share of the United States rises to 21 per cent, and Luxembourg and the Netherlands combined make up only 14 per cent of German inward FDI stock. Similar differences apply to all other countries whose reported data allow direct comparison.
In this context, standard bilateral FDI data cannot properly uncover ultimate investor relations. The need for bilateral statistics by ultimate investors to complement standard bilateral FDI is now largely acknowledged by the international community (OECD Benchmark Definition of Foreign Direct Investment, edition 2008, page 110, item i). Nevertheless, progress in reporting FDI positions on the basis of ultimate investors has been slow; currently only 14 developed countries provide statistics by ultimate investors. Statistical and analytical efforts at the international level to bridge this gap are ongoing (Damgaard and Elkjaer, 2017; Borga and Caliandro, 2018).
UNCTAD’s probabilistic approach to estimating investment positions held by ultimate investors combines standard bilateral FDI data, available for a large set of countries, with appropriate assumptions on conduit FDI. This provides a transition rule to link final recipient countries to ultimate investors, effectively looking through conduit jurisdictions. More specifically, the distribution of FDI based on direct investing countries provides the overall exposure of recipient country X to direct investment from investor country Y; at the same time, assumptions on conduit FDI define whether direct investor Y is an intermediate or an ultimate investor. If investor Y qualifies as intermediate, the investment process iterates until an ultimate investor arises. Box figure I.1.1 illustrates the logic behind this approach. Framing the dynamics represented in the figure within the probabilistic setting of absorbing Markov chains makes it possible to analytically derive the distribution of ultimate investors. The final outcome of the UNCTAD approach is a novel bilateral matrix providing inward positions by ultimate counterparts for more than 100 recipient countries, covering about 95 per cent of total FDI stock and including many developing countries.
Source: UNCTAD.
Note: Full methodological details and an empirical validation can be found in the technical background paper on UNCTAD’s UIC data set, published as UNCTAD Insights in Transnational Corporations (Casella, 2019).
Box I.1. UNCTAD estimates of bilateral FDI by ultimate investing country
Investors
Recipients
Inve
stm
ent p
roce
ss
Reve
rsed
inve
stm
ent p
roce
ss
Step 0:
Step 1:
Step 2:
Step 3:
….
Final recipient
Ultimate investor
FDI (C, D)
FDI (D, E)
FDI (E, B)
B2 B1
B0
D2 D1
D0
E2 E1
E0
B0
B0
B
A0
A0
A0
A
C0
C0
C0
C
D0
D0
D
E0
E0
E
1-COND (B)
COND (D)
COND (E)
ConduitNon-conduit
FDI (X,Y) = share of Y in total direct investment into X
COND(X) = share of direct investment from X made by conduit entity
UNCTAD approach to search ultimate investors illustratedBox �gure I.1.1.
Source: UNCTAD.
Chapter I Global Investment Trends and Prospects 31
1 FDI data may differ from one WIR issue to another as data are continually revised, updated and corrected by relevant national authorities, such as central banks and statistical offices, which provide FDI data to UNCTAD.
2 Only about a third of the MNEs in the top 100 ranking from developing and transition economies reported R&D expenditures, as most of the State-owned MNEs from extractive or industrial sectors are private and do not report sufficient information in this context. These are, however, not top R&D investors.
3 State-owned MNEs are defined here as separate legal entities engaged in commercial activities, including FDI operations through foreign affiliates. In addition, a governmental entity should either own at least 10 per cent of the capital, be the largest shareholder, or hold a “golden share” – a type of share that gives the government special voting rights to block key strategic decisions, especially takeovers by other shareholders. Subnational entities in countries with federal governments but significant functions at the state level (e.g. German Länder, Republics as federal subjects in the Russian Federation, states in the United States) as well as municipalities are considered State owners.
4 The updated UNCTAD-Eora GVC database can be found at http://worldmrio.com/unctadgvc.
NOTES
32 World Investment Report 2019 Special Economic Zones


