Global Governance for Sustainable Development...source-intensive technologies and to enhance...
28
1 Author: Luca Molinas Institution: Università La Sapienza, Roma Address: Via del Castro Laurenziano, 9 E-mail: [email protected] Telephone: 0039/3285626084 12th EADI General Conference Global Governance for Sustainable Development The Need for Policy Coherence and New Partnerships To What Extent is Asian Capitalism Harmful for the Environment? The Neo-Malthusian Hypothesis Tested in the Case-Study of CO 2 Emissions in India
Transcript of Global Governance for Sustainable Development...source-intensive technologies and to enhance...
1
Author: Luca Molinas
Institution: Università La Sapienza, Roma
Address: Via del Castro Laurenziano, 9
E-mail: [email protected]
Telephone: 0039/3285626084
12th EADI General Conference
Global Governance for Sustainable Development
The Need for Policy Coherence
and New Partnerships
To What Extent is Asian Capitalism Harmful for the Environment?
The Neo-Malthusian Hypothesis Tested in the Case-Study of CO2 Emissions in India

2
Abstract
The depletion of global environmental resources is representing one of the most important common features
emerging when comparing the traditional western model of capitalism development and the new growing capi-
talist economies of Asia. Despite that, the western model of capitalism claims to be more “environmental
friendly” with respect to the new Asian model which is often blamed by western media and policy institutions
for its negative economic and demographic impact on the environment. This argument is largely debated in the
academic world, and it is known as Neo-Malthusian hypothesis.
Comparing trends and prospects of carbon emissions in the two capitalist models can lead to very interesting
outcomes and contribute to understand the pattern of capitalist growth in the emerging economies and to chal-
lenge the Neo-Malthusian argument. This is due to a number of reasons. First, carbon emissions are directly
connected with demographic pressure because population growth has a direct and indirect impact on the level of
emissions (Dyson 2005). Second, carbon emissions are a reliable indicator of capitalist growth (Bongaarts 1992).
Last, emissions can picture very effectively the process of depletion of environmental resources. This occurs
because they mostly take place as a consequence of the burning of fossil fuels (coal, oil, natural gas) for anthro-
pogenic activities. Fossil fuels are not renewable natural resources. From a western perspective, these criticisms
are especially addressed to the countries which are increasing their demand for fossil fuels in order to strengthen
their capitalist growth and accelerate their “catching up” process with the western model of production and con-
sumption.
Among the emerging economies in Asia, India stands in a reference position for testing the Neo-Malthusian
hypothesis. This is true for at least three reasons. The first is demographic. By 2030, India is expected to become
the most populated country in the Earth (UN projections 2004). This has a clear relevance in terms of demo-
graphic pressure on carbon dioxide emissions (both direct and indirect demand effect). The second is economic.
India represents an economy that is growing very rapidly and is expected to rely heavily upon fossil fuels. The
last reason refers to environmental policy. The joining to Asia Pacific Partnership for Clean Development and
Climate Change in 2005 and the recent Indo-US nuclear deal represent a clear step towards a domestic consensus
for the need for a new energy technology and a shift from high to low emission intensive energy sources.
The IPAT model represents one possible way to test the Neo-Malthusian hypothesis (Ehlrich, Holdren 1971) in
emerging economies such as India. This model has the advantage to be simple and intuitive and to express the
dynamics of the Neo-Malthusian framework by disaggregating the determinants of environmental impact (I) into
population growth (P), economic growth (A) and technology (T). Following a pessimistic approach, impact is
seen as a positive function of the three independent variables (P, A and T). In this paper, the I=PAT model is
applied to a concrete database relative to the projected trends of carbon emissions, population, GDP and GDP
carbon intensity in India in the period 2003-2030 (EIA figures).
The main argument of this paper is that the demographic variable will play a minor role in terms of environ-
mental impact and that the main concern for global environment will still be represented by the pattern of pro-
duction and consumption of the “old” western capitalist system. Economic growth and technology, but not popu-
lation, will result as the main factors leading to future global environmental detriment. The example of carbon
emissions in India will provide a link to connect empirical results to the theoretical Neo-Malthusian framework.

3
1. – THE POPULATION ENVIRONMENT DEVELOPMENT DEBATE
The basic neoclassical growth model assumes a trade-off between consumption of material
goods and number of children at household level (Barro, Sala-y-Martin 1994). When envi-
ronmental goods1 are introduced in the model, a trade-off between quality of the environment
and consumption is the result. The basic idea behind environmental economics models is the
concept of scarcity. When a resource is relatively scarce, its price is expected to go up (ac-
cording to the supply-demand law). This is an incentive for producers to substitute less re-
source-intensive technologies and to enhance technological progress. The price of environ-
mental goods in terms of financial assets is the so called “scarcity rent” (O’Neill 2001). This
“rent” should increase over time more than the financial interest rate (due to the fact that the
supply of environmental resources is limited by the nature), because if not, rent-owners would
withdraw immediately their stock of resources and invest the obtained value into more profit-
able financial assets. This logic makes obvious that a rational decision for the owner of a re-
source stock would be to conserve supplies for the future in order to keep the price high by
not introducing large amounts of resource on the marketplace (Pearce Turner 1999).
The neoclassical model also argues that the demand for environmental quality rises when
the income increases (Panayotou 1994). In other words, economic growth does not exert
downwards pressure on environmental resources because a higher income economy demands
more environmental protection. This is a consequence of the hypothesis of low elasticity to
income demand for primary products. This means that as consumers’ income goes up, they
will demand marginally less and less primary products (that are generally more connected to
environmental resources2) such as food. On the contrary, the demand for environmental pro-
tection and for preservation of scarce resources will go up. The preservation of scarce re-
sources introduces the neoclassical definition of “environmental sustainability”. This concept
is highly connected to the discount rate. The discount rate is typical of the cost-benefit models
and can be described as the rate to which the value of natural resources has to be multiplied to
verify their depletion across intergenerational transfer (Pearce, Turner 1999). Obviously, the
higher the discount rate is, the more the value of environmental goods has declined and,
hence, the less environmentally sustainable is the economy (O’Neill 2001). The basic conclu-
sion is that economic growth under perfect market conditions is not harmful for the preserva-
tion of the natural resources. Yet, a joint conclusion on the impact of population growth on
1 In these models, the environmental goods are considered both in terms of non-renewable resources and envi-
ronmental “loss” (Pearce, Turner 1999). 2 An example is that when agricultural goods demand decreases less deforestation is needed to gain new lands
4
environmental resources and economic development cannot be expressed. Indeed, Neoclassi-
cal frameworks study the relationship between population growth and environmental degrada-
tion by dividing the analysis into two different effects: the effect of population growth on
economic growth (seen above) and the effect of economic growth on the environment
(Panayotou 1994).
Let us refer to the role of population in environmental economics. The effect of population
growth is to increase the value of the “scarcity rent”. This induces a rise in the price of envi-
ronmental resources relative to the cost of labour. As a consequence, workers have to face a
lower salary whereas rent-owners experience an income rise. The income distribution is,
hence, more unequal driving to an increase in the number of poor individuals (because rent-
owners normally belong to high income groups) (O’Neill 2001).
According to this argument, population growth can enhance distortion in the marketplace
for environmental goods and lead to the misallocation of property rights. This is the reasoning
behind “The Tragedy of the Commons” (Hardin 1968).
However, as explained in the previous section, the impact of population growth on eco-
nomic growth is still controversial. Consequently, is not possible to find a unidirectional
causal nexus about the relationship between economic growth and environmental resources
(Livi Bacci 1999).
Yet, the neoclassical model population development environment model has some links
with the optimist perspective. One of these is international trade.
Panayotou (1994) makes four points about international trade considering it as a factor that
can offset the potentially detrimental impact of population growth. These points are: the im-
portance of trading scarce resources (ecological capital), the possibility of importing new
technologies (substitution argument), the specialization in less resource-intensive production
(basically Ricardo’s comparative advantages argument), and the trading of low pollution-
intensive or resource-intensive intermediate and final products.
To sum up, the main conclusion of the Neoclassical population-development-environment
model is that population does not exert a necessarily negative impact on resources. This is
true under the condition that neoclassical assumptions are verified (including efficient alloca-
tion of property rights for environmental resources, free trade and perfectly competitive mar-
kets). If some of these assumptions fall down, the results of the Neoclassical model change.
And this is exactly where the Neo-Malthusian hypothesis comes out claiming that there are
limits to technological progress and to economic growth and, so, population growth cannot be
offset and environmental degradation is inevitable.

5
The pessimistic view on the impact of population growth on economic and environmental
resources is largely based on the demographic idea of “carrying capacity”. Some scholars
(Daly 1992) see this concept as a factor that can exacerbate the scarcity of resources that
characterises the Earth. According to the biological definition, the “carrying capacity” refers
to the maximum number of individuals an environment can sustain (Zaba and Scoones, 1994)
without being depleted.
The point of saturation is reached when density-induce mortality rate equals fertility rate.
Any increase in the population beyond the limit of the “carrying capacity” is harmful to the
environment and to the preservation of natural resources. Several social scientists have ap-
plied the concept of “carrying capacity” to human populations and to the Earth. Cohen (1995)
has provided different estimates for the actual number of individuals that the Earth could sup-
port ranging from 4 to 16 billions. Other scholars, such as Guilland (1983) and Smil (1994),
have tried to give a measure of the “carrying capacity” in terms of resources such as energy
and food.
However, the main insight coming from the various studies is that the concept of “carrying
capacity” is not very useful to study human populations. Cohen and Postel (1994) justify this
criticism mentioning three main factors that can affect “carrying capacity” dimensions: values
(human choices), international trade of ecological capital, and migration.
Neo-Malthusians scholars, who believe that these factors will just help to delay the problem
of overpopulation but not to solve it, oppose this view. The Neo-Malthusian position consid-
ers still applicable the “carrying capacity” model to social sciences and, indeed, argues about
the catastrophic impacts for the environment and the economy caused by demographic in-
crease, especially in developing countries (O’Neill 2001). Neo-Malthusians have studied the
problem demographic increase proposed and models for the different outcomes that resulted
from their assumptions. The projected scenarios have mostly been alarmist and catastrophist.
One of the first to develop and study these concepts has been Elhrich (1968) in “The Popu-
lation Bomb” with a particular reference to famines. After that, the 1992 publication of “The
Limits to Growth” by the Club of Rome (Meadows Meadows) tried to model and test the hy-
pothesis of incompatibility between population growth, economic development and environ-
ment in quantitative terms. The obtained projections were extremely catastrophic, ranging
from overpopulation to collapse and exhaustion of non-renewable resources. The empirical
reality has turned out to be very different than the one foreseen by the Club of Rome. None of
their predictions turned out to be truth. Nevertheless, the Neo-Malthusian alarmism does not
seem to have lost its academic and political support. In the academic world, this is especially
6
true with reference to food issues. The argument of future food scarcity in developing coun-
tries is made by Lester Brown (1995)3. However, some authors have obtained different results
by projecting the endowments of food in developing countries and analysing the demographic
prospects (Dyson 1996). In the political world, the Neo-Malthusian hypothesis has been rede-
fined and improved and has arrived to represent a mainstream consensus in the agenda of sev-
eral international organizations (UNFPA 2001). Vicious circle models are part of this agenda
and can be considered as a way of reforming the Neo-Malthusian paradigm.
3 Lester Brown, president of the Earth Policy Institute.
7
2 - THE METHODOLOGY
2.1 - THE IPAT IDENTITY: MODELLING A NEOMALTHUSIAN FRAMEWORK
The IPAT model (1971) considers the environmental impact (I) as a dependent variable cor-
related to three different independent variables: population (P), affluence (A= economic
growth) and technology (T). As the authors intended it, the equation should have taken a
multiplicative structure I = P ×A ×T where the variable impact (I) is standing for a natural
resource consumption or a pollutant emission (O’Neill, MacKellar, Lutz, 2001). Affluence
(A) represents the effect of economic growth per capita (GDP per capita) and technology (T)
indicates the intensity of the impact over economic growth (basically the ratio of impact over
GDP).
The most important assumption of the model (and the most criticized one) is that variables
at the right-hand side of the equation are not correlated. This assumption, in a way, recalls the
earlier neoclassical one of no direct correlation between economic development and popula-
tion growth. The main advantage of considering such equation is that it explains environ-
mental impact with respect to more than one single variable. Additionally, this identity can be
easily used to evaluate the contribution of the demographic variable on the depletion of the
environment.
The IPAT model is also relevant for political issues. Indeed, obtained results can suggest
policy-makers which specific measures should be implemented in order to decrease the envi-
ronmental depletion rate in a country. In fact, just by changing any of the three variables on
the right side of the equation, the resulting environmental impact (I) can change significantly.
To this extent, social scientists can predict the results in the application of any energy policy,
economic policy and demographic policy as a tool to preserve the environment. Basically, it is
possible to adjust any variable at the right side of the equation and to set different scenarios
projecting the obtained results.
For instance, demographers have used this model to try to calculate the impact of population
(P) on different types of environmental variables (I), ranging from energy use (O’Neill 1995),
water consumption and fertilizer use (Harrison 1992).
Bongaarts (1992) was the first to apply the IPAT methodology considering the atmosphere
as a resource and CO2 emissions as a pollutant while analysing environmental impact. He also
proposed and adopted the decomposition methodology that allows to assign an additive rather

8
than multiplicative form to the equation. This idea contributes to simplify significantly the
model and allows to analyse the impact (I) in terms of expected growth rates across time.
2.2 - THE DECOMPOSITION METHOD
The methodology implemented by Bongaarts (1992) allows the author to decompose the
I=PAT identity into an equation such as I' = P' + A' + T' in which each variable is expressed in
terms of average annual growth rate.
The key advantage is represented by the possibility to standardize everything on the right
side of the equation in terms of the average annual impact growth rate (just by dividing P', A'
and T' by I'). In this way, it is possible to assess which of the three factors will have the great-
est percentage effect on impact (I) in a certain interval of time.
In his work, Bongaarts (1992) estimates the impact (I) in terms of CO2 emissions. The im-
pact (I) measure unit is assumed as millions of Tons of Carbon Dioxide Emissions while
population expressed in Millions and GDP per capita in Billions of US Dollars. The variable
technology is expressed as CO2 intensity, in other words, as Tons of Carbon Dioxide Emis-
sions necessary to produce 1 Dollar of GDP. Using EPA4 figures, he shows how about 50% of
the projected CO2 emissions growth rate between 1985 and 2025 is related to population. Fur-
ther, he extends his forecast to 2100 estimating that population growth will account for 35%
in the CO2 emissions growth.
Mackellar and Lutz (1995) apply the same decomposition methodology in order to compare
developing countries and developed countries in terms of variable P. This shows how the
IPAT model can be used in the field of development studies to include population, environ-
ment and economy in a single multidisciplinary analysis and to discuss the eventual results of
the projections made. For this reason the IPAT model has been used in several fields of social
science to produce projections and scenarios. However, it shall be highlighted that this meth-
odology is based on assumptions that are useful to simplify the model but that certainly intro-
duce limitations both from a conceptual and analytical point of view.
2.3 - CRITICISMS TO IPAT APPROACH
The criticisms to IPAT models follow two main directions. The first one (Mackellar, 1995)
relates to some conceptual aspects of the model such as the not realistic assumption of any
correlation existing between P, A and T. The relevance of the debate on the effects of popula-
4 US Environmental Protection Agency

9
tion growth on environment and development that we have discussed in Chapter 2 provides
evidence on how this assumption is a critical subject for the IPAT model.
The second direction is methodological. O’Neill (2001) reports some problems arising from
the application of IPAT models to empirical data sets considering the problems that may be
related to the decomposition methodology.
The first problem is the “offset” effect, which influences the model when one of the ex-
planatory variables has a strong projected decreasing trend. According to the authors “If one
of the variables on the right-hand side of the equation of the I=PAT formulation is shrinking
over the time period in question, it will offset the contribution of one of the growing variables,
and the third variable will be left apparently accounting for a very large proportion of total
environmental impact” (page 120).
In the case of Bongaarts (1992) the 35% increase in CO2 emissions due to population is ac-
tually ambiguous if compared to a 126% decrease in technology and 191% increase in afflu-
ence (GDP per capita).
The second point considered by the authors is the heterogeneity bias. The decomposition
may be biased in two ways. The first one is when population growth is associated with per
capita impact. In the case of carbon emissions it is possible to note that these are lower in the
areas of highest population growth. Once again, this can hinder a correct evaluation of the
contribution of demographic growth in the equation. Another source of bias can be noticed
when opposite effects are aggregated for different areas. That is, if a variable increases in a
region and falls in another one, the model “may appear to have undergone no change”
(O’Neill page 121).
It has also been argued that considering the additive form of the IPAT equation is correct for
continuous growth rates but not for discrete ones5. In the second case, according to O’Neill
(2001), one should also consider the interaction effects between all the three independent
variables.
Last, the use of annual average growth rates rather than absolute changes to describe envi-
ronmental change is controversial. Indeed, the use of growth rates has been heterogeneous and
various authors have provided different approaches in considering the time frame analysed.
Some authors, for instance, have tried to freeze the variable of interest to the initial level and
calculating the reduction in terms of impact (Bartiaux and VanYPersele, 1993).
5 Discrete growth rates the IPAT decomposition still represent a good approximation for relatively small val-
ues.

10
Additionally, projected IPAT scenarios often compare unrealistic situations. This is espe-
cially true for population growth. The demographic variable presents two orders of problems:
the first is how to take into account the population momentum (even a declining growth rate
can have an “absolute” effect due to momentum) and the second, is the choice of the demo-
graphic unit to be considered in the IPAT model. Empirical evidence applied to the case of
energy consumption presents very different results accordingly to whether individuals or
households are considered as demographic units for the IPAT projections (MacKellar, 1995).
This is due to the fact that some resources, such as energy, are characterised by economies of
scale in terms for consumption.

11
3 - CHALLENGING THE IPAT MODEL: THE FUTURE OF INDIAN ENVIRON-
MENTAL IMPACT
The aim of this section is to implement the IPAT methodology to a concrete scenario. The
actual reference scenario will see projected CO2 emissions in India between 2003 and 2030:
figures from EIA6. database will be used. The first part of this chapter will present a separate
study for the projected trends of each variable analysed in the period 2003-2030. India trends
will be also compared at an international level.
This approach will help to give an overview to the problem and to provide the growth rates
figures for the IPAT projections. To this extent, in the second part of this chapter I (??) EIA
figures will be elaborated and concrete contribution of each of the three independent variables
(P, A, T) will be calculated to project environmental impact variable (I) in terms of CO2 emis-
sions. The decomposition method, already recalled in Chapter 2, will be used.
3.1 – POPULATION
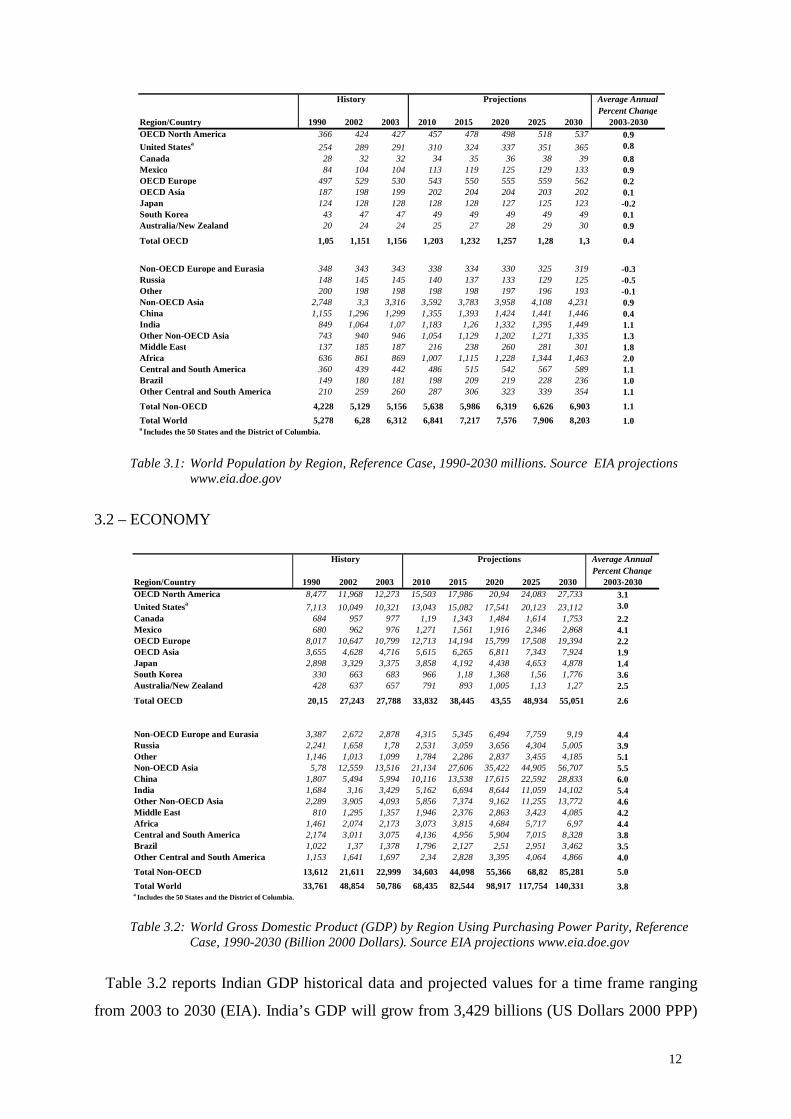
By 2030 India will become the most populated nation in the world. This is true according to
the UN Population Projections (2004) and to the World Bank Projections (2003). Table 3.1
reports the expected absolute demographic increase expected in India from 2003 to 2030
where population is expected to grow from about 1,070 billions in 2003 to 1,449 billions in
2030 (EIA 2006). The estimated average annual growth rate for population across the period
2003 ÷ 2030 is 1.1 percent. This is relevant if compared to other Non-OECD Asian countries
and it is much more significant than China that will actually start to decrease its population
size by 2037 (UN Projections, 2004). The demographic dimensions of India witness once
again the relevance of testing Neo-Malthusian hypothesis in a relatively high projected demo-
graphic growth rate context.
6 US Energy Administration Information US
12
History Projections Average AnnualPercent Change
Region/Country 1990 2002 2003 2010 2015 2020 2025 2030 2003-2030OECD North America 366 424 427 457 478 498 518 537 0.9United Statesa 254 289 291 310 324 337 351 365 0.8Canada 28 32 32 34 35 36 38 39 0.8Mexico 84 104 104 113 119 125 129 133 0.9OECD Europe 497 529 530 543 550 555 559 562 0.2OECD Asia 187 198 199 202 204 204 203 202 0.1Japan 124 128 128 128 128 127 125 123 -0.2South Korea 43 47 47 49 49 49 49 49 0.1Australia/New Zealand 20 24 24 25 27 28 29 30 0.9
Total OECD 1,05 1,151 1,156 1,203 1,232 1,257 1,28 1,3 0.4
Non-OECD Europe and Eurasia 348 343 343 338 334 330 325 319 -0.3Russia 148 145 145 140 137 133 129 125 -0.5Other 200 198 198 198 198 197 196 193 -0.1Non-OECD Asia 2,748 3,3 3,316 3,592 3,783 3,958 4,108 4,231 0.9China 1,155 1,296 1,299 1,355 1,393 1,424 1,441 1,446 0.4India 849 1,064 1,07 1,183 1,26 1,332 1,395 1,449 1.1Other Non-OECD Asia 743 940 946 1,054 1,129 1,202 1,271 1,335 1.3Middle East 137 185 187 216 238 260 281 301 1.8Africa 636 861 869 1,007 1,115 1,228 1,344 1,463 2.0Central and South America 360 439 442 486 515 542 567 589 1.1Brazil 149 180 181 198 209 219 228 236 1.0Other Central and South America 210 259 260 287 306 323 339 354 1.1
Total Non-OECD 4,228 5,129 5,156 5,638 5,986 6,319 6,626 6,903 1.1
Total World 5,278 6,28 6,312 6,841 7,217 7,576 7,906 8,203 1.0a Includes the 50 States and the District of Columbia.
Table 3.1: World Population by Region, Reference Case, 1990-2030 millions. Source EIA projections www.eia.doe.gov
3.2 – ECONOMY
History Projections Average AnnualPercent Change
Region/Country 1990 2002 2003 2010 2015 2020 2025 2030 2003-2030OECD North America 8,477 11,968 12,273 15,503 17,986 20,94 24,083 27,733 3.1United Statesa 7,113 10,049 10,321 13,043 15,082 17,541 20,123 23,112 3.0Canada 684 957 977 1,19 1,343 1,484 1,614 1,753 2.2Mexico 680 962 976 1,271 1,561 1,916 2,346 2,868 4.1OECD Europe 8,017 10,647 10,799 12,713 14,194 15,799 17,508 19,394 2.2OECD Asia 3,655 4,628 4,716 5,615 6,265 6,811 7,343 7,924 1.9Japan 2,898 3,329 3,375 3,858 4,192 4,438 4,653 4,878 1.4South Korea 330 663 683 966 1,18 1,368 1,56 1,776 3.6Australia/New Zealand 428 637 657 791 893 1,005 1,13 1,27 2.5
Total OECD 20,15 27,243 27,788 33,832 38,445 43,55 48,934 55,051 2.6
Non-OECD Europe and Eurasia 3,387 2,672 2,878 4,315 5,345 6,494 7,759 9,19 4.4Russia 2,241 1,658 1,78 2,531 3,059 3,656 4,304 5,005 3.9Other 1,146 1,013 1,099 1,784 2,286 2,837 3,455 4,185 5.1Non-OECD Asia 5,78 12,559 13,516 21,134 27,606 35,422 44,905 56,707 5.5China 1,807 5,494 5,994 10,116 13,538 17,615 22,592 28,833 6.0India 1,684 3,16 3,429 5,162 6,694 8,644 11,059 14,102 5.4Other Non-OECD Asia 2,289 3,905 4,093 5,856 7,374 9,162 11,255 13,772 4.6Middle East 810 1,295 1,357 1,946 2,376 2,863 3,423 4,085 4.2Africa 1,461 2,074 2,173 3,073 3,815 4,684 5,717 6,97 4.4Central and South America 2,174 3,011 3,075 4,136 4,956 5,904 7,015 8,328 3.8Brazil 1,022 1,37 1,378 1,796 2,127 2,51 2,951 3,462 3.5Other Central and South America 1,153 1,641 1,697 2,34 2,828 3,395 4,064 4,866 4.0
Total Non-OECD 13,612 21,611 22,999 34,603 44,098 55,366 68,82 85,281 5.0
Total World 33,761 48,854 50,786 68,435 82,544 98,917 117,754 140,331 3.8a Includes the 50 States and the District of Columbia.
Table 3.2: World Gross Domestic Product (GDP) by Region Using Purchasing Power Parity, Reference Case, 1990-2030 (Billion 2000 Dollars). Source EIA projections www.eia.doe.gov
Table 3.2 reports Indian GDP historical data and projected values for a time frame ranging
from 2003 to 2030 (EIA). India’s GDP will grow from 3,429 billions (US Dollars 2000 PPP)
13
value in 2003 to the 14,102 billions in 2030. The projected growth of the Indian economy is
impressive. Indeed, the estimated average annual growth rate will be 5,4%. This value is less
than China (about 6%), but still more than some other Non OECD countries such as Mexico
(4,1%) and Russia (3,9%). Again, the Indian fast growing economy confirms to be very inter-
esting for testing the Neo-Malthusian hypothesis.
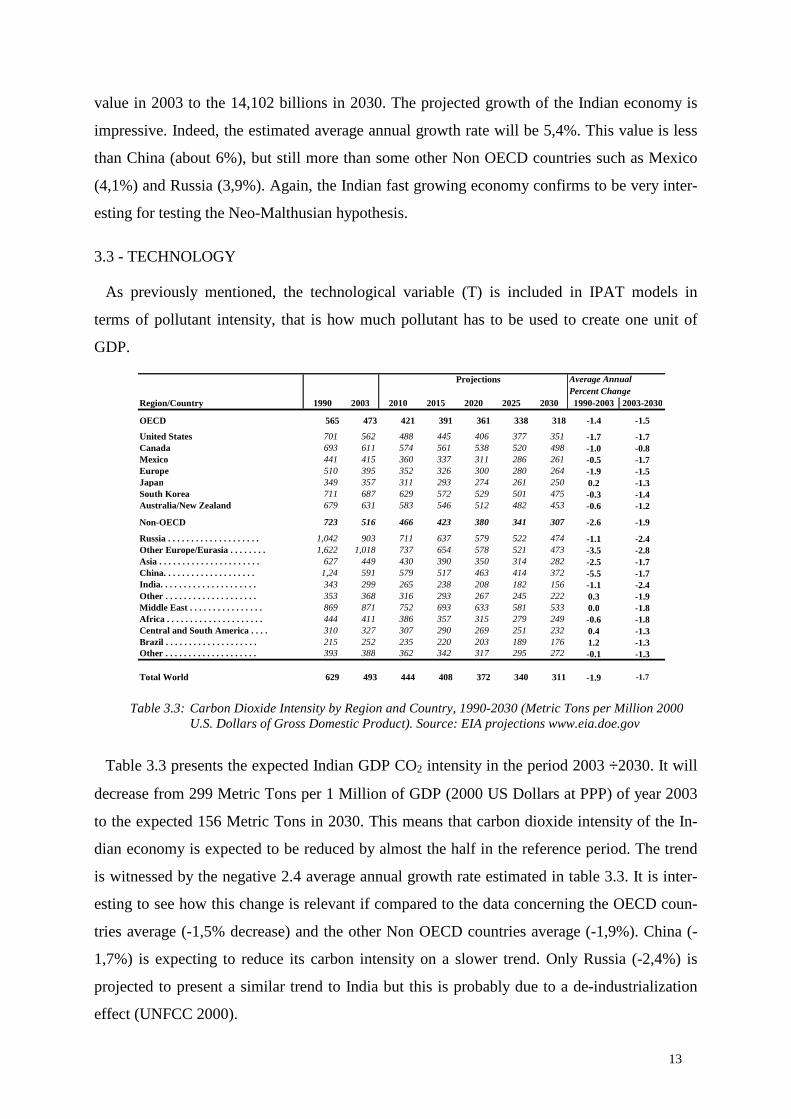
3.3 - TECHNOLOGY
As previously mentioned, the technological variable (T) is included in IPAT models in
terms of pollutant intensity, that is how much pollutant has to be used to create one unit of
GDP.
Projections Average AnnualPercent Change
Region/Country 1990 2003 2010 2015 2020 2025 2030 1990-2003 2003-2030
OECD 565 473 421 391 361 338 318 -1.4 -1.5
United States 701 562 488 445 406 377 351 -1.7 -1.7Canada 693 611 574 561 538 520 498 -1.0 -0.8Mexico 441 415 360 337 311 286 261 -0.5 -1.7Europe 510 395 352 326 300 280 264 -1.9 -1.5Japan 349 357 311 293 274 261 250 0.2 -1.3South Korea 711 687 629 572 529 501 475 -0.3 -1.4Australia/New Zealand 679 631 583 546 512 482 453 -0.6 -1.2
Non-OECD 723 516 466 423 380 341 307 -2.6 -1.9
Russia . . . . . . . . . . . . . . . . . . . . 1,042 903 711 637 579 522 474 -1.1 -2.4Other Europe/Eurasia . . . . . . . . 1,622 1,018 737 654 578 521 473 -3.5 -2.8Asia . . . . . . . . . . . . . . . . . . . . . . 627 449 430 390 350 314 282 -2.5 -1.7China. . . . . . . . . . . . . . . . . . . . 1,24 591 579 517 463 414 372 -5.5 -1.7India. . . . . . . . . . . . . . . . . . . . . 343 299 265 238 208 182 156 -1.1 -2.4Other . . . . . . . . . . . . . . . . . . . . 353 368 316 293 267 245 222 0.3 -1.9Middle East . . . . . . . . . . . . . . . . 869 871 752 693 633 581 533 0.0 -1.8Africa . . . . . . . . . . . . . . . . . . . . . 444 411 386 357 315 279 249 -0.6 -1.8Central and South America . . . . 310 327 307 290 269 251 232 0.4 -1.3Brazil . . . . . . . . . . . . . . . . . . . . 215 252 235 220 203 189 176 1.2 -1.3Other . . . . . . . . . . . . . . . . . . . . 393 388 362 342 317 295 272 -0.1 -1.3
Total World 629 493 444 408 372 340 311 -1.9 -1.7
Table 3.3: Carbon Dioxide Intensity by Region and Country, 1990-2030 (Metric Tons per Million 2000 U.S. Dollars of Gross Domestic Product). Source: EIA projections www.eia.doe.gov
Table 3.3 presents the expected Indian GDP CO2 intensity in the period 2003 ÷2030. It will
decrease from 299 Metric Tons per 1 Million of GDP (2000 US Dollars at PPP) of year 2003
to the expected 156 Metric Tons in 2030. This means that carbon dioxide intensity of the In-
dian economy is expected to be reduced by almost the half in the reference period. The trend
is witnessed by the negative 2.4 average annual growth rate estimated in table 3.3. It is inter-
esting to see how this change is relevant if compared to the data concerning the OECD coun-
tries average (-1,5% decrease) and the other Non OECD countries average (-1,9%). China (-
1,7%) is expecting to reduce its carbon intensity on a slower trend. Only Russia (-2,4%) is
projected to present a similar trend to India but this is probably due to a de-industrialization
effect (UNFCC 2000).

14
In India this could be affected by the use of less carbon intensive technologies in production
processes, or by a switch in the energy policy from high emission intensive fuels (such as fos-
sil fuels) to low emission intensive energy sources (such as biomass, nuclear power and re-
newable).
3.4 - EMISSIONS
The environmental impact variable considered in this case study (Carbon Dioxide emis-
sions) is reported in Table 3.4 that provides the relative projected data for the reference period
(EIA). Once again, as for the economy, the general expected trend is a rise in volume. In 2003
India emitted globally 1,023 millions Metric Tons of CO2. This value is expected to rise up to
2,205 in 2030 with a projected average annual growth rate of 2,9%.
History Projections Average AnnualPercent Change
Region/Country 1990 2002 2003 2010 2015 2020 2025 2030 2003-2030OECD North America 5,753 6,687 6,797 7,505 7,997 8,513 9,096 9,735 1.3United Statesa 4,978 5,748 5,796 6,365 6,718 7,119 7,587 8,115 1.3Canada 474 570 596 683 753 799 839 873 1.4Mexico 300 369 405 457 526 595 670 747 2.3OECD Europe 4,089 4,203 4,264 4,474 4,632 4,741 4,909 5,123 0.7OECD Asia 1,536 2,063 2,09 2,269 2,39 2,455 2,54 2,638 0.9Japan 1,011 1,191 1,206 1,2 1,228 1,218 1,214 1,219 0.0South Korea 234 462 470 608 675 723 781 843 2.2Australia/New Zealand 291 410 415 462 487 515 545 576 1.2
Total OECD 11,378 12,952 13,15 14,249 15,02 15,709 16,545 17,496 1.1
Non-OECD Europe and Eurasia 4,193 2,634 2,725 3,113 3,444 3,758 4,047 4,352 1.7Russia 2,334 1,546 1,606 1,799 1,949 2,117 2,246 2,374 1.5Other 1,859 1,088 1,118 1,314 1,495 1,641 1,801 1,978 2.1Non-OECD Asia 3,626 5,733 6,072 9,079 10,753 12,407 14,113 15,984 3.6China 2,241 3,273 3,541 5,857 7,000 8,159 9,349 10,716 4.2India 578 1,011 1,023 1,369 1,592 1,799 2,008 2,205 2.9Other Non-OECD Asia 807 1,449 1,508 1,853 2,161 2,449 2,756 3,062 2.7Middle East 704 1,152 1,182 1,463 1,647 1,811 1,987 2,177 2.3Africa 649 850 893 1,188 1,363 1,477 1,593 1,733 2.5Central and South America 673 993 1,006 1,27 1,436 1,586 1,758 1,933 2.4Brazil 220 347 348 423 469 508 559 610 2.1Other Central and South America 453 645 659 847 967 1,078 1,199 1,323 2.6
Total Non-OECD 9,846 11,362 11,878 16,113 18,643 21,039 23,5 26,18 3.0
Total World 33,761 48,854 50,786 68,435 82,544 98,917 117,754 140,331 2.1a Includes the 50 States and the District of Columbia.
Table 3.4: World Carbon Dioxide Emissions by Region, Reference Case, 1990-2030 (Million Metric Tons Carbon Dioxide). Source: EIA projections www.eia.doe.gov
However, if we look carefully table 3.4, it is possible to verify that the volume of emissions
it is going to be more dimensionally relevant in the OECD countries (17,496 million) and in
China (10,716) that are expected to become (in absolute terms, not per capita). China is also
experiencing a significantly quicker growth in relative terms with an annual average growth
rate of 4,2%. Possible interpretation for this stands both in the larger size of its economy and
heavier reliance on fossil fuels both industrial and transport use.

15
The projected emissions trend suggests us that the scope of carbon dioxide emissions will
have a more relevant dimension in developed countries (OECD) than emerging economies
(China and India). This is a first step for challenging the Neo-Malthusian hypothesis.
3.5 - THE IPAT MODEL FOR INDIA
Having analysed the trends for the Indian economy in terms of all four variables of the
IPAT model, it is now possible to aggregate these figures in a model that will forecast which
variable will play the major role in Indian’s future environmental degradation. Table 3.5
summarizes briefly the indicators of the previous paragraph. In order to apply the data to the
model, the decomposition methodology will be used.
The I = P × A × T equation can then be transformed into additive form either taking the
logarithm of both sides of the identity or applying continuous growth rates for all variables7
(O’Neill 2001). The second approach is therefore applicable to our example. In this case, the
equation becomes:
I′ = P′ + A′ + T′
The prime notation indicates that the average annual growth rate is considered. According to
O’Neill (2001) the “normalization of decompositions allows comparison between scenarios,
time periods, regions or pollutants” (page 20). Normalization can take place simply by divid-
ing all growth rates of the independent variables of the IPAT model (PAT) by the growth rate
of the independent variable impact (I). The variable (I), by definition represents the sum of the
average annual growth grates of (P), (A) and (T). The equation then takes the form:
1 = P′/I′ + A′/I′ + T′/I′
This methodology allows the representation of each variable in terms of percentage contri-
bution on the impact growth rate. However, some important limitation to this model should be
remarked. For the EIA figures the average annual growth rate has been assumed constant over
the reference period8. This assumption is very strong and has to be remarked.
7 The model still works for discrete growth rates that are not too high in value (O’Neill 2001). In our case the
hypothesis of constant average growth rate in the EIA figures allows the application of the decomposition methodology.
8 The assumed formula to calculate the growth rates follows the compound interest rate model

16
2003 2030
Average Annual Change %
(2003-2030)
POPULATION (Billions)
1.070 1.449 1.1
AFFLUENCE-GDP
(Billions of USD 2000 PPP) 3,429 14,102 5.4
TECHNOLOGY
(Metric Tons of Carbon Emissions per 1 Million GDP)
299 156 -2.4
IMPACT (Millions Metric Tons of CO2)
1,023 2,205 2.9
Table 3.5: Projected population, GDP, intensity and carbon dioxide emissions India (2003-2030). Sources: www.eia.doe.gov.
3.6 - RESULTS OF THE PROJECTIONS
Table 3.6 reports the results of the application of the IPAT model to India in terms of ex-
pected percentage contribution of demographic growth, economic growth and technology
improvements to the projected growth of carbon dioxide emissions in the evaluated reference
period (2003 ÷2030).
INDIA (2003 ÷ 2030) I P A T
AVERAGE ANNUAL CHANGE
(Percentage) 2.9 1.1 5.4 - 2.4
CONTRIBUTION
(Percentage) 100 % 26.83 % 131.70 % - 58.53 %
Table 3.6: Percentage contribution India (2003-2030).
The applied normalization method allows the evaluation of each of the three independent
variables and helps to introduce a discussion on the obtained results. The first result is that
population will play a relatively marginal role in determining the future growth of carbon
emissions. The demographic growth is projected to account just for the 26.83% of total car-
bon dioxide growth.
17
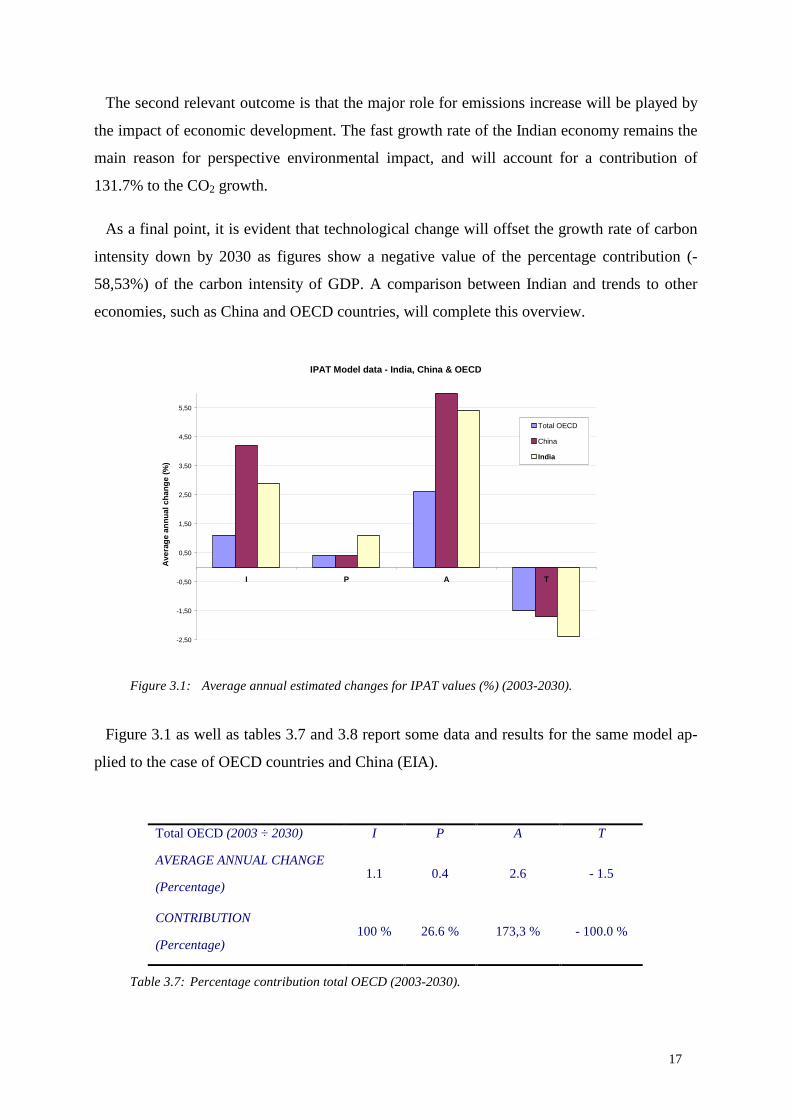
The second relevant outcome is that the major role for emissions increase will be played by
the impact of economic development. The fast growth rate of the Indian economy remains the
main reason for perspective environmental impact, and will account for a contribution of
131.7% to the CO2 growth.
As a final point, it is evident that technological change will offset the growth rate of carbon
intensity down by 2030 as figures show a negative value of the percentage contribution (-
58,53%) of the carbon intensity of GDP. A comparison between Indian and trends to other
economies, such as China and OECD countries, will complete this overview.
IPAT Model data - India, China & OECD
-2,50
-1,50
-0,50
0,50
1,50
2,50
3,50
4,50
5,50
I P A T
Ave
rag
e an
nu
al c
han
ge
(%)
Total OECD
China
India
Figure 3.1: Average annual estimated changes for IPAT values (%) (2003-2030).
Figure 3.1 as well as tables 3.7 and 3.8 report some data and results for the same model ap-
plied to the case of OECD countries and China (EIA).
Total OECD (2003 ÷ 2030) I P A T
AVERAGE ANNUAL CHANGE
(Percentage) 1.1 0.4 2.6 - 1.5
CONTRIBUTION
(Percentage) 100 % 26.6 % 173,3 % - 100.0 %
Table 3.7: Percentage contribution total OECD (2003-2030).

18
CHINA (2003 ÷ 2030) I P A T
AVERAGE ANNUAL CHANGE
(Percentage) 4.2 0.4 6.0 - 1.7
CONTRIBUTION
(Percentage) 100 % 9.5 % 127.65 % - 36.17 %
Table 3.8: Percentage contribution China (2003-2030)
To this extent, some considerations can be developed. First of all, the demographic
contribution to emissions seems to be not relevant in all reference three scenarios.
Additionally, it can be noted that population pressure will have more or less the same
importance in OECD and in India (26%) on the production of future emissions. By contrast,
in China the demographic variable will account for just 8.5% to the total emission growth.
Secondly, these results show that, for India, the projected outstanding economic perform-
ance in terms of GDP growth rate will represent the main determinant of the rise in CO2 emis-
sions. Surprisingly, the contribution is relatively higher in India (131.7%) than in China
(127.65%) despite the latter is supposed to be experiencing a much higher GDP growth rate
(6%). However, both economies stand behind with respect to the OECD countries (173,3%)
where GDP growth is still expected to be the first source for environmental impact in terms of
emissions.
Let us now focus on the third factor: technology. For this variable, the results are quite sur-
prising for the Indian case. Indeed, by 2030 the country is projected to reduce by (-58.53%) its
contribution to carbon dioxide emissions growth in terms of carbon intensity amelioration.
The result is relevant if compared to China that is expected to achieve only a -36.17% reduc-
tion due to technological change. The OECD countries will experience a major downward
push to emissions (-100%) coming from the improvements in carbon intensity, and this is
probably due to policy reasons, and technological leadership.

19
4 - DISCUSSION
The results obtained by the application of IPAT methodology to India can help to focus on
some relevant points connected to the Neo-Malthusian hypothesis and to the theoretical de-
bate reviewed in the first part of the paper:
a) the first target of this work was to discuss and challenge the Neo-Malthusian hypothe-
sis that has been illustrated in Chapter 1 and to test it with a concrete case study with the
IPAT methodology. The results obtained by my case study are pretty straightforward
and tend to indicate that, basically, population growth does not hinder significantly the
preservation of the environment. To this regard, the example of carbon emissions, as al-
ready mentioned in Chapter 1, has been useful to evaluate an environmental variable
having a very strong direct and indirect connection with demographic growth. The re-
sults of the application of the IPAT model to India have shown that the projected demo-
graphic increase will contribute only marginally to the expected internal change in the
level CO2 emissions (just 26%) and other factors such as GDP growth and technology
will play a much more important role. Additionally, the example of India has shown
how, in relative terms, an emerging capitalist economy with relevant demographic di-
mensions is going to exert relatively less pressure on environmental resources than other
developed economies with reduced demographic dimensions (this also confirmed by the
estimated provisions for China with a contribution of only 9.5% to the expected carbon
dioxide increase). Therefore, the evidence provided by this case study rejects the Neo-
Malthusian argument of incompatibility between demographic growth, and environ-
mental preservation with specific reference to the reality of “new” emerging capitalist
systems of Asia.
b) the second aim of the paper was to give a clear answer to widely discussed topic in
the academic literature and in the international political debate: is economic growth
more harmful than demographic growth for the preservation of environmental re-
sources? The answer that can be given according to the results showed by this paper is
positive. In fact, the Indian case-study shows that GDP growth will account for 131,7 %
of the total expected environmental impact (carbon dioxide) growth rate by 2030. This
conclusion remains still valid if we consider this contribution offset by the negative
value of the intensity (-58.53%)9. Economic growth discounted by the effect of carbon
dioxide intensity reduction will still be about three times more important than demo-
9 As some IPAT methodologies collapse the A and T variables an a single one (Bongaarts, 1992)

20
graphic growth to the increase in CO2 emissions. In China and OECD economies the
differential between demographic and economic contribution is projected to be even
wider. This confirms that, in absolute and not per-capita terms, the economic growth
variable contributes mostly in terms of pressure on environmental resources. The projec-
tions have shown that these conclusions apply to both developing and developed coun-
tries. Apparently, it seems that even in developed the world, which supposedly is more
committed to the climate change reduction agenda through the binding regulations of the
Kyoto Protocol and of the European Directives, still much has to be done in terms of
environmental policy and clean technology. In fact, despite China and India will experi-
ence a higher GDP growth rate (in percentage terms), the most relevant carbon dioxide
impact will be coming without any sort of doubts from the developed world (173%).
c) the third point suggested by the discussion of this case study regards the technological
variable. In the IPAT model, the intensity variable is often expected to offset the posi-
tive contribution of the other two variables. The projected results for India are out-
standing with –58.53% in the carbon dioxide increase to a reduction in the carbon GDP
intensity. If we compare this value to China we realize how India is ahead to other de-
veloping countries in terms of carbon dioxide intensity reduction. Only OECD countries
stay forward with a predicted reduction by 100%. These figures can also lead to some
interesting insights. First, India is expected to be very active in the so-called “substitu-
tion effect”. In other words, it is predictable that it will switch massively to energy
sources alternative to fossil fuels. Indeed, by definition, fossil fuels are the most carbon
dioxide intensive energy sources and India currently relies especially on coal that is the
most emission-intensive fossil fuel (EIA10). This is a quite surprising as Neo-Malthusian
scholars often blames developing countries of scarce environmental concerns. On the
contrary, the projections for India go on the opposite direction and witness a renewed in-
terest in carbon emissions reduction policies. One important thing to note is that India is
actually not obliged to meet any target by the Kyoto Protocol by the fact that the proto-
col only applies to developed countries. This leads to the last point of interest in this dis-
cussion regarding environmental policy issues.
d) As mentioned before, one the most important advantages of the IPAT identity is that it
allows to decide what kind of policy is more desirable to preserve the environment. Two
main conclusions concerning policy choice can be outlined. First, it is possible to say
that practically any sort of demographic policy aimed at fertility reduction is not desir- 10 www.eia.doe.gov

21
able for a significant amelioration of the emissions level. This argument can also be ex-
tended to other form of pressure on environmental resources and comes about by the re-
jection of the Neo-Malthusian paradigm that was discussed in Chapter 1. Second, a re-
mark on environmental policy should be stressed. Having showed how GDP growth and
technological improvements are the key issues in the topic, the renewed need for an en-
vironmental policy is consequently logic. However, it is also relevant to find out what
kind of climate change policy is more effective for the environment. Another point to
discuss is how countries try to implement policies with the goal of environmental pres-
ervation. To this extent, it might be useful to remind that many countries with relevant
economies are redirecting their international environmental policy according to a
domestic economic and political strategy (DeSombre 2005). This strategy increasingly
foresees environmental policies affecting much more technology (T) rather than GDP
growth (A). In other words, the international environmental policy consensus sees a
growing consensus (both from developed and developing countries) on an environ-
mental preservation agenda not aimed at hindering economic growth. This can be shown
if we take into account the shift of many countries from mandatory to voluntary climate
change regimes (Betsill 2005). A clear evidence for this argument is the US decision to
quit the Kyoto agenda (fundamentally based on a reduction of economic growth) and to
establish an alternative agreement such as the Asia Pacific Partnership (aimed at reduc-
ing climate change through carbon intensity amelioration) (DeSombre 2005). This logic
is followed by an increasing number of developing countries too. The main rationale is
that they do not want to trade off economic development in the name of concepts strictly
related to environmental preservation and that developed countries have never really
considered in their own path of growth. With regard to this, the environmental policy of
India provides an interesting case (Dyson, Cassen, Visaria 2004). The ratification, last
summer, of the Asia Pacific Partnership and the renewed collaboration with the US
about the gradual switch to nuclear power and alternative sources of energy represent a
clear sign of not letting development down for environmental issues. Additionally, it
confirms the fact that an emerging economy, such as India, is increasingly seeking for
energy technology independence for strategic economic and political reasons.
22
5 - CONCLUDING REMARKS
This paper has been focused on the issue of environmental resources in Asia and has sought
to evaluate the role of demographic pressure on the depletion of natural resources. The work
has especially been aimed at challenging the Neo-Malthusian hypothesis of incompatibility
between demographic growth and preservation of the environment in developing countries.
This has been done through several steps. First, the paper has contributed to review the aca-
demic literature on the population, environment, development debate.
Second, the paper has chosen a way to face the problem. The choice of challenging the
IPAT model methodology has represented one possible manner of applying a paradigm that
derives directly from the pessimistic assumptions on population growth and preservation of
environment. The limitations of the IPAT identity and its strong assumptions have also been
outlined and considered.
Third, this theoretical model has here been tested on an empirical example referred to a spe-
cific environmental variable and to a specific developing country. The case study has covered
the projected increase in CO2 emissions in India in the period 2003 ÷ 2030. Contributions of
demographic, economic and technological variables have been calculated relatively to the
growth of carbon dioxide emission. The results have confirmed the hypothesis that the Neo-
Malthusian paradigm is not appropriate to explain the demographic impact on the environ-
mental variable in Asian economies. Instead, evidence has been provided to consider that the
main determinant for environmental impact is still going to be economic growth. As a conse-
quence, the paper has discussed some the main points of interest arising from these conclu-
sions in terms of how countries often see environmental and energy policies related to na-
tional economic and political interests.
The social and political relevance of this work stands in the fact that currently environ-
mental issues are representing a growing issue in development studies. The depletion of the
environment connected to human activities represents a common concern in the entire world
and recently also these phenomena is increasing especially in Asian economies. This study
has referred to CO2, as an indicator for the variables in the IPAT model, mainly because accu-
rate database exist both for actual and expected values. CO2 also represents also a good ex-
ample of indicator that can be calculated by Life Cycle Analysis (LCA) methodology while
referring all unman polluting activities to an unique parameter.

23
To this extent, the issue of carbon dioxide emissions is, above all, important and the conse-
quences of CO2 and greenhouse gases emissions are well known in terms of their responsibil-
ity for climate change. Global warming may seriously represent a hinder to development in
many countries. To avoid the consequences of climate change, a collective policy action re-
sponse is desirable as well as more equality in lifestyles and in welfare between the North and
the South.
24
REFERENCES
Auerbach A. e Kotlikoff L., Macroeconomics: an integrated approach, MIT University Press,
Boston, 1998
Barrett S. (2000), “The Political Economy of the Kyoto Protocol ”, in Helm D. (edited by)
Environmental Policy, OUP , Oxford.
Bartiaux F., Van Ypersele J. (1993), “ The Role of Population Growth in Global Warming”,
in Proceedings of the International Population Conference Montreal 1994.
Batterbury, SPJ, Forsyth T. (1999), "Fighting Back: human adaptations in marginal environ-
ments" Environment 41(6) 6-11, 25-30
Bengtsson T. e Saito O. (2000), Population and Economy, Oxford University Press, Oxford.
Betsill M. (2005), “Global Climate Change Policy: Making Progress or Spinning Wheels?” in
Axelrod S., Downie D., Vig N.J. (edited by) The Global Environment: Institution, Law and
Policy CQ Press, Wahsington.
Birsdall N.(2001), “How and why population matters” in Birsdall N., Kelley C., Sinding S.
(eds.) Population Matters: Demographic Change, Economic Growth and Poverty in the De-
veloping World, Oxford University Press, Oxford.
Birsdall N.(2001), “New Findings in Economics and Demography: Implications for Policies
to Reduce Poverty” in Birsdall N., Kelley C., Sinding S. (eds.) Population Matters: Demo-
graphic Change, Economic Growth and Poverty in the Developing World, Oxford University
Press, Oxford, 2001.
Bongaarts J. (1992), “Population Growth and Global Warming” in Population and Develop-
ment Review, Vol 18, No 2.
Bongaarts J. (2001), “Dependency Burdens in the Developing World” in Birsdall N., Kelley
C., Sinding S. (eds.) Population Matters: Demographic Change, Economic Growth and Pov-
erty in the Developing World, , Oxford University Press, Oxford.

25
Boserup E. (1990), Economic and Demographic Relationships in Development, John Hopkins
University Press, London.
Boyce, J. (1989),“Population Growth and Real wages of Agricultural labourers in Bangla-
desh, Journal of Development Studies 25(4):467-485
Boyd, C. and Slaymaker, T. (2000), Re-Examining the ‘More People Less Erosion’ Hypothe-
sis: Special case or wider trend? ODI Natural Resource Perspectives, No. 63.
Brown, L., Gardner, G. and Halweil, B. (1999), Beyond Malthus. The Nineteen Dimensions of
the Population Problem. Earthscan, London.
Cassen, R. (2000), Population, Development and Environment: India and beyond, Asia-
Pacific Review, Vol. 7, No. 2 pp. 99-120.
Coale A., Hoover E. (1958), Population Growth and Economic Development in Low-Income
Countries, Princeton University Press, Princeton, New Jersey.
Cohen J.E. (1995) How Many People Can the Earth Support? New York, Norton & Co.
Cohen J.E. (1995) Population Growth and Earth's Human Carrying Capacity. Science 269,
341-346
Connelly J. and Smith G. (2003), Politics and the environment fro Theory to Practice,
Routledge, London.
Cuffaro N. (2001), Population, Economic Growth and Agriculture in Less Developed Coun-
tries, Routledge, London.
Daily G.C. and Ehrlich P.R. (1992) Population, sustainability, and Earth's carrying capacity.
Bioscience 42 (10), 761-771
Dasgupta P.S. (1995) Population, Poverty and the Local Environment. Scientific American
Feb. 1995, 40-45.

26
Dauvergne P. (2005), “Globalization and the Environment” in Ravenhill.J. (edited by) Global
Political Economy, OUP , Oxford.
De Sa P. (1998), “Population, Carbon Emissions and Global Warming”, in Population and
Development Review, Vol 24, No 4.
DeSombre E. (2005), “Understanding United States Unilateralism: Domestic Sources of U.S.
International Environmental Policy” in Axelrod S., Downie D., Vig N.J. (edited by) The
Global Environment: Institution, Law and Policy CQ Press, Washington.
Deudney, D 1990 ‘The Case Against Linking Environmental Degradation and National Secu-
rity’, Millennium 19, 3: 461-476.
Dyson T. (1996), Population and food: global trends and future prospects, Routledge, Lon-
don.
Dyson, Tim; Cassen, R.; Visaria, L (2004.). 21st Century India: Population, Economy, Hu-
man Development and the Environment. Oxford University Press, Oxford.
Dyson T. (2005), “On development, demography and climate change: the end of the world as
we know it?“ available at: http://iussp2005.princeton.edu/download.aspx?submissionId=50222.
Ehrlich P.R and Holdren J., (1971), “Impact of Population Growth”, Science, 171, pages
1212-1217.
Forsyth T. Leach M. and Scoones I. (1998), Poverty and Environment (for UNDP and EC),
LSE Public Folders.
Hal R. Varian (1999). Intermediate Microeconomics -- A Modern Approach. W. W. Norton &
Company, New York, 5th edition.
Holdren J. (1991), “Population and the Energy problem”, Population and Environment, 12,
pages 231-255.
Homer-Dixon T. (1991), ‘On the threshold: environmental changes as causes of acute con-
flict’, International Security 16, 2 pp 76-116.

27
Homer-Dixon T. (1994), ‘Environmental Scarcities and Violent Conflict’, International Secu-
rity 19, 1 pp 5-40.
Homer-Dixon T (1995), ‘The Ingenuity Gap: Can Poor Countries Adapt to Resource Scar-
city?’, Population and Development Review 21. 3 pp 587-612.
Jennings V., Lloyd-Smith C., Ironmonger D.(2004), “Global Projections of Households
Number using the age-determined ratio”, Research paper N.914, Department of Economics,
University of Melbourne, Australia
Kelley C. (2001), “The population Debate in Historical Perspective: Revisionism Revised” in
Birsdall N., Kelley C., Sinding S. (eds.) Population Matters: Demographic Change, Eco-
nomic Growth and Poverty in the Developing World,, Oxford University Press, Oxford, 2001.
Kelley C., Schmidt R. (2001), “Economic and Demographic Change: A Synthesis of Models,
Findings and Perspectives” in Birsdall N., Kelley C., Sinding S. (eds.) Population Matters:
Demographic Change, Economic Growth and Poverty in the Developing World,, Oxford Uni-
versity Press, Oxford.
Leach M. Mearns R and Scoones I (1999), ‘Environmental Entitlements: Dynamics and Insti-
tutions in Community Based Natural Resource Management, World Development Vol 27 No
2
MacKellar F., Landis M., Lutz W., (1995), “Population, Households and Co2 emissions” , in
Population and Development Review, Vol 21, No 4.
Malthus R. (1803), An Essay on the Principle of Population, Cambridge University Press.
Meadows et. (1972), The limits to Growth, Universe, New York.
Murphy M.(2005), Household projections using by the headship rate method, SA485 Course
Material, LSE
O’Brien R. and Williams M. (2004), Global Political Economy, Palgrave, New York.

28
O’Neill B, Mackellar F., Lutz W. (2001), “Population and Climate Change”, Cambridge
University Press, Cambridge.
Pearce, D. Turner, R. (1990), Economics of Natural Resources and the Environment, The
John Hopkins University Press, Baltimore.
Smil, V. (1994), “How many people can the Earth feed?” Population and Development Re-
view 20(2):255-292
The World Bank (2006), Little Green Data Book, Washington DC.
The World Bank (2006), Reducing Air Pollution from Urban Transport, Washington DC.
Tiffen M., Mortimore M. and Gichuki F., (1994), More People, Less Erosion: Environmental
Recovery in Kenya, John Wiley London.
UN Economic Commission for Africa (2000), PEDA Model, New York.
UN (2001) Council Concise Report 2001. Population, Environment and Development
UNFPA (2001), Annual Report, New York.
US National Research Council (1984),Population Growth and Economic Development: Pol-
icy Questions, National Academy Press, Washington DC, USA.
W. Lutz & S. Scherbov, (1999), “Quantifying Vicious Circle Dynamics: The PDE Model for
Population, Environment, Development and Agriculture in African Countries”, Working Pa-
pers ir99049, International Institute for Applied Systems Analysis, Vienna
Zaba B, Scoones I. (1994), “Is carrying capacity a useful concept to apply to human popula-
tions?”, in (edited by) Zaba B., Environment and population change, Ordina, Liege
Zartman W. (1997), “Negotiations, Governance, and Regime Building” in Rolen M., Sjoberg
H., and Svedin U. (edited by) International Governance in Environmental Issues, OUP, Ox-
ford.