Global C4IR-1 Masterclass Cambridge Coutts - CIR 2017
32
© 2015 Routes to Value | All rights reserved Value Network Dynamics C 4 IR 3 February Cambridge Presented at Consortium for the 4th Revolution | Executive Briefing Day (#C4IR) Cambridge, UK 2-3 February 2017 | www.cir-strategy.com/events
-
Upload
justin-hayward -
Category
Economy & Finance
-
view
13 -
download
0
Transcript of Global C4IR-1 Masterclass Cambridge Coutts - CIR 2017

© 2015 Routes to Value | All rights reserved!
Value Network Dynamics!!
C4IR!
3 February !Cambridge!
Presented at Consortium for the 4th Revolution | Executive Briefing Day !(#C4IR) Cambridge, UK 2-3 February 2017 | www.cir-strategy.com/events!
Confidential! 2!© 2015 Routes to Value | All rights reserved!
Value network
2!
Controlability:content;container- visibility
Packaging material:time/cost/
quantity/quality
Productcommunicationeffectiveness
sell packagesurface space
growth; productto be usedcorrectly
time, cost,quantity,quality
reliable,involuntarypartnership
Affordability(cheapest);flexibility;on time
Campains
expertise
Food quality;packagequality
orders
orders
on time; tospecifications
Food quality;package quality
ready designs
Certification, externalstandards
approvalof proof
orders,financing
Package choice:visibility, quality,
price, variety
on time; tospecifications
service standards;parts; quality;optimisation
sell package surfacespace
Operationalreliability;capability;
functionality
healthycompetition;
complementingTP system;stay outsideTP system
growth; product to beused correctly
materials thatcan be or are
digitally printed
on time; tospecifications
Printabledesigns
reliablefilling line
Food safetycertified materialand environment
(factory)
Price; performance;JIT; sourcing
capability
orders
time, cost,quantity,quality
orders
logisticsefficiency
orders
Printabledesigns
follow TPstandards
good handling of packages;unbroken chill-chain
if appropriate.
speed ofresponse;
report,proofing;
equipmentacquisition
investment
innovate to compete;remain uncompetitive;
identify changes inthe market
good price;good quality
Operationalreliability;capability;
functionality
Dual and globalsourcing;
tcqq equipment
orders
Compatibility;performance
Functionality:use; recycling;renewability;
emotionalengagement;
safety
to copy products;not to innovate;
inferior quality; andnot price competitive
with TP
compatibility;consistency
on time; tospecifications
maintaining standards
orders
Stability;innovate;disrupt;
break new ground
correct handling;promotion
orders,financing
Operationalreliability;capability;
functionality
on time;to specifications
correcthandling
brand awareness;environmentalconsciousness
Foodproducer
Foodprocessingoperation
Inkmanufacturer
Brandownerprivatelabel
Co-packer
Secondarypackagingmaterialssupplier
OEMequipment
andcomponents
Maintenanceprovider
Secondarypackagingequipment
supplier
CompetitorsOUT non-Fibre
Disposal andrecyclingserviceprovider
Consumergroups
Advertisingagencies
Supply chainintegrator
Customerfactory
Brandowner
customer
Energyprovider
ANA/ISOstandards
organisations
TPfactory
- converting
Foodsafety
regulator
Consumers- end users
Platesuppliers
Print enginemanufacturers
CompetitorsOUT with Fibre
Foodintegrator
Customersales rep
TPDesign Hub
Retailer- small,
independent
Serviceprovider
- quality andoptimisation
Integratorof packaging
lines
Mediabuyers
TPMarket
Company
Packagingmaterialcontract
convertor
Institutionalbuyer
Distributor
Foodfilling
operation
Media
eRetailer
Brandowner
producer
Orderfulfilmentprocessowner
Government
CompetitorsIN
Spare partsmanufacturer/ supplier
Plantautomation
and operation
Disposalof
chemicalsprovider
Largeretail
chains
Designagency
TPbrand owner
Basematerialsupplier
Additionalmaterials
TetraPakFutureMoneyFlows
Future DP money flows - Null Future DP money flows - Very Low Future DP money flows - Low Future DP money flows - Medium Future DP money flows - High Future DP money flows - Very High
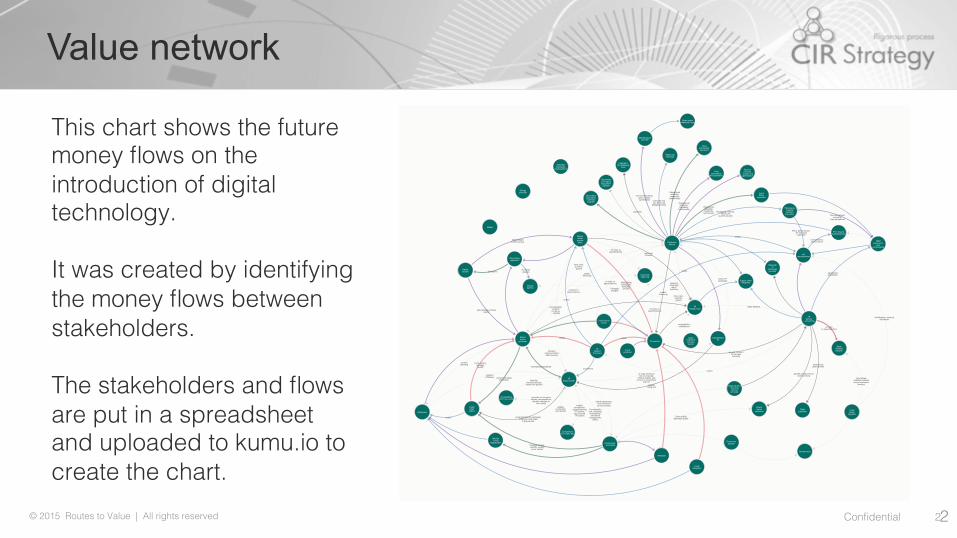
This chart shows the future money flows on the introduction of digital technology.!!It was created by identifying the money flows between stakeholders.!!The stakeholders and flows are put in a spreadsheet and uploaded to kumu.io to create the chart.!

Confidential! 3!© 2015 Routes to Value | All rights reserved!
Value network dynamics
The value network shows the links between stakeholders.!!These links can be product, information, service, competence and money flows.!!Understanding how moving from analogue to digital technology may impact these flows can help:!!
Maintain current value!Capture new value !Mitigate risks!
Confidential! 4!© 2015 Routes to Value | All rights reserved!
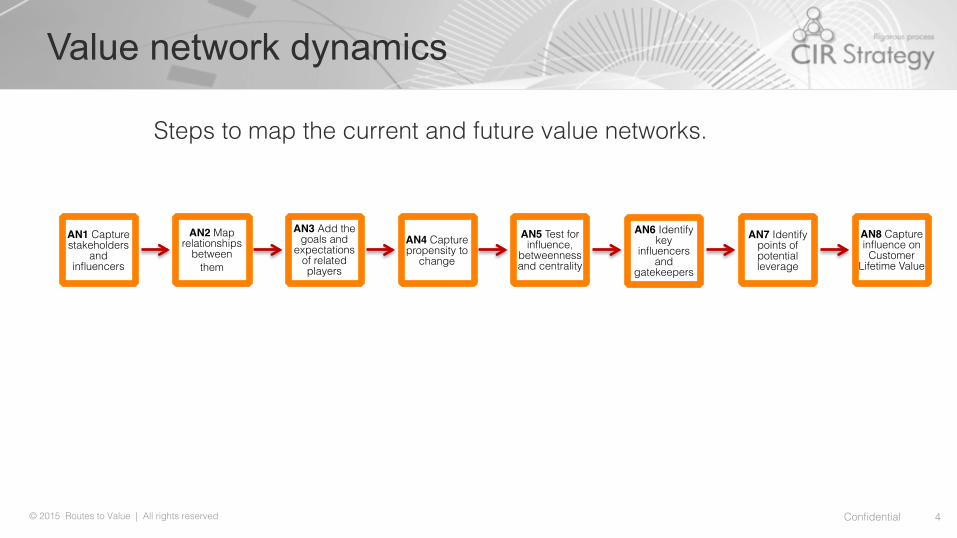
Value network dynamics
Steps to map the current and future value networks.!
AN1 Capture stakeholders
and influencers
AN2 Map relationships
between them
AN3 Add the goals and
expectations of related players
AN4 Capture propensity to
change
AN5 Test for influence,
betweenness and centrality
AN6 Identify key
influencers and
gatekeepers
AN7 Identify points of potential leverage
AN8 Capture influence on
Customer Lifetime Value

Confidential! 5!© 2015 Routes to Value | All rights reserved!
Value network dynamics
Steps to map the current and future value networks.!
AN1 Capture stakeholders
and influencers
AN2 Map relationships
between them
AN3 Add the goals and
expectations of related players
AN4 Capture propensity to
change
AN5 Test for influence,
betweenness and centrality
AN6 Identify key
influencers and
gatekeepers
AN7 Identify points of potential leverage
AN8 Capture influence on
Customer Lifetime Value
DescriptionIdentify stakeholders and all known influencers of their preference and behaviour (technical, social, cultural etc.).These are agents not generalised ideas (e.g. not the economy).Categorise by type.

Confidential! 6!© 2015 Routes to Value | All rights reserved!
Value network dynamics
Steps to map the current and future value networks.!
AN1 Capture stakeholders
and influencers
AN3 Add the goals and
expectations of related players
AN4 Capture propensity to
change
AN5 Test for influence,
betweenness and centrality
AN6 Identify key
influencers and
gatekeepers
AN7 Identify points of potential leverage
AN8 Capture influence on
Customer Lifetime Value
DescriptionEnter agents in the model assigning colour by type and build the structure by linking agents who have dealings with each other and avoiding as many crossed lines as possible (automatic if agents are unpinned in Kumu)
AN2 Map relationships
between them

Confidential! 7!© 2015 Routes to Value | All rights reserved!
Value network dynamics
Steps to map the current and future value networks.!
AN1 Capture stakeholders
and influencers
AN2 Map relationships
between them
AN4 Capture propensity to
change
AN5 Test for influence,
betweenness and centrality
AN6 Identify key
influencers and
gatekeepers
AN7 Identify points of potential leverage
AN8 Capture influence on
Customer Lifetime Value
DescriptionIndicate goals and expectations of agents and show direction.(x expects … of y, arrow head at y. NB because y may also expect something of x you may need to add a link in the opposite direction)
AN3 Add the goals and
expectations of related players

Confidential! 8!© 2015 Routes to Value | All rights reserved!
Value network dynamics
Steps to map the current and future value networks.!
AN1 Capture stakeholders
and influencers
AN2 Map relationships
between them
AN3 Add the goals and
expectations of related players
AN5 Test for influence,
betweenness and centrality
AN6 Identify key
influencers and
gatekeepers
AN7 Identify points of potential leverage
AN8 Capture influence on
Customer Lifetime Value
DescriptionIndicate propensity to change as an attribute with High, Medium, Low alternatives. (bullseye colour can be used to indicate propensity of each agent)
AN4 Capture propensity to
change

Confidential! 9!© 2015 Routes to Value | All rights reserved!
Value network dynamics
Steps to map the current and future value networks.!
AN1 Capture stakeholders
and influencers
AN2 Map relationships
between them
AN3 Add the goals and
expectations of related players
AN4 Capture propensity to
change
AN6 Identify key
influencers and
gatekeepers
AN7 Identify points of potential leverage
AN8 Capture influence on
Customer Lifetime Value
DescriptionThese are automatic tests run in the metrics built into Kumu
AN5 Test for influence,
betweenness and centrality

Confidential! 10!© 2015 Routes to Value | All rights reserved!
Value network dynamics
Steps to map the current and future value networks.!
AN1 Capture stakeholders
and influencers
AN2 Map relationships
between them
AN3 Add the goals and
expectations of related players
AN4 Capture propensity to
change
AN5 Test for influence,
betweenness and centrality
AN7 Identify points of potential leverage
AN8 Capture influence on
Customer Lifetime Value
DescriptionHigh centrality exerts high influence too (information and trends to be inherited through them). Influence can be indicated by node size.High betweenness indicates gatekeepers or bottlenecks
AN6 Identify key
influencers and
gatekeepers

Confidential! 11!© 2015 Routes to Value | All rights reserved!
Value network dynamics
Steps to map the current and future value networks.!
AN1 Capture stakeholders
and influencers
AN2 Map relationships
between them
AN3 Add the goals and
expectations of related players
AN4 Capture propensity to
change
AN5 Test for influence,
betweenness and centrality
AN6 Identify key
influencers and
gatekeepers
AN8 Capture influence on
Customer Lifetime Value
DescriptionUse the resulting model to deduce where action to engage or persuade might exert high leverage in the network.Potential consortia and key launch players can also be identified.
AN7 Identify points of potential leverage

Confidential! 12!© 2015 Routes to Value | All rights reserved!
Value network dynamics
Steps to map the current and future value networks.!
AN1 Capture stakeholders
and influencers
AN2 Map relationships
between them
AN3 Add the goals and
expectations of related players
AN4 Capture propensity to
change
AN5 Test for influence,
betweenness and centrality
AN6 Identify key
influencers and
gatekeepers
AN7 Identify points of potential leverage
AN8 Capture influence on
Customer Lifetime Value
DescriptionInfer which influencers and trends are most likely to influence customer perception and behaviour.

Confidential! 13!© 2015 Routes to Value | All rights reserved!
Stakeholder mapping
Day 2 of stakeholder mapping workshop.!

Confidential! 14!© 2015 Routes to Value | All rights reserved!
Example upload sheet – impact assessment of introduction of digital technology on stakeholders

Confidential! 15!© 2015 Routes to Value | All rights reserved!
Example upload sheet – current and future money flows between stakeholders
Money flow: 5 = very high 1 = very low 0 = no flow!

Confidential! 16!© 2015 Routes to Value | All rights reserved!
Value network dynamics
16!
Controlability:content;container- visibility
Packaging material:time/cost/
quantity/quality
Productcommunicationeffectiveness
sell packagesurface space
growth; productto be usedcorrectly
time, cost,quantity,quality
reliable,involuntarypartnership
Affordability(cheapest);flexibility;on time
Campains
expertise
Food quality;packagequality
orders
orders
on time; tospecifications
Food quality;package quality
ready designs
Certification, externalstandards
approvalof proof
orders,financing
Package choice:visibility, quality,
price, variety
on time; tospecifications
service standards;parts; quality;optimisation
sell package surfacespace
Operationalreliability;capability;
functionality
healthycompetition;
complementingTP system;stay outsideTP system
growth; product to beused correctly
materials thatcan be or are
digitally printed
on time; tospecifications
Printabledesigns
reliablefilling line
Food safetycertified materialand environment
(factory)
Price; performance;JIT; sourcing
capability
orders
time, cost,quantity,quality
orders
logisticsefficiency
orders
Printabledesigns
follow TPstandards
good handling of packages;unbroken chill-chain
if appropriate.
speed ofresponse;
report,proofing;
equipmentacquisition
investment
innovate to compete;remain uncompetitive;
identify changes inthe market
good price;good quality
Operationalreliability;capability;
functionality
Dual and globalsourcing;
tcqq equipment
orders
Compatibility;performance
Functionality:use; recycling;renewability;
emotionalengagement;
safety
to copy products;not to innovate;
inferior quality; andnot price competitive
with TP
compatibility;consistency
on time; tospecifications
maintaining standards
orders
Stability;innovate;disrupt;
break new ground
correct handling;promotion
orders,financing
Operationalreliability;capability;
functionality
on time;to specifications
correcthandling
brand awareness;environmentalconsciousness
Foodproducer
Foodprocessingoperation
Inkmanufacturer
Brandownerprivatelabel
Co-packer
Secondarypackagingmaterialssupplier
OEMequipment
andcomponents
Maintenanceprovider
Secondarypackagingequipment
supplier
CompetitorsOUT non-Fibre
Disposal andrecyclingserviceprovider
Consumergroups
Advertisingagencies
Supply chainintegrator
Customerfactory
Brandowner
customer
Energyprovider
ANA/ISOstandards
organisations
TPfactory
- converting
Foodsafety
regulator
Consumers- end users
Platesuppliers
Print enginemanufacturers
CompetitorsOUT with Fibre
Foodintegrator
Customersales rep
TPDesign Hub
Retailer- small,
independent
Serviceprovider
- quality andoptimisation
Integratorof packaging
lines
Mediabuyers
TPMarket
Company
Packagingmaterialcontract
convertor
Institutionalbuyer
Distributor
Foodfilling
operation
Media
eRetailer
Brandowner
producer
Orderfulfilmentprocessowner
Government
CompetitorsIN
Spare partsmanufacturer/ supplier
Plantautomation
and operation
Disposalof
chemicalsprovider
Largeretail
chains
Designagency
TPbrand owner
Basematerialsupplier
Additionalmaterials
TetraPakFutureMoneyFlows
Future DP money flows - Null Future DP money flows - Very Low Future DP money flows - Low Future DP money flows - Medium Future DP money flows - High Future DP money flows - Very High
The stakeholders and flows are put in a spreadsheet and uploaded to kumu.io to create the chart.!!!The value network dynamics can then be analysed. !!!Add alerts to rack changes in flows: eg Google Alerts and Repindex.!! !

Confidential! 17!© 2015 Routes to Value | All rights reserved!
Analysis of value network dynamics
The tables below have been generated uploading the Value Network Impact Assessment Framework* for the current money flows.! !Table 1 Top 10 elements by Degree Centrality!Table 2 Top 10 elements by Closeness Centrality!Table 3 Top 10 elements by Betweenness Centrality !Table 4 Top 10 elements by Eigenvector Centrality!Table 5 Top 10 elements by Indegree !Table 6 Top 10 elements by Outdegree!!! !* file name = upload numeric money flows.xlsx!

Confidential! 18!© 2015 Routes to Value | All rights reserved!
Analysis of network dynamics

Confidential! 19!© 2015 Routes to Value | All rights reserved!
Impact estimation
Stakeholder Name%of%stakeholder Completed%by Date UpdateMoney.inflow Money.outflow
Flow%number
Flow%description,%eg%printed%carton
Cost%or%revenue%flow
Estimate%in%size%of%money%inflow
confidence%%
Impact%on%stakeholder
confidence%%
Estimate%of%size%of%money%outflow
confidence%%
Impact%on%stakeholder
confidence%%
1 current2 future3 current4 future56
ImpactVery%high 5 NoteHigh 4 Always%state%the%source%and%date%of%each%estimateMedium 3Low 2Very%low 1No%impact 0
For a detailed explanation of impact estimation, see Gilb T., Competitive Engineering, Elsevier Butterworth Heinemann, 2006, chapter 9!

Confidence table!

Stakeholders and barriers to adoption of graphene!

IKAWA ROADMAP
From product to service!

Confidential! 23!© 2015 Routes to Value | All rights reserved!
Write business plan
Basic value network model !
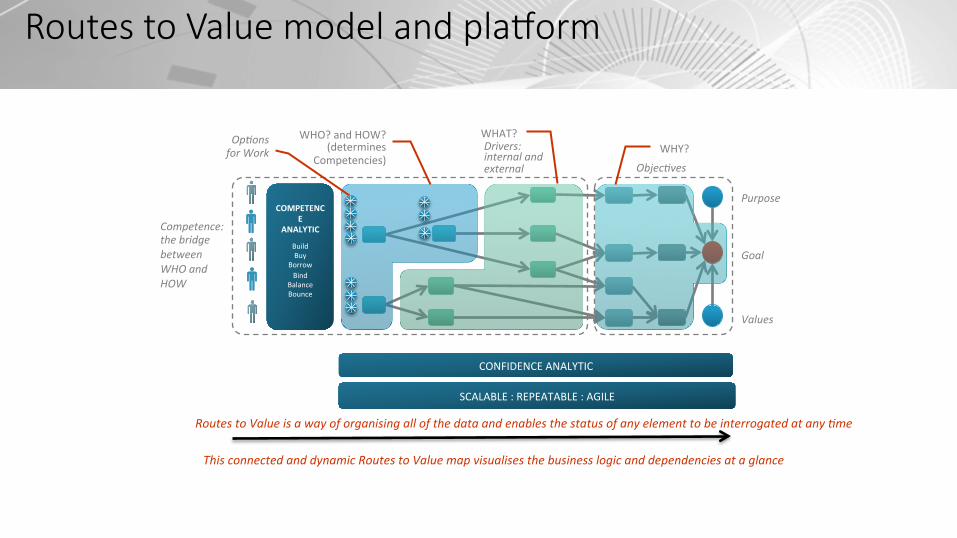
Routes to Value model and pla/orm
Goal
Values
Purpose
WHAT?WHO?andHOW?(determines
Competencies)Objec1ves
WHY?
ThisconnectedanddynamicRoutestoValuemapvisualisesthebusinesslogicanddependenciesataglance
SCALABLE:REPEATABLE:AGILE
Drivers:internalandexternal
COMPETENCE
ANALYTIC
BuildBuy
BorrowBind
BalanceBounce
Competence:thebridgebetweenWHOandHOW
CONFIDENCEANALYTIC
Op1onsforWork
RoutestoValueisawayoforganisingallofthedataandenablesthestatusofanyelementtobeinterrogatedatany1me

Confidential! 25!© 2015 Routes to Value | All rights reserved!
Effective Evaluation of the Business Logic Meter:
-45 63-5 1
Contribution 355 -10 136Sufficiencyconfidence 85% -3Attributionconfidence 80% -63
Start: 90Fail: 45
Acceptable: 40 FromStart: 67% CompleteTarget: 30 FromAcceptable: 0% Complete
Contributiontodate: 0
Efforttodate(p.ds): 82Timetodate(wks): 11.2
PROGRESS
Current: 50
S.8.Improvetheaveragetimetakenfromrecruitmenttoeffectiveworkingofstaff
Startofemploymentofaveragehiretomanager’ssign-off(days)
Owner: JC
90
4540
30
50
StarttoFailFailtoAcceptable
AcceptabletoTargetAboveTarget

Confidential! 26!© 2015 Routes to Value | All rights reserved!
Effective Tracking of Supply and Demand
COMPETENCEANALYTIC
BuildBuy
BorrowBind
BalanceBounce
Requires input from workforce management pipeline!

Confidential! 27!© 2015 Routes to Value | All rights reserved!
Reveals Effectiveness in Execution
Project Acorn – workstream 2 WS2!
Meter:
15 1315 1
Contribution 780 5 186Sufficiencyconfidence 80% 4Attributionconfidence 75% 39
Start: 60Fail: 75
Acceptable: 90 FromStart: 14% CompleteTarget: 95 FromAcceptable: 0% Complete
Contributiontodate: 0
Efforttodate:Timetodate:
PROGRESS
Current: 65
WS2Increasetheconfidenceintheestimatesoftimetocompletework
%increaseinconfidence
Owner: LS
StarttoFail AboveTarget
60
75
90
9565
StarttoFailFailtoAcceptable
AcceptabletoTargetAboveTarget
COMPETENCE!
TIME!
Work!
HIGH!
HIGH!
LOW!
LOW!
Confidential! 28!© 2015 Routes to Value | All rights reserved!
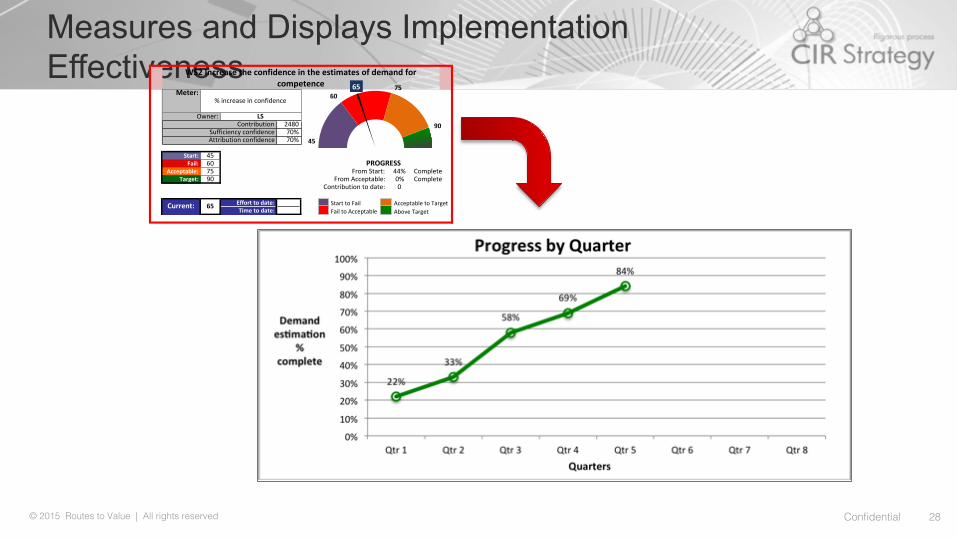
Measures and Displays Implementation Effectiveness
Meter:
15 3915 1
Contribution 2480 15 160Sufficiencyconfidence 70% 6Attributionconfidence 70% 51
Start: 45Fail: 60
Acceptable: 75 FromStart: 44% CompleteTarget: 90 FromAcceptable: 0% Complete
Contributiontodate: 0
Efforttodate:Timetodate:
PROGRESS
Current: 65
WS2Increasetheconfidenceintheestimatesofdemandforcompetence
%increaseinconfidence
Owner: LS
StarttoFail AboveTarget
45
6075
90
65
StarttoFailFailtoAcceptable
AcceptabletoTargetAboveTarget
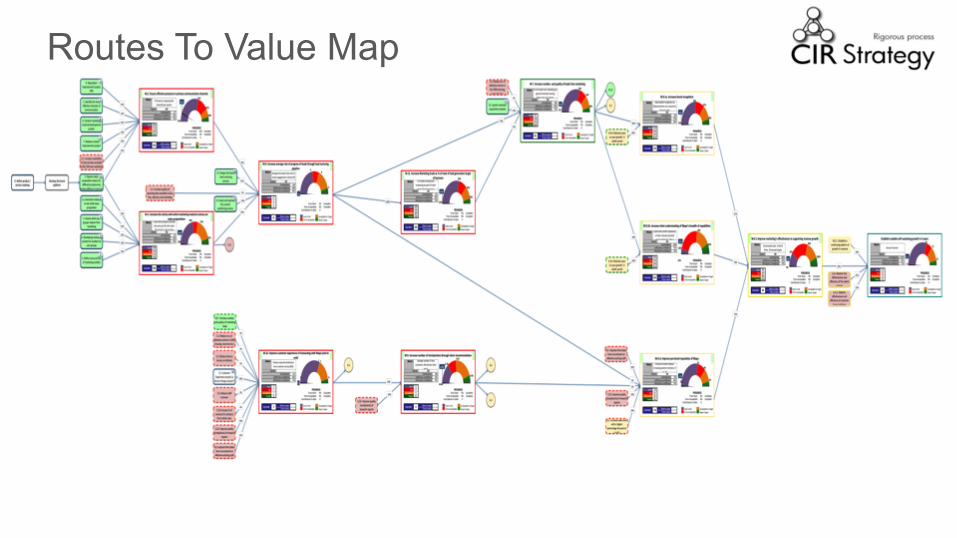
Routes To Value Map

Confidential! 30!© 2015 Routes to Value | All rights reserved!
Stakeholders and barriers to adoption of graphene!
Exercise!

Confidential! 31!© 2015 Routes to Value | All rights reserved!
Exercise
Barriers to adoption of IIoT B2B or B2C?!!Stakeholders!!Barriers by stakeholder!!Barrier scoring – if time: very high to very low!!
Confidence table helps address human error – a framework for validation!
We will produce the map and circulate it to all.!

Confidential! 32!© 2015 Routes to Value | All rights reserved!
Stakeholders and barriers