Full Obesity and diabetes: a heavy burden report (Word) 144KB

E p i d e m i o I o g y / H e a 11 h S e r v i c e s / P s y c h o s o c i a I R e s e a r c hN A L A R T I C L E
Global Burden of Diabetes, 1995-2025Prevalence, numerical estimates, and projections
HILARY KING, MD, DSC
RONALD E. AUBERT, PHD
WILLIAM H. HERMAN, MD, MPH
OBJECTIVE — To estimate the prevalence of diabetes and the number of people with dia-betes who are ^20 years of age in all countries of the world for three points in time, i.e., theyears 1995, 2000, and 2025, and to calculate additional parameters, such as sex ratio, urban-rural ratio, and the age structure of the diabetic population.
RESEARCH DESIGN AND METHODS — Age-specific diabetes prevalence estimateswere applied to United Nations population estimates and projections for the number of adultsaged 5:20 years in all countries of the world. For developing countries, urban and rural pop-ulations were considered separately.
RESULTS — Prevalence of diabetes in adults worldwide was estimated to be 4.0% in 1995and to rise to 5.4% by the year 2025. It is higher in developed than in developing countries.The number of adults with diabetes in the world will rise from 135 million in 1995 to 300 mil-lion in the year 2025. The major part of this numerical increase will occur in developing coun-tries. There will be a 42% increase, from 51 to 72 million, in the developed countries and a170% increase, from 84 to 228 million, in the developing countries. Thus, by the year 2025,>75% of people with diabetes will reside in developing countries, as compared with 62% in1995. The countries with the largest number of people with diabetes are, and will be in the year2025, India, China, and the U.S. In developing countries, the majority of people with diabetesare in the age range of 45-64 years. In the developed countries, the majority of people with dia-betes are aged ^65 years. This pattern will be accentuated by the year 2025. There are morewomen than men with diabetes, especially in developed countries. In the future, diabetes willbe increasingly concentrated in urban areas.
CONCLUSIONS — This report supports earlier predictions of the epidemic nature of dia-betes in the world during the first quarter of the 21st century. It also provides a provisional pic-ture of the characteristics of the epidemic. Worldwide surveillance of diabetes is a necessaryfirst step toward its prevention and control, which is now recognized as an urgent priority.
Diabetes Care 21:1414-1431,1998
I n 1993, the World Health Organization(WHO) Ad Hoc Diabetes Reporting Grouppublished standardized global estimates
for the prevalence of diabetes and impairedglucose tolerance in adults, based on datafrom 75 communities in 32 countries (1).
These estimates provided, for the firsttime, comparable information on theprevalence of abnormal glucose tolerancefrom many populations worldwide. How-ever, they did not meet the needs of thosewho frequently refer to the WHO diabetes
From the Division of Noncommunicable Diseases (H.K.), World Health Organization, Geneva, Switzerland;the Prudential Center for Health Care Research (R.E.A.), Atlanta, Georgia; and the Division of Endocrinologyand Metabolism (W.H.H.), Department of Internal Medicine, University of Michigan, Ann Arbor, Michigan.
Address correspondence and reprint requests to Dr. Hilary King, Division of Noncommunicable Dis-eases/DIA, 1211 Geneva 27, Switzerland. E-mail: [email protected].
Received for publication 24 December 1997 and accepted in revised form 5 May 1998.Abbreviations: EME, established market economies; FSE, former socialist economies of Europe; LAC,
Latin America and the Caribbean; MEC, Middle Eastern crescent; OAI, other Asia and islands; SSA, sub-Saha-ran Africa; WHO, World Health Organization.
A table elsewhere in this issue shows conventional and Systeme International (SI) units and conversionfactors for many substances.
program for information on the number ofpeople with diabetes in a particular coun-try/community, nor did they take accountof future trends in the burden of diabetes.
Therefore, a further study has nowbeen undertaken that links data from theglobal database collected by WHO withdemographic estimates and projectionsissued by the United Nations to estimatethe number of people with diabetes in allcountries of the world for three points intime, i.e., the years 1995, 2000, and 2025.In addition, the data have been analyzed interms of certain additional parameters,such as sex ratio, urban-rural ratio, and theage structure of the diabetic population.
The principal purpose of the projectwas to assemble numerical estimates andprojections for the frequency of diabetes inall countries as a primary source of infor-mation and as an aid to planning healthcare and public health interventions inWHO's member states.
RESEARCH DESIGN ANDMETHODS — This study is based on aset of 5-year age- and sex-specific estimatesof diabetes prevalence from rural and urbanareas of various countries. Criteria for inclu-sion were 1) a valid and apparently unbi-ased population sample and 2) a diagnosisof diabetes made according to the recom-mendations of recent WHO expert groups(2,3), i.e., a venous plasma glucose concen-tration of ^ 11.1 mmol/1 (or its equivalent)2 h after a 75-g oral glucose challenge. Stud-ies using only fasting blood glucose testingwere excluded. The estimates were drawnfrom the studies listed in the earlier report(1) with the addition of new survey datafrom China (4), Indonesia (5), Japan (6),Pakistan (7), and Uzbekistan (8). Thesedata were then applied to demographic esti-mates for the world's population issued bythe United Nations Population Division (9).
In accordance with United Nationsconvention, Europe (including the formersocialist economies), North America, Aus-tralia, New Zealand, and Japan were con-sidered "developed" countries, with allother countries designated as "developing"countries. For regional groupings, theaggregations proposed by the World Devel-opment Report 1993 were adopted (10).
1414 DIABETES CARE, VOLUME 21, NUMBER 9, SEPTEMBER 1998
Dow
nloaded from http://diabetesjournals.org/care/article-pdf/21/9/1414/586598/21-9-1414.pdf by guest on 11 January 2022

King, Aubert, and Herman
Because the great majority of peoplewith diabetes are adults, the study wasrestricted to subjects aged ^20 years. For thedeveloped countries, risk factors were notconsidered to differ markedly in rural andurban areas, and estimates were appliednationally. However, for developing coun-tries, rural and urban areas were consideredseparately, since prevalence is known to dif-fer markedly with differences in diet, physi-cal exercise, and other socioeconomic factors.Estimates for present and future urbanizationpatterns are also available from the UnitedNations Population Division (11,12). Wheneither rural or urban prevalence data wereunavailable, the urban rate was generallyassumed to be twice the available rural esti-mate, or the rural estimate was taken as one-half the available urban estimate. That thisrelation holds for most populations in devel-oping countries is evident from rural-urbancomparisons of the age-standardized esti-mates presented in the earlier report (1). Forcountries lacking valid prevalence estimates,extrapolation from the nearest or socioeco-nomically and ethnically most similar coun-try was performed. A listing of the dataapplied to each country's demographic esti-mates is given in APPENDIX l.
The assumption underlying the studymethodology was that, in addition to eth-nicity the size, sex distribution, age struc-ture, and degree of urbanization determinethe present and future frequency of diabetesin countries. Thus, for estimations for 1995,2000, and 2025, the baseline age- and sex-specific prevalence estimates within ruraland urban areas were maintained as a con-stant (i.e., inclusion in the models of popu-lation growth, aging, and urbanization wasconsidered sufficient to capture present andfuture trends in diabetes frequency).
Not all data sets included the full agerange under consideration (^20 years).Therefore, for each source of data, a logisticregression analysis was performed to esti-mate the relationship of age to the probabil-ity of having diabetes. The predictedprobability was then used as an estimate ofthe missing age-specific prevalence(s) so thatall the age-groups of interest, from 20-24years to ^80 years, could contribute to themodels. This method also resulted in a sta-bilization of rates when numbers from theraw data were quite sparse.
In certain cases, combinations of datawere made. For Novosibirsk, data for malesand females were combined because ofsmall numbers. For Israel, data from foursurveys were combined to give national
Developed Developing World
B1,200
1,000
800
•1 600 • -t
400 •-
200 •-
:slablished
Market
Economies
Formerly
socialists
economies
of Europe
Middle
Eastern
cresenl
India China Other Asia
and Islands
Latin
America
and the
Caribbean
Sub-
Saharan
Africa
Figure 1—Size of the adult population (aged ^20 years) by year and region. A: Developed and devel-oping countries and world total B: Major geographic areas. 53,1995; H,2000; • , 2025.
estimates. For China, data from the 1994National Diabetes Survey of 250,000 sub-jects in 16 provinces were aggregated intorural and urban estimates. For the U.K.,two surveys were combined. For the U.S.,National Health and Nutrition Examina-tion Survey II data were used for ages20-74 years, and Rancho Bernardo datawere used for older subjects.
RESULTS — The detailed numerical esti-mates and other parameters of interest arepresented for all countries and regions for theyears 1995,2000, and 2025 in APPENDIX 2.
DemographyThe size of the world's adult population(aged ^20 years) is shown by year andregion in Fig. 1. It can be seen that for thedeveloped countries, total population sizewill remain relatively stable, with an 11%increase from 1995 to 2025 of ~ 1 billion.
For the developing countries, the increasewill be around 80%, from ~2.5 billion in1995 to >4 billion in 2025. It is thisincrease that will determine the ~60%growth of the world's adult population as awhole over these 30 years, from >3 billionto >5 billion.
The rise in adult population size will bemodest in the former socialist economies ofEurope (FSE) (5%) and the establishedmarket economies (EME) (11%); moderatein China (39%); -80% in India, other Asiaand islands (OAI), and Latin America andthe Caribbean (LAC); and >100% in sub-Saharan Africa (SSA) and the Middle East-ern crescent (MEC).
Prevalence of diabetesThe prevalence of diabetes in adults aged^20 years is shown by year and region inFig. 2. Between 1995 and 2025 there willbe a 35% increase in the worldwide preva-
DIABETES CARE, VOLUME 21, NUMBER 9, SEPTEMBER 1998 1415
Dow
nloaded from http://diabetesjournals.org/care/article-pdf/21/9/1414/586598/21-9-1414.pdf by guest on 11 January 2022
Global burden of diabetes
Developed Developing World
B
Formerly Middle
socialists Eastern
economies of cresem
Europe
Other Asia Latin America Sub-Saharan
and Islands and the Africa
Caribbean
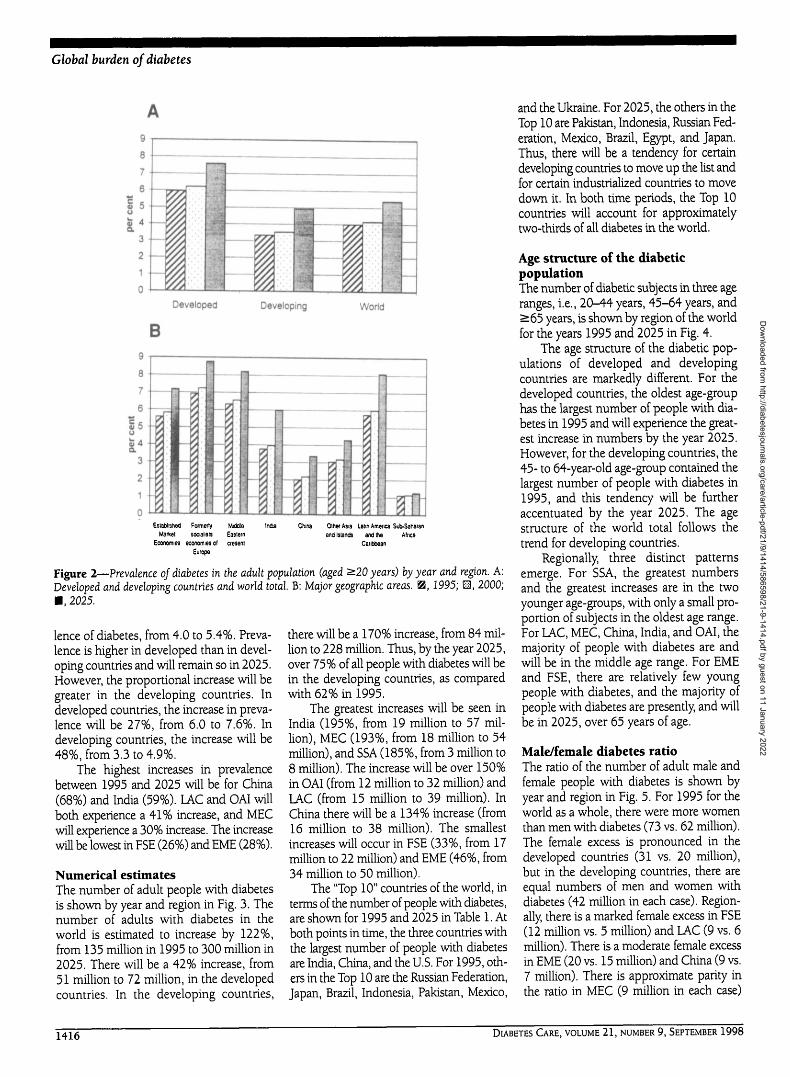
Figure 2—Prevalence oj diabetes in the adult population (aged ^-20 years) by year and region. A:Developed and developing countries and world total. B: Major geographic areas. H, 1995; H, 2000;M, 2025.
lence of diabetes, from 4.0 to 5.4%. Preva-lence is higher in developed than in devel-oping countries and will remain so in 2025.However, the proportional increase will begreater in the developing countries. Indeveloped countries, the increase in preva-lence will be 27%, from 6.0 to 7.6%. Indeveloping countries, the increase will be48%, from 3.3 to 4.9%.
The highest increases in prevalencebetween 1995 and 2025 will be for China(68%) and India (59%). LAC and OAI willboth experience a 41% increase, and MECwill experience a 30% increase. The increasewill be lowest in FSE (26%) and EME (28%).
Numerical estimatesThe number of adult people with diabetesis shown by year and region in Fig. 3. Thenumber of adults with diabetes in theworld is estimated to increase by 122%,from 135 million in 1995 to 300 million in2025. There will be a 42% increase, from51 million to 72 million, in the developedcountries. In the developing countries,
there will be a 170% increase, from 84 mil-lion to 228 million. Thus, by the year 2025,over 75% of all people with diabetes will bein the developing countries, as comparedwith 62% in 1995.
The greatest increases will be seen inIndia (195%, from 19 million to 57 mil-lion), MEC (193%, from 18 million to 54million), and SSA (185%, from 3 million to8 million). The increase will be over 150%in OAI (from 12 million to 32 million) andLAC (from 15 million to 39 million). InChina there will be a 134% increase (from16 million to 38 million). The smallestincreases will occur in FSE (33%, from 17million to 22 million) and EME (46%, from34 million to 50 million).
The "Top 10" countries of the world, interms of the number of people with diabetes,are shown for 1995 and 2025 in Table 1. Atboth points in time, the three countries withthe largest number of people with diabetesare India, China, and the U.S. For 1995, oth-ers in the Top 10 are the Russian Federation,Japan, Brazil, Indonesia, Pakistan, Mexico,
and the Ukraine. For 2025, the others in theTop 10 are Pakistan, Indonesia, Russian Fed-eration, Mexico, Brazil, Egypt, and Japan.Thus, there will be a tendency for certaindeveloping countries to move up the list andfor certain industrialized countries to movedown it. In both time periods, the Top 10countries will account for approximatelytwo-thirds of all diabetes in the world.
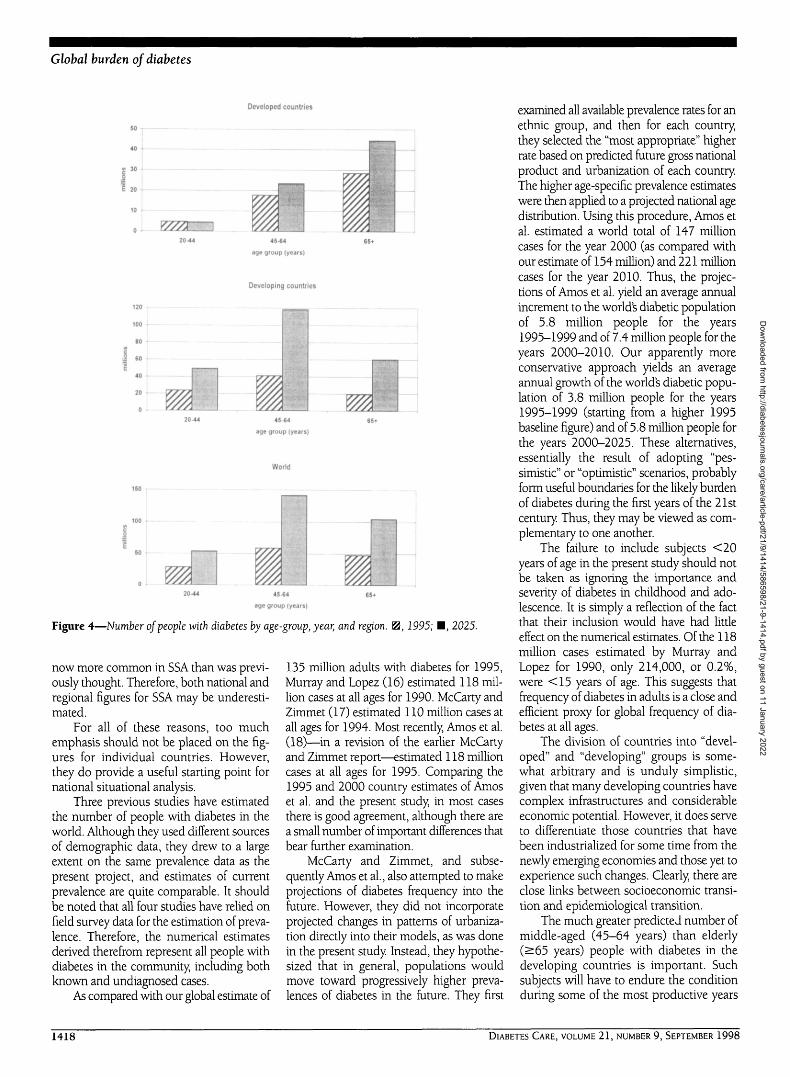
Age structure of the diabeticpopulationThe number of diabetic subjects in three ageranges, i.e., 20-44 years, 45-64 years, and^65 years, is shown by region of the worldfor the years 1995 and 2025 in Fig. 4.
The age structure of the diabetic pop-ulations of developed and developingcountries are markedly different. For thedeveloped countries, the oldest age-grouphas the largest number of people with dia-betes in 1995 and will experience the great-est increase in numbers by the year 2025.However, for the developing countries, the45- to 64-year-old age-group contained thelargest number of people with diabetes in1995, and this tendency will be furtheraccentuated by the year 2025. The agestructure of the world total follows thetrend for developing countries.
Regionally, three distinct patternsemerge. For SSA, the greatest numbersand the greatest increases are in the twoyounger age-groups, with only a small pro-portion of subjects in the oldest age range.For LAC, MEC, China, India, and OAI, themajority of people with diabetes are andwill be in the middle age range. For EMEand FSE, there are relatively few youngpeople with diabetes, and the majority ofpeople with diabetes are presently, and willbe in 2025, over 65 years of age.
Male/female diabetes ratioThe ratio of the number of adult male andfemale people with diabetes is shown byyear and region in Fig. 5. For 1995 for theworld as a whole, there were more womenthan men with diabetes (73 vs. 62 million).The female excess is pronounced in thedeveloped countries (31 vs. 20 million),but in the developing countries, there areequal numbers of men and women withdiabetes (42 million in each case). Region-ally, there is a marked female excess in FSE(12 million vs. 5 million) and LAC (9 vs. 6million). There is a moderate female excessin EME (20 vs. 15 million) and China (9 vs.7 million). There is approximate parity inthe ratio in MEC (9 million in each case)
1416 DIABETES CARE, VOLUME 21, NUMBER 9, SEPTEMBER 1998
Dow
nloaded from http://diabetesjournals.org/care/article-pdf/21/9/1414/586598/21-9-1414.pdf by guest on 11 January 2022

King, Aubert, and Herman
350
300
250
200
150
100
50
Developed Developing World
B70
60
50
40
30 --*
20 --S
10 --/1I
I -\
n-
- 1 r- 1 TTTIEstablished
Market
Economies
Formerly
socialists
economies
ol Europe
Middle
Eastern
cresent
India China Other Asia
and Islands Am
Ci
Lalin
erica and
thesribbean
Sub-
Saharan
Africa
Figure 3—Number of people with diabetes in the adult population (aged ^20 years) by year andregion. A: Developed and developing countries and world total. B: Major geographic areas. S3, 1995;m, 2000; S, 2025.
and OAI (6 million in each case). There is amale excess in India (11 vs. 8 million) andinSSA(1.8vs. 1.1 million).
By the year 2025, the worldwidefemale/male excess is estimated to bereduced somewhat (to 159 vs. 141 million).The female excess will decrease in FSE andEME but increase slightly in China, LAC,and MEC. The male excess will decrease inIndia, but it will increase in SSA.
Urban/rural diabetes ratioFor developing regions of the world, thestudy design permitted the calculation ofthe ratio of the frequency of diabetes inurban and rural areas (Fig. 6). Apart fromChina and SSA, all regions had at least asmany cases in urban as in rural areas in1995. By 2025, there will be a considerableexcess of diabetes in the urban areas. Themost extreme example is LAC (with a 12-fold excess), followed by MEC (with a 4-
fold excess) and India (with a 3-foldexcess). For developing countries as awhole, the urban/rural ratio in diabetes fre-
quency is predicted to rise from 1.6 in1995 to 3.3 in 2025.
CONCLUSIONS — The results of thisstudy suggest that for the world as a whole,between the years 1995 and 2025, theadult population will increase by 64%,prevalence of diabetes in adults willincrease by 35%, and the number of peo-ple with diabetes will increase by 122%.For the developed countries, there will bean 11% increase in the adult population, a27% increase in the prevalence of adultdiabetes, and a 42% increase in the num-ber of people with diabetes. For the devel-oping countries, there will be an 82%increase in the adult population, a 48%increase in the prevalence of adult dia-betes, and a 170% increase in the numberof people with diabetes.
Because of a lack of suitable survey data,many extrapolations were necessary in thisstudy (all of SSA was estimated based on thedata from Tanzania). Even when a survey ina particular country was available, its find-ings may not necessarily have been nation-ally representative (it is unlikely that thereare three times as many men as women withdiabetes in Australia and New Zealand; thisresult was due to a relatively high number ofelderly diabetic men being identified in theonly available Australian study).
Additional caution should be expressedover the fact that some of the studies wereconducted in the 1980s and therefore maynot reflect the current situation. Somerecent reports have suggested quite sub-stantial increases in prevalences in countriessuch as India (13) and Korea (14). A recentreport from Nigeria (15), as well as clinicalobservation, also suggests that diabetes is
Table 1—Top ten countries for estimated number of adults with diabetes, 1995 and 2025
Rank1234567
8910
Country
IndiaChinaU.S.Russian FederationJapanBrazilIndonesiaPakistanMexicoUkraine
All other countriesTotal
1995 (millions)
19.416.013.98.96.34.94.5
4.33.83.6
49.7135.3
Country
IndiaChinaU.S.PakistanIndonesiaRussian FederationMexicoBrazilEgyptJapan
2025 (millions)
57.237.621.914.512.412.211.711.68.88.5
103.6300.0
DIABETES CARE, VOLUME 21, NUMBER 9, SEPTEMBER 1998 1417
Dow
nloaded from http://diabetesjournals.org/care/article-pdf/21/9/1414/586598/21-9-1414.pdf by guest on 11 January 2022
Global burden of diabetes
Developed countries
1 20
45-64
age group (years)
Developing countries
120
100
80
I 60
40
-
7777,
WA V//A45-64
age group (years)
World
n n45-64
age group (years)
Figure 4—Number of people with diabetes by age-group, year, and region, ffl, 1995; M, 2025.
now more common in SSA than was previ-ously thought. Therefore, both national andregional figures for SSA may be underesti-mated.
For all of these reasons, too muchemphasis should not be placed on the fig-ures for individual countries. However,they do provide a useful starting point fornational situational analysis.
Three previous studies have estimatedthe number of people with diabetes in theworld. Although they used different sourcesof demographic data, they drew to a largeextent on the same prevalence data as thepresent project, and estimates of currentprevalence are quite comparable. It shouldbe noted that all four studies have relied onfield survey data for the estimation of preva-lence. Therefore, the numerical estimatesderived therefrom represent all people withdiabetes in the community, including bothknown and undiagnosed cases.
As compared with our global estimate of
135 million adults with diabetes for 1995,Murray and Lopez (16) estimated 118 mil-lion cases at all ages for 1990. McCarty andZimmet (17) estimated 110 million cases atall ages for 1994. Most recently, Amos et al.(18)—in a revision of the earlier McCartyand Zimmet report—estimated 118 millioncases at all ages for 1995. Comparing the1995 and 2000 country estimates of Amoset al. and the present study, in most casesthere is good agreement, although there area small number of important differences thatbear further examination.
McCarty and Zimmet, and subse-quently Amos et al., also attempted to makeprojections of diabetes frequency into thefuture. However, they did not incorporateprojected changes in patterns of urbaniza-tion directly into their models, as was donein the present study Instead, they hypothe-sized that in general, populations wouldmove toward progressively higher preva-lences of diabetes in the future. They first
examined all available prevalence rates for anethnic group, and then for each country,they selected the "most appropriate" higherrate based on predicted future gross nationalproduct and urbanization of each country.The higher age-specific prevalence estimateswere then applied to a projected national agedistribution. Using this procedure, Amos etal. estimated a world total of 147 millioncases for the year 2000 (as compared withour estimate of 154 million) and 221 millioncases for the year 2010. Thus, the projec-tions of Amos et al. yield an average annualincrement to the worlds diabetic populationof 5.8 million people for the years1995-1999 and of 7.4 million people for theyears 2000-2010. Our apparently moreconservative approach yields an averageannual growth of the worlds diabetic popu-lation of 3.8 million people for the years1995-1999 (starting from a higher 1995baseline figure) and of 5.8 million people forthe years 2000-2025. These alternatives,essentially the result of adopting "pes-simistic" or "optimistic" scenarios, probablyform useful boundaries for the likely burdenof diabetes during the first years of the 21stcentury Thus, they may be viewed as com-plementary to one another.
The failure to include subjects <20years of age in the present study should notbe taken as ignoring the importance andseverity of diabetes in childhood and ado-lescence. It is simply a reflection of the factthat their inclusion would have had littleeffect on the numerical estimates. Of the 118million cases estimated by Murray andLopez for 1990, only 214,000, or 0.2%,were <15 years of age. This suggests thatfrequency of diabetes in adults is a close andefficient proxy for global frequency of dia-betes at all ages.
The division of countries into "devel-oped" and "developing" groups is some-what arbitrary and is unduly simplistic,given that many developing countries havecomplex infrastructures and considerableeconomic potential. However, it does serveto differentiate those countries that havebeen industrialized for some time from thenewly emerging economies and those yet toexperience such changes. Clearly, there areclose links between socioeconomic transi-tion and epidemiological transition.
The much greater predicted number ofmiddle-aged (45-64 years) than elderly(^65 years) people with diabetes in thedeveloping countries is important. Suchsubjects will have to endure the conditionduring some of the most productive years
1418 DIABETES CARE, VOLUME 21, NUMBER 9, SEPTEMBER 1998
Dow
nloaded from http://diabetesjournals.org/care/article-pdf/21/9/1414/586598/21-9-1414.pdf by guest on 11 January 2022

King, Aubert, and Herman
1.2
1.0
0.8
o1 0.6
0.4
0.2
0.0 IDeveloped Developing World
B1.8
1.6
1.4
1.2
o 1.0S 0.8
0.60.40.20.0
y" /
/' /
i
- -\
-
-
?
/- i -1-
y
////
-
Established Formerly MiddeMarket socialists Eastern
Economics economies cresenlof Europe
Other Asia Latin Sub-and Istand3 America and Saharan
the AfricaCaribbean
Figure 5—Male/female ratio oj number of people with diabetes by year and region. A: Developed anddeveloping countries and world total. B: Major geographic areas. 0 ,1995; E3, 2000; • , 2025.
3.5
3.0
2.5
o 2.0
2 1.5
1.0
0.5
0.0
mB
14.0
12.0
10.0
8.0
6.0
4.0
2.0
0.0 1 n i c^rflMiddle Eastern India
cresenlChina Other Asia and
Islands
Latin America
andlneCaribbean
Sub-Sahara
Africa
Figure 6—Urban/rural ratio oj number of people with diabetes by year and region. A: Developingcountries. B: Major geographic areas. 0 , 1995; M, 2000; M, 2025.
of their lives. They will also have moreyears of life to develop the chronic compli-cations of diabetes than will the generallyelderly diabetic population of the industri-alized countries. This will have majorimplications with respect to health careneeds, resource utilization, and cost.
The fact that there are more womenthan men with diabetes in many countries isalso notable. For the developed countries, alikely explanation is the greater longevity ofwomen. However, in the developing coun-tries, diabetes is more common in the mid-dle-aged than the elderly (Fig. 4), underwhich circumstances the previous explana-tion is less likely In this case, it may be dif-ferential distribution of risk factors—especially diet, physical inactivity, and cen-tral obesity—in men and women that maydetermine the male/female ratio. If so, theratio may have public health, as well ashealth planning, significance.
The increasing concentration of dia-betes in urban areas of developing coun-tries, which may be largely accounted forby the rapid growth in size of the majorurban conglomerates of developing coun-tries, as well as by the aging of their popu-lations, should also be borne in mind whenplanning future health care systems.
In summary, this report supports ear-lier predictions of the epidemic nature ofdiabetes in the world during the first quar-ter of the 21st century. It also provides aprovisional picture of the characteristics ofthe epidemic. The database is a contribu-tion to an ongoing process of worldwidesurveillance of diabetes, its complications,and related disorders, which recently ledthe WHO to recommend prevalence ofdiabetes as one of the "basic health indica-tors" for its member states (19). Such sur-veillance is a first step toward the integratedprevention and control of diabetes andother noncommunicable diseases, whichis now recognized as an urgent priority fornational and international health authori-ties (20).
Acknowledgments— This project was con-ceived as a joint collaboration between theWHO diabetes program and the Division ofDiabetes Translation, Centers for Disease Con-trol and Prevention, Atlanta, Georgia, during theperiod of employment of R.E.A. and W.H.H. inthe Division of Diabetes Translation, Centersfor Disease Control and Prevention.
The authors thank the members of theWHO Ad Hoc Diabetes Reporting Group whosupplied the survey data used in this study.
DIABETES CARE, VOLUME 21, NUMBER 9, SEPTEMBER 1998 1419
Dow
nloaded from http://diabetesjournals.org/care/article-pdf/21/9/1414/586598/21-9-1414.pdf by guest on 11 January 2022

Global burden of diabetes
Appendix 1—Description of survey data used for the calculation of country estimates
Country
EMEAustraliaAustriaBelgiumCanadaDenmarkFinlandFranceGermanyGreeceIrelandItalyJapanNetherlandsNew ZealandNorwayPortugalSpainSwedenSwitzerlandU.K.U.S.
FSEAlbaniaBelarusBulgariaCzech RepublicHungaryLithuaniaPolandRepublic ofMoldova
RomaniaRussian
FederationSlovakiaUkraineYugoslavia
MECAfghanistanAlgeriaArmeniaAzerbaijanBahrainCyprus
EgyptGeorgiaIran,
IslamicRepublic of
IraqIsraelJordanKazakhstan
KuwaitKyrgyzstan
LebanonLibyan ArabJamahiriya
MoroccoOmanPakistanQatarSaudi ArabiaSyriaTajikistan
TunisiaTurkeyTurkmenistan
Urbanprevalence
AustraliaU.K.U.K.Hanes: U.S.FinlandFinlandU.K.U.K.Sanza, ItalyU.K.Sanza, ItalyJapanU.K.AustraliaFinlandSanza, ItalySanza, ItalyFinlandU.K.U.K.Hanes: U.S.
WroclawNovosibirskWroclawWroclawWroclawWroclawWroclawWroclaw
WroclawNovosibirsk
WroclawNovosibirskWroclaw
Cairo X 0.5TunisiaCairo X 0.5Cairo X 0.5OmanCairoCairoCairo x 0.5Cairo X 0.5
Cairo x 0.5IsraelCairoUzbekistan
X 1.5OmanUzbekistan
X 1.5CairoTunisia
TunisiaOmanPakistanOmanOmanCairoUzbekistan
x 1.5TunisiaTunisiaUzbekistan
X 1.5
Ruralprevalence
AustraliaU.K.U.K.Hanes: U.S.FinlandFinlandU.K.U.K.Sanza, ItalyU.K.Sanza, ItalyJapanU.K.AustraliaFinlandSanza, ItalySanza, ItalyFinlandU.K.U.K.Hanes: U.S.
WroclawNovosibirskWroclawWroclawWroclawWroclawWroclawWroclaw
WroclawNovosibirsk
WroclawNovosibirskWroclaw
Baluchistan X 0.5Tunisia x 0.5Baluchistan X 0.5Baluchistan X 0.5Oman X 0.5KaliubiaKaliubiaBaluchistan X 0.5Kaliubia X 0.5
Kaliubia X 0.5IsraelKaliubiaUzbekistan
Oman X 0.5Uzbekistan
x 0.5KaliubiaTunisia x 0.5
Tunisia x 0.5Oman X 0.5Pakistan x 0.5Oman x 0.5Oman X 0.KaliubiaUzbekistan
X 0.5Tunisia X 0.5Tunisia X 0.5Uzbekistan
Ref.
21
22,2322,2324,252626
22,2322,2327
22,23276
22,232126272726
22,2322,2324,25
28*282828282828
28*
28*28
29,73029,729,7312929
29,729
2932298
318
2930
303173131298
30308
Country
United ArabEmirates
Uzbekistan
YemenIndiaChinaOAI
BangladeshBhutanBruneiDarussalam
CambodiaCook IslandsDemocratic
Urbanprevalence
Oman
UzbekistanX 1.5
Cairo X 0.5India, urbanChina, urban
BangkokBangkokBangkok
BangkokFijiBangkok
Peoples Republicof Korea
East TimorFijiHong KongIndonesiaKiribatiLao Peopled
DemocraticRepublic
MalaysiaMaldivesMarshall IslandsMicronesiaMongoliaMyanmarNauruNepalNiuePalauPapuaNew Guinea
PhilippinesRepublic of
KoreaSamoaSingaporeSolomon IslandsSri LankaThailandTongaTuvaluVanuatuVietnam
LACAntigua
and BarbudaArgentinaBahamasBarbadosBelizeBoliviaBrazilChileColombiaCosta RicaCubaDominicaDominican
RepublicEcuadorEl SalvadorGrenadaGuadeloupeGuatemalaGuyanaHaitiHonduras
BangkokFijiBangkokIndonesiaFijiBangkok
BangkokBangkokFijiFijiBangkokBangkokFijiBangkokFijiFijiFiji
BangkokBangkok
FijiBangkokFijiBangkokBangkokFijiFijiFijiBangkok
St. James
BogotaSt. JamesSt. JamesBogotaBogotaSao PauloBogotaBogotaBogotaSt. JamesSt. JamesSt. James
BogotaBogotaSt. JamesSt. JamesBogotaSt. JamesSt. JamesSt. James
Ruralprevalence
Oman x 0.5
Uzbekistan
Kaliubia x 0.5India, ruralChina, rural
Bangkok X 0.5Bangkok X 0.5Bangkok X 0.5
Bangkok x 0.5Fiji X 0.5Bangkok x 0.5
Bangkok x 0.5Fiji X 0.5Bangkok X 0.5Indonesia X 0.5Fiji x 0.5Bangkok X 0.5
Bangkok X 0.5Bangkok x 0.5Fiji x 0.5Fiji X 0.5Bangkok X 0.5Bangkok X 0.5Fiji X 0.5Bangkok X 0.5Fiji X 0.5Fiji X 0.5Fiji x 0.5
Bangkok x 0.5Bangkok X 0.5
Fiji X 0.5Bangkok X 0.5Fiji x 0.5Bangkok x 0.5Bangkok x 0.5Fiji X 0.5Fiji x 0.5Fiji x 0.5Bangkok x 0.5
St. James x 0.5
Bogota X 0.5St. James X 0.5St. James x 0.5Bogota X 0.5Bogota X 0.5Sao Paulo X 0.5Bogota x 0.5Bogota x 0.5Bogota x 0.5St. James x 0.5St. James X 0.5St. James X 0.5
Bogota X 0.5Bogota x 0.5St. James X 0.5St. James x 0.5Bogota x 0.5St. James x 0.6St. James X 0.5St. James x 0.5
Ref.
31
8
29334
343434
343534
34353453534
3434353534343534353535
3434
353435343435353534
36
373636373738373737363636
3737363637363636
Country
JamaicaMartiniqueMexicoNeth. AntillesNicaraguaPanamaParaguayPeruPuerto RicoSt. Kitts
and NevisSt. LuciaSt. Vincent and
the GrenadinesSurinameTrinidad andTobago
UruguayVenezuela
SSAAngolaBeninBotswanaBurkina FasoBurundiCameroonCape VerdeCentral AfricanRepublic
ChadComorosCongoC6te d'lvoireDjiboutiEquatorial
GuineaEritreaEthiopiaGabonGambiaGhanaGuineaGuinea-BissauKenyaLesothoLiberiaMadagascarMalawiMaliMauritaniaMauritiusMozambiqueNamibiaNigerNigeriaReunionRwandaSao Tome and
PrincipeSenegalSeychellesSierra LeoneSomaliaSouth AfricaSudanSwazilandTogoUgandaUnited Republic
of TanzaniaZaireZambiaZimbabwe
Urbanprevalence
St. JamesSt. JamesMexico CitySt. JamesBogotaBogotaBogotaBogotaSt. JamesSt. James
St. JamesSt. James
St. JamesSt. James
BogotaBogota
Dar-es-SalaamDar-es-SalaamDar-es-SalaamDar-es-SalaamDar-es-SalaamDar-es-SalaamDar-es-SalaamDar-es-Salaam
Dar-es-SalaamDar-es-SalaamDar-es-SalaamDar-es-SalaamDar-es-SalaamDar-es-Salaam
Dar-es-SalaamDar-es-SalaamDar-es-SalaamDar-es-SalaamDar-es-SalaamDar-es-SalaamDar-es-SalaamDar-es-SalaamDar-es-SalaamDar-es-SalaamDar-es-SalaamDar-es-SalaamDar-es-SalaamDar-es-SalaamDar-es-SalaamDar-es-SalaamDar-es-SalaamDar-es-SalaamDar-es-SalaamDar-es-SalaamDar-es-SalaamDar-es-Salaam
Dar-es-SalaamDar-es-SalaamDar-es-SalaamDar-es-SalaamDar-es-SalaamDar-es-SalaamDar-es-SalaamDar-es-SalaamDar-es-SalaamDar-es-Salaam
Dar-es-SalaamDar-es-SalaamDar-es-Salaam
Ruralprevalence
St. James x 0.5St. James X 0.5Mexico City X 0.5St. James X 0.5Bogota X 0.5Bogota X 0.5Bogota X 0.5Bogota X 0.5St. James x 0.5St. James X 0.5
St. James X 0.5St. James X 0.5
St. James X 0.5St. James X 0.5
Bogota x 0.5Bogota x 0.5
WaluguruWaluguruWaluguruWaluguruWaluguruWaluguruWaluguruWaluguru
WaluguruWaluguruWaluguruWaluguruWaluguruWaluguru
WaluguruWaluguruWaluguruWaluguruWaluguruWaluguruWaluguruWaluguruWaluguruWaluguruWaluguruWaluguruWaluguruWaluguruWaluguruWaluguruWaluguruWaluguruWaluguruWaluguruWaluguruWaluguru
WaluguruWaluguruWaluguruWaluguruWaluguruWaluguruWaluguruWaluguruWaluguruWaluguru
WaluguruWaluguruWaluguru
Ref.
36363936373737373636
3636
3636
3737
4040404040404040
404040404040
40404040404040404040404040404040404040404040
40404040404040404040
404040
Personally communicated data: *E. Shubnikov.
1420 DIABETES CARE, VOLUME 21, NUMBER 9, SEPTEMBER 1998
Dow
nloaded from http://diabetesjournals.org/care/article-pdf/21/9/1414/586598/21-9-1414.pdf by guest on 11 January 2022

King, Aubert, and Herman
Appendix 2—Population size, prevalence of diabetes, and number of people with diabetes in adults aged 20 years and over—1995,2000, and 2025
Countryand year
World199520002025
Developed countries199520002025
Developing countries199520002025
Established market economies199520002025
Andorra199520002025
Australia199520002025
Austria199520002025
Belgium199520002025
Canada199520002025
Denmark199520002025
Finland199520002025
France199520002025
Germany199520002025
Greece199520002025
Iceland199520002025
Ireland199520002025
Italy199520002025
Japan199520002025
Luxembourg199520002025
Malta199520002025
Monaco199520002025
Population(000)
3,397,6043,719,5515,572,260
856,952883,442953,703
2,540,6522,836,1094,618,557
612,477633,575697,518
444647
12,93913,85818,374
6,0856,2306,523
7,6887,8378,077
21,39122,60928,551
3,9723,9993,963
3,8053,8994,082
42,75044,02747,154
63,97464,59563,008
7,9638,2918,069
183197248
2,3452,4882,842
44,86345,88543,757
96,16399,63198,404
314329341
259272314
242526
Prevalence(%)
4.04.25.4
5.96.27.6
3.33.54.9
5.65.87.1
7.17.17.0
2.52.73.3
2.02.12.7
2.12.22.7
7.27.59.2
8.38.410.8
7.98.311.1
2.12.12.6
2.12.22.8
7.67.89.6
7.07.29.3
1.81.82.3
7.57.810.0
6.56.98.7
2.02.12.7
1.81.92.5
2.12.12.1
Rural
———
———
33,05136,21553,176
———
———
——
———
—
—
——
———
—
—
———
———
——
——
———
——
_——
——
—
—
Urban
———
———
51,22063,320174,472
———
———
———
———
———
——
———
———
———
———
———
———
———
——
——
——
—
—
——
Male
62,13071,470141,936
19,88021,54429,765
42,25049,925112,171
14,50715,66921,752
1.51.61.6
241269466
545988
7579105
651723
1,154
141144188
118130193
399425569
610661856
262276317
6.26.411
212232
1,4141,4891,747
2,6842,9493,601
2.93.14.4
2.22.53.8
0.20.20.2
Number of people (000)
Female
73,15682,922158,037
31,09433,26642,484
42,06249,657115,554
19,54621,07428,075
1.61.71.7
8898144
697191
8892116
882978
1,464
189191240
182192261
482510665
749773914
345374455
6.67.812
222434
1,9562,1032,618
3,5853,9564,942
3.43.64.9
2.52.84.0
0.30.30.3
20-44
28,64232,60853,874
4,7944,8784,420
23,84827,73049,454
3,8303,9413,568
———
474953
6.26.95.2
8.18.36.4
239248238
10107.9
11108.9
464640
646951
677056
0.60.60.6
333
377399265
465442375
0.30.40.3
0.30.30.3
——
Age (years)45-64
58,74767,899141,418
17,63919,14923,378
41,10848,749118,041
13,66314,98618,699
———
122142219
495474
656784
651753
1,039
8190103
808994
347366464
585613734
239238276
3.13.55.7
182028
1,2911,3111,595
2,8172,9552,837
2.72.93.7
2.22.42.9
——
>65
47,85153,832104,599
28,53630,77744,445
19,31523,05560,154
16,55517,81127,554
———
161176339
686999
9095130
643701
1,341
238235318
210222350
488524731
710752986
300342440
9.11017
222336
1,7021,8822,505
2,9873,5085,331
3.23.55.3
2.32.64.5
———
Total
135,286154,392299,974
50,97454,81072,248
84,31399,582
227,725
34,05436,74349,826
3.13.33.3
330367610
123130178
164171221
1,5321,7012,618
329335428
300322454
881935
1,234
1,3591,4341,770
607650772
131423
434666
3,3693,5924,365
6,2696,9058,543
6.26.89.3
4.85.37.7
0.50.50.5
DIABETES CARE, VOLUME 21, NUMBER 9, SEPTEMBER 1998 1421
Dow
nloaded from http://diabetesjournals.org/care/article-pdf/21/9/1414/586598/21-9-1414.pdf by guest on 11 January 2022

Global burden of diabetes
Appendix 2 (continued)
Number of people (000)
Countryand year
Netherlands199520002025
New Zealand199520002025
Norway199520002025
Portugal199520002025
San Marino199520002025
Spain199520002025
Sweden199520002025
Switzerland199520002025
U.K.199520002025
U.S.199520002025
Formerly socialist econom199520002025
Albania199520002025
Belarus199520002025
Population(000)
11,73012,08512,898
2,4762,6193,227
3,2253,2693,550
7,1987,3987,630
202120
29,95431,37431,213
6,6086,6837,380
5,5325,7186,105
43,36543,78446,756
187,607196,407244,959
lies of Europe244,475249,867256,185
2,0402,2153,323
7,2167,3137,509
Bosnia and Herzegovina199520002025
Bulgaria199520002025
Croatia199520002025
Czech Republic199520002025
Estonia199520002025
Hungary199520002025
Latvia199520002025
Lithuania199520002025
2,4373,1383,474
6,5096,5326,150
3,3233,3413,269
7,4247,6417,936
1,1061,1011,087
7,4597,5157,141
1,8591,8211,771
2,6312,6582,802
Prevalence(%)
1.92.02.7
2.52.63.2
8.68.610.2
7.17.38.8
7.67.67.6
7.27.39.5
9.39.411.2
2.02.12.8
2.12.12.5
7.47.68.9
6.97.28.8
2.82.93.9
8.99.511.4
3.43.65.0
4.44.45.0
4.44.55.1
4.14.14.7
4.44.45.0
4.44.44.9
4.54.65.0
4.24.34.9
Age (years)Rural Urban Male Female 20-44 45-64 >65 Total
104115172
465078
117119160
213222280
0.60.60.6
9149701,244
265272372
505584
419434564
5,6976,1929,462
5,3735,8758,013
232653
209233311
314264
102101103
515255
105112129
151517
107107111
252527
343543
119127182
171925
159161203
300316394
0.90.90.9
1,2421,3331,709
350360456
596386
493500622
8,1568,81712,430
11,54712,19214,409
343978
432463543
5171109
183190207
9498112
202202244
343437
220223241
585962
767993
131310.0
8.89.39.1
8.78.97.5
646856
262285205
161716
5.96.44.6
434640
2,0662,1262,112
964937852
7.48.611
303027
9.51210
201917
11109.4
252322
3.73.63.4
252219
6.06.05.5
8.69.18.4
94106141
232638
596687
194198266
8048081163
134150168
465068
359380491
5,5996,4968,720
3,9754,1634,679
313571
104101120
455984
139136140
727173
146160178
232324
152155155
393839
525162
116123203
313356
209205269
255272352
—
1,0911,2101,584
464465644
586198
510508655
6,1886,38711,060
11,98012,96616,892
192249
507564707
284378
127136153
626985
136131174
222327
150152178
384045
495467
222242354
6368103
276280363
513538674
1.51.61.5
2,1562,3032,952
614631827
109118170
912934
1,186
13,85315,00921,892
16,92018,06722,422
5865131
641696854
82114172
286290311
145150167
307314373
494955
326329352
838489
110115137
1422 DIABETES CARE, VOLUME 21, NUMBER 9, SEPTEMBER 1998
Dow
nloaded from http://diabetesjournals.org/care/article-pdf/21/9/1414/586598/21-9-1414.pdf by guest on 11 January 2022

King, Aubert, and Herman
Appendix 2 (continued)
Countryand year
Poland199520002025
Republic of Moldova199520002025
Romania199520002025
Russian Federation199520002025
Slovakia199520002025
Slovenia199520002025
Population(000)
26,40327,49830,483
2,8933,0133,645
16,23916,74216,992
105,326106,994107,169
3,6563,8544,399
1,4391,4861,457
The Former Yugoslav Republic of Macedonia199520002025
Ukraine199520002025
Yugoslavia199520002025
The Middle Eastern Crescent199520002025
Afghanistan199520002025
Algeria199520002025
Armenia199520002025
Azerbaijan199520002025
Bahrain199520002025
Cyprus199520002025
Egypt199520002025
Georgia199520002025
Iraq199520002025
Islamic Republic of Iran199520002025
Israel199520002025
1,4571,5611,894
37,42337,77737,234
7,6357,6678,450
290,043335,553653,472
9,99313,61925,134
13,92316,55730,966
2,2292,4223,361
4,4734,8817,168
339383658
495521678
32,65537,25566,125
3,7453,8514,464
9,39411,14024,677
30,66934,96676,814
3,4863,8435,564
Prevalence(%)
3.94.04.7
3.73.74.2
4.04.04.8
8.49.011.4
3.83.84.6
4.34.45.3
3.43.64.6
9.610.111.8
4.14.24.6
6.36.58.2
4.14.15.3
4.34.66.3
6.97.38.9
6.46.78.7
8.49.612.8
13.114.217.4
9.910.213.3
7.88.19.3
6.06.17.0
5.55.76.8
8.58.510.2
Rural
———
———
———
———
———
———
———
———
——
5,7256,3179,999
276364575
173165295
353637
656777
2.32.84.2
161716
9621,0811,592
666351
5864104
318324543
171619
Urban
———
———
———
———
———
———
———
———
——
12,57515,64843,550
136196748
433599
1,642
120141261
220259549
263480
4858102
2,2782,7207,211
227247363
504614
1,635
1,3741,6534,672
280310547
Male
353375472
363752
238238292
2,6933,0134,407
464968
212225
202232
1,1461,2541,612
117117139
9,33211,24526,703
200272596
330424993
6172
111
112132234
172246
252944
1,4281,6793,756
105113147
246297739
739858
2,221
151168296
Number of people (000)
Female
688729953
7175102
416437526
6,2016,5667,832
9298134
404352
303455
2,4302,5482,778
194203252
8,96810,72026,845
212287727
276340944
94105187
173194392
111538
404574
1,8112,1225,046
188197267
315381
1,001
9531,1192,994
145159270
20-44
1009497
111112
545250
456443381
131313
4.84.64.0
5.45.55.8
148147131
262425
6,6807,89916,247
174257456
207265474
495568
100116147
131417
182024
1,2831,4482,706
717682
228271605
668780
1,843
262737
Age (years)45-64
493525614
525572
328324393
1,4691,5511,715
657194
303134
273042
546591591
161156179
8,41310,20126,782
183230659
273344
1,041
6674
135
120127309
121841
313654
1,4421,7444,229
130134189
248302820
706809
2,352
124143243
>65
449484714
434670
272299375
6,9697,58610,144
606495
263038
172139
2,8813,0633,667
124141187
3,2073,86410,520
5572
208
125154422
394895
6482170
3.54.527
161840
5156091867
91101144
85105314
318388
1,020
147157286
Total
1,0411,1031,425
107113154
654675817
8,8949,57912,240
138148202
616577
505687
3,5763,8014,389
311320391
18,30021,96453,549
412559
1,323
606764
1,937
155177298
285325627
293784
6574118
3,2403,8018,802
293310414
561678
1,739
1,6921,9775,215
297327566
DIABETES CARE, VOLUME 21, NUMBER 9, SEPTEMBER 1998 1423
Dow
nloaded from http://diabetesjournals.org/care/article-pdf/21/9/1414/586598/21-9-1414.pdf by guest on 11 January 2022

Global burden of diabetes
Appendix 2 (continued)
Countryand year
Jordan199520002025
Kazakhstan199520002025
Kuwait199520002025
Kyrgyzstan199520002025
Lebanon199520002025
Libyan Arab Jamahiriya199520002025
Morocco199520002025
Oman199520002025
Pakistan199520002025
Qatar199520002025
Saudi Arabia199520002025
Syria199520002025
Tajikistan199520002025
Tunisia199520002025
Turkey199520002025
Turkmenistan199520002025
United Arab Emirates199520002025
Uzbekistan199520002025
Yemen199520002025
India199520002025
China199520002025
Population(000)
2,4722,9866,842
10,46311,17615,408
7659921,912
2,5282,8104,853
1,6901,8953,086
2,3892,8556,783
14,23316,59928,183
9201,1142,918
64,49475,111166,975
362397551
8,51710,37423,162
6,1227,44418,733
2,8733,3407,164
4,8465,5759,240
35,16039,35563,457
2,0682,3704,441
1,1771,3022,021
11,43113,12425,016
6,1327,29617,118
515,361577,814957,337
800,890859,0861,116,209
Prevalence(%)
11.011.313.8
4.74.85.8
8.08.712.4
4.24.24.9
13.713.818.0
5.35.45.7
4.34.46.2
6.56.77.4
6.77.18.7
9.411.113.6
8.79.110.1
9.59.612.0
3.83.74.3
4.74.96.8
5.25.67.2
3.63.64.7
9.210.812.9
3.73.74.7
3.74.05.2
3.84.06.0
2.02.23.4
Rural
333663
194196220
5.06.712
7478113
131214
111117
211238383
293359
2,1592,4734,229
2.63.43.8
8085131
135156315
7482144
566187
358320356
303151
101217
171179285
92103185
8,1359,08614,094
9,38210,06813,047
Urban
239302881
292338681
5680226
3340126
219251541
115142368
3974911,364
3042158
2,1792,83710,294
314071
6648592,203
4445621,938
3442162
173211544
1,4831,8964,195
4555157
98129243
257312884
138188705
11,26213,79343,149
6,6348,56924,509
Male
118149401
241265462
2842115
5359127
88100205
7792212
323387866
3139108
2,6283,2088,669
253347
4375591,244
249312972
5765169
122145314
1,0031,1942,277
3945114
80103159
222255641
96126417
11,15213,12331,514
7,0148,17615,984
Number of people (000)
Female
154189543
246268439
3244123
5459111
144163350
4961173
285342881
2835109
1,7102,1025,853
8.51128
3073851,090
3304061,281
5160137
107127317
8381,0232,274
364193
2938101
207237528
134165473
8,2459,75525,729
9,00210,46121,571
20-44
in146324
677287
273455
161829
8193138
4249121
205246403
212574
1,8352,1785,236
151413
286319676
243319870
172244
7590138
571663979
131627
474451
7187154
100136369
5,0795,97111,914
3,0123,2603,655
Age (years)45-64
121139472
261292483
2744117
5559135
99110295
6477183
275335929
293898
2,0792,6257,635
172730
3524881,085
2432851,047
5863180
103120336
8701,0322,355
4045124
5586102
227254687
102120418
10,02011,76531,112
8,4849,98720,643
>65
4153148
159169330
6.38.566
364074
5260122
212781
128148416
9.91245
4255071,652
1.43.132
106137573
93115336
334083
5162157
3995211,217
222556
6.711108
131151328
2835103
4,2985,14214,217
4,5205,39013,257
Total
272338944
487533901
6186237
107118239
232262555
126153385
6087291,747
5975217
4,3385,31014,523
344475
7459442,334
5797182,253
108125307
229272631
18412,2174,551
7586208
109141260
4294921,169
230291890
19,39722,87857,243
16,01618,63737,555
1424 DIABETES CARE, VOLUME 21, NUMBER 9, SEPTEMBER 1998
Dow
nloaded from http://diabetesjournals.org/care/article-pdf/21/9/1414/586598/21-9-1414.pdf by guest on 11 January 2022

King, Aubert, and Herman
Appendix 2 (continued)
Countryand year
Other Asia and islands199520002025
Bangladesh199520002025
Bhutan199520002025
Brunei Darussalam199520002025
Cambodia199520002025
Cook Islands199520002025
Population(000)
401,050453,613739,466
59,31769,579131,442
799903
1,739
162186301
4,7865,33511,240
91017
Democratic Peopled Republic of Korea199520002025
East Timor199520002025
Fiji199520002025
Hong Kong199520002025
Indonesia199520002025
Kiribati199520002025
15,03216,37723,986
405439770
424486803
4,3224,5604,941
111,372125,873192,239
343964
Lao People's Democratic Republic199520002025
Malaysia199520002025
Maldives199520002025
Marshall Islands199520002025
Micronesia199520002025
Mongolia199520002025
Myanmar199520002025
Nauru199520002025
Nepal199520002025
2,2162,5325,457
10,67112,05521,629
107128313
172033
485590
1,2321,4392,573
24,44927,54248,860
2.42.84.5
10,28911,89924,112
Prevalence(%)
3.03.24.3
2.22.23.1
2.12.12.3
3.13.24.1
2.02.12.5
8.18.18.1
2.93.24.3
2.12.22.8
10.110.614.8
4.24.55.5
4.14.36.5
7.07.07.0
2.32.42.8
2.83.03.7
2.52.53.0
7.07.07.0
7.07.07.0
3.03.13.9
2.42.53.2
24.024.024.0
2.22.22.6
Rural
6,0446,6789,866
856969
1,652
151729
1.41.62.0
7687161
———
103111141
6.47.311
141521
4.54.33.6
2,4642,6893,836
———
333657
107117159
1.41.52.7
———
——
8.89.613
341376554
———
172190320
Urban
6,0947,676
21,776
429595
2,381
1.72.310
3.64.510
2027122
——
340416897
2.02.610
293698
179201268
2,0822,7078,591
———
182493
193245648
1.31.76.6
——
——
293687
247305995
———
5373
318
Male
6,4977,65816,552
755922
2,253
9.11022
2.93.56.5
4756152
0.30.30.5
241284515
4.95.612
212558
102112140
2,3322,7576,406
1.11.22.0
273281
166197427
1.61.95.4
0.60.71.2
1.71.93.1
212553
318369812
0.30.30.5
125147359
Number of people (000)
Female
5,6546,71115,114
530642
1,779
7.58.517
2.12.65.7
4858131
0.40.50.8
202243523
3.54.39.4
222660
8193132
2,2142,6386,021
1.31.52.5
242869
134165380
1.11.33.8
0.60.71.1
1.71.93.2
172047
270312737
0.30.40.6
100116279
20-44
4,3205,0958,120
583725
1,448
6.67.616
2.32.43.5
4451119
———
198231260
4.04.58.7
101120
676846
1,1381,3552,109
——
212563
129150272
1.21.54.2
——
——
161934
241285531
———
91108259
Age (years)45-64
5,6516,65016,501
567676
2,086
8.19.119
2.32.96.0
4253132
———
196237599
3.74.59.9
242965
8397141
2,1692,5486,315
——
242970
136171405
1.21.34.0
——
——
172152
273306809
———
107124304
>65
2,1682,6097,022
136163497
1.82.24.6
0.50.72.7
9.11032
———
5059178
0.70.82.7
8.41133
343984
1,2391,4924,003
——
6718
3541131
0.30.41.0
—
——
4.05.014
7489
208
——
273276
Total
12,15114,36931,666
1,2851,5644,032
171939
5.06.012
96114283
0.70.81.4
443527
1,038
8.49.921
4352119
183205271
4,5465,39612,427
2.42.74.5
5160150
300362807
2.73.29.2
1.21.42.3
3.33.86.3
3745101
588681
1,549
0.60.71.1
225263638
DIABETES CARE, VOLUME 21, NUMBER 9, SEPTEMBER 1998 1425
Dow
nloaded from http://diabetesjournals.org/care/article-pdf/21/9/1414/586598/21-9-1414.pdf by guest on 11 January 2022

Global burden of diabetes
Appendix 2 (continued)
Countryand year
Niue199520002025
Palau199520002025
Papua New Guinea199520002025
Philippines199520002025
Republic of Korea199520002025
Samoa199520002025
Singapore199520002025
Solomon Islands199520002025
Sri Lanka199520002025
Thailand199520002025
Tonga199520002025
Tuvalu199520002025
Vanuatu199520002025
Vietnam199520002025
Population(000)
1.41.52.6
8.09.215
2,1462,4494,572
34,59939,55469,467
30,43132,90840,664
6982199
2,0062,1222,586
167207475
10,91412,13117,760
36,08839,98152,660
434981
6.06.79.5
7692195
38,80344,56180,166
Latin America and the Caribbean199520002025
Antigua and Barbuda199520002025
Argentina199520002025
Bahamas199520002025
Barbados199520002025
Belize199520002025
Bolivia199520002025
270,259305,400486,097
687487
21,32123,33432,427
169189272
183187233
101120255
3,6234,1678,058
Prevalence{ 0/ \\ (0 J
9.69.69.5
7.07.07.0
7.27.49.9
2.72.93.6
3.63.84.8
4.84.59.4
4.24.65.3
6.97.39.4
2.52.63.5
2.42.53.7
8.08.08.0
4.04.14.8
7.07.69.7
2.22.33.1
5.76.08.1
4.54.76.7
7.47.38.1
4.14.57.3
4.54.67.4
4.14.15.6
4.44.55.6
Rural
———
106116193
349376520
138148150
2.32.47.9
0.00.00.0
7.99.719
171190243
514563674
—
———
3.74.58.1
549636
1,088
2,0432,1673,005
——
888786
1.21.31.9
2.62.63.0
1.31.52.6
545780
Urban
———4865
261
592761
1,999
9611,1081,809
1.01.311
8598136
3.65.426
104128374
349454
1,248
——
———
1.72.511
321379
1,366
13,43516,08536,279
———
1,4901,6272,555
5.87.218
5.66.114
2.83.512
105130368
Male
0.10.10.1
0.30.30.5
7992
236
519626
1,339
584660976
1.51.49.9
465171
5.97.823
147167313
472550964
1.41.72.7
0.00.10.1
2.83.79.0
459543
1,297
6,4347,57216,054
1.51.72.8
742805
1,260
3.44.510
4.24.39.3
2.12.67.2
7689219
Number of people (000)
Female
0.10.10.1
0.30.40.6
7589
218
423511
1,180
515596982
1.82.38.8
394666
5.67.222
128151304
391467959
2.02.33.8
0.20.20.4
2.63.310
411471
1,157
9,06810,70623,275
1.61.83.0
836909
1,380
3.54.19.6
4.04.47.9
2.12.47.2
8398
230
I
20-44
—
———
38 •4599
414488862
431479422
0.91.54.7
343427
2.93.810
103115169
368422494
———
———
1.41.74.4
377460834
3,4253,9415,838
———
262280395
1.11.41.7
1.11.21.2
1.01.33.1
404799
ige (years)45-64
—
———88103269
428528
1,283
541618
1,120
1.30.912
405070
6.48.225
131156325
3894651084
———
———
3.03.910
368408
1,285
7,4048,81419,618
———
743804
1,221
4.15.212
3.84.49.7
1.72.07.7
8194
228
>65
——
———283286
100122375
127159416
1.11.31.8
111340
2.23.19.4
4047122
106130345
———
———
0.91.34.3
125147336
4,6495,49713,828
———
573630
1,024
1.62.06.2
3.33.06.4
1.41.63.5
3846121
Total
0.10.10.2
0.60.61.1
154181453
9421,1372,519
1,0991,2561,958
3.33.719
8598136
121545
275318617
8631,0171,923
3.43.96.5
0.20.30.5
5.37.019
8701,0152,454
15,50118,27939,329
3.03.55.8
1,5781,7142,641
6.98.620
8.28.717
4.25.014
159187449
1426 DIABETES CARE, VOLUME 21, NUMBER 9, SEPTEMBER 1998
Dow
nloaded from http://diabetesjournals.org/care/article-pdf/21/9/1414/586598/21-9-1414.pdf by guest on 11 January 2022

King, Aubert, and Herman
Appendix 2 (continued)
Countryand year
Brazil
1995
2000
2025
Chile
1995
2000
2025
Colombia
1995
2000
2025
Costa Rica
1995
2000
2025
Cuba
19952000
2025
Dominica
1995
2000
2025
Dominican Republic
1995
2000
2025
Ecuador
1995
2000
2025
El Salvador
1995
2000
2025
Grenada
1995
2000
2025
Guadeloupe
1995
2000
2025
Guatemala
1995
2000
2025
Guyana
1995
2000
2025
Haiti
1995
2000
2025
Honduras
1995
20002025
Jamaica
1995
2000
2025
Martinique
1995
2000
2025
Mexico
1995
2000
2025
Netherlands Antilles
1995
2000
2025
Nicaragua
1995
2000
2025
Panama
1995
2000
2025
Population(000)
93,349
105,098
161,442
8,834
9,655
13,944
19,919
22,492
34,421
1,895
2,171
3,733
7,752
8,070
9,562
717882
4,276
4,850
7,695
6,040
7,034
12,154
2,718
3,224
6,153
92101113
280308417
4,744
5,634
12,422
488535804
3,554
3,957
7,138
2,555
3,063
6,630
1,451
1,585
2,360
258275347
50,178
57,649
94,977
133138180
1,892
2,324
5,415
1,494
1,688
2,657
Prevalence(%)
5.25.57.2
6.16.58.3
4.95.27.5
4.64.96.9
5.45.88.3
4.54.76.7
3.94.26.4
4.64.86.5
4.44.45.6
4.54.76.7
4.85.07.2
4.14.25.2
3.03.36.0
3.23.24.0
3.33.44.6
3.63.86.6
5.35.67.7
7.78.112.3
5.25.57.6
4.54.55.5
4.85.07.3
Rural
523532638
424453
150164235
252840
505154
———
374059
7176130
394263
———
2.32.42.9
7281119
6.37.112
646898
303360
181827
2.32.42.5
529578891
1.21.21.3
171833
192127
Urban
4,376
5,256
10,965
4965801,101
8271,006
2,345
6380217
366419743
———
128162432
206262660
8299284
———
111327
123154521
8.31137
4859187
5471246
3542128
111324
3,318
4,076
10,793
5.76.412
6787264
5364167
Male
1,962
2,325
4,669
251292553
4635541,236
4252127
226253430
1.51.82.6
90110267
136166377
5565158
2.02.33.6
6.97.815
96116307
7.59.124
5664143
4555163
283283
7.07.814
1,185
1,436
3,513
3.43.87.2
3949137
364296
Number of people (000)
Female
2,937
3,463
6,934
287332601
5146171,345
4656129
190216367
1.61.92.9
7592224
141172413
6577189
2.12.43.9
6.57.715
99120333
7.18.624
5664142
3949143
242872
6.87.513
2,661
3,218
8,172
3.53.86.5
4657160
364398
20-44
1,407
1,594
2,172
121137164
270312416
222642
495550
———
283551
7487151
273273
———
1.82.12.3
4959150
2.73.44.7
182142
151846
8.41115
1.61.81.9
5726901,092
0.81.01.1
232873
182030
Age (years)45-64
2,285
2,754
5,705
257302564
4555681,350
4252125
237273480
———
97119298
130161392
6068181
——
7.48.919
94111319
8.51031
6877178
4960184
2832101
7.68.416
1,803
2,176
5,679
4.34.57.8
4051148
344197
>65
1,207
1,440
3,726
161185427
252291815
242990
129142267
——
4049142
7389248
344293
4.24.59.3
5266171
3.44.212
273065
202676
161740
4.75.19.3
1,472
1,787
4,913
1.82.14.8
222776
202467
Total
4,899
5,788
11,603
5396241,154
9771,171
2,581
88107257
416470797
3.23.75.5
165202491
277338791
120142347
4.14.77.6
131630
195235640
151848
112128285
84104306
5360155
141527
3,847
4,654
1,1684
6.97.614
84106297
7285194
DIABETES CARE, VOLUME 21, NUMBER 9, SEPTEMBER 1998 1427
Dow
nloaded from http://diabetesjournals.org/care/article-pdf/21/9/1414/586598/21-9-1414.pdf by guest on 11 January 2022

Global burden of diabetes
Appendix 2 (continued)
Countryand year
Paraguay199520002025
Peru199520002025
Puerto Rico199520002025
Saint Kitts and Nevis199520002025
Saint Lucia199520002025
Population(000)
2,4802,8685,675
12,83914,81424,915
2,4112,5913,303
414547
142155199
Saint Vincent and the Grenadines199520002025
Suriname199520002025
Trinidad and Tobago199520002025
Uruguay199520002025
Venezuela199520002025
Sub-Saharan Africa199520002025
Angola199520002025
Benin199520002025
Botswana199520002025
Burkina Faso199520002025
Burundi199520002025
Cameroon199520002025
Cape Verde199520002025
112123147
237252416
761833
1,269
2,1322,2362,645
11,66613,48323,503
263,048304,644665,976
4,7335,56112,861
2,3032,6545,980
679817
1,789
4,6725,23810,755
2,8013,2117,082
5,9877,005
15,421
182218454
Central African Republic199520002025
Chad199520002025
Comoros199520002025
1,5591,7623,436
2,9543,4216,814
268318818
Prevalence(%)
4.34.66.1
5.05.17.0
5.96.07.4
4.54.76.7
4.54.76.7
4.54.76.7
3.83.86.1
4.54.76.7
8.18.08.6
5.55.87.6
1.11.11.3
1.11.11.2
1.11.21.3
1.11.11.4
1.11.11.2
1.01.01.1
1.21.21.4
1.11.21.5
1.31.21.4
1.21.21.3
1.11.11.2
Rural
313455
109118170
171717
———
——
———
2.62.54.0
5.86.28.3
8.27.55.9
252327
1,7221,8993,166
343968
131422
4.04.58.4
374058
242858
363860
0.80.91.4
8.79.012
171926
1.82.03.7
Urban
7697
292
528643
1,571
124139226
———
——
6.37.121
283377
164171220
621761
1,749
1,2201,5505,209
172283
131753
3.24.718
131768
2.33.217
3646150
1.11.75.4
111335
192366
1.11.46.1
Male
5265174
314376867
7380125
0.91.01.5
3.13.56.4
2.42.84.7
4.54.913
182044
8083107
318386876
1,8232,1525,365
323898
161948
4.55.917
303481
151846
4554137
1.01.44.3
121329
232760
1.82.16.5
Number of people (000)
Female
5466173
323385874
6977118
0.91.11.6
3.33.86.9
2.63.05.1
4.44.712
161941
9295119
328398899
1,1251,3033,018
202353
101227
2.73.38.7
202246
111329
273173
0.91.12.5
7.98.818
131532
1.11.33.3
20-44
313570
164192312
151620
———
———
———
1.31.72.9
5.16.19.2
252631
173198317
1,3331,5653,679
232870
121434
3.74.710
222559
141635
303687
0.91.32.6
7.88.919
151838
1.31.64.6
Age (years)45-64
4864168
319378902
8090136
———
——
———
5.25.216
202351
7879108
315391887
1,1361,3313,385
202360
111230
2.63.412
192248
8.31028
293489
0.60.63.3
7.99.020
151740
1.11.34.0
>65
2732109
154191528
465087
———
———
———
2.52.85.8
9.31025
697388
159194572
473553
1,311
8.29.622
4.24.911
0.91.24.2
8.29.619
4.85.213
131534
0.50.60.9
3.84.28.0
5.86.714
0.40.51.3
Total
106131347
637761
1,741
141156243
1.82.13.2
6.37.313
5.05.89.9
8.99.625
343986
172179226
646784
1,775
2,9473,4558,383
5161151
263175
7.29.226
5057126
273175
7285
210
1.92.56.8
192247
364292
2.93.49.8
1428 DIABETES CARE, VOLUME 21, NUMBER 9, SEPTEMBER 1998
Dow
nloaded from http://diabetesjournals.org/care/article-pdf/21/9/1414/586598/21-9-1414.pdf by guest on 11 January 2022

King, Aubert, and Herman
Appendix 2 (continued)
Countryand year
Congo199520002025
COte d'lvoire199520002025
Djibouti199520002025
Equatorial Guinea199520002025
Eritrea199520002025
Ethiopia199520002025
Gabon199520002025
Gambia199520002025
Ghana199520002025
Guinea199520002025
Guinea—Bissau199520002025
Kenya199520002025
Lesotho199520002025
Liberia199520002025
Madagascar199520002025
Malawi199520002025
Mali199520002025
Mauritania199520002025
Mauritius199520002025
Mozambique199520002025
Namibia199520002025
Population(000)
1,1381,2982,837
5,7986,70816,654
274317593
191210420
1,6171,8593,892
23,90427,65762,378
692760
1,412
550633
1,175
7,7819,079
20,232
2,8543,3107,373
520578
1,050
11,50313,66833,240
9701,1272,335
1,3331,5563,613
6,4247,59317,940
4,7625,23711,190
4,5635,31712,110
1,0491,2212,468
695763
1,059
7,2208,54517,900
734850
1,735
Prevalence(%)
1.11.11.2
1.21.11.2
1.41.41.6
1.21.21.2
1.01.01.2
1.01.01.1
1.41.41.4
1.11.11.3
1.11.21.3
1.11.11.2
1.21.21.3
1.11.11.3
1.11.11.3
1.21.31.3
1.11.11.2
1.01.01.0
1.01.11.2
1.21.31.4
1.31.41.8
1.11.21.3
1.21.21.4
Rural
7.07.411
353862
0.50.50.6
1.41.52.2
131528
200227429
4.75.06.2
3.74.15.7
475387
192133
3.94.15.1
7481136
7.68.413
7.48.113
455190
394288
313559
4.94.97.4
4.04.45.2
535173
4.95.38.3
Urban
6.07.424
3238133
3.44.18.8
0.81.03.0
2.93.817
4456255
4.85.613
2.33.19.9
4253182
121556
2.32.98.4
4965
307
3.34.518
9.21135
2432131
8.91126
162285
7.91128
5.36.213
2648155
3.84.916
Male
8.09.323
4551133
2.63.06.1
1.31.53.3
9.81127
147172427
5.86.412
3.74.49.5
5667171
192359
3.74.28.4
7894
307
6.47.619
111231
4251139
293269
293592
8.11023
5.66.310
4862147
5.46.415
Number of people (000)
Female
5.05.612
222662
1.41.53.3
0.91.01.9
6.67.718
97111257
3.84.27.2
2.32.86.1
333998
121331
2.42.85.1
4552136
4.65.312
5.97.017
273281
192145
192252
4.75.512
3.74.28.5
313881
3.33.88.7
20-44
5.86.716
3035100
1.61.83.6
0.91.02.3
7.58.719
113132315
3.43.77.8
2.83.26.0
4048113
151741
2.42.85.7
6073
211
4.55.312
7.08.321
323898
232555
232765
5.87.114
3.94.14.7
3544102
3.74.49.5
Age (years)45-64
5.05.614
273071
1.82.14.4
0.80.92.1
6.37.217
90104256
4.14.57.2
2.52.96.9
3542111
121436
2.62.85.5
4148177
4.35.113
6.57.519
263189
181941
182158
5.06.115
3.54.38.7
313992
3.44.010
>65
2.32.54.9
9.61124
0.50.61.4
0.50.50.9
2.63.28.2
4147114
2.12.44.1
0.81.02.7
141745
4.55.312
1.11.32.3
212454
2.12.56.2
3.13.78.3
111335
7.78.519
7.28.520
1.92.45.4
1.92.15.3
141734
1.51.84.3
Total
131535
6777
195
3.94.69.4
2.22.45.2
161945
244283683
9.61119
6.17.216
89106269
313689
6.16.914
123146442
111331
171948
6983
221
4853114
4856144
131635
9.31119
7999
228
8.71024
DIABETES CARE, VOLUME 21, NUMBER 9, SEPTEMBER 1998 1429
Dow
nloaded from http://diabetesjournals.org/care/article-pdf/21/9/1414/586598/21-9-1414.pdf by guest on 11 January 2022

Global burden of diabetes
Appendix 2 (continued)
Countryand year
Niger199520002025
Nigeria199520002025
Reunion199520002025
Rwanda199520002025
Population(000)
3,7804,43210,616
49,36957,297124,633
402443641
3,3923,9718,496
Sao Tome and Principe199520002025
Senegal199520002025
Seychelles199520002025
Sierra Leone199520002025
Somalia199520002025
South Africa199520002025
Sudan199520002025
Swaziland199520002025
Togo199520002025
Uganda199520002025
505576
3,7124,3299,075
444867
2,0622,3154,460
3,9014,55210,492
21,75124,79944,663
12,72514,87930,995
388466986
1,8202,1264,841
8,6559,927
23,242United Republic of Tanzania
199520002025
Zaire199520002025
Zambia199520002025
Zimbabwe199520002025
12,93215,00933,073
18,30821,24050,658
3,9514,54210,166
5,0975,72311,781
Prevalence(%)
1.01.0I.I
1.21.21.3
1.51.52.0
0.90.91.0
1.31.31.3
1.21.21.3
10.010.010.0
1.21.21.3
1.11.11.2
1.41.41.6
1.11.11.3
1.11.11.4
1.11.11.2
1.00.91.0
1.01.11.2
1.11.11.2
1.11.11.2
1.11.11.3
Rural
313570
275299437
1.51.51.7
293368
——
222436
———
121215
283155
93102133
90104165
2.32.54.3
131425
7077151
90100170
132148262
212544
293048
Urban
6.68.642
301387
1,221
4.35.311
2.93.719
———
212784
———
131643
141868
205245588
4858
227
1.92.69.8
7.19.134
131884
4358
232
6883
329
222483
2734109
Male
222669
360431
1,061
3.44.06.8
192253
0.40.40.6
273278
1.71.92.6
151738
263180
186216438
85100246
2.63.29.2
121437
5058151
8398
260
122142386
283287
3742104
Number of people (000)
Female
151843
216254597
2.42.85.7
131534
0.30.30.4
161843
2.62.94.0
9.31021
161843
112130282
5362146
1.61.94.9
8.09.222
333685
5160142
7889
205
151740
202253
20-44
182154
258304699
2.22.53.1
161942
———
192351
———
111225
202358
122138247
6372
163
2.02.45.6
8.71026
4249124
6376184
90106285
212563
283371
Age (years)
45-64
131641
233279696
2.42.85.8
111232
———
172052
———
101125
161949
122146325
5465162
1.62.06.4
7.79.023
283183
5158160
7787
223
161750
202365
>65
5.76.817
85102263
1.31.53.6
5.15.812
———
6.67.718
———
3.74.28.5
6.47.317
5462149
222566
0.60.72.1
3.54.110
131529
202458
333884
5.86.514
8.29.221
Total
3744112
576685
1,658
5.86.813
323786
0.70.71.0
4351121
4.44.86.7
242859
4249123
298346721
138162392
4.25.114
202359
8394
236
134158402
200231591
4248127
5664157
Separate urban and rural estimates were not calculated for demographically developed and some small island countries. Some small island countries also lack age-specific estimates. Developed countries comprise EME and FSE. Developing countries are all others.
1430 DIABETES CARE, VOLUME 21, NUMBER 9, SEPTEMBER 1998
Dow
nloaded from http://diabetesjournals.org/care/article-pdf/21/9/1414/586598/21-9-1414.pdf by guest on 11 January 2022

King, Aubert, and Herman
References1. King H, Rewers M, WHO Ad Hoc Diabetes
Reporting Group: Global estimates forprevalence of diabetes and impaired glu-cose tolerance in adults. Diabetes Care16:157-177, 1993
2. World Health Organization: Diabetes Mellitus:Report of a WHO Study Group. Geneva, WorldHealth Org., 1985 (Tech. Rep. Ser, no. 727)
3. World Health Organization: Prevention ojDiabetes Mellitus: Report oj a WHO StudyGroup. Geneva, World Health Org., 1994(Tech. Rep. Ser., no. 844)
4. Xiao-Ren P: Changing prevalence of dia-betes. In Diabetes Towards the New Millen-nium. Third International DiabetesFederation Western Pacific Congress, HongKong, 1996, p. 16
5. Waspadji S, Oermardi M, Soewondo P,Soegondo S, Suyono S: Diabetes mellitus inan urban population: a decade interval. InDiabetes Towards a New Millennium. ThirdInternational Diabetes Federation WesternPacific Congress, Hong Kong, 1996, p. 91
6. Sekikawa A, Tominaga M, Takahashi K,Eguchi H, Igarashi M, Ohnuma H, SugiyamaK, Manaka H, Sasaki H, Fukuyama H,Miyazawa K: Prevalence of diabetes andimpaired glucose tolerance in Funagata area,Japan. Diabetes Care 16:570-574,1993
7. Shera AS, Rafique G, Khwaja IA, Ara J,Baquai S, King H: Pakistan National DiabetesSurvey: prevalence of glucose intoleranceand associated factors in Shikarpur, SindhProvince. DiabetMed 12:1116-1121,1995
8. King H, Abdullaev B, Djumaeva S, Nikitin YAshworth L, Gacic Dobo M: Glucose intol-erance and associated factors in the FerganaValley, Uzbekistan. Diabet Med. In press
9. United Nations Department for Economicand Social Information and Policy Analy-sis, Population Division: World PopulationProspects: the 1994 Revision(ST/ESA/SER.A/145). New York, UnitedNations, 1995
10. World Bank: World Development Report1993: Investing in Health. New York, OxfordUniversity Press, 1993
11. United Nations Department for Economicand Social Information and Policy Analysis,Population Division: World UrbanizationProspects: the 1994 Revision (ST/ESA/SER.A/150). New York, United Nations, 1995
12. United Nations Department for Economicand Social Information and Policy Analysis,Population Division: Urban and Rural Areasby Sex and Age (ESA/P/WP/120). New York,United Nations, 1993
13. Ramachandran A, Snehelatha C, Latha E,Vijay V, Viswanathan M: Rising prevalenceof NIDDM in an urban population in India.Diabetologia 40:232-237,1997
14. Park Y, Lee H, Koh C-S, Min H, Yoo K, KimY, Shin Y: Prevalence of diabetes and IGT inYonchon County, South Korea. DiabetesCare 18:545-548, 1995
15. Cooper R, Rotimi C, Kaufman J, Owoaj e E,
Fraser H, Forrester T, Wilks R, Riste L,Cruikshank JK: Prevalence of NIDDMamong populations of the African diaspora.Diabetes Care 20:343-348, 1997
16. Murray CJL, Lopez AD: Global Health Sta-tistics: Global Burden oj Disease and InjurySeries. Vol. II. Boston, MA, Harvard Schoolof Public Health, 1996, p. 586-600
17. McCarty D, Zimmet P: Diabetes 1994 to2010: Global Estimates and Projections. Mel-bourne, Australia, International DiabetesInstitute, 1994
18. Amos AF, McCarty DJ, Zimmet P: The ris-ing global burden of diabetes and its com-plications: estimates and projections to theyear 2010. Diabet Med 14 (Suppl. 5):S1-S85,1997
19. World Health Organization: World HealthReport 1997: Conquering Suffering, EnrichingHumanity. Geneva, World Health Org.,1977,p. 152-156
20. World Health Organization: Noncommuni-cable Disease Prevention and Control: Reportby the Director-General EB101/14. Geneva,World Health Organization, 1997
21. Welborn TA, Glatthaar C, Whittall D, Ben-nett S: An estimate of diabetes prevalencefrom a national population sample: a maleexcess. MedjAust 150:78-81, 1989
22. YudkinJS, Forrest RD,Jackson CA, BurnettSD, Gould MM: The prevalence of diabetesand impaired glucose tolerance in a Britishpopulation. Diabetes Care 16:1530,1993
23. Forrest RD, Jackson CA, Yudkin JS: Glu-cose intolerance and hypertension in NorthLondon: the Islington Diabetes Survey. Dia-bet Med 3:338-342,1986
24. Harris MI, Hadden WC, Knowler WC,Bennett PH: Prevalence of diabetes andimpaired glucose tolerance and plasma glu-cose levels in the U.S. population aged20-74 years. Diabetes 36:523-534, 1987
25. McPhillips JB, Barrett-Connor E, WingardDL: Cardiovascular risk factors prior to thediagnosis of impaired glucose tolerance andnon-insulin-dependent diabetes mellitus ina community of older adults. Am J Epi-demiol 131:443-453, 1990
26. Tuomilehto J, Nissinen A, Kivela S-L,Pekkanen J, Kaarsalo E, Wolf E, Aro A,Punsar S, Karvonen MJ: Prevalence of dia-betes mellitus in elderly men aged 65 to 84years in eastern and western Finland. Dia-betologia 29:611-615, 1986
27. Verrillo A, de Teresa A, La Rocca S, Giar-russo PC: Prevalence of diabetes mellitusand impaired glucose tolerance in a ruralarea of Italy. Diabetes Res 2:301-306, 1985
28. SzybinskiZ,ZukowskiW,RitaR,SieradzkiJ,Turska-Karbowska I, Gizler M: Diabetes mel-litus in the urban population of Wroclaw. InAbstracts ojthe 11 Scientijk Congress ojthe PolishDiabetological Association. Krakow, Poland, Pol-ish Diabetological Association, 1989, p. 225
29. Herman W, Ali MA, Aubert RE, EngelgauMM, Kenny SJ, Gunter EW, Malarcher AM,Brechner RJ, Wetterhall SF, DeStefano F,
Thompson TJ, Smith PJ, Badran A, Sous ES,Habib M, Hegazy M, Abd el SS, Ibrahim AS,el Moneim el Behairy A: Diabetes mellitus inEgypt: risk factors and prevalence. DiabetMed 12:1126-1131,1995
30. Papoz L, Ben Khalifa F, Eschwege E, AyedH: Diabetes mellitus in Tunisia: descriptionof urban and rural populations. Int J Epi-demiol 17:419-422, 1988
31. Asfour MG, Lambourne A, Soliman A, A1-Behlani S, Al-Asfoor D, Bold A, Mahtab H,King H: High prevalence of diabetes mellitusand impaired glucose tolerance in the Sul-tanate of Oman. DiabetMed 12:1122-1125,1995
32. Modan M, Lubin F, Lusky A, Chetrit A,Fuchs Z, Halkin H: Interrelationships ofobesity, habitual diet, physical activity, andglucose intolerance in the four main IsraeliJewish ethnic groups. In Recent Advances inObesity Research V. Berry EM, BlondheimSH, Eliahou EH, Sharfir E, Eds. London,Libbey, 1987, p. 46-59
33. Ramachandran A, Snehalatha C, DharmarajD, Visnawathan M: Prevalence of glucoseintolerance in Asian Indians: urban-rural dif-ference and significance of upper body adi-posity. Diabetes Care 15:1348-1355,1992
34. Bunnag SC, Sitthi-Amorn C, ChandraprasertS: The prevalence of obesity, risk factors, andassociated diseases in Klong Toey slum andKlong Toey government apartment houses.Diabetes Res Qin Pract 10 (Suppl.1):S81-S87,1990
35. Zimmet P, Taylor R, Ram P, King H, SlomanG, Raper LR, Hunt D: Prevalence of dia-betes and impaired glucose tolerance in thebiracial (Melanesian and Indian) popula-tion of Fiji: a rural-urban comparison. Amj Epidemiol 118:673-688,1983
36. Beckles GLA, Kirkwood BR, Carson DC,Miller GJ, Alexis SD, Byam NTA: High totaland cardiovascular disease mortality inadults of Indian descent in Trinidad, unex-plained by major coronary risk factors.Lancet i: 1298-1300,1986
37. Aschner P, King H, Triana de Torrado M,Rodriguez BM: Glucose intolerance in Colom-bia: a population-based survey in an urbancommunity Diabetes Care 16:90-93,1993
38. Franco LJ, Albuquerque RH, Almeida L,Braga CD, Forti AC, Lessa I, Lima LP,Malerbi D, Modesto J, Pimazoni Netto A,Milech A, Ohana W, Oliveira JEP, SchmidtMI: Multicentric study on the prevalence ofdiabetes mellitus in Brazil (Abstract). Dia-betes Res Clin Pract 5 (Suppl. 1):S346,1988
39. Stem MP, Gonzalez C, Mitchell BD, Villal-pando E, Haffner SM, Hazuda HP: Geneticand environmental determinants of type IIdiabetes in Mexico City and San Antonio.Diabetes 41:484-492, 1992
40. McLarty DG, Swai ABM, Kitange HM,Masuki G, Mtinangi BL, Kilima PM, MakeneWJ, Chuwa LM, Alberti KGMM: Prevalenceof diabetes and impaired glucose tolerancein rural Tanzania. Lancet i:871-874,1989
DIABETES CARE, VOLUME 21, NUMBER 9, SEPTEMBER 1998 1431
Dow
nloaded from http://diabetesjournals.org/care/article-pdf/21/9/1414/586598/21-9-1414.pdf by guest on 11 January 2022