GLOBAL AGRICULTURE AND FOOD SECURITY PROGRAM …
122
GLOBAL AGRICULTURE AND FOOD SECURITY PROGRAM (GAFSP) PRIVATE SECTOR WINDOW AGRIBUSINESS COUNTRY DIAGNOSTIC – TANZANIA October 2016 PUBLIC VERSION Submitted by: Cambridge Economic Policy Associates Ltd
Transcript of GLOBAL AGRICULTURE AND FOOD SECURITY PROGRAM …

GLOBAL AGRICULTURE AND FOOD SECURITY PROGRAM (GAFSP)
PRIVATE SECTOR WINDOW
AGRIBUSINESS COUNTRY DIAGNOSTIC – TANZANIA
October 2016
PUBLIC VERSION Submitted by:
Cambridge Economic Policy Associates Ltd

i
CONTENTS
List of Abbreviations ........................................................................................................ iii
Executive summary ......................................................................................................... vi
1. Introduction .............................................................................................................. 1
1.1. Background to the assignment .................................................................................. 1
1.2. Objectives of this report ............................................................................................ 2
1.3. Structure of the report............................................................................................... 2
2. Overview of the Agribusiness sector in Tanzania ....................................................... 3
2.1. Agribusiness sector profile......................................................................................... 3
2.2. Agribusiness competitive strengths and weaknesses ............................................... 4
2.3. Agribusiness enabling environment .......................................................................... 5
2.4. Access to inputs ......................................................................................................... 6
2.5. Access to finance........................................................................................................ 7
2.6. Main government policy initiatives ........................................................................... 8
2.7. Donor interventions ................................................................................................... 9
3. Sector analysis ........................................................................................................ 10
3.1. Edible oils ................................................................................................................. 10
3.2. Sugar ........................................................................................................................ 15
3.5. Cashew nuts ............................................................................................................. 28
3.6. Coffee ....................................................................................................................... 32
3.7. Cotton ...................................................................................................................... 36
3.8. Dairy ......................................................................................................................... 40
3.9. Horticulture .............................................................................................................. 44
3.10. Tea ............................................................................................................................ 48
3.11. Sisal .......................................................................................................................... 52
3.12. Rice ........................................................................................................................... 55
4. Priority sectors and next steps ................................................................................ 59
4.1. Approach to identifying the priority sectors ........................................................... 59
4.2. Priority sectors ......................................................................................................... 63
4.3. Next steps ................................................................................................................ 63
5. Horticulture value chain .......................................................................................... 66
5.1. Sector overview ....................................................................................................... 66
5.2. Investment/ advisory opportunities in horticulture for GAFSP PrSW/IFC .............. 73

ii
5.3. Next steps for GAFSP PrSW/ IFC in the horticulture sector..................................... 74
6. Edible oils value chain ............................................................................................. 75
6.1. Sector overview ....................................................................................................... 75
6.2. Investment/ advisory opportunities in edible oils for GAFSP PrSW/IFC ................. 80
6.3. Next steps for GAFSP PrSW/ IFC in the edible oils sector........................................ 80
7. Grain value chain .................................................................................................... 81
7.1. Sector overview ....................................................................................................... 81
7.2. Market information on the grain sector .................................................................. 84
7.3. Investment/ advisory opportunities in grain for GAFSP PrSW/IFC .......................... 85
7.4. Next steps for GAFSP PrSW/ IFC in the grains sector .............................................. 85
8. Investment opportunities in other sectors ............................................................... 86
8.1. Tea sector ................................................................................................................. 86
8.2. Sugar sector ............................................................................................................. 88
8.3. Financial sector ........................................................................................................ 89
8.4. Opportunities identified in other sectors ................................................................ 89
Annex A Summary of commitments to input sector ................................................... 90
Annex B Summary of donor activity in Tanzania ......................................................... 92
Annex C Additional information on oilseeds sub-sector ............................................. 99
Annex D Additional information on sugar sector ...................................................... 102
Annex E Profiles of Tanzanian dairy companies ........................................................ 103
Annex F Recent investments in horticulture by AECF-TZAW ..................................... 104
Annex G Bibliography .............................................................................................. 106
Annex H List of stakeholders consulted .................................................................... 110

iii
LIST OF ABBREVIATIONS
3ADI African Agribusiness and Agro-Industries Development Initiative
ACT Agricultural Council of Tanzania
AECF Africa Enterprise Challenge Fund
AfDB African Development Bank
AFT Agriculture Fast Track Fund
AgFiMS Agriculture Finance Markets Scoping Survey
AGRA Alliance for a Green Revolution in Africa
AITF Agricultural Input Trust Fund
AMCOS Agricultural Marketing Co-operative Societies
ANSAF Agricultural Non-State Actors Forum
ASDP Agricultural Development Support Project
ASA Agriculture Seed Agency
BCI Better Cotton
BEE Bagaomoyo EcoEnergy
BMGF Bill and Melinda Gates Foundation
BRN Big Results Now Initiative
CAADP Comprehensive African Agriculture Development Program
CAVA Cassava: Adding Value for Africa
CDTF Cotton Development Trust Fund
CDI Clinton Development Initiative
CEPA Cambridge Economic Policy Associates
CEZOSOPA Central Zone Sunflower Oil Processors Association
CFA Connected Farmer Alliance
CGIAR Consortium of International Agricultural Research Centers
CIP Commodity Investment Plans
CNBT Cashew Nut Board of Tanzania
COWABAMA Collective Warehouse-based Marketing Schemes
CRDB Cooperative Rural Development Bank
DFI Development Finance Institution
DuCon Dutch Connexxion
EAF East African Community
ECCAg Environment and Climate Compatible Agriculture
EADD East Africa Dairy Development
FAO Food and Agriculture Organization
FDI Foreign Direct Investment
FIPS Farm Inputs Promotion System
FMCG Fast-Moving Consumer Goods
GAFSP PrSW Private Sector Window of the Global Agriculture and Food Security Programme
GAP Good Agricultural Practices

iv
GoT Government of Tanzania
HYV High-Yielding Varieties
IFAD International Fund for Agricultural Development
IFC International Finance Corporation
JICA Japan International Cooperation Agency
JV Joint Venture
KOICA Korea International Cooperation Agency
KPL Kilombero Plantations Limited
KSC Kilombero Sugar Company
KSL Kagera Sugar Limited
KSCL Kilombero Sugar Company Ltd.
KSRI Kibaha Sugarcane Research Institute
KYC Know Your Customer
MAFC Ministry of Agriculture, Food Security and Cooperatives
METL Mohamed Enterprises Tanzania Ltd (METL)
MFI Micro Finance Institution
MFO Micro Finance Organisation
MGF Matching Grants Fund
MHQFP Masasi High Quality Farmers Products Limited
MSE Mtibwa Sugar Estate
NAIVS National Agriculture Input Voucher Program
NAFAKA Tanzania Staples Value Chain
NARI Naliendele Agricultural Institute
NCFI Tanzania National Council for Financial Inclusion
NFRA National Food Reserve Agency
NGO Non-Governmental Organisation
NMB National Microfinance Bank
NPS National Panel Survey
NORAD Norwegian Agency for Development Cooperation
NZAID New Zealand Agency for International Development
OECD Organization for Economic Cooperation and Development
PAC Partnership Accountability Committee
PICS Purdue Improved Crop Storage
R&D Research & Development
RCN Raw Cashew Nut
RLDP Rural Livelihood Development Company
RMB Rand Merchant Bank
RUDI Rural Urban Development Initiative
RVO Netherlands Enterprise Agency
SACCOS Savings and Credit Cooperative Organizations
SADCO Southern Highlands Agricultural Development Company Limited

v
SAGCOT Southern Agriculture Growth Corridor of Tanzania
SHADECO Southern Highlands Agricultural Development Company
SIDA Swedish Development Cooperation Agency
SIDO Small Industries Development Organization
SIF SME Impact Fund
SME Small and Medium-Sized Enterprises
SNV Netherlands Development Organization
SSA Sub-Saharan Africa
TADB Tanzania Agricultural Development Bank
TAFSIP Tanzania Agriculture and Food Security Investment Plan
TAGMARK Tanzanian Agricultural Market Development Trust
TAHA Tanzania Horticulture Association
TAMPA Tanzania Milk Producers Association
TANCIS Tanzania Customs Integrated System
TAP Tanzania Agricultural Partnership
TASTA Tanzania Seed Trade Association
TASUPA Tanzania Sunflower Processors Association
TBS Tanzania Bureau of Standards
TCB Tanzania Cotton Board
TEOSA Tanzania Edible Oil Seed Association
TFDA Tanzania Food and Drug Administration
TIB Tanzanian Investment Bank
TIC Tanzania Investment Centre
TLRI Tanzania Livestock Research Institute
TOSCI Tanzania Official Seed Certification Agency
TPC Tanganyika Planting Company
TRIT Tea Research Institute of Tanzania
TSB Tanzania Sisal Board
TZAW Tanzania Agribusiness Window
UHT Ultra-Heat Treated
UN United Nations
UNDP United Nations Development Program
UNIDO United Nations Industrial Development Organisation
UVOP International Union for the Protection of New Varieties of Plants
USAID United States Agency for International Development
VCDSP Value Chain Development Support Program
VETA Vocational Educational and Training Authority
WB World Bank
WFP World Food Programme

vi
EXECUTIVE SUMMARY
Cambridge Economic Policy Associates (CEPA) was appointed by the International Finance
Corporation (IFC) to identify investment opportunities that could be supported by the Private
Sector Window of the Global Agriculture and Food Security Programme (GAFSP PrSW/IFC)
in Tanzania’s agribusiness sector.
This is the public version of two reports originally delivered to IFC. The primary purpose of the
original reports were to inform GAFSP PrSW/IFC of potentially investable opportunities on
which it could follow up. The secondary purpose was to provide information on constraints
and issues facing the agribusiness sector (and individual sub-sectors) in Tanzania. IFC are
making a version of this report public to share any non-confidential information with other
individuals or organisations concerned with Tanzanian agribusiness.
ES.1 Background
The IFC manages the GAFSP - PrSW, which is a multilateral mechanism to assist in the
implementation of pledges made by the G20 in Pittsburgh, USA in September 2009. GAFSP
established a private sector window to provide long and short term loans, credit guarantees,
equity and advisory services to support private sector activities for improving agricultural
development and food security. Through the blending of IFC finance and GAFSP finance,
investments can be financed which are commercially viable, but have temporary higher costs
and/or higher risks than the investments which IFC normally finances, and justify a
concessional element in the financing package.
The objective of the IFC-managed private sector window is to address the following:
Support and demonstrate new and innovative financing aimed at agribusiness
companies and their supply chains,
Help increase productivity, improve market access, support innovation and
development of new ideas in financing and technology, reduce information
asymmetries between small end users of capital and financial institutions, and reduce
risks associated with financing small holders/companies in the agribusiness sector
Support projects that foster research, development and innovations through entities
operating in the ‘last mile’ and projects that can demonstrate higher productivity,
lower use of water resources and inputs such as fertilizers
As a means to reach these objectives, IFC contracted CEPA to conduct an agribusiness sector
diagnostic of Tanzania to (i) analyse / identify the most promising sub-sectors for IFC/GAFSP
investment and advisory services and (ii) identify specific IFC/GAFSP investment opportunities
and related partners.
In practice, GAFSP PrSW/IFC is looking to support projects in developing countries of a
minimum size of US$5m and preferably higher. A US$5m investment would be at the bottom
end of IFC’s financing range, so any such project would need to have a strong developmental

vii
case. IFC can finance 15 - 35% of a company’s capitalisation (depending on the company’s
credit rating and size of financing), which can increase to 50% for expansion projects. There
is no limit to the proportion of a project that IFC can finance as long as the capitalisation
requirements explained above are met.
ES.2 Approach
CEPA undertook this assignment in two phases. In Phase 1 we carried out desk-based research
to identify three priority agribusiness sectors with potential to deliver development impacts
for Tanzania and investment opportunities for GAFSP PrSW/IFC.
In Phase 2 we conducted a two-week visit to collect more detailed information on the priority
sectors, and to identify investable opportunities by meeting with key stakeholders. We
consulted 29 companies and other organisations in total (a full list is provided in Annex H).
ES.3 Identifying priority sectors
We used a two-stage assessment process to identify the priority sectors:
A long-list of sub-sectors was identified by reviewing FAOStat data and following
discussions with the IFC.
Each sector in the long-list was reviewed and assessed against a range of indicators of
the scope to yield opportunities for GAFSP PrSW/ IFC.
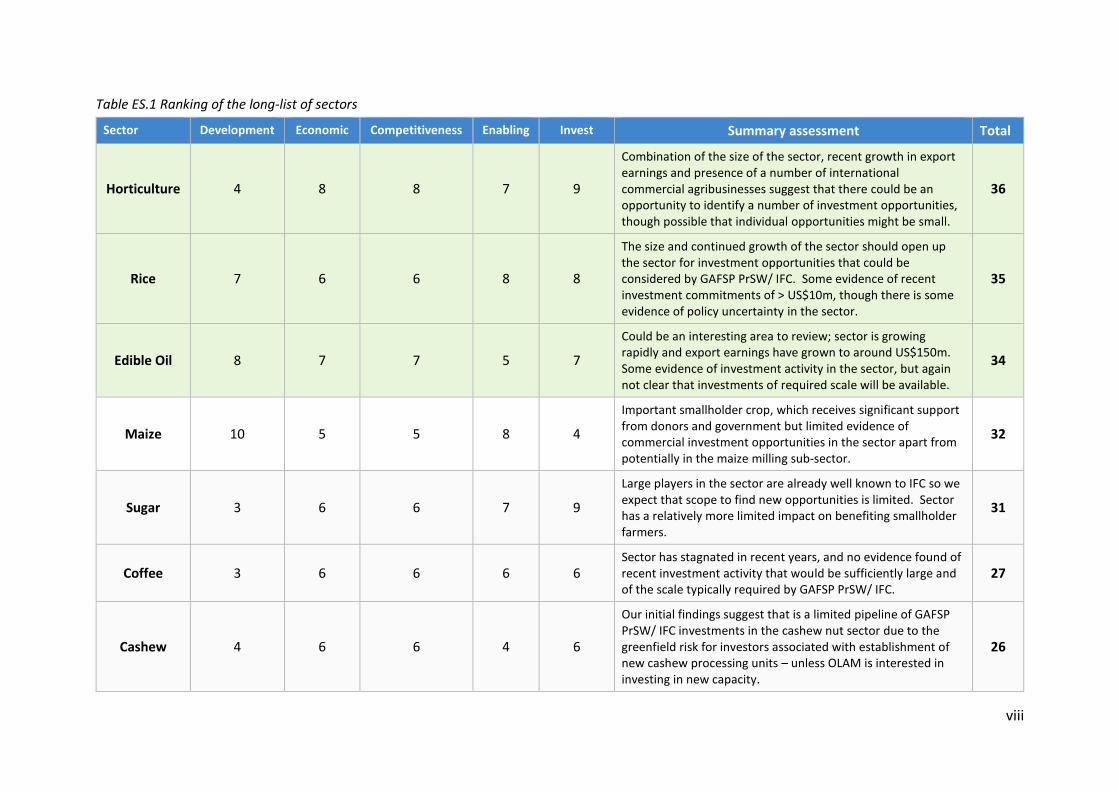
The summary ranking of each sub-sector considered is summarised in Table ES.1. Overall, we
identified horticulture, rice and edible oils as priority sectors, though we considered
opportunities that arose in other sectors as well during our phase 2 consultations. This took
account of the areas that IFC already has good knowledge of / involvement in.
viii
Table ES.1 Ranking of the long-list of sectors
Sector Development Economic Competitiveness Enabling Invest Summary assessment Total
Horticulture 4 8 8 7 9
Combination of the size of the sector, recent growth in export earnings and presence of a number of international commercial agribusinesses suggest that there could be an opportunity to identify a number of investment opportunities, though possible that individual opportunities might be small.
36
Rice 7 6 6 8 8
The size and continued growth of the sector should open up the sector for investment opportunities that could be considered by GAFSP PrSW/ IFC. Some evidence of recent investment commitments of > US$10m, though there is some evidence of policy uncertainty in the sector.
35
Edible Oil 8 7 7 5 7
Could be an interesting area to review; sector is growing rapidly and export earnings have grown to around US$150m. Some evidence of investment activity in the sector, but again not clear that investments of required scale will be available.
34
Maize 10 5 5 8 4
Important smallholder crop, which receives significant support from donors and government but limited evidence of commercial investment opportunities in the sector apart from potentially in the maize milling sub-sector.
32
Sugar 3 6 6 7 9
Large players in the sector are already well known to IFC so we expect that scope to find new opportunities is limited. Sector has a relatively more limited impact on benefiting smallholder farmers.
31
Coffee 3 6 6 6 6
Sector has stagnated in recent years, and no evidence found of recent investment activity that would be sufficiently large and of the scale typically required by GAFSP PrSW/ IFC.
27
Cashew 4 6 6 4 6
Our initial findings suggest that is a limited pipeline of GAFSP PrSW/ IFC investments in the cashew nut sector due to the greenfield risk for investors associated with establishment of new cashew processing units – unless OLAM is interested in investing in new capacity.
26
ix
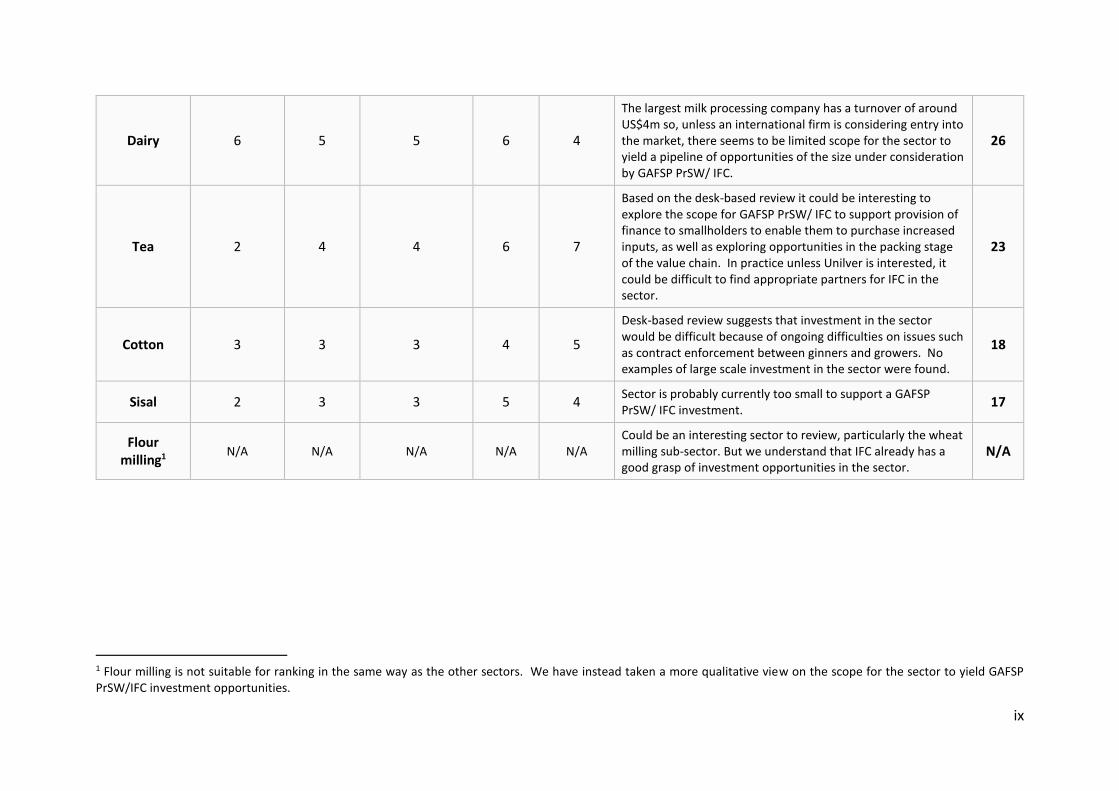
Dairy 6 5 5 6 4
The largest milk processing company has a turnover of around US$4m so, unless an international firm is considering entry into the market, there seems to be limited scope for the sector to yield a pipeline of opportunities of the size under consideration by GAFSP PrSW/ IFC.
26
Tea 2 4 4 6 7
Based on the desk-based review it could be interesting to explore the scope for GAFSP PrSW/ IFC to support provision of finance to smallholders to enable them to purchase increased inputs, as well as exploring opportunities in the packing stage of the value chain. In practice unless Unilver is interested, it could be difficult to find appropriate partners for IFC in the sector.
23
Cotton 3 3 3 4 5
Desk-based review suggests that investment in the sector would be difficult because of ongoing difficulties on issues such as contract enforcement between ginners and growers. No examples of large scale investment in the sector were found.
18
Sisal 2 3 3 5 4 Sector is probably currently too small to support a GAFSP PrSW/ IFC investment.
17
Flour milling1
N/A N/A N/A N/A N/A Could be an interesting sector to review, particularly the wheat milling sub-sector. But we understand that IFC already has a good grasp of investment opportunities in the sector.
N/A
1 Flour milling is not suitable for ranking in the same way as the other sectors. We have instead taken a more qualitative view on the scope for the sector to yield GAFSP PrSW/IFC investment opportunities.

x
ES.4 Summary findings
Few locally based agribusinesses are large enough to carry out investments of the required
size, and many promising sub-sectors are at an early stage of development. Furthermore, IFC
are already active in agreeing mandates with a number of the relatively few major
agribusinesses that could support large investment in the target sectors, and a number of
other larger players are not likely to pass IFC’s due diligence tests. This limited our ability to
identify new opportunities in the grains and edible oil sectors (including milling).
Nevertheless, we identified several interesting opportunities. The majority of investment
opportunities identified were below the US$5m minimum target investment size (as
expected), though some do have potential to expand and offer additional scope for future
engagement. We were also able to identify a small number of larger-scale projects for which
discussions have been taken forward, though details are omitted throughout this report for
confidentiality reasons.
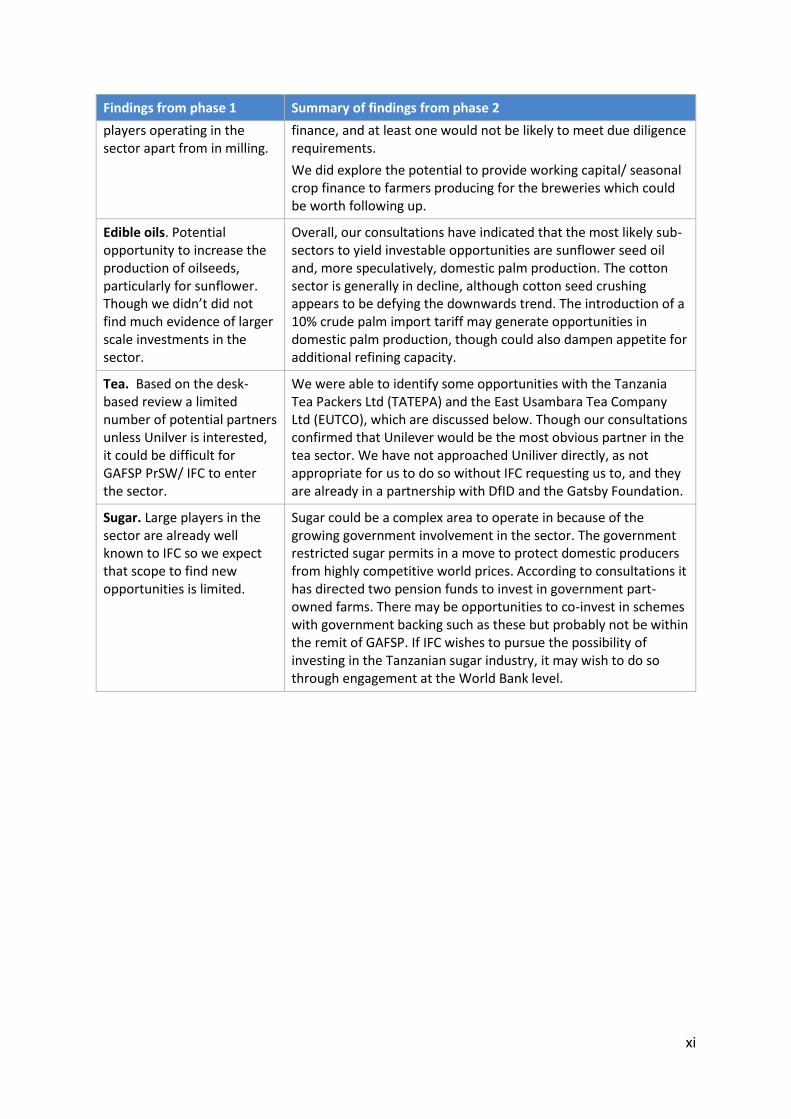
Table ES.2 below summarises our findings in each priority sub-sector and for tea and sugar -
where opportunities presented themselves during our visit. The first column provides our
initial view of investment opportunities in the sub-sector from desk-based research in phase
1. The second column gives our fuller opinion based on meetings with companies and other
stakeholders.
Table ES.2: Summary findings by sub-sector
Findings from phase 1 Summary of findings from phase 2
Horticulture. Seen as being a rapidly growing sector with a number of established businesses exporting to the EU, offering some scope for GAFSP PrSW/ IFC investments.
The story of the horticulture sector is still one of potential; it has failed to develop as quickly as regional competitors such as Kenya and Ethiopia. While Kenya is often held up as the example, it is perhaps more interesting to look at the way in which Ethiopia has been able to achieve rapid growth based on a more proactive set of government interventions to develop the sector. Back in the early 2000s both Ethiopia and Tanzania exported around €15m Euros to the EU – now Tanzania exports just €30m whilst Ethiopia has grown to nearly €200m. One of the issues is that there is no specific niche area that takes best advantage of Tanzanian conditions, rather than producing what is done in Kenya at a smaller scale.
Whilst the development of the sector has been limited by a combination of policy and infrastructure-related constraints there are some individual agribusinesses that are having some success in producing for export markets/ have interesting investment plans under development that could provide an opportunity for GAFSP PrSW to engage in the sector.
Rice/ grains. Again seen as a growing sector, but recognized that there are a limited number of large
The country visit confirmed that apart from the milling sub-sector opportunities in the grains sector are more generally limited. Grain producers in Tanzania are too small to be recipients of IFC financing with the exception of the three major rice producers. Of these three, none appear to have a current need for external
xi
Findings from phase 1 Summary of findings from phase 2
players operating in the sector apart from in milling.
finance, and at least one would not be likely to meet due diligence requirements.
We did explore the potential to provide working capital/ seasonal crop finance to farmers producing for the breweries which could be worth following up.
Edible oils. Potential opportunity to increase the production of oilseeds, particularly for sunflower. Though we didn’t did not find much evidence of larger scale investments in the sector.
Overall, our consultations have indicated that the most likely sub-sectors to yield investable opportunities are sunflower seed oil and, more speculatively, domestic palm production. The cotton sector is generally in decline, although cotton seed crushing appears to be defying the downwards trend. The introduction of a 10% crude palm import tariff may generate opportunities in domestic palm production, though could also dampen appetite for additional refining capacity.
Tea. Based on the desk-based review a limited number of potential partners unless Unilver is interested, it could be difficult for GAFSP PrSW/ IFC to enter the sector.
We were able to identify some opportunities with the Tanzania Tea Packers Ltd (TATEPA) and the East Usambara Tea Company Ltd (EUTCO), which are discussed below. Though our consultations confirmed that Unilever would be the most obvious partner in the tea sector. We have not approached Uniliver directly, as not appropriate for us to do so without IFC requesting us to, and they are already in a partnership with DfID and the Gatsby Foundation.
Sugar. Large players in the sector are already well known to IFC so we expect that scope to find new opportunities is limited.
Sugar could be a complex area to operate in because of the growing government involvement in the sector. The government restricted sugar permits in a move to protect domestic producers from highly competitive world prices. According to consultations it has directed two pension funds to invest in government part-owned farms. There may be opportunities to co-invest in schemes with government backing such as these but probably not be within the remit of GAFSP. If IFC wishes to pursue the possibility of investing in the Tanzanian sugar industry, it may wish to do so through engagement at the World Bank level.

1
1. INTRODUCTION
Cambridge Economic Policy Associates (CEPA) was appointed by the International Finance
Corporation (IFC) to carry out analysis of the agribusiness sector in Tanzania to support work
related to the GAFSP PrSW/IFC.
1.1. Background to the assignment
GAFSP PrSW/IFC is a multilateral mechanism managed by the IFC. It is designed to assist the
implementation of pledges made by the G20. GAFSP PrSW/IFC provides long and short term
loans, credit guarantees, equity and advisory services with the aim of improving agricultural
development and food security in targeted developing countries. It targets agribusiness
investments across the value-chain which are commercially viable but have temporary higher
costs/ risks that would otherwise prevent them from attracting/ affording finance on more
commercial terms.
GAFSP PrSW/IFC is looking to support projects of a minimum size of US$5m in developing
countries. A US$5m investment would be at the bottom end of IFC’s financing range, so any
such project would need to have a strong developmental case. In practice the target
investment size is US$10m and preferably higher. IFC can finance 15 - 35% of the company’s
capitalisation (depending on the company’s credit rating and size of financing) this can
increase to 50% for expansion projects. There is no limit to the proportion of the project that
IFC can finance as long as the capitalisation requirements explained above are met.
For the purposes of the Tanzania study we have focused on investments that meet these
criteria, but have also included smaller projects where there may be scope for additional
investment in the medium-term. Given the size and level of development of the agricultural
sector in Tanzania, the number of suitable investment opportunities is likely to be quite
limited. Furthermore, IFC are already active in agreeing mandates with a number of the
relatively few major agribusinesses that could support large investment in the target sectors.
Our ability to identify opportunities and assess the value chain in the grains and edible oil
sectors was limited by IFC’s request that we should not meet with these organisations.
CEPA undertook this assignment in two phases. In Phase 1 we carried out desk-based research
using secondary sources of information to identify priority agribusiness sectors with the
potential to deliver development impacts for Tanzania as well as investment opportunities
for GAFSP PrSW/IFC. Overall the ranking analysis identified horticulture, grains and edible
oils as the highest scoring priority sectors.
In Phase 2 we conducted a two-week visit to collect more detailed market information on the
priority sectors, and to identify possible investment opportunities by meeting with key
stakeholders. We consulted 29 companies and other organisations in total (a full list is
provided in annex H).
2
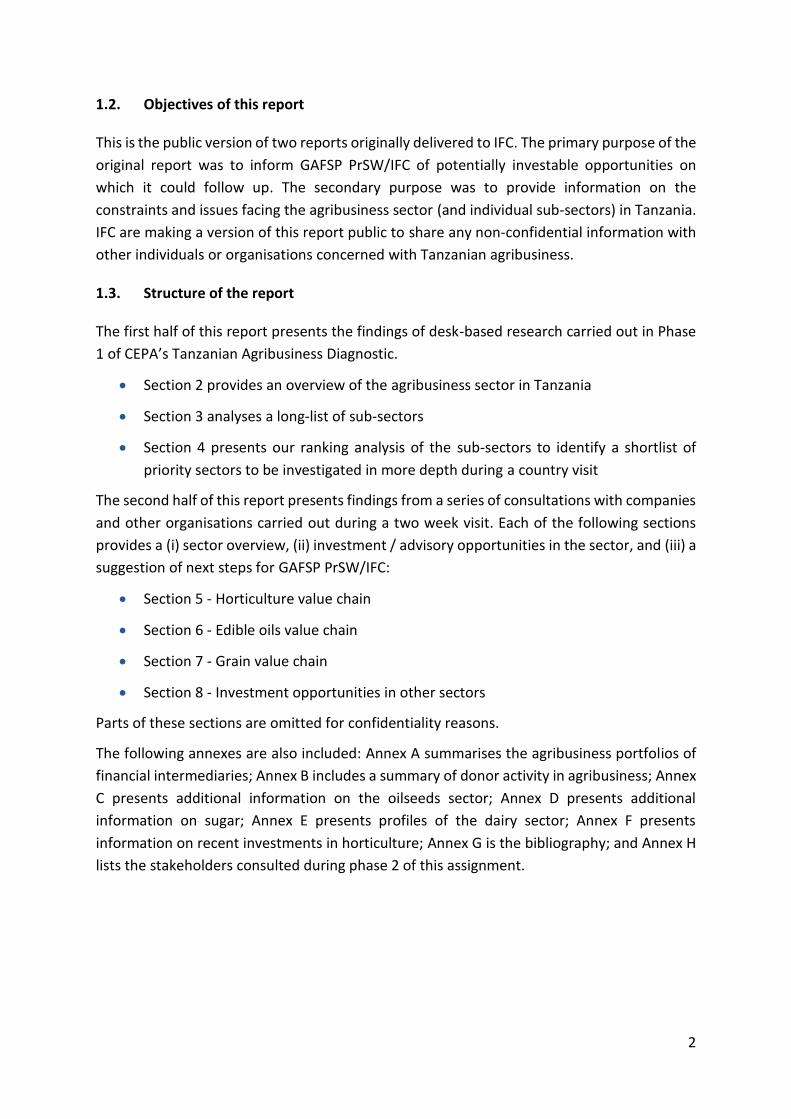
1.2. Objectives of this report
This is the public version of two reports originally delivered to IFC. The primary purpose of the
original report was to inform GAFSP PrSW/IFC of potentially investable opportunities on
which it could follow up. The secondary purpose was to provide information on the
constraints and issues facing the agribusiness sector (and individual sub-sectors) in Tanzania.
IFC are making a version of this report public to share any non-confidential information with
other individuals or organisations concerned with Tanzanian agribusiness.
1.3. Structure of the report
The first half of this report presents the findings of desk-based research carried out in Phase
1 of CEPA’s Tanzanian Agribusiness Diagnostic.
Section 2 provides an overview of the agribusiness sector in Tanzania
Section 3 analyses a long-list of sub-sectors
Section 4 presents our ranking analysis of the sub-sectors to identify a shortlist of
priority sectors to be investigated in more depth during a country visit
The second half of this report presents findings from a series of consultations with companies
and other organisations carried out during a two week visit. Each of the following sections
provides a (i) sector overview, (ii) investment / advisory opportunities in the sector, and (iii) a
suggestion of next steps for GAFSP PrSW/IFC:
Section 5 - Horticulture value chain
Section 6 - Edible oils value chain
Section 7 - Grain value chain
Section 8 - Investment opportunities in other sectors
Parts of these sections are omitted for confidentiality reasons.
The following annexes are also included: Annex A summarises the agribusiness portfolios of
financial intermediaries; Annex B includes a summary of donor activity in agribusiness; Annex
C presents additional information on the oilseeds sector; Annex D presents additional
information on sugar; Annex E presents profiles of the dairy sector; Annex F presents
information on recent investments in horticulture; Annex G is the bibliography; and Annex H
lists the stakeholders consulted during phase 2 of this assignment.

3
2. OVERVIEW OF THE AGRIBUSINESS SECTOR IN TANZANIA
This section was written during the first (desk-based) phase of our study and may not reflect
the most current or detailed information available.
This section provides an overview of the agribusiness sector in Tanzania. It then considers
the agribusiness sector’s main competitive strengths and weaknesses, discusses the enabling
environment, considers farmers’ access to inputs, access to finance, the main government
policies and the relevant donor interventions separately.
2.1. Agribusiness sector profile
Figure 2.1: Agricultural sector in Tanzania
Source: African Economic Outlook (2015); PAC, New Alliance (2014); Economic and Social Research Foundation (2012).
Agriculture contribute approximately 75% of Tanzania’s export earnings, with cotton, tea,
cashew and tobacco representing the key sources of foreign exchange. Other major cash
crops include coffee, sisal, pyrethrum and beans.
While maize is one of the largest crop sectors in terms of production, maize imports are also
significant. Other import-competing food crops include rice, wheat and sugar. Key subsistence
crops include cassava, sorghum, millet, Irish potato, sweet potato, cooking (green) bananas.
In addition, the livestock population in Tanzania is thought to be the largest in the SADC region
and is ranked third in Africa in this regard (after Sudan and Ethiopia).

4
2.2. Agribusiness competitive strengths and weaknesses
COMPETITIVE STRENGTHS COMPETITIVE WEAKNESSES
Agro-ecological conditions and market factors
Large availability of arable land, range of farming systems and agro-ecological conditions conducive for large-scale production of cash crop and a wide variety of fruits and vegetables.
Network of Agriculture Research Institutes (ARIs) and availability of appropriate technologies for different systems.
Conducive environment for digital agribusiness services, with ~27.1m mobile GSM connections across Tanzania.
Overall planned private investment of $846m under the Comprehensive African Agriculture Development Programme (CAADP) Framework, with US$42m invested as of 2014; complemented by donor disbursements of $336.84m.
Investment in infrastructure for trade with recent improvements to the port at Dar es Salaam; and implementation of Tanzania Customs Integrated System (TANCIS).
Improved availability of inputs, with an increase in the number of private firms supplying commercial seeds; agro-dealers; and private firms importing/ distributing tractors.
Reliance on rain-fed agriculture, increasing vulnerability to erratic weather conditions. Less than 3% of plots under the National Panel Survey (NPS) 2010/11 were irrigated.
Low crop productivity. Farmers’ use of inputs is still low due to low access to credit, weak infrastructure and proliferation of counterfeits (fake/ adulterated seeds, fertilisers and pesticides). Other issues include high cost of power and dependence on traditional farming methods, e.g. tractors are estimated to be used for only ~14% of cropped land. Overall, there is limited commercial farm management experience.
Limited availability and access to land given disputes between farmers and pastoralists, tenure disputes and lack of awareness on land ownership, legal status and policies.
Other key constraints to agro-processing include: (i) poor access to crops, low crop quality and post-harvest losses (weak storage facilities and inefficient logistics); (ii) lack of skills in operating processing technologies; (iii) food safety issues, lack of standards/ certification; (iv) costly packaging materials; (v) difficulties entering local retail/ wholesale distribution network ; and (vi) access to finance.
Policy and Institutional Environment

5
Government of Tanzania (GoT) has committed to 12 policy actions under the New Alliance Framework. Key recent reforms relate to seed varieties release system; and a review of land laws to allow long-term leases for foreign companies.
Tanzania Investment Centre (TIC) has introduced incentives for agricultural investments and is allocating 83,000 Ha to investors for rice and sugar production.
Significant donor funds directed at supporting sustainability in agriculture.
Increase in public spending on agriculture, estimated at ~6.8% with a Presidential commitment to reach the CAADP target of 10% of overall national budget.
Investor uncertainty due to ad-hoc policies such as export bans on crops (maize, rice, beans); arbitrary application of cesses (locally levied tax) of 2-5% on sale of crops; and poor communication/ implementation of policy changes such as 2012 waiver for VAT on irrigation, tractors, farm implements etc.
Recent ten-fold rise in land taxes in rural areas, to the same level as urban land taxes.
‘Red tape’. E.g. food processing is regulated by over 17 bodies resulting in multiple fees, delays, duplicate functions and bureaucracy.
Weak government planning and inefficient implementation of the subsidy program; while the National Food Reserve Agency (NFRA) has also caused market disruptions and disincentives to private grain trade.
2.3. Agribusiness enabling environment
Tanzania is ranked 139 out of 189 economies in the World Bank Doing Business 2016 Survey,
receiving particularly low rankings with regard to trading across borders, access to credit and
paying taxes.
The potential for scaling up commercialisation in agriculture is largely unrealised. Major
constraints identified by agricultural companies include climate change (given the
dependence on rain-fed production); limited access to finance; and an unpredictable tax
regime, particularly relating to ad-hoc export bans on crops and inconsistent policies around
VAT/ duties charged on inputs. For instance, while there is no import duty on fertilisers, 18%
VAT is charged on bags, services rendered at the port (e.g. bagging), and on transport services,
transmitting through to higher costs for farmers.
Reports suggest that GoT is trying to implement reforms to improve the ease of doing
business, with a focus on business registration, licensing, regulation and tax administration.
For instance, it has removed the requirement for inspections by health, town and land officers
to try to ease the process of starting a new business.
GoT is targeting the use of PPP arrangements to bring more investment in agriculture, with a
focus on value chains with nucleus and out-grower models. See the box below.
Box 2.1: Agribusiness PPPs in Tanzania
GoT is aiming for PPP initiatives to develop 330,000 Ha of enhanced smallholder farmlands (out-grower) and 350,000 of new commercial farmland (not including areas occupied by out-growers), with the objective of achieving an increase in: sugar cane crop planting (by 150,000 MT); rice production (by 290,000 MT); maize output (by 100,000 MT); and involvement of 400,000 smallholders in commercial and out-grower schemes. The expansion is to be achieved under the Big Results Now initiative (BRN) through:
25 commercial farming deals for rice paddy and sugarcane;

6
78 professionally-managed collective rice irrigation and marketing schemes; and
275 collective warehouse-based marketing schemes.
TIC has already been issued 83,000 Ha of land to allocate to investors for rice and sugar production through an open and competitive process.
Source: Partnership Accountability Committee, New Alliance (2014); FAO (2013)
2.4. Access to inputs
Although government has implemented some recent policy measures to increase access to
seeds, e.g. implementing regional agreements (SADC MoU) to quicken the registration of
improved seeds2. Overall liberalisation of the sector has been limited, with supply of improved
seeds still relatively low due to persistent policy institutional constraints including:
Restricted-take-up of government released varieties,3 the Agricultural Seed Agency
(ASA) has a limited capacity for foundation seed production, while companies don’t
have timely access public varieties and lack sufficient processing capacity.
Inadequate funding for Tanzania Official Seed Certification Agency (TOSCI), resulting
in fewer than needed field inspections – e.g. just two field inspections of hybrid maize
when four are needed.
The National Agriculture Input Voucher Program (NAIVS) is believed to have had some role in
increasing smallholder farmers use of fertiliser; however there are a number of issues with
the implementation of the programme that have reduced its efficiency.4 These include
inconsistency in the distribution of vouchers and delays in the redemption of vouchers by
banks; and a lack of finance available to agro-dealers and inadequate number of trained agro-
dealers and extension staff to supervise the program.
Another important issue with the regulations and policies affecting the fertiliser sector
include the requirements for any new fertiliser blends to undergo three consecutive seasons
of testing at a cost of $10,000 per season for each new fertilizer product, paid by the importer/
blender. According to data received from the Tanzania Fertiliser Registration Authority (TFRA)
is that there are currently just 37 different types of fertiliser currently registered for use in
Tanzania, this compares to countries in the region such as Zimbabwe and Zambia where
reports suggest that around 250 different types of fertiliser have been registered for use by
farmers. The lack of access to blends means that farmers cannot use the fertiliser varieties
that are suited best to their soil characteristics, as a result their yields suffer as do their
potential incomes. For instance, one stakeholder suggested that maize farmers in Tanzania
2 Verification of a variety released in another Eastern African country is only required one season, enabling the faster release of foreign plant varieties 3 Approx. 80% of government-released varieties have been made available to the private sector 4 Under this input subsidy program, eligible farms are those cultivating maize/ rice on area of 1 Ha or less; smallholders are provided with a 50% subsidy of the input market price (and must pay for the remaining cost); with subsidised seed and fertiliser provided for 0.5 Ha of land.

7
continue to use DAP and Urea, but could experience an increase in yield of around 30% - 40%
if they switched to using fertiliser blends.
2.5. Access to finance
Tanzania is ranked 152 out of 189 countries in terms of access to credit, under the World Bank
Doing Business 2016 survey. Limited access to finance is particularly a constraint for the
agriculture sector – according to the Tanzania National Council for Financial Inclusion (NCFI),
the level of access to formal financial services in rural areas is only 8.5% relative to 23% in
urban areas; while 60% of the rural population is completely excluded from financial access,
relative to 45% in urban areas.
As illustrated by Figure 2.2 below, usage of formal financial services by agribusinesses is also
very low. The 2011 Agriculture Finance Markets Scoping Survey (AgFiMS) indicates that only
32% agri-business small and medium-sized enterprises (SMEs)5 accessed financial services,
with over half of surveyed agribusinesses excluded from any form of financial services.
Furthermore, agriculture-related loans account for just 15% of the commercial bank lending
portfolio in 2011.
Figure 2.2: Usage of financial services by SME agribusinesses
Source: AgFiMS Survey, 2011 in Tanzania National Council for Financial Inclusion
The key constraints impeding access to financial services for agriculture identified by the NCFI
include the unstable macroeconomic environment; the difficulty in enforcing contracts; the
lack of understanding of financial products; the limited range of financial products that are
designed for the agriculture sector; and the costs in reaching agribusinesses located in remote
locations.
The NCFI has targeted an increase in the share of agribusinesses with access to formal
financial services from 32% to 50% by 2016. Key activities include:
5 Small and Medium Enterprises (SMEs) in the agri-business sector are defined as entities with $600 dollars turn-over per annum or 5 acres of land; that is, agriculture producers, processors, and service providers with turnover of USD $600 or more

8
Increasing proximity of financial access points to where people live and transact (from
5% to 25%), such as through extending financial institutions branch networks, ATMs, POS;
with a focus on branchless banking mode.
Ensuring robust electronic information infrastructure, for individual and business
profiles, credit history and collateral.
Ensuring that customers are informed and protected, in terms of their means of payment
and stores of value.
2.6. Main government policy initiatives
This figure presents an overview of the major policy frameworks and programmes targeting
the agriculture sector in Tanzania.
Figure 2.3: Main GoT policy initiatives

9
2.7. Donor interventions
Donors originally committed $867m in support to Tanzania’s agriculture sector through the
New Alliance Country Cooperation Framework Agreements, of which $337m has been
disbursed as of 2014. The figure below presents an overview of key areas targeted by donor
support in Tanzania; a more detailed summary is provided in Annex B.
Figure 2.4: Donor activities in agribusiness
10
3. SECTOR ANALYSIS
This section was written during the first (desk-based) phase of our study and may not reflect
the most current or detailed information available.
This section provides a summary analysis of the following twelve agribusiness sectors in
Tanzania, the sectors were identified following consultation with the IFC:
Edible oils
Sugar
Maize
Flour milling
Cashew nuts
Coffee
Cotton
Dairy
Horticulture
Tea
Sisal
Rice
The following subsections provide a review of each of the above agribusiness sectors. We
provide an overview of the current size and identify the main agribusinesses operating in each
sector, discuss the competitiveness strengths and weaknesses and conclude by presenting an
initial view of the scope for GAFSP PrSW/ IFC investment.
3.1. Edible oils
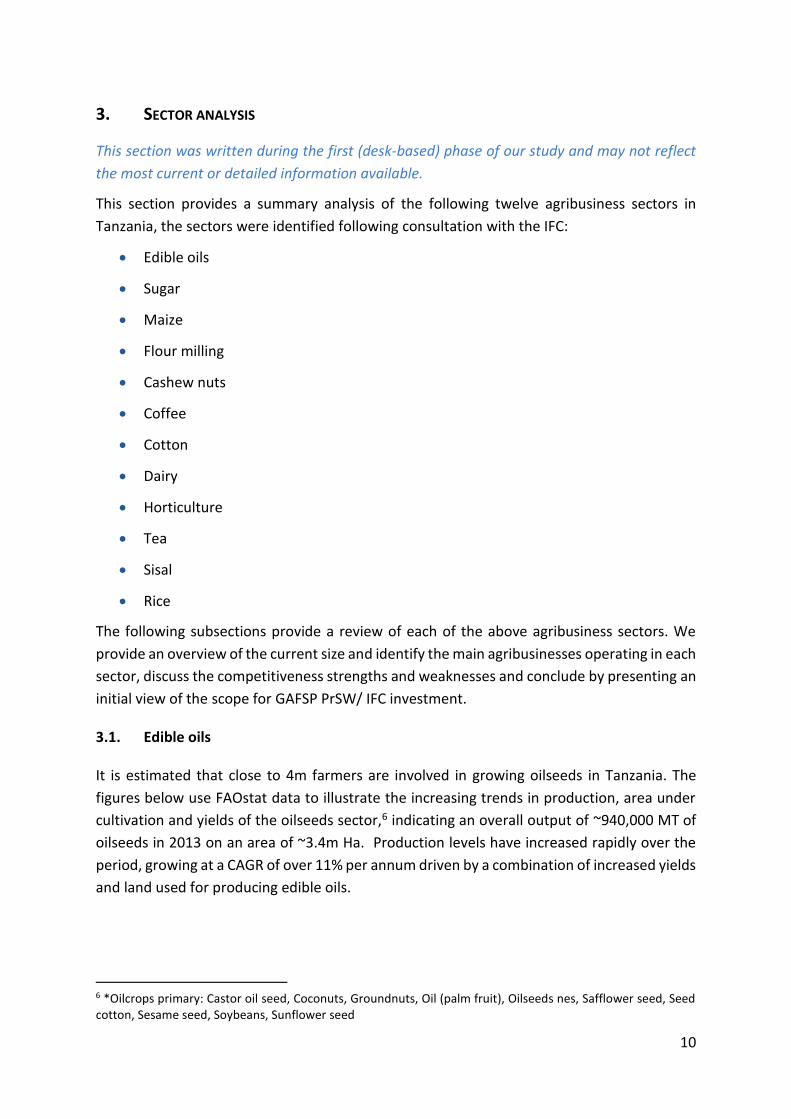
It is estimated that close to 4m farmers are involved in growing oilseeds in Tanzania. The
figures below use FAOstat data to illustrate the increasing trends in production, area under
cultivation and yields of the oilseeds sector,6 indicating an overall output of ~940,000 MT of
oilseeds in 2013 on an area of ~3.4m Ha. Production levels have increased rapidly over the
period, growing at a CAGR of over 11% per annum driven by a combination of increased yields
and land used for producing edible oils.
6 *Oilcrops primary: Castor oil seed, Coconuts, Groundnuts, Oil (palm fruit), Oilseeds nes, Safflower seed, Seed cotton, Sesame seed, Soybeans, Sunflower seed
11
Figure 3.1: Trends in production and yields of the oilcrops sector.
Source: FAOStat
The key oilseed crops are groundnuts (40%); sunflower (36%); sesame (15%); cotton (8%); and
palm oil (1%) (RLDC, 2008), with Tanzania ranked as one of the top ten sunflower oilseed
producers globally according to the FAO. Annex C presents further detail on these sub-sectors,
including in terms of areas of cultivation and production.
Processing in rural areas is mainly on a small-scale via manual oil presses, with large-scale
processing limited to Dar es Salaam, Morogoro, Arusha and Mwanza. Overall, there are
around 26 manufacturing plants producing edible oil – 22 for sunflower and oil seeds; and
five dedicated to refining palm oil to produce cooking oil and soap. An overview of the major
companies is provided as part of Annex C.
In general however, there is considerable variation in the data on production7 (particularly
sunflower and sesame) and consumption of edible oils – estimates of domestic demand for
edible oils range between 200,000 and 500,000 MT.
Domestic production is estimated to meet only 40-50% of total requirements, with the
country reliant on imports to supply the remainder. Imports are mainly in the form of crude
or refined palm oil, with total imports valued at between $120m-$230m each year. The figure
below presents the breakdown of the overall edible oil sub-sector.
7 TEOSA (2012) indicates a total production of over 800,000 MT of sunflower seeds and 130,000mt for sesame in 2011/12, yielding ~240,000 MT of sunflower oil in the market; while more recent estimates from FAO indicate a production 350,000 tons of sunflower oilseeds, yielding ~90,000 tons of oil.

12
Figure 3.2: Edible oil sub-sector breakdown
The sector is supported by the Agriculture Development Policy of Tanzania, which articulates
GoT’s commitment to: (i) facilitate formation of traders’ associations; (ii) provide quality
control services for oilseeds; (iii) set up an information system to link producers and traders;
and (iv) strengthen research and extension services. In addition, the sector is covered through
the CAADP framework, SAGCOT, Kilimo Kwanza Resolve and Agricultural policy (2012), with a
focus on oilseeds in the pipeline for Big Results Now Initiative.
A number of development partners have also targeted value chain development. The United
Nations Industrial Development Organization (UNIDO) has been working with the Ministry of
Industry and Trade to upgrade and modernise the agro-industry and competitiveness of
locally processing including sunflower oil, on both national and international markets.
Netherlands Development Organisation (SNV) has also targeted commercially viable and pro-
poor value chain development in sunflower and sesame, through: (i) influencing district and
national level policy development and public services; (ii) promoting inclusive business
arrangements between small-scale producers and the processing industry such as through
up-scaling contract farming arrangements and impact investments; and (iii) facilitating
knowledge development.
3.1.1. Overview of the edible oils value chain
Research and development
Inputs and farmer services
Production Post-harvest
Key constraints
Limited R&D on planting materials and plant health management
Weak coordination between designated ARIs
Inadequate public delivery of extension services
Fragmented and weak input supply system, with delayed delivery (under NAIVS)
Limited access to credit
Outdated agricultural practices
Land degradation; loss of soil fertility
Fungal and viral diseases
Poor quality / mixed seeds;
Poor storage facilities
Inefficient oil expelling technology
Palm-basedimports53%
Domesticsunfloweroil
28%
Otheroilimports12%
Domesticcottonoil
4%
Domesticpalmoil
3%
13
and R&D outreach posts
Lack of irrigation
Low prices
Non-standard measurements & packages
Low processing efficiency
Public sector
Sesame research –Naliendele Agricultural Institute (NARI); sunflower research – Ilonga Agriculture Training
Institute
NAIVS
VETA
AMCOs; TFDA; TBS
Private sector
Seeds: Mount Meru Seeds Limited; Kilimo Markets Co. Ltd
TEOSA; Highland Seeds; Kipato Seed Company
Intermech Company Limited;
Southern Highlands Agricultural Development Company Limited (SADCO).
BIDCO (contract farming)
Small-scale farmers;
East Coast Oil and Fats Limited (part of METL);
FELISA Company Ltd.;
BIDCO;
Associations: TASUPA; TEOSA
Associations: CEZOSOPA, TEOSA, TASUPA
Palm oil refining plants: Murzah Oil Mills Limited; BIDCO; Mukwano; East Coast; and Best Tigra Industries Ltd
Other companies:
East Coast Oil and Fats Limited (METL); Mount Meru Millers; Vegetable Oil Industries Ltd; SADCO; BIDCO; Uncle Milo Sunflower Oil Co.; MSK Refineries Ltd.; Nsagali Company Ltd; Kibaigwa Flour Supplies Ltd; SIZA Agro-processing; Frasal Inter Trade Limited.
Donor interventions
SNV UNIDO – IUMP ; IFAD- MUVI
SNV; VECO-Tanzania; IFAD- MUVI; RLDC
SNV; Rural Oriented Sustainable Development Organisation (ROSDO); FAO; IFAD-MUVI; UNIDO; RLDC; VECO Tanzania; CDI
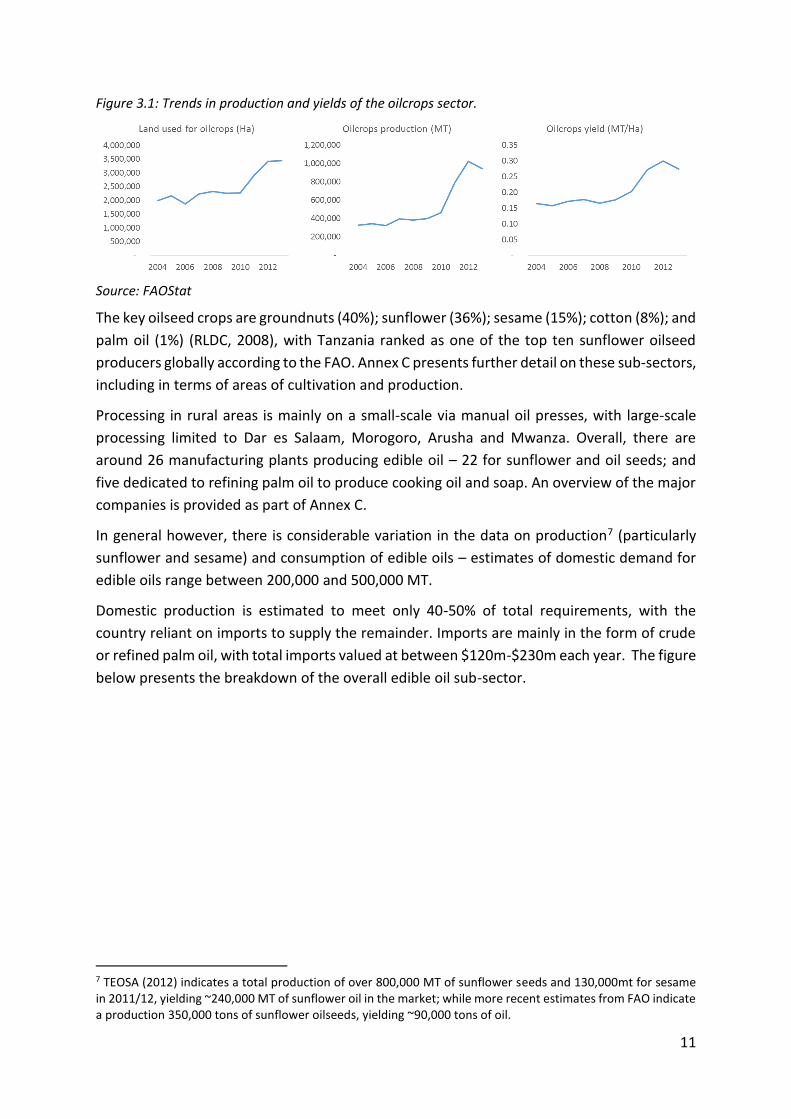
3.1.2. Strengths and weaknesses of the edible oils sector
Competitive strengths Competitive weaknesses
Demand-side growth driven largely by economic and population growth. In particular there are reports of growing consumer demand for sunflower oil.
Low yields due to use of disease-prone recycled oilseeds; lack of proper agronomic practices; and a poorly developed input supply system, with negligible use of fertilisers and chemicals.

14
Increased sunflower and sesame production has been supported by application of improved seeds; investment in crops (through District Agricultural Development Plans); increased mechanisation through Kilimo Kwanza; and international NGOs (RLDC, SNV, Aga Khan and VECO) supporting establishment of value chain actors bodies.
GoT’s recognition of the strategic role of edible oilseeds is reflected in key measures such as: (i) VAT waiver on domestically processed edible oils; (ii) subsidy in planting seeds under ASDP; and (iii) parallel standards for edible oils to allow SMEs access markets, etc.
Emergence of a number stakeholder associations; e.g. Tanzania Sunflower Promoters Association (TASUPA); Central Zone Oilseeds Processors’ Associations (CEZOSOPA); and Tanzania Edible Oilseeds Actors Limited (TEOSA), which aims to promote and protect interests of the edible oilseeds industry, and includes processors, producers, traders and suppliers of technology as its members.
Increasing private sector investment, including targeted support to out-growers. For instance, BIDCO offers small-scale oil palm farmers in Kigoma area, a guaranteed market for their produce.
Broad/ rural-based value addition is facilitated through scalability of oil pressing technology; with local capacity to support technology (e.g. Intermech; Small Industries Development Organization (SIDO); CARMATEC etc.)
Scope to develop linkages e.g. expansion of seedcake production for the livestock sector and export market. In addition, there is potential to expand cultivation of safflower, jatropha, castor seeds, moringa and olive
Sesame already has a strong export-based demand. There is scope to further consolidate Tanzania’s oil sub-sector in regional markets (EAC & SADC); as well as expand
Cyclical pattern in sunflower and sesame output due to inconsistent, unpredictable rainfall.
Focus is on production rather than oil content, resulting in poor seed quality (esp. sunflower).
Weak marketing system: (i) weakly organised farmer associations and uncoordinated actors; (ii) non-structured trade, with non-grading of seeds and use of non-standard measurements and packages; (iii) limited storage facilities, increasing post-harvest losses; and (iv) vulnerability to supply/ demand shocks, particularly for prices of crude palm oil;
Processing is estimated at ~30% of installed capacity. Key constraints: (i) inadequate supplies of oilseeds; (ii) outdated technologies, (particularly for small processors) and lack of standards and enforcement mechanisms for oil expelling technology (10-15% of oil is left in the seedcake); (ii) lack of small-scale technology for oil refining for products to conform to TFDA requirements; (iii) inadequate power supply; and (iv) limited accessibility to packaging materials (some evidence that packaging contributes ~30% of sunflower oil costs).
Other issues for processors include competitive pressures from imports of cheap refined/ semi-refined oils (e.g. vegetables oils industry); while SME oil processors have also been side-lined by recent food fortification initiatives.
Reliance on raw material imports due to inadequate local oilseed supply (e.g. ~80-85% of palm oil seeds and other inputs are imported by Murzah Oil Mills), resulting in exchange rate risks and other costs; e.g. the import process is lengthy, taking ~15 days to offload and clear cargo from Dar es Salaam port, increasing storage costs and delaying production.
Limited access to value-added services and markets, with no clear enabling policies in place. E.g. despite the potential, there are no national initiatives to support seedcake exports.
Institutional issues include multiple taxations system and limited support from TFDA/ TBS to certify domestic oil quality exports. Exporters are also constrained by document requirements (particularly for EU & US markets) and high transport costs.
3.1.3. Scope for GAFSP PrSW/ IFC investment in edible oils
The desk-based research suggests that there may be scope to develop the sector with a
particular opportunity to increase the production of oilseeds, particularly for sesame and
sunflower8, as well as to explore investments in oil seeds processing.
8 TEOSA (2012) estimates that introduction of Good Agricultural Practices (GAP) has the potential to double sesame and produce 4-5 times more sunflower (per acre).

15
However, preliminary research indicates that the scale of the sector could be an issue. The
Tanzania window of the AECF has financed a number of projects in the oilseeds sector
(summarised in the table below) at quite low investment sizes; we have not found any
evidence of larger scale investments in the sector through the desk-based research.
Table 3.1: AECF financed projects in the oilseeds sector
Company Approved funding (date)
Project objective Direct household beneficiaries
Total benefit expected at end of project
Uncle Milo Sunflower Oil Company (sunflower oil processing business in Dodoma)
$420,000 (2013)
Invest in two new oil processing capabilities – refining and fortification of sunflower oil, to ensure alignment with recent regulations which require all edible oils to be fortified with Vitamin A.
Double existing production volumes over next six years.
Strengthen/ expand contract farming arrangements to ensure consistent raw material supply.
3,510 (annual income of US$425)
US$ 1,523,122
Mount Meru Millers Ltd
$800,000 (2015)
Establish a sesame seed processing unit and oil factory for producing clean, graded sesame seed, de-hulled Sesame, sesame meal and sesame oil.
Benefits throughout-grower scheme and training programs conducted by the company
7,000 (additional $27 for each farmer; annual income of $214 per household)
US$1,498,000
MSK Refineries (refinery producing edible cotton seed oil, sunflower seed oil, seed cakes and by-products)
$800,000 (2011)
Set-up 1.5m double refinery edible oil plant for processing cotton and sunflower seed.
Invest in a farmer contracting and extension support to improve cotton yields and sunflower production.
30,000 (US $717 p.a.)
US$22,044,456
Source: AECF
Annex C presents an overview of some of the large agribusinesses operating in this sector.
3.2. Sugar
Sugar is thought to be the largest agro-processing industry in Tanzania, accounting for 35% of
gross output by volume of food manufacturing and 8.5% of the total value-added in
manufacturing.

16
FAOStat data indicates that while there have been increasing trends in the area used for
sugarcane cultivation and in production levels, sugarcane yields have exhibited a significant
decline – as discussed in section 3.2.2 below; key underlying constraints include the lack of
irrigation and adequate water storage facilities; in addition to prevalence of sugarcane ratoon
stunting disease. Overall production was estimated at close to 3m MT in 2013, with a total
area of 58,500 Ha under cultivation.
Figure 3.3: Trends in production and yields of the sugar sector.
Source: FAOStat
Sugarcane production is mainly on four major sugar estates, having a total of 31,000 Ha under
plantation management and average yields of 68 MT/ Ha. These are: (i) Kilombero Sugar
Company (KSC), accounting for ~42% of total output; (ii) Tanganyika Planting Company (TPC),
owning two sugarcane estates and factories respectively, and contributing ~25% of sugarcane
output; (iii) Mtibwa Sugar Estate (MSE); and (iv) Kagera Sugar Limited (KSL).
Three of the four estates – KSC, MSE AND KSL – work with ~18,500 small-scale cane
outgrowers, having a total of 27,000 Ha of land under cultivation and producing ~710,000 MT
of cane at an average yield of 27 MT/ Ha. Annex D presents further detail on the activities on
each of the four major estates, including a case study on the outgrower scheme adopted by
KSC.
Domestic sugar consumption is estimated at ~520,000 MT (including 120,000 MT of refined
sugar used for industrial purposes), exceeding the combined raw sugar production by the four
large estates, which is estimated at around 300,000MT. The deficit of ~220,000 MT is met
through sugar imports (mainly from outside the East Africa Region), which are valued at
approximately ~US$132m annually. Reports indicate that import licenses exceed
requirements, resulting in a raw sugar surplus imported annually. Sugar smuggling is also a
key concern.
As Tanzania is a sugar-deficit country, exports from the sector are relatively low; official STB
Annual Reports indicate sugar exports of 59,950 MT in 2012/13, with a total exported quantity
of 98,950 MT estimated over the period between 2010/11-2012/13. Existing reports cite high
transport costs and difficulties obtaining export permits, as some of the key constraints to
expanding exports.

17
Increased sugarcane production (including outgrower schemes) is a key component of the
SAGCOT project; in addition, GoT has been promoting large scale investments under the BRN
Initiative given strategic importance of the sector to food security and import substitution.
New greenfield projects in sugar have been planned in Kilombero District, under both these
projects. However despite these developments and the introduction of the five-year industry
development plan in 2010/11, there is perceived to be weakly organised government support
for the sector including limited capital provided.
The sector is regulated by the Sugar Board of Tanzania (SBT) under MAFC. GoT recently also
announced the establishment of a new sugar procurement entity under the SBT, to involve
both local producers and importers. The sector is perceived to have had a successful PPP
arrangement between SBT and the private sector centred on a research program undertaken
by the Kibaha Sugarcane Research Institute (KSRI)9, whereby GoT provided the infrastructure
and paid researchers’ salaries, with research funds contributed by private sugar processing
companies.10 In addition, a number of donor programmes have provided support for training
and inputs to outgrower programs.
3.2.1. Overview of the sugar value chain
Research and development
Inputs and farmer services
Production Post-harvest
Key constraints
Inadequate funding by government
High input costs (fertilizers & herbicides), with minimal government subsidies.
Low level of skills and training of out-growers (inadequate provision of extension services)
Shorter growing period
Lack of irrigation
Drought and flooding;
Pests and disease
Competition from cheap/ illegal imports
Post-harvest losses due to weak transport
Price volatility; unviable costs
Outdated processing operations
Difficulties obtaining export permits
Public sector
KSRI
Training: National Sugar Institute in Kidatu
Access to finance: NMB; Savings and Credit Cooperative Organizations (SACCOS)
SBT; Tanzania
Sugar Producers Association;
Tanzania Sugar Cane Growers Association;
Council of Cane Growers Associations;
SBT
Tanzania Sugar Producers Association
KNCU
9 Institution undertaking trials and research in pest and disease control, and in agronomic improvements. 10 The PPP supported an increase in cane production from 25-30 MT/ Ha to 40-55 MT/ Ha, with an increase in productivity from 70–90 MT/Ha to over 100 MT/ Ha from the perspective of the estates

18
Private sector
Private Agricultural Support Services
KSC; MSE; TPC; KSL
Out-growers; local groups of out-growers; out-growers associations11
KSC; MSE; TPC; KSL
Donor interventions
EU and WB financed capacity building
EU projects for block farms
AfDB-supported Bagamoyo project
EU and WB financed roads
3.2.2. Strengths and weaknesses of the sugar sector
COMPETITIVE STRENGTHS COMPETITIVE WEAKNESSES
Ideal soils and climate for sugarcane cultivation.
Growing local demand for sugar supported by rapidly rising population (increasing at about 3% p.a.) and incomes. Domestic sugar consumption is projected to increase at a rate of 20,000 MT annually.
The sector has benefited from investment from a number of global sugar companies (e.g. Illovo, ED&F Man; Ciel Group; Groupe Quartier Francais), with all four estates initiating cane area expansion and development (through gradual expansion of irrigation, introducing improved cane varieties and improving field practices) as well as rehabilitating/ improving milling capacity.
There is also a more long-term opportunity to expand supply to meet the regional sugar supply gap of ~400,000 – 500,000 MT/ year estimated for EAC common market (which is expected to be growing at >10% p.a.); in addition to exporting to other global deficit markets including Middle East; East Asia; EU (duty-free access under EBA); and North America (duty-free access under AGOA).
Opportunities also exist for expanding into ethanol and power markets – all four mills produce sufficient biogass to generate power for their cane processing and field irrigation, with some even exporting power to the national grid. The local market for power is expected to have ~100 MW of immediate unmet demand; in addition, there is potential to supply the local market for fuel.
Sugarcane yields are lower than elsewhere in East Africa, largely due to lack of irrigation and inadequate water storage facilities. Outgrower cane is almost entirely rain-fed (av. yields of ~40-80 MT/ Ha, vs. 80-110 MT/ Ha for irrigated cane) and as such, vulnerable to unpredictable weather and drainage issues. Estates having irrigation (e.g. TPC) face high electricity costs of pumping water from boreholes.
Cane quality is affected by ‘smut’ and ratoon stunting disease (reducing yield by over 50%, with a decline in the plant population); white scale pest, increasing the need for replanting; and harvesting during short rainy season.
Reduced producer prices due to decline in cane sucrose content (often below benchmark 10%), to levels lower than neighbours given fewer hours of crop exposure to sunshine.
Post-harvest losses; poor transport links impede timely delivery of cane to factories (annual 9 month cane crushing campaign is not feasible).
Underdeveloped state of the sugar sector by international and regional standards, with inefficient and outdated operations and factories reportedly operating below capacity.
Rabobank estimates transport costs of ~US$0.15 per MT/ km; as such, sugar estates focus on supplying region around their respective mills. Exports are even costlier –transporting sugar from Dar es Salaam to Rwanda cost an additional US$180/ MT, in addition to the transaction costs of obtaining export permits (particularly for exports to EU). An estimated 60,000 MT of sugar is smuggled out of Tanzania annually, mainly to Kenya, DRC, Burundi, Rwanda and Uganda.
11 Mtibwa Out-growers Association; Ruembe out-growers Association; Kilombero Cane Growers Association.

19
GoT has been reportedly reluctant to implement measures to facilitate large-scale foreign investment, imposing a ceiling of 10,000 Ha for cane production per investor (this is not seen as viable, even if accompanied by further 10,000 Ha for out-growers). Other issues include lack of land title deeds; large number of parties involved in investment process; lack of urgency and transparent tax structure; recent fivefold increase in land rental prices; and increased local taxes and service levies by local and district authorities.
Domestic production is also deterred by illegal imports, compounded by reported cases of exemptions to sugar duty/ levy-free or subsidised imports which are cheaper than locally produced sugar. A key constraint for local processers relates to the general lack of control over quantity of licensed sugar imports, while the timing of distribution is not synchronised with the local production cycle, often resulting in an over-supply when the domestic crushing season begins.
3.2.3. Scope for GAFSP PrSW/ IFC investment in sugar
The desk-based research suggests that there is a need for investments to target a more long-
term expansion in production to meet both the local and regional demand and supply gap,
supported by GoT’s recent focus on promoting development of new greenfield sugar projects.
Specifically, TIC has been allocated 40,000 Ha of land for coordinating investment in large-
scale commercial farming for sugar in Mkulazi area (two farms of 20,000 Ha each, with TIC
reporting interest of global players such as Illovo and Tereos in pursuing these opportunities).
Other strategic areas identified for cane farming expansion include Rufiji Valley, Kigoma,
Kilosa, Ngerengere and Bagamoyo.
Rabobank have also identified a number of investments in new sugar estates, involving
organisation of outgrowers into larger units (block farming) to facilitate economies of scale.
For instance, Indian investors are collaborating with local Tanzanian entrepreneurs to
establish a large sugar estate in the Rufiji area, with cane cultivation on ~10,000 Ha to produce
~125,000 MT of raw sugar annually. There is significant scope for further expansion, with the
project eventually aiming to produce 250,000 MT of sugar annually, making it the largest
estate in Tanzania. Out-growers would operate in blocks of 100 Ha.
Other projects identified include the rehabilitation of the Mohenda estate on Zanzibar Island,
with potentially ~1,500 Ha under cane production and a mill capacity of 25 MT of cane/hour.
Currently, the estate has ~400 Ha under rain-fed cane and potential to produce 8,000 MT of
raw sugar annually. Development of large-scale sugarcane greenfield operations near Lake
Tanganyika in the Rukwa/Kigoma region have also been proposed by a Dubai-based group.

20
In addition, there have been a number of private sector commitments to the sugar sector
through the New Alliance framework, notably for the Bagaomoyo EcoEnergy (BEE) project,
(summarised in the box below). Yara is reportedly exploring new partnerships in the sugar
value chain. There might be scope for GAFSP PrSW/ IFC to provide support to some of the
existing investment activities in the sector.
Box 3.1: Bagaomoyo EcoEnergy Project
Under the BEE project, Agro EcoEnergy (an African company) aims to produce sugar and renewable energy sustainably through development of a $425m agro-energy project (in a JV with GoT and supported by the African Development Bank (AfDB)) encompassing a sugar mill and bio-refinery via a 7,800 Ha sugarcane estate and 3,000 Ha out-grower programme, both fully- irrigated. The objective is to produce 125,000 MT of sugar, 8-15,000 m3 of ethanol, and 100,000 MWh/year of renewable electricity to the national grid.
Under the arrangements, government and local communities will be provided a 10% stake in the project company as ordinary equity (with further 15% in B-shares to be granted after 18 years), in exchange for land free of encumbrance, as a site for the facility. Further, there will be supplier contracts and off-taker agreements for sugar and power from ethanol.
However, the project appears to have been held up, with recently reports of the Prime Minister stating that the Bagamoyo project was unlikely to go ahead as it border’s the Saadani Game Reserve, and so its implementation would affect the area’s ecosystem.
Source: New Alliance for Food Security and Nutrition and Grow Africa (2015)
3.3. Maize
Maize is one of the most important food crops in Tanzania, accounting for approximately 20%
of agricultural GDP, 30% of overall food production and 40% of the total calories consumed.
Figure 3.4 below indicates an expansion in production, driven largely by increase in planted
area rather than increased yields. The country is thought to have one largest planted areas of
maize in Southern and East Africa, estimated between 4-5m Ha, with a production close to
6m MT in 2014 according to a recent report commissioned by BMGF.
Figure 3.4: Trends in production and yields of the maize sector.
Source: FAOStat
While maize is produced in all 21 regions in Tanzania, around 50% is concentrated in Southern
Highland regions of Morogoro, lunga, Mbeya, Rukwa and Ruvuma. An estimated 85-95% of
production is via small-scale farmers on an average landholding of ~0.7 Ha under low-input
and rain-fed conditions. Overall, ~3.5-4m households (60% of farming families) are involved

21
in production, in addition to a limited number of large-scale farms, mainly in the Southern
Highlands (30-50), which do not produce large quantities given unfavourably perceived
market conditions.
The figure below presents the market share breakdown of the maize sub-sector, indicating
that ~75% of maize production is consumed on-farm (including saved seeds12) or is purchased
by non-farming domestic households.13 Overall household consumption was estimated at 3.8-
4.5m MT in 2014, mainly in the form of ugali stiff porridge made from maize flour.
Figure 3.5: Market share of maize production
Source: Bill and Melinda Gates Foundation (BMGF) (2014)
The value chain is weakly organised and fragmented, with trade mainly through informal
unregulated channels. As with other sub-sectors, there is a question around the accuracy of
official statistics on maize production, marketing and exports – the share of production
marketed through commercial channels is estimated to vary between 20-35%, while the farm-
gate/ rural market is estimated at $665-900m (BMGF). In terms of processing, only around
12% of total maize production is milled into flour, with small-scale rural operations accounting
for over 90% of milled maize – this segment of the value chain is discussed further as part of
the sub-sector analysis on flour milling.
As Figure 3.5 above indicates, exports account for approximately 12% of maize production. A
USAID Report (2012) indicates that while official exports are minimal (estimated at just 3,000
MT), there is much higher informal trade with exports thought to have totalled 114,000 MT
in 2011 (of which 95,000 MT were directed to Kenya). BMGF’s estimates are higher still; based
12 It is estimated that over 70,000 MT of maize seeds are used by farmers in Tanzania each year, with ~80% of these seeds retained from the previous harvest. 13 With regard to consumption by domestic households, the maize is sold as grain to millers or markets, with households purchasing this either as flour or grain to mill themselves
On-farm
consumption57%
Savedseeds1%
Domestichouseholds
16%
Feedprocessing
10%
Foodsecurity4%
Exports12%

22
on interviews with traders, they estimate that at least 200,000 – 400,000 MT of maize exports
are directed to Kenya each year.
The sub-sector is prioritised as part of TAFSIP, SAGCOT, BRN and CAADP framework. Previous
efforts have targeted PPPs, with TAP outlining six district-level maize Commodity Investment
Plans (CIP) operations in the Southern Highlands. The Collective Warehouse-based Marketing
Schemes (COWABAMA) also targeted a significant increase in maize output by 100,000 MT by
2015, as well as other key objectives including 275 warehouse marketing schemes operational
by 2015 (first 50 being funded by BMGF), with 165,000 SHF participating (across all crops).
In addition, the sub-sector has benefited from the support of donors and a few large-scale
operators in the Southern Highlands. For instance, Clinton Development Initiative’s (CDI)
Anchor Farm Project (2012) has integrated commercial farming and smallholder outreach
through establishment of Ruaha Development Company to manage the operations of
Ngongwa Farm, a 900 Ha commercial farm owned by the Tanzanian Agricultural Seed Agency.
It has been working with over 4,000 farmers on improving agronomy and access to inputs and
markets.
3.3.1. Overview of the maize value chain
Research and development
Inputs and farmer services
Production Post-harvest
Key constraints
Poorly-funded research.
Lack of direct links between research and extension services.
Weak legal protection for plant breeders’/ patent rights for hybrid seeds.
Limited availability and high costs of improved seed and fertilisers.
Weak extension (~4000 workers).
Inappropriate fertiliser recommendations.
Low-input, rain-fed conditions.
Limited use of agro-chemicals, resulting in lack of nitrogen and other nutrient deficits.
Lack of soil moisture.
Weak rural infrastructure
Post-harvest losses of 20-40%
Lack of storage and aggregation at farmer level
Lack of market info and quality standards
Bans on exports
High cost and low quality of maize for feed processors
Public sector
Uyole Agricultural Research Institute
Tanzania Agricultural Partnership (TAP); Agricultural Non-State Actors Forum (ANSAF); Farm Inputs Promotion
System(FIPS)
TAP; ASDP;
Mtandao wa Vikundi vya Wakulima Tanzania;
Cereals Board; Tanzania Warehouse Licensing Board; Tanzanian Bureau of Standards; TFDA; NFRA; TAP; BRN

23
Private sector
Rural Urban Development Initiative (RUDI)
Supply of seeds: Seed Co Tanzania; TANSEED; AMINATA Highland Seeds; DeKalb; Pannar; Pioneer Montsanto; Mount Meru Seeds Limited; Syngenta
RUDI
Maize Growers’ Associations;
Large millers: Agro Processing and Allied Products (part of METL); Bahkresa Group; Export Trading Company (ETC)
Feed producers: Falcon Feeds; Interchick; Hill Animal Feeds; Kijenge Animal Products; SIZA Agro-processing
Donor interventions
CDI, Anchor Farm Project; AGRA Soil Health Program
USAID – Tanzania Staples Value Chain (NAFAKA);
Participatory Ecological Land Use Management, FERT; CDI Anchor Farm Project
Water Efficient Maize Africa (WEMA); Technoserve
USAID – Feed the Future’ SERA initiative and support for Tuboreshe Chakula Projects; BMGF; Purchase for Progress (PFP under WFP); The Purdue Improved Crop Storage (PICS)
3.3.2. Strengths and weaknesses of the maize sector
COMPETITIVE STRENGTHS COMPETITIVE WEAKNESSES
Major maize producer in East Africa with widespread cultivation and capacity for three harvests each year in different zones.
Rising production from increased land under cultivation; and improved use of legumes in Maize Farming Systems.
Research increasingly focused on variety development, diseases, droughts, pests and fertilizer application. There is also readily available appropriate technology which can be applied to the sub-sector.
Established national demand, with a dietary preference for maize over drought-adapted traditional cereals (e.g. sorghum and millet). Total annual consumption is growing at ~3%.
Market-based developments to support farmers, including WRS; professional Maize Growers Associations; Kibaigwa Maize Market (trade of over 100,000 MT of maize p.a.). To some extent, improved markets have increased market transparency (e.g. village representatives receive prices via SMS), while providing other benefits such as two weeks of free storage to sellers and more affordable long-term storage; as well as
Only ~2-3% of farmers undertake appropriate use of improved seeds and fertilisers. Yields have flattened at ~1.2-1.5 MT/ Ha, vs. potential 6-7 MT/Ha under GAP and appropriate fertiliser use to address lack of soil moisture and other nutrient deficits.
Despite increased availability, improved seeds cover ~26-27% of cropped area for maize. Affordability is an issue given high interest rates (30%) and seed-to-grain price-ratio of using hybrid seed of 10:1. Most seed companies import hybrid maize seeds for marketing given weak legal protection for plant breeder’s rights or patent rights.
Lack of irrigation (and dependence on erratic weather conditions) is a key factor driving unreliable production (particularly in the Northern Highlands); prices correspondingly vary from season to season, resulting in market uncertainty, which is particularly a constraint for commercial investors.
Other disincentives to production include the inability of NFRA and WFP to make timely and expedient payments to farmers), as well as inconsistent policies and structural issues including:

24
forming a single purchasing point for buyers from across Tanzania and region.
Value chain support from international organizations (including USAID; WFP; BMGF; FTF; CRS; CDI) and private sector, including: (i) farmer organization and development, particularly linking production to markets and attracting commercial investments; (ii) improving soil health and maize varieties; and (iii) hermetic storage.
Strong demand from Kenya, with maize prices ~20% higher on average than local prices. As a net exporter, Tanzania is also well-positioned to supply increasing demand from East Africa (given regional maize deficit of ~8m MT expected by 2020), particularly in light of the maize lethal necrosis disease. Tanzania’s competitive advantage is likely to increase as a result of climate change, given that trading partners are expected to have production affected by severe dry conditions. Overall, FAO (2015) indicates that Tanzania could be exporting ~2m MT of maize by 2020.
Increased demand for poultry feed, with large processors present in the feed sector. Currently, 100,000-150,000 MT of maize is annually purchased by a small number of large processors, with remaining 400,000MT processed by large number of small-scale feed processors. There is further untapped potential to expand yellow maize production for animal feed.
(i) unenforceability of contracts; (ii) cumbersome process for foreign investments; (iii) GoT’s focus on self-sufficiency and affordable prices at the cost of commercial expansion; and (iv) periodic bans on exports.
Fragmented value-chain, with inefficient links between producers, traders, processors and demand. Key marketing constraints include lack of trust, market information, standards and quality assurance; and geographical separation between demand and supply.
Post-harvest losses up to 30-40% in some rural areas due poor post-harvest handling, weak transport infrastructure, weather variability and biotic factors (e.g. insects, pests and mycotoxin-producing fungi). Inadequate low-quality storage is also an issue, as government warehouses are in disrepair, while available private warehouses are few in number and subject to prohibitive distances.
Limited trade opportunities, as exports have largely been opportunistic, often illegal and depend on other internal/ external factors (e.g. export bans). Legal exports are a costly, complex process, requiring multiple permit, while high transport costs from certain areas such as Mbeya in Southern Highlands also curb exports to Kenya
Constraints to processing (both milling and for feed), given insufficient throughput for small-local milling to be commercially viable; erratic nature of supply and demand; inefficiencies; and transaction costs of sourcing maize including high taxes, excessive transport costs and corruption. Feed processors are small and dispersed across the country.
3.3.3. Scope for GAFSP PrSW/ IFC investment in maize
The analysis commissioned by BMGF projects a CAGR of 8% for maize between 2014-20, with
production increasing from approx. 6m MT to 9.1m MT. Correspondingly there is scope for
investment targeted at expanding the maize processing sector. Scope for agro-processing
activities relating to flour milling are discussed in Section 3.4 below.
Demand from feed sector. The livestock sector (around half of which is dominated by
poultry) is estimated to be growing by 3-4%, with a corresponding increase in the
demand for maize used for poultry feed, supported also by opening up broiler and
hybrid poultry market. There are already a number of large agribusinesses processing
100,000-150,000 MT of maize annually and are keen to find a reliable source of maize.
E.g. Interchick and Hill Feeds are feed processors based in Dar es Salaam, purchasing
5,000 MT and 20,000 MT of maize respectively annually each year. The latter have
expressed interest in being connected to farmers to ensure quality. Kijenge Animal
Products Ltd is a medium sized feed processer based in Arusha, which has recently

25
been expanding facilities to increase animal feed production. There is also significant
undeveloped potential to introduce and expand yellow maize production.
Expansion of exports. Given the growing regional demand and East Africa deficit,
exports could be more broadly targeted beyond Kenya to Zambia, Malawi, Burundi,
DRC, Southern Sudan, Somali, Djibouti and possibly Ethiopia. Key issues at present
include the fragmented nature of the market – weakly organized foreign traders and
separation of surplus from demand.
There could be scope for GAFSP PrSW/ IFC investment in maize to target consultations with
the main processors to determine the scope to support additional investment in the sector.
3.4. Flour milling
Maize flour is the largest segment in the flour milling industry of Tanzania. The flour milling
industry also consists of wheat flour and to a lesser extent, rice, sorghum and cassava.
Tanzania’s exports of flour has increased dramatically in recent years, rising to US$43m in
2010 from just US$2m in 1997. An overview of the key sub-sectors identified is presented
below.
Maize flour production
Maize flour milling accounts for 12% of total maize production in Tanzania. The processing
industry is highly fragmented with ~30,000 flour mills of all sizes, the majority of which
operate at less than 5MT/ day:
Small-scale local milling operations in rural/ urban areas. Over 90% of maize milling
is at village based posho & small hammer mills, where households can have their
maize milled for a fee (converted into low-cost and low-quality flour). These mills
account for the majority of milled maize bought by Tanzanian consumers.
Limited number of medium/ large sophisticated (roller) millers. These commercial
mills provide a higher-quality product for middle and upper-income middle urban
consumers. Reports indicate that many are operating below capacity (~10-15 MT/
day) and/ or leaving the industry given consumers’ preferences for flour derived from
smaller mills, which impede profitability of commercial operations. Recent
government regulations also require large millers to fortify maize flour with vitamins
and minerals. The large players include Mohamed Enterprise and Export Trading Co
(which trade in maize as well as exporting maize and its products); Bakhresa/Azam
and General Mills of East Africa.
Maize flour is used to make ugali, a staple starch consumed by both urban and rural
populations.

26
Wheat flour production
The wheat sector in Tanzania is relatively small, with an estimated production of 170,000 MT
in 2014, mainly by smallholder farmers in the Southern Corridor, cultivating a few acres of
wheat each. There is also some wheat production in northern Tanzania, which is sold to the
millers in Arusha and Dar es Salaam.
Unlike the maize flour industry, wheat flour milling is dominated by large commercial players
such as Bakhresa, Azam and ANZANIA. Local wheat production competes with wheat
produced from FSU, Canada, Australia, USA and Germany, which is imported by the millers
through Mombasa and Dar es Salaam.
Wheat is mainly consumed in the form of flour in urban areas (with urban consumption
accounting for 83% of wheat flour market). However, consumption has been recently
declining due to high world wheat prices. Around 75% of wheat exports are directed to DRC,
with the remainder going to EAC partners.
While wheat flour is used in baked goods and breads, more traditionally, wheat flour is used
for ugali (though less frequently than maize-based ugali). Fortification of iron, folic acid and
vitamin A is becoming increasingly prominent, seen by some large millers as a form of CSR.
Cassava flour
Although cassava is not traditionally consumed in flour form, it presents a viable alternative
to wheat or maize flour. Cassava is the second most produced food crop behind maize,
supporting the livelihood of 37% of farmers in rural areas. Cassava flour is most commonly
consumed as ugali through a blend with maize flour for a desirable texture. Cassava flour
could play a significant role in food security given the periodic shortage of maize and the
reliance on wheat imports.
3.4.1. Overview of the flour milling value chain
Research and development
Inputs and farmer services
Production Post-production
Key constraints
Low-yielding seeds with poor drought adaptability
Reliance on imported wheat
High competition of maize flour mills results in low margins
Poor nutritional content without fortification
High cost of transportation to export overseas
Public sector
Ministry of Agriculture, the Tanzanian Food and Drug Authority, and the Tanzania Food and Nutrition Centre
Tanzanian Food and Drug Authority, and the Tanzania Food and Nutrition Centre
Millers Association of Tanzania
International Association of Operative
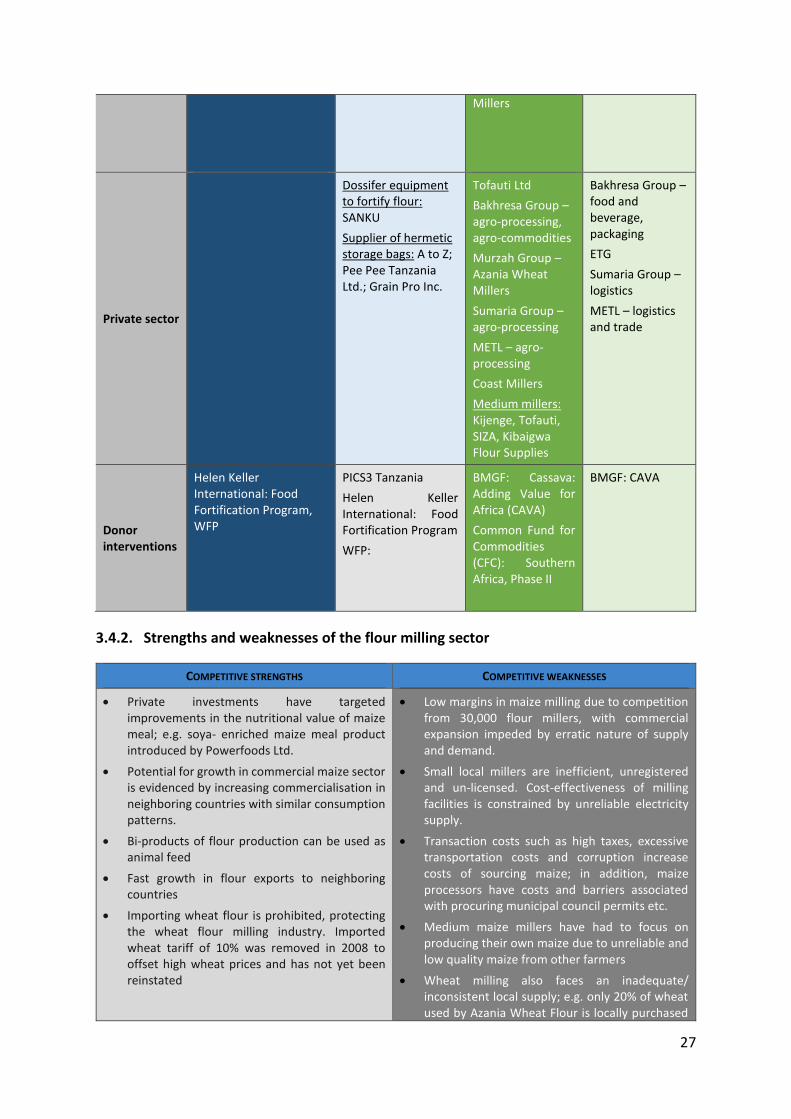
27
Millers
Private sector
Dossifer equipment to fortify flour: SANKU
Supplier of hermetic storage bags: A to Z; Pee Pee Tanzania Ltd.; Grain Pro Inc.
Tofauti Ltd
Bakhresa Group – agro-processing, agro-commodities
Murzah Group – Azania Wheat Millers
Sumaria Group – agro-processing
METL – agro-processing
Coast Millers
Medium millers: Kijenge, Tofauti, SIZA, Kibaigwa Flour Supplies
Bakhresa Group – food and beverage, packaging
ETG
Sumaria Group – logistics
METL – logistics and trade
Donor interventions
Helen Keller International: Food Fortification Program, WFP
PICS3 Tanzania
Helen Keller International: Food Fortification Program
WFP:
BMGF: Cassava: Adding Value for Africa (CAVA)
Common Fund for Commodities (CFC): Southern Africa, Phase II
BMGF: CAVA
3.4.2. Strengths and weaknesses of the flour milling sector
COMPETITIVE STRENGTHS COMPETITIVE WEAKNESSES
Private investments have targeted improvements in the nutritional value of maize meal; e.g. soya- enriched maize meal product introduced by Powerfoods Ltd.
Potential for growth in commercial maize sector is evidenced by increasing commercialisation in neighboring countries with similar consumption patterns.
Bi-products of flour production can be used as animal feed
Fast growth in flour exports to neighboring countries
Importing wheat flour is prohibited, protecting the wheat flour milling industry. Imported wheat tariff of 10% was removed in 2008 to offset high wheat prices and has not yet been reinstated
Low margins in maize milling due to competition from 30,000 flour millers, with commercial expansion impeded by erratic nature of supply and demand.
Small local millers are inefficient, unregistered and un-licensed. Cost-effectiveness of milling facilities is constrained by unreliable electricity supply.
Transaction costs such as high taxes, excessive transportation costs and corruption increase costs of sourcing maize; in addition, maize processors have costs and barriers associated with procuring municipal council permits etc.
Medium maize millers have had to focus on producing their own maize due to unreliable and low quality maize from other farmers
Wheat milling also faces an inadequate/ inconsistent local supply; e.g. only 20% of wheat used by Azania Wheat Flour is locally purchased

28
Local abundance in production of both cassava and maize
(through contracts with local suppliers); remaining 80% is imported from Canada, US, Australia, Germany and Argentina. While Bakhresa and Coast Millers imports 98% of its wheat (latter from Ukraine, Croatia, Argentina, German, Russia, Pakistan and India)
Wheat imports face high transaction costs/ constraints, such as power interruptions and unreliable suppliers. Azania Wheat Flour has had to pay the army up to US$45,000 per import consignment to patrol the dock (e.g. due to issues of piracy); further the company is required to pay the shipper a penalty of up to $120,000 per day for docking delays at the port of Dar es Salaam
3.4.3. Scope for GAFSP PrSW/ IFC investment in milling
Reports suggest that large maize flour processors have been pushed out of the market by
small and medium millers (who can produce flour tailored to consumers’ demand) and are
shifting their focus to wheat. However, given recent trends towards commercialisation of
maize flour milling in neighbouring countries, there may be an opportunity to capitalise on
industry consolidation in the future if millers can connect with smallholders and develop the
technology to produce maize flour to consumers’ taste, at scale. For instance, Tofauti Sembe,
a medium-sized mill which uses its own maize for flour processing, has indicated interest in
connecting with small-scale farmers, provided quality is assured. Equally, there may be an
opportunity to backward integrate along the maize value chain given Tanzania’s potential for
local maize production.
Other areas with scope for investment include agro-processing to expand into the market for
animal feed (cattle, pigs and local breeds of poultry) and quality maize meal. For instance,
USAID’s ‘Feed the Future’ initiative, the Tuboreshe Chakula Projects will work to support
fortified maize flour. The PE firm Fanisi Capital, has also reportedly bought a $65m minority
stake in Tanzanian agro-processing company, Kijenge Animal Products Limited (Kijenge), a
mid-sized maize flour milling, animal feed milling and poultry production firm.
However, in the nearer-term, there may be more potential for investments in wheat milling
given the presence of several large domestic players in this sub-sector, as well as to increase
value-add, especially to increase the nutritional content to might malnutrition. Although, we
note that this would need to be considered against key constraints, particularly the reliance
on wheat imports, compounded by existing policy risks surrounding the absence of import
tariffs.
3.5. Cashew nuts
According to the African Cashew Alliance, Tanzania is Africa’s fourth-largest producer of
cashew nuts (behind Ivory Coast, Nigeria and Guinea-Bissau). However, the sector accounts
for a small share of total agricultural production in Tanzania, with significant volatility

29
observed in FAOStat data, particularly in terms of area used for cultivation and cashew nuts
yields, which could in part be attributed to increasing disincentives to production (discussed
further in sub-section 4.4.3 below). As Figure 3.6 below indicates, production of raw cashew
nuts (RCN) appears to have declined from a peak of 160,000 MT in 2012 to ~128,000 MT in
2013, with a total area of ~410,600 Ha estimated under cultivation.
Figure 3.6: Trends in production and yields of the cashew net sector.
Source: FAOStat
According to the Cashew Nut Board of Tanzania (CNBT), at least 700,000 households rely on
the crop for 75% of their annual income. Smallholder farmers typically cultivate 1-2 Ha of
cashew nut trees, at times inter-cropped with food crops such as cassava, grain staples and
legumes. Close to 80% of total area and production of cashew nuts is concentrated in
southern coastal regions of Mtwara, Lindi, and Ruvuma.
Following introduction of the Warehouse Receipt System, all exports must be marketed
through Agricultural Marketing Co-operative Societies (AMCOS) before being sold via auction,
where exporters and processors bid for raw cashew nuts.
Approximately 88% of production is exported as raw nuts for processing abroad, mainly to
India, with the sector estimated to account for 10% of total agricultural exports. The desk-
based research indicates that cashew exports were valued at $133.5m for the year ending
May 2014, as compared to $150m in the previous year, with the decline in earnings attributed
to falling global prices and lower production.
Only 12-20% of production is processed. The country’s processing capacity in 2013 was
estimated at ~136,700 MT at 25 plants, with per plant capacity ranging between 300 –12,000
MT. However, reports suggest maximum estimated processing of 30,000 MT in 2012.
Olam Tanzania is the largest processor with a capacity of 25,000 MT p.a., followed by Export
Trading Company (Tunduru) and Mohammed Enterprise (Dar es Salaam), which have a
maximum processing capacity of 5,000 MT p.a. each; while. Jumbo nut (Dar es Salaam) and
Perfect cashew nut (Masasi) are medium-scale, processing a maximum of 3,000 MT p.a.
The CNBT is the main sector regulator. It is involved in policy formulation and quality control,
as well as being the main coordinating body in the sector

30
3.5.1. Overview of the cashew nuts value chain
Research and development
Inputs and farmer services
Production Post-harvest
Key constraints
Financial; technical resource constraints
Inadequate use of inputs, especially pesticides
Inadequate and weak coverage of extension (lack of skills, training & equipment)
Insufficient availability of planting materials
Lack of irrigation
Poorly maintained & aged trees
High production costs, coupled with low farm-gate prices
Poor drying and storing of nuts
Insufficient bags for packaging
High energy costs
Inefficient use of processing technologies
Low hygiene in manual processing
Public sector
Cashew Research Institute ;
NARI;
University of Dar Es Salaam (UDSM)
District Agricultural and Livestock Offices; NARI; Cashew Nut Development Centres; National Cashew Input Fund; CAMATEC; SIDO; NARI; VETA;
Primary cooperative societies; cooperative unions
Financial services: NMB; CRDB
Cooperatives: TANECU; MAMCU; ILULU; TAMCU; CORECU; and DARECU
CNBT; Cashew Nut Industry Development Trust Fund; Ministry of Agriculture and Cooperatives; Primary cooperatives and cooperative unions; AMCOS
Private sector
Chemical companies; e.g. Syngenta
Masasi High Quality Farmers Products Limited (MHQFP)
Processors: Olam Tanzania; Export Trading Company; Mohammed enterprise (METL – Mo Cashew); Jumbo nut and Perfect Cashew Nut
Newala factory; Kitama Farmers Association; MHQFP
Warehouses
Donor interventions
NGOs: Action Aid, Dutch Connection – support to MHQFOP;
3ADI – VCDSP
3ADI – VCDSP; UNIDO; FAO
3.5.2. Strengths and weaknesses of the cashew nuts sector
Competitive strengths Competitive weaknesses
Tanzania produces larger nuts than other African countries and the harvest coincides with the end of the Indian and West African season.
Poorly-maintained over-aged plantations, with insufficient availability of planting materials to support rehabilitation; lack of farmers’

31
The Tanzanian crop is also considered to be one of the best quality cashews globally; high quality (more than 90% is sold as Grade A) and value means that Tanzanian cashew nut is relatively easy to market.
Global increase in demand for cashews is estimated at 9% p.a., with African production contributing ~45% of global output.
CNBT has implemented an auction system, with a view to rationalising marketing costs between producers (organised through cooperatives) and Cooperative Unions, through the use of WRS. A commodity exchange has also been initiated.
Under 2016/17 national budget, GoT recently announced that it is abolishing “unnecessary” levies and fees charged by agents, regulatory bodies and local government authorities – that is, farmers no longer need to pay the levy of US$0.01/ kg of cashew nuts charged by the Cooperative Union, nor the US$0.02/ kg transportation levy.
Untapped potential to develop value addition of kernels such as in the form of butter, soups, powder, pastes etc.; as well as pursuing marketing of by-products (CNSL, testa and shells) and capturing and reusing energy in cashews and shells. Bloomberg has reported that Tanzanian authorities are looking to increase local processing from 40 small-scale factories, including by-products such as cashew nut shell used in pharmaceuticals.
knowledge on management and agronomic techniques; and inadequate use of inputs.
Yields are less than 1 MT/ Ha, which although productive by East African standards, is below comparable yields in West Africa (2 MT/ Ha in Nigeria), or the most productive countries (3 MT/ Ha in Mexico; ~5 MT/ Ha in Philippines).
Lack of irrigation has increased vulnerability to weather conditions with RCN production expected to have declined by 40% in 2015 due to poor rains in the major growing areas.
Weak marketing system, with lack of information on opportunities and prices. There have also reportedly been riots due to CNBT paying farmers less than the agreed price.
Disincentives to production, mainly due to export tax of 15% on RCN as well as the move towards centralised auction and WRS, increasing costs (as processors go through a double transaction of selling the crop through the primary societies and buying stocks from warehouses on auctions) and allegedly leading to a grey market. Local taxes of ~5% are also applied to the farm gate price.
Local processing is at a competitive disadvantage to the Indian industry which benefits from a low-cost skilled workforce. Average capacity utilisation for large scale processors in Tanzania is estimated at just 21% (2012); key constraints include: (i) difficulties accessing loans to purchase RCN at affordable prices to maintain continuous processing operations year-round; (ii) shortage of workers for labour-intensive processing activities as local processing is based on manual technology from India; (iii) aside from a few companies (e.g. OLAM), most commercial processors lack technological and managerial capacity, facing high fixed and running costs and need to upgrade factories, adapting to lower scale operations.
Bureaucratic constraints to exports, with multiple permit requirements for traders and overregulation (multiple bodies). The export tax has had limited effectiveness in promoting in-country processing, as exports are still seen as more attractive. The Indian market also benefits from purchasing power.
3.5.3. Scope for GAFSP PrSW/ IFC investment in cashew nuts
Given the increasing global demand for cashews (estimated at 9% p.a.), a number of private
players are pursuing expansion activities in Tanzania, with a view to accelerating exports of
processed cashews through backward integration. For instance, Mo Cashew (under METL) is
currently expanding its own plantations, with a target production level of 30,000 MT.

32
Key projects supported by development partners include 3ADI’s Value Chain Development
Support Program (VCDSP), which has aimed at doubling cashew nut production by 2020,
accompanied by an increase in domestic processing (to 80%), with 30% of production sold on
domestic and African regional markets.
In general though, our initial findings suggest that is a limited pipeline of GAFSP PrSW/ IFC
investments in the cashew nut sector, given for instance, the greenfield risk for investors
associated with establishment of new cashew nut orchards. In practice, it also seems difficult
to develop value addition activities in the sector – including modernising and/ or expanding
processing plants – due to the inherent competitive advantage currently enjoyed by India in
this regard.
3.6. Coffee
Although Tanzania is not a major producer of coffee on a global scale (accounting for just
~0.6% of the world market), the sector represents 24% of the value of traditional cash crops
and is one of the largest export crops in the country.
Overall, production of coffee beans was estimated at ~71,000 MT in 2013, with approximately
224,000 Ha under cultivation. According to the FAOStat data, production has increased in the
last few years, but as shown in the figures below, the longer-term trend suggests that
production has been stagnant.
Figure 3.7: Trends in production and yields of the coffee sector.
Source: FAOStat
One of the underlying factors identified for this trend is the declining production in the
Northern Highlands, where production has been largely based. Other regions of coffee
cultivation include Southern Highlands (Mbeya, Ruvuma and Ludewa Regions), and the
Western Lake Zone (in Kagera Region), in addition to Tanga, Iringa, Manyara, Morogoro,
Kigoma, Mwanza, Rukwa and Mara Regions.
Most production (~90%) is by ~450,000 smallholder families, typically operating on 0.5-1 Ha
of land; with the remainder output accounted for by largest estates (over 110 have been
estimated). Overall, approximately 2.4m individuals are supported by the coffee sector.
Arabica coffee contributes around 70% of total coffee production and is almost entirely wet-
processed; the remainder 30% of production is of robusta, grown only in the Kagera region.

33
There are thought to be around 15 coffee and hulling plants, with production capacities
varying between 1.5-8 MT/ hour. Larger plants typically operate with older equipment and
are owned by cooperative unions, while most smaller plants are owned by multinational
coffee companies with modern technologies and fewer employees. In addition to coffee
processors, the value chain also includes coffee roasters and blenders.
Domestic coffee consumption is relatively low (per capita consumption of ~0.06 kg p.a.), with
over 90% of production directed to export markets – mainly to the E.U., but also Japan and
the U.S.A. As such, coffee is one of the largest agricultural export commodities, valued at
US$162.4m in 2013 (FAOStat).
Marketing of coffee exports is largely through a centralised auction in Moshi (Northern
Tanzania). Historically, purchases at Moshi have been concentrated in terms of four key
traders – Mazao; Tchibo; Dorman; Taylor Winch.
In addition to sector prioritisation under the ASDP, the Coffee Industry Development Strategy
2011–16 has been introduced by the Tanzania Coffee Board to establish a framework for
expanding production and improving quality. Further detail is provided in Box 3.2 below.
Box 3.2: Coffee Industry Development Strategy 2011–16
Key objectives of the Coffee Industry Development Strategy include: (i) expanding production (from 50,000 MT to at least 80,000 MT by 2016 and 100,000 MT by 2021); (ii) improving quality of output by 2016 (by increasing share of coffee sold with price premiums on export markets from 35% to 70% by 2021); (iii) improving the business environment; (iv) increasing farmer incomes and price premiums (increasing farmers’ share of net FOB price on coffee exports to at least 75% by 2021); and (v) increasing value addition throughout the coffee value chain.
The strategy is based on the following key strategic thrusts: (i) increased productivity; (ii) enhanced internal marketing process and business environment; (iii) improved quality; and (iv) development on new markets including sustainable coffee. Key areas of GoT support will include:
Progressive replacement of old trees with improved varieties, combined with application of GAP to support +100% increase in average yields from current level of 225 kgs/ Ha of clean coffee to 450 kgs/ Ha of clean coffee by in 2021 (+55% in 2016);
Expanding area under production, with a total of 10,000 Ha planted by both small holders and large scale investors by 2021 (at least 1,000 Ha per year).
Support from TaCRI seedlings multiplication program, whereby ~20m seedlings will be availed annually on this period.
Increased coffee agronomy extension support on the field, through Training of Trainers and capacity building of extension officers to provide village-based training and facilitate technology transfer to farmers in their groups.
Expected outcomes include additional revenues (at a national level) of at least US$150M annually through export earnings, of which at least 75% would be redistributed to coffee farmers. This is expected to almost double the coffee incomes of an estimated 400,000 households, contributing to a sustainable capacity for self-improvement of the coffee industry in Tanzania.
The sector has also benefited from introduction of innovative financing mechanisms,
including the WRS and KILICAFE’s financial linkage, supported by TechnoServe. GoT is in
process of establishing a commodity exchange, which would eventually cover coffee & tea.

34
3.6.1. Overview of the coffee value chain
Research and development
Inputs and farmer services
Production Post-harvest
Key constraints
Need for more research into improved varieties
Low availability of improved coffee varieties
Inadequate access to and low use of inputs
Limited access to credit
Lack of knowledge infrastructure
Lack of irrigation
Insufficient, ageing trees.
Poor husbandry
Coffee Berry Disease; Coffee Leaf Rust
High transaction costs and restrictive regulations
Price volatility
Inadequate functional central pulperies
Public sector
Tanzania Coffee Research Institute
Association of Kilimanjaro Specialty Coffee Growers (KILICAFE)
TaCRI seedlings multiplication program
Tanzania Coffee Board; Tanganyika Coffee Growers Association; KILICAFE; Kilimanjaro Native Cooperative Union (KNCU); Kagera Cooperative Union Ltd; Karagwe District Cooperative Union
Tanzania Coffee Board; Tanzania Coffee Board Inspection Facility; Tanzania Coffee Association; KNCU; Kagera Cooperative Union Ltd; KILICAFE; Mbinga Cooperative Union
Private sector
Israel Chemicals Limited (ICL) Specialty Fertiliser
Coffee farms (estates & smallholdings);
Burka Estates Limited; Mufindi Tea Company
Processors: Tanganyika Coffee Curing Company;
International processing companies: Neumann Kaffee Gruppe (two curing plants – City Coffee of Mbeya & Mazao Limited); Volcafe Ltd (Rafiki Coffee Ltd of Moshi); Gourmet Coffee Company
Instant coffee producer: Tanzania Instant Coffee Company; Afri Tea and Coffee Blenders Ltd.
Exporters: Ibero Coffee Tanzania Limited (owned by Neumann Kaffee Gruppe); Tailor Winch Tanzania (owned by Volcafe Ltd Dorman Export
Donor interventions
TechnoServe (support to KILICAFE)
Fairtrade Coffee
Fairtrade Coffee
VSO Tanzania
Fairtrade Coffee
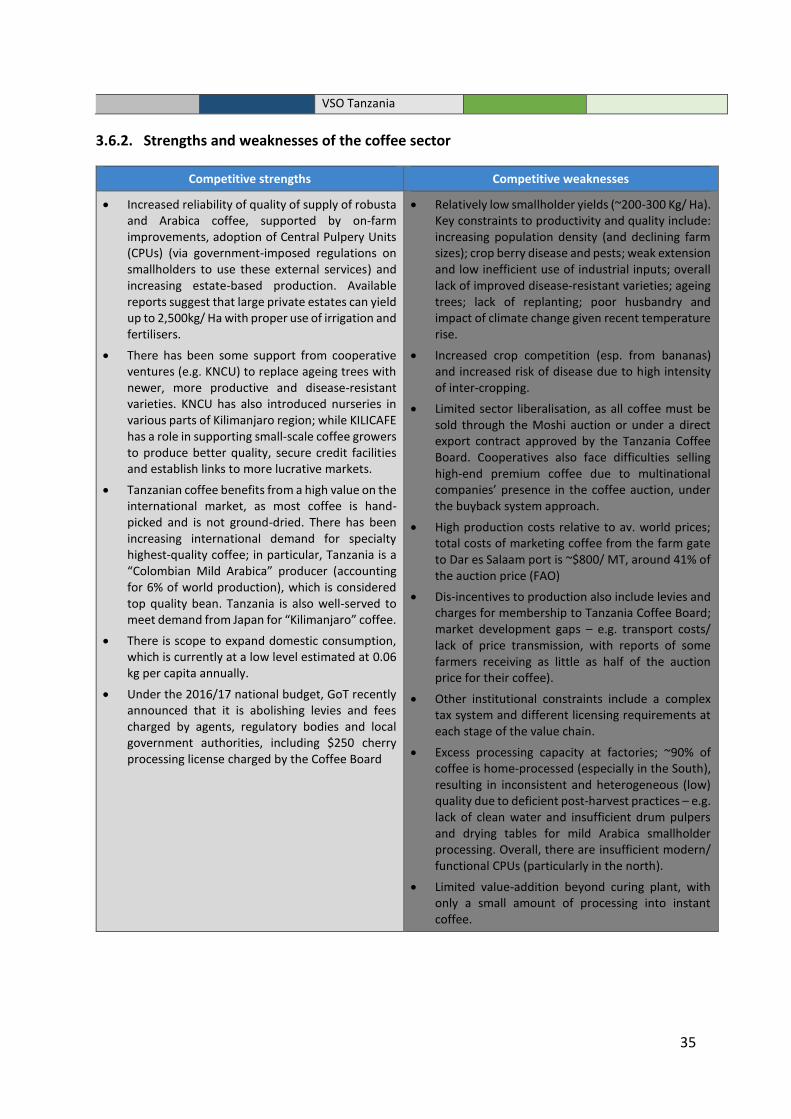
35
VSO Tanzania
3.6.2. Strengths and weaknesses of the coffee sector
Competitive strengths Competitive weaknesses
Increased reliability of quality of supply of robusta and Arabica coffee, supported by on-farm improvements, adoption of Central Pulpery Units (CPUs) (via government-imposed regulations on smallholders to use these external services) and increasing estate-based production. Available reports suggest that large private estates can yield up to 2,500kg/ Ha with proper use of irrigation and fertilisers.
There has been some support from cooperative ventures (e.g. KNCU) to replace ageing trees with newer, more productive and disease-resistant varieties. KNCU has also introduced nurseries in various parts of Kilimanjaro region; while KILICAFE has a role in supporting small-scale coffee growers to produce better quality, secure credit facilities and establish links to more lucrative markets.
Tanzanian coffee benefits from a high value on the international market, as most coffee is hand-picked and is not ground-dried. There has been increasing international demand for specialty highest-quality coffee; in particular, Tanzania is a “Colombian Mild Arabica” producer (accounting for 6% of world production), which is considered top quality bean. Tanzania is also well-served to meet demand from Japan for “Kilimanjaro” coffee.
There is scope to expand domestic consumption, which is currently at a low level estimated at 0.06 kg per capita annually.
Under the 2016/17 national budget, GoT recently announced that it is abolishing levies and fees charged by agents, regulatory bodies and local government authorities, including $250 cherry processing license charged by the Coffee Board
Relatively low smallholder yields (~200-300 Kg/ Ha). Key constraints to productivity and quality include: increasing population density (and declining farm sizes); crop berry disease and pests; weak extension and low inefficient use of industrial inputs; overall lack of improved disease-resistant varieties; ageing trees; lack of replanting; poor husbandry and impact of climate change given recent temperature rise.
Increased crop competition (esp. from bananas) and increased risk of disease due to high intensity of inter-cropping.
Limited sector liberalisation, as all coffee must be sold through the Moshi auction or under a direct export contract approved by the Tanzania Coffee Board. Cooperatives also face difficulties selling high-end premium coffee due to multinational companies’ presence in the coffee auction, under the buyback system approach.
High production costs relative to av. world prices; total costs of marketing coffee from the farm gate to Dar es Salaam port is ~$800/ MT, around 41% of the auction price (FAO)
Dis-incentives to production also include levies and charges for membership to Tanzania Coffee Board; market development gaps – e.g. transport costs/ lack of price transmission, with reports of some farmers receiving as little as half of the auction price for their coffee).
Other institutional constraints include a complex tax system and different licensing requirements at each stage of the value chain.
Excess processing capacity at factories; ~90% of coffee is home-processed (especially in the South), resulting in inconsistent and heterogeneous (low) quality due to deficient post-harvest practices – e.g. lack of clean water and insufficient drum pulpers and drying tables for mild Arabica smallholder processing. Overall, there are insufficient modern/ functional CPUs (particularly in the north).
Limited value-addition beyond curing plant, with only a small amount of processing into instant coffee.

36
3.6.3. Scope for GAFSP PrSW/ IFC investment in coffee
While the Coffee Industry Development Strategy has set ambitious targets – including a two-
fold expansion in production by 2021 – preliminary findings suggest that the industry is still
constrained by low quality and productivity due to a factors including limited use of inputs
and insufficient replanting; inefficient marketing and lack of value addition. In this context,
any investments to expand the number of processing units, would need to be accompanied
by support targeted at agronomic improvements and increasing farmers’ adoption of these
CPUs.
Indicative examples of the types of investments required in the coffee sector include a $14m
loan provided by FMO to Aviv Tanzania (a subsidiary of Olam International), a 1,200 Ha
greenfield coffee plantation and a wet and dry mill processing facility in the Songea district
(South West Tanzania). The project provides training to outgrowers to improve yields, as well
as supporting development of roads and energy services in the region and implementation of
an Integrated Water Resources Management Plan, facilitating drip irrigation for coffee
production. Under the New Alliance Framework, Armajaro (a global soft commodity trading
house and supply chain manager), is also supporting development of smallholder coffee
farmers in the Mbeya and Mbinga regions by providing access to finance, improving
productivity (e.g. through training in GAP and increasing processing in the wet mills); and
strengthening market linkages.
Given that there is currently limited processing beyond the curing plant, other opportunities
highlighted by the available research relate to an expansion of value addition activities.
However, at present it is unlikely that such investments would be sufficiently large and of the
scale typically required by GAFSP PrSW/ IFC. For instance, Tanzania Instant Coffee Company
Ltd – which is among the few instant coffee factories in East and Central Africa – has a
relatively low annual production of 500 MT of instant coffee and sales of ~US$1.9m in 2010
(of which ~US$1m were exports). Another identified player, Afri Tea and Coffee Blenders Ltd.
Is the only East African producer of instant coffee exporting to Japan. However, again, it has
a small capacity of 300MT p.a. for instant coffee powder and 750 MT p.a. for roasted and
ground coffee.
3.7. Cotton
Cotton is one of Tanzania’s largest sources of export revenue. Cotton products (including
cotton lint, seed, cake and cotton seed oil) brought in over US$96m in 2013. The crop is
mainly grown on small scale farms ranging from 0.5 to 10 Ha, with average farm size being
1.5 Ha.
97% to 99% of Tanzania’s cotton is grown in the northwest of the country near Lake Victoria.
Simiyu, Shinyanga, Mwanza, and Geita are the largest cotton producing regions in Tanzania,
with Simiyu region producing over 40% of the national output. Production is dominated by
smallholder farmers who use rain-fed techniques/ basic technology. In total it is estimated

37
that between 350,000 and 500,000 smallholder farmers are involved in producing cotton on
around 400,000 Ha of land each year. Cotton yields in Tanzania are reported to average 0.55
MT/ Ha, which is well below global averages of around 0.8 MT/ Ha; in addition the poor quality
of Tanzanian cotton has meant that traders have had to sell the product at a discount on the
world market.
As Figure 3.8 below shows, cotton seed production has been quite volatile over the past 15
years, varying from around 75,000 to 225,000 MT, but with no real extended period of
sustained growth. According to USDA estimates, around just 120,000 MT of cotton seed was
produced in 2015/16, with current forecasts suggesting that this will increase to 140,000 MT
in 2016/17. The decline in production in 2015/16 was attributed to lower than expected
levels of rain during the February - March 2015 period, which are important months for cotton
production.
Alongside changes in the global price of cotton, erratic weather conditions is reported to be
the main factor behind the level of volatility in production of seed cotton. More structural
factors constraining the growth of the sector include a lack of affordable and quality inputs
for smallholders and the lack of trust/ working relationship between cotton producers and
ginners, which has helped to prevent the growth of contract farming arrangements and has
continued to constrain the level of seed cotton production in Tanzania.
Figure 3.8: Cotton production in Tanzania
Source: FAOStat
The Tanzania Cotton Board, which is the institution responsible for regulating the quality of
cotton production in Tanzania, sets an indicative seed cotton price each year that is
announced at the beginning of June each year. The actual market price that is received by
smallholders depends on multiple factors such as the quality and quantity of the cotton that
smallholders end up producing and the level of market demand for the good in the Tanzanian
market.
According to the government’s Cotton Advisory Committee 28 ginning companies obtained a
licence to trade in cotton lint production by mid-way through 2015/16. Overall, there is
estimated to be capacity to gin 400,000 bales of cotton (around 72,400 MT) per month in

38
Tanzania, suggesting that there is currently excess ginning capacity in the country – which
subsequently can lead to significant competition amongst the ginners to acquire sufficient
supplies of seed cotton and exacerbates the issue of side-selling, which has undermined
contract farming arrangements in the country.
Table 3.2 below sets out some statistics on cotton lint production in Tanzania. It shows that
cotton lint production has been falling in recent years, due to low production of cotton seed
and the recent decline in prices for lint exports. Around 80% of cotton lint production is
exported, with countries such as Bangladesh, India and China being the main destinations.
Table 3.2: Cotton statistics
Year Area under
production (Ha)
Ave USD$/ Kg farm-gate-
price for seed cotton
Ave local lint export
price USC/ Lb
Lint production
(MT)
2009/10 348,464 0.49 0.53 89,496
2010/11 469,445 0.40 0.77 54,809
2011/12 450,000 0.65 1.00 75,731
2012/13 450,000 0.41 0.72 119,756
2013/14 350,000 0.43 0.83 82,394
2014/15 350,000 0.46 0.84 67,812
2015/16 n/a 0.4 0.64 Estimated –
54,300
Source: Tanzanian International Cotton Advisory Committee
3.7.1. Overview of cotton value chain
Research and development
Inputs and farmer services
Production Post-harvest
Key constraints
Lack of funds to support sufficient research
Disputes between farmers and ginners and bad history of enforcing contracts /side-selling
Poor technical assistance from ginneries
Declining use of seasonal inputs
Pests; disease
Loss of soil fertility
Weather variability
Declining quality of seed production and lint
Inadequate storage facilities
Volatility in global cotton lint prices, and exchange rate
Outdated technologies
Most cotton exported as lint, limited processing of textiles
High transport costs
Public sector
Illonga and Ukiriguru Agricultural research station
TCB, Cotton Development Trust Fund (CDTF)
TCB TCB
Private sector
Quton Seed Company
Smallholder farmers
Over 40 ginning companies: Gaki investment; Olam; Kahama cotton; Mwanza
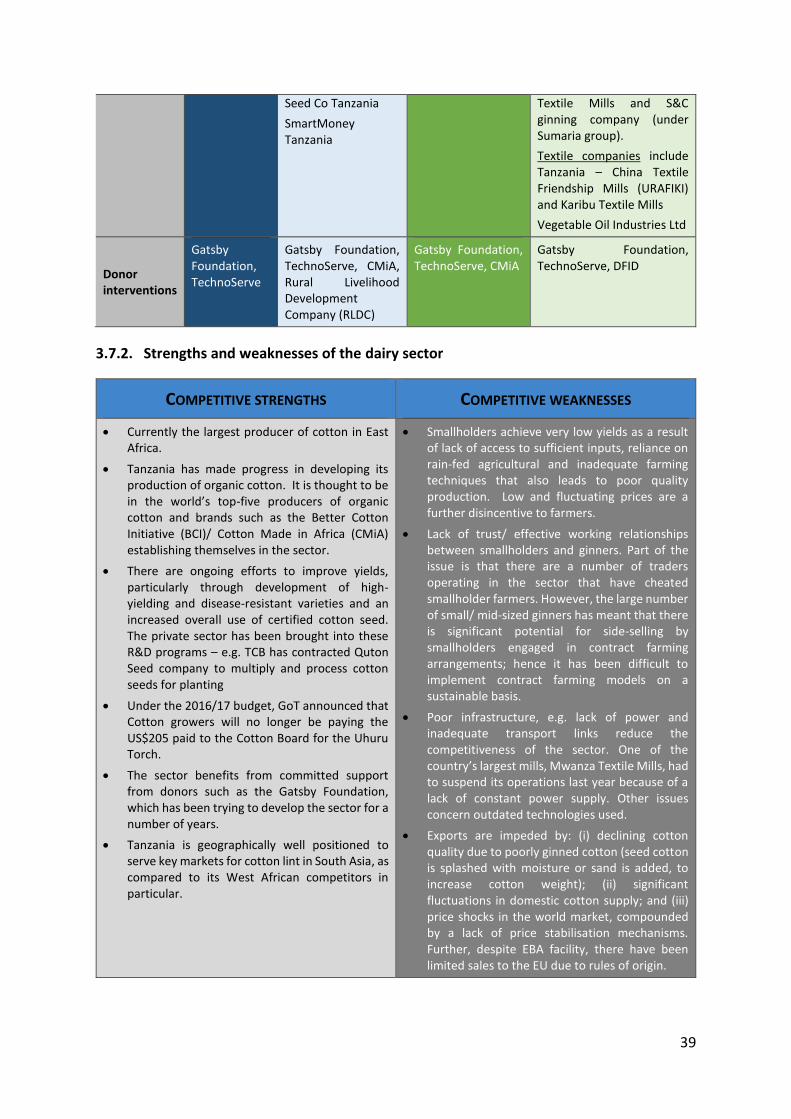
39
Seed Co Tanzania
SmartMoney Tanzania
Textile Mills and S&C ginning company (under Sumaria group).
Textile companies include Tanzania – China Textile Friendship Mills (URAFIKI) and Karibu Textile Mills
Vegetable Oil Industries Ltd
Donor interventions
Gatsby Foundation, TechnoServe
Gatsby Foundation, TechnoServe, CMiA, Rural Livelihood Development Company (RLDC)
Gatsby Foundation, TechnoServe, CMiA
Gatsby Foundation, TechnoServe, DFID
3.7.2. Strengths and weaknesses of the dairy sector
COMPETITIVE STRENGTHS COMPETITIVE WEAKNESSES
Currently the largest producer of cotton in East Africa.
Tanzania has made progress in developing its production of organic cotton. It is thought to be in the world’s top-five producers of organic cotton and brands such as the Better Cotton Initiative (BCI)/ Cotton Made in Africa (CMiA) establishing themselves in the sector.
There are ongoing efforts to improve yields, particularly through development of high-yielding and disease-resistant varieties and an increased overall use of certified cotton seed. The private sector has been brought into these R&D programs – e.g. TCB has contracted Quton Seed company to multiply and process cotton seeds for planting
Under the 2016/17 budget, GoT announced that Cotton growers will no longer be paying the US$205 paid to the Cotton Board for the Uhuru Torch.
The sector benefits from committed support from donors such as the Gatsby Foundation, which has been trying to develop the sector for a number of years.
Tanzania is geographically well positioned to serve key markets for cotton lint in South Asia, as compared to its West African competitors in particular.
Smallholders achieve very low yields as a result of lack of access to sufficient inputs, reliance on rain-fed agricultural and inadequate farming techniques that also leads to poor quality production. Low and fluctuating prices are a further disincentive to farmers.
Lack of trust/ effective working relationships between smallholders and ginners. Part of the issue is that there are a number of traders operating in the sector that have cheated smallholder farmers. However, the large number of small/ mid-sized ginners has meant that there is significant potential for side-selling by smallholders engaged in contract farming arrangements; hence it has been difficult to implement contract farming models on a sustainable basis.
Poor infrastructure, e.g. lack of power and inadequate transport links reduce the competitiveness of the sector. One of the country’s largest mills, Mwanza Textile Mills, had to suspend its operations last year because of a lack of constant power supply. Other issues concern outdated technologies used.
Exports are impeded by: (i) declining cotton quality due to poorly ginned cotton (seed cotton is splashed with moisture or sand is added, to increase cotton weight); (ii) significant fluctuations in domestic cotton supply; and (iii) price shocks in the world market, compounded by a lack of price stabilisation mechanisms. Further, despite EBA facility, there have been limited sales to the EU due to rules of origin.

40
Textile production sector has yet to really be established due to a number of constraints, in particular competition from cheap imports.
3.7.3. Scope for GAFSP PrSW/ IFC investment in cotton
The government has a stated ambition to support the development of the cotton sector in
Tanzania. There is a target to increase the production of cotton seed to 1.5m MT mainly by
increasing yields by 2020 (however, a similar target had been set for 2010). The TCB recently
finished implementing the 2009 – 2015 Cotton Sector Development Strategy, it is not yet clear
what impact the strategy had or what policy framework will be in place going forwards.
It is clear that if efforts to develop the sector are to be achieved, more needs to be done to
improve smallholders’ access to improved inputs, in particular seeds and fertiliser as well as
their access to training; in addition to improving returns through facilitating price stability.
Some of the programs developed to address the issue – e.g. by the Gatsby Foundation –
initially failed due to the inability/ unwillingness of government to regulate effectively the
ginners. There are reported to be ongoing efforts to re-establish the contract farming model
alongside other efforts to develop the sector by providing capacity building to farmers/
farmer groups directly.
Given the highly competitive and diffuse structure of the ginning sector in Tanzania it would
seem that there is very limited scope for GAFSP PrSW/ IFC investment in the cotton processing
sector – reports suggest that investors have been put off the sector due to factors such as the
unreliable power supply and the disputes between ginners and smallholders, which have
negatively affected sector competitiveness. Unless there is potential to support the provision
of inputs on credit alongside an established partner such as Olam or together with the Gatsby
Foundation it is unclear that there will be much scope for investment in the sector.
3.8. Dairy
Consumption of milk in Tanzania is measured to be around 43L per person each year, which
is significantly below the 200L recommended by the World Health Organisation, but is a
similar level to other countries in the region (though notably consumption in Kenya is more
than double the level in Tanzania). Most studies suggest that demand for milk is growing
significantly driven by population growth, urbanisation and the recent economic growth
experienced in Tanzania.
Milk consumption is quite common in Tanzania, though there is a general preference for local
raw milk over processed milk. Consumption of processed dairy products such as cheese,
yoghurt etc. is quite marginal. Most estimates suggest that imports of dairy products, mainly
in the form of milk powder, butter and cheese are roughly the same size as Tanzania’s
processed dairy sector. The available data suggests that imports of dairy products have grown
at over 10% per annum to over US$25m in 2014 (though this is driven partly by a considerable
increase in the last year of over US$10m).

41
Figure 3.9: Dairy imports to Tanzania
Source: UNComtrade
Tanzania is thought to have one of the largest cattle populations in Sub Saharan Africa. The
most recent data put the number at almost 22m (Tanzania Investment Centre (2013).
Tanzania Investment Guide 2014-15). Over 95% of the cattle population are estimated to be
the indigenous breeds (the shorthorn East African zebu), which is low milk yielding compared
to crossbred and exotic breeds (mainly Friesian and Ayrshires). The overall milk production
yield is estimated to be around 2L per cow per day, which is significantly lower than that
achieved in Kenya (around 5L per cow per day).
It is estimated that over a third of all rural households own cattle (over 2m households), of
these around 70% keep between 1 and 10 cattle. The majority of cattle are kept in the
following regions: Shinyanga, Mwanza, Arusha, Mara, Manyara, Singida and Dodoma, which
are mainly lowland and humid regions. The improved dairy breeds are concentrated in the
Kilimanjaro, Arusha and Mbeya regions – the cooler highland regions.
Milk production has been growing at over 7% per annum over the last 14 years driven by
increases in the cattle population. By 2013, close to 2m MT of milk were produced. Around
80% of production is consumed at the farm level by subsistence farmers; between 15 and
20% is sold through informal channels as and when smallholders have excess milk that they
want to sell; the remainder – less than 5% of total production – is sold through formal
channels.

42
Figure 3.10: Milk production in Tanzania
S
Source: FAOStat
The processing sector is small and focused mainly on the pasteurisation and production of
dairy products, most of the companies have small and medium sized plants with the capacity
to process between 500 to 30,000L per day; the overall capacity in Tanzania is approx.
400,000L. Examples of the largest companies are Tanga Fresh (which has received investment
from CDC in the past), which is the largest dairy company in the country (50,000L per day
capacity and annual turnover in region of US$4m); Asas; Musoma dairies; Mara milk and Tan
dairies. The processors typically source over half their milk from smallholder farmers, with
the remainder coming from commercial farms.
3.8.1. Overview of dairy value chain
Research and development
Inputs and farmer services
Production Post-harvest
Key constraints
Lack of funding; disconnection between research and extension systems;
limited availability/ provision of the appropriate genetics
Limited provision of extension services; and poor delivery of appropriate genetics, veterinary services and animal health inputs
Poor quality of fodder and of genetic stock
High costs of medicine and vaccines for treatment and prevention of tick-borne disease
Technical skills
Access to credit to purchase inputs
Distance from markets
Livestock diseases
Smallholders typically make direct sales in small volumes so a struggle to improve coordination/ get economies of scale etc.
Cost and availability of power
Absence of cold-chain facilities
Quality and availability of milk
Disposable income of consumers
Underutilisation of processing capacity
Poor and disorganised milk marketing system
Public sector/ Associations
Tanzania Livestock Research Institute;
Tanzania Dairy Board; Livestock Training Agency’;
Tanzania Dairy Board; Tanzania
Tanzania Milk Processors Association;

43
Tanzania Veterinary Laboratory Agency
Regional and District Livestock Development Office
Milk Producers Association
Tanzania Dairy Board
Private sector
Mgolole Agro-Processing Co. Ltd
Predominantly smallholder farmers, though small number of commercial farms
Tanga Fresh; Asas; Musoma Dairies; Mara milk; Tan dairies; Bakhresa Food Products (Azam ice cream brand); Mgolole Agro-Processing Co. Ltd
Donor interventions
ILRI, CIAT Land O’Lakes; IFAD through the MilkIT project
Land O’Lakes, SNV MoreMilkiT project funded by Iris; Farm Friends (independent Dutch NGO); BMGF East Africa Dairy Development II Programme
3.8.2. Strengths and weaknesses of the dairy sector
COMPETITIVE STRENGTHS COMPETITIVE WEAKNESSES
Conducive climate for livestock operations; high rainfalls provide mostly flat grasslands, with sufficient water for keeping livestock at a stocking rate of 1 animal/ 3 Ha (or better).
One of the largest cattle populations in SSA.
Dairy, albeit local raw milk, is a popular drink for local consumers; findings also indicate popularity of fermented milk and yogurt, given taste preferences.
Land availability for grazing not highlighted as a constraint - though quality of feed/ grasses is not high.
Opportunity to improve productivity through introducing improved breeds, which at present represent less than 1% of the national herd.
Interest shown by foreign companies such as Brookside Dairies and Nestle Group. The sector has also benefited from the support of development partners, such as BMGF which is targeting improvements in productivity and increased market access for dairy products through the East Africa Dairy Development (EADD) II Programme (2014-2018).
The milk producers association Tanzania Milk Producers Association (TAMPA), has successfully advocated for removal of VAT on locally processed dairy products to increase
Limited access to key inputs including lack of quality breeding heifers and breeding bulls; and good quality feed for cattle, especially during dry season.
Yields have been stagnating due to factors such as limited skills/ understanding among farmers on how to raise cattle effectively; poor nutrition and disease; weak extension services.
The inadequate transport infrastructure is a key issue for processors; collecting the milk from farmers requires significant travel which is costly and creates uncertainty for the supply chain.
Poor network for milk collection. The lack of cold chain facilities and limited supply of power is a significant constraint, as the power outages result in high use of expensive generators and causes a lot of milk to become spoilt.
Under-used capacity of chilling/ processing plants (estimated at ~25% of processing capacity). In general, the quantity of processed local milk is estimated to be equivalent to the quantity of milk imports.
Disorganised milk marketing system, with relative lack of demand for processed milk. Commonly cited constraints to dairy consumption include high prices (of processed milk), lack of availability in dry season and distance between homes and retail locations.

44
competitiveness of domestic production relative to cheap imports.
3.8.3. Scope for GAFSP PrSW/ IFC investment in dairy
The largest milk processing company has a turnover of around US$4m so, unless an
international firm is considering entry into the market, there seems to be limited scope for
the sector to yield a pipeline of opportunities of the size under consideration by GAFSP PrSW/
IFC.
Although not of large scale, there have been several recent investments in the sector through
investors such as AECF-TZAW, the New Alliance Framework and a collaboration with TDCU
and Dutch investors. For instance, AECF-TZAW has provided $450,000 in funding to Mgolole
Agro-Processing Co. Ltd to develop an integrated dairy project to produce and sell quality
heifers to farmers in Morogoro region. Further detail on these investments is provided in
Annex E.
If there is a desire to get engaged in the sector, it may be necessary to explore opportunities
around the provision of credit to groups of farmers in partnership with the processors/ an
existing financial intermediary.
3.9. Horticulture
The Tanzania Horticulture Association (TAHA) defines horticulture as being any agricultural
activity that: involves production, processing or packaging of flowers, fruits, vegetable seeds,
spices and roots and tubers. The sector therefore includes quite a wide range of different
goods that are individually quite small, but are combining to make horticulture an important
part of the agricultural sector in Tanzania.
The sector is reported widely as being the fastest growing agribusiness sector in Tanzania,
achieving growth rates of 9 – 12% per annum over the past five years (2008-2013). Overall,
the sector is estimated to provide employment for 500,000 individuals, with women making
up around 65% of the workforce. Most of the farmers in the sector, around 70%, control
landholdings of less than 2 Ha.
Horticultural products are produced mainly in three parts of the country:
Southern highlands – Morogoro, Iringa, Mbeya and Ruvuma.
Northern corridor – Arusha, Kilimanjaro, Tanga and Manyara.
Coastal zone: Coastal regions and Zanzibar.
The horticultural sector has grown to become the second largest source of export earnings
for Tanzania, according to Tanzania Bureau of Statistics data. As shown in the figure below,
the Tanzania Revenue Authority estimates that between 2010 and 2014 export earnings from
horticulture have more than doubled from US$212m to US$447m.

45
Figure 3.11: Tanzania horticulture export data 2010 - 2014
Source: Tanzania Revenue Authority
Figure 3.12 shows that the growth in horticultural export earnings has occurred primarily due
to the growth of the vegetable sub-sector. Vegetable exports have increased by over
US$100m between 2010 and 2014.
Figure 3.12: Breakdown of Tanzania horticulture export data 2010 – 2014 (US$)
Source: Tanzania Revenue Authority
Interestingly, according to a study by Mashindano et al (2013), only around 5% of the
horticultural products produced in Tanzania are destined for export markets. The remainder
are produced for own consumption, sold in the domestic market or go to waste. This suggests

46
that there may be considerable scope to continue to grow the sectors export earning
potential.
Tanzania has less than 30 large scale growers/ exporting companies operating in the sector.
These agribusinesses are based mainly in Arusha and Manyara. These companies are an
important source of employment in their respective regions. Many of the agribusinesses are
owned by international players. For instance, Hortanzia Farms has an overall turnover of over
US$1bn and employs 450 people; its main product is cut roses which it exports to the
Netherlands, Norway and the UK, with lower quality roses sold on the domestic market.
3.9.1. Overview of horticulture value chain
Research and development
Inputs and farmer services
Production Post-harvest
Key constraints
Limited provision of extension services
Lack of access to finance
Inability to adhere to market standards
Small size of many of the operators
Supporting infrastructure for the sector
Weak logistics impeding access to markets.
Public sector/ Associations
TAHA TAHA TAHA TAHA
Private sector
Yara, Export Trading Group
Smallholder farmers
Commercial private flower growers
Ngongoseke Farms
Serengeti Fresh Ltd
Beth Equi-solutions Company Limited
~30 companies including: Bakhresa Food Products, Hortanzia farms, Multi-farms, Africado, Afrisem, Mara Farming, Serengeti Fresh Ltd
Donor interventions
IFAD USAID, IFAD, TAPP TechnoServe, USAID, TAPP
USAID, AfDB, DANIDA, SIDA, Dutch Embassy
3.9.2. Strengths and weaknesses of the dairy sector
COMPETITIVE STRENGTHS COMPETITIVE WEAKNESSES
One of the fastest growing sectors in Tanzania, with strong export growth achieved in recent years
Large availability of land, with less than 5% currently in use of the estimated 500,000 Ha of land deemed suitable for growing horticultural crops in Tanzania.
Soils and diverse climatic conditions (cool climate, altitude, rainfall) give Tanzania a good
Overall, sector is still quite small relative to say Kenya. It is not big enough to support the required investment in infrastructure, e.g. in cold room facilities, to facilitate much greater expansion.
Weak subsector associations limit the level of coordination amongst organisations in the sector.

47
basis to produce a wide range of horticultural crops. A number of investors are already involved in production and marketing of crops, mainly for exports.
Commitment by government, at least in the development of new policy frameworks, to support the sector such as Tanzania Horticultural Development Strategy (2012-21), in addition to sector focus as part of SAGCOT etc. There are also a number of donor-supported projects including by USAID, the Dutch Government, WB, EU, BEST-AC etc.
Tanzania benefits from good links to ports and airports in both Tanzania and Kenya, which provide guarantee for sea freighting and air-lifting of horticultural products to international markets.
Poor production and harvesting techniques lead to low productivity and low quality of products. Post-harvest losses of over 40% estimated in the domestic market (and 10% in export sectors). Key issues concern transport and unreliable electricity supply.
Inadequate market support infrastructure and inconsistency in supply of quality products has meant that Tanzania is still importing fruits, vegetables and spices.
Limited technical knowhow of practices required to access international markets, including limited safety assurances.
Imposition of taxes and charges by government affects competitiveness.
Inefficiency at ports/ airports reduces competitiveness in international markets.
Less than 10% of fruits and vegetables produced are processed.
3.9.3. Scope for GAFSP PrSW/ IFC investment in horticulture
The combination of the size of the sector, recent growth in export earnings and presence of
a number of international commercial agribusinesses suggest that there is a relatively strong
potential for the horticulture sector to yield some investment opportunities for GAFSP PrSW/
IFC but potential is that individual investment opportunities might be small. Many investors
are already involved in production and marketing of horticultural crops, primarily for export
markets.
Moreover, there appears to be strong policy and donor support for development of the
sector; the horticulture sector has been earmarked as one of the potential fast-growth areas
in the TAFSIP and SAGCOT. The GoT objectives include establishing modern vegetables, fruits,
flowers, spices and horticultural seed business operations for domestic, regional and
international markets.
Meanwhile, international players such as Unilever and Syngenta are also involved in the
horticulture sector Alongside the recent investment in high tech cultivation equipment by the
AfDB-managed AFT Fund, there have been several investments made recently by AECF-TZAW
ranging between US$100,000-$1,000,000, with the objectives of supporting smallholder
production and expansion of fruit processing operations. Further detail is provided in Annex
F.
AgDevCo has also made a number of investments in Tanzania’s horticultural sector. It recently
invested US$400,000 in EA Fruits and Farm Ltd to enable them to purchase a refrigerated
delivery vehicle and a central pack house to support the expansion of their business. AgDevCo
also invested US$1.5m in Rungwe Avocado Company (RAC) to fund the installation of 100 Ha
of micro-jet irrigation systems on their commercial farm, update their cold storage supply
chain infrastructure and support their ongoing smallholder farmer outgrower scheme.
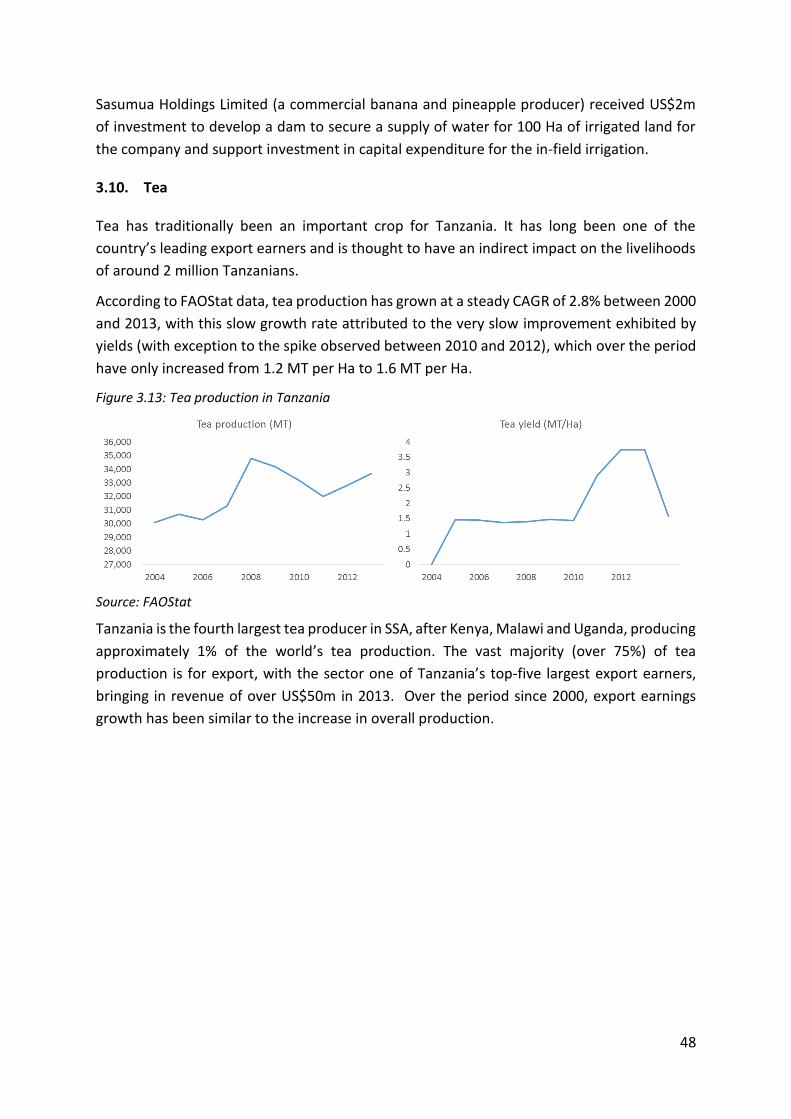
48
Sasumua Holdings Limited (a commercial banana and pineapple producer) received US$2m
of investment to develop a dam to secure a supply of water for 100 Ha of irrigated land for
the company and support investment in capital expenditure for the in-field irrigation.
3.10. Tea
Tea has traditionally been an important crop for Tanzania. It has long been one of the
country’s leading export earners and is thought to have an indirect impact on the livelihoods
of around 2 million Tanzanians.
According to FAOStat data, tea production has grown at a steady CAGR of 2.8% between 2000
and 2013, with this slow growth rate attributed to the very slow improvement exhibited by
yields (with exception to the spike observed between 2010 and 2012), which over the period
have only increased from 1.2 MT per Ha to 1.6 MT per Ha.
Figure 3.13: Tea production in Tanzania
Source: FAOStat
Tanzania is the fourth largest tea producer in SSA, after Kenya, Malawi and Uganda, producing
approximately 1% of the world’s tea production. The vast majority (over 75%) of tea
production is for export, with the sector one of Tanzania’s top-five largest export earners,
bringing in revenue of over US$50m in 2013. Over the period since 2000, export earnings
growth has been similar to the increase in overall production.

49
Figure 3.14: Export earnings from tea production in Tanzania
Source: FAOStat
There are three main tea growing areas in Tanzania: the Highland zones of Mufindi, Njome
and Rungwe district; the North East Zones of Lusotho, Korogwe; and Muheza districts and the
Northwest Zone areas of Bukoba and Muleba districts. Overall, approx. 22,000 Ha of land is
used to produce tea, which is split roughly 50:50 between land under production by
smallholders and land used by the commercial tea estates.
Around 50,000 smallholders are involved in the production of tea, relying on rain-fed
production and making limited use of inputs. The smallholder yield is estimated at less than
1 MT/ Ha, whilst the estates have been achieving close to 2 MT/ Ha. Unilever and Mufindi,
which are both growing under irrigation, are reportedly achieving 2.8 – 3.5 MT/ HA.
The main tea estates include Unilever Tea Tanzania (which is reported to account for around
40% of tea output), Tanzania Tea Packers (which has received significant CDC investment in
the past) and Mufindi Tea Company (which exported around US$7m in 2010). The processors,
such as Unilever, have their own commercial tea estates and also purchase/ process the tea
produced by the smallholders. In 2013 Unilever signed an MoU with the government as part
of the SAGCOT to create an additional 5,000 jobs linked to its Mufindi tea estates and support
the development of 6,000 Ha of smallholder tea farms.
Primary processing of tea is carried out mainly by agribusinesses that are dispersed
throughout the growing areas. Around 20 of these are owned by the different commercial
producers and 4 are owned jointly by the smallholders and the farmers. On average they are
estimated to produce 33,000 MT of processed tea annually. 75% of the tea produced is
exported, the remainder of the tea is packaged and sold in the domestic market. The
packaging and marketing of tea is carried out by five licensed factories such as Afri Tea and
Coffee Ltd., Chai Bora Ltd., and International Food Packers.

50
3.10.1. Overview of tea value chain
Research and development
Inputs and farmer services
Production Post-harvest
Key constraints
Inadequate funding
Inadequate funding for/ lack of access to extension workers and services
Lack of access to finance to purchase inputs
Lack of market given smallholders’ limited incomes
Rain-fed production
Low farm-gate prices
Poor quality of production; low green-leaf throughput.
Inadequate supportive infrastructure (roads, power)
Taxes
Distance to processors/ markets
Licensing procedures
Tea imports from Kenya/ the region
Public sector/ Associations
Tea Research Institute of Tanzania
Tea Board of Tanzania (TBT)
TBT
Tanzania Smallholder Tea Development Agency
Tea Association of Tanzania
TBT
Private sector
TBC Fertiliser/ seed companies
SmartMoney Tanzania
~30,000 smallholders
Commercial tea estates: East Usambara Tea Company (part of Mac Group), Unilever Tea Tanzania, Mufindi Tea Company
~20 primary processors (some not functional)
~ 5 licensed tea packers: Afri Tea and Coffee Ltd, Chai Bora Ltd (Mafinga–Iringa), Promasidor Tanzania (PTY) Ltd (DSM), International Food Packers Ltd (Tanga), Zanzibar Tea Packers Ltd (Zanzibar).
Main exporter: Tanzania Tea Packers (TATEPA)
Donor interventions
Wood Family Trust, Gatsby Foundation
Wood Family Trust, Gatsby Foundation
Wood Family Trust, Gatsby Foundation
Wood Family Trust, Gatsby Foundation
3.10.2. Strengths and weaknesses of the tea sector
COMPETITIVE STRENGTHS COMPETITIVE WEAKNESSES
Presence of large international players with a long commitment to the sector.
Government has been committed to developing the sector and has tried to introduce subsidies to
The sector is caught in a downward spiral at the moment. Reports suggest that production levels are not high enough to enable existing processing factories to operate at an efficient scale. As a result farmers are offered lower prices

51
increase access of smallholders to improved clonal planting materials.
The sector has benefitted from a successful PPP between tea producing estates (in Mufindi, Mbeya, Tanga and Kagera regions), processing companies and government to support Tea Research Institute of Tanzania (TRIT). Observed outcomes have included increase in area planted by smallholders; dissemination of new recommended management practices etc.
Increased production of value-added teas, with the launch of Ikanga a new black tea factory, which will have the capacity to produce 3,500 MT per annum . having a process capacity of 1.5m kg. annually.
than in neighbouring countries (Tanzanian farmers are said to receive just 33% of the sale price compared to 51% in Kenya), which limits their incentive to invest and therefore limits the growth of the sector.
Smallholders lack access to finance to purchase necessary inputs, as a result their yields are very low, estimated at 40% less than average yields in Kenya.
Reliance on rain-fed production.
Quality of tea produced in Tanzania is low and has a poor reputation in international markets – Tanzanian tea gets less than half the price per kg than tea produced in regional competitors such as Kenya and Rwanda.
Competition from cheaper priced imports for blended and packaged tea, due to the high unit production cost of packaged tea in Tanzania compared to other countries in EAC.
Tea packers have generally been located in urban areas, have yet to exploit in full local production of tea in part because they are not located near to smallholder producers – they generally rely on supply from the large tea estates.
Illegal imports (to avoid taxes) is also a key issue, with reports suggesting that this supplies around a third of domestic demand
3.10.3. Scope for GAFSP PrSW/ IFC investment in tea
Based on the desk-based review it could be interesting to explore the scope for GAFSP PrSW/
IFC to support provision of finance to smallholders to enable them to purchase increased
inputs, as well as exploring opportunities in the packing stage of the value chain. Beyond that,
there are some established international players in the sector (such as Unilever), which could
be potential partners for investment, although the desk-based research suggests that there
is limited need for investment in increased processing capacity until supply constraints are
addressed. AECF-TZAW has made a couple of small investments in this regard recently,
including provision of US$450,000 to Kagera Tea Company Limited in 2015 to support scaling-
up of technology used by farmers and improvements in the transport system, with a view to
increasing quality and production of green leaf tea sold to the company for processing.
Furthermore Tanzania Tea Packers has recently received over approx. US$3.5m to finance
investment in a new hydropower plant to enable it to boost production.
Key donor-supported interventions include the Chai Project launched by the Gatsby
Foundation and Wood Foundation Africa, with a view to transforming the sector through
providing matching grants with private factories (to address specific local constraints);
strengthening a farmers’ association; and working with the Tea Board to introduce a new

52
market-based pricing mechanism for all 30,000 smallholders, and with the Tanzania
Smallholder Tea Development Agency to pilot a land titling project.
3.11. Sisal
Sisal is grown to produce fibre that can be used in a range of products such as rope, cloth,
paper, and carpets. The plant typically has a 7 – 10 year lifespan and takes a number of years
after planting before it is ready for harvesting. Only 2% of the sisal plant is made up of the
fibre. Recent studies have shown that the waste can be used to produce biogas. UNIDO and
the Common Fund for Commodities (CFC) helped to support the establishment of a
demonstration biogas from sisal leaf waste plant. Other uses of sisal waste include the
production of bio-fertiliser and for animal feed.
The statistics that are available on the sector are produced by the Tanzania Sisal Board (TSB),
which is responsible for a range of functions across the sector, such as issuing the licences
that all producers, traders and exporters in the sector require to operate, developing and
enforcing regulations relating to quality of production, marketing and export; collecting data
on the sector; and providing advice to government on policy matters.
According to data from the Tanzania Sisal Board (TSB), sisal fibre production has increased by
around 4% per annum between 2000 and 2011. Total production has reportedly grown to
around 40,000 MT by 2015. Tanzania is in the top-five global producers of the product; Brazil
has the largest share of global production (it produces in excess of 150,000 MT). The TSB has
a target of trying to overtake Brazil as the world’s largest producer within the next ten years.
Approx. 45% of the fibre produced is exported, key destinations include the UK, China and
Saudi Arabia. The remainder of sisal produced is either sold on domestic markets or goes to
waste.
In total around 60,000 Ha of land is used to produce sisal each year. As of 2012 around a
quarter of sisal produced came from smallholder farmers. Smallholder production of sisal
was established by Katani Ltd in the Tanga region of Tanzania, through a contract farming
scheme that includes around 2,000 farmers. Most other smallholder production was
developed through NGO/ government based programmes. Commercial production takes
place on large plantations of between 3,000 to 7,500 Ha.

53
Figure 3.15: Sisal production in Tanzania
Source: FAOStat
There are four sisal spinning mills operating in Tanzania. Reportedly only 35% of installed
capacity is being utilised. The mills were established back in the 1960s/ 70s, but some of them
have been modernised in the last 10 years. Katani is the largest firm and accounts for approx.
30% of the share of production. Ruhinda and Co ltd and Mohamed Enterprises are other
prominent firms operating in the sector. The process of extracting the fibre from the sisal
leaves requires considerable use of power and water; problems accessing reliable power is a
significant constraint for the producers.
3.11.1. Overview of sisal value chain
Research and development
Inputs and farmer services
Production Post-harvest
Key constraints
Lack of access to inputs
Inadequate access to long-term finance
Limited short-term profitability
Low quality of production
Limited access to power
Inadequate modernisation of infrastructure and utilities
Public sector/ Associations
Tanzania Sisal Board (TSB)
Agricultural Research Institute (ARI) Mlingano; Research universities
TSB
ARI Mlingano
TSB
Sisal association of Tanzania
TSB
Private sector
Katani Ltd. Smallholder farmers
Private estates such as METL
Katani Ltd; SFI Tanzania
Four sisal spinning mills
METL
Katani Ltd.; SFI Tanzania

54
Donor interventions
FAO support for development of new varieties; Oxfam Scale-Up project
Oxfam Scale-Up project
UNIDO; Oxfam Scale-Up project
3.11.2. Strengths and weaknesses of the sisal sector
COMPETITIVE STRENGTHS COMPETITIVE WEAKNESSES
One of the world’s largest producers of the crop, with established operators. In addition, ARI Mlingano is reportedly the only research station devoted to sisal in the world.
Sisal is thought to be a drought resistant crop that is well suited to production in Tanzania; there is also adequate land available to increase production.
Donor-supported interventions have reportedly improved efficiency in fibre extraction and sisal growing, through development of high density planting, development of new processing methods, using hammer mills and mobile decorticators which lower losses in fibre and utilise less water and energy.
Recent projects have supported uses from the biomass, produced with 96-98% of the sisal plant which otherwise goes to waste. Under the Ten-Year Sisal Crop Development Plan (2011-2020), the Mlingano Agriculture Research Institute planned to initiate a sisal characterization program for developing a protocol for the production of ethanol and citric acid from liquid effluents.
Lack of profitability of fibre production in the short term, with smallholder involvement impeded by limited access to markets and finance, extension services, access to information (market, technical and R&D) etc.
The limited access to power increases significantly costs of production as well.
Quality of production is currently below international standards, with an observed need for mills and exporters to receive consistent and reliable supplies complying with formal contractual arrangements (such agreements are still not widely used.)
Spare capacity in the sisal processing units
Tariff structure on semi-finished and final products
3.11.3. Scope for GAFSP PrSW/ IFC investment in sisal
The total export earnings for the sector are in the region of US$10-15m, and a rough estimate
suggests that the leading firms in the sector most likely turnover a maximum of US$5m. This
suggests that the sector is potentially too small to support investments of the size targeted
by GAFSP PrSW/ IFC.
That said a biogas plant developed by Katani Ltd. with support from the likes of Unido in 2007
cost approximately US$4.5m. Going forward, there could be scope for some of the existing
producers to undertake additional investments in this area, to increase utilisation of sisal and
increase value addition of the sector, whilst addressing the key constraints associated with
limited supply of power in Tanzania.
As such, there may be some value in consulting with some of the larger firms operating in the
sector, such as Mohamed Enterprises Tanzania and Sagera Estates. But in practice the sector
is unlikely to have the capacity to yield a robust pipeline of investment opportunities.

55
3.12. Rice
According to data from FAOStat, rice production in Tanzania has more than doubled over the
past 14 years with production growing at a CAGR of 9% p.a. This growth has been driven by
both an increase in rice yields, which have grown from 1.9 MT/ Ha to 2.8 MT/ Ha and an
increase in the amount of land under rice production.
Figure 3.16: Rice production in Tanzania
Source: FAOStat
Rice is an important crop for both subsistence and commercial farming in Tanzania, and
consumption has been increasing in recent years. Rice is more expensive than other cereal
crops including maize (Tanzania’s chief staple crop) but similar to a number of other countries
in Sub-Saharan Africa (SSA), the combination of increasing urbanisation and household
income has led to households consuming more rice and substituting away from the cheaper
cereals.
Dar es Salaam market is the largest market for rice in Tanzania and is responsible for
approximately 40% of the country’s rice consumption. According to a BMGF commissioned
study, Tanzanian consumers are willing to pay a 21% premium for Tanzanian rice, over
cheaper imported rice, because of their inherent preference for its flavour, aroma and
freshness. Further, consumers are brand conscious, with Kyela and Mbeya rice regarded as
the best quality rice, followed by Morogoro rice.
In order to meet growing demand, Tanzania imports rice (e.g. Pakistani long-grain non-
basmati white rice IRRI-6, 5% broken and 25% broken varieties). Historically imports
constituted as much as 30% of domestic supply. But since the introduction of the East African
Community’s Common External Tariff (EAC-CET) in 2005, which increased the duty on
imported rice from 25% to 75%, rice imports have fallen to roughly 10% of domestic supply.
However there has been some inconsistency with respect to the government’s policy on rice
imports. In 2013 the government made the decision to import 175,000MT of rice from
Pakistan duty free. The impact of this policy on the local rice market was to depress
significantly local rice prices, causing the domestic agribusinesses and smallholder rice
producers to loose significant revenues.

56
Rice is produced mainly in the Morogoro, Shinyanga, Tabora, Mwanga and Mbeya regions of
Tanzania; with production dependent on smallholder farmers. It is estimated that between
1.2m to 1.8m smallholder farmers are engaged in the production of rice on farm sizes
between 0.5-3 Ha. The majority of smallholder production relies on traditional rain-fed
production (either lowland flood or upland dry), which makes very limited use of technology,
fertiliser, seeds etc. Yields achieved by these farmers are as low as 0.4 MT/ Ha (in rain-fed
upland production) to 2.5 MT/ Ha (rain-fed lowland).
Only 6% of rice is produced by large-scale commercial farms. The commercial farms can
achieve yields in excess of 8 MT/ Ha. Each of the producing regions have their own wholesale
market, all of which use the Dar es Salaam price as their benchmark wholesale market price
(less cost of transport). Examples of commercial processors include Kilombero Plantations Ltd
(KPL) which is the largest commercial producer in the Tanzania; Kapunga Rice Plantation
Limited and Mbarali Rice Farm, both in Mbeya.
3.12.1. Overview of the rice value chain
Research and development
Inputs and farmer services
Production Post-harvest
Key constraints
Lack of funds Lack of funds
Low capacity of existing staff
Limited availability of different varieties of improved seed and fertiliser due to policy constraints
Increasing input costs
Lack of irrigation
Limited availability of labour
traditional planting techniques
Disease and pests
Irregular/ poor quality supply from smallholders
Access to power
Inconsistent government policies
Supportive infrastructure e.g. road network linking farmers to markets, storage
Limited value-addition
Public sector/ Associations
Uyole Agricultural Research Institute, KATRIN
Agricultural Seed Agency
Uyole Agricultural Research Institute
Iringa Veterinary Investigation Centre
Kilimo Markets Co. Ltd
Association of Kilombero High Quality Rice Growers
Tanzania Agricultural Partnership
SAGCOT
Private sector
TBC Export Trading Group, Yara
Smallholder farmers
Small number of commercial producers
Mtenda Kyela, Kapunga, Mbarali, KPL, Bahkresa Group

57
Donor interventions
Consortium of International Agricultural Research Centers (CGIAR), International Rice Research Institute, AGRA, BMGF, Africa Rice Centre
TechnoServe, JICA, AGRA, BRAC, BMGF, Africa Rice Centre
USAID, DFID, TechnoServe, JICA, AGRA, BMGF, Rural Urban Development Initiative (RUDI), TARIPA
DFID, BMGF, TARIPA
3.12.2. Strengths and weaknesses of the rice sector
COMPETITIVE STRENGTHS COMPETITIVE WEAKNESSES
Continued rapid population growth/ urbanisation and rise in incomes expected to drive increased demand for rice in Tanzania over the coming years creating opportunities for domestic producers
Local varieties are preferred and growing middle class consumers are reportedly willing to pay a premium; as such, local production supplies ~92% of domestic consumption, despite a 21% price premium over imported rice.
Only 720,000 Ha of a total potential area estimated at 2-3m Ha, are currently under production, indicating significant potential to expand cultivation.
Although there have been persisting issues in implementation, government has sought to prioritise rice through the National Rice Development Strategy. SAGCOT and BRN Initiative under which it has earmarked a number of sites for large-scale irrigation rice scheme.
Some examples of nucleus out-grower rice models; TIC refers to one case which is already cultivating more than 10,000 Ha achieving out-grower yields of 8T/ Ha.
A wide range of donor supported initiatives are active in the sector, targeted at funding out-grower irrigation systems, training and input supplies.
Potential to expand exports to EAC given the large rice gap estimated in the region.
Reliance on rain-fed production limits the productivity of the majority of rice production in Tanzania. Paddy yields average ~1.5 MT/ Ha, as compared to 2.5 MT/ ha for Africa as a whole and 4.4 MT/ Ha in Asia.
Lack of access to finance limits smallholders’ access to inputs. Only 1% of cropped area is planted with improved seed.
Local production is more costly than imported rice due to labour-intensive production practices and high transport costs. As such, the local industry is seen to be in part dependent on import tariffs.
Production, processing and rice market are all very fragmented. Key constraints at the collection stage include limited capital and use of unauthorised weighting measures; while processing is impeded by low and untimely supply of paddy; poor milling quality; inadequate storage facilities; lack of formal arrangements with traders and unreliable power supply.
Difficulty enforcing contracts for any commercial farmers seeking to employ contract farming techniques.
Distribution of rice also faces high collection costs, low quality of rice, high transport costs, limited grading techniques, lack of rice standards and government levies.
3.12.3. Scope for GAFSP PrSW/ IFC investment in rice
The size and continued growth of the sector should open up the sector for investment
opportunities that could be considered by GAFSP PrSW/ IFC. Government support for
reducing policy barriers in the sector is evident through promotion of investments in the rice
sector under BRN, and strengthening the Tanzania Rice Partnership to represent private

58
sector stakeholders. In particular, GoT has allocated 20,000 Ha of land for investment in large-
scale commercial rice farming, with transactions coordinated by TIC.
In recent years a number of investments have been completed and agribusinesses from
outside of Tanzania have shown interest in the sector. For instance,
AgDevCo has invested over US$11m to fund the construction of a biomass gasifier
plant to facilitate the roll-out of a 3,000 Ha irrigation scheme. AgDevCo is also working
with them to develop further KPL’s outgrower scheme to enable input credit packages
and off-take contracts to be provided to smallholders.
Bhati Bangla Agrotec, owned by the Al Falah Group in Bangladesh, has been trying to
develop a US$5.5m 30,000 Ha project to support increased rice, maize and pulses
production.
Reuters reported that the Indian Bank – Yes Bank has been pursuing the acquisition of
30,000 to 50,000 Ha of land for rice and wheat production in Tanzania, and the
construction of a processing plant near the farm.
AGCO, the US-based global manufacturer for farm equipment has conducted
exploration visits to Tanzania evaluating existing opportunities with SAGCOT and MOA
and other partners like AgDevCo and Agrica/KPL.
Whilst some of the projects have yet to be completed, with the uncertain policy environment
one of the key factors limiting progress, the available desk-based evidence suggests that there
could be a potential pipeline of investment opportunities in the rice sector for consideration
by GAFSP PrSW/ IFC.
59
4. PRIORITY SECTORS AND NEXT STEPS
This section was written during the first (desk-based) phase of our study and may not reflect
the most current or detailed information available.
Section 3 presented an overview of selected agribusiness sectors in Tanzania to identify three
to five sectors to take forward for the second phase of the project. Phase 2 identified the key
stakeholders and specific investment opportunities that could be suitable for support from
the GAFSP PrSW/IFC in the priority sectors.
It is important to emphasize that this does not preclude any GAFSP PrSW/IFC investments in
the sectors not taken forward – we note in particular that some interesting cross-sector
opportunities might present themselves during the country visit.
It is necessary to identify some priority sectors to guide the Phase 2 analysis. It is probable
that through the process of consulting with multiple country stakeholders additional
opportunities in non-priority sectors will be identified.
4.1. Approach to identifying the priority sectors
To identify the short-list we have reviewed each sector against five criteria, summarised in
the Table 4.1. Each sector is scored out of five for each indicator – the maximum score
possible is 50.
Table 4.2 then sets out the data gathered for each of the sectors.

60
Table 4.: Criteria and indicators used to identify priority sectors
Criteria Indicators Scaling approach used Sources/ how measured
Development impact
Estimated number of smallholder farmers in sector
1: < 100,000
2: 100,000 - 1,000,000
3: 1,000,000 - 2,000,000
4: 2,000,000 - 3,000,000
5: > 3,000,000
FAOStat data; USAID Feed the Future reports; Ministry of Agriculture Census; CEPA estimates
Contribution to food security based on contribution to average daily calorie consumption
1: No contribution
2: 0 - 100 calories per day
3: 100 - 200 calories per day
4: 200 – 400 calories per day
5: > 400 calories per day
USDA study http://www.ers.usda.gov/media/1784075/eib135.pdf and others
Economic impact
Average value of production of crop over last five years
1: < $50m 2: $50m - $100m 3: $100m - $500m 4: $500m - $1bn 5: > $1bn
FAOStat value of production data (US$m constant value). Data available up until 2013
Average value of exports/ imports over last five years
1: < $10m
2: $10m - $50m
3: $50m - $100m
4: $100m - $200m
5: > $200m
FAOStat trade data. Data available up until 2013.
Competitiveness
Yield per hectare achieve in Tanzania relative to the average yield of the world’s top five producers
1: 0 – 25% 2: 25 – 50% 3: 50 – 75% 4: 75 – 100%
5: >100%
FAOStat comparative yield data.
Share of global exports over the past five years ($m) - for import crops (dairy, rice,
1: Significant decline 2: Marginal decline 3: Stagnation
Review of FAOStat trade data; FAOStat domestic production and supply data
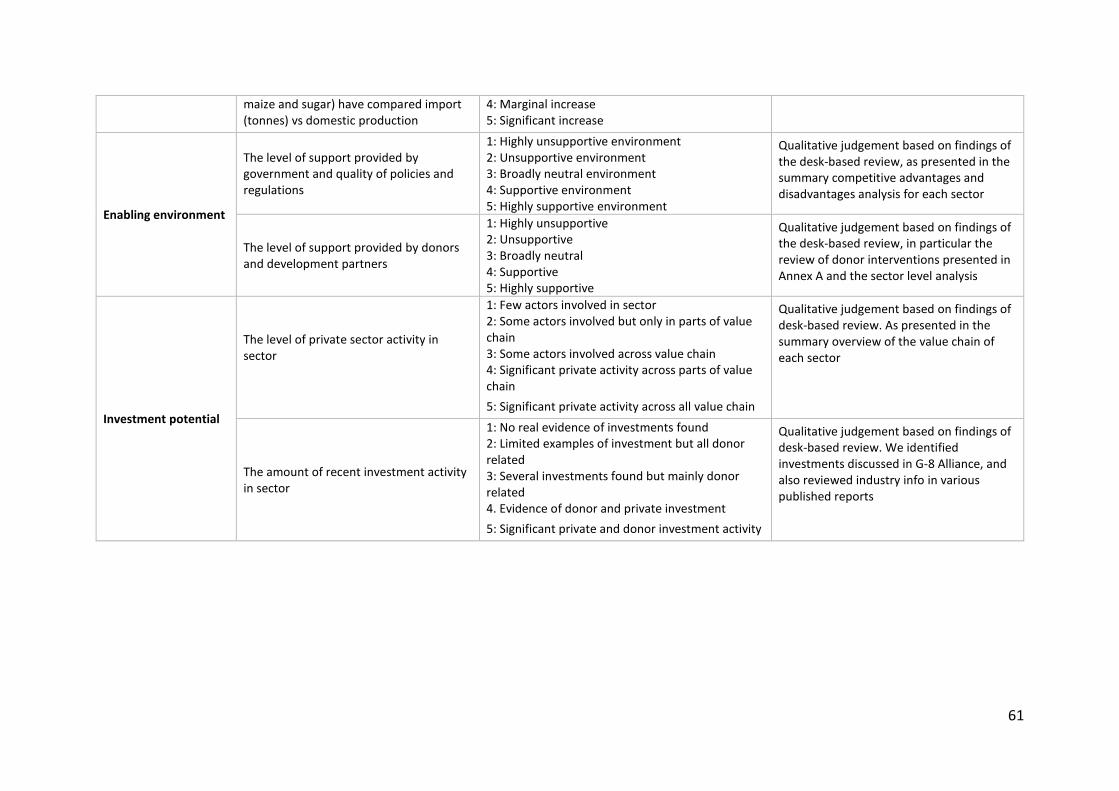
61
maize and sugar) have compared import (tonnes) vs domestic production
4: Marginal increase 5: Significant increase
Enabling environment
The level of support provided by government and quality of policies and regulations
1: Highly unsupportive environment 2: Unsupportive environment 3: Broadly neutral environment 4: Supportive environment 5: Highly supportive environment
Qualitative judgement based on findings of the desk-based review, as presented in the summary competitive advantages and disadvantages analysis for each sector
The level of support provided by donors and development partners
1: Highly unsupportive 2: Unsupportive 3: Broadly neutral 4: Supportive 5: Highly supportive
Qualitative judgement based on findings of the desk-based review, in particular the review of donor interventions presented in Annex A and the sector level analysis
Investment potential
The level of private sector activity in sector
1: Few actors involved in sector 2: Some actors involved but only in parts of value chain 3: Some actors involved across value chain 4: Significant private activity across parts of value chain
5: Significant private activity across all value chain
Qualitative judgement based on findings of desk-based review. As presented in the summary overview of the value chain of each sector
The amount of recent investment activity in sector
1: No real evidence of investments found 2: Limited examples of investment but all donor related 3: Several investments found but mainly donor related 4. Evidence of donor and private investment
5: Significant private and donor investment activity
Qualitative judgement based on findings of desk-based review. We identified investments discussed in G-8 Alliance, and also reviewed industry info in various published reports

62
Table 4.2: Data for long-list sectors14
Sector Development Economic Competitiveness Enabling Investment
No. of
smallholders Ave. daily calories
Ave. value US$ 000s
Ave. value of exports US$ 000s
Yield as % of competitors
Change in export share score
Policy environment
score
Support from
donors score
Private activity score
Investment activity score
Cashew 700,000 8 98,435 137,607 19.7% 3 2 2 3 3
Coffee 450,000 0 64,532 141,374 31.4% 4 3 3 3 3
Cotton 425,000 0 35,397 22,424 46.1% 2 2 2 3 2
Dairy 2,000,000 50 583,614 6,519 47.9% 2 2 4 2 2
Edible Oil 4,000,000 109 750,000 98,183 48.6% 4 3 2 4 4
Horticulture 500,000 79 376,311 354,600 38.3% 4 3 4 5 4
Maize 3,750,000 882 647,712 23,779 26.5% 2 3 5 2 2
Rice 1,500,000 233 570,057 58,423 45.1% 2 3 5 4 4
Sisal 15,000 0 16,069 12,500 28.6% 3 3 2 2 2
Sugar 18,500 88 94,768 101,741 78.7% 2 4 3 5 4
Tea 50,000 0 35,508 54,606 137.7% 2 3 3 4 3
Sources: FAOStat, USDA, UnComtrade, CEPA analysis
14 The data has been pulled together from a range of different sources. We have tried to use the most up to date information where possible, on occasion we have made use of back of the envelop estimates where data was not available.

63
4.2. Priority sectors
We ranked each of the twelve sectors in the long-list against the different criteria described
in the table above. The final scores for each sector are shown in Table 4.3 below.
Overall the analysis suggests that the Phase 2 work should focus on the horticulture, rice and
edible oil sectors.
4.3. Next steps
For phase 2 of the assignment the team will visit Tanzania to meet with key private and public
sector stakeholders primarily in the potential priority sectors but will also take advantage of
the chance to meet with potential GAFSP PrSW/IFC opportunities in other sectors as they
arise.
The objective of this visit will be to update the information available on the key stakeholders
present along each stage of the value chain for the priority sectors and to identify a pipeline
of investment opportunities for GAFSP PrSW/IFC.
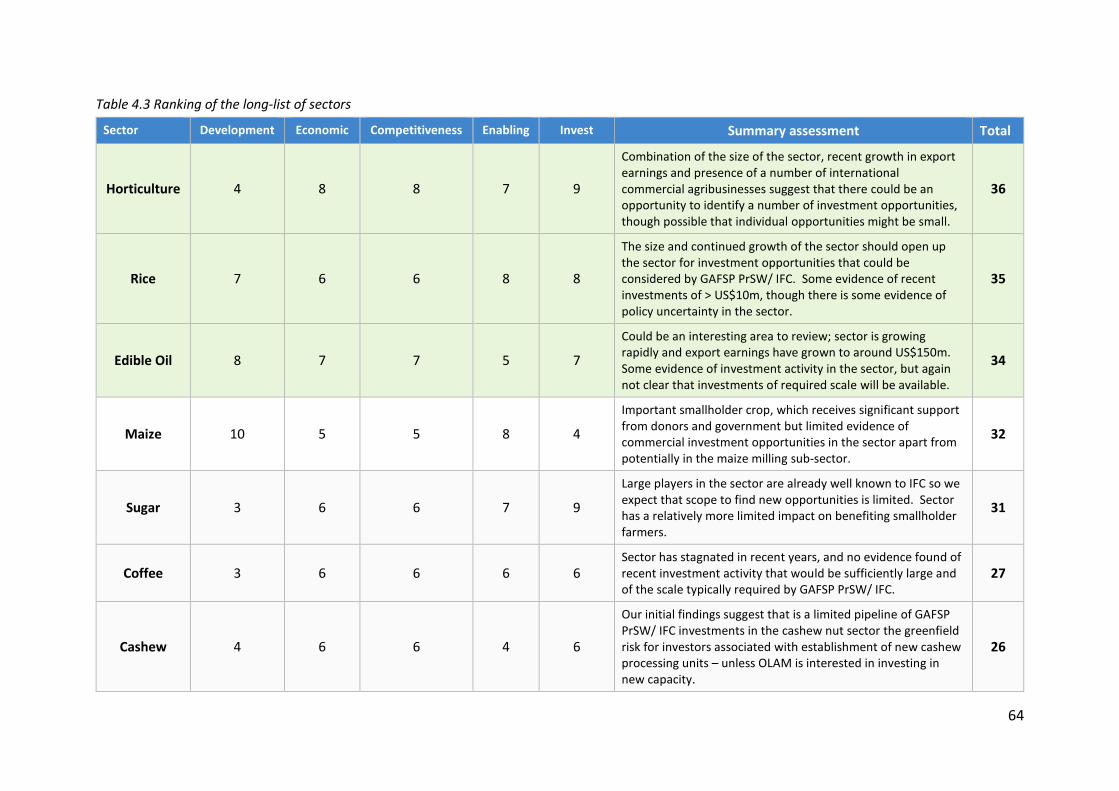
64
Table 4.3 Ranking of the long-list of sectors
Sector Development Economic Competitiveness Enabling Invest Summary assessment Total
Horticulture 4 8 8 7 9
Combination of the size of the sector, recent growth in export earnings and presence of a number of international commercial agribusinesses suggest that there could be an opportunity to identify a number of investment opportunities, though possible that individual opportunities might be small.
36
Rice 7 6 6 8 8
The size and continued growth of the sector should open up the sector for investment opportunities that could be considered by GAFSP PrSW/ IFC. Some evidence of recent investments of > US$10m, though there is some evidence of policy uncertainty in the sector.
35
Edible Oil 8 7 7 5 7
Could be an interesting area to review; sector is growing rapidly and export earnings have grown to around US$150m. Some evidence of investment activity in the sector, but again not clear that investments of required scale will be available.
34
Maize 10 5 5 8 4
Important smallholder crop, which receives significant support from donors and government but limited evidence of commercial investment opportunities in the sector apart from potentially in the maize milling sub-sector.
32
Sugar 3 6 6 7 9
Large players in the sector are already well known to IFC so we expect that scope to find new opportunities is limited. Sector has a relatively more limited impact on benefiting smallholder farmers.
31
Coffee 3 6 6 6 6
Sector has stagnated in recent years, and no evidence found of recent investment activity that would be sufficiently large and of the scale typically required by GAFSP PrSW/ IFC.
27
Cashew 4 6 6 4 6
Our initial findings suggest that is a limited pipeline of GAFSP PrSW/ IFC investments in the cashew nut sector the greenfield risk for investors associated with establishment of new cashew processing units – unless OLAM is interested in investing in new capacity.
26

65
Dairy 6 5 5 6 4
The largest milk processing company has a turnover of around US$4m so, unless an international firm is considering entry into the market, there seems to be limited scope for the sector to yield a pipeline of opportunities of the size under consideration by GAFSP PrSW/ IFC.
26
Tea 2 4 4 6 7
Based on the desk-based review it could be interesting to explore the scope for GAFSP PrSW/ IFC to support provision of finance to smallholders to enable them to purchase increased inputs, as well as exploring opportunities in the packing stage of the value chain. In practice unless Unilver is interested, it could be difficult to find appropriate partners for IFC in the sector.
23
Cotton 3 3 3 4 5
Desk-based review suggests that investment in the sector would be difficult because of ongoing difficulties on issues such as contract enforcement between ginners and growers. No examples of large scale investment in the sector were found.
18
Sisal 2 3 3 5 4 Sector is probably currently too small to support a GAFSP PrSW/ IFC investment.
17
Flour milling15
N/A N/A N/A N/A N/A Could be an interesting sector to review, particularly the wheat milling sub-sector. But we understand that IFC already has a good grasp of investment opportunities in the sector.
N/A
15 Flour milling is not suitable for ranking in the same way as the other sectors. We have instead taken a more qualitative view on the scope for the sector to yield GAFSP PrSW/IFC investment opportunities.

66
5. HORTICULTURE VALUE CHAIN
This section provides an overview of the horticultural value chain in Tanzania, and concludes
by presenting the investment and advisory opportunities identified during consultations with
some of the larger agribusinesses operating in the sector.
5.1. Sector overview
Tanzania’s horticultural sector is reported to be one of the fastest growing sectors in the
economy, with estimated growth rates of 9% to 12% per annum. Overall, the sector is
estimated to provide employment for 500,000 individuals, with women making up around
65% of the workforce. It is dominated by smallholder farmers, own landholdings of less than
2 Ha.
The vast majority of production is either for home-consumption or local markets. According
to a study by Mashindano et al (2013), only around 5% of horticultural products produced in
Tanzania are destined for export markets.16
Horticultural production takes place throughout the country, but it is concentrated nearby to
the larger towns or where the climate is most suited to a particular crop. The export industry
targeting the EU tends to be based in the cooler climate around Arusha whereas Southern
Highlands and Coastal zones produce for the main local conurbations. The main horticultural
export products are fruits and vegetables such as avocados and green beans; whilst flower
exports remain an important part of the sector.
Hence we targeted the Arusha area for the majority of our consultations in the horticultural
sector as the exporters are much larger organisations and therefore represent a much better
market opportunity for the IFC.
5.1.1. Export performance of the horticulture sector
Estimates provided by the Tanzania Revenue Authority (TRA) and quoted by the Tanzania
Horticulture Association (TAHA) suggest that Tanzania makes around US$500m from
exporting horticultural products each year, which is around 40% of the country’s agricultural
export earnings. It is reported that fruits and vegetables (such as green beans and avocados)
make up over 50% of horticultural exports, with spices and flowers (roses and cut flowers)
the other key export earning segments.
However, these figures are probably inflated by including the export of pulses and possibly
cashew fruits to Asia, which would not normally be counted as being horticultural exports.
According to most anecdotal evidence, up to 80% of Tanzania’s horticultural exports are
16 Mashindano, O Kanyuze; Kazi, V Mashauri; and Baregu, S (2013). Tapping export opportunities for horticulture products in Tanzania: do we have supporting policies and institutional frameworks.

67
meant to be destined for EU markets; hence we reviewed EuroStat data to see what
information there is on Tanzanian exports to this market.
According to the EuroStat data, Tanzanian exports of fruit & vegetables, flowers and spices
amounted to €28.7m Euros in 2015, with around €21.1m Euros of that total coming from
fruits & vegetables, just over €6.6m from flowers and around €1m from the export of spices.
If even just 50% - as opposed to the 80% commonly quoted - of Tanzanian horticultural
exports are to the EU, it suggests that the US$500m quoted by the industry is a significant
overstatement of realised export earnings. Further the data from Eurostat is a bit closer to
the export information that we received from the agribusinesses operating in the sector.
Though it is also possible that EuroStat data understates Tanzanian exports by including some
Tanzanian exports within Kenyan export figures.
The figure below shows that Tanzania has had some success in growing horticultural export
earnings, achieving a CAGR of around 4% since 2002. That growth has been driven by
increases in the exports of fruits and vegetables. However the flower sector has declined – it
achieved exports of over €10m Euros in 2008, but has fallen back to €6.6m since then. This is
attributed to the fact that some of the flower companies that were active in Tanzania exited
the sub-sector following a decline in prices per stem post 2008, e.g. Hortanzia that has moved
from producing cut roses to chives and Arusha Blooms that now exports green beans.
Figure 5.1: Tanzanian horticultural exports to EU
Source: Eurostat
Our consultations and desk-based research suggested that green beans and avocados are two
of the most important fruit and vegetable export crops. The figure below shows that the
exports of the two commodities was over €10m Euros in 2015 with over €7m coming from
the export of avocados, which has grown quickly to become one of the larger horticultural

68
exports to the EU and reflects the emergence of Africado and to a lesser extent Rungwe
Avocados Limited.
Figure 5.2: Tanzanian exports of green beans and avocados
Source: Eurostat
Kenya and Ethiopia are the two largest horticultural exporters to the EU so it is useful to see
how they have performed in recent years compared to Tanzania. The figure below shows
that both Kenya and Ethiopia achieve a much higher level of horticultural exports to the EU –
Kenya achieving €750m Euros and Ethiopia around €150m Euros – compared to Tanzania.
But it is most interesting to see how Ethiopia has achieved rapid export growth in the sector,
growing at a CAGR of 21%, since 2002. Ethiopia used to have a similar level of exports to the
EU as Tanzania but has been able to achieve a much higher level of growth.

69
Figure 5.3: Tanzanian export performance to EU compared to Kenya and Ethiopia (Euros)
Source: EuroStat
Why have Kenya and Ethiopia outperformed Tanzania?
The above export data highlights the fact that Tanzania has been much less successful in
developing the horticulture sector than its regional competitors Kenya and Ethiopia. This is
despite the fact that it targeted the sector at about the same time as its neighbours. It is
therefore important to understand why it has been less successful. The Tanzanian
Horticultural Association (TAHA) and a number of stakeholders in the private sector
emphasise that the Kenyan Governments support of exports and the private sector allowed
its exports, initially mainly green beans and other fine vegetables to become established.
Kenyan growers also have much greater areas of good land and varying altitudes, which
means it is a much better position to grow horticultural crops at their optimum temperatures
(for example, different types of roses require different temperatures, therefore sweetheart,
spray and t-hybrid roses are grown in different parts of Kenya; the sample applies to
vegetables where green beans and mangetout are grown at different altitudes).
The addition of a wider range of crops added more volume to exports and facilitated the
establishment of a freight aircraft service out of Nairobi; today there are often 15 to 25 wide-
bodied freighters/week taking off from Kenya to Europe each with a capacity of 120 to 140
tonnes. This volume has enabled Kenyan exporters to build more effective cargo handling
facilities around the airport perimeter and negotiate very competitive freight rates.
70
The situation in Ethiopia was slightly different in that its Government made a determined
effort to attract investors by providing a conducive policy environment and subsidised loans
to investors. This accounted for the very significant expansion, especially in rose production
in green houses. Ethiopia does not export the wide range of products that Kenya does, but it
has a very significant rose-export industry. This does show that if the growing conditions are
correct and a Government adopts supportive policies and the correct incentives, it could be
possible to significantly expand perishable horticultural exports.
Today, the key to Kenya’s success compared to Tanzania is probably based on its very
significant economies of trade; for example Kenya’s green bean exports are 20 times larger
than Tanzania’s. Furthermore, interviews with the floriculture industry suggest that rose
production in Tanzania is at a much lower scale compared with over 3,000 Ha in Kenya and
over 1,000 Ha in Ethiopia. This tends to suggest that if the World Bank Group wants to support
the Tanzanian horticulture industry, it would be best to focus on supporting the entire
industry rather than individual producers.
TAHA has been vocal in advocating for policy changes to improve competitiveness compared
to regional rivals. We discuss some of the main outstanding policy constraints highlighted by
the industry below.
5.1.2. Key policy constraints in the horticulture sector
TAHA articulated a number of the policy-related constraints that are specific to the
horticulture sector in its position paper on incentives in the horticulture sector which was
produced back in 2011. We understand from our consultations that these issues continue to
affect horticulture in Tanzania, suggesting that the government is still not providing sufficient
support to the sector.
Excessive taxes, levies affecting the competitiveness of the sector
One of the issues raised by exporting companies is the problem of double taxation. In
particular companies have to pay tax which is included on the price of purchasing inputs but
then have to pay produce cess, which is charged as a proportion of total earnings (3 – 5% of
the producers’ farm gate price – though most Districts charge the maximum 5% rate).
According to the Local Government Authority (LGA) Finance Act, produce cess is meant to be
levied on the buyer rather than the producer. The local government has targeted horticultural
producers because they know that much of their produce is destined for export, which is not
consistent with the terms of the Finance Act.
In addition to produce cess, horticulture firms are being charged a 0.3% levy on their turnover.
The 1999 Finance Act is also clear that firms should not have to pay both the service levy and
produce cess.

71
Payment of VAT and receipt of refunds on VAT claims
Another issue related to tax payment is the extent to which agribusinesses in the sector have
to pay VAT on agro-inputs such as seeds and plant materials. Horticultural planting material
is charged a 25% tariff and 18% VAT. Many of the inputs that the horticulture sector needs
are not available locally so have to be imported. These additional taxes limit the
competitiveness of Tanzanian horticultural products.
Horticultural exporters are meant to be able to reclaim VAT payments from the Tanzania
Revenue Authority (TRA); however the companies report that they face significant time delays
when trying to do so – often as long as a year.
Air freight charges and facilities at Kilimanjaro airport
As we discuss in the agribusiness profiles below, most of the exporters in Tanzania’s
horticulture sector have to rely on Nairobi to export their produce. This is because the
provision of cargo plane services at Kilimanjaro airport has never really taken off. A number
of consultees suggested that this was because of the excessive charges in place for using
Kilimanjaro airport. We heard that there used to be a regular dedicated cargo service landing
at the airport, but which was stopped as landing fees increased. The scope for other players
to benefit from the airport is therefore limited. Given that a number of the large horticultural
firms are located in and around Arusha there would be potential benefits for the sector if the
government could coordinate some joint action to improve the cost effectiveness of service
provision at Kilimanjaro airport. Though the ongoing work to develop the road link between
Arusha and Kenya will also help to reduce the travel time and cost for exporters in the
medium-term.
Fertiliser registration laws
According to the Tanzania Fertiliser Regulations, 2011, any new fertiliser in Tanzania has to
be registered by the Tanzania Fertiliser Regulatory Authority (TFRA). The regulations state
that the new fertiliser has to go through three consecutive seasons of testing (which can take
three years), at a total cost of US$30,000 (US$10,000 per season).
The existing regulations are disproportionate when compared with other countries in the
region. The available evidence suggests that the length of time required to register new
fertilisers specified in the regulations is too long and the cost are too high. In other countries
such as Uganda, Rwanda, Ghana and Zambia it typically takes less than 1 year to register new
fertiliser with total registration costs estimated to be less than US$2,000.
The regulations have restricted severely the availability of new fertiliser blends to Tanzanian
farmers. There are currently just 37 different fertiliser varieties registered in Tanzania
compared to over 200 in countries such as Zambia. The constraint also reduces investment in
fertiliser blending, which has limited the growth of a local blending industry in Tanzania.

72
This constraint is reportedly having a material effect on the sector - in particular the emergent
commercial farmers that need access to a wide range of blends to optimise yields. We
understand that horticulture requires lots of different varieties of fertiliser in quite small
quantities. Given current registration laws it is not financially viable for a firm to undergo the
three seasons of testing and US$30,000 costs to register a new blend because the size of their
potential sales would not cover registration costs. The small varieties of fertiliser available in
Tanzania is reported to be significantly affecting the ability of emergent farmers to access the
fertilisers that they need for their crops.
Developing a programme to address the policy constraints
The above highlight some of the main policy constraints highlighted as limiting the growth of
the horticulture sector. Horticulture was included as one of the priority areas in the Kilimo
Kwanza back in 2009, and following on from that the Horticultural Development Council of
Tanzania (HODECT) developed the Tanzania Horticultural Development Strategy, which was
published in 2010.
However, the view from the range of consultees is very much that the sector lacks genuine
commitment from government to support its development; reading the strategy it is clear
that many of identified actions have not been implemented. As a result the sector is
characterised as having lots of potential, with some individual success stories – some of which
such as Africado, have individually been able to benefit from supportive government policies
(it has Export Processing Zone status).
Despite the numerous government strategy documents that have been developed in the past
there is a sense from the feedback that we received that there is almost a need to start from
a blank sheet of paper when considering the steps to develop the sector.
First, as alluded to in the discussions above there is a need for Tanzania to stop
focusing on trying to compete with/ mimic the Kenyan horticultural sector. The
agronomic conditions for the horticultural sector in Tanzania are distinct from those
in Kenya; there is a need to develop something that takes best advantage of Tanzanian
conditions, rather than just copying Kenya at a smaller scale and less efficiently.
o For instance, although a number of flower exporters are operating in Arusha,
the area does not offer the same range of altitudes that Kenya has to enable
the production of a broader range of varieties. This partly explains why the
flower sector in Tanzania has stagnated with a number of companies leaving
the industry as they didn’t have their own niche which enabled them to
compete when there was more price pressure in the sector.
One of the first steps is to refresh the sector strategy and identify what products are
best suited to Tanzanian conditions. Again at the moment this seems like a process
that is being led by some of the individual agribusinesses such as Rijkzwan Afrisem and
Africado are actively in the process of testing conditions to identify which types of

73
crops have potential. There is scope for an advisory programme that brings together
government policy makers and these type of companies to help develop a more
Tanzania-focused horticultural development strategy.
Once it is more focused strategy is developed government will need to identify the
steps that will be needed to create the enabling environment for the sector to grow.
Tanzanian policy makers could be supported to determine how to provide a
sustainable package of incentives for the sector. Tanzania could learn from how the
Ethiopian government went about designing and then implementing successfully its
horticultural sector development plan.
The above describes a set of actions that could support the medium-term development of the
sector. In the short-term central government and local government need to work together to
address the issues around the more effective implementation of existing laws and
regulations. TAHA has tried to advocate on these issues on multiple occasions and could
potentially benefit from support from development partners to make more progress.
5.2. Investment/ advisory opportunities in horticulture for GAFSP PrSW/IFC
Some Information in this section has been omitted for confidentiality reasons.
Overall, our assessment of the horticulture sector in Tanzania is that there is limited scope for
the sector to grow in the coming years unless government takes a much more proactive
approach to supporting the growth of the sector. Whilst there is reportedly high and growing
demand for horticultural products in the EU markets it is not clear that Tanzania has much of
a competitive advantage in many of the products, particularly given the competition provided
by Kenya.
However, we did identify a number of professionally managed farms that are having varying
degrees of success in exporting to the EU and other developed markets. Most of the
companies that we consulted with are achieving a turnover in the US$3m to US$10m range.
They indicated a desire to invest to expand their operations over time, but noted that most
agribusinesses in the sector do not have the capacity to absorb one-off US$5m + investments
at the moment. Instead they need investments in the US$500K to US$5m range to support
more sustainable growth, given the supporting infrastructure and human resource needs
associated with any expansion.
As a result the immediate investment needs for the prospective companies is in general less
than the intended US$5m project size [with one exception omitted for confidentiality
reasons]. However, with the right partner, there could be potential to complete a number of
investments to support expansion over the coming years.
The scope for advisory support with potential to lead to investment activity also seems more
limited at this stage apart from the opportunity identified to support the pilot wholesale
market. Most of the existing firms that could benefit from investment in the coming years are

74
already operating in partnership with technical advisors or are able to manage their activities
in-house, though this would need to be explored with the target agribusinesses in more detail.
5.2.1. Scope to establish a risk-sharing facility
One possible area for intervention raised during consultations was the scope to establish a
risk-sharing facility focused on supporting the growth of emergent farmers in the horticulture
sector [details are omitted for confidentiality reasons].
It is unlikely that the overall size of the horticulture sector is large enough to justify
development of a dedicated risk-sharing facility, but there is some scope to follow-up with
existing initiatives to link them to the IFC’s interventions with the Private Agricultural Sector
Support Trust (PASS).
5.2.2. Scope to support companies to scale-up out-grower programmes
There could be potential for GAFSP PrSW/ IFC to provide advisory support to agribusinesses
that want to increase the scale of their out-grower programmes. We consulted with three
horticultural companies that could present an immediate advisory opportunity; however they
are all at different stages of development so would require a tailored approach [details are
omitted for confidentiality reasons].
5.3. Next steps for GAFSP PrSW/ IFC in the horticulture sector
There are some potential individual investments for GAFSP PrSW/ IFC to consider in the
horticulture sector in Tanzania [details are omitted for confidentiality reasons]. Depending on
the extent to which IFC wants to engage with horticulture we have also identified a range of
other businesses which it may wish to consult to review their stated investment needs.
However, our overall assessment is that, apart from some individual success stories, the
horticulture sector in Tanzania has failed to take advantage of the opportunity to develop.
While Kenya has some agro-climatic advantages over Tanzania, it is striking to look at the way
Ethiopia has been able to achieve such rapid growth in export earnings since starting from a
similar base as Tanzania through proactive government measures to develop the sector.
Engagement with government to address the sector’s various policy and infrastructure
constraints may be more important than making individual investments. Furthermore, one
of the potential issues with the sector is that it has yet to really develop a niche that is
designed to make best use of Tanzanian conditions and market access rather than simply
mimicking what takes place in Kenya at a smaller scale.

75
6. EDIBLE OILS VALUE CHAIN
This section provides an overview of the main edible oil sub-sectors in Tanzania. The section
concludes by outlining the projects identified during the country visit.
6.1. Sector overview
The edible oil sector is growing at over 10% per annum according to FAO Stat statistics on
domestic production levels. The main edible oilseeds produced in Tanzania are sunflower,
groundnuts, and cottonseeds which account for over 85% of production. Domestic production
of edible oils is about 200,000 tonnes to 250,000 tonnes, with sunflower oil accounting for
around 160,000 tonnes, both cottonseed and sesame oil production at around 20,000 tonnes,
and 15,000 tonnes of palm each year.
Tanzania’s total demand for edible oil is estimated to be up to 500,000 tonnes. At the moment
around 50% to 60% of Tanzania’s edible oil consumption is imported (as illustrated in Figure
6.1), suggesting an opportunity for import substitution. It is estimated that over US$120m is
spent on edible oil imports each year, with oil palm the most imported product, though
domestic production of oil palm is very low.
Figure 6.1: Left - Edible oils production (tonnes); Right - sub-sector breakdown, 2012
Source: Left - FAOSTAT; Right - Tanzania Edible Oilseeds Actors Ltd (TEOSA)
We present a review of sunflower, palm and cotton oil sectors below, before presenting our
findings on investment opportunities.
6.1.1. Sunflower oil
Global exports of sunflower oil are greater than US$10bn. The sub-sector has been growing
at over 10% per annum over the last ten years, driven by increased consumer demand. The
global price for sunflower oil has increased from around US$700-900 per tonne a decade ago
Palm-based
imports53%
Domestic sunflower
oil28%
Other oil imports
12%
Domestic cotton oil4%
Domestic palm oil3%
-
20,000
40,000
60,000
80,000
100,000
120,000
140,000
160,000
180,000
2004 2005 2006 2007 2008 2009 2010 2011 2012 2013
Oil, palm + kernel Oil, cottonseed Oil, sunflower

76
to its current level of around US$1,000 per tonne. Over the last twenty years, global
production of sunflower seeds has nearly doubled from around 20m tonnes to close to 40m
tonnes. The leading global producers of sunflower seeds are Russia, the Ukraine and the EU
block. In SSA Tanzania is second to South Africa as the leading sunflower seed producer,
though African countries account for only around 5% to 6% of world output.
In Tanzania sunflower seed production has increased rapidly in recent years. Between 2010
and 2014 production has reportedly more than doubled. This has been driven by a significant
improvement in yields and an increase in the planted area. Sunflower seeds are grown across
a range of different regions in Tanzania.
Figure 6.2: Sunflower seed production in Tanzania
Source: FAOStat
Sunflower oil production in Tanzania has mirrored the increase in seed production, growing
by over 200% since 2010. Most sunflower oil produced in Tanzania is consumed domestically
– exports of sunflower oil products are estimated to be around US$6m a year. However, there
is an important trade in sunflower cake (a bi-product of the oil production). Exports of cake
have grown to over US$60m, with the vast majority exported to India.
Sunflower oil value chain
The production of sunflower seeds in Tanzania is dominated by smallholder farmers which
make up around 95% of production. Smallholders typically operate on farms of less than 2 Ha
and have no access to on-farm machinery or storage facilities. The farmers use primarily
recycled traditional seed varieties – though in some cases get access to seeds distributed by
the Agricultural Seeds Agency (ASA). Overall it is estimated that around 35% of farmers are
using improved seed varieties.
It is estimated that around 8m smallholders are involved in producing sunflower seeds in
Tanzania. The crop is usually grown as an intercrop together with maize, sorghum and
cowpeas.
The sunflower seed produced by smallholders is sold to local traders, agents or collected by
the Agricultural Marketing Cooperatives operating on behalf of local processors, though a

77
proportion is sold directly to the large processors. Sunflower seed produced by medium and
large-scale producers is generally sold directly to processors.
The largest processors are Mount Meru Millers (IFC is already in discussion with them and
asked us not to meet them for this assignment), Sunshine Industrial Limited (a sunflower
processing company located in Dodoma) and Murzah Oil Mills. The majority of sunflower oil
produced by the large processors is for export markets. It is estimated that despite the rapid
increase in sunflower seed production there remains significant spare processing capacity in
Tanzania. There does not seem to be much scope for additional investment in processing
capacity at present, efforts to develop the sector will need to focus on improving smallholder
productivity by increasing use of improved seeds and other inputs.
An overview of the sunflower oil value chain is presented below.
Figure 6.3: Overview of sunflower value chain
Source: Government of Tanzania, International Trade Centre (Intracen). Sunflower sector development
strategy 2016 – 2020.

78
Input-costs faced by sunflower oil farmers
As mentioned above one of the main development opportunities for the sunflower sector is
to continue efforts to develop the productivity of sunflower farmers. One option could be to
work with one/ a group of processors to help them provide finance to smallholders so that
the farmers can make use of improved inputs and so increase productivity levels.
Based on some existing studies we present a simple back-of-the envelop analysis to give an
idea of the potential size of such a scheme.
The rough cost per Ha of the inputs required to produce sunflower seeds is around
US$250 to US$500 per Ha, this is to achieve yields of around 1 tonne per Ha.
Fertiliser (around 23%) is estimated to be the largest cost in the study, with labour,
ploughing, packing and transport costs also significant.
As we describe in more detail in the profile below, Murzah Oil is interested in investing
to develop a sunflower seed processing unit which has the capacity to process 500
tonnes per day.
Depending on the level of capacity utilisation this might mean that it needs between
100,000 to 150,000 tonnes of sunflower seed a year.
Given the input cost per tonne of US$500, this implies that input costs would be within
the US$25m to US$75m range.
If a scheme were developed in which smallholders had to pay half of the input costs
up-front and where then provided with the remaining input costs on credit this would
still involve a financing requirement in the region of US$10m to US$40m to support
an expansion in processing capacity similar to that suggested by Murzah.
Key constraints in the sunflower sub-sector
The government’s recent sunflower strategy document highlights the following as the main
constraints facing the sector:
The need to improve farmers’ access to improved seeds and inputs. In addition, there
is a need to train more farmers in GAP practices so that their produce can be exported
to international markets.
Improving coordination and transparency between the smallholder farmers, traders
and processors.
The processors have indicated that they face a complicated tax regime including VAT,
produce CESS and other duties on their imports which creates uncertainty for their
business and can reduce the competitiveness of domestic production compared to
imports.

79
6.1.2. Palm oil
Tanzania produces very little of its own crude palm oil. In 2013 it imported 256,000 tonnes of
crude palm and palm kernel oil, compared to smallholder-based domestic production of only
14,000 tonnes. The imported oil is fractioned and refined in one of five-or-so plants around
Dar es Salaam. The largest refiners include:
East Coast Oils and Fats Ltd (MeTL Group subsidiary). Has a single plant with a refining
capacity of around 200,000 tonnes. MeTL is reportedly acquiring 25,000 Ha of land for
large-scale palm cultivation, with an estimated eventual yield of 118,000 tonnes of
crude oil.
Murzah Wilmar East Africa Ltd. A joint venture between the Murzah Group and
Wilmar International formed in December 2015. Owns two major refineries with a
joint refining capacity of 108,000 tonnes per annum, but is currently planning to
consolidate operations onto a single site.
Bidco Oil & Soap Ltd. Has a single plant with a refining capacity of around 120,000
tonnes.
As well as the major MeTL expansion referenced above, plans are underway for a 10,000 Ha
“Integrated Oil Palm Project” in the Ruvu River Basin near Dar Es Salaam. The project is being
undertaken by TB Tanagro Ltd - a joint venture between the state-run National Development
Corporation (20%) and Singapore-based Nava Bharat Pte Limited (80%). At the moment 6,000
Ha of land has been secured. NDC predicts eventual yields of 7.7 tonnes of crude oil per
hectare per year (up to 77,000 tonnes, assuming 100% of the proposed area is used).
In July 2016 the GoT introduced a 10% import tariff on crude palm to incentivise domestic
production. This was a departure from the 0% tariff which still holds in other EAC countries.
The effect on refiners is unclear, but it raises the chances of increasing domestic palm
production or substitution towards other oilseeds.
6.1.3. Cotton oil
According to existing data around 400,000 Ha of rain-fed land in the Lakes zone are sown each
year by around 400,000 smallholder farmers who sell to ginners. Ginners separate out cotton
lint as the primary product, of which 80-85% is exported as raw lint rather than being
processed in-country. Cottonseed is produced as a bi-product, but which is increasingly being
crushed for oil and oilseed cake rather than being sold back to farmers for sowing.
Our consultations have suggested that Tanzania’s cotton sector is struggling. Tanzanian
smallholders are finding it difficult to compete in what is a highly competitive global market.
In 2014/15 Tanzania had an estimated average yield of 200 kg lint / Ha, compared to 475 in
Burkina Faso (Africa’s leading producer) and 550 in India. As a result, the sector is reported to
be shrinking. We have heard that Tanzania’s cotton mills are operating at about 20% of full
capacity, with only 20 of around 32 ginners with installed oil mills currently operational. This

80
is in line with a similar picture of decline in several African countries in the face of competition
from synthetic fabrics and mills operating in Asia.
Oil production from cottonseed crushing, on the other hand, is reported to have doubled
between 2010 and 2013 as world prices jumped. In Tanzania, crude oil prices reportedly rose
from around 250 to 720 TZS/kg. Exports of cotton by-products were negligible until 2014, at
which point they jumped from US$4.7m in 2013 to US$32.7m (of which 93% was crude
cottonseed oil). The sudden increase appears to have been almost entirely due to a buyer in
Switzerland.17
During our consultations we spoke to several stakeholders (including Sumaria - owner of S&C
Ginning Ltd.) who confirmed that cotton ginners have been struggling in recent years, are
heavily indebted and are not looking to expand. Some of the larger ginners or crushing and
refining plants (e.g. Mount Meru Millers, Kahama Oil Mills, Birchand Oil Mills, Olam Tanzania)
may seek to expand their crushing capacity at an appropriate scale for IFC. Although we are
not aware of any current expansion projects, we understand that Cooperative Rural
Development Bank (CRDB) are providing working capital credit to several ginners: including
KSH35bn of credit to a major Chinese-owned miller based in Shinyanga.
6.2. Investment/ advisory opportunities in edible oils for GAFSP PrSW/IFC
Some Information in this section has been omitted for confidentiality reasons.
Overall, our consultations have indicated that the most likely sub-sectors to yield investable
opportunities are sunflower seed oil and, more speculatively, domestic palm production. The
cotton sector is generally in decline, although seed crushing appears to be defying the
downwards trend. The introduction of a 10% crude palm import tariff may generate
opportunities in domestic palm production, though could also dampen appetite for additional
refining capacity.
6.3. Next steps for GAFSP PrSW/ IFC in the edible oils sector
With respect to identifiable investment opportunities, the following represent opportunities
that are worth following up on: [details are omitted for confidentiality reasons].
More broadly, there may be an opportunity to meet the high demand for working capital
among growers and millers in the edible oils sector, possibly through a bank such as CRDB.
17 United Republic of Tanzania Cotton-to-Clothing strategy 2016-2020, International Trade Centre (ITC), 2016
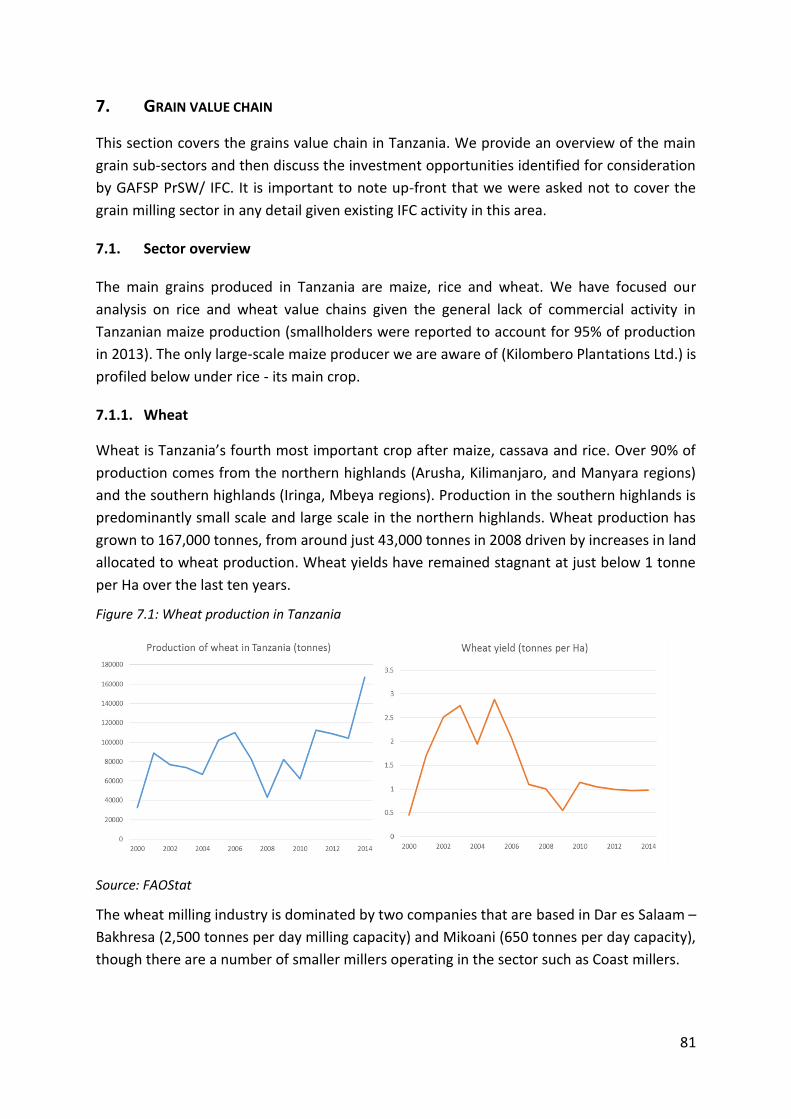
81
7. GRAIN VALUE CHAIN
This section covers the grains value chain in Tanzania. We provide an overview of the main
grain sub-sectors and then discuss the investment opportunities identified for consideration
by GAFSP PrSW/ IFC. It is important to note up-front that we were asked not to cover the
grain milling sector in any detail given existing IFC activity in this area.
7.1. Sector overview
The main grains produced in Tanzania are maize, rice and wheat. We have focused our
analysis on rice and wheat value chains given the general lack of commercial activity in
Tanzanian maize production (smallholders were reported to account for 95% of production
in 2013). The only large-scale maize producer we are aware of (Kilombero Plantations Ltd.) is
profiled below under rice - its main crop.
7.1.1. Wheat
Wheat is Tanzania’s fourth most important crop after maize, cassava and rice. Over 90% of
production comes from the northern highlands (Arusha, Kilimanjaro, and Manyara regions)
and the southern highlands (Iringa, Mbeya regions). Production in the southern highlands is
predominantly small scale and large scale in the northern highlands. Wheat production has
grown to 167,000 tonnes, from around just 43,000 tonnes in 2008 driven by increases in land
allocated to wheat production. Wheat yields have remained stagnant at just below 1 tonne
per Ha over the last ten years.
Figure 7.1: Wheat production in Tanzania
Source: FAOStat
The wheat milling industry is dominated by two companies that are based in Dar es Salaam –
Bakhresa (2,500 tonnes per day milling capacity) and Mikoani (650 tonnes per day capacity),
though there are a number of smaller millers operating in the sector such as Coast millers.

82
Wheat consumption is higher in urban areas and the growth of the major cities of Dar es
Salaam, Mwanza and Arusha will further spur demand for wheat products. The main growth
categories for the wheat industry are pasta, biscuits, and breakfast cereals.
The current production of wheat is estimated to account for approx. 10% of total domestic
consumption; the country is reliant on imports to meet demand, with wheat imports costing
between US$225m to US$300m per annum.
7.1.2. Rice
According to data from FAOStat, rice production in Tanzania has more than doubled over the
past 14 years with production growing at a CAGR of 9% p.a. This growth has been driven by
both an increase in rice yields, which have grown from 1.9 tonnes per Ha to 2.8 tonnes per
Ha and an increase in the amount of land under rice production.
Figure 7.2: Rice production in Tanzania
Source: FAOStat
Rice is an important crop for both subsistence and commercial farming in Tanzania, and
consumption has been increasing in recent years. Rice is more expensive than other cereal
crops including maize (Tanzania’s chief staple crop) but similar to a number of other countries
in SSA, the combination of increasing urbanisation and household income has led to
households consuming more rice and substituting away from the cheaper cereals.
Rice is produced mainly in the Morogoro, Shinyanga, Tabora, Mwanga and Mbeya regions of
Tanzania; with production dependent on smallholder farmers. It is estimated that between
1.2m to 1.8m smallholder farmers are engaged in the production of rice on farm sizes
between 0.5-3 Ha. The majority of smallholder production relies on traditional rain-fed
production (either lowland flood or upland dry), which makes very limited use of technology,
fertiliser, seeds etc. Yields achieved by these farmers are as low as 0.4 tonnes per Ha (in rain-
fed upland production) to 2.5 tonnes per Ha (rain-fed lowland).
Only 6% of rice is produced by large-scale commercial farms. The commercial farms can
achieve yields in excess of 8 tonnes per Ha. Each of the producing regions have their own
wholesale market, all of which use the Dar es Salaam price as their benchmark wholesale
market price (less cost of transport). The largest commercial rice producer is KPL. Our

83
assessment from a number of consultations is that they are the only rice producing company
that has potential to partner with GAFSP PrSW/ IFC, but not at present. The other large
producers are Kapunga Rice Plantation Limited and Mbarali Rice Farm, both located in Mbeya.
We consulted with KPL as part of this project and present findings below.
Rice imports vs. domestic production
Dar es Salaam market is the largest market for rice in Tanzania and is responsible for
approximately 40% of the country’s rice consumption. According to a BMGF commissioned
study, Tanzanian consumers are willing to pay a 21% premium for Tanzanian rice, over
cheaper imported rice, because of their inherent preference for its flavour, aroma and
freshness. Further, consumers are brand conscious, with Kyela and Mbeya rice regarded as
the best quality rice, followed by Morogoro rice.
In order to meet growing demand, Tanzania imports rice (e.g. Pakistani long-grain non-
basmati white rice IRRI-6, 5% broken and 25% broken varieties). Historically imports
constituted as much as 30% of domestic supply. But since the introduction of the East African
Community’s Common External Tariff (EAC-CET) in 2005, which increased the duty on
imported rice from 25% to 75%, rice imports have fallen to roughly 10% of domestic supply.
The combination of forecasts for continued growth in demand for rice, combined with a
strong preference for domestic supply suggests that there may be scope for supporting
investment in increased rice production.
However there has been some inconsistency with respect to the government’s policy on rice
imports as is discussed in the box below.
Box 7.1: Importation of rice duty-free, inconsistent with existing trade policy
In 2005 the East African Community imposed a Common External Tariff (CET) on rice imported from outside of the community of 75%. The presumable intention behind this policy was to help stimulate the growth of the region’s domestic rice sectors – indeed in Tanzania rice domestic rice production has doubled in the past ten years.
However in 2013, the government of Tanzania made the decision to import 175,000MT of rice from Pakistan duty free, based on misleading local price information (pricing data was used only for the premium market segment, which does not reflect pricing for the majority of consumers). The impact of this policy on the local rice market was to depress significantly local rice prices causing domestic agribusinesses and smallholder rice producers to lose significant revenues.
Impact on private investment:
Since 2008, after $40m of initial investment, KPL has become East Africa’s leading rice producer with a 5,000-hectare nucleus commercial farm and a transformative satellite smallholder programme lifting 5,000 farmer families from subsistence to surplus.
KPL recently attracted around US$11m of investment from AgDevCo to support an expansion in its business, which will benefit the company and the farmers attached to the scheme. The financial viability of the investment would be undermined if government were to dump duty free rice on the market again thus highlighting the uncertainty faced by an investor in the sector.
Although the figures are dated, the 2012 BMGF analysis shows that domestic rice production
is not competitive with imported rice absent the imposition of the 75% tariff. This is due to

84
high labour costs involved in rice production, resulting from labour intensive production
practices and high transportation costs. While consumers are thought to be willing to pay a
premium for domestically produced rice, available evidence suggests that the commercial
case for investment in the sector is highly dependent on the continued imposition of the
common external tariff and the ability to export within the region. Rice producers in Tanzania
are currently of the view that the EAC tariff is working and that the government retains
commitment to enforcing it – though there is obvious wariness that government has shown
in the recent past that it will dump imported rice on the domestic market. Also it should be
noted that there are significant issues with cross-border smuggling of rice from outside the
EAC region given the price incentive created by the external tariff.
Our consultations have suggested that Tanzania is currently enforcing the common external
tariff on rice. However, Rwanda and Burundi still impose a 75% tariff on Tanzanian rice (see
Box 7.1 above). As a result, Tanzania is now in significant surplus (500,000 tonnes of paddy).
Market prices are accordingly low, and can fall below break-even point for growers with larger
overheads.
7.2. Market information on the grain sector
7.2.1. Brewing - wheat, barley and sorghum
Tanzania lacks wheat or barley farms of a sufficient size to be of interest to IFC. Mountainside
Farms Ltd, the largest of only four commercial producers, made US$2m of revenue in 2012.
Although its scale may have increased since then, it is unlikely to be able to take a loan greater
than $US5m.
Large investments in these sectors are most likely to be viable at the processing level. Both
major breweries in the country, Serengeti and Tanzania Breweries (SBL and TBL), are
reportedly planning to source locally more wheat, barley and white sorghum. They would
ideally wish to engage with a commercial operation such as Mountainside Farms Ltd (which
was originally formed in 2000 as a joint venture with SBL), although finding the requisite land
would be difficult, or to partner formalised outgrower programmes (tax incentives make out-
growing through smallholder farmers reasonably economical). We have also heard that grain
storage is likely to be a focus area for expansion.
7.2.2. Milling
As the IFC is already in close contact with most of the major millers operating in Tanzania, we
were directed not to engage with milling companies. This restricted the potential for finding
new investable opportunities in the grains sector. We have therefore explored other areas in
more depth - namely, brewing and rice - the only grain for which commercial growers of a
suitable size exist in Tanzania.
85
However as part of our discussion with Murzah Wilmar East Africa (MWEAL) on edible oils we
identified an opportunity to develop a rice and a flour mill (profiled in Section 7.3). We
understand that the IFC has not yet made contact with this company.
7.2.3. Rice farming
Other than KPL (described in Section 7.3 below), the two other commercial rice operations in
Tanzania are:
Kapunga Rice Plantation Ltd, owned by ETG and Duxton Asset Management; and
Mbarali Rice Farms Ltd, owned by Highland Estates Ltd.
Both companies are based in the Mbeya region and mostly now rely on smallholder
production. Our consultations have confirmed that both estates had large donor sums
invested into their establishment through the National Farming Corporation (in the region of
US$60-80m each). Our contacts do not expect either estate to be an IFC investment
opportunity. Mbarali in particular was not considered likely to pass IFC’s social criteria due to
land dispute issues.
7.3. Investment/ advisory opportunities in grain for GAFSP PrSW/IFC
Some Information in this section has been omitted for confidentiality reasons.
Our consultations have confirmed that grain producers in Tanzania are too small to be
recipients of IFC financing with the exception of the three major rice producers. Of these
three, none appear to have a current need for additional external finance, and at least one
would not be likely to meet due diligence requirements. We have identified one company
that is seeking significant finance for multiple projects [details are omitted for confidentiality
reasons]. Although neither brewery is looking for external finance themselves, there is
potential to explore opportunities to provide credit to their grain suppliers either through the
breweries, or through an intermediary.
7.4. Next steps for GAFSP PrSW/ IFC in the grains sector
Our ability to review the value chain and identify the investment opportunities in the sector
was limited because we were asked not to see the major grain milling companies. Despite this
we were able to identify some opportunities that could be worth following up with: [details
are omitted for confidentiality reasons].

86
8. INVESTMENT OPPORTUNITIES IN OTHER SECTORS
In addition to the analysis of the priority sectors we identified opportunities that we came
across during our country visit. They cover the following sectors, which we present below:
tea;
sugar;
financial services; and
one individual project opportunity in the sisal sector.
8.1. Tea sector
8.1.1. Tea value chain
There are three main tea growing areas in Tanzania: the Southern highland zones of Mufindi,
Njome and Rungwe district; the North East zone of Lusotho, Korogwe and Muheza districts;
and the Northwest zone of Bukoba and Muleba districts. Overall, approx. 22,000 Ha of land is
used to produce tea, which is split roughly 50:50 between land under production by
smallholders and land used by the commercial tea estates, though estates account for around
two thirds of made tea production.
Around 50,000 smallholders are involved in the production of tea, relying on rain-fed
production and making limited use of inputs. The smallholder yield is estimated at less than
one tonne/ Ha, whilst estates have been achieving close to 2 tonnes/ Ha. Unilever and Rift
Valley, which are both growing under irrigation, are reportedly achieving 2.8 – 3.5 tonnes/
Ha.
Tanzania’s production of made tea has climbed gradually over the last ten years - reaching
around 37,000 tonnes in 2014, but dipping back to 32,000 tonnes in 2015 following a
prolonged dry spell in Rungwe District and uneven rainfall in Mufindi District. In both years
around 30,000 tonnes were exported, generating $52m of export earnings in FY15/16. The
remainder is packaged and sold to domestic markets. Packaging and marketing of tea is
carried out by five licensed factories run by Afri Tea and Coffee Ltd., Chai Bora Ltd., Chai Amani
Ltd., International Food Packers, and Rift Valley Tea Solutions.
The Tea Board of Tanzania has forecast that both local sales and export of tea will continue
to climb over the next 7 years. Our consultations have suggested that producers continue to
invest in improving and expanding their plantations despite suffering from low world prices
in recent years. Part of the investment rationale for tea in Tanzania is that domestic
consumption is expected to grow as population and household wealth rises. Kenyans
reportedly consume four times as much tea per capita as Tanzanians, which industry
stakeholders tend to attribute to the larger disposable incomes of Kenyan consumers.

87
Figure 8.1: Made tea production (tonnes) in Tanzania (right) and by factory owner (left)
Source: Tea Board of Tanzania; FAOStat
There are four companies currently operating in Tanzania at a scale that might yield
investment opportunities appropriate for IFC (not including METL). These are:
Rift Valley Corporation. A Harare-based group of mainly agricultural businesses owned
by the Höegh and von Pezold families. In Tanzania, Rift Valley owns and operates three
tea estates through Mufindi Tea Company / Mufindi Tea Estates with factories in
Itona, Luponde and Kibena (ex CDC), and a factory in Lupembe for processing tea from
smallholders. It also started a trading and blending business based in Dar in 2013.
Unilever Tea Tanzania Ltd. Unilever owns and operates estates in the Mufindi district
of southern Tanzania, with three factories at Lugoda, Kibwele, and Kilima. Unilever is
currently undertaking a c. €47m project to build a new factory and estate in the
Njombe area and to establish a service company serving smallholder farmers in the
region. Project partners include DfID (£7.5m), the Wood Family Trust, and the Gatsby
Foundation as part of their “Chai” project.
Tanzania Tea Packers Ltd (Tatepa). Tatepa is a tea and avocado producer, majority-
owned by Maris Capital. It owns and operates the Katumba tea estate and factory
through Wakulima Tea Company Ltd (WATCO).
East Usambara Tea Company Ltd (EUTCO). EUTCO, which is 50% owned by MAC
Group, operates on 14,164 Ha of land in Muheza District with factories at Kwamkoro
and Bulwa.
8.1.2. Investment opportunities in the tea sector
This section has been omitted for confidentiality reasons.
-
2,000
4,000
6,000
8,000
10,000
12,000
FY14-15 FY15-16
-
5,000
10,000
15,000
20,000
25,000
30,000
35,000
40,000

88
8.2. Sugar sector
Some Information in this section has been omitted for confidentiality reasons.
We also had consultations with Coca Cola Kwanza and Sumaria - two coke bottlers and major
sugar consumers, we combined these discussions with some research to present some initial
findings on the sugar sector.
Industry and government stakeholders alike recognise the potential for expansion of
Tanzanian sugar production. There are several different estimates of Tanzania’s sugar
requirement were quoted (up to 600,000 tonnes per year), but there is agreement that it is
not currently being met by domestic production which fluctuates around 300,000 tonnes. As
shown in Figure 8.2 below, Tanzania is therefore importing large quantities of sugar each year,
mostly from Thailand, Brazil, India and Indonesia. Most of this is white refined sugar for
industrial purposes. We understand that Tanzania currently has only one refined white sugar
factory - Kilombero’s K2 factory at Ruhembe.
Figure 8.2: Sugar production by factories (left) and import-export balance for 2012/13 (right) - tonnes
Source: Sugar Board of Tanzania
Note: KSC = Kilombero Sugar Company Ltd; TPC = Tanganyika Planting Company Ltd; MSL = Mtibwa
Sugar Estate Ltd; KSL = Kagera Sugar Ltd.
Sugar is an issue of growing political concern in Tanzania. In February 2016, President
Magufuli ordered the restriction of sugar import permits in a move to protect domestic
producers from highly competitive world prices. We understand that this ban was lifted in
early September. This has heightened interest in adding production capacity, but the
investment environment remains challenging.
The Bagamoyo EcoEnergy project to plant 8,000 Ha of sugar cane for sugar, ethanol and
power production has been trying to put up a refinery for the last 5 years. However, we have
heard reports that the project may not now go ahead, which may be explained by the
-
20,000
40,000
60,000
80,000
100,000
120,000
140,000
160,000
KSC TPC MSE KSL
-
50,000
100,000
150,000
200,000
250,000
300,000
350,000
400,000
450,000
Production Exported Imported(domestic)
Imported(industrial)
Nationalconsumption

89
difficulty of securing land rights. Existing sugar farms’ access to land for expansion is also
restricted without securing further land grants from the government.
The government has reportedly directed two pension funds to invest in government part-
owned farms. Although we are not aware of the specifics of these plans we have heard that
the investment may be in the region of US$50-75m, but that they are not actively looking for
private sponsors.
There may be opportunities to co-invest in schemes with government backing such as these.
This could require sustained political engagement and may not be within the remit of GAFSP.
8.3. Financial sector
This section has been omitted for confidentiality reasons.
8.4. Opportunities identified in other sectors
In addition to our other findings we discussed an opportunity in the sisal sector, which is
profiled below [details are omitted for confidentiality reasons].

90
ANNEX A SUMMARY OF COMMITMENTS TO INPUT SECTOR
The table below presents examples of private sector commitments to the agricultural input sector in Tanzania, made under the New Alliance
Framework. This annex was collated during the first (desk-based) phase of our study and may not reflect the most current or detailed information
available.
Table A.1: Private sector commitments to the input sector in Tanzania
Company Commitment Progress under commitment (as of 2014)
AGCO, US-based global manufacturer of farm equipment
Capacity building, knowledge transfer of the agronomic system and intensification of agriculture and farming mechanisation by:
i. establishing a demonstration farm and training centre in collaboration with global and local partners, aimed at large- to small-scale farmers, agriculture students and local schoolchildren;
ii. providing infrastructure and technical support with mechanisation, storage and livestock systems, including after-sales services for commercial smallholders, and emerging and large-scale farmers; and
iii. offering finance solutions and developing leasing models for tractor supply to small-scale farmers with little working capital.
The Company has already conducted exploration visits and evaluated existing opportunities with SAGCOT and Ministry for Agriculture, including TAN25, and other partners like AgDevCo and Agrica/KPL on rice.
In addition, it is in Concept Stage for the nucleus farm project and out-grower scheme in Kigom and with Tanzania Horticultural Association (TAHA) for a horticulture development project.
Syngenta, global agricultural inputs co.
Contribute to delivering cluster initiatives to support development of large farms and surrounding smallholders, such as by supporting SAGCOT Centre with funding, planning and delivery; and partnering with other companies and USAID to develop a village-based agro-dealer network, among other sector-specific initiatives for rice and maize.
Tanseed Contributing to stabilising and increasing rice and maize productivity and
profitability among smallholders, though improving availability and adoption
of affordable, high- quality rice and maize seed varieties, as well as better crop
management practices.
As of 2013, Tanseed had produced 11 MT of certified seed, processed and packed in 298,200 small packs and distributed to 119,243 smallholders through 102 seed distributors across 43 districts. It also engaged in strategic partnerships with the International Maize and Wheat Improvement Center, the International Rice Research Institute, AGRA, USAID and Root Capital, focused on developing unique crop genetics for greater market pull, facilitating staff training and attracting working capital.
United Phoshorous
Improving productivity and income of small and marginal farmers of interest crops (corn, sorghum, sunflower, canola, rice, cotton, forages, legumes and
Blueprint for implementation was ready as of 2013, with the company awaiting registration of seeds (expected in 2014).

91
(UPL)/ Advanta, India-based seed and crop production co.
vegetables) through technology transfer to small and marginal farmers via on-farm training schools (3,000 trainees planned in 1st year), and through its role as key input and knowledge partner to large farms.
Yara, Norway-based multinational fertiliser company
Develop long-term partnerships to further the national fertiliser market through: (i) continuing existing efforts in SAGCOT (particularly the rice value-chain partnership with KPL and developing an Integrated Green Corridor); (ii) initiating an integrated sustainability approach with NORAD and AGRA; (iii) developing 2-3 subsequent value-chain initiatives under SAGCOT; and (iv) developing a pilot initiative with Vodafone and government to field-test mobile phone delivery mechanisms for improved supply-chain efficiencies.
Progress updates as of year 3: (i) finalising construction of a $20m revolving fertiliser terminal in Dar es Salaam; (ii) established 5 in-market storage facilities in key agricultural areas and a smallholder outreach programme focused on improving food security; (iii) conducted several field missions to neighbouring Rwanda and Burundi to develop regional distribution and agro-dealer market, with Tanzania as hub; (iv) held numerous discussions on project-specific activities in SAGCOT including with NORAD and AGRA; (v) provided technical expertise and products to develop smallholder capacity in the tea value chain in partnership with Unilever; (vi) trained 10,000 farmers on improved coffee production practices in partnership with ECOM Trading Group; (vii) provided plant nutrition expertise, fertiliser and practical support to ECCAg research partnership field trials; (viii) signed MoU with microfinance NGO BRAC to collaborate on Livelihood Enhancement through agricultural development project on maize; (ix) establishing trials and providing technical support related to key crops and value chains; and (x) exploring new partnerships in sugar, cotton and maize value chains.
Source: Partnership Accountability Committee, New Alliance (2014)

92
ANNEX B SUMMARY OF DONOR ACTIVITY IN TANZANIA
The table below presents a summary of key donor-supported programmes and projects in the agriculture sector in Tanzania. This annex was
collated during the first (desk-based) phase of our study and may not reflect the most current or detailed information available.
Table B.1: Donor activity in agriculture sector in Tanzania
On-going/ recent
programmes
Size Description
GAFSP/IFC
GAFSP Private Sector: CRDM Bank SME and agribusiness support
US$75m Currently, only 15% of small business owners or women business owners have access to loans.
IFC and CRDB Bank partnership focuses on underserved SME and retail market segments as well as agribusiness producers and exporters.
IFC will also provide advisory services for trade and warehouse financing to strengthen CRDB’s operations.
The investment is expected to reach over 800 clients including SMEs and farmers cooperatives, thereby reaching 6,000 farmers
GAFSP will contribute $10m to the program
GAFSP Public Sector: TARIPA-SAGCOT Expanding Rice Production Project
US$22.9m The project will support rehabilitation of irrigation schemes and an input voucher scheme for rice input packages in project zones.
The ultimate aim is to improve food and nutrition security of smallholder farmers. Indirect benefits will include increased income and better livelihoods, price stability for rice in the domestic market, and curbing rising food prices
The specific GAFSP intervention promotes a seed multiplication distribution system, accelerated adoption of new technologies, rehabilitate irrigation schemes, enhancing capacity for monitoring and evaluation
IFC/ World Food Programme (WFP)
Patient Procurement Platform (2015 – 2016)
US$9.2m pilot
To improve access to crop input finance for farmers in traditional crops, the WFP Farmer Financing Facility is working with a number of partners in the value chain to create market links and reduce risks. IFC and WFP are working together to identify ways to introduce innovative risk mitigation structures around crop loss and price in markets where these products do not exist or are not well utilized.

93
US$45m (across 4 countries)
The WFP/IFC project aggregates demand from a consortium of buyers for a longer period of time than typical spot contracts, with farmers receiving pre-planting forward delivery contracts which guarantee a minimum floor price to cover cost of production and basic sustenance for farmers.
WFP currently has identified 35,000 MT in offtake agreements with 6 buyers including ETG (IFC’s portfolio client), Ken Millers, Basic Element Limited, Kibaigwa Maize Flower and Quality Food Products Limited, International Tan Feeds Limited, and Silverlands Tanzania Limited (in addition to the standard off-take agreements) for the November planting of maize and beans with WFP currently considering to sign a commitment letter to guarantee the last resort purchase up to 5,000 MT.
USAID
Feed the Future/ Tanzania program (2011-2015)
US$315m
Feed the Future/ Tanzania program is focused on priority value chains – rice; maize; and horticulture, primarily in SAGCOT development corridor. Key components are value chain development (NAFAKA project for rice and maize, and TAPP project for horticulture), processing (Tuboreshe Chakula project), nutrition (Mwanzo Bora project), infrastructure (roads and irrigation basket funding with support from CDM engineering firm), policy (SERA project), and research and training (iAGRI project at Sokoine University of Agriculture).
Direct grant funding is provided for TAHA and SAGCOT Center; planned for SUA and BRN in 2014.
Feed the Future particularly supports analysis related to policy commitments in the New Alliance agreement, including export and import policy, the crop cess, land, and seed taxes; in addition, projects support and collaborate with New Alliance LOI signatories including Yara, Vodaphone, KPL, Tanseed, TAHA and TASTA.
The specific GAFSP intervention promotes a seed multiplication distribution system, accelerated adoption of new technologies, rehabilitate irrigation schemes, enhancing capacity for monitoring and evaluation
Kilombero-Ifakara Road Project
US$400,000 (jointly sponsored by USAID, DFID and EU)
Involves construction of 103.3 Kilometre tarmac road along a strategic section of Tanzania’s southern corridor; including upgrades to the Ifakara-Madete road and the construction of three bridges near Ifakara.
Objective is to improve transport facilities and enhance access to rural areas with strong agricultural potential; and is directly aligned with USAID’s Feed the Future program.
Partnership for growth (2012-2016)
Partnership between the Government of Tanzania and the United States Government, to mobilize interagency efforts of development assistance.
Part of the project includes developing rural roads to provide adequate market access to rural agricultural land.
It also includes expanding rural electrification to reach rural agribusinesses.
AGRA
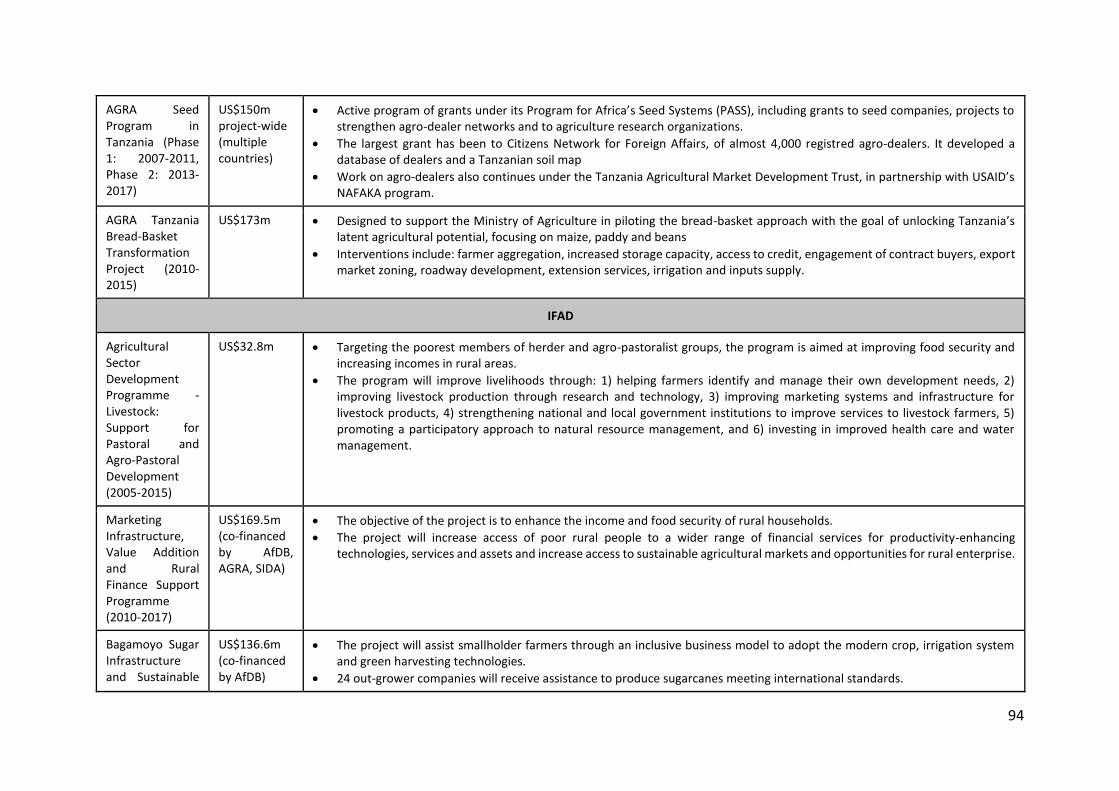
94
AGRA Seed Program in Tanzania (Phase 1: 2007-2011, Phase 2: 2013-2017)
US$150m project-wide (multiple countries)
Active program of grants under its Program for Africa’s Seed Systems (PASS), including grants to seed companies, projects to strengthen agro-dealer networks and to agriculture research organizations.
The largest grant has been to Citizens Network for Foreign Affairs, of almost 4,000 registred agro-dealers. It developed a database of dealers and a Tanzanian soil map
Work on agro-dealers also continues under the Tanzania Agricultural Market Development Trust, in partnership with USAID’s NAFAKA program.
AGRA Tanzania Bread-Basket Transformation Project (2010-2015)
US$173m Designed to support the Ministry of Agriculture in piloting the bread-basket approach with the goal of unlocking Tanzania’s latent agricultural potential, focusing on maize, paddy and beans
Interventions include: farmer aggregation, increased storage capacity, access to credit, engagement of contract buyers, export market zoning, roadway development, extension services, irrigation and inputs supply.
IFAD
Agricultural Sector Development Programme - Livestock: Support for Pastoral and Agro-Pastoral Development (2005-2015)
US$32.8m Targeting the poorest members of herder and agro-pastoralist groups, the program is aimed at improving food security and increasing incomes in rural areas.
The program will improve livelihoods through: 1) helping farmers identify and manage their own development needs, 2) improving livestock production through research and technology, 3) improving marketing systems and infrastructure for livestock products, 4) strengthening national and local government institutions to improve services to livestock farmers, 5) promoting a participatory approach to natural resource management, and 6) investing in improved health care and water management.
Marketing Infrastructure, Value Addition and Rural Finance Support Programme (2010-2017)
US$169.5m (co-financed by AfDB, AGRA, SIDA)
The objective of the project is to enhance the income and food security of rural households.
The project will increase access of poor rural people to a wider range of financial services for productivity-enhancing technologies, services and assets and increase access to sustainable agricultural markets and opportunities for rural enterprise.
Bagamoyo Sugar Infrastructure and Sustainable
US$136.6m (co-financed by AfDB)
The project will assist smallholder farmers through an inclusive business model to adopt the modern crop, irrigation system and green harvesting technologies.
24 out-grower companies will receive assistance to produce sugarcanes meeting international standards.

95
Community Development Programme (BASIC) (2015-2024)
The project will also assist smallholder producers to negotiate long-term supply agreements with beneficial conditions.
BASIC will finance the planning of village land use and titling to obtain land certificates. There will be investments in infrastructure that will benefit broader population.
It will build the capacity of smallholder farmers to manage sustainably natural resource and support them in forming agribusinesses and small and medium rural enterprises.
FAO
Southern Highlands Food Security Programme (2010-2013)
US$5.3m ($2m disbursed through 2013) in project funding
Developed training manuals and trained Government and NGO officials in supporting smallholders taking “agriculture as a business” approach, linking farmers with agro-processors and developing commodity-based sub-sector development strategies for maize, rice, red meat & edible oil
Tanzania Livestock Traceability System (TANLITS) (2011-2014)
US$475,000 Aimed to develop, implement and build capacity in the use of a new information system (TANLITS software) for the Livestock Identification and Traceability System.
The TANLITS database is linked to the Animal Health (Veterinary Services Needs) and Animal Production (Animal Production Needs) Information Management Systems, in order to enable Tanzania to conform to international livestock trade requirements by ensuring efficient traceability mechanisms along the entire food chain, from the farm to the market.
Economic Growth (2011-2016)
US$1.5m Aimed at providing assistance to GoT and other stakeholders to build capacity to implement inclusive economic growth strategies,
The project will accelerate poverty reduction and assist Tanzania’s progress towards achieving goals of MKUKUTA/MKUZA, as well as the MDGs, particularly MDG1, by supporting government’s efforts to address challenges as articulated in key policy and programming documents.
World Bank
SAGCOT (2016-2021)
US$75m Aimed at increasing the adoption of new technologies and marketing practices by smallholder farmers through expanding and creating partnerships between smallholder farmers and agribusinesses in Tanzania.
Tanzania Agricultural
US$151m The first objective of the project is to provide farmers with better access to, and use of agricultural knowledge, technologies, marketing systems and infrastructure.

96
Sector Development Project (2006-2016)
The second objective is to promote agricultural private investment based on an improved regulatory and policy environment. The implementing agency is the Ministry of Agriculture and Food Security.
Additional Financing for Agricultural Sector Development Project (2009-ongoing)
US$30m Aimed as an emergency program to provide credits in support of the Accelerated Food Security Program.
The program responds to an urgent request from the Government of Tanzania to support its efforts to achieve greater food security by increasing food production and productivity and providing social protection for vulnerable groups and the rural poor.
AECF
AEZF TZAW US$22.9m A special fund of the AECF for agribusiness in Tanzania. The fund seeks innovative agribusiness that impact the rural poor, including support for farming, plantations, ranching companies, out grower schemes, producers, manufacturers and distributors, traders, merchants and other private sector providers.
The TZAW scheme has funded 37 agribusiness projects to date. Partners of AECF include, Government of Canada, SIDA, IFAD, Australian Government, UKaid, DANIDA, Kingdom of the Netherlands and AGRA.
UK
2012-2015 US$100m A number of projects are supported relating to agricultural development, including: (i) Coastal rural support programme, which supports rice and sesame value chains in the Mtwara and Lindi regions; (ii) Cotton development programme in Lake Zone; (iii) Horticulture, and food processing activities in Arusha, Morogoro and Zanzibar; (iv) Supporting Agribusinesses with linkages to smallholders across Tanzania through a challenge fund arrangement; (v) Supporting the development of the agricultural finance sector through the Financial Sector Development Trust, and (vi) Supporting private sector organisations that advocate for a better business environment for agriculture.
In subsequent years four new programmes will start to disburse. These include: (i) Support to the SAGCOT initiative; (ii) Support to BRAC-implemented Livelihoods enhancement through agricultural development; (iii) A rural roads programme; (iv) A programme to support improved land administration and titling.
(DFID) The Land Tenure Support Program (2016)
US$11.5m DfID’s Land Tenure Support Programme, beginning in 2016, is designed to make information on land records and processes of land allocation publicly available, and clarify and address current constraints to protecting legitimate land claims

97
In partnership with SIDA and DANIDA, the programme will contribute to growth in agricultural production and better-planned investment in urban infrastructure, including housing.
EU
2011-2015 US$120m Support for food security and rural development in Tanzania with a focus on trade, agriculture and rural infrastructure development:
The project consists of (i) Rural Roads Programme (US$28m); (ii) Support to SAGCOT US$51m (roads, energy, agriculture, environmental management); (iii) Trade and Agriculture Support Programme (Coffee, Tea, Cotton, Horticulture, Fisheries standards and quality improvement) US$28 million; (iv) Support to sugarcane out-growers and research (Kilombero, Mtibwa, Kagera, Moshi) US$8m; and (v) Food security and access to market. US$6m.
Project funding is through civil society, Tanzanian research institutions, or line ministries.
France
2012-2015 US$50m On-going project (US$2.7m) with the Foundation “Institut de Gestion de la Faune” for supporting socio-ecologic development of local populations in the corridors Tarangire/Manyara and Tarangire/Simanjiro.
Pre-identification of a local development program in selected rural areas.
Germany
2012-15 US$92m Germany is supporting programs in Tanzania that have a close link to rural development especially in the area of rural infrastructure development and nature conservation.
The program consists of: (i) Water Sector Development Programme US$19m; (ii) Rural Development Serengeti (US$30m); (iii) Selous-Niassa Wildlife Corridor US$10m; and (iv) Programme Renewable Energies US$33m.
Japan
2012-15 US$140m Japanese assistance policy to Tanzania is to promote economic and social development towards sustainable economic growth and poverty reduction.
In particular, it is supporting the following programmes in line with the New Alliance Cooperation Framework: (i) ASDP; (ii) Programme for Strengthening Rice Production Capacity; and (iii) Programme for Transportation and Traffic Network Development.
Some new projects were started (US$24m), which were not initially planned at the time of the commitment.
Funding is the form of technical cooperation, grant aid and loan
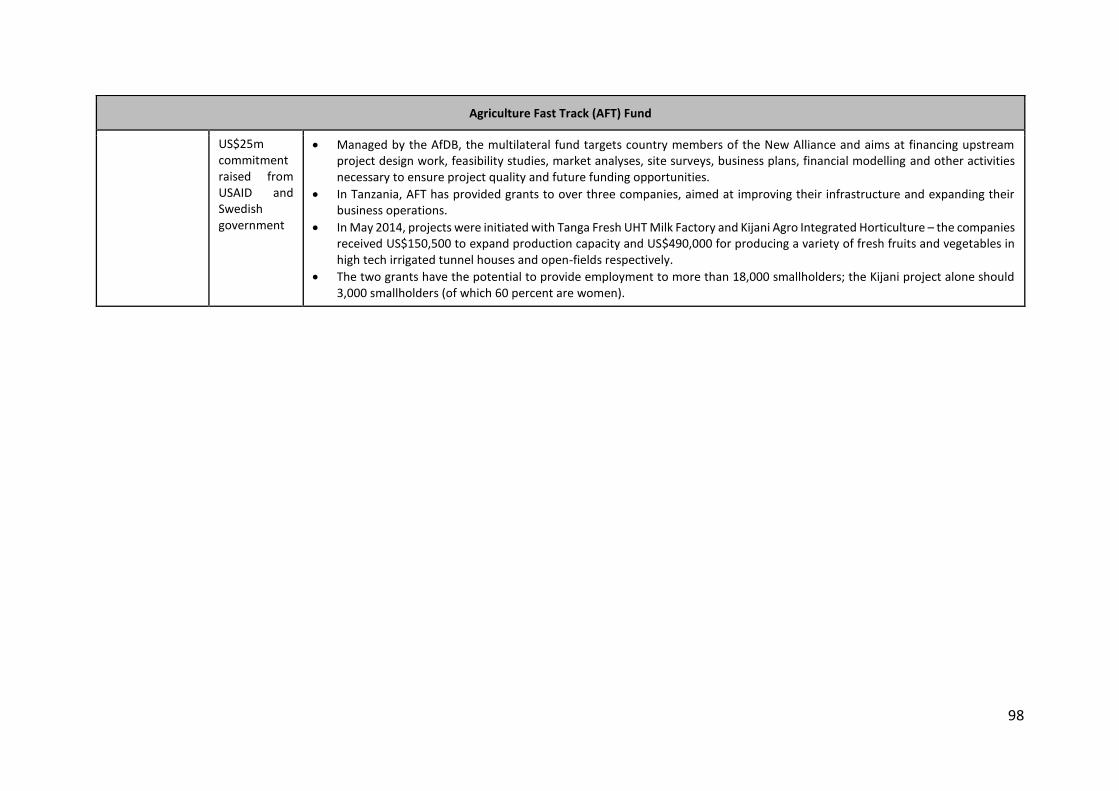
98
Agriculture Fast Track (AFT) Fund
US$25m commitment raised from USAID and Swedish government
Managed by the AfDB, the multilateral fund targets country members of the New Alliance and aims at financing upstream project design work, feasibility studies, market analyses, site surveys, business plans, financial modelling and other activities necessary to ensure project quality and future funding opportunities.
In Tanzania, AFT has provided grants to over three companies, aimed at improving their infrastructure and expanding their business operations.
In May 2014, projects were initiated with Tanga Fresh UHT Milk Factory and Kijani Agro Integrated Horticulture – the companies received US$150,500 to expand production capacity and US$490,000 for producing a variety of fresh fruits and vegetables in high tech irrigated tunnel houses and open-fields respectively.
The two grants have the potential to provide employment to more than 18,000 smallholders; the Kijani project alone should 3,000 smallholders (of which 60 percent are women).

99
ANNEX C ADDITIONAL INFORMATION ON OILSEEDS SUB-SECTOR
The following tables presents an overview of the key oilseed sub-sectors, followed by an overview of the key agribusinesses operating in the
sub-sector. This annex was collated during the first (desk-based) phase of our study and may not reflect the most current or detailed information
available.
Table C.1: Overview of key oilseed sub-sectors
Sub-sector Regions of cultivation Production Processing
Sunflower Dodoma (22.5% of total output); Singida (8.9%); Rukwa, Kilimanjaro (13.2%); and Arusha and Manyara (13.1%). Other regions are Iringa, Mbeya, Ruvuma, Tanga, Morogoro, Rukwa and Coast.
Mainly grown by 150,000–200,000 smallholders on 0.4–1.2 Ha; large-scale farming accounts for only 10% of production.
Manufacture of sunflower oil and oilcake
Sesame 75% of production is from the south. Main regions include: Mtwara, Lindi, Dodoma, Arusha, Manyara, Iringa and Singida. Other areas include Tabora, Mbeya, Tanga and Ruvuma
Mainly small-scale farmers; Processing is mostly via small machines, catered for home consumption and small-scale trading; In 2009, a medium-scale oil mill (capacity of 80 MT/day) was installed in Lindi by Frasal Inter Trade Limited.
Palm oil seeds
Traditionally in Kigoma; but also in Mbeya and some parts of the Tanga region
Large scale production by FELISA Company, which aims to cultivate total of ~10k Ha, around half of which will be from smallholder outgrowers
Local cooperatives collect ~150,000L of palm oil p.a., selling this on to local refineries and soap producers in Dar es Salaam. Women at the local level are also responsible for boiling and milling of palm oil and selling palm oil products.
Soya beans Ruvuma, Rukwa, Iringa, Mbeya and Morogoro. Some is produced in Lindi, Mtwara, Kagera, Manyara & Tanga.
Cotton Most production is in Mwanza, Shinyanga, Tabora, Kigoma, Singida and Kagera. Other producing regions are Kilimanjaro, Manyara, Mbeya and Iringa.
Groundnuts Dodoma, Shin- yanga, Tabora, Singida, Mbeya, Mtwara, Ruvuma and Lindi.
Source: International Growth Centre (2012)

100
Table C.1: Overview of key agribusinesses operating in the oilseeds sub-sector.
Company (turnover as of 2010)
Employment (2010)
Activities Exports Investments – recent & planned (as of 2012)
Murzah Oil Mills (part of the Murzah Group) (US$117m)
300 (100 FTE in oil mills plant; 200 are part-time)
Largest sunflower oil producer in Tanzania.
Close links with farmers’ cooperative union in Kigoma, as well having a procurement centre in the region to ensure steady domestic supply of palm oil.
Seven refineries producing three types of vegetable cooking oil; it also produces toilet and laundry soaps, vegetable cooking fat, bakers fat and margarine (produced from by-products of its fractionation plant).
A large level of local demand has enabled Murzah to reduce production costs and improve export competitiveness
93% of Tanzania’s exports of palm oil products in 2009, valued at ~US$3.36m.
~34% of Tanzania’s exports of ‘other oilseeds & oleaginous fruits’, with exports worth US$1.12m.
85% of Tanzania’s exports of soap products, valued at US$13m (via Murzah Soap and Murzah Oil).
Plant and equipment is modern, sourced from Extraction De Smet of Belgium.
Expansion in fractionation plant capacity from 100 to 300 MT/ day, introducing capability of processing basic raw materials of crude palm oil and to separate the liquid and solid fractions.
Development agenda included: expanding capacity of Mukwano factory; and setting up offfices in Uganda, Zambia, Democratic Republic of the Congo and Switzerland.
Mount Meru Millers Limited (annual average turnover exceeding US$6.5m)
400 Manufacturer of edible sunflower oil based in Arusha, with out-grower network covering 70,000 sunflower farmers in Arusha, Manyara and Singida region, to which it supplies sunflower & corn seeds.
It also produces seed cake and seed husk (for which there is strong demand in export markets, given use for animal feed and boiler fuel respectively).
Subsidiaries of Mount Meru Group include Mount Meru Seeds Limited, which deals with foundation seed farms and certified seed production. In particular, maize and sunflower seeds are purchased, processed, graded, hand cleaned, fumigated, packed, certified and sold.
~70% of Mount Meru Millers Limited’s output is exported to neighbours (Kenya, Uganda, Zambia and Democratic Republic of the Congo) and Europe (Turkey and Ukraine), with annual exports of ~S$5m.
Modern, automated machinery at manufacturing plant in Arusha; seed crushing plant and a nursery in Singida region.
Development agenda included plans to: (i) build another boiler, which uses byproducts (husk) as fuel; and to build a silo with the capacity to store 5,000 MT of seed; (ii) doubling oil crushing and refining capacity by building plants in neighbouring countries; (iii) establish an out-grower network of more than 10,000 farmers and promote sunflower growing over

101
16,000 Ha to produce 300,000 MT of sunflower grain.
Vegetable Oil Industries Ltd ($3.4m)
Annual capacity of 16,000 MT
The Group operates a number of business including cooking oil, fats, plastic/cans, drinking water, battery solution and distilled water.
Exports of vegetable oil to Uganda and Rwanda
BIDCO Oil and Soap Production of edible oil, soap and fat Exports are mainly to Democratic Republic of the Congo and Zambia, mostly in the form of edible oil
Exports were valued at over $7m in 2010
Over $20m capital investment to develop Tanzania’s most modern edible oil refinery.
Development agenda included plans to strengthen links with palm tree farmers through development of large-scale commercial oil palm farming.
Source: International Growth Centre (2012)
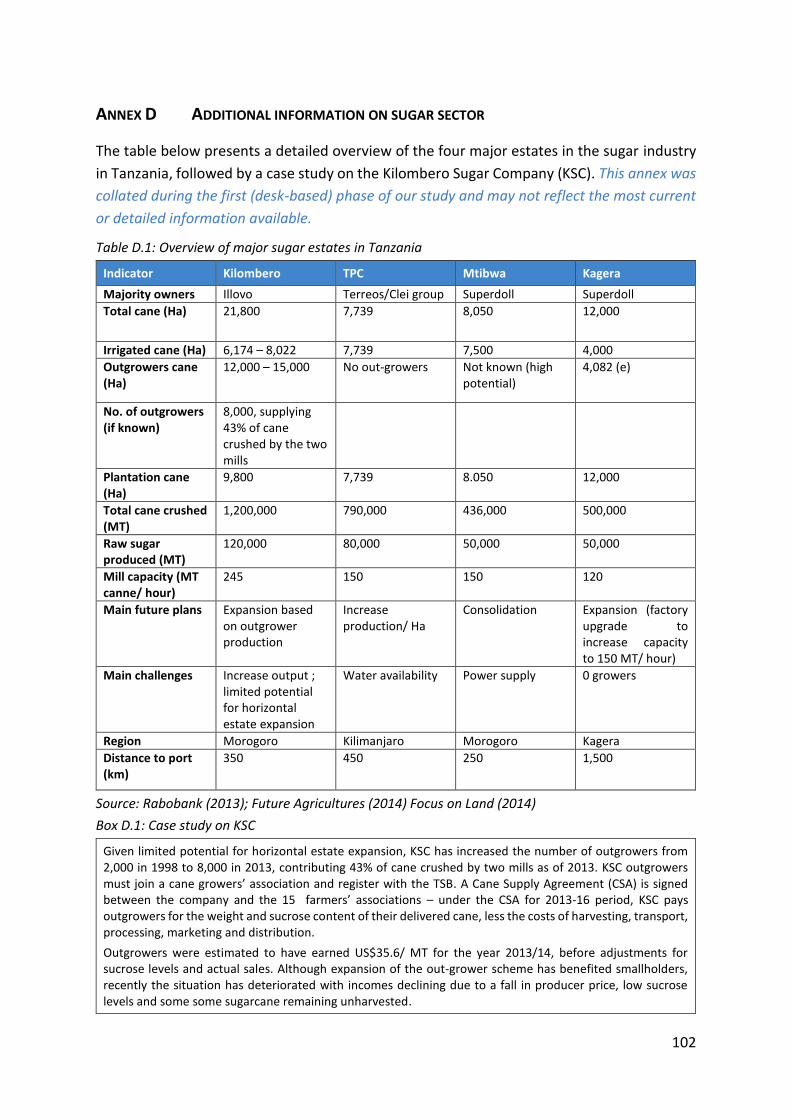
102
ANNEX D ADDITIONAL INFORMATION ON SUGAR SECTOR
The table below presents a detailed overview of the four major estates in the sugar industry
in Tanzania, followed by a case study on the Kilombero Sugar Company (KSC). This annex was
collated during the first (desk-based) phase of our study and may not reflect the most current
or detailed information available.
Table D.1: Overview of major sugar estates in Tanzania
Indicator Kilombero TPC Mtibwa Kagera
Majority owners Illovo Terreos/Clei group Superdoll Superdoll
Total cane (Ha) 21,800 7,739 8,050 12,000
Irrigated cane (Ha) 6,174 – 8,022 7,739 7,500 4,000
Outgrowers cane (Ha)
12,000 – 15,000 No out-growers Not known (high potential)
4,082 (e)
No. of outgrowers (if known)
8,000, supplying 43% of cane crushed by the two mills
Plantation cane (Ha)
9,800
7,739 8.050 12,000
Total cane crushed (MT)
1,200,000 790,000 436,000 500,000
Raw sugar produced (MT)
120,000 80,000 50,000 50,000
Mill capacity (MT canne/ hour)
245 150 150 120
Main future plans Expansion based on outgrower production
Increase production/ Ha
Consolidation
Expansion (factory upgrade to increase capacity to 150 MT/ hour)
Main challenges Increase output ; limited potential for horizontal estate expansion
Water availability Power supply 0 growers
Region Morogoro Kilimanjaro Morogoro Kagera
Distance to port (km)
350 450
250 1,500
Source: Rabobank (2013); Future Agricultures (2014) Focus on Land (2014)
Box D.1: Case study on KSC
Given limited potential for horizontal estate expansion, KSC has increased the number of outgrowers from 2,000 in 1998 to 8,000 in 2013, contributing 43% of cane crushed by two mills as of 2013. KSC outgrowers must join a cane growers’ association and register with the TSB. A Cane Supply Agreement (CSA) is signed between the company and the 15 farmers’ associations – under the CSA for 2013-16 period, KSC pays outgrowers for the weight and sucrose content of their delivered cane, less the costs of harvesting, transport, processing, marketing and distribution.
Outgrowers were estimated to have earned US$35.6/ MT for the year 2013/14, before adjustments for sucrose levels and actual sales. Although expansion of the out-grower scheme has benefited smallholders, recently the situation has deteriorated with incomes declining due to a fall in producer price, low sucrose levels and some some sugarcane remaining unharvested.

103
ANNEX E PROFILES OF TANZANIAN DAIRY COMPANIES
The boxes below provide a brief profile of the major agribusinesses operating in Tanzania’s
dairy sub-sector. This annex was collated during the first (desk-based) phase of our study and
may not reflect the most current or detailed information available.
Tanga Fresh – A leading dairy foods company, contracting 4,5000 farmers to supply milk to its plant; annual
turnover estimated at $4m. The company produces fresh milk, fermented milk, plain and flavoured yoghurt,
mozzarella cheese, butter and ghee. Company meets international hygiene standards and uses state-of-the-
art European equipment and methods. In 2010, Tanga Dairies Cooperative Union (TDCU) collaborated with
Dutch and local partners, to set up a breeding unit and a dairy farm in the Tanga region to increase the supply
of heifers to TDCU farmers and to expand the supply of milk to the Tanga Fresh factory; in addition, the
company introduced text messaging service for farmers and milk collection centres to facilitate information
flow about market, new industry developments, animal husbandry practices etc (used by 2,000 of 4,500
farmers). Processing capacity doubled from 15,000 L/day in 2008 to 31,000 L/ day in 2010, with plans to
expand capacity to 50,000 L/day in 2015. Tanga Fresh is also investing in services of Virtual City, to automate
the recording of milk collection and payments to farmers, with the objective or ensuring the farmer is paid
the correct amount. In 2014, AfDB- managed AFT fund has provided a grant of USD$150,500 to Tanga Fresh
UHT Milk Factory top expand production capacity.
Mgolole Agro-Processing Co. Ltd – Received funding of $450,000 in 2015 from AECF-TZAW to develop an
integrated dairy project to produce and sell quality heifers to farmers in Morogoro region, specifically by
adopting and using improved breeding methods; utilizing locally available feed resources supplemented with
innovative feeding techniques; forming mutually beneficial and sustainable partnerships with financial
institutions, smallholder farmers, milk processing companies and other stakeholders along the dairy value
chain. The project is expected to directly benefit 2,139 households with an annual income of US$1,448 per
household, resulting in a total benefit of US$ 3,097,272 at the end of the project.
Shambani Graduates Enterprises – Milk-processing company founded by 3 graduates of Sokoine University
of Agriculture in Tanzania) have committed to contributing to national increased annual milk production
targets by investments in expanding their milk collection, processing and marketing; and building
quality/hygiene capacity of around 400 milk producers to supply 4,000 L/day, to create additional $900 in
annual income per farmer.
Key progress updates as of Year 3 (2013): (i) development of business plan and focused strategy, with unique
value proposition for expansion; (ii) investment of $62,500 in renovating facilities, including milk collection
centres; (iii) discussions with two firms for financing but no commitment secured to date; (iv) 1,500 L/day of
milk sourced from around 120 smallholders; and (v) near-completion of installation of a new boiler to enhance
processing capacity.
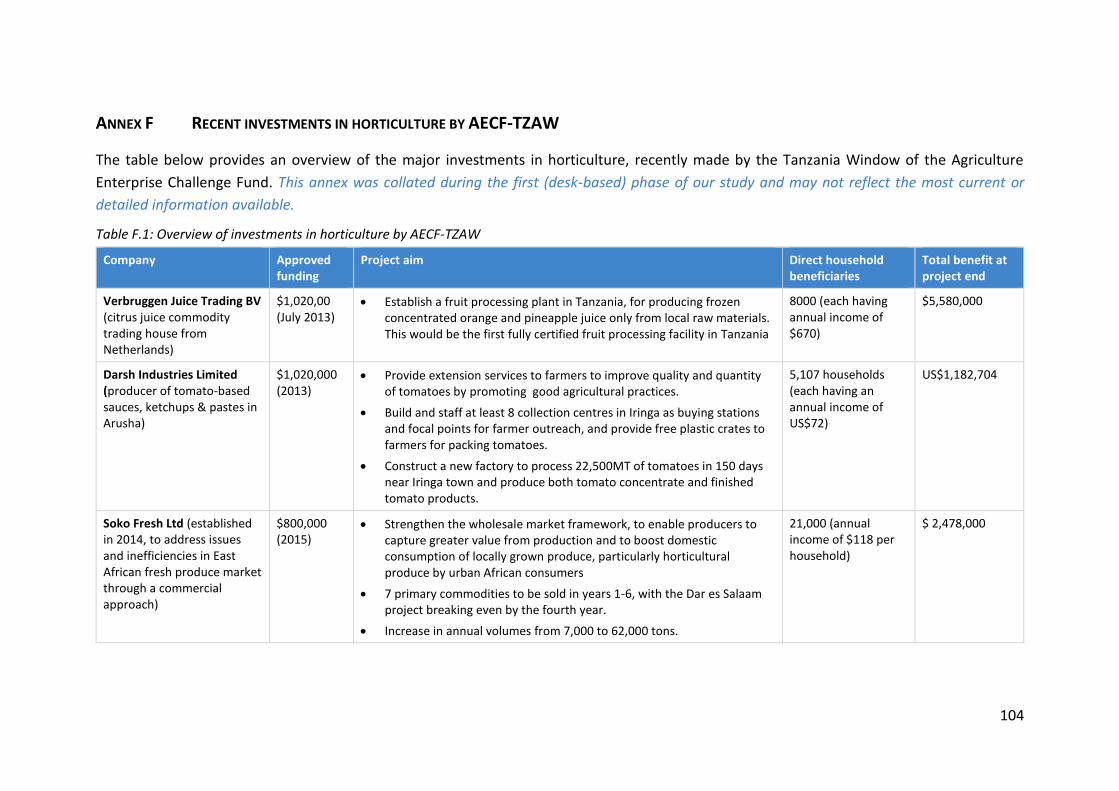
104
ANNEX F RECENT INVESTMENTS IN HORTICULTURE BY AECF-TZAW
The table below provides an overview of the major investments in horticulture, recently made by the Tanzania Window of the Agriculture
Enterprise Challenge Fund. This annex was collated during the first (desk-based) phase of our study and may not reflect the most current or
detailed information available.
Table F.1: Overview of investments in horticulture by AECF-TZAW
Company Approved funding
Project aim Direct household beneficiaries
Total benefit at project end
Verbruggen Juice Trading BV (citrus juice commodity trading house from Netherlands)
$1,020,00 (July 2013)
Establish a fruit processing plant in Tanzania, for producing frozen concentrated orange and pineapple juice only from local raw materials. This would be the first fully certified fruit processing facility in Tanzania
8000 (each having annual income of $670)
$5,580,000
Darsh Industries Limited (producer of tomato-based sauces, ketchups & pastes in Arusha)
$1,020,000 (2013)
Provide extension services to farmers to improve quality and quantity of tomatoes by promoting good agricultural practices.
Build and staff at least 8 collection centres in Iringa as buying stations and focal points for farmer outreach, and provide free plastic crates to farmers for packing tomatoes.
Construct a new factory to process 22,500MT of tomatoes in 150 days near Iringa town and produce both tomato concentrate and finished tomato products.
5,107 households (each having an annual income of US$72)
US$1,182,704
Soko Fresh Ltd (established in 2014, to address issues and inefficiencies in East African fresh produce market through a commercial approach)
$800,000 (2015)
Strengthen the wholesale market framework, to enable producers to capture greater value from production and to boost domestic consumption of locally grown produce, particularly horticultural produce by urban African consumers
7 primary commodities to be sold in years 1-6, with the Dar es Salaam project breaking even by the fourth year.
Increase in annual volumes from 7,000 to 62,000 tons.
21,000 (annual income of $118 per household)
$ 2,478,000
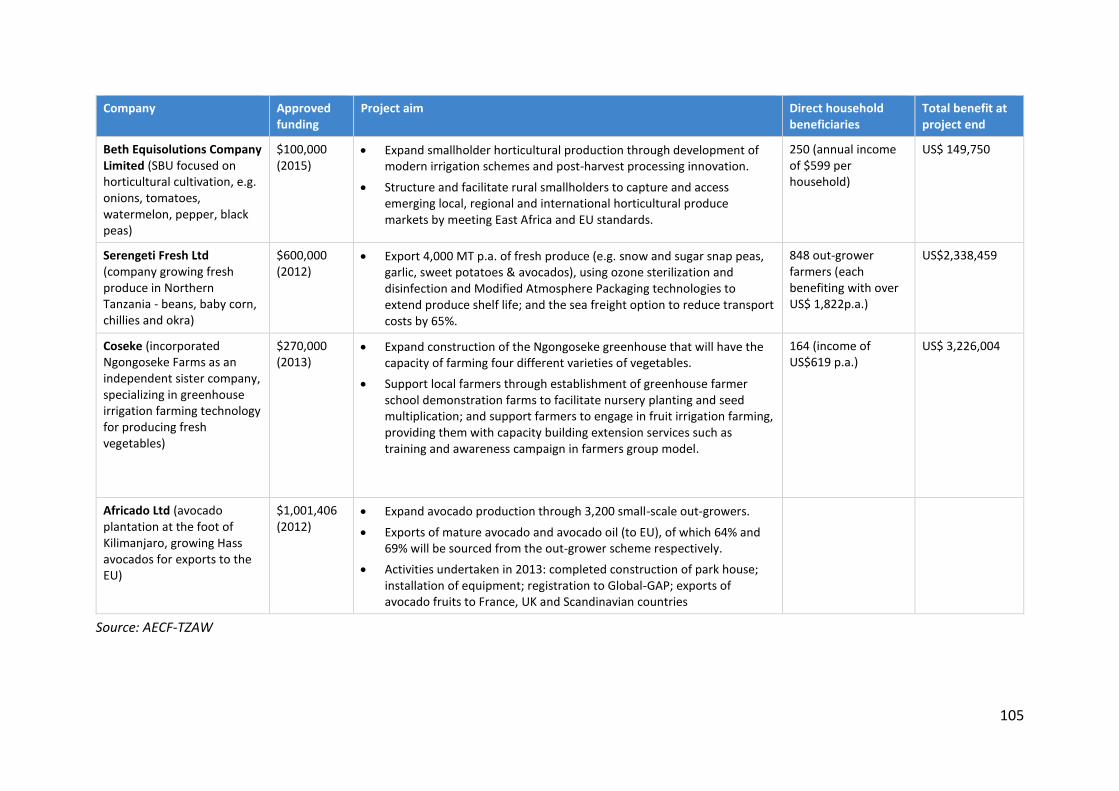
105
Company Approved funding
Project aim Direct household beneficiaries
Total benefit at project end
Beth Equisolutions Company Limited (SBU focused on horticultural cultivation, e.g. onions, tomatoes, watermelon, pepper, black peas)
$100,000 (2015)
Expand smallholder horticultural production through development of modern irrigation schemes and post-harvest processing innovation.
Structure and facilitate rural smallholders to capture and access emerging local, regional and international horticultural produce markets by meeting East Africa and EU standards.
250 (annual income of $599 per household)
US$ 149,750
Serengeti Fresh Ltd (company growing fresh produce in Northern Tanzania - beans, baby corn, chillies and okra)
$600,000 (2012)
Export 4,000 MT p.a. of fresh produce (e.g. snow and sugar snap peas, garlic, sweet potatoes & avocados), using ozone sterilization and disinfection and Modified Atmosphere Packaging technologies to extend produce shelf life; and the sea freight option to reduce transport costs by 65%.
848 out-grower farmers (each benefiting with over US$ 1,822p.a.)
US$2,338,459
Coseke (incorporated Ngongoseke Farms as an independent sister company, specializing in greenhouse irrigation farming technology for producing fresh vegetables)
$270,000 (2013)
Expand construction of the Ngongoseke greenhouse that will have the capacity of farming four different varieties of vegetables.
Support local farmers through establishment of greenhouse farmer school demonstration farms to facilitate nursery planting and seed multiplication; and support farmers to engage in fruit irrigation farming, providing them with capacity building extension services such as training and awareness campaign in farmers group model.
164 (income of US$619 p.a.)
US$ 3,226,004
Africado Ltd (avocado plantation at the foot of Kilimanjaro, growing Hass avocados for exports to the EU)
$1,001,406 (2012)
Expand avocado production through 3,200 small-scale out-growers.
Exports of mature avocado and avocado oil (to EU), of which 64% and 69% will be sourced from the out-grower scheme respectively.
Activities undertaken in 2013: completed construction of park house; installation of equipment; registration to Global-GAP; exports of avocado fruits to France, UK and Scandinavian countries
Source: AECF-TZAW

106
ANNEX G BIBLIOGRAPHY
3ADI (2011). Tanzania’s Cashew Value Chain: A diagnostic.
3ADI. Value chain support program for Tanzania’s cashew and read meat/ leather industry.
AECF Africa. http://www.aecfafrica.org/windows/tanzania-window
AfDB (2014). http://www.afdb.org/fileadmin/uploads/afdb/Documents/Project-and-Operations/Project_Brief_-_Tanzania_-_Bagamoyo_sugar_project.pdf
AFK Insider (2015). Accessed on 20/06/16 at: http://afkinsider.com/85879/fdi-soars-to-3-billion-for-tanzania-agribusiness/
African Business Magazine (2014). http://africanbusinessmagazine.com/sectors/agriculture/tanzania-going-nuts-cashew/#
African Economic Outlook (2015). Tanzania 2015.
African farming and food processing (2015). The tea sector in East Africa.
Agribusiness Africa (2014). http://www.agribusinessafrica.net/index.php/634-tanzania-out-to-reduce-importation-of-edible-oil-to-promote-local-industry
Agriculture Council of Tanzania (2010). Value Chain Analysis of Rice and Maize in Selected Districts in Tanzania.
Agritrade (2013). Executive brief. Tea Sector.
Agritrade (2013). Accessed on 01/07/16 at: http://agritrade.cta.int/Agriculture/Commodities/Tea/New-tea-sector-investment-goes-ahead-in-Tanzania-while-Kenya-tea-sector-is-deregulated
All Africa (2014). http://allafrica.com/stories/201409300595.html
All Africa (2016). http://allafrica.com/stories/201606090216.html
Andrew R and D Phillip (2014). Coffee Production in Kigoma Region, Tanzania: Profitability and Constraints.
Bill and Melinda Gates Foundation (2012). Developing the rice industry in Africa.
Bloomberg (2015). http://www.bloomberg.com/news/articles/2015-11-16/tanzania-sees-2015-cashew-crop-dropping-40-percent-on-poor-rains
BMI Research (2015). Accessed on 20/06/16 at: http://www.agribusiness-insight.com/industry-trend-analysis-east-africa-sugar-ethiopia-stand-out-apr-2015
Clinton Foundation. https://www.clintonfoundation.org/our-work/clinton-development-initiative/programs/agribusiness-development-tanzania
Dr. Damas Philip ( ). Scaling up Agriculture: Challenges and Opportunities for Modernising Agriculture in Tanzania.
East African Business Week (2015). http://www.busiweek.com/index1.php?Ctp=2&pI=4247&pLv=3&srI=84&spI=463
ECDPM (2015). Recent developments in the dairy sector in Eastern Africa.
Ecobank (2015). Middle Africa Markets Update. Soft Commodities.
Ecobank (). The tea sector in East and Southern Africa.
Economic and Social Research Foundation (2012). The Role of Financial Sector in Agriculture Development and Industrialization.
FAO (2012). Monitoring African and Agricultural Policies – Analysis of incentives and disincentives for cashew nuts in the United Republic of Tanzania.
FAO (2012). Monitoring African and Agricultural Policies – Analysis of incentives and disincentives for maize in the United Republic of Tanzania.
FAO (2012). The BEFS Analysis for Tanzania - Sunflower Biodiesel, Water, and Household Food Security.

107
FAO (2013). A country report of the United Republic of Tanzania – Agribusiness Public-Private Partnerships
FAO (2013). Monitoring African and Agricultural Policies – Analysis of incentives and disincentives for coffee in the United Republic of Tanzania.
FAO (2013). Monitoring African and Agricultural Policies – Analysis of incentives and disincentives for wheat in the United Republic of Tanzania.
FAO (2013). Potential constraints to smallholder integration into the developing sisal value chain in Tanzania.
FAO (2015). The maize value chain in Tanzania.
FAO. Tanzania tea industry. Current status and future prospects.
Focus on Land (2014). Accessed on 20/06/16 at: http://www.focusonland.com/fola/en/for-comment/inclusive-business-model-the-case-of-sugarcane-in-tanzania/.
Future Agricultures (2014). Opportunities and Challenges in Tanzania’s Sugar Industry: Lessons for SAGCOT and the New Alliance.
Gatsby Foundation (). Tanzanian cotton sector.
Global Impact Investing Network (2015). The landscape for impact investing in East Africa – Tanzania
Horticultural Development Council of Tanzania (2010). Tanzania Horticultural Development Strategy 2012 – 2021.
International Growth Centre (2013). Expanding Agricultural Production in Tanzania
International Growth Centre (2012). An Enterprise Map of Tanzania.
International Advisory Committee, Tanzania (2015). Tanzania’s Statement to the 74th Plenary Session of the International Cotton Advisory Committee.
International Trade Centre (). Cotton from Tanzania.
Kabengele, Guy (2016). Opportunities and challenges for biogas plant technology in East Africa. Sisal biogas plant in Hale/ Tanzania.
Kabissa, Joe (). Cotton in Tanzania. Trends, performance and future prospects.
Kabura, James Philip (2014). Extension programme needs by farmers in Tanzania: a descriptive study.
Land O’Lakes (). Tanzania dairy development programme.
Mashindano, O Kanyuze; Kazi, V Mashauri; and Baregu, S (2013). Tapping export opportunities for horticulture products in Tanzania: do we have supporting policies and institutional frameworks.
Match Maker Associates Limited (2012). Scoping study on value chain initiatives and studies in Tanzania for Irish Aid and DANIDA.
Match Maker Group: http://www.matchmakergroup.com/news/maize-sector-in-tanzania-challenges-and-opportunities.aspx#.V2v9I5MrJsN
MeTL. http://www.metl.net/en/public/cashews
Mhando et al (2013). Adaptation to changes in the coffee value chain and the price of coffee among coffee producers in two villages in Kilimanjaro, Tanzania.
Miller Magazine. http://www.millermagazine.com/english/grain-and-flour-market-in-kenya-and-tanzania/
Mshandete, Anthony Manoni; Kibazohi, Oscar; and Kivaisi, Amelia Kajumulo (2013). Tanzania sisal industry: auditing and characterisation of sisal post-harvest wastes as a bio-resource for bio-refining.
Mwandima, Ikupa Hakimu (2015). Towards unlocking the hidden potential of horticulture in Arusha, Tanzania.

108
Mwangulumba, E.I; Buluma, M. Kalidushi (2012). Tanzania Cotton Production and Productivity.
New Alliance for Food Security and Nutrition and Grow Africa (2015). Joint Annual Progress Report: 2014-2015.
Nkuba, J; Ndunguru, A; Madulu, R; Lwezaura, D; Kajiru, G; Ababu, A (2016). Rice value chain analysis in Tanzania: identification of constraints, opportunities and upgrading strategies.
Nell, Arend Jan; Schiere, Hans; and Bol, Sifra (2014). Quick scan, dairy sector Tanzania.
Omore, Amos; Bwana, Godfrey; and Ballantyne, Peter (2015). Transforming smallholder dairy value chains in Tanzania through innovation and market linkages.
Oxfam (2015). Tanzania agricultural scale-up programme sisal.
Pass Trust (2013). Draft investment potential for maize and rice.
PASS Trust (2013). Draft investment potential in cashew nut industry.
Partnership Accountability Committee, New Alliance (2014). Tanzania: Progress in Public Private Partnership in Agricultural Transformation.
PWC (2015). Global Agribusinesses.
Rabobank (2014). Significant potential for Tanzanian coffee industry, but serious challenges remain.
Rabobank (2013). Tanzania Sugar.
Reuters (2015). Accessed on 20/06/2016: http://www.reuters.com/article/us-tanzania-coffee-idUSKBN0NI0D520150427
SAGCOT (2012). SAGCOT Investment Partnership Program – Opportunities for investors in the rice and sugar sectors.
SAGCOT. Appendix IV: Value chain and market analysis http://www.smeimpactfund.com/our-impact/impact-dashboard.aspx
Sagera sisal waste biogas project. Project Idea Note (PIN).
SNV (2012). Edible Oil Subsector Tanzania.
SNV (2012) SNV Tanzania.
Sokoine University of Agriculture (2012). The Tanzania dairy industry.
Suleiman (2015). Current Maize Production, Postharvest Losses and the Risk of Mycotoxins Contamination in Tanzania
Sutton, John; and Olomi, Donath (2012). An enterprise map of Tanzania.
TAHA, SAGCOT ( ). Tanzania investment opportunity, Horticulture.
Tanzania Coffee Board (2013). Introducing: Tanzania Coffee Industry Development Strategy (2011‐2021)
Tanzania Coffee Board (2012). Tanzania Coffee Industry Development Strategy 2011/21
Tanzania Cotton Board (2014). Annual report and accounts for year ending June 2013.
Tanzania Cotton Board (2010). The Second Cotton Sector Development Strategy.
Tanzania Investment Centre (2013). Tanzania Investment Guide 2014-15.
Tanzania National Council for Financial Inclusion. National Financial Inclusion Framework. A Public-Private Stakeholders’ Initiative.
TechnoServe (2012). Dairy industry in Tanzania. Value chain analysis.
TEOSA (2012). Assessment of the Potential of Edible Oilseeds Produced in Tanzania: The Case of Sunflower and Sesame
TEOSA (2012). Edible Oilseeds Production in Tanzania: The Case of Sunflower and Sesame.
The Exchange (2016). Accessed on 20/06/16 at: http://exchange.co.tz/tanzania-project-to-increase-sugar-plants-to-meet-demand/.
TNS (2011). Tanzania dairy survey report.

109
UNIDO (2016) http://www.unido.org/news/press/tanzanias-sunflower-oil-producers-come-into-bloom.html
USAID (2010). Tanzania Coffee Industry Value Chain Analysis.
USDA (). Tanzania cotton sector update.
WGC Natural Fibres Worldwide (2015). Market report sisal. November 2014 – March 2015.
Wilson, R, Trevor; and Lewis, I (2015). The rice value chain in Tanzania.
Wood Family Trust (2015). 2014 Chairman’s review.
World Bank (2016). Doing Business 2016 Tanzania
World Bank. Accessed on July 4th, 2016 at: http://eba.worldbank.org/data/exploreeconomies/tanzania/
World Bank (2012). Agribusiness Indicators: Tanzania.

110
ANNEX H LIST OF STAKEHOLDERS CONSULTED
Table H.1: Stakeholders consulted during Tanzania Agribusiness Diagnostic phase 2
Organisation Sector
Hortanzia Horticulture
Norfund Development Finance Institution
Makuru farms Horticulture
Kibo seeds Agri-inputs
TAHA Horticulture
HomeVeg Tanzania Horticulture
Mount Meru Flowers Horticulture
Arusha Blooms Horticulture
Rijkzwan Afrisem Horticulture
Vision Fund Micro-finance Bank Micro-finance
Serengeti Fresh Horticulture
Africado Horticulture
MAC Group Multiple, incl. tea & sisal
Sumaria Multiple, incl. bottling
Africa Enterprise Challenge Fund Development Finance Institution
PASS (Private Agriculture Sector Support Trust) Development Finance Institution
CRDB Banking
Murzah Wilmar East Africa Multiple, incl. edible oils; milling
AgDevCo Venture capital firm
Anepa Food Products Edible oils
Coca Cola Kwanza Bottling
Serengeti Breweries Brewing
Clyde & Co. Tanzania Legal, transactions & advisory
Dutch Embassy -
Maris Capital Venture capital firm
Dekker Bruins Tanzania Horticulture
Tanzania Gatsby Trust Foundation
Kilombero Plantations Ltd (KPL) Rice
Sasuma / Thorncastle Fruit juice processing / wholesale market