Coefficient = solvency capital* in proportion to solvency limit

© 2010 The Actuarial Profession www.actuaries.org.uk
Challenges for GI Actuaries
GIRO conference and exhibition 2010Solvency II IMAP Working Party

Our brief
The internal model approval process forSolvency II presents a number ofspecific challenges for GI actuaries. Forexample, what level of documentation issufficient for a third party actuary to gaincomfort over the model? How are therequirements for risk ranking andcalibration being interpreted in practice?And what level/extent of use are firmstargeting?
In this update, we will cover
the results of our research(esurvey, face-face interviews);
possible approaches to keyquestions on calibration, expertjudgement, risk ranking, profitand loss attribution,documentation and the use test
1Solvency II: IMAP

Agenda
Chair
Introduction
Key areas of research
Calibration
Expert Judgement
Risk Ranking
P&L Attribution
Documentation
Close & Next Steps
Solvency II: IMAP2

Our focusBridging CEIOPS requirements and business/modelling reality
Questions
How are the requirementsbeing interpreted byexperienced modellers?
How is the industryapproaching the tests?
Topics
Calibration
Expert Judgement
Use Test
Risk Ranking
Profit & Loss Attribution
Documentation
Solvency II: IMAP3
The ‘hurdle’ for each model test is likely to emerge over the next 2-3years. Views expressed here are those of the working party members.

Business Reality – your plans for the use test40+ firms responded to our esurvey
Top 5 – Uses Top 5 - Influence
4Solvency II: IMAP
94%
90%
90%
87%
81%
Capital management
Businessplanning/strategy
Measurement ofmaterial risks
Reinsurance
Development andmonitoring of risk
appetite73%
77%
80%
83%
93%
Eficient use ofcapital/performance
measurement
Developing andmonitoring of risk
appetite
Reinsurance
Businessplanning/strategy
Capital management

© 2010 The Actuarial Profession www.actuaries.org.uk
Calibration

Approach to estimating 12 months capital still unclear – ifmuch discussed !
How do you interpret therequirement?
Almost all plan to produceSCR on S2 basis(99.5% VaR over 1 year timehorizon, liabilities measured toultimate)
Most were plan to use analternative measure foreconomic capital
Few had developed prototypeSCR calculations
How do you plan toadjust your ICA model to
calculate the SCR over a 1year time horizon and VaR
measure?Are you consideringusing a different time
period or risk measure, ifso, why?
6Solvency II: IMAP

One year calibration methods identified
Perfectforesight
7Solvency II: IMAP
Simulatedre-reserving
Proportionalemergence
Merz-Wuthrich(simulated)
Hindsightre-estimation
QIS 5 USPMethod 1
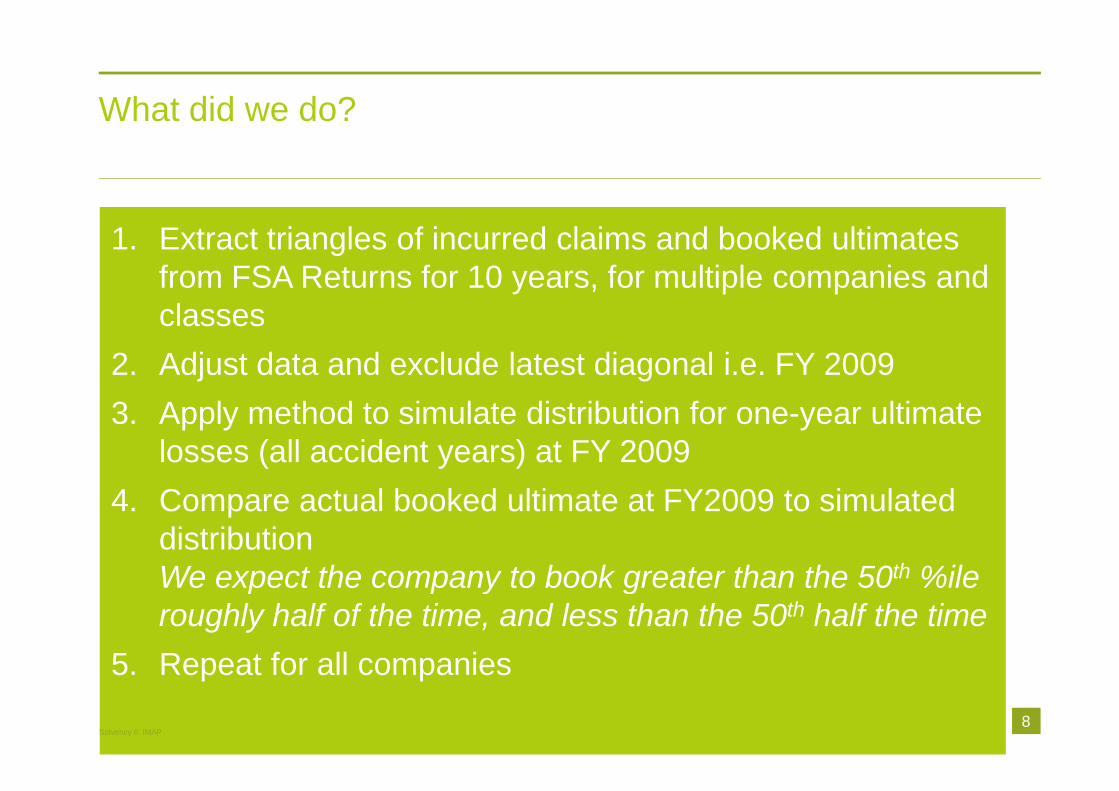
What did we do?
1. Extract triangles of incurred claims and booked ultimatesfrom FSA Returns for 10 years, for multiple companies andclasses
2. Adjust data and exclude latest diagonal i.e. FY 2009
3. Apply method to simulate distribution for one-year ultimatelosses (all accident years) at FY 2009
4. Compare actual booked ultimate at FY2009 to simulateddistributionWe expect the company to book greater than the 50th %ileroughly half of the time, and less than the 50th half the time
5. Repeat for all companies
8Solvency II: IMAP

Results – Incurred with a 10% reserve bias adjustment
One Year Calibration Predictiveness Test Results - Incurred with a 10%reserve bias adjustment
0.00%
10.00%
20.00%
30.00%
40.00%
50.00%
60.00%
70.00%
80.00%
90.00%
100.00%
0% 20% 40% 60% 80% 100%
Recognised Percentile
CD
F
Perfect foresight
Simulated Re-reserving (CL)
Hindsight Re-estimation
Ultimate Emergence
Reserve Emergence
Simulated M-W
QIS 5 USP Method 1
Y=X
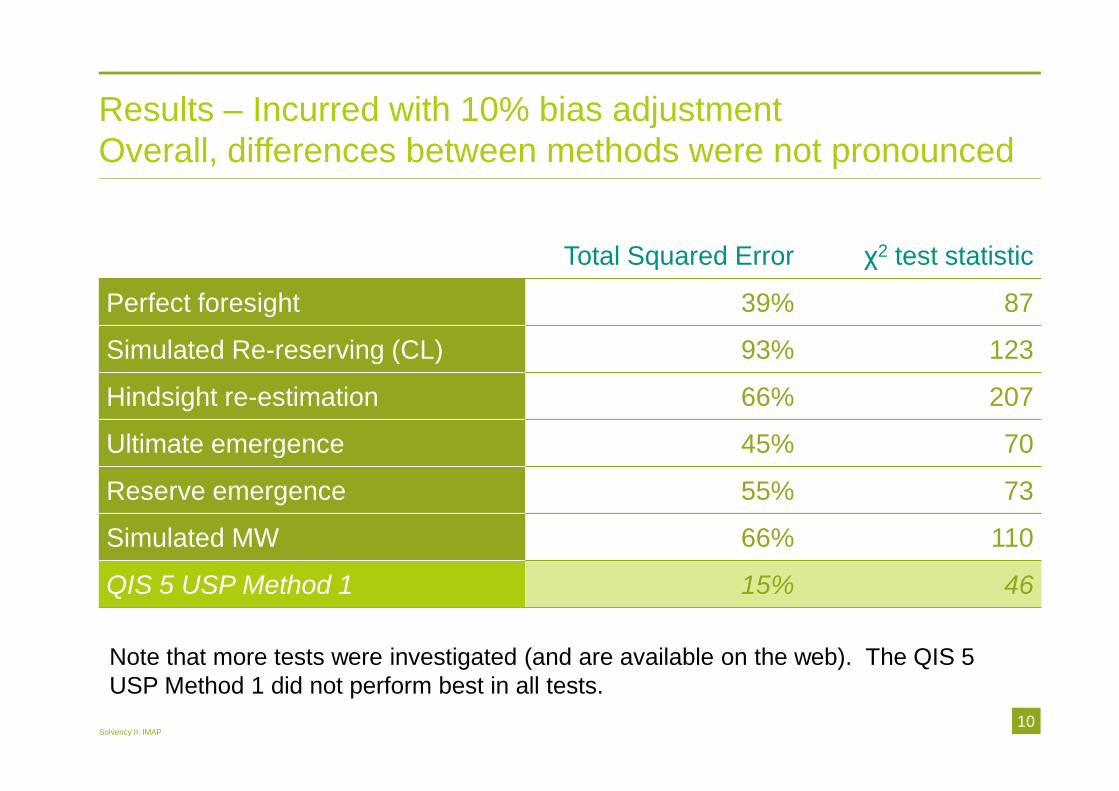
Results – Incurred with 10% bias adjustmentOverall, differences between methods were not pronounced
10Solvency II: IMAP
Total Squared Error χ2 test statistic
Perfect foresight 39% 87
Simulated Re-reserving (CL) 93% 123
Hindsight re-estimation 66% 207
Ultimate emergence 45% 70
Reserve emergence 55% 73
Simulated MW 66% 110
QIS 5 USP Method 1 15% 46
Note that more tests were investigated (and are available on the web). The QIS 5USP Method 1 did not perform best in all tests.

© 2010 The Actuarial Profession www.actuaries.org.uk
Expert Judgement

Scope of Expert Judgement
Our viewIt is sensible to include all expertjudgements, but if we do
Materiality and proportionalityare key
Where expert judgements arematerial, important to review anddocument thoroughly
Less detail needed if expertjudgement is less material
CEIOPS view
Do the requirements apply to
Data ...
or
… all expert judgements?
12Solvency II: IMAP

Independent review
– internal
– external
Other forms of validation
– Consideration of how well theassumption fits the data
– Comparison to other sources
– Back testing
What processes do or will you use to justify the expertjudgement, with respect to selection of data, methods,
parameters, or other areas?
13Solvency II: IMAP
Expert Judgement
How do you interpret the requirements?

Possible Process
1. Defineproblem orissue
14Solvency II: IMAP
2. Identifyappropriateexpert
3. Collectdata
5. Makejudgement
6.Document
7.Review
4. Analyseand considerdata
8. Sign offjudgement tobe used ininternal model

Key Issues
When is a judgement materialenough to document in detail?
Should the expert be:
– part of the risk managementfunction?
– business representative?
– part of the modelling team?
– external to the company?
How can you demonstrate thatsomeone is an expert?
What happens if experts disagree?
How do you allow for expertjudgement within change policy?
What are the implications if theexpert judgement is notcommissioned specifically for theinsurer?
How should you handle expertjudgements that are "inherited" fromexternal data or external models?
How easy is it to create a trackrecord of expert judgements?
What should the governancearrangements around the use ofexpert judgement look like?
15Solvency II: IMAP

© 2010 The Actuarial Profession www.actuaries.org.uk
Risk Ranking

What are our key risks? What are interrelationships? Do we model theseappropriately?
What are our most material risks? Do these drive the tail?
Does the model drive capital allocation?
Does the model reflect structure and nature of risks?
Needs to be a common sense and pragmatic solution
the ability of the internal model to rank risk shall besufficient to ensure that it is widely used in and plays an
important role ... their risk-management system and decision-making processes, and capital allocation” Article 121
17Solvency II: IMAP
Risk Ranking ....
How do you interpret the requirement?

Demonstrating that the model ranks risk appropriately –possible approaches
IndependentActuarialReview
18Solvency II: IMAP
Use ofResults
Analysis ofDrivers
Comparisonto RiskRegister
Stress andScenarioTesting
CoV, ReturnPeriod,CapitalAllocation
Review byManagement,Business orOperations
Risk ReturnMeasures

A worked example – Operational Risk
19Solvency II: IMAP
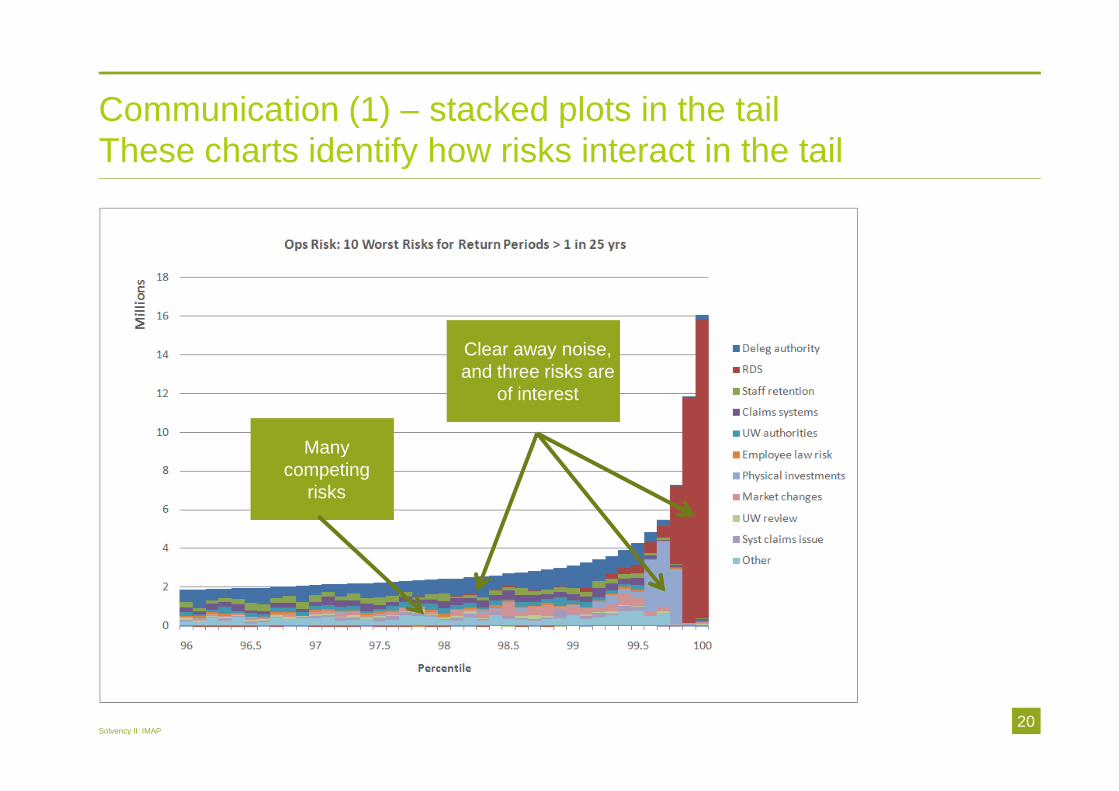
Manycompeting
risks
Clear away noise,and three risks are
of interest
Communication (1) – stacked plots in the tailThese charts identify how risks interact in the tail
Solvency II: IMAP20

Communication (2) – treemaps versus pie chartsTreemaps communicate relativities more effectively
21Solvency II: IMAP
vs
Note graphs show capital allocated by risk

Communication (3) – Frequency and Severity PlotsDrill down by function, or individual ...
Solvency II: IMAP22

© 2010 The Actuarial Profession www.actuaries.org.uk
Profit & Loss Attribution

“For each level of granularity, we will compare the actual profit or loss againstthe distribution of profit or losses projected by the model.”
“To support management in understanding the drivers of profitability”
“To validate the assumptions in the model against emerging experience”
Demonstrate how the categorisation of riskchosen in the internal model explains the causes and
sources of profits and losses. The categorisation of risk andattribution of profits and losses shall reflect the risk profile of
the insurance and reinsurance undertakings. Article 123
24Solvency II: IMAP
Profit and Loss Attribution ....
How do you interpret the requirement?

Graphical Display of Profitability
The variability in profit comes from avariety of sources:
Lines of business (ie. property,motor etc)
Risks (ie. non-life, market,operational etc.)
Terms of trade & commissionarrangements
Business Strategy
And can be controlled by levers thatcause profit variability:
Investment portfolio
Reinsurance protection
Pricing & underwriting
Terms of trade & commissionarrangements
Business Strategy
25Solvency II: IMAP

Graphical Display of Profitability
26Solvency II: IMAP
Pro
pe
rty
bu
sin
ess
Mo
tor
bu
sin
ess
Channel 1 Channel 2 Channel 3
Channel 1 Channel 2 Channel 3

Profit & Loss Attribution – a waterfall chart helps to track thekey movements in sources of profit from plan
This enables
– the business to understand the areas of the internal model where differences havearisen from what was expected
– the actuaries to backtest volatility assumptions in the model, by looking at year-onyear deviations, or more importantly trends
27Solvency II: IMAP

Profit & Loss Attribution – different approaches toimplementing the test
Challenges
Business Plan and CapitalAssessment may not bejoined up
SII analysis may not be seenas value add by management
Allocation of investment,expenses or reinsurance maybe arbitrary
Test increasingly spurious atlower levels of granularity
What trigger levels? Trendsor year on year deviations?
28Solvency II: IMAP
Definition of Profit
Solvency II
Accounting e.g. UK GAAP
Management e.g. UW Year
Granularity
By Entity, Division or LOB
Insurance, Investment oroperational results
Historical Data
• Current Year / Prior Years

© 2010 The Actuarial Profession www.actuaries.org.uk
Documentation

Documentation requirements ...
An independent,knowledgeablethird party can :
30Solvency II: IMAP
“form a sound judgment as to the reliability of the internalmodel ... and understand the reasoning and the underlyingdesign and operational details of the internal model.”Former CP56 9.53.
“understand the model framework, its methodology, theunderlying assumptions, and the limits of applicability of themodel” Former CP56 9.40
“use a different platform to build a consistent internal modelwithin a reasonable time period.” Former CP56 9.41
“in principle reproduce the model outputs if all theparameters and exposure data were available.” FormerCP56 9.40

Views from our surveyWhat do you need to form a sound judgement on the model?
Solvency II: IMAP31
KeyDocumentation
ModelPurposeand Uses
Clear AuditTrail
Plain Englishdescription
of themethodology
Flowchartsor Screenshots
Results
ValidationResults
(eg sensitivitytesting)
Access tomodel
Ability to runtesting andvalidation

Summary of CP requirements – Possible DocumentationFramework
Solvency II: IMAP32
Solvency II: IMAP

Our focusBridging CEIOPS requirements and business/modelling reality
Questions
How are the requirementsbeing interpreted byexperienced modellers?
How is the industryapproaching the tests?
Topics
Calibration
Expert Judgement
Use Test
Risk Ranking
Profit & Loss Attribution
Documentation
Solvency II: IMAP33
The working party continues next year –volunteers welcome !

Questions or comments?
Expressions of individual views by members ofThe Actuarial Profession and its staff areencouraged.
The views expressed in this presentation arethose of the presenters.
34© 2010 The Actuarial Profession www.actuaries.org.uk