GHG Mitigation Potential in Global Forests
26
1 Jayant A. Sathaye, Larry Dale, Willy Makundi and Peter Chan Lawrence Berkeley National Laboratory Berkeley, CA With input from Niels Anger, ZEW Inc. Germany and Ken Andrasko, US EPA (now at the World Bank), Washington DC Presented at World Bank, Washington, DC 27 May 2008 Work supported by US EPA, Climate Change Division. GHG Mitigation Potential in Global Forests
Transcript of GHG Mitigation Potential in Global Forests

1
Jayant A. Sathaye, Larry Dale, Willy Makundi and Peter Chan
Lawrence Berkeley National Laboratory
Berkeley, CA
With input from
Niels Anger, ZEW Inc. Germany and
Ken Andrasko, US EPA (now at the World Bank), Washington DC
Presented at
World Bank, Washington, DC
27 May 2008
Work supported by US EPA, Climate Change Division.
GHG Mitigation Potential in Global Forests

2
Contents
• GCOMAP Model Description
• Deforestation Processes and Costs
– GCOMAP analysis ongoing for the UK Eliasch and the
Australian Review
– What is magnitude of costs? Do these vary by region?
How good are the data?
• Post-Kyoto emissions trading and reducing
deforestation
– What is the fraction of 2020 Annex 1 emissions
reduction that reducing deforestation can contribute?
What is the impact of uncertain baselines?
• Summary and Conclusions

3
F7: Tropical Forestry and Global Climate Change Research Network – Initiated in 1990
• ASIA:
� CHINA -- Prof. Xu, Deying and Dr. Xiao-Quan Zhang, IPCC Lead Authors, LULUCF
Report, Forest Ecology and Environment Institute, Beijing
� INDIA -- Dr. N.H. Ravindranath , IPCC Coordinator LULUCF Report, CLA for Tech
Transfer, and LA for WGIII Report, Consultant to UNFCCC, Indian Institute of Science,
Bangalore
� INDONESIA -- Prof. Rizaldi Boer, Bogor Agriculture University, Bogor, GPG LA
� MALAYSIA -- Dr. Roslan Ismail, ITTO Board, IPCC LA, SustechAsia.com Sdn Bhd.
� PHILIPPINES -- Prof. Rodel Lasco, IPCC Lead Author, LULUCF Report, University of
the Philippines, Los Banos
• AFRICA:
� TANZANIA -- Dr.Willy Makundi, LULUCF, GPG CLA, and LA for Tech Transfer and
WGIII TAR and AR4
• LATIN AMERICA:
� MEXICO -- Prof. Omar Masera, IPCC CLA LULUCF and LA Tech Transfer and WG III
reports, National Autonomous University of Mexico -UNAM
� BRAZIL -- Dr. Philip Fearnside, IPCC, CLA LULUCF and LA WGII,
National Institute for Research in the Amazon (INPA), Manaus

4
GCOMAP Model
Characteristics
• Perfect foresight based on
investment theory
• Data mostly from F7
tropical country studies and
FAO global statistics
• Time horizon annual up to
2100
• 10 carbon pools tracked
annually
• 10 global regions; 4
deforestation regions
GCOMAP Model
Structure:
3 Modules
Land-use Module
Monetary Costs and Benefits
Module
Biomass and Carbon
Stock ChangeModule
•Forested area
•Planted and deforested land
•Maximum suitable land area
•Opportunity cost of land
•Land price supply curve
•Biomass yield •Rotation period
•Biomass and soil carbon•Timber product output and life •Non-timber product output
•Product demand and supply
•Planting and deforestation costs –fixed and annual•Timber and
non-timber product prices
Carbon price scenario (2000-2100)
Annual land use change and land price
Economic parameters
Annual product output
Annual land use change
Land and Carbon Gain (2000-2100)
DATA
Mitigation Scenario OnlyReference and Mitigation Scenarios
Social Welfare Change: Forest Sector
(2000-2100)
How much additional land area will be planted or
avoided from being deforested in response to C price scenario?

5
GCOMAP Scope
Mitigation Options Geographic Regions Carbon Pools
Forestation –
Short-rotation
Long-rotation
• Without biofuels
• With biofuels
(not analyzed
yet)
North America
South / Central
America
Europe
Russia (not FSU)
China
India
Australia/NZ
Asia-Pacific
Africa
Avoided deforestation
(no biofuels)
South / Central
America
Asia-Pacific
Africa
• Above/below
ground biomass
• Soils
• Litter
• Post-harvest
residue
• Domestic timber
products
• International
timber products
• Fuelwood
• Mill-waste
products
• Biofuels – used as
a substitute for
coal in power
plants
6
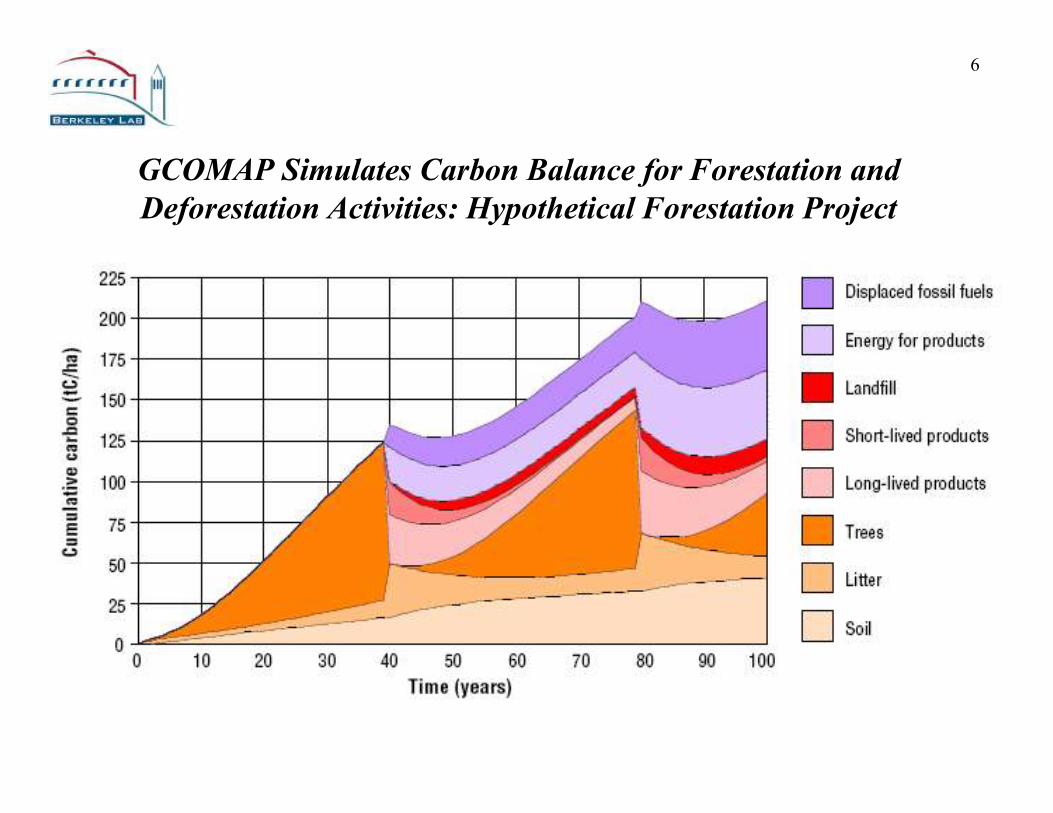
GCOMAP Simulates Carbon Balance for Forestation and
Deforestation Activities: Hypothetical Forestation Project

7
2. Deforestation
Drivers, Processes and Costs

8
Areas with high net change in forest area between
2000 and 2005• Global forest cover -- 3,952 million ha, about 30 percent of the world’s land area
• Net forest area loss was 7.3 million ha/yr compared to 8.9 million ha/yr in the 1990s
FAO, 2006

9
Long-run Baseline Setting a Challenge:Carbon balance of the land use change and forestry sector by region
(Positive Values = Emissions)
Tr. Asia
USATr. Africa
Tr. Am
China
Source: Houghton (2003)

10
GCOMAP Deforestation Rate: Historical and Projected
Region
Change in
Deforestation
Rate (%/yr)
Deforestation Rates (% / year)
1990 –00 2000 2020 2040 2050 2100
Africa + 0.026 0.80 1.29 0.78 0.65 0.26
Rest of Asia - 0.005 1.03 0.82 0.60 0.52 0.12
Central
America
- 0.011 1.19 0.97 0.75 0.65 0.37
South
America
- 0.030 0.40 0.26 0.21 0.20 0.13
The deforestation rate gives the percent decline in the forest area per year (-) rate is an annual decline in the deforestation rate Based on FAO 2001 – Forest Resource Assessment-2000; Kaimovitz 1996 Livestock and deforestation in Central America in 1980s and 1990s; Barraclough and Ghimire 2000. Agricultural Expansion and Tropical Deforestation
• Global deforestation 17 Mha/yr in 1990s; 13 Mha/yr in 2000-05 (FAO)
•Projected rate is an extrapolation of historical deforestation rate
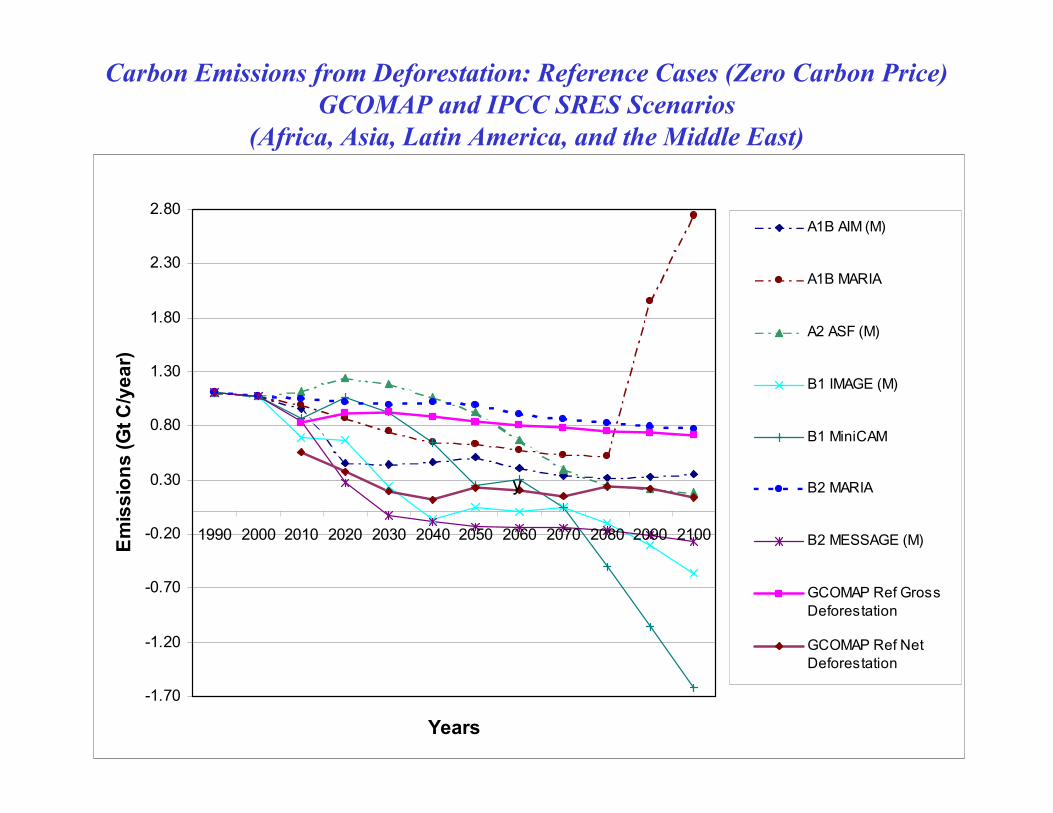
Carbon Emissions from Deforestation: Reference Cases (Zero Carbon Price)
GCOMAP and IPCC SRES Scenarios
(Africa, Asia, Latin America, and the Middle East)
-1.70
-1.20
-0.70
-0.20
0.30
0.80
1.30
1.80
2.30
2.80
1990 2000 2010 2020 2030 2040 2050 2060 2070 2080 2090 2100
Years
Emissions (Gt C/year)
A1B AIM (M)
A1B MARIA
A2 ASF (M)
B1 IMAGE (M)
B1 MiniCAM
B2 MARIA
B2 MESSAGE (M)
GCOMAP Ref Gross
Deforestation
GCOMAP Ref Net
Deforestation
y

12
Source: INPE, Brazil
Annual Deforestation in Legal Amazon
0
5,000
10,000
15,000
20,000
25,000
30,000
35,000
1988 1993 1998 2003
Sq. km
Annual Deforestation Rates Can Fluctuate WidelyBrazil Example: Price of agricultural products (soy) a key driver?

13
Deforestation Drivers and Land Use
• Initial Causes:
– Land settlement
– Shifting cultivation
– Infrastructure construction (roads, navigable rivers, dams, etc.)
• Logging (timber harvesting)
– May release significant carbon emissions
– Can be a high revenue activity
• Crops –
– Minimal carbon mitigation potential
• Grains – soy, rice, corn
• Other crops – cocoa, coffee
– Significant carbon mitigation potential
• Perennials – mango, oil palm, rubber
• Plantations – rubber, eucalyptus
• Agroforestry
• Cattle ranching – pasture land

14
Annual profit margins based on variable costs only:Cattle revenue is stable but lower over time
compared to crop revenue in Legal Amazon in Brazil
-10%
0%
10%
20%
30%
40%
50%
60%
70%
1998 1999 2000 2001 2002 2003 2004 2005 2006
Crops Cattle
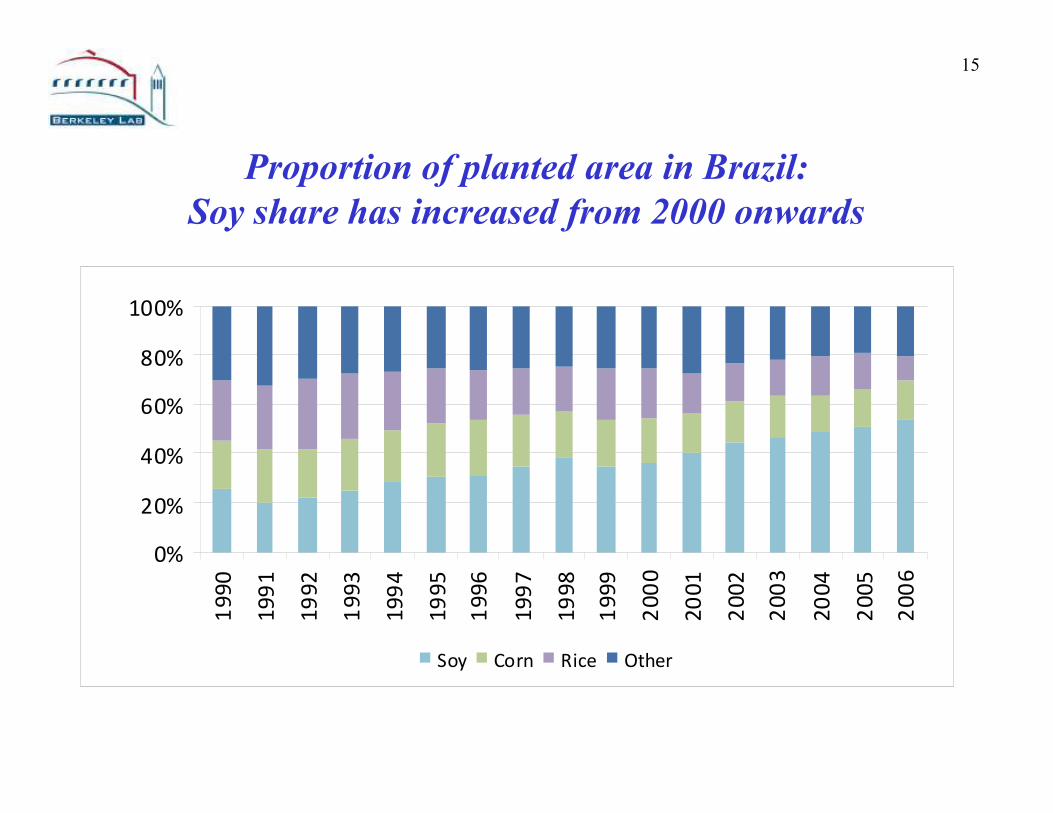
15
Proportion of planted area in Brazil:
Soy share has increased from 2000 onwards
0%
20%
40%
60%
80%
100%
1990
1991
1992
1993
1994
1995
1996
1997
1998
1999
2000
2001
2002
2003
2004
2005
2006
Soy Corn Rice Other

16
Deforestation Processes Opportunity Costs
• Shares of forest land that are undergoing these processes?
– Yucatan – Large fraction of the land is already logged, subsistence
agriculture and cattle ranching are being practiced, opportunity costs could
be low
– Sumatra – Combination of illegal logging and planting of crops ongoing,
opportunity costs could be high but so could the mitigation potential
– DR Congo – Logging, exports of logs and subsistence agriculture is
ongoing, opportunity costs could be high
– Tanzania – Subsistence agriculture, low opportunity cost
• Preliminary Findings:
– Across Africa, Central America, SE Asia, and South America opportunity
costs for agricultural products range around $300 per ha
• Subsistence agriculture by itself has much lower opportunity cost
– Big uncertainty -- % of area harvested for timber and current status of
areas that are deforestation candidates
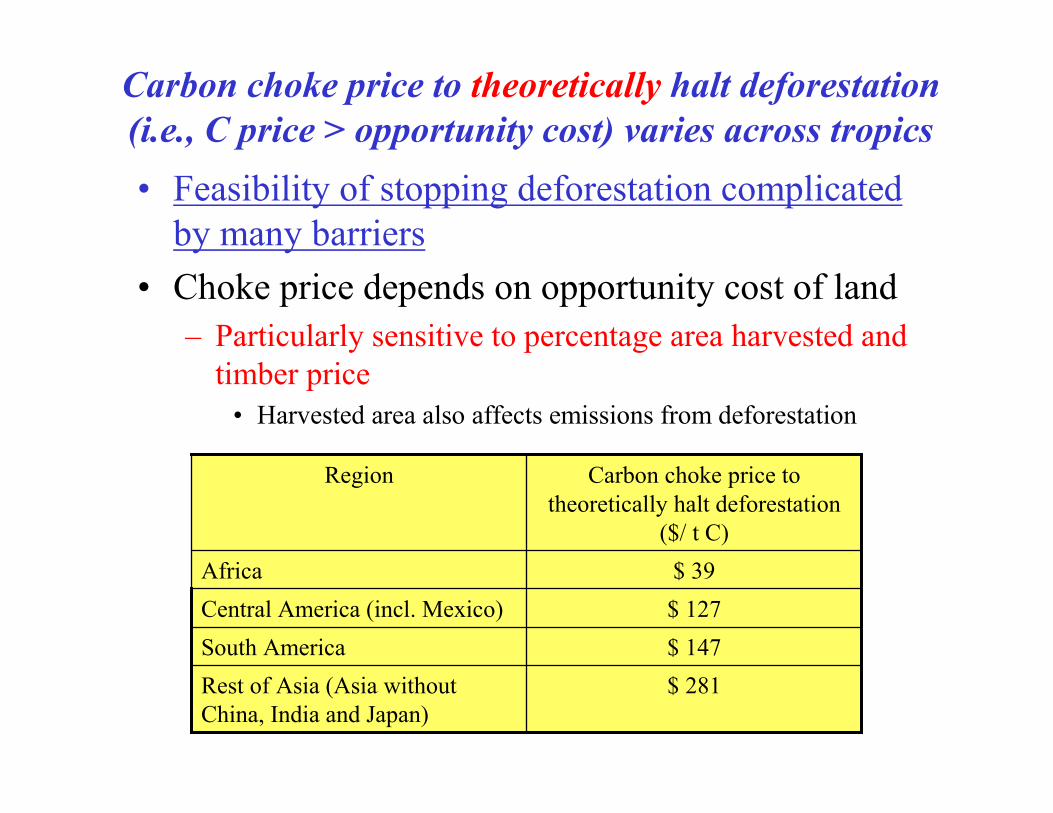
Carbon choke price to theoretically halt deforestation
(i.e., C price > opportunity cost) varies across tropics
• Feasibility of stopping deforestation complicated
by many barriers
• Choke price depends on opportunity cost of land
– Particularly sensitive to percentage area harvested and
timber price
• Harvested area also affects emissions from deforestation
$ 281Rest of Asia (Asia without
China, India and Japan)
$ 147South America
$ 127Central America (incl. Mexico)
$ 39Africa
Carbon choke price to
theoretically halt deforestation
($/ t C)
Region

18
Transaction Costs (TC)*
Influence Supply of Traded Carbon
Supply with transaction costsRange varies withProject size?Current vs. mature market?Project type?Region?
Demand
Supply
Transaction Cost
Emissions Reduction from REDD Projects/Programs
Transaction costs
* TC includes search, feasibility studies, regulatory approvals,
monitoring and verification, negotiation, and insurance.

19
Findings: Transaction Costs of Projects
• Project sizes range from 0.02 to 6.0 million t C over project life
• Transaction costs range from
– $0.18/t C for large forestry projects to $ 4.5/t C for smaller ones
– Transaction costs are lower in US and higher in developing countries
– 1% to 19% of project costs for forestry projects
• Implications
– Programmatic approaches and large scale projects are to be preferred
– Relative to carbon prices of projects to date TR costs are small
– Carbon mitigation potential is not likely to be reduced significantly by TR
costs
Source: Antinori and Sathaye (2007)

20
Post-Kyoto Emissions Trading and
Reducing Deforestation
� Analysis evaluates the benefits of CDM trading and reducing
deforestation assuming that EU and selected large Annex I countries
reduce emissions by 33% by 2020 relative to 1990.
�Models used:
�SIMAC: Numerical multi-country partial equilibrium
model of the global carbon market in 2020 (Anger 2007,
Böhringer et al. 2005)
�GCOMAP

21
CDM + reduced deforestation:
Emission reductions
Emission reductions in 2020 (% vs. BAU)
0
10
20
30
40
50
60
70
80
Emissions
trading
[AnnexB]
CDM
access
[AnnexB]
AvDeforest
high TC
[AnnexB]
AvDeforest
low TC
[AnnexB]
AnnexBAfricaSouth-East AsiaCentral AmericaSouth America
Reduced deforestation
CDM
PARALLEL trading
TC: Transaction Costs

22
Offset credit exports (positive) and imports
(negative) by region (Mt CO2)
-2000
-1500
-1000
-500
0
500
1000
1500
CDM regions Africa South-East Asia Central America South America
CDM [EU++]
Deforestation_highTC [EU++]
Deforestation_lowTC [EU++]
Annex B
TC: Transaction Costs
CDM Regions: Brazil, China, India, Mexico and South Korea

23
Alternative deforestation baselines:
Net offset-credit exports by region (Mt CO2)
-2000
-1500
-1000
-500
0
500
1000
CDM regions Africa South-East Asia Central America South America
Deforestation_lowBase [EU++]
Deforestation_highBase [EU++]
Annex B
24
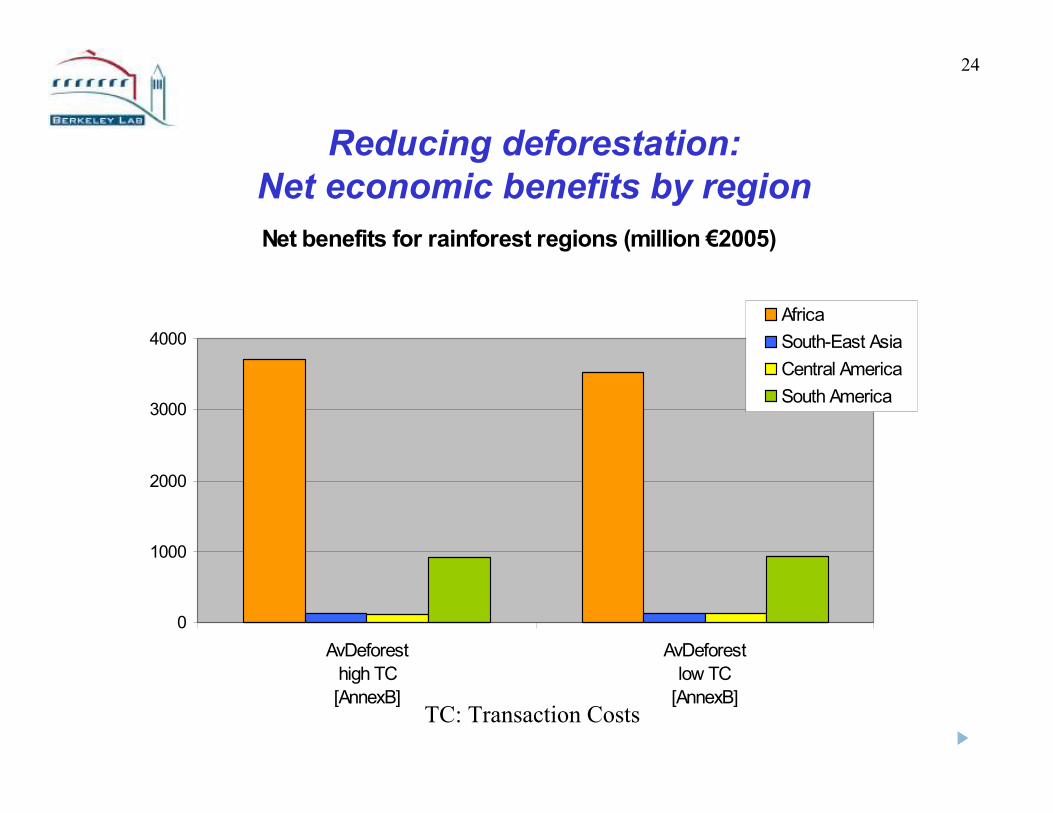
Reducing deforestation:
Net economic benefits by region
Net benefits for rainforest regions (million €2005)
0
1000
2000
3000
4000
AvDeforest
high TC
[AnnexB]
AvDeforest
low TC
[AnnexB]
Africa
South-East Asia
Central America
South America
TC: Transaction Costs
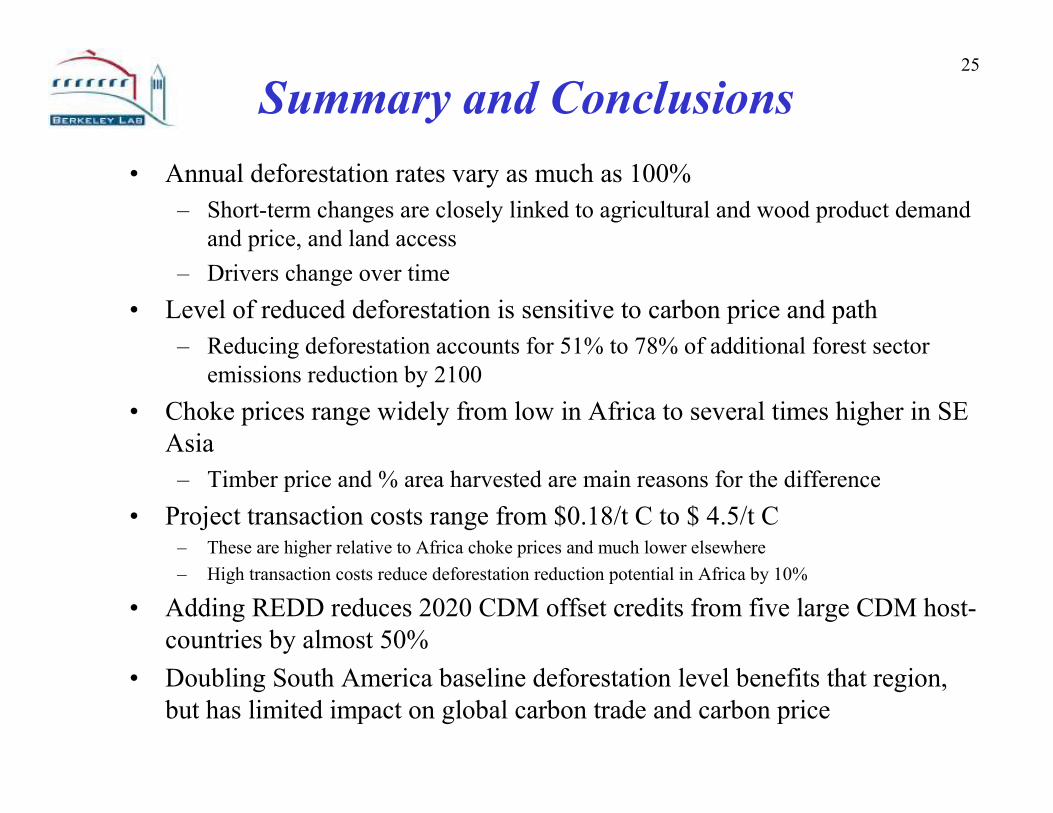
25
Summary and Conclusions
• Annual deforestation rates vary as much as 100%
– Short-term changes are closely linked to agricultural and wood product demand
and price, and land access
– Drivers change over time
• Level of reduced deforestation is sensitive to carbon price and path
– Reducing deforestation accounts for 51% to 78% of additional forest sector
emissions reduction by 2100
• Choke prices range widely from low in Africa to several times higher in SE
Asia
– Timber price and % area harvested are main reasons for the difference
• Project transaction costs range from $0.18/t C to $ 4.5/t C– These are higher relative to Africa choke prices and much lower elsewhere
– High transaction costs reduce deforestation reduction potential in Africa by 10%
• Adding REDD reduces 2020 CDM offset credits from five large CDM host-
countries by almost 50%
• Doubling South America baseline deforestation level benefits that region,
but has limited impact on global carbon trade and carbon price
26
Thank you
Jayant Sathaye
http://ies.lbl.gov