Overview of WRI GHG Protocol Mitigation Accounting Standards
36
Apurba Mitra World Resources Institute Overview of WRI GHG Protocol Mitigation Accounting Standards
Transcript of Overview of WRI GHG Protocol Mitigation Accounting Standards
Apurba MitraWorld Resources Institute
Overview of WRI GHG Protocol Mitigation Accounting Standards

• Introduction to WRI, GHG Protocol, and Mitigation Accounting Project
• Overview of GHG Protocol Policy and Action Standard • Overview of GHG Protocol Mitigation Goals Standard• Q & A
Agenda

Introduction to WRI, GHG Protocol, and GHG Protocol Mitigation Accounting Project

• The GHG Protocol was launched in 1998 by
• Multi-stakeholder partnership of businesses, NGOs, governments and others
• Enable corporate and government measurement and management practices that lead to a low carbon economy
The Greenhouse Gas Protocol

Corporate Standard
Corporate Value Chain (Scope 3) StandardProject Protocol
Product Standard
GHG Protocol standards to date
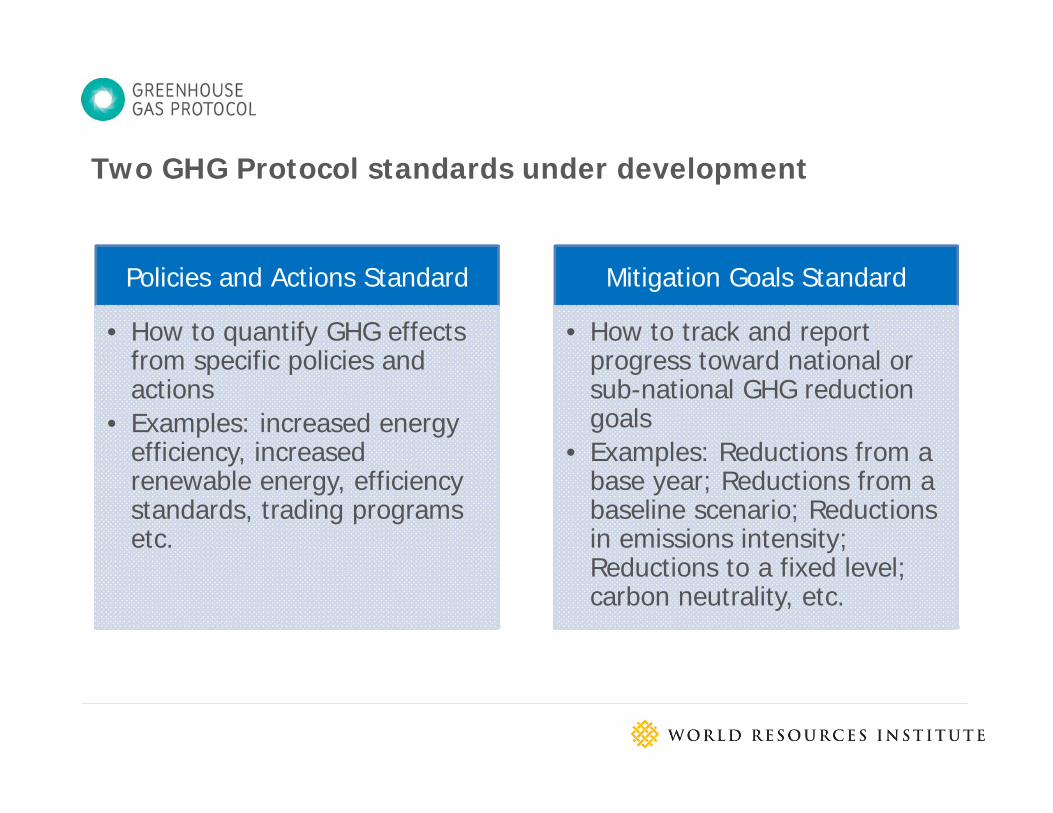
Two GHG Protocol standards under development
Policies and Actions Standard
• How to quantify GHG effects from specific policies and actions
• Examples: increased energy efficiency, increased renewable energy, efficiency standards, trading programs etc.
Mitigation Goals Standard
• How to track and report progress toward national or sub-national GHG reduction goals
• Examples: Reductions from a base year; Reductions from a baseline scenario; Reductions in emissions intensity; Reductions to a fixed level; carbon neutrality, etc.

• New types of GHG reduction goals (intensity, BAU, carbon neutrality, etc.)
• Increasing need to quantify GHG effects of policies and actions (larger than projects)
– Domestic policy design and tracking
– NAMAs
– New market-based mechanisms
• Lack of consistency and transparency
• Lack of capacity
• No international guidelines
Context

Standard development process
Secretariat (WRI)
Advisory Committee (30)
Technical Working Groups (100)
Review Group (150+)
Pilot Testers (20+)
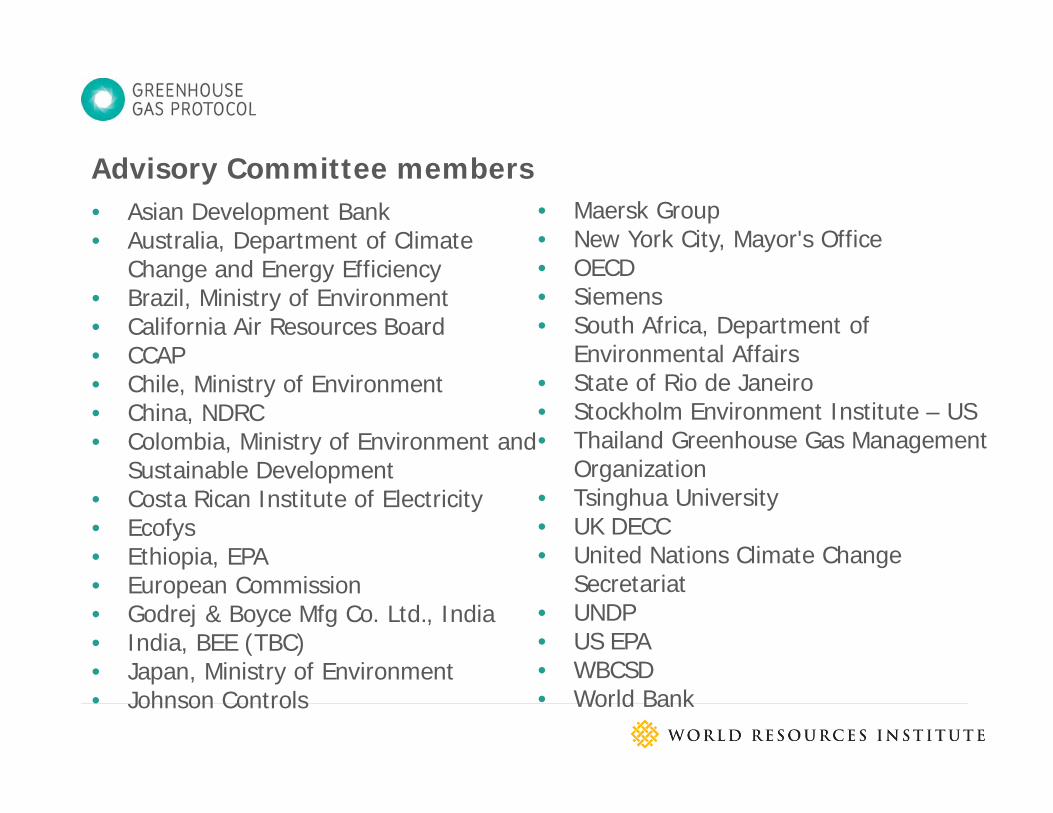
• Asian Development Bank• Australia, Department of Climate
Change and Energy Efficiency• Brazil, Ministry of Environment • California Air Resources Board• CCAP• Chile, Ministry of Environment• China, NDRC• Colombia, Ministry of Environment and
Sustainable Development• Costa Rican Institute of Electricity• Ecofys• Ethiopia, EPA• European Commission• Godrej & Boyce Mfg Co. Ltd., India• India, BEE (TBC)• Japan, Ministry of Environment• Johnson Controls
Advisory Committee members• Maersk Group• New York City, Mayor's Office • OECD• Siemens• South Africa, Department of
Environmental Affairs• State of Rio de Janeiro • Stockholm Environment Institute – US• Thailand Greenhouse Gas Management
Organization• Tsinghua University• UK DECC• United Nations Climate Change
Secretariat• UNDP• US EPA• WBCSD• World Bank

Timeline
Activities 2012 2013 2014
Q1 Q2 Q3 Q4 Q1 Q2 Q3 Q4 Q1 Q2 Q3 Q4
Convene stakeholder groups
Develop draft standards
First drafts releasedWorkshops (Doha, Washington, Beijing) and review period
Revise draft standards
Pilot test standards
Public comment period
Publish final standards

• Belgium – off-shore wind, roof insulation
• Brazil – city of Rio• Brazil – state of Rio• Colombia – national, transport policy• Colombia – Medellin, transport policy• Chile – national BAU goal• Chile – energy sector NAMA• China – national power sector policies• Costa Rica – coffee sector NAMA• Ethiopia – national goal• Ethiopia – land use/forestry policy• India – TBD
Pilot testing
• Indonesia – TBD • Israel – national goal • Israel – energy policy • Mexico – Mexico City -
transport policy• South Africa – Mining sector,
information instruments• US – Seattle, city goal• Cities (C40) - TBD• Tunisia- Solar PV• Bangladesh- technology
improvement
GHG Protocol Policy and Action Standard
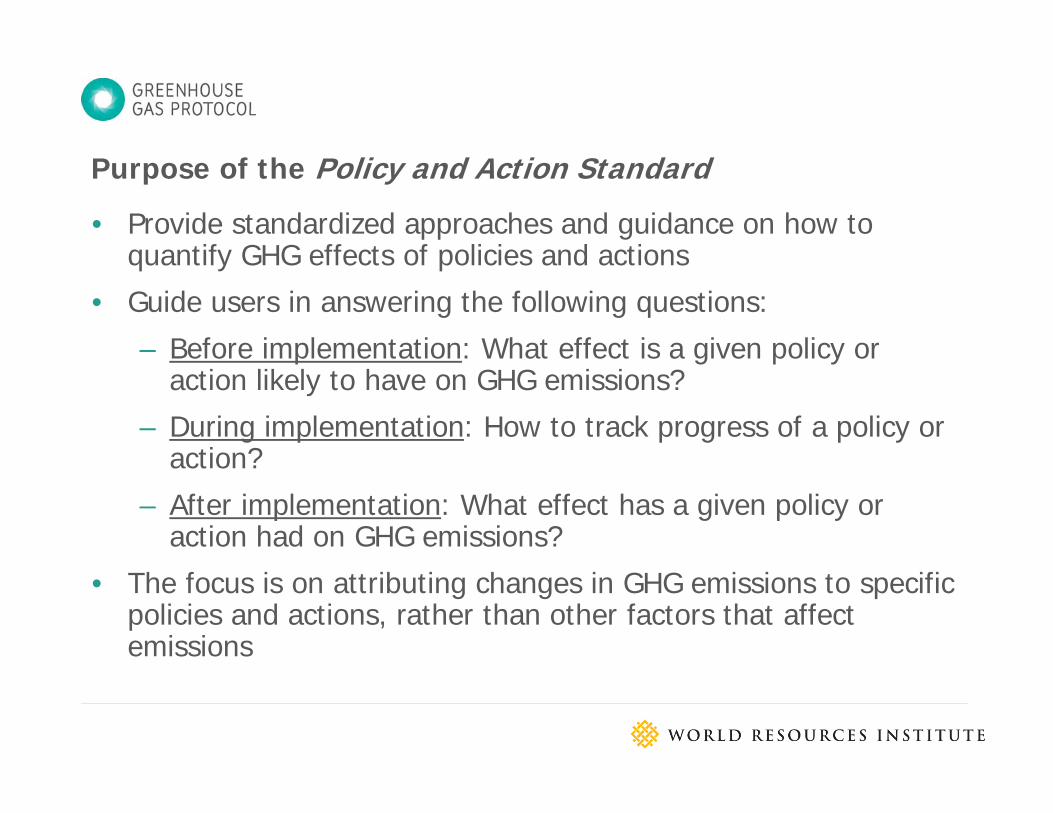
• Provide standardized approaches and guidance on how to quantify GHG effects of policies and actions
• Guide users in answering the following questions:
– Before implementation: What effect is a given policy or action likely to have on GHG emissions?
– During implementation: How to track progress of a policy or action?
– After implementation: What effect has a given policy or action had on GHG emissions?
• The focus is on attributing changes in GHG emissions to specific policies and actions, rather than other factors that affect emissions
Purpose of the Policy and Action Standard

• Inform mitigation strategies based on expected GHG effects of policies/actions (ex-ante)
• Track effectiveness and performance of policies/actions (ex-post)
• Report on GHG effects of policies/actions
• Facilitate financial support for mitigation actions (e.g., NAMAs) based on quantification of GHG reductions
Objectives of quantifying GHG effects of policies/actions

Intended users
• Governments (city, sub-national, national)• Donor agencies and financial institutions• Businesses• NGOs/research institutions
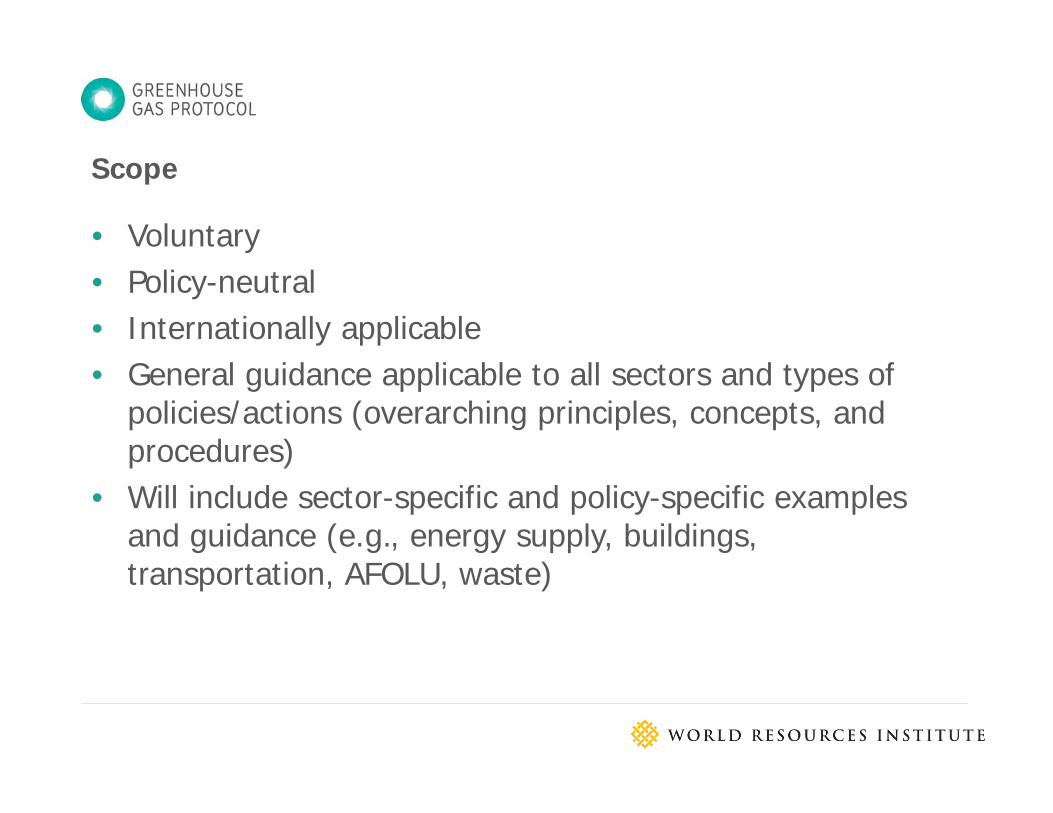
• Voluntary• Policy-neutral• Internationally applicable• General guidance applicable to all sectors and types of
policies/actions (overarching principles, concepts, and procedures)
• Will include sector-specific and policy-specific examples and guidance (e.g., energy supply, buildings, transportation, AFOLU, waste)
Scope
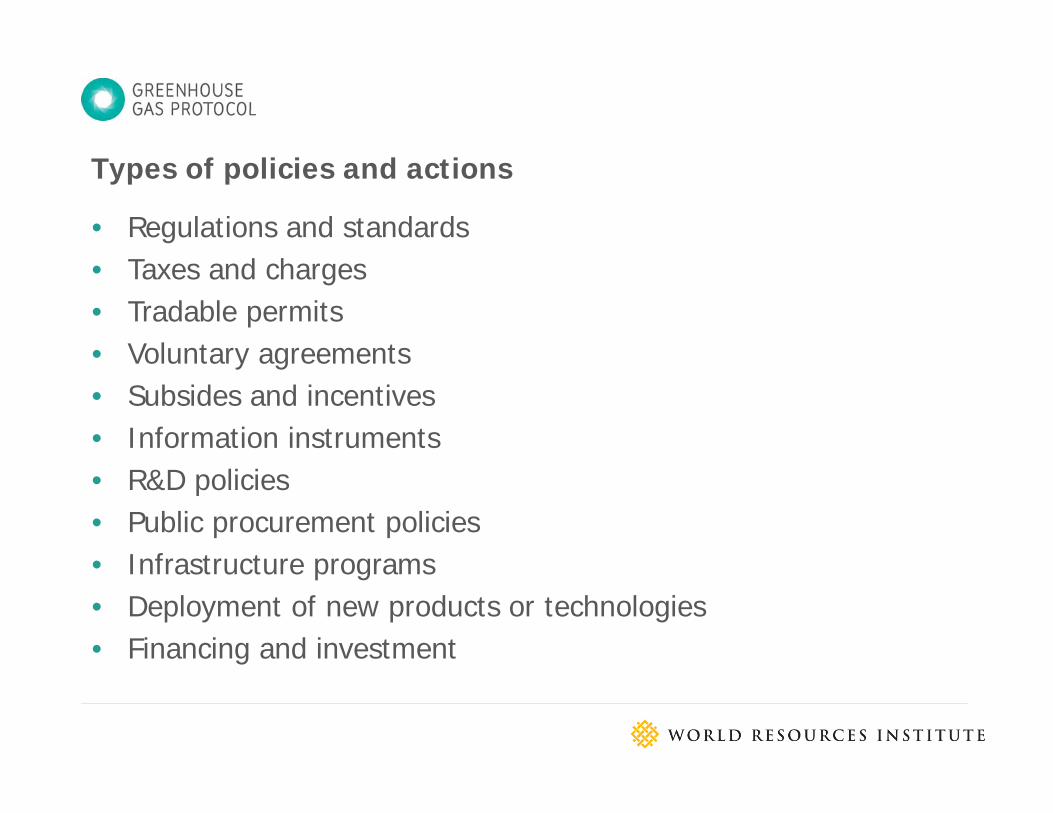
• Regulations and standards• Taxes and charges• Tradable permits• Voluntary agreements• Subsides and incentives• Information instruments• R&D policies• Public procurement policies• Infrastructure programs• Deployment of new products or technologies• Financing and investment
Types of policies and actions

Table of contents and sequence of steps
1. Introduction2. Objectives3. Key concepts, overview of steps, and summary of requirements4. Accounting and reporting principles5. Defining the policy or action6. Mapping the causal chain7. Defining the GHG assessment boundary8. Quantifying baseline emissions9. Quantifying GHG effects ex-ante10. Quantifying GHG effects ex-post11. Collecting data and monitoring performance over time12. Assessing uncertainty13. Verification14. Reporting

• The standard presents a range of methods depending on users’ objectives
Tiered approach
TierLevel of accuracy/ completeness
GHG assessment boundary
Quantification method Data sources
1 Lowest Less complete
Less accurate methods (e.g., simplified approaches)
Less accurate data (e.g., global average data, estimated data)
2 Intermediate Intermediate completeness
Intermediate accuracy
Mix of data sources and quality (e.g., country-specific data)
3 Highest Most complete
Most accurate methods (e.g., complex approaches)
Most accurate data (e.g., source-specific data)

Mapping the causal chain
• Key step: identifying potential effects of the policy or action
• Types of effects to consider– Intended effects and unintended effects– In-jurisdiction effects and out-of-jurisdiction effects– Short-term effects and long-term effects– GHG-increasing effects and GHG-decreasing effects
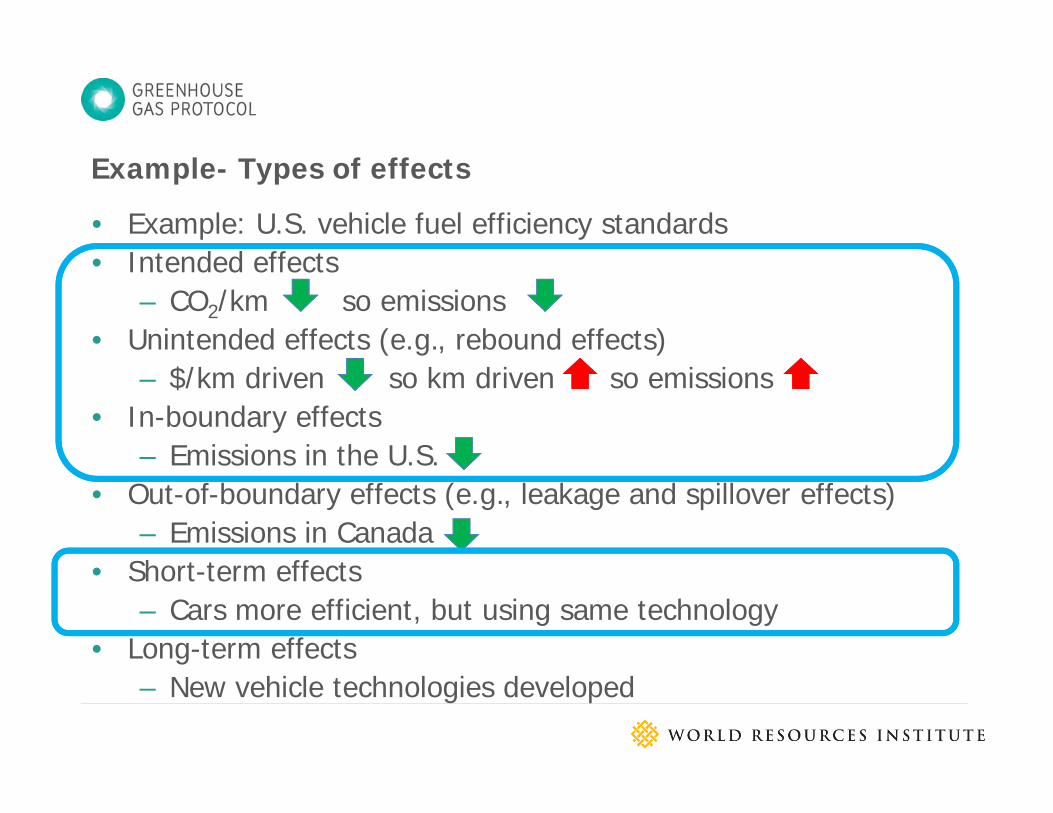
Example- Types of effects
• Example: U.S. vehicle fuel efficiency standards• Intended effects
– CO2/km so emissions• Unintended effects (e.g., rebound effects)
– $/km driven so km driven so emissions • In-boundary effects
– Emissions in the U.S. • Out-of-boundary effects (e.g., leakage and spillover effects)
– Emissions in Canada • Short-term effects
– Cars more efficient, but using same technology• Long-term effects
– New vehicle technologies developed
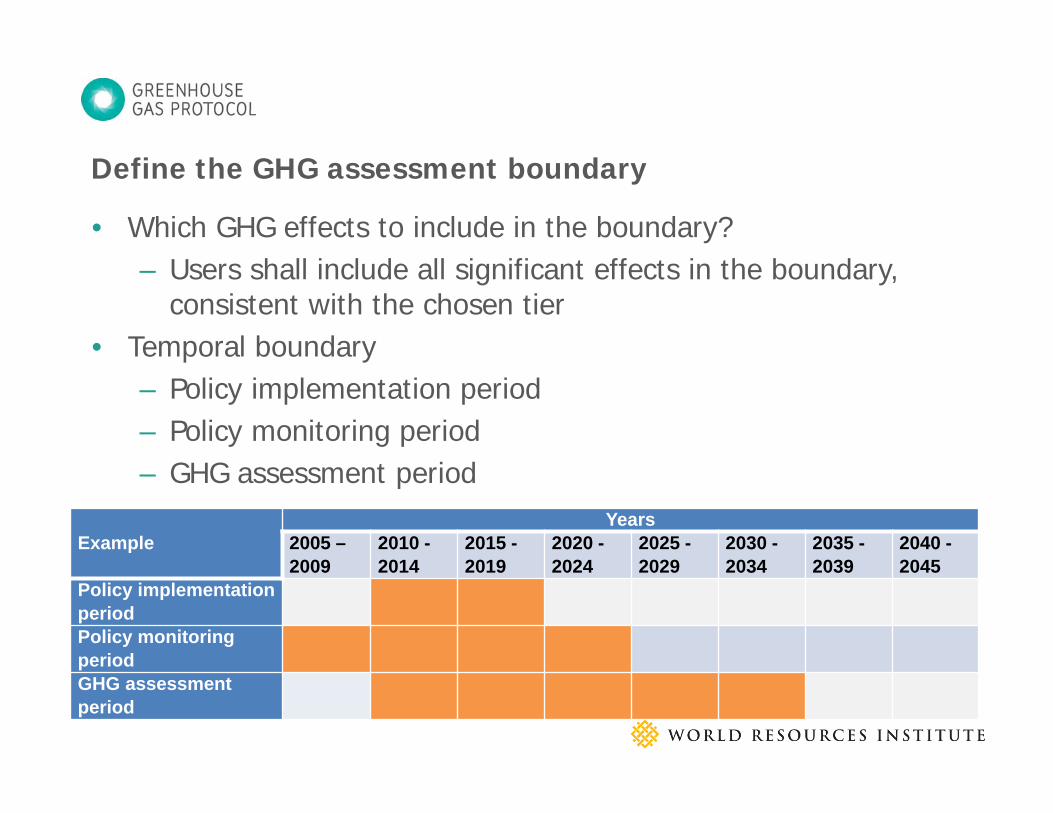
• Which GHG effects to include in the boundary?– Users shall include all significant effects in the boundary,
consistent with the chosen tier• Temporal boundary
– Policy implementation period– Policy monitoring period– GHG assessment period
Define the GHG assessment boundary
ExampleYears
2005 –2009
2010 -2014
2015 -2019
2020 -2024
2025 -2029
2030 -2034
2035 -2039
2040 -2045
Policy implementation periodPolicy monitoring periodGHG assessment period

• Define the baseline scenario– For each effect, define baseline emissions based on
underlying drivers• Other policies• non-policy drivers
• Define the policy scenario (ex-ante or ex-post)– Define emissions in the policy scenario based on what
is expected to change as a result of the policy
Quantify GHG effects of the policy or action

Ex-ante and ex-post assessmentG
HG
em
issi
ons
(met
ric to
ns C
O2e
)
Quantified GHG effect of policy/action (ex-ante)Historical
GHG emissions
2010 2015 2020
Quantified GHG effect of policy/action (ex-post)

Independent Overlapping Reinforcing
Policy interactions
Policy X
Policy Y
Policy X
Policy Y
Policy X
Policy Y
Combined effect > X + YCombined effect < X + YCombined effect = X + Y

GHG Protocol Mitigation Goals Standard

• Provide standardized approaches and guidance
• How to quantify GHG reductions and track progress toward national and sub-national GHG mitigation goals
• Guide users in answering the following questions:
– For jurisdictions that do not have a mitigation goal: Which factors to consider when developing a mitigation goal
– Before the goal period: How to estimate future emission levels and GHG reductions associated with meeting the goal
– During the goal period: How to track and report progress toward meeting the goal
– After the goal period: How to evaluate and report whether the goal has been achieved
Purpose of Mitigation Goals Standard
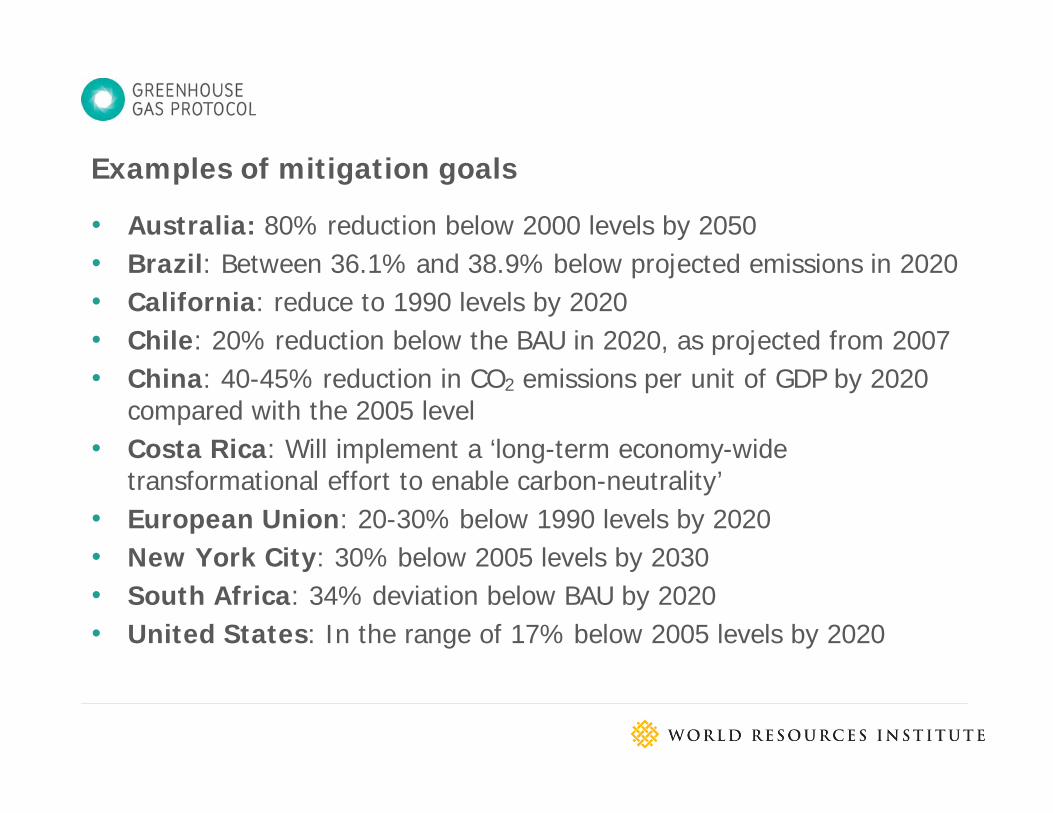
• Australia: 80% reduction below 2000 levels by 2050• Brazil: Between 36.1% and 38.9% below projected emissions in 2020• California: reduce to 1990 levels by 2020• Chile: 20% reduction below the BAU in 2020, as projected from 2007• China: 40-45% reduction in CO2 emissions per unit of GDP by 2020
compared with the 2005 level• Costa Rica: Will implement a ‘long-term economy-wide
transformational effort to enable carbon-neutrality’• European Union: 20-30% below 1990 levels by 2020• New York City: 30% below 2005 levels by 2030• South Africa: 34% deviation below BAU by 2020• United States: In the range of 17% below 2005 levels by 2020
Examples of mitigation goals

Example: Tracking progress toward NYC’s 30% reduction goal
Source: City of New York, 2013

• Internationally applicable• Applicable to all levels of government (municipal, subnational,
national)• Four types of mitigation goals
– Reductions from a base year– Reductions from a baseline scenario– Reductions in emissions intensity– Reductions to a fixed level
• Economy-wide and sectoral goals
Scope

1. Develop a GHG inventory2. Define geographic boundary3. Choose sectors included4. Decide on the treatment of the land use sector5. Choose direct/indirect emissions included6. Choose GHGs included7. Choose mitigation goal type8. Choose single or multi-year goal9. Choose and estimate base year/baseline scenario emissions10.Choose target year/period11.Consider use of transferable emissions units12.Define the goal level
Regardless of pledge type, following steps need to take place to design a pledge

• Ex ante estimation• Tracking progress during the period• Ex post evaluation
After design of target
• For each goal type, the GHG Protocol Mitigation Goals Standard provides calculations for:– Expected emissions level in the target year associated with meeting the
target– Expected emissions reductions needed to meet the goal

• Ex ante estimation• Tracking progress during the period• Ex post evaluation
After design of target
• For each goal type, the GHG Protocol Mitigation Goals Standard provides calculations for:– Change in emissions since base year– Additional emissions reductions necessary to meet target
• Including with adjustments for transferable emissions units and the land use sector

• Ex ante estimation• Tracking progress during the period• Ex post evaluation
After design of target
• For each goal type, the GHG Protocol Mitigation Goals Standard provides calculations for:– Whether the goal has been achieved– Total emissions and removals in the target year/period– Cumulative changes over the goal period
• Including with adjustments for transferable emissions units and the land use sector

To download the draft standards:
www.ghgprotocol.org/mitigation-accounting