LNG Facility GHG Mitigation Options - Government of Nova Scotia
65
LNG Facility GHG Mitigation Options Government of Nova Scotia 15-Jun-16
-
Upload
marcellus-drilling-news -
Category
News & Politics
-
view
234 -
download
0
Transcript of LNG Facility GHG Mitigation Options - Government of Nova Scotia

LNG Facility GHG Mitigation Options
Government of Nova Scotia
15-Jun-16

DISCLAIMER
The information, concepts and recommendations expressed in this document are based on information
available at the time of the preparation of this document. Action or abstinence from acting based on
the opinions and information contained in this document are the sole risk of the reader and Delphi shall
have no liability for any damages or losses arising from use of the information and opinions in this
document. All information is provided “as is” without any warranty or condition of any kind. The
document may contain inaccuracies, omissions or typographical errors.
Copyright © 2015 The Delphi Group
All rights reserved. The use of any part of this document, whether it is reproduced, stored in a retrieval
system, or transmitted in any form or means (including electronic, mechanical, photographic,
photocopying or recording), without the prior written permission of The Delphi Group is an infringement
of copyright law.
428 Gilmour Street
Ottawa, ON K2P 0R8 Canada
Tel.: (613) 562-2005
Fax: (613) 562-2008
www.delphi.ca
Stephan Wehr

Page i
Nova Scotia LNG Facility GHG Mitigation Options Report
EXECUTIVE SUMMARY
Introduction
Liquefaction of natural gas to liquefied natural gas (LNG) facilitates transportation to overseas markets,
thereby increasing the market potential for North America’s abundant supply of natural gas. Canadian
regulators have received proposals for LNG liquefaction and export facilities to be located on the east and
west coasts of Canada, including Nova Scotia. LNG production is an energy intensive process, and
therefore LNG facilities are expected to be large emitters of greenhouse gases (GHGs).
To better understand potential GHG emissions impacts1 and options for reducing them, the Nova Scotia
government engaged strategic consultancy The Delphi Group to prepare a report that:
Provides background on LNG facilities, key GHG emission sources, and typical ways of quantifying
emissions;
Identifies and assesses potential technology and operational policy and practice options for
reducing emissions; and
Estimates the GHG emissions intensity of hypothetical LNG liquefaction facilities in Nova Scotia
for different facility designs, including ‘standard’, ‘no regrets’, and ‘beyond no regrets’ options,2
and how the emissions could compare to other North American and global facilities.
LNG Facility Overview
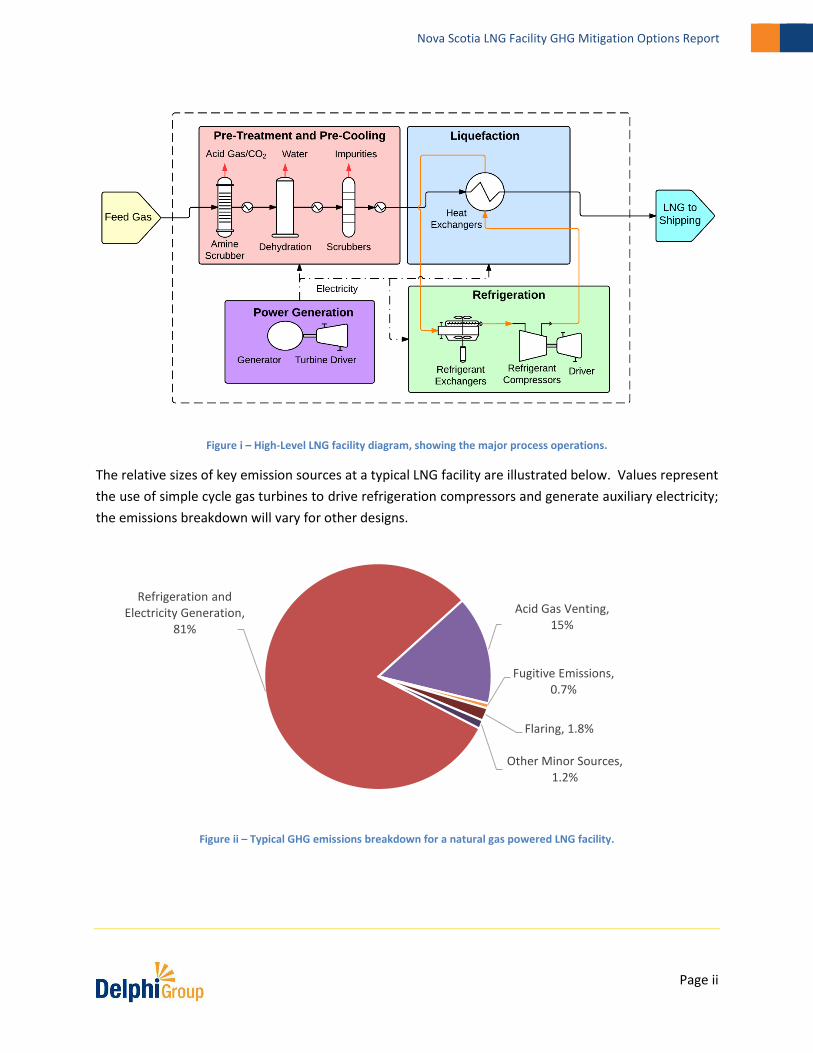
The conversion of natural gas to LNG involves two primary steps: treatment of the feed natural gas to
reduce impurities (notably CO2) that interfere with liquefaction, followed by liquefaction, which reduces
the temperature to approximately -162oC.
The figure below presents a high-level diagram of the natural gas liquefaction process, organized into four
main facility sections: pre-treatment and pre-cooling; liquefaction; refrigeration; and, power generation.
1 Please note that the scope of this report covers liquefaction facility operations, but does not include broader ‘value-chain’ or life cycle emissions associated with gas extraction, processing, and transport; transport of LNG to markets; or end use by consumers. 2 No regrets and beyond no regrets refer to technologies that have higher capital costs than those in a ‘standard’ or typical facility, but improve facility efficiency and thereby lead to fuel cost savings. No regrets technologies can be expected to have a payback period acceptable to LNG proponents. Beyond no regrets technologies will result in lower GHG emissions than no regrets, but payback periods are longer. Refer to Section 4 for further details and criteria for categorizing technologies as standard, no regrets, or beyond no regrets.
Page ii
Nova Scotia LNG Facility GHG Mitigation Options Report
Figure i – High-Level LNG facility diagram, showing the major process operations.
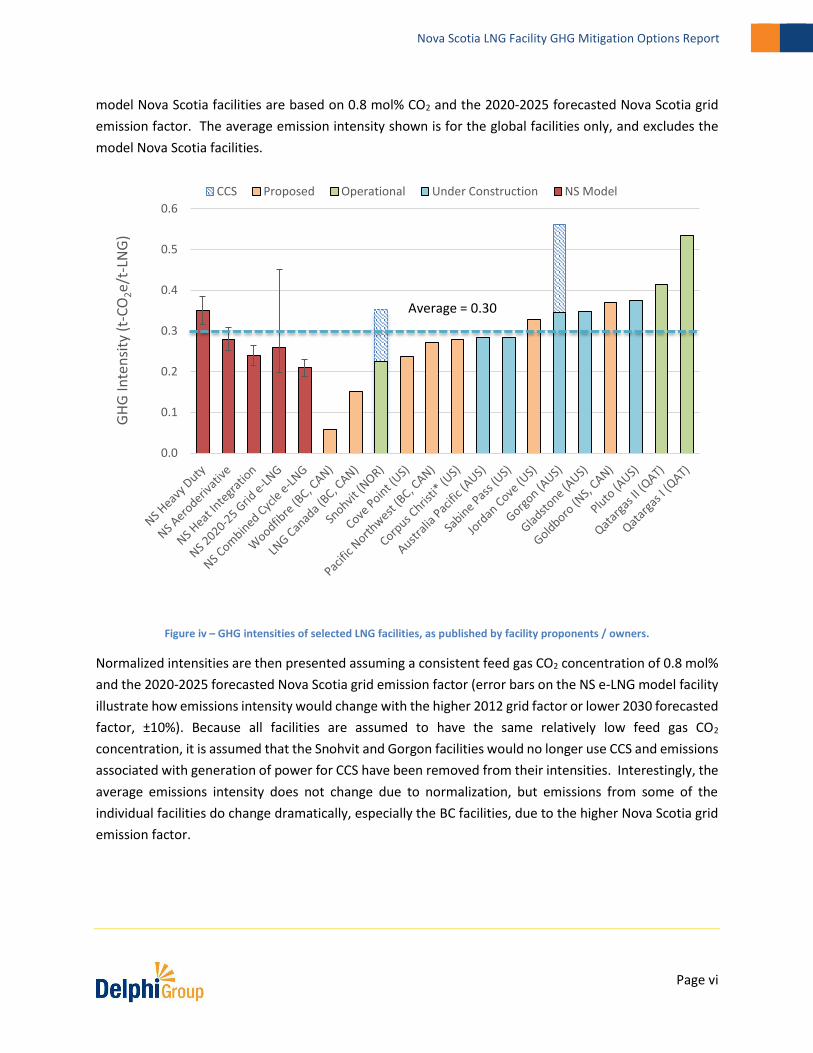
The relative sizes of key emission sources at a typical LNG facility are illustrated below. Values represent
the use of simple cycle gas turbines to drive refrigeration compressors and generate auxiliary electricity;
the emissions breakdown will vary for other designs.
Figure ii – Typical GHG emissions breakdown for a natural gas powered LNG facility.
Refrigeration and Electricity Generation,
81%
Acid Gas Venting, 15%
Fugitive Emissions, 0.7%
Flaring, 1.8%
Other Minor Sources, 1.2%

Page iii
Nova Scotia LNG Facility GHG Mitigation Options Report
Factors Impacting LNG Facility GHG Emissions
Factors influencing emissions at LNG facilities can be broken into two general categories, as summarized below.
1) Environmental, Public Policy and Situational Factors (outside of LNG proponent control)
a. Feed gas composition – the concentrations of CO2 as well as other impurities. Removed CO2 is typically vented, resulting in GHG emissions, and all impurities require energy use (and thus emissions) to remove. Nova Scotia facilities are expected to use pipeline-quality gas that has already had CO2 and other impurities reduced to some degree during upstream gas processing. Some global facilities accept raw unprocessed gas with potentially significantly elevated amounts of CO2.
b. Ambient temperature – while the impacts are complex and difficult to generalize, lower ambient air temperatures can improve turbine and cooling efficiency. Seasonal and daily temperature fluctuations can as a result influence facility efficiency. Nova Scotia’s relatively lower temperatures compared to other, often warmer, global locations with LNG facilities should be an advantage.
c. Electricity grid – if a LNG facility uses grid electricity for some or all of its energy needs, emissions will directly depend on the mix of grid connected power generation types and the associated emissions intensity. Currently, Nova Scotia’s coal-dominated electrical grid is very carbon intensive, but this is expected to drop rapidly in the coming years as more renewables are introduced.
d. Public policy – while not directly impacting emissions, policies such as regulated emission targets or carbon taxes change the economics of design options with different efficiency levels and emissions profiles, which can reduce barriers to adopting less carbon-intensive options.
2) Design and Technological Factors (within LNG proponent control)
a. Liquefaction process – choice of refrigerant and related design considerations tends to have relatively limited impact on GHG emissions, since associated technologies have been refined and optimized over many years and have similarly high efficiencies for medium-to-large sized facilities.
b. Refrigeration power source – this is the most significant factor impacting emissions. A typical 10 million tonne LNG per annum (mtpa) facility could require over 300 MW of compression energy. Primary options include ‘direct drive’ compressors powered by heavy duty or aeroderivative (more efficient) natural gas-fired turbines, or electric motors (e-drive) powered by either grid electricity or self-generated electricity.
c. Auxiliary electricity source – a smaller but still significant energy demand and source of emissions, typically over 100 MW for a 10 mtpa facility. Primary options include heavy duty and aeroderivative turbines, combined cycle gas turbines (more efficient than

Page iv
Nova Scotia LNG Facility GHG Mitigation Options Report
‘simple cycle’ heavy duty and aeroderivative turbine options), grid electricity, or generation using waste heat (see below).
d. Heat integration – most new facilities already recover waste heat for use in acid gas (CO2, H2S) removal and gas dehydration; more advanced designs will generate electricity using waste heat from direct drive compressor turbines.
e. Other options – various other design options are available, but reductions are typically very modest or not applicable to a Nova Scotia context (e.g. carbon capture and storage, due to an expected lack of suitable geologic formations in Nova Scotia).
Model Nova Scotia LNG Facilities
The various design and technology options were classified as ‘standard’, ‘no regrets’, or ‘beyond no
regrets’ based on a consideration of the prevalence of the technologies, CAPEX and OPEX, and technical
barriers. Five different hypothetical Nova Scotia facility models were created based on the classifications.
The models summarized below, with estimated emissions intensities presented in the subsequent graph.
Table i – Technological characteristics of the Nova Scotia model facilities.
Compressor Driver
Electricity Source Waste Heat Recovery Classification
Heavy Duty Heavy Duty
Turbines Heavy Duty
Turbines Yes, for inlet gas
conditioning units Standard
Aeroderivative Aeroderivative
Turbines Aeroderivative
Turbines Yes, for inlet gas
conditioning units No Regrets
Advanced Heat Integration
Heavy Duty Turbines
Steam Electricity Generation
Yes, for electricity generation
No Regrets
Grid e-LNG Electric Motors Grid Electricity Not applicable Beyond No Regrets
Combined Cycle e-LNG
Electric Motors Outside the Fence Combined Cycle
Power Plant
Yes, in the combined cycle power plant for electricity generation
Beyond No Regrets

Page v
Nova Scotia LNG Facility GHG Mitigation Options Report
Figure iii – GHG intensities of the modelled hypothetical Nova Scotia LNG facilities.
The above intensities were calculated based on an assumed 0.8 mol% CO2 in the feed gas. In the case of
the grid-connected e-LNG facility model, the emissions intensity was estimated using three different Nova
Scotia grid electricity emission factors, including the historic 2012 factor and projections for the 2020-
2025 and 2030 periods. The factors reflect a gradual reduction in emissions intensity as additional
renewables are added to the Nova Scotia grid. Error bars on the graphs represent a standard ±10%
uncertainty.
LNG Facility Benchmarking
The model Nova Scotia facilities were then compared against the emissions intensities observed or
anticipated from a select group of 15 leading North American and global facilities that are currently
operating, under construction, or at the design stage. The facilities examined represent a subset of the
total number of global facilities, and exclude a number of older (and typically more emissions intensive)
facilities. Benchmarking results are presented in three ways in the graphs below.
First, emissions intensities are presented as published in environmental assessment reports or similar
public reports, based on conditions (e.g. feed gas CO2, grid emission factor) present in each facility’s local
jurisdiction. Note that the impact of carbon capture and storage (CCS) is displayed for those facilities
employing the technology (such facilities have very high feed gas CO2 concentrations). Intensities for the
0.00
0.10
0.20
0.30
0.40
0.50
GH
G In
ten
sity
(t-
CO
2e/
t-LN
G)
2012 Grid
2020-2025 Grid
2030Grid
Page vi
Nova Scotia LNG Facility GHG Mitigation Options Report
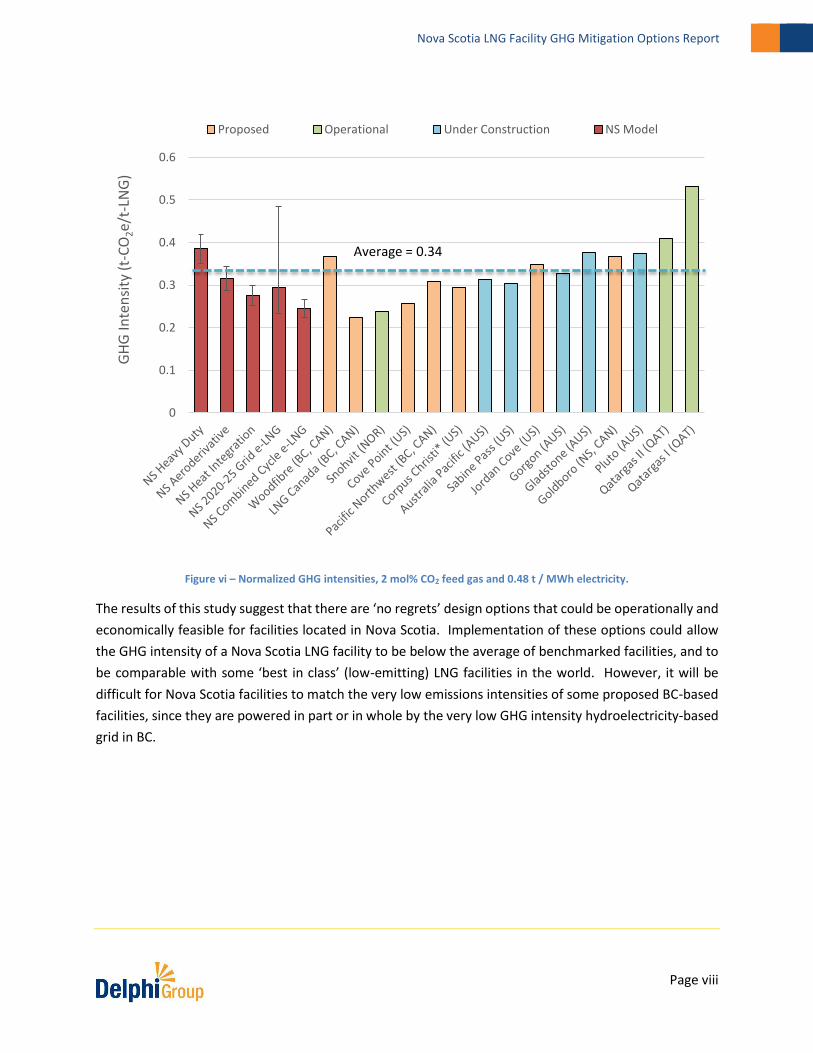
model Nova Scotia facilities are based on 0.8 mol% CO2 and the 2020-2025 forecasted Nova Scotia grid
emission factor. The average emission intensity shown is for the global facilities only, and excludes the
model Nova Scotia facilities.
Figure iv – GHG intensities of selected LNG facilities, as published by facility proponents / owners.
Normalized intensities are then presented assuming a consistent feed gas CO2 concentration of 0.8 mol%
and the 2020-2025 forecasted Nova Scotia grid emission factor (error bars on the NS e-LNG model facility
illustrate how emissions intensity would change with the higher 2012 grid factor or lower 2030 forecasted
factor, ±10%). Because all facilities are assumed to have the same relatively low feed gas CO2
concentration, it is assumed that the Snohvit and Gorgon facilities would no longer use CCS and emissions
associated with generation of power for CCS have been removed from their intensities. Interestingly, the
average emissions intensity does not change due to normalization, but emissions from some of the
individual facilities do change dramatically, especially the BC facilities, due to the higher Nova Scotia grid
emission factor.
0.0
0.1
0.2
0.3
0.4
0.5
0.6
GH
G In
ten
sity
(t-
CO
2e/
t-LN
G)
CCS Proposed Operational Under Construction NS Model
Average = 0.30

Page vii
Nova Scotia LNG Facility GHG Mitigation Options Report
Figure v – Normalized GHG intensities, 0.8 mol% CO2 feed gas and 0.48 t / MWh electricity.
Finally, normalized results are presented in the same manner as the previous graph, but with a higher 2
mol% CO2 concentration assumed, to illustrate the impact of increased CO2 emissions from acid gas
removal that would occur with a higher feed gas CO2 concentration. The average emissions intensity of
the benchmarked facilities increases from 0.30 to 0.34 t CO2e/t LNG with the increase from 0.8 to 2 mol%
CO2 in the feed gas.
0
0.1
0.2
0.3
0.4
0.5
0.6
GH
G In
ten
sity
(t-
CO
2e/
t-LN
G)
Proposed Operational Under Construction NS Model
Average = 0.30
Page viii
Nova Scotia LNG Facility GHG Mitigation Options Report
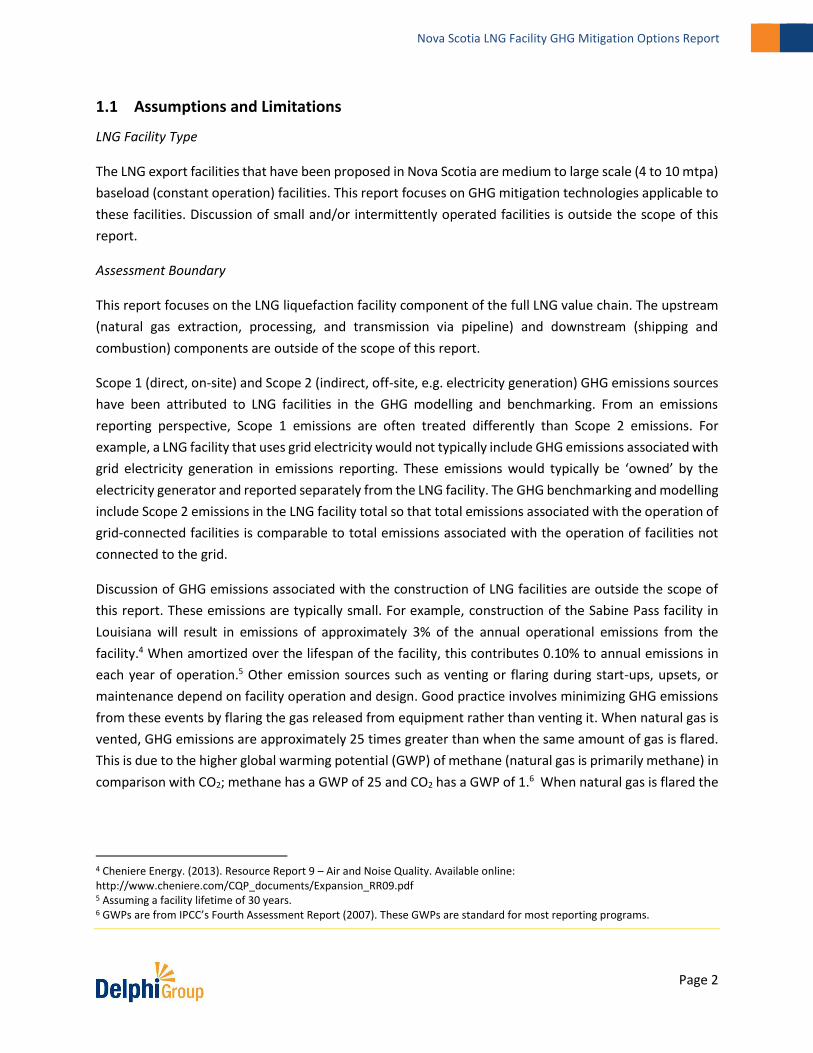
Figure vi – Normalized GHG intensities, 2 mol% CO2 feed gas and 0.48 t / MWh electricity.
The results of this study suggest that there are ‘no regrets’ design options that could be operationally and
economically feasible for facilities located in Nova Scotia. Implementation of these options could allow
the GHG intensity of a Nova Scotia LNG facility to be below the average of benchmarked facilities, and to
be comparable with some ‘best in class’ (low-emitting) LNG facilities in the world. However, it will be
difficult for Nova Scotia facilities to match the very low emissions intensities of some proposed BC-based
facilities, since they are powered in part or in whole by the very low GHG intensity hydroelectricity-based
grid in BC.
0
0.1
0.2
0.3
0.4
0.5
0.6
GH
G In
ten
sity
(t-
CO
2e/
t-LN
G)
Proposed Operational Under Construction NS Model
Average = 0.34

Page ix
Nova Scotia LNG Facility GHG Mitigation Options Report
TABLE OF CONTENTS
Executive Summary .......................................................................................................................... i
Table of Contents ............................................................................................................................ ix
1 Introduction ............................................................................................................................. 1
1.1 Assumptions and Limitations ........................................................................................................ 2
2 LNG Facility Overview .............................................................................................................. 4
2.1 LNG Facility Site............................................................................................................................. 4
2.2 LNG Facility Process Overview ...................................................................................................... 5
2.3 LNG Facility GHG Emissions .......................................................................................................... 8
3 Factors Impacting LNG Facility GHG Emissions ..................................................................... 10
3.1 Environmental, Public Policy and Situational Factors ................................................................. 10
3.1.1 Feed Gas Composition ........................................................................................................ 10
3.1.2 Ambient Temperature ........................................................................................................ 12
3.1.3 Electricity Grid ..................................................................................................................... 13
3.1.4 Public Policy ........................................................................................................................ 15
3.2 Design and Technological Factors ............................................................................................... 16
3.2.1 Liquefaction Processes ........................................................................................................ 16
3.2.2 Refrigeration Power Source ................................................................................................ 20
3.2.3 Source of Electricity ............................................................................................................ 22
3.2.4 Heat Integration / Heat Recovery ....................................................................................... 23
3.2.5 Other GHG Mitigation Technologies ................................................................................... 24
3.2.6 Future LNG Technologies .................................................................................................... 25
4 Model Nova Scotia LNG Facilities .......................................................................................... 26
4.1.1 Evaluation of Refrigeration Power Source Options ............................................................ 27
4.1.2 Evaluation of Electricity Source Options ............................................................................. 30
4.1.3 Evaluation of Heat Integration / Heat Recovery Options ................................................... 32
4.2 Nova Scotia Model Facilities ....................................................................................................... 32
4.3 GHG Intensities of Model Facilities ............................................................................................. 36
5 LNG Facility Benchmarking .................................................................................................... 38
5.1 LNG Facilities Benchmarking ....................................................................................................... 38

Page x
Nova Scotia LNG Facility GHG Mitigation Options Report
5.2 Normalized LNG Facilities Benchmarking ................................................................................... 41
6 Measurement and Reporting Considerations ....................................................................... 43
6.1 Assessment boundary ................................................................................................................. 43
6.2 Quantification methods .............................................................................................................. 44
6.3 Reported Emissions ..................................................................................................................... 47
7 References ............................................................................................................................. 48
Figures
Figure i – High-Level LNG facility diagram, showing the major process operations..................................... ii
Figure ii – Typical GHG emissions breakdown for a natural gas powered LNG facility. ............................... ii
Figure iii – GHG intensities of the modelled hypothetical Nova Scotia LNG facilities. ................................. v
Figure iv – GHG intensities of selected LNG facilities, as published by facility proponents / owners. ........ vi
Figure v – Normalized GHG intensities, 0.8 mol% CO2 feed gas and 0.48 t / MWh electricity................... vii
Figure vi – Normalized GHG intensities, 2 mol% CO2 feed gas and 0.48 t / MWh electricity. ................... viii
Figure 1 – Proposed site of the Bear Head LNG facility. ............................................................................... 4
Figure 2 – Proposed site of the Goldboro LNG facility.................................................................................. 5
Figure 3 – High-level LNG facility schematic. ................................................................................................ 6
Figure 4 – Typical GHG emissions breakdown for a natural gas powered LNG facility. ............................... 8
Figure 5 – GHG emissions intensity of acid gas removal for raw gas facilities and pipeline gas facilities. . 11
Figure 6 – Seasonal temperature profile and corresponding theoretical maximum facility output for a
5mtpa facility. ............................................................................................................................................. 13
Figure 7 – Cumulative installed capacity of liquefaction processes. .......................................................... 16
Figure 8 – Liquefaction processes by train capacity. .................................................................................. 17
Figure 9 – LNG process cycle efficiencies for commonly used LNG processes. .......................................... 18
Figure 10 – Source of refrigeration power at LNG facilities, by year of commissioning. ........................... 28
Figure 11 – Electricity source at new facilities, by year of commissioning. ................................................ 30
Figure 12 – Heat recovery for process heating at new facilities, by year of commissioning. ..................... 32
Figure 13 – Heavy duty LNG facility schematic. .......................................................................................... 34
Figure 14 – Aeroderivative LNG facility schematic. .................................................................................... 34

Page xi
Nova Scotia LNG Facility GHG Mitigation Options Report
Figure 15 – Advanced heat recovery LNG facility schematic. ..................................................................... 35
Figure 16 – Grid electricity e-drive LNG facility schematic. ........................................................................ 35
Figure 17 – Combined cycle e-drive LNG facility schematic. ...................................................................... 36
Figure 18 – GHG intensities of Nova Scotia model facilities. ...................................................................... 37
Figure 19 – GHG intensities of selected LNG facilities, as published. ......................................................... 38
Figure 20 – Normalized intensities of selected LNG facilities, 0.8 mol% CO2 feed gas and 2020-25 NS grid
factor. .......................................................................................................................................................... 41
Figure 21 – Normalized intensities of selected LNG facilities, 2 mol% CO2 feed gas and 2020-25 NS grid
factor. .......................................................................................................................................................... 42
Tables
Table i – Technological characteristics of the Nova Scotia model facilities. ................................................ iv
Table 1 – Technological characteristics of the Nova Scotia model facilities. ............................................. 33
Table 2 – Technical information for global facilities benchmarked. ........................................................... 40
Table 3 – Measurement and reporting considerations - quantification methods. .................................... 44


Page 1
Nova Scotia LNG Facility GHG Mitigation Options Report
1 INTRODUCTION
Liquefaction of natural gas to liquefied natural gas (LNG) facilitates transportation to overseas markets,
thereby increasing the market potential for North America’s abundant supply of natural gas. Canadian
regulators have received proposals for LNG export facilities to be located on the east and west coasts of
Canada, including Nova Scotia.
LNG production is an energy intensive process, and therefore LNG facilities are expected to be large
emitters of greenhouse gases (GHGs). Some jurisdictions, such as a British Columbia, expect to see
significant growth in the LNG industry and have implemented GHG performance expectations based on
the carbon footprint (GHG intensity, tonne-CO2e / tonne-LNG produced) of the facility.
Nova Scotia Environment is responsible for provincial contributions to efforts on climate change, and
commissioned this report with an objective to examine technologies and practices that are potentially
implementable to manage and minimize the carbon footprint of LNG facilities in Nova Scotia.
Other objectives of this report include:
Benchmark GHG intensities of leading global LNG facilities and facilities proposed or under
construction in North America.
Summarize global best practices for ‘no-regrets’ and ‘beyond-no-regrets’ GHG mitigation
technologies implemented by existing LNG facilities.3
Model the GHG intensities of hypothetical ‘standard’, ‘no regrets’, and ‘beyond no regrets’
facilities located in Nova Scotia.
Summarize best practices for detailed measurement and reporting of GHG emissions from LNG
facilities.
Summarize GHG mitigation technologies that may be implementable at LNG facilities in the
future.
Summarize facility-level low carbon policies and practices that are applicable to Nova Scotia.
3 No regrets and beyond no regrets refer to technologies that have higher capital costs than those in a ‘standard’ or typical facility, but improve facility efficiency and thereby lead to fuel cost savings. No regrets technologies can be expected to have a payback period acceptable to LNG proponents. Beyond no regrets technologies will result in lower GHG emissions than no regrets, but payback periods are longer. Refer to Section 4 for further details and criteria for categorizing technologies as standard, no regrets, or beyond no regrets.
Page 2
Nova Scotia LNG Facility GHG Mitigation Options Report
1.1 Assumptions and Limitations
LNG Facility Type
The LNG export facilities that have been proposed in Nova Scotia are medium to large scale (4 to 10 mtpa)
baseload (constant operation) facilities. This report focuses on GHG mitigation technologies applicable to
these facilities. Discussion of small and/or intermittently operated facilities is outside the scope of this
report.
Assessment Boundary
This report focuses on the LNG liquefaction facility component of the full LNG value chain. The upstream
(natural gas extraction, processing, and transmission via pipeline) and downstream (shipping and
combustion) components are outside of the scope of this report.
Scope 1 (direct, on-site) and Scope 2 (indirect, off-site, e.g. electricity generation) GHG emissions sources
have been attributed to LNG facilities in the GHG modelling and benchmarking. From an emissions
reporting perspective, Scope 1 emissions are often treated differently than Scope 2 emissions. For
example, a LNG facility that uses grid electricity would not typically include GHG emissions associated with
grid electricity generation in emissions reporting. These emissions would typically be ‘owned’ by the
electricity generator and reported separately from the LNG facility. The GHG benchmarking and modelling
include Scope 2 emissions in the LNG facility total so that total emissions associated with the operation of
grid-connected facilities is comparable to total emissions associated with the operation of facilities not
connected to the grid.
Discussion of GHG emissions associated with the construction of LNG facilities are outside the scope of
this report. These emissions are typically small. For example, construction of the Sabine Pass facility in
Louisiana will result in emissions of approximately 3% of the annual operational emissions from the
facility.4 When amortized over the lifespan of the facility, this contributes 0.10% to annual emissions in
each year of operation.5 Other emission sources such as venting or flaring during start-ups, upsets, or
maintenance depend on facility operation and design. Good practice involves minimizing GHG emissions
from these events by flaring the gas released from equipment rather than venting it. When natural gas is
vented, GHG emissions are approximately 25 times greater than when the same amount of gas is flared.
This is due to the higher global warming potential (GWP) of methane (natural gas is primarily methane) in
comparison with CO2; methane has a GWP of 25 and CO2 has a GWP of 1.6 When natural gas is flared the
4 Cheniere Energy. (2013). Resource Report 9 – Air and Noise Quality. Available online: http://www.cheniere.com/CQP_documents/Expansion_RR09.pdf 5 Assuming a facility lifetime of 30 years. 6 GWPs are from IPCC’s Fourth Assessment Report (2007). These GWPs are standard for most reporting programs.

Page 3
Nova Scotia LNG Facility GHG Mitigation Options Report
methane is mostly converted to CO2, resulting in CO2 being released to the atmosphere rather than
methane.
Data Sources
This report is based on publicly available information and data sources. Data related to GHG emissions
from operational LNG facilities are for the most part unavailable. GHG intensities in the benchmarking
section are primarily based on pre-project environmental impact statements and environmental
assessments. As with any projected data, actual facility performance may differ after commissioning,
especially if design alterations occur during construction.
GHG reductions attainable through the implementation of technologies discussed in this report are based
on published equipment efficiencies and other assumptions that may vary based on site-specific
conditions and LNG facility operating parameters.
A high-level discussion of capital costs associated with various technologies is provided in Section 4. The
discussion is limited to the relative capital costs of technology options based on publicly available
information. Detailed capital cost estimates are outside of the scope of this report.

Page 4
Nova Scotia LNG Facility GHG Mitigation Options Report
2 LNG FACILITY OVERVIEW
2.1 LNG Facility Site
The land footprint of a LNG facility will depend to some extent on the capacity of the facility (amount of
LNG produced per year), number of process operations required, number of trains, and other site-specific
conditions. As an example, the proposed 4 mtpa Bear Head LNG facility in Nova Scotia is planned for a 255
acre (1 km2) site, as shown below in Figure 1.
Figure 1 – Proposed site of the Bear Head LNG facility.7
7 Liquefied Natural Gas Limited. (2015). Bear Head LNG. Available online: http://www.lnglimited.com.au/irm/content/bear-head-lng.aspx?RID=331.
Page 5
Nova Scotia LNG Facility GHG Mitigation Options Report
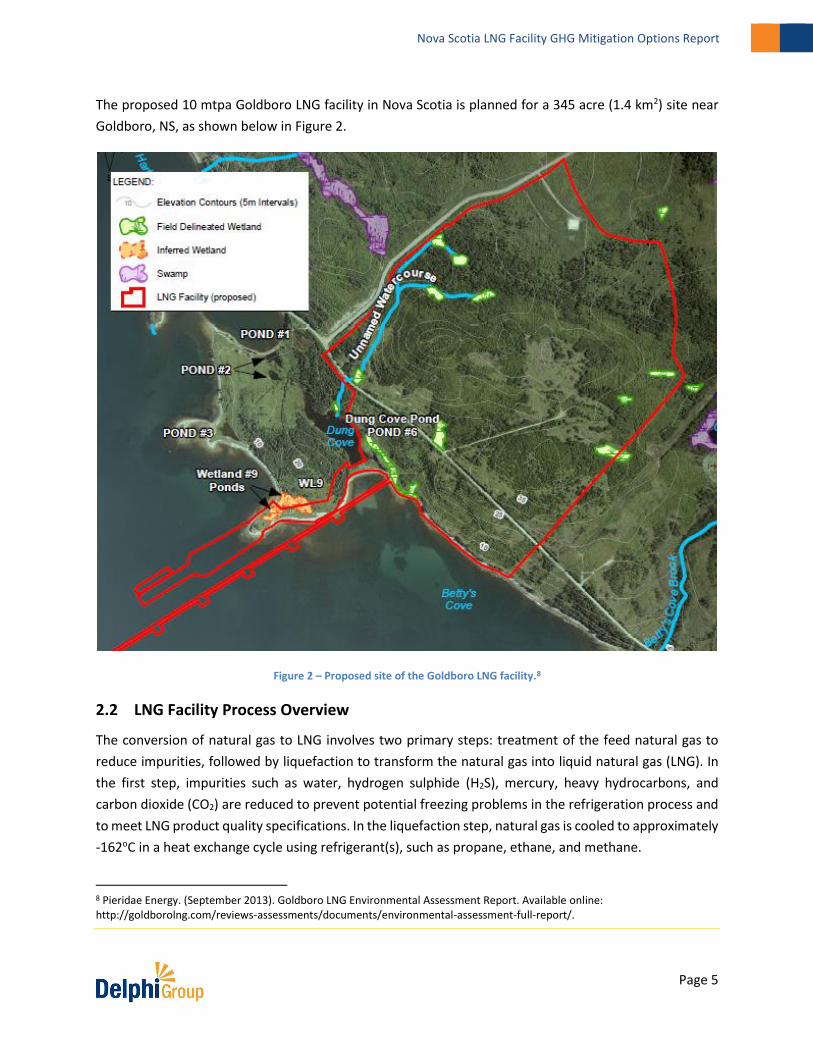
The proposed 10 mtpa Goldboro LNG facility in Nova Scotia is planned for a 345 acre (1.4 km2) site near
Goldboro, NS, as shown below in Figure 2.
Figure 2 – Proposed site of the Goldboro LNG facility.8
2.2 LNG Facility Process Overview
The conversion of natural gas to LNG involves two primary steps: treatment of the feed natural gas to
reduce impurities, followed by liquefaction to transform the natural gas into liquid natural gas (LNG). In
the first step, impurities such as water, hydrogen sulphide (H2S), mercury, heavy hydrocarbons, and
carbon dioxide (CO2) are reduced to prevent potential freezing problems in the refrigeration process and
to meet LNG product quality specifications. In the liquefaction step, natural gas is cooled to approximately
-162oC in a heat exchange cycle using refrigerant(s), such as propane, ethane, and methane.
8 Pieridae Energy. (September 2013). Goldboro LNG Environmental Assessment Report. Available online: http://goldborolng.com/reviews-assessments/documents/environmental-assessment-full-report/.

Page 6
Nova Scotia LNG Facility GHG Mitigation Options Report
Figure 3 below presents a high-level diagram of the natural gas liquefaction process, organized into four
main facility sections: pre-treatment and pre-cooling; liquefaction; refrigeration; and, power generation.
Figure 3 – High-level LNG facility schematic.
In the process above, the feed natural gas first enters the pre-treatment and pre-cooling section of the
facility. The feed gas may be raw gas or pipeline gas. Raw gas is typically piped directly from a nearby gas
reservoir without undergoing initial processing to remove impurities, whereas pipeline gas has undergone
initial processing prior to being sent to the LNG facility, in order to reduce impurities to the extent required
by pipeline specifications. Some impurities will remain in the pipeline gas, and these must be further
reduced at the LNG facility to avoid freezing problems and meet LNG quality specifications.
The first step in pre-treatment is the acid gas removal unit (AGRU), which removes CO2 and H2S contained
within the feed gas and vents or incinerates the resulting acid gas stream (CO2 and H2S with some
methane). This results in significant emissions of CO2, on average accounting for approximately 15% of
total facility emissions (see Figure 4 below). Emissions of CO2 from the AGRU are dependent on the
concentration of CO2 in the feed gas. Facilities that liquefy pipeline gas typically have lower emissions
from acid gas removal since some CO2 would have been removed upstream during initial processing to
meet pipeline specifications. Facilities that liquefy raw natural gas will have higher emissions from acid
gas removal in situations where the raw natural gas has a high CO2 concentration (which depends on the

Page 7
Nova Scotia LNG Facility GHG Mitigation Options Report
reservoir from which the natural gas is extracted). In some cases the CO2 concentration may be 8 mol%
or greater,9 as compared with approximately 1-2 mol% for pipeline gas.
CO2 in the acid gas steam may be captured and injected in an underground reservoir, in a process known
as carbon capture and storage (CCS). Note that only one operational plant in the world (Snohvit, Norway)
currently incorporates CCS. The Gorgon plant in Australia, currently under construction, anticipates using
CCS. Importantly, the Snohvit facility in Norway processes raw gas with a CO2 concentration up to 7.9
mol% and the Gorgon facility in Australia processes raw gas with a CO2 concentration up to 14 mol%, so
the higher AGRU emissions that would be observed at these facilities makes CCS a more attractive option
than at sites that are using pre-processed pipeline gas.
Other steps required in the pre-treatment section will depend on the impurities in the feed gas and the
type of refrigeration process used. Typical steps include: mercury removal, which removes trace amounts
of mercury; dehydration, where water is removed to prevent freezing during liquefaction; natural gas
liquids (NGLs) extraction, where NGLs such as ethane, propane, butane, and pentane are removed and
stored for sale (or incinerated if quantities are small). Pre-cooling operates essentially as the first step in
some liquefaction processes, using a separate refrigerant, such as propane or ammonia.
After leaving the pre-treatment and pre-cooling section, the natural gas enters the liquefaction section.
Here, heat exchange steps take place to cool the natural gas down to approximately -162oC, at which point
it condenses to form LNG. Heat transfer from the natural gas is driven by a refrigerant (or multiple
refrigerants) undergoing vapour compression refrigeration cycles. The number of heat exchange steps
and types of refrigerants used vary by liquefaction process type. There are a number of options for
powering the refrigerant compressors, including “direct drive” natural gas heavy duty or aeroderivative
turbines, electric motors, or steam turbines (further discussed in Section 3.2.2). After being liquefied, the
LNG is pumped to storage tanks, which are used to load shipping vessels.
The refrigeration and liquefaction sections may be divided into ‘trains’, which are processes operating in
parallel to handle the total facility production capacity (the refrigerant compressors can only be sized to
cool a maximum amount of natural gas). Typical train sizes for a large-scale LNG facility range from around
3 mtpa to 7 mtpa. Large-scale LNG facilities (8 mtpa or greater) will typically consist of more than one
train.
LNG facilities require electricity to meet auxiliary power requirements. This is typically provided by a
power plant located on-site, as represented by the “Power Generation” section in Figure 3. In a typical
facility, electricity is provided by natural gas turbines connected to a generator. However, electricity may
9 The Snohvit facility in Norway processes raw gas with a CO2 concentration up to 7.9 mol% and the Gorgon facility in Australia processes raw gas with a CO2 concentration up to 14 mol%.

Page 8
Nova Scotia LNG Facility GHG Mitigation Options Report
be provided by a local power grid or an ‘outside-the-fence’ power plant (such as a combined cycle power
plant). Potential sources of electricity are discussed further in Section 3.2.3.
2.3 LNG Facility GHG Emissions
Figure 4 below displays the GHG emissions breakdown by source category for a typical LNG production
facility.
Figure 4 – Typical GHG emissions breakdown for a natural gas powered LNG facility.10
Natural gas combustion for refrigeration power and electricity generation is the most significant source
of GHG emissions (81%). Within this category, the breakdown between refrigeration power and electricity
generation can vary significantly depending on the liquefaction process. For example, the ratio of
emissions from refrigeration power to electricity generation for the Air Products C3/MR™ process is
approximately 60:40, while for the ConocoPhillips Optimized Cascade® the ratio is 88:12. This should be
taken into consideration when selecting power sources, so that efficient technologies are matched
appropriately with power demands (further discussed in Section 3.2.1).11
Another significant source of GHG emissions is CO2 venting from the acid gas removal unit (15%). Smaller
sources of GHG emissions include: fugitive emissions of natural gas from valves, piping, seals, and other
equipment (0.7%); flaring during process upsets (1.8%); and other minor sources such as on-site heating,
back-up generators, and methane vented during N2 removal from the feed gas (1.2%).
10 Average emissions breakdown of the following facilities: Goldboro, Pluto, Gorgon, Australia Pacific, Gladstone, and Sabine Pass. These facilities were chosen as representative of a ‘typical’ facility because they use gas turbines for electricity generation and refrigeration power (a mix of heavy duty turbines and aeroderivative turbines), and use the most common liquefaction processes – Air Products C3/MR™ and ConocoPhillips Optimized Cascade®. Environmental assessments for these facilities also disaggregated emissions for the major emissions sources. 11 Ratios were calculated as the average of Australia Pacific, Gladstone, and Sabine Pass for the Optimized Cascade® process and Goldboro, Pluto, and Gorgon for the C3/MR™ process.
Refrigeration and Electricity Generation,
81%
Acid Gas Venting, 15%
Fugitive Emissions, 0.7%
Flaring, 1.8%
Other Minor Sources, 1.2%

Page 9
Nova Scotia LNG Facility GHG Mitigation Options Report
Discussion of GHG mitigation options in the subsequent sections of this report place emphasis on options
for reducing emissions from electricity generation and refrigeration power generation, since these two
facility operations are the most significant sources of GHG emissions at a LNG facility.

Page 10
Nova Scotia LNG Facility GHG Mitigation Options Report
3 FACTORS IMPACTING LNG FACILITY GHG EMISSIONS
. In this section, factors impacting LNG facility emissions are broken out into two broad categories:
environmental, public policy, and situational factors; and, facility design and technological factors.
Environmental, public policy, and situational factors are site-specific and generally outside of the control
of LNG facility proponents. Facility design and technological factors involve choices that LNG proponents
have a high degree of control over, although note that process design and technology selection is also
influenced to some extent by environmental and situational factors such as ambient temperature and
feed gas composition. This section provides an overview of the important factors under each broad
category, including a discussion of implications for facility GHG emissions.
3.1 Environmental, Public Policy and Situational Factors
Environmental, public policy, and situational factors include: feed gas composition; ambient temperature
at the facility site; accessibility to, and the emissions intensity of, the local electricity grid; and, public
policy in the jurisdiction where the facility is located, such as carbon pricing
3.1.1 Feed Gas Composition
As discussed in Section 2.2, the feed gas may be raw gas or pipeline gas. Raw gas has not undergone initial
processing to remove impurities, and may contain relatively high concentrations of CO2, H2S, N2, water,
NGLs, and other impurities. The presence of these impurities impacts GHG emissions from the LNG facility
in two primary ways: first, CO2 in the feed gas must be vented (or sequestered) during pre-treatment at
the facility, resulting in GHG emissions; and second, process operations that remove impurities require
electricity (and heat in some cases), the generation of which typically results in GHG emissions (unless
renewable electricity is used).
Figure 5 below presents the acid gas removal emissions intensity for two LNG facilities that receive raw
gas (Gorgon and Pluto), three facilities that receive pipeline gas (Sabine Pass, Corpus Christi, and LNG
Canada), and two hypothetical Nova Scotia facilities that receive pipeline gas at 0.8 mol% or 2 mol%. These
facilities were chosen as examples primarily because acid gas venting emissions data are available in their
respective environmental impact statements.

Page 11
Nova Scotia LNG Facility GHG Mitigation Options Report
Figure 5 – GHG emissions intensity of acid gas removal for raw gas facilities and pipeline gas facilities.12
The Gorgon facility receives raw gas from two reservoirs, with a weighted average CO2 concentration of
9.4 mol%. Without CCS, the GHG intensity of acid gas venting at Gorgon would be 0.27 t-CO2e / t-LNG,
which is greater than the total emissions intensity of some LNG facilities (refer to Section 5 for facility
benchmarking). However, by integrating CCS, the Gorgon facility will reduce emissions from acid gas
venting to approximately 0.05 t-CO2e / t-LNG. This is in line with emissions from Pluto and the 2 mol% NS
facilities, which both receive and process gas with a CO2 concentration of 2 mol%. The other pipeline gas-
fed facilities shown have slightly lower acid gas emissions, ranging from 0.03 – 0.04 t-CO2e / t-LNG. This is
a result of pipeline gas having a lower CO2 concentration of approximately 0.8 – 2 mol%. The hypothetical
NS facility that receives pipeline gas at 0.8 mol% has approximately the same acid gas removal emissions
as the LNG Canada facility, which also receives pipeline gas at 0.8 mol%.
In addition to CO2 venting, feed gas composition impacts the electricity and heat consumption of process
operations that remove impurities. However, the increase in emissions associated with extra electricity
and heat is small in comparison with the increase resulting from a high concentration of CO2 in the feed
gas. For example, Chevron estimates that Gorgon’s acid gas removal unit requires 15 MW of additional
electricity in comparison with a facility that processes feed gas with 1 mol% CO2.13 This corresponds with
12 Calculated as acid gas venting emissions divided by total facility emissions. Refer to the references section for a full list of environmental impact statements used as data sources. 13 Chevron Australia. (2009). Gorgon Gas Development and Jansz Feed Gas Pipeline: Greenhouse Gas Abatement Program. Available online: http://www.chevronaustralia.com/docs/default-source/default-document-library/gorgon-emp-greenhouse-gas-abatement-program.pdf?sfvrsn=2.
0.00
0.05
0.10
0.15
0.20
0.25
0.30
Gorgon(AUS)
Pluto(AUS)
Sabine Pass(US)
CorpusChristi (US)
LNG Canada(BC, CAN)
NS Facility(0.8 mol%
feed)
NS Facility(2 mol%
feed)
GH
G In
ten
sity
(t-
CO
2e/
t-LN
G)
CCS AGRU Emissions - Raw Gas AGRU Emissions - Pipeline Gas AGRU Emissions - Pipeline Gas (NS)

Page 12
Nova Scotia LNG Facility GHG Mitigation Options Report
an increase in the facility intensity of 0.006 t-CO2e / t-LNG, which is minor when compared with the
increase associated with CO2 venting due to a high CO2 concentration in the feed gas.
3.1.2 Ambient Temperature
LNG facilities have historically been located in areas with tropical or desert climates where the yearly
average ambient temperature is above 20oC. An exception is the Snohvit facility in northern Norway,
where the average temperature is approximately 0oC. It has been claimed that facilities located in colder
climates may benefit from efficiency improvements arising from a “cold climate advantage”.14
LNG facilities located in colder climates benefit from a colder cooling medium (air or sea water). The
cooling medium removes heat transferred to the refrigerants during the natural gas liquefaction process,
as well as the heat generated by the refrigerant compressors. When that heat is rejected into a colder
cooling medium, the process becomes more efficient. All things being equal, the liquefaction process
efficiency therefore increases with a colder cooling medium.15
A colder air temperature also increases the power available from gas turbines. These turbines intake a
constant volume of air and their power output is directly proportional and limited by the air mass flow
rate. At colder temperatures, air becomes denser and therefore a constant volume flow will have a greater
mass, resulting in increased power output. For heavy duty turbines, the increase in power is approximately
0.7% per oC, and for aeroderivative turbines the increase in power is approximately 1.1% per oC. There is,
however, an upper limit to the power increase. For a typical heavy duty turbine, the available power may
increase until the ambient temperature is below -20°C. Aeroderivative turbines will reach their maximum
power output at higher ambient temperatures, typically between -10oC and +10oC.16
As power available from the gas turbines increases with lower temperatures, this may be translated into
increased LNG production, depending on the facility configuration. However, this may complicate the
operation and design of the LNG facility in regions with large temperature fluctuations between seasons.
Figure 6 below shows the impact of seasonal temperature variability on LNG production. A scale is not
provided for the y-axis; however, the reference source notes that the variability in production from
summer to winter is approximately ± 10% of the average yearly production (5 mtpa).
14 Clean Energy Canada. (2013). The Cleanest LNG in the World? How to Slash Carbon Pollution from Wellhead to Waterline in British Columbia’s Proposed Liquefied Natural Gas Industry. Available online: http://cleanenergycanada.org/wp-content/uploads/2013/09/CEC_Cleanest_LNG_World.pdf. 15 Schmidt, W.P. (2013). Arctic LNG Plant Design: Taking Advantage of the Cold Climate. Liquefied Natural Gas 17 Conference: Liquefaction, Machinery and Onshore Facilities, Houston, US. Available online: http://www.airproducts.com/~/media/Files/PDF/industries/lng/arctic-lng-plant-design.pdf 16 Schmidt (2013).

Page 13
Nova Scotia LNG Facility GHG Mitigation Options Report
Figure 6 – Seasonal temperature profile and corresponding theoretical maximum facility output for a 5mtpa facility.17
In locations with high ambient temperature fluctuations, the facility can be designed for a low, high, or
average air temperature. If the facility is sized for a low temperature condition, the equipment may be
underutilized for most of the year; if sized for a higher ambient temperature, the equipment will be
constrained for most of the year. Finding the right balance is an important consideration when designing
a facility.18 Depending on the export market, it may be preferable to design a facility for maximum
production during the winter months in order to meet demand. For example, Europe has a greater
demand for gas during the winter months for residential heating.19
The climate in Nova Scotia is on average colder than locations where the majority of LNG facilities are
situated. However, there is also a large seasonal fluctuation in temperatures, which could negate any ‘cold
climate’ GHG benefits, depending on the facility design. Any benefits will need to be determined on a
facility-by-facility basis. As a rough estimate, GHG benefits could range from negligible to up to 10% (in
comparison with a facility located in Australia where the average temperature is 26oC).20
3.1.3 Electricity Grid
LNG facilities can be powered in part or in whole by grid-supplied electricity. Technical considerations
associated with electrification of the refrigeration process are discussed in Section 3.2.2 and the use of
grid electricity for auxiliary power is discussed in Section 3.2.3. Situational factors that should be taken
17 Adapted from Josten, M. and J. Kennedy (June 2008). BP Develops Studied Approach to Liquefaction in an Arctic Climate. LNG Journal. June 2008 Issue, pp. 28-30. 18 Kotzot, H. Durr, C., Coyle, D., and C. Caswell. (2007). LNG Liquefaction – Not All Plants Are Created Equal. Available online: http://www.kbr.com/newsroom/publications/technical-papers/lng-liquefaction-not-all-plants-are-created-equal.pdf. 19 Honore, A. (January 2011). Economic Recession and Natural Gas Demand in Europe: What Happened in 2008-2011? The Oxford Institute for Energy Studies. Available online: http://citeseerx.ist.psu.edu/viewdoc/download?doi=10.1.1.398.1589&rep=rep1&type=pdf. 20 Calculated using a rule of thumb of 0.6% increase in production for a drop in temperature of 1oC and assuming an average annual temperature of 8oC for Nova Scotia. Refer to Chevron (2009) for rule of thumb reference.

Page 14
Nova Scotia LNG Facility GHG Mitigation Options Report
into account when considering the use of grid electricity for facility power requirements include the grid
emission factor, access to power distribution lines, reliability, and congestion on the system. For an
electrified LNG facility, GHG emissions associated with auxiliary power and refrigeration power are
directly proportional to the GHG intensity of the local electricity grid.
The sources of electricity generated to supply a local grid (typically a provincial grid in Canada) can vary
significantly in terms of GHG impact. Fossil fuel electrical generating stations have a significantly higher
GHG intensity (t-CO2e / MWh) than renewable sources such as hydro, wind, or solar. The GHG intensity
of a provincial grid is the weighted average of the intensities of all sources used to supply electricity to the
grid. In 2012, the Nova Scotia electrical grid had a relatively high GHG intensity (0.790 t-CO2e / MWh), in
comparison with the Canadian average (0.170 t-CO2e / MWh) and the other province where LNG facilities
have been proposed, British Columbia (0.0091 t-CO2e / MWh).21 This is a result of Nova Scotia’s grid
currently being supplied primarily by coal generating facilities (about 50% of electricity generated), with
natural gas, hydro, and other renewables making up the rest of the supply.
However, the GHG intensity of the Nova Scotia grid is expected to decline in the future. This will be a
result of the Nova Scotia government’s policy to increase renewables to 40% of total generating capacity
by 2020, a provincial GHG emissions cap that requires the electricity sector to reduce its total emissions
25% by 2020 and 55% by 2030. Emissions associated with electricity generation will be reduced primarily
by new wind projects and the Maritime Link – a project to transmit hydroelectricity from Newfoundland
to Nova Scotia via subsea transmission cables. The project is expected to be completed by year-end 2017.
The increase in renewables supplying the Nova Scotia grid will lead to a decrease in its GHG intensity.
Modelled forecasts from Nova Scotia Power for electricity generation and CO2 emissions were used to
calculate the anticipated grid intensity in 2020, 2025, and 2030.22 These intensities are 0.48 t-CO2 / MWh
for 2020 and 2025, and 0.41 t-CO2 / MWh in 2030. Note that these estimates are sensitive to the
underlying set of modeling assumptions, which include high uptake of demand side management
programs, retirement of some coal facilities, and new electricity supplied by wind and the Maritime Link.
The “base” modelled scenario was selected to estimate the GHG intensities because it is a ‘middle of the
road’ scenario with reasonable assumptions for demand side management, coal retirements, and increase
in renewables supplying the grid.
Note that the Nova Scotia Power modelling assumptions do not factor in the significant amount of
electricity that would be required by a grid-connected LNG facility – about 400 MW peak and 3,500 GWh
per year, for a 10 mtpa facility entirely powered by grid electricity. For a facility connected to the grid for
auxiliary power, requirements would be about 150MW peak and 1,300 GWh per year for a 10 mtpa
facility. The forecasting assumptions would need to be updated to take this demand into account to obtain
21 Environment Canada. (2014). National Inventory Report: Greenhouse Gas Sources and Sinks in Canada. Available online: http://unfccc.int/national_reports/annex_i_ghg_inventories/national_inventories_submissions/items/8108.php. 22 Nova Scotia Power. (September 2014). 2014 Integrated Resource Plan Final Results, CRP 2-1.

Page 15
Nova Scotia LNG Facility GHG Mitigation Options Report
a more accurate emission factor forecast. This may be a worthwhile exercise should a LNG proponent be
interested in connecting to the grid; however, it is outside of the scope of this report.
For reference, the forecasted grid factors are lower than coal and simple cycle natural gas generation,
which have emission factors of around 0.9 t-CO2e / MWh and 0.5 t-CO2e / MWh, respectively. The
forecasted Nova Scotia factors are slightly higher than a commonly assumed typical emission factor for
natural gas-fired combined cycle (two turbine stages, with waste heat from the first stage used to drive
the second stage) electricity generation of 0.34 tonne-CO2e / MWh.
Another factor of importance is the proximity of the LNG facility to power distribution lines of the
appropriate voltage. A map of the power distribution system in Nova Scotia indicates that high voltage
lines are not currently in place near the proposed sites of Goldboro or Bear Head.23 New high voltage
power distribution lines would need to be installed, incurring extra costs for project proponents. There
may also be constraints on the current transmission system that would cause difficulties in meeting the
required load. For example, there is a pinch point between Cape Breton Island and mainland Nova Scotia
that could limit opportunities for grid connection.
The reliability of the local electrical grid is also an important consideration. Refrigeration and auxiliary
power are both essential to maintaining the operation of a LNG facility: a LNG facility will not be able to
operate without the required auxiliary power, even for a short period of time. Facilities typically require
99.9% reliability of the power supply to reduce the risk of interruptions to operations.24
3.1.4 Public Policy
An in-depth discussion of public policy relevant for mitigating environmental impacts associated with LNG
facilities is outside the scope of this report. However, it should be noted that public policy such as a price
on carbon may impact technology choices made by LNG proponents. For example, the carbon tax in
Norway appears to have been one of the primary motivations behind incorporating CCS at the Snohvit
LNG facility.25 Carbon pricing will also provide an economic incentive for implementing efficient
technology or processes where this leads to reduced compliance costs.
British Columbia has developed GHG requirements for LNG facilities, including a GHG intensity benchmark
(0.16 t-CO2e / t-LNG). LNG facility facilities with emissions intensities higher than the benchmark will have
options to reach the benchmark, including purchasing offsets and contributing to a technology fund (price
23 Hatch. (February 2014). Reviewing Electrical Substation Maintenance Practices at Nova Scotia Power. Available online: http://www.hatch.ca/News_Publications/Energy_Innovations/February2014/novascotiapower.htm. 24 KPMG. (July 18, 2014). Pacific Northwest LNG Limited Partnership. Summary: Independent Review of Power Options Evaluation and Selection Process. Available online: http://pacificnorthwestlng.com/wp-content/uploads/2013/02/PNW_Partnership-report_v.19_WEB.pdf. 25MIT. (2015). Snohvit Fact Sheet: Carbon Dioxide Capture and Storage Project. Available online: https://sequestration.mit.edu/tools/projects/snohvit.html.
Page 16
Nova Scotia LNG Facility GHG Mitigation Options Report
of $25 / t-CO2e). If a facility is below the benchmark it will receive a credit that can be sold or banked for
future years.26
Public policy may also have an impact on the emissions intensity of the electricity grid if there are targets
or other incentives for renewables, as is the case in Nova Scotia.
3.2 Design and Technological Factors
The technology factors that influence LNG facility GHG intensity include choice of liquefaction process,
power generation (choice of turbines and configuration), use of waste heat, and implementation of other
energy efficiency or GHG mitigating technologies. In the subsequent sections, these choices are discussed
independently of each other as a simplifying approach; however, it should be noted that the various
components of a facility (e.g., liquefaction process, power generation, waste heat recovery) are typically
considered together when designing a facility rather than separately. This ensures that all technologies
selected operate together optimally.
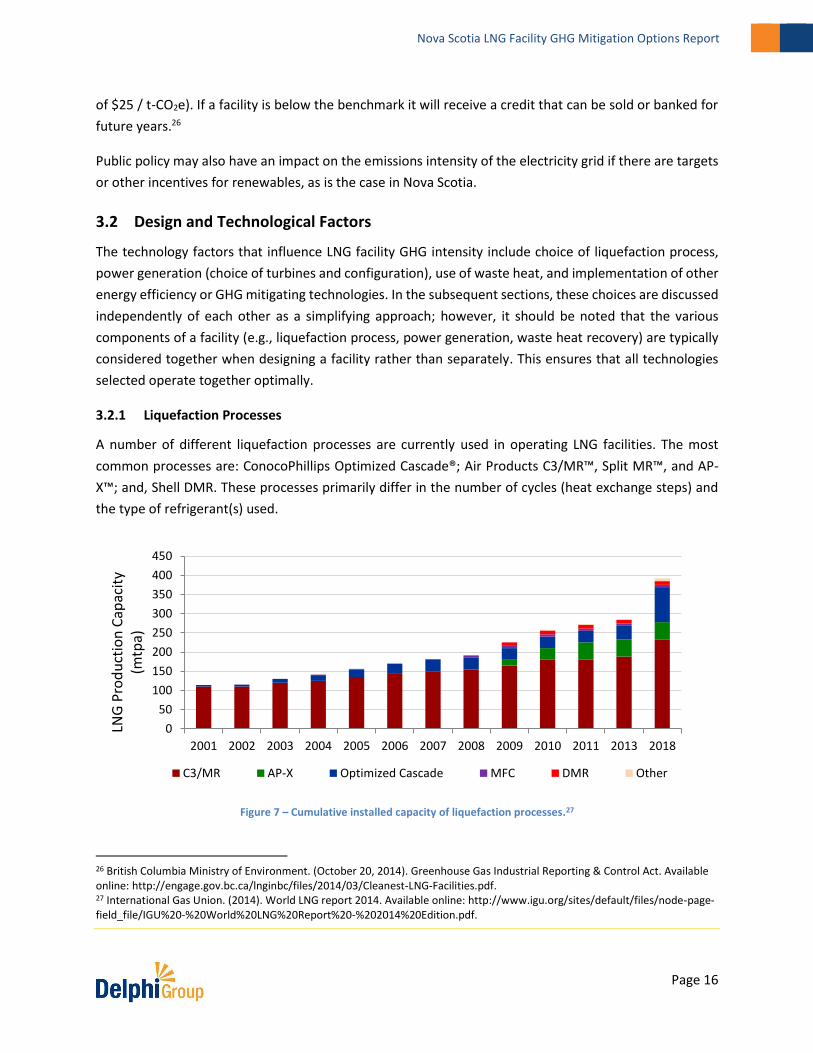
3.2.1 Liquefaction Processes
A number of different liquefaction processes are currently used in operating LNG facilities. The most
common processes are: ConocoPhillips Optimized Cascade®; Air Products C3/MR™, Split MR™, and AP-
X™; and, Shell DMR. These processes primarily differ in the number of cycles (heat exchange steps) and
the type of refrigerant(s) used.
Figure 7 – Cumulative installed capacity of liquefaction processes.27
26 British Columbia Ministry of Environment. (October 20, 2014). Greenhouse Gas Industrial Reporting & Control Act. Available online: http://engage.gov.bc.ca/lnginbc/files/2014/03/Cleanest-LNG-Facilities.pdf. 27 International Gas Union. (2014). World LNG report 2014. Available online: http://www.igu.org/sites/default/files/node-page-field_file/IGU%20-%20World%20LNG%20Report%20-%202014%20Edition.pdf.
0
50
100
150
200
250
300
350
400
450
2001 2002 2003 2004 2005 2006 2007 2008 2009 2010 2011 2013 2018
LNG
Pro
du
ctio
n C
apac
ity
(mtp
a)
C3/MR AP-X Optimized Cascade MFC DMR Other

Page 17
Nova Scotia LNG Facility GHG Mitigation Options Report
Figure 7 shows the cumulative installed global capacity in mtpa of the available liquefaction processes. Air
Products C3/MR™ has been the most commonly utilized process historically. It is expected to continue to
be used in the future, along with ConocoPhillips Optimized Cascade® process.
The choice of liquefaction process depends on the desired capacity of the LNG trains. Certain processes
such as pre-cooled N2 and N2 recycle require fewer pieces of equipment and hence have lower capital
costs. These processes are used in small liquefaction trains (less than 2 mtpa), where capital costs are a
more important consideration than efficiency and fuel costs. Efficiency is a more important consideration
for medium (3-6 mtpa) and large trains (7-10 mtpa), and therefore different, more efficient processes
have been designed for these capacities. Figure 8 below presents the processes most commonly used for
train capacities of 0.5 to 10 mtpa.
Figure 8 – Liquefaction processes by train capacity.28
In addition to capital cost and efficiency considerations, there are also technical factors that generally
restrict the applicability of liquefaction processes to the train capacity ranges shown in Figure 8. All
liquefaction processes have ‘bottlenecks’ or limiting factors that constrain the maximum capacity
achievable. For example, the SMR process contains bottlenecks related to the main cryogenic heat
exchanger and mixed refrigerant compression equipment. The C3/MR™ process overcomes these
28 Adapted from Bronfenbrenner, J.C., Pillarella, M., and J. Solomon. (2009). Selecting a Suitable Process for the Liquefaction of Natural Gas. Available online: http://www.airproducts.com/~/media/Files/PDF/industries/lng-selecting-suitable-process-technology-liquefaction-natural-gas.pdf
0 1 2 3 4 5 6 7 8 9 10
Train Capacity (mtpa)
AP-X
C3/MR, DMR, OptimizedCascade
SMR, OSMR
Pre-cooled N2
N2 Recycle

Page 18
Nova Scotia LNG Facility GHG Mitigation Options Report
bottlenecks through the use of propane pre-cooling which reduces the volumetric flow of the mixed
refrigerant.29
The C3/MR™ process is constrained to a maximum capacity of around 5 mtpa, due to flow limitations on
the refrigerant compressors and main cryogenic heat exchanger. To expand the capacity of the C3/MR™
process, new designs would need to be developed for these major pieces of equipment.30 The AP-X™
process overcomes these limitations by adding a third heat exchange cycle, which allows train capacities
to increase to approximately 7.5-10+ mtpa. This overcomes the typical C3/MR™ process bottlenecks, such
as the main cryogenic heat exchanger diameter and propane refrigerant compressor capacity.31
Liquefaction process efficiency is typically expressed as the ratio of power consumption to produced LNG
in one day, e.g. kWday / tonne-LNG. As this is a measure of the power input required to produce LNG, a
lower value indicates a more efficient process. Figure 9 presents the efficiencies of the most common
liquefaction processes.
Figure 9 – LNG process cycle efficiencies for commonly used LNG processes.32
29 Roberts, M.J., Petrowski, J.M., Liu, Y., and J.C. Brofenbrenner. (2002). Large Capacity Single Train AP-X™ Hybrid LNG Process. Available online: http://www.airproducts.com/~/media/Files/PDF/industries/lng-large-capacity-single-train-ap-xtm-hybrid-lng-process.pdf. 30 Roberts et al. (2002). 31 Barclay, M. and T. Shukri. (2007). Enhanced Single Mixed Refrigerant Process for Stranded Gas Liquefaction. LNG 15 International Conference. Available online: http://www.ivt.ntnu.no/ept/fag/tep4215/innhold/LNG%20Conferences/2007/fscommand/PO_24_Barclay_s.pdf. 32 Adapted from van Osch, M.M.E., Belfroid, S.P.C., and M. Oldenburg. (2010). Marine Impact on Liquefaction Processes. Available online: http://www.kgu.or.kr/download.php?tb=bbs_017&fn=PO4-4_vanOsch-p.pdf&rn=PO4-4_vanOsch-p.pdf.
0
2
4
6
8
10
12
14
16
18
20
C3/MR DMR OptimizedCascade
SMR Pre-cooledN2
Liq
uef
acti
on
Pro
cess
Eff
icie
ncy
(k
Wd
/t-L
NG
)

Page 19
Nova Scotia LNG Facility GHG Mitigation Options Report
As shown in the figure, the liquefaction processes available for medium to large size trains (C3/MR™, DMR,
and Optimized Cascade®) are all approximately equal in terms of efficiency. A published efficiency value
is not available for the AP-X™ process; however, Air Products literature indicates this process has
approximately the same efficiency as C3/MR™ and DMR.33 For medium to large size trains, the natural gas
liquefaction industry has matured to the point where further modifications to process configurations have
a limited impact on facility efficiency. The underlying efficiencies of processes are approaching practical
limits, and cannot be improved significantly.34
Liquefaction processes suitable for smaller trains, such as pre-cooled N2 and SMR tend to have lower
efficiencies than processes suitable for medium to large trains. For smaller facilities, capital costs and
schedule considerations are often more important than facility efficiency. The processes for smaller trains
tend to have lower capital costs since fewer and less expensive pieces of equipment are used. This
equipment is less efficient and heat integration between process units is limited.
One exception for smaller trains is the LNG Limited Optimized Single Mixed Refrigerant (OSMR®)
liquefaction process. While process efficiency values do not appear to have been published, it appears
from the refrigerant/natural gas cooling curve35 that the OSMR® efficiency will be similar to the Optimized
Cascade® or C3/MR™ process. OSMR® also incorporates efficient power generation technologies such as
aeroderivative turbines and a combined heat and power plant (these technologies are discussed in more
detail in subsequent sections).
Liquefaction Process GHG Impact
Translating the simple comparison of liquefaction process efficiencies shown in Figure 9 into GHG
emissions impacts can be misleading. This is because the overall efficiency of a particular LNG facility is
dependent on both the liquefaction process choice and the selection of process equipment, such as the
refrigeration power source and the source of electricity. When designing a LNG facility, the selection of
process technology and equipment are interrelated, as the process technology must be able to work hand-
in-hand with the process equipment to result in a reliable LNG facility.36 With this in mind, among the
liquefaction processes suitable to medium or large trains, there are only minor differences in liquefaction
process efficiencies, and therefore the impact on facility GHG emissions will be minor. There may be a
significant efficiency difference when comparing the liquefaction processes for medium and large trains
to those for small trains, with the larger processes being more efficient and hence resulting in lower GHG
emissions. However, new liquefaction processes for smaller trains, such as OSMR®, have comparable
33 Bronfenbrenner et al. (2009). 34 Ransbarger, W. (2007). A Fresh Look at LNG Process Efficiency. Available online: http://lnglicensing.conocophillips.com/Documents/SMID_016_WeldonsPaperLNGIndustry.pdf. 35 Liquefied Natural Gas Ltd. Improved LNG Process. Better Economics for Future Projects. Available online: http://www.lnglimited.com.au/IRM/Company/ShowPage.aspx?CPID=1455&EID=56380866 36 Caswell, C., Durr, C., Kotzot, H., and D. Coyle. (2011). Additional myths about LNG. Available online: http://www.kbr.com/Newsroom/Publications/Technical-Papers/Additional-Myths-about-LNG.pdf.

Page 20
Nova Scotia LNG Facility GHG Mitigation Options Report
efficiencies to the larger processes and therefore the GHG emissions impact associated with the
liquefaction process choice will be comparable.
3.2.2 Refrigeration Power Source
The refrigeration compressors require a significant amount of power (typically over 300 MW for a 10 mtpa
facility). There are three main choices for providing power to the compressors: steam turbines, natural
gas direct drive turbines, and electric motors.
Steam Turbines
Steam turbines were the primary choice in early LNG facilities (1970s to 1980s).37 The use of steam
turbines requires an elaborate steam, water treatment and cooling system, making them more complex
to operate than gas turbines. This, combined with lower efficiencies and limitations on train capacities
resulted in a move away from steam turbine drivers in the 1980s.38 Steam turbines are no longer a
common choice for new LNG facilities; however, some advanced facilities may use steam turbines in
combination with waste heat recovery units to generate electricity or provide a portion of the power
required by the refrigeration compressors. This type of heat integration is discussed in more detail in
Section 3.2.4.
Gas Turbines
Since the mid-1980s, most LNG facilities have used gas turbines as drivers for the refrigeration
compressors. There are two options for gas turbines – heavy duty and aeroderivative.
Heavy duty gas turbines that are currently in use at LNG facilities are almost exclusively supplied by
General Electric (GE). GE’s Frame 5, 6, 7 and 9 heavy duty turbines have been used in the LNG industry
since the late 1960s. The thermal efficiencies of these gas turbines range from 30% to 34%.39
Aeroderivative gas turbines were developed from aircraft engines and their use as mechanical drives in
industries other than LNG dates back to the 1950s.40 They are relatively compact, lightweight and have
thermal efficiencies ranging from 39% to 43%. In 2006, Darwin LNG in Australia became the first facility
to use aeroderivative turbines to drive refrigeration compressors.
37 Nored, M. and A. Brooks. (2013). A Historical Review of Turbomachinery for LNG Applications. LNG 17 International Conference & Exhibition on Liquefied Natural Gas. Available online: http://www.gastechnology.org/Training/Documents/LNG17-proceedings/Mach-10-Marybeth_Nored.pdf 38 Shah, P. et al. (2013). Refrigeration Compressor Driver Selection and Technology Qualification Enhances Value for the Wheatstone Project. LNG 17 International Conference & Exhibition on Liquefied Natural Gas. Available online: http://www.gastechnology.org/Training/Documents/LNG17-proceedings/2-5-Pankaj_Shah.pdf 39 P. Shah et al. (2013). 40 P. Shah et al. (2013).

Page 21
Nova Scotia LNG Facility GHG Mitigation Options Report
Electric Motors
In recent years, there has been increasing interest in using electric motors (e-drives) as drivers for the
refrigeration compressors. Some in the industry have proposed that the high availability of electric motors
can increase the overall yearly facility production, due to reduced maintenance down-time. However, the
extent of the increase in production is debatable and this option typically requires significant additional
investment for power plants and systems. The Snohvit project in Norway is the only LNG facility to use
electric motors as the primary refrigeration drivers.41 A few proposed facilities in the US plan to use e-
drives with electricity supplied by the grid or a combined cycle power plant.
Refrigeration Power Source GHG Impact
Choice of the refrigeration power source can have a significant impact on LNG facility emissions. As shown
in Figure 4, GHG emissions from electricity generation and refrigeration power generation account for
approximately 81% of facility emissions. Within this percentage, emissions from the refrigeration power
source make up 60-88%, depending on the liquefaction process. This represents 49-71% of the total
facility emissions.
Switching from heavy duty turbines to aeroderivative turbines will increase the refrigeration power
generation efficiency by approximately 5-13%, depending on the models chosen. This corresponds with a
decrease in facility GHG emissions of approximately 2.5-10%. Note that the higher decrease in GHG
emissions (10%) is associated with implementing aeroderivative turbines at a facility using the
ConocoPhillips Optimized Cascade® liquefaction process. This process requires a greater amount of power
for refrigeration than auxiliary power (88:12 ratio of power for refrigeration to auxiliary). This is an
important factor to be taken into consideration when evaluating the trade-off between increased
efficiency (and the associated fuel cost savings) and the higher capital costs of aeroderivative turbines.
When electric motors are chosen as the drivers for refrigeration compressors, the GHG impact will range
from significant to negligible, or possibly even negative (higher GHG emissions), depending on the fuels
used to generate the electricity. If renewable electricity such as hydro, wind, or solar is the source, GHG
emissions from refrigeration power will be negligible, representing a 49-71% decrease in total facility
emissions. On the other hand, if the electricity is produced through combustion of a carbon-intensive fuel,
such as coal, emissions from refrigeration power will be greater than if heavy duty or aeroderivative
turbines were used. Therefore, the GHG emission factor of the electricity supply is an important
consideration when deciding whether electric motors are a viable GHG mitigation option.
41 P. Shah et al. (2013).

Page 22
Nova Scotia LNG Facility GHG Mitigation Options Report
3.2.3 Source of Electricity
LNG facilities require electricity for auxiliary power – running various equipment such as pumps, control
systems, and process units. While the electric power requirement is not as great as the refrigeration
power requirement, it is still significant (over 100 MW for a 10 mtpa facility). Facilities that use electric
motors to drive refrigeration compressors will require additional electric power. For a 10 mtpa facility that
uses electricity for refrigeration and auxiliary power, the total electric power requirements will be in the
range of 400 MW.
There are a number of options for providing electricity to the facility. These include steam turbines,
natural gas heavy duty or aeroderivative turbines, grid electricity, a combined cycle power plant, or
another outside the fence source of electricity (e.g., renewables or any other type of generation could
theoretically be used, but these options are not discussed in detail because they have not been
implemented or proposed). Steam, heavy duty, and aeroderivative turbines were discussed in the
preceding section and that discussion applies whether the turbines are used for refrigeration power or
electric power generation.
Grid electricity may be used to provide auxiliary power or both auxiliary power and refrigeration power.
Currently, there are no operating facilities that use grid electricity to provide auxiliary or refrigeration
power; however, the Snohvit facility is connected to the grid for back-up power requirements. A number
of proposed facilities plan on using grid electricity for auxiliary power, including the LNG Canada facility in
BC, and the Corpus Christi and Cameron facilities in the US. The proposed Woodfibre facility in BC plans
to use grid electricity for both auxiliary power and refrigeration power.
As discussed in the preceding section, the carbon intensity or GHG emission factor of the grid will
determine the emissions associated with auxiliary power and/or refrigeration power generation. The BC
grid has a very low emission factor since it is predominantly supplied with hydroelectricity. As a result, the
Woodfibre and LNG Canada facilities are expected to have very low emissions intensities (refer to the
benchmarking results in Section 5).
Another option for electricity supply is to build a dedicated combined cycle power plant to provide electric
power. The proposed Jordan Cove facility in the US plans to use this option to meet auxiliary and
refrigeration power requirements. If appropriate agreements are in place, any excess electricity generated
may be sold to the grid.
Renewables such as wind or solar could be used to generate a portion of the facility electricity
requirements. However, there is no precedent for the use of renewables directly connected to a facility.
The variability / intermittent nature of wind power would increase the challenges associated with such an
option and would need to be managed accordingly.
Source of Electricity GHG Impact
Page 23
Nova Scotia LNG Facility GHG Mitigation Options Report
Choice of the electricity source can have a significant impact on LNG facility emissions. As shown in Figure
4, GHG emissions from electricity generation and refrigeration power generation account for
approximately 81% of facility emissions. Within this percentage, emissions from the refrigeration power
source make up 12-40%, depending on the liquefaction process. This represents 10-32% of the total
facility emissions.
As with refrigeration power generation, switching from industrial turbines to aeroderivative turbines will
increase the auxiliary power generation efficiency by approximately 5-13%, depending on the models
chosen. This corresponds with a decrease in facility GHG emissions of approximately 1-5%.
As with the options for refrigeration power, the GHG impact of the electricity generation options will
range from significant to negligible, or possibly even negative (higher GHG emissions), depending on the
fuels used to generate the electricity. If renewable electricity such as hydro, wind, or solar is the source,
GHG emissions from refrigeration power will be negligible, representing a 10-32% decrease in total facility
emissions. On the other hand, if the electricity is produced through combustion of a carbon-intensive fuel,
such as coal, emissions from refrigeration power will be greater than if heavy duty or aeroderivative
turbines were used. Therefore, the GHG emission factor of the electricity supply is an important
consideration when deciding whether electric motors are a viable GHG mitigation option.
3.2.4 Heat Integration / Heat Recovery
Heat may be recovered from the compression or electricity generation turbines and used elsewhere in
the facility, either directly as heat or as electricity generated from steam. The main direct uses of heat in
a LNG facility are for process heating in the AGRU and dehydration units; however, the heat demand of
these units varies depending on the feed gas composition and facility design.
Heat recovery for electricity generation is a method to capture waste energy from heavy duty or
aeroderivative gas turbines. Some facility designs include steam generation at both the electricity
generation and compression turbines, which is then fed into a steam-powered electrical turbine. A further
step is to change compression from direct drive to e-drive and operate a combined cycle power plant. In
a combined cycle gas plant, the gas turbine and steam turbine cycles are directly connected for greater
power generation efficiency.
Heat Integration GHG Impact
The GHG mitigation effect of heat recovery and integration with the AGRU and dehydration units is small
(1-2% reduction). Also, this type of waste heat recovery is commonplace in new LNG facilities and
therefore may be considered ‘business as usual’ or standard.
Heat recovery for steam and electricity generation may lead to significant GHG reductions, 10% or greater.
For further details refer to the heat integration facility model in Section 4.

Page 24
Nova Scotia LNG Facility GHG Mitigation Options Report
3.2.5 Other GHG Mitigation Technologies
Other GHG mitigation technologies are organized by a high-level estimate of their mitigation potential42
for a LNG facility accepting pipeline quality gas (note that estimates can vary depending on facility design).
A large impact could reduce facility GHG intensity by 10% or more, with a medium impact closer to 5%
and a small impact roughly 2% or less. Most of the listed technologies would be expected to have small
impacts.
3.2.5.1 Large Impact
Renewable Energy
A renewable source of energy is used to provide on-site energy requirements. The GHG impact is a
function of the quantity of renewable energy used, but could be large if the facility is connected to a large-
scale generation facility (e.g. large wind or hydro).
3.2.5.2 Medium Impact
Carbon Capture and Storage (CCS)
The relatively pure CO2 stream from the AGRU is sequestered in underground storage. CO2 could also be
captured from turbine exhaust gas; however, this type of application would require additional capture
technology (due to the relatively lower concentration of CO2 in combustion exhaust gases vs. AGRU vents)
and has yet to be implemented at industrial scale for natural gas. Also, there must be storage space
available within close proximity to the facility, or a CO2 pipeline to transmit elsewhere for storage.
The AGRU unit is likely to contribute roughly 5% of the total emissions of a LNG facility in Nova Scotia.
Given the energy (and associated GHG emissions) required to store the CO2 (e.g. for pumps and other
equipment) the actual GHG savings will be lower.
3.2.5.3 Small Impact
Cooling Medium Selection
The cooling medium removes heat transferred to the refrigerants during the natural gas liquefaction
process, as well as the heat generated by the refrigerant compressors. The two main choices for the
cooling medium are air or seawater. It has been claimed that cooling with seawater is more efficient than
air;43 however, data with which to estimate the GHG impact is unavailable.
Acid Gas Recovery Unit (AGRU) Solvent Selection
42 Mitigation potential includes a consideration of whether a technology would be considered ‘standard practice’, in which case it would be classified as business as usual instead of a mitigation option. 43 Woodfibre LNG. (2014). Electric Drives & Seawater Cooling. Available online: http://www.squamish.ca/assets/WLNG/WLNG-electric-drives-seawater-cooling-2014-07-17.pdf.
Page 25
Nova Scotia LNG Facility GHG Mitigation Options Report
A more selective solvent is chosen to reduce co-absorption of hydrocarbons and subsequent venting
during regeneration. Solvent performance is relatively standard in newer facilities and not seen as a likely
area for improvement.
AGRU Methane Recovery
Methane from solvent regeneration in the AGRU is captured and used instead of sent to a thermal oxidizer
or vented. The impact is dependent on the selectivity of the AGRU solvent and the business as usual (BAU)
case. Where the BAU is to send the gas to a thermal oxidizer (due to regulations), the impact would be
negligible since CH4 is already converted to CO2 in the exhaust gas, dramatically reducing its GHG impact
in CO2e units. A small impact can be seen at facilities where the alternative to recovery is venting.
Boil-Off Gas Recovery
LNG is kept at temperature during on-site storage by allowing a small amount of boil-off. Recovery units
capture the boil-off gas and re-use it within the facility or return it to the pipeline. This is now deemed
standard practice at new LNG facilities.
Fugitive Emissions Management
This involves implementing technologies designed to reduce fugitive emissions from the facility (e.g. high-
effectiveness seals). Fugitive emissions tend to be a minor source of emissions at LNG facilities (about 1%
of total emissions) and therefore management initiatives will have only a small impact on the overall
facility GHG intensity.
3.2.6 Future LNG Technologies
The natural gas liquefaction industry has matured to the point where further improvements to process
configurations and technologies will result in a limited increase in facility efficiency over a theoretical
present-day best in class facility that uses the most efficient processes and equipment. The underlying
efficiencies of processes are approaching practical limits, and cannot be improved significantly. Therefore,
it is not expected that any ‘disruptive’ new technologies leading to significant efficiency improvements
will become commercialized.
However, there may be room for incremental improvements in liquefaction processes, turbines, heat
exchangers, compressors, and other process equipment. Such improvements may lead to a few
percentage points increase in efficiency over the current best in class technologies.

Page 26
Nova Scotia LNG Facility GHG Mitigation Options Report
4 MODEL NOVA SCOTIA LNG FACILITIES
A primary objective of this report was to model the GHG intensity of hypothetical ‘standard’, ‘no regrets’,
and ‘beyond no regrets’ facilities located in NS. These facilities are defined as follows:
Standard Facility:
o Lowest capital cost technology for electricity generation and refrigeration.
o Most prevalent technology for electricity generation and refrigeration.
o Minimal technical barriers.
No Regrets Facility:
o Capital costs for electricity generation and refrigeration technology may be higher than
in the Standard Facility case. However, the technology will be of higher efficiency and
therefore lead to fuel cost savings. The payback period is not expected to present a
significant barrier; however, note that payback periods are dependent on fuel prices.
o The technology may or may not currently be in use at operational facilities; however, it is
expected the technology will become more prevalent in the future.
o There are some technical barriers; however, these are not expected to be
insurmountable.
Beyond No Regrets Facility:
o Capital costs for electricity generation and refrigeration are higher than the No Regrets
Facility. The technology will be of higher efficiency than the No Regrets facility, leading to
fuel cost savings; however, the long payback on investment presents a barrier to
implementation. Policies not taken into account for the hypothetical NS facilities, such as
carbon pricing, may improve the financial viability of the technology in some jurisdictions.
o The technology may or may not currently be in use at operational facilities; however, it is
expected the technology will become more prevalent in the future.
o There are significant technical barriers that must be overcome before the technology can
be implemented.
In order to determine whether specific technologies are applicable to a Standard, No Regrets, or Beyond
No Regrets facility, they were evaluated for prevalence at existing facilities, capital cost and operational
cost savings, and technical barriers. The methodology employed for each criterion is as follows:

Page 27
Nova Scotia LNG Facility GHG Mitigation Options Report
Prevalence of Technologies:
o A survey was conducted of 21 LNG facilities that are currently operational, under
construction, or proposed.44
o Refrigeration power source, electricity source, and degree of heat recovery
implementation were noted for each facility.
o Charts displaying each of the above were generated to determine the level of technology
adoption at existing facilities and the trends for technologies at under construction and
proposed facilities.
Capital Costs (CAPEX) and Operational Costs (OPEX):
o A literature survey was undertaken to determine the relative CAPEX of each technology.
o OPEX (energy cost) savings were qualitatively assessed based on the expected efficiency
improvements of the different technology options.
o Note that carbon pricing has not been taken into consideration. Carbon pricing could
favour higher CAPEX technologies in cases where they result in reduced compliance costs.
Technical Benefits and Barriers:
o A literature survey was undertaken to determine technical benefits and barriers
applicable to each technology.
o It has been assumed that technologies yet to be implemented at an operational LNG
facility will face higher technical barriers than those already implemented and
operational.
A detailed evaluation of refrigeration power source options, electricity source options, and heat recovery
/ heat integration options was undertaken since these are the technologies with the greatest potential to
impact facility emissions. Other GHG mitigation options identified in Section 3.2.5 are not expected to
have a significant impact on facility emissions and have therefore not been evaluated in detail.
4.1.1 Evaluation of Refrigeration Power Source Options
As discussed in Section 3.2.2, the power source for refrigeration may be a natural gas turbine (heavy duty
or aeroderivative), steam, or electricity.
44 Facilities included in the survey were Pluto, Snohvit, Qatargas I, Qatargas II, Australia Pacific, Gorgon, Gladstone, Sabine Pass, Corpus Christi, Cove Point, Jordan Cove, LNG Canada, Pacific Northwest, Goldboro, Woodfibre, Oman, Darwin, Freeport, Cameron, Nigeria LNG, and Egypt LNG.

Page 28
Nova Scotia LNG Facility GHG Mitigation Options Report
Prevalence of Technologies
Figure 10 displays the results of the survey of 21 LNG facilities with respect to the choice of the power
source for refrigeration. The bars show the number of new facilities within the commissioning year range
indicated that use either heavy duty turbines, aeroderivative turbines, or an electric motor to power
refrigeration compressors. Steam was not used as a refrigeration power source at any of the facilities
surveyed.
Figure 70 – Source of refrigeration power at LNG facilities, by year of commissioning.
Heavy duty turbines are the only power source used at facilities commissioned between 1996 and 2005.
Facilities commissioned in 2006 or later still commonly use heavy duty turbines; however, there is a trend
of increased use of electric motors and aeroderivative turbines. In total, of the 21 facilities surveyed, the
number of facilities that use or propose to use heavy duty turbines is 10 (48%), aeroderivative turbines is
7 (33%), and electric motors is 4 (19%). Heavy duty turbines are therefore the most prevalent technology
choice, followed by aeroderivative turbines and electric motors.
CAPEX and OPEX
Aeroderivative turbines have a higher capital cost than heavy duty turbines.45 Electric drive refrigeration
is the highest cost; however, the incremental cost over aeroderivative turbines may be minor.46 In terms
of operating costs, aeroderivative turbines will consume 5-13% less fuel than heavy duty turbines and may
improve facility availability by reducing maintenance time requirements. Operating costs for e-drive
45 Coyle, D.A., Durr, C.A., and D.K. Hill. (1998). “Cost Optimization,” The Contractor’s Approach. Available online: http://www.ivt.ntnu.no/ept/fag/tep4215/innhold/LNG%20Conferences/1998/Papers/7-3-Hill.PDF. 46 Kleiner, F. and S. Kauffman. (2005). All Electric Driven Refrigeration Compressors in LNG Plants Offer Advantages. Available online: http://www.energy.siemens.com/hq/pool/hq/energy-topics/pdfs/en/oil-gas/1_All_electric_driven_refrigeration.pdf.
0
2
4
6
8
10
1996-2000 2001-2005 2006-2010 2011-2015 2016-2020
# o
f N
ew F
acili
ties
Year of Commissioning
Heavy Duty E-Drive Aeroderivative

Page 29
Nova Scotia LNG Facility GHG Mitigation Options Report
facilities are highly dependent on the cost of electricity. In North America, electricity is currently more
expensive than natural gas, and therefore e-drive facilities will have higher operating costs. However, the
increase in operating costs may not be as high in Nova Scotia when compared with other North American
jurisdictions because gas prices are typically higher than the North American average.
Technical Benefits and Barriers47,48
Heavy Duty Turbines:
Limited speed range, require starter motors.
Longer maintenance time than aeroderivative turbines.
Aeroderivative Turbines:
Possible improvement in facility availability as a result of the ability to change out a gas generator or turbine within 48 hours versus 14 or more days for a heavy duty turbine.
Sensitive to high ambient temperatures (likely not an issue for a Nova Scotia facility).
While a relatively new technology for LNG facilities, the first facility to utilize aeroderivative turbines (Darwin LNG) has operated successfully for a number of years.49
E-Drive:
Only one operational facility uses e-drive for refrigeration power (Snohvit).
Require a stable, high-voltage electricity supply. o Unproven with grid electricity. Snohvit uses electricity generated on-site.
Potentially higher facility availability and lower compressor driver life cycle costs.
Negligible ambient temperature effect.
Reduced maintenance costs and downtime.
Classification
Heavy duty turbines are the most common and least capital intensive choice and therefore have been
classified as standard. Aeroderivative turbines have higher capital costs, but have been operated
successfully for a number of years and have lower operating costs. Aeroderivative turbines have therefore
been classified as no regrets. E-drive facilities are the most expensive in terms of capital and operating
costs. E-drive is therefore classified as beyond no regrets.
47 Meher‐Homji, C.B., Matthews, T., Pelagotti, A., and H.P. Weyermann. (2007). Gas Turbines and Turbocompressors for LNG Service. Proceedings of the Thirty-Sixth Turbomachinery Symposium. Available online: http://turbolab.tamu.edu/proc/turboproc/T36/ch15-meher_homji.pdf 48 P. Shah et al. (2013). 49 Meher‐Homji, C.B. et al. (2011). World’s First Aeroderivative Based LNG Liquefaction Plant – Design, Operational Experience and Debottlenecking. Proceedings of the First Middle East Turbomachinery Symposium. February 13-16, 2011, Doha, Qatar. Available online: http://iagt.conferencematerial.mobi/files/iagt14/Cyrus-%20METS%20Darwin%20LNG%20paper.pdf.

Page 30
Nova Scotia LNG Facility GHG Mitigation Options Report
4.1.2 Evaluation of Electricity Source Options
Figure 11 displays the results of the survey of 21 LNG facilities with respect to the choice of electricity
source. The discussion of heavy duty and aeroderivative turbines in the preceding section applies to
electricity source options as well, and the classifications remain unchanged.
Prevalence of Technologies
Figure 11 – Electricity source at new facilities, by year of commissioning.
As with the refrigeration power choice, heavy duty turbines are the most common choice for electricity
generation in older facilities. Over the past ten years, there have been a few commissioned facilities that
utilize aeroderivative turbines. Proposed facilities plan to use various options, including heavy duty
turbines, aeroderivative turbines, grid electricity, a dedicated combined cycle power plant (outside the
fence), or steam turbines that leverage waste heat recovered from the refrigeration driver.
CAPEX and OPEX
Steam turbines driven by recovered waste heat and boilers may have a lower capital cost than heavy duty
or aeroderivative turbines.50 Fuel costs are also reduced since the efficiency of this set-up is similar to a
combined cycle power plant. Capital costs associated with connecting a facility to a local electricity grid
are highly dependent on the distance of the facility from power lines of an appropriate voltage. For
facilities in remote locations, this is likely not a viable option. Operating costs may also be higher,
depending on the price of electricity in the jurisdiction where the facility is located. One proposed facility
(Jordan Cove) plans to build a new, outside the fence, combined cycle power plant to provide the facility
with electricity for auxiliary power and refrigeration power. The capital cost of this option is the highest;
50 Meher‐Homji et al. (2007).
0
2
4
6
8
10
1996-2000 2001-2005 2006-2010 2011-2015 2016-2020
# o
f N
ew F
acili
ties
Year of Commissioning
Heavy Duty Aeroderivative Grid Combined Cycle Heat Recovery Steam Turbine

Page 31
Nova Scotia LNG Facility GHG Mitigation Options Report
however, fuel costs will be similar to or lower than the heat recovery with steam turbines option. The
combined cycle power plant would also have the option of generating excess electricity to sell to the grid
to increase revenues (though this would require establishing a grid connection with associated costs).
Technical Benefits and Barriers (for options not already covered in Section 4.1.1)
Heat Recovery Steam Turbines:51
Higher efficiency than aeroderivative or heavy duty turbines.
More complex to operate.
Not currently used in any operational facility.
Grid Electricity:
Requires a stable grid connection.
Interconnection with the electricity grid may require running new power lines through difficult
terrain.
May not be possible to serve the load considering system hubs and pinch points.
Outside the Fence Combined Cycle Power Plant:
Combined cycle power plants have been operated successfully for decades.
The major risk with this set-up is associated with e-drive technology, which was discussed in the
previous section.
Classification
Steam turbines driven by recovered waste heat and boilers have low capital costs, but are more complex
to operate and have not been proven in an operational LNG facility; however, the technology is common
in other applications such as combined cycle gas turbines and cogeneration. As such, it is not expected
that implementation of this technology within a LNG facility will prove challenging. This option is therefore
classified as no regrets. Implementing grid electricity for auxiliary power should not incur significant
capital costs if there are power distribution lines of appropriate voltage located in close proximity to the
facility. However, if extensive new lines need to be built or existing lines upgraded the costs may be
significant. There is also no precedent for using grid electricity at a LNG facility, although the technical
barriers do not appear significant. Grid electricity has been classified as no regrets for a simple
interconnection with the grid and beyond no regrets for interconnections that require extensive power
lines to be constructed, as would likely be the case in Nova Scotia. An outside the fence combined cycle
power plant has been classified as beyond no regrets since it is the option with the highest capital costs.
51 Meher‐Homji et al. (2007).

Page 32
Nova Scotia LNG Facility GHG Mitigation Options Report
4.1.3 Evaluation of Heat Integration / Heat Recovery Options
One option for heat recovery and integration, heat recovery steam turbines, was discussed in the
preceding section. The other option is to use recovered heat for process heating in the AGRU and
dehydration units. Figure 12 below shows the prevalence of this type of heat recovery.
Figure 12 – Heat recovery for process heating at new facilities, by year of commissioning.
As shown in the figure, heat recovery for process heating is very common in facilities commissioned within
the last ten years and in proposed facilities. While there are some extra capital costs associated with heat
recovery, the technology is highly prevalent and therefore has been classified as standard for new LNG
facilities.
4.2 Nova Scotia Model Facilities
Based on the above technology analysis, model facilities were developed based on anticipated operating
conditions in Nova Scotia. Assumptions made for modeling these facilities include the following:
The LNG production capacity is 10 mtpa.
The feed gas is pipeline gas with 0.8 mol% CO2.
The liquefaction process is C3/MR™, Optimized Cascade®, DMR, or another process with an
equivalent efficiency.
The following grid emission factors for Nova Scotia were used: 0.79 t-CO2e/MWh (2012), 0.48 t-
CO2e/MWh (2020 and 2025), and 0.41 t-CO2e/MWh (2030).
The table below summarizes the technologies utilized at the five facilities modeled. Note that some
options discussed in Section 3 are not included in the model facility scenarios. For example, CCS could
achieve minor reductions (maximum of 5%) at the assumed pipeline CO2 concentration. CCS could be
0
1
2
3
4
5
6
7
8
1996-2000 2001-2005 2006-2010 2011-2015 2016-2020
# o
f N
ew F
acili
ties
Year of Commissioning
Heat Recovery No Heat Recovery

Page 33
Nova Scotia LNG Facility GHG Mitigation Options Report
included in a beyond no regrets scenario; however, given the high capital costs associated with CCS it was
not deemed economically viable and has not been included with the facilities modelled.
Also, there could be an option to connect a facility to dedicated renewable electricity sources. This would
reduce emissions associated with electricity generation at all facilities connected to the grid option or an
‘outside-the-fence’ electricity supply. Given the uncertainties associated with grid emission factor forecast
should a LNG facility become grid connected, this option has not been specifically modelled. However, it
is an option worth investigating further since the addition of dedicated renewables to a grid connected
facility could ease some of the power demand on the grid.
Table 1 – Technological characteristics of the Nova Scotia model facilities.
Compressor Driver
Electricity Source Waste Heat Recovery Classification
Heavy Duty Heavy Duty
Turbines Heavy Duty
Turbines Yes, for inlet gas
conditioning units Standard
Aeroderivative Aeroderivative
Turbines Aeroderivative
Turbines Yes, for inlet gas
conditioning units No Regrets
Advanced Heat Integration
Heavy Duty Turbines
Steam Electricity Generation
Yes, for electricity generation
No Regrets
Grid e-LNG Electric Motors Grid Electricity Not applicable Beyond No Regrets
Combined Cycle e-LNG
Electric Motors Outside the Fence Combined Cycle
Power Plant
Yes, in the combined cycle power plant for electricity generation
Beyond No Regrets
Each of these five options is also illustrated in the diagrams below.
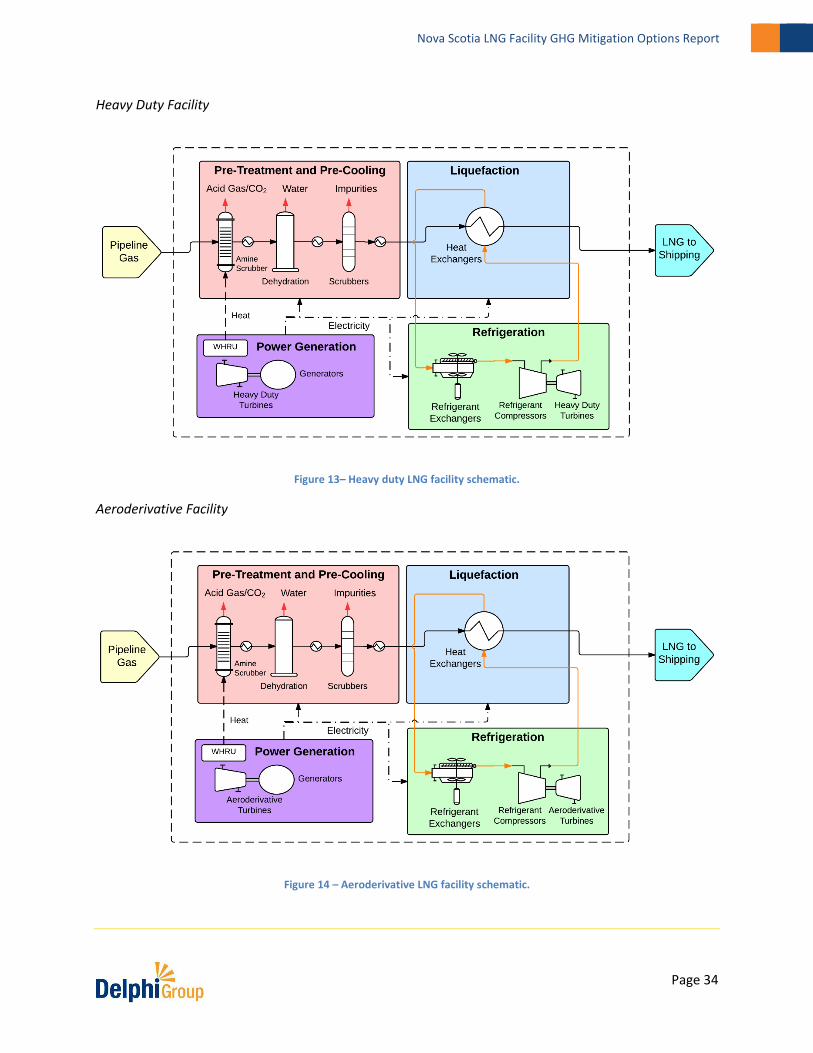
Page 34
Nova Scotia LNG Facility GHG Mitigation Options Report
Heavy Duty Facility
Figure 13– Heavy duty LNG facility schematic.
Aeroderivative Facility
Figure 14 – Aeroderivative LNG facility schematic.
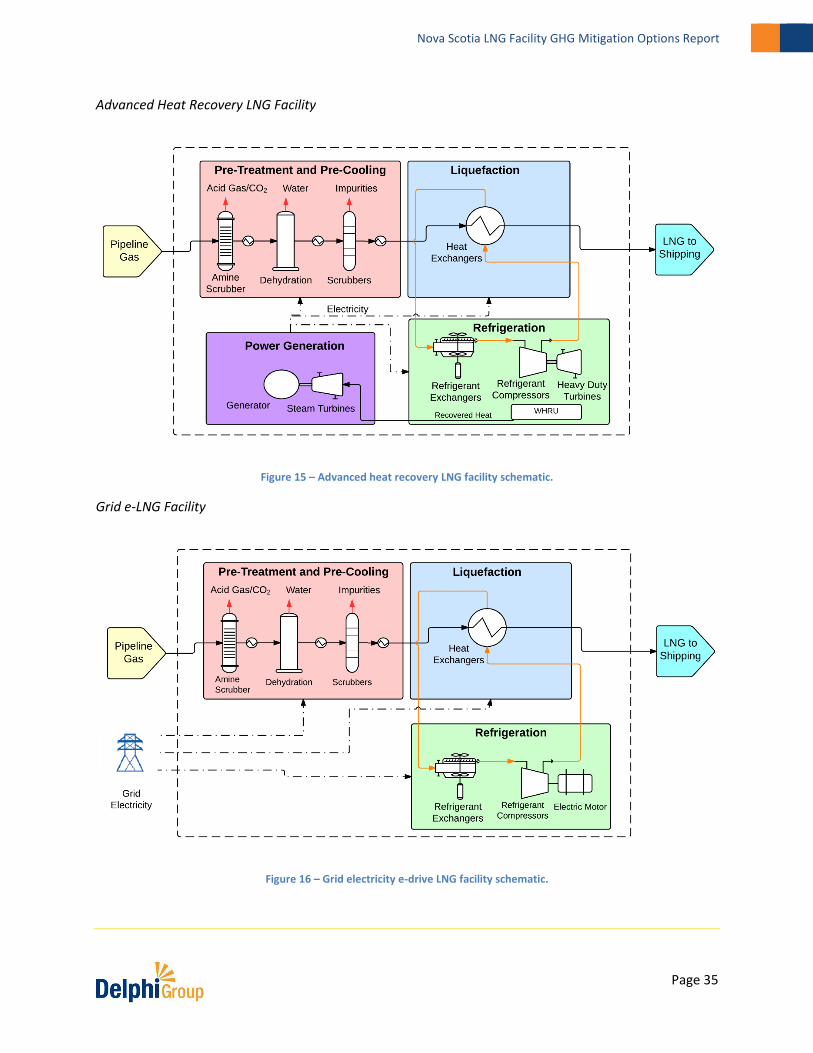
Page 35
Nova Scotia LNG Facility GHG Mitigation Options Report
Advanced Heat Recovery LNG Facility
Figure 15 – Advanced heat recovery LNG facility schematic.
Grid e-LNG Facility
Figure 16 – Grid electricity e-drive LNG facility schematic.

Page 36
Nova Scotia LNG Facility GHG Mitigation Options Report
Combined Cycle e-LNG Facility
Figure 17 – Combined cycle e-drive LNG facility schematic.
4.3 GHG Intensities of Model Facilities
GHG intensities of the model facilities were estimated using published refrigeration and electric power
requirements, turbine efficiencies, compressor efficiencies, average flaring and fugitive emissions from
operational facilities, and various other emission factors and assumptions.
The greenhouse gas intensities in tonne-CO2e per tonne of LNG produced are presented below in Figure
18. Note that the error bars represent ± 10% of the GHG intensity value and these have been included to
demonstrate that there is some uncertainty associated with the intensity estimates. As would be
expected, the Heavy Duty (standard) facility has the highest GHG intensity, 0.35 t-CO2e / t-LNG. The
Aeroderivative and Advanced Heat Integration facilities (no regrets) have lower intensities, 0.28 and 0.24
t-CO2e / t-LNG, respectively. Three intensities are shown for the grid e-LNG facility (beyond no regrets),
calculated using the 2012 grid emission factor (0.79 t-CO2e / MWh), the anticipated 2020-2025 grid
emission factor (0.48 t-CO2e / MWh), and the anticipated 2030 grid emission factor (0.41 t-CO2e / MWh).
The 2020-2025 e-LNG facility has an intensity of 0.26 t-CO2e / t-LNG, which is slightly higher than the
Advanced Heat Integration Facility. However, note that the addition of a large power consumer to the grid
such as a LNG facility will likely require changes to the anticipated electricity supply sources, thereby
altering the grid emission factor. The combined cycle e-LNG facility has the lowest GHG intensity of all
facilities modelled, 0.21 t-CO2e / t-LNG.

Page 37
Nova Scotia LNG Facility GHG Mitigation Options Report
Figure 18 – GHG intensities of Nova Scotia model facilities.
0.00
0.10
0.20
0.30
0.40
0.50
GH
G In
ten
sity
(t-
CO
2e/
t-LN
G)
2012 Grid
2020-2025 Grid
2030Grid
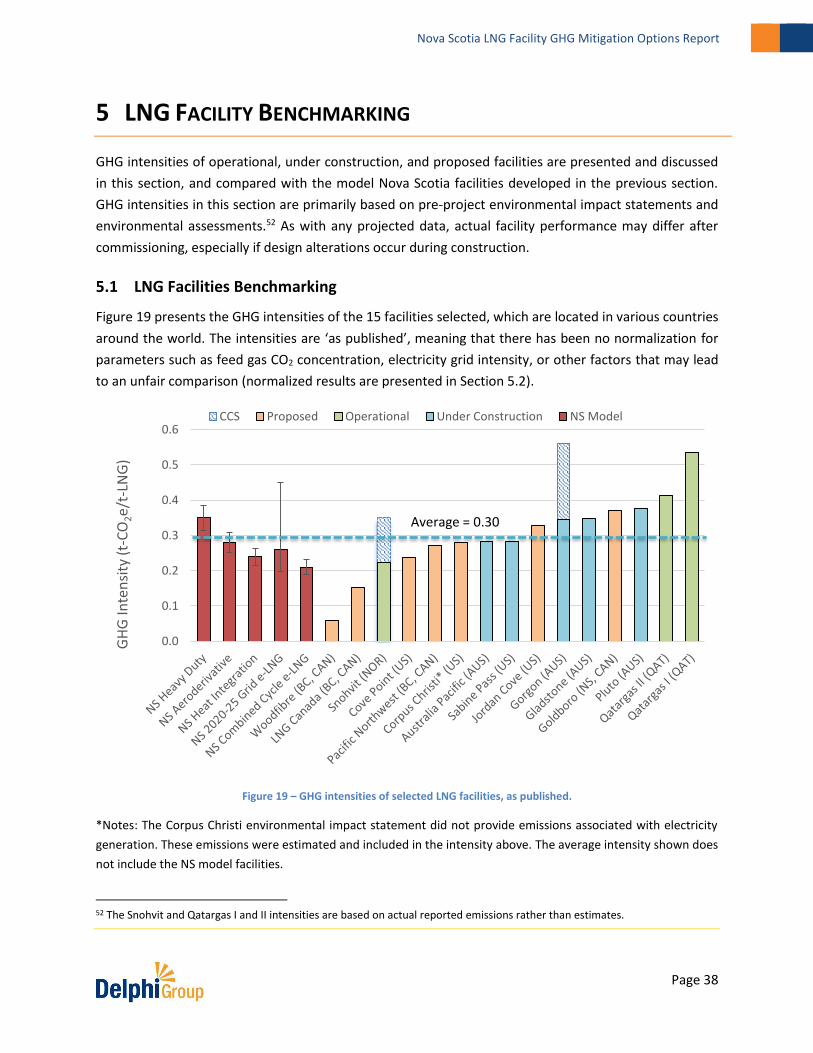
Page 38
Nova Scotia LNG Facility GHG Mitigation Options Report
5 LNG FACILITY BENCHMARKING
GHG intensities of operational, under construction, and proposed facilities are presented and discussed
in this section, and compared with the model Nova Scotia facilities developed in the previous section.
GHG intensities in this section are primarily based on pre-project environmental impact statements and
environmental assessments.52 As with any projected data, actual facility performance may differ after
commissioning, especially if design alterations occur during construction.
5.1 LNG Facilities Benchmarking
Figure 19 presents the GHG intensities of the 15 facilities selected, which are located in various countries
around the world. The intensities are ‘as published’, meaning that there has been no normalization for
parameters such as feed gas CO2 concentration, electricity grid intensity, or other factors that may lead
to an unfair comparison (normalized results are presented in Section 5.2).
Figure 19 – GHG intensities of selected LNG facilities, as published.
*Notes: The Corpus Christi environmental impact statement did not provide emissions associated with electricity
generation. These emissions were estimated and included in the intensity above. The average intensity shown does
not include the NS model facilities.
52 The Snohvit and Qatargas I and II intensities are based on actual reported emissions rather than estimates.
0.0
0.1
0.2
0.3
0.4
0.5
0.6
GH
G In
ten
sity
(t-
CO
2e/
t-LN
G)
CCS Proposed Operational Under Construction NS Model
Average = 0.30

Page 39
Nova Scotia LNG Facility GHG Mitigation Options Report
The facilities selected are for the most part newer facilities that implement at least some energy efficiency
and GHG mitigation technologies (with the exception of Qatargas I). Three facilities benchmarked are
operational, which is a small percentage of the approximately 25 facilities operational in the world. The
GHG intensities of Qatargas I and II are likely to be more representative of these operational facilities since
the majority were constructed before efficient technologies such as aeroderivative turbines were first
used in the LNG industry. As such, the average intensity shown on the benchmarking chart (0.30 t-CO2e /
t-LNG) should not be thought of as an average of all global facilities. It is the average of the facilities chosen
for benchmarking, which are newer and more efficient than most operational facilities.
The intensities of the Nova Scotia facilities are as in Section 4. Note that for the Grid e-LNG facility, the
intensity shown was calculated with the forecasted 2020-2025 grid factor. This is the approximate
timeframe during which LNG facilities could be expected to become operational. The error bars represent
the emissions intensity of this facility using the 2012 grid factor for the high intensity and the forecast
2030 emission factor for the low intensity.
Woodfibre and LNG Canada are proposed facilities that will be located in British Columbia. The low GHG
intensities associated with these facilities is primarily a result of the very low electricity grid emission
factor in BC. Power requirements at Woodfibre will be entirely met by the BC grid, and as a result GHG
emissions associated with refrigeration and auxiliary power are expected to be near-zero. The only
sources of emissions at the facility are associated with back-up generators, acid gas venting, flaring, and
fugitives. The LNG Canada facility will be powered with grid electricity only partially, for auxiliary power.
Refrigeration power will be provided by aeroderivative turbines, and for this reason the GHG intensity of
the LNG Canada facility will be higher than Woodfibre.
Snohvit is a low intensity facility located in northern Norway. It was the first facility to power refrigeration
compressors with electric motors, as well as the first to incorporate CCS. Without CCS, Snohvit would have
an above-average GHG intensity because the raw gas processed has a high CO2 concentration, up to 7.9
mol%.
Cove Point is a proposed facility to be located on the east coast of the United States. The facility is similar
to the NS Advanced Heat Integration model facility in that it uses steam turbines driven by recovered
waste heat for electricity generation.
Australia Pacific and Sabine Pass use aeroderivative turbines to supply refrigeration power, and as a result
are less GHG intensive than facilities such as Goldboro, Gorgon, Pluto, and Qatargas I and II. These more
emissions intensive facilities all use heavy duty turbines for both auxiliary and refrigeration power
generation. They are comparable to the NS Heavy Duty model facility.
For each facility, information related to start year, capacity, power sources, and feed gas type is presented
on the following page in Table 2.

Page 40
Nova Scotia LNG Facility GHG Mitigation Options Report
Table 2 – Technical information for global facilities benchmarked.
Country Facility Name
Published GHG
Intensity (t-CO2e / t-
LNG)
Start Year
Capacity (mtpa)
# of Trains Feed Gas Inlet CO2
Concentration Liquefaction
Process Refrigeration Power
Source Electricity
Source
Qatar Qatargas I 0.54 1997 9.5 3 Processed offshore gas. 2.1% AP-X Direct drive heavy duty
gas turbines Heavy duty gas
turbines
Norway Snohvit 0.22 2007 4.2 1 Unprocessed offshore gas 7.9% Mixed Fluid
Cascade E-drive. Aeroderivative gas turbines
Qatar Qatargas II 0.41 2009 15.6 2 Unprocessed offshore gas 2.1% AP-X Direct drive heavy duty
gas turbines Heavy duty gas
turbines
Australia Pluto 0.38 2012 4.3 1 Unprocessed offshore gas 2.0% C3/MR Direct drive heavy duty
gas turbines Heavy duty gas
turbines
Australia Australia Pacific 0.28 2015 9 4 Pipeline 1.0% Optimized
Cascade Direct drive aeroderivative
gas turbines Heavy duty gas
turbines
Australia Gorgon 0.34 2015 15.6 3 Unprocessed offshore gas 9.4% C3/MR Direct drive heavy duty
gas turbines Heavy duty gas
turbines
Australia Gladstone 0.35 2015 7.8 3 Unprocessed offshore gas Not available Optimized
Cascade Direct drive aeroderivative
gas turbines Aeroderivative
gas turbines
LA, US Sabine Pass 0.28 2015 18 4 Pipeline 1.3% Optimized
Cascade Direct drive aeroderivative
gas turbines Heavy duty gas
turbines
MD, US Cove Point 0.24 2017 7.8 1 Pipeline Not available C3/MR Direct drive heavy duty gas turbines Steam turbines
BC, Canada Woodfibre 0.059 2017 2.1 1 Pipeline Not available SMR E-drive BC Grid
TX, US Corpus Christi 0.28 2018 13.5 3 Pipeline Not available Optimized
Cascade Direct drive aeroderivative
turbines TBD - Proposed Grid Electricity
OR, US Jordan Cove 0.33 2018 6 4 Pipeline Not available Mixed
Refrigerant E-drive Combined cycle gas power plant
BC, Canada
Pacific Northwest 0.27 2018 19.2 3 Pipeline Not available C3/MR Direct drive aeroderivative
gas turbines Aeroderivative
gas turbines NS, Canada Goldboro 0.37 2018 10 2 Pipeline 2.1% C3/MR Direct drive heavy duty
gas turbines Heavy duty gas
turbines BC, Canada
LNG Canada 0.15 2019-
2020 26 4 Pipeline 0.8% DMR Direct drive aeroderivative gas turbines BC Grid

Page 41
Nova Scotia LNG Facility GHG Mitigation Options Report
5.2 Normalized LNG Facilities Benchmarking
Figure 20 presents the GHG intensities of the 15 facilities selected, along with the intensities of the model
Nova Scotia facilities. The intensities have been normalized to align with the feed gas and electricity
emission factor assumptions used to calculate the Nova Scotia facilities intensities (0.8 mol% and 0.48 t-
CO2e / MWh). For the two facilities that incorporate CCS (Gorgon and Snohvit) it has been assumed that
CCS would no longer be used to reduce acid gas venting emissions when the feed gas has a low
concentration of CO2. Emissions associated with the extra power required to capture and compress CO2
in the acid gas stream have been subtracted from Gorgon and Snohvit for the normalization.
Figure 20 – Normalized intensities of selected LNG facilities, 0.8 mol% CO2 feed gas and 2020-25 NS grid factor.
A second normalized benchmarking is shown below in Figure 21. This benchmarking shows the intensities
of facilities assuming a feed gas of 2 mol%, which represents the most likely maximum CO2 concentration
in Nova Scotia pipeline gas.
0
0.1
0.2
0.3
0.4
0.5
0.6
GH
G In
ten
sity
(t-
CO
2e/
t-LN
G)
Proposed Operational Under Construction NS Model
Average = 0.30

Page 42
Nova Scotia LNG Facility GHG Mitigation Options Report
Figure 21 – Normalized intensities of selected LNG facilities, 2 mol% CO2 feed gas and 2020-25 NS grid factor.
In comparing the Nova Scotia model facilities with the other facilities, it may be seen that all NS model
facilities are below the average intensity (average does not include the NS model facilities) of 0.30 t-CO2e
/ t-LNG (or 0.34 t-CO2e / t-LNG for 2% feed gas CO2 concentration), except for the Heavy Duty facility. This
is not unexpected since the Heavy Duty facility incorporates the lowest capital cost and least efficient
process technologies, whereas over half of the global facilities benchmarked incorporate at least some of
the technologies classified as no regrets.
The NS Aeroderivative facility has an intensity slightly below the average. The Advanced Heat Integration,
Grid e-LNG, and Combined Cycle e-LNG have lower intensities, approaching, but still higher than the best
in class intensities of Snohvit and LNG Canada. However, given the very low grid factor in BC, it is unlikely
that a facility located in Nova Scotia could be comparable to Woodfibre or LNG Canada without
normalization for the electricity grid factor. Facilities in Nova Scotia could still compare favorably with
global facilities without normalization. The emissions intensity associated with the Advanced Heat
Integration facility is lower than the majority of world facilities, and as discussed in Section 4, capital costs
may be comparable to or lower than the Heavy Duty or Aeroderivative facility.
0
0.1
0.2
0.3
0.4
0.5
0.6
GH
G In
ten
sity
(t-
CO
2e/
t-LN
G)
Proposed Operational Under Construction NS Model
Average = 0.34

Page 43
Nova Scotia LNG Facility GHG Mitigation Options Report
6 MEASUREMENT AND REPORTING CONSIDERATIONS
The following recommendations and guidelines are offered with respect to measuring, estimating, and
reporting on GHG emissions from LNG facilities. This is not intended to provide a comprehensive set of
detailed requirements for GHG reporting. Rather, the aim is to identify key approaches and assumptions
that should be considered in order to prepare reasonably accurate estimates of emissions while ensuring
consistency in approach between facilities. Emphasis is placed on estimates prepared prior to facility
operation where various assumptions and estimates must necessarily be used.
6.1 Assessment boundary
The GHG assessment boundary for a LNG facility is typically set as the direct and energy-indirect (e.g. grid
electricity generation) emissions associated with activities occurring within the physical facility boundary,
from receipt of feed gas to loading of produced LNG at a shipping terminal.
Where full ‘value-chain’ reporting is to be done, the assessment boundary would expand to encompass
extraction, processing, and transportation of natural gas to the facility, shipping of LNG to end-use
consumers, and potentially other indirect emission sources as well. Since the focus of this report is on
liquefaction facility emissions and not the broader value-chain, the remainder of this section is focused
on assessing facility emissions.
Regardless of boundary chosen, it is essential that boundaries be transparently presented when reporting
emissions to ensure that ‘apples-to-apples’ comparisons can be made.

Page 44
Nova Scotia LNG Facility GHG Mitigation Options Report
6.2 Quantification methods
The table below summarizes typical GHG emission sources associated with LNG facilities and related methods and assumptions that would typically
be used to quantify associated emissions.
Table 3 – Measurement and reporting considerations - quantification methods.
Emission Source Description Typical
Magnitude Typical Calculation
Method Key Assumptions /
Parameters Emission Factors
Energy for refrigeration compression and auxiliary electrical loads
On-site fossil fuel combustion (typically natural gas) and/or generation of grid electricity to drive the compressors and supply other electrical loads
Very Large On-site Combustion: (volume of fuel combusted) X (emission factor)
Volume of fuel combusted – based on equipment specifications and facility production, or monitored fuel use during facility operation
If pipeline gas, default emission factors for Nova Scotia could be
used (e.g. from NIR53); better
would be to use gas composition (mole fraction) analysis and derive CO2 emission factor using carbon mass balance + use default CH4 and N2O factors
Grid / off-site electricity generation: (quantity of electricity consumed) X (emission factor)
Quantity of electricity - based on equipment specifications and facility production, or monitored electricity consumption during facility operation
Provincial average emission factors (e.g. from NIR or NS Environment) and/or factors specific to generation types where power is purchased from specific generating assets. Note that grid factors can vary over time if the supply mix is expected to change. When comparing against emissions from other facilities, ensure a consistent grid factor is assumed
53 Environment Canada (2014).
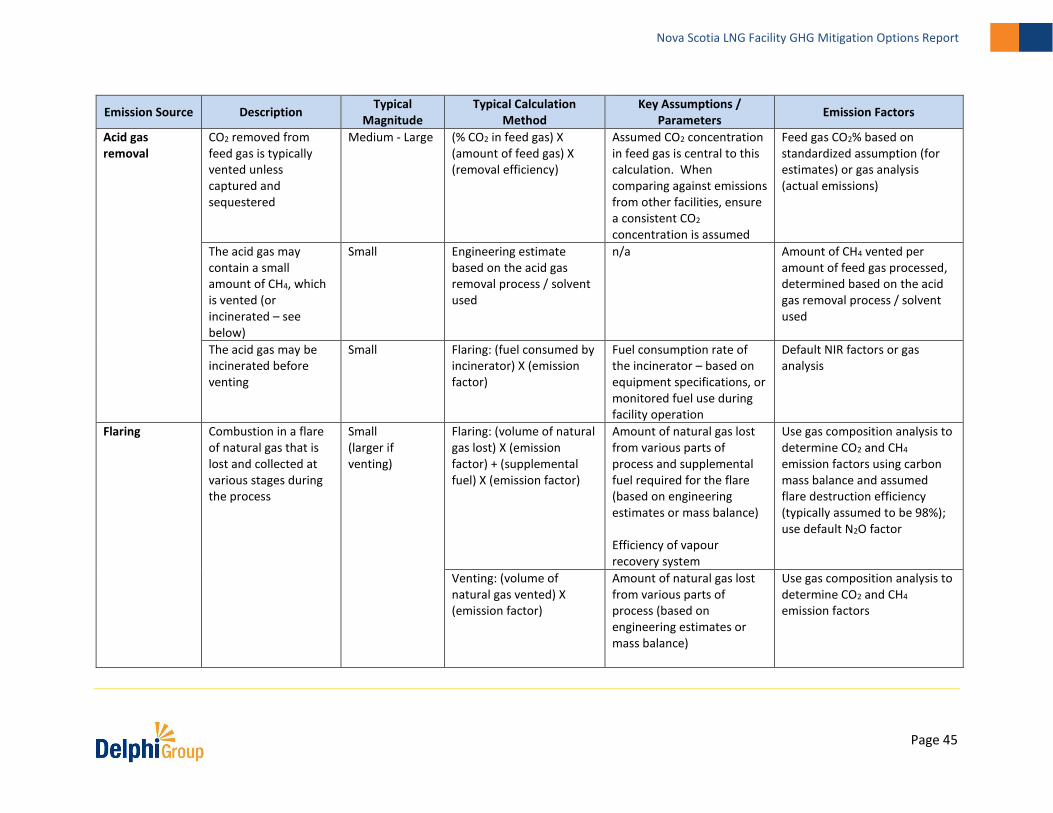
Page 45
Nova Scotia LNG Facility GHG Mitigation Options Report
Emission Source Description Typical
Magnitude Typical Calculation
Method Key Assumptions /
Parameters Emission Factors
Acid gas removal
CO2 removed from feed gas is typically vented unless captured and sequestered
Medium - Large (% CO2 in feed gas) X (amount of feed gas) X (removal efficiency)
Assumed CO2 concentration in feed gas is central to this calculation. When comparing against emissions from other facilities, ensure a consistent CO2 concentration is assumed
Feed gas CO2% based on standardized assumption (for estimates) or gas analysis (actual emissions)
The acid gas may contain a small amount of CH4, which is vented (or incinerated – see below)
Small Engineering estimate based on the acid gas removal process / solvent used
n/a Amount of CH4 vented per amount of feed gas processed, determined based on the acid gas removal process / solvent used
The acid gas may be incinerated before venting
Small Flaring: (fuel consumed by incinerator) X (emission factor)
Fuel consumption rate of the incinerator – based on equipment specifications, or monitored fuel use during facility operation
Default NIR factors or gas analysis
Flaring Combustion in a flare of natural gas that is lost and collected at various stages during the process
Small (larger if venting)
Flaring: (volume of natural gas lost) X (emission factor) + (supplemental fuel) X (emission factor)
Amount of natural gas lost from various parts of process and supplemental fuel required for the flare (based on engineering estimates or mass balance) Efficiency of vapour recovery system
Use gas composition analysis to determine CO2 and CH4 emission factors using carbon mass balance and assumed flare destruction efficiency (typically assumed to be 98%); use default N2O factor
Venting: (volume of natural gas vented) X (emission factor)
Amount of natural gas lost from various parts of process (based on engineering estimates or mass balance)
Use gas composition analysis to determine CO2 and CH4 emission factors

Page 46
Nova Scotia LNG Facility GHG Mitigation Options Report
Emission Source Description Typical
Magnitude Typical Calculation
Method Key Assumptions /
Parameters Emission Factors
(100% minus Efficiency of vapour recovery system)
Removal of inert gases from feed gas
If the feed gas contains significant amounts of inerts such as nitrogen, these compounds must be purged from the feed gas prior to liquefaction. Some methane will also be emitted during this process
Very Small Engineering estimate based on processes used and feed gas composition
n/a Amount of CH4 removed per amount of feed gas processed, determined based on specific processes and feed gas composition
Fugitives CH4 emissions from leaky fittings, valves, other equipment.
Very Small (volume of natural gas fugitively released) X (emission factor)
Amount of gas fugitively released per year or per amount of LNG produced Volume released estimated using equipment and valve counts and published leak rates. API is one reference source for leak rates.
Use gas composition analysis to determine CO2 and CH4 emission factors
Auxiliary fuels Testing of back-up generators, fire pumps, heaters, other equipment.
Very Small Likely immaterial for most facilities
(volume of fuel combusted) X (emission factor)
n/a Default NIR factors

Page 47
Nova Scotia LNG Facility GHG Mitigation Options Report
6.3 Reported Emissions
LNG GHG emissions are commonly reported in both ‘absolute’ units (metric tonnes of carbon dioxide
equivalent per year – CO2e / year) and intensity units (tonnes CO2e per tonne of LNG produced). The
amount of emissions in CO2e units is determined by multiplying the amounts of individual GHGs (e.g. CO2,
CH4, and N2O) by their respective global warming potentials (GWPs). Since GWPs can change as scientific
understanding of climate change processes increases, it is best practice to calculate the amounts of
individual GHGs separately prior to then multiplying by GWPs and summing to a single CO2e value (as
opposed to using CO2e emission factors that have assumed GWPs embedded in them), as this will allow
easy updating of emissions estimates if GWPs are updated.
Emissions intensity is most commonly used for comparing facility emissions to other facilities or
established benchmarks (since differences in facility size are factored out when dividing by LNG
production), whereas absolute emissions is commonly used when reporting emissions to government
reporting programs and assessing the overall climate change impact of facility operations.

Page 48
Nova Scotia LNG Facility GHG Mitigation Options Report
7 REFERENCES
Barclay, M. and T. Shukri. (2007). Enhanced Single Mixed Refrigerant Process for Stranded Gas Liquefaction. LNG
15 International Conference. Available online:
http://www.ivt.ntnu.no/ept/fag/tep4215/innhold/LNG%20Conferences/2007/fscommand/PO_24_Barclay_s.pdf.
British Columbia Ministry of Environment. (October 20, 2014). Greenhouse Gas Industrial Reporting & Control Act.
Available online: http://engage.gov.bc.ca/lnginbc/files/2014/03/Cleanest-LNG-Facilities.pdf.
Bronfenbrenner, J.C., Pillarella, M., and J. Solomon. (2009). Selecting a Suitable Process for the Liquefaction of
Natural Gas. Available online: http://www.airproducts.com/~/media/Files/PDF/industries/lng-selecting-suitable-
process-technology-liquefaction-natural-gas.pdf.
Caswell, C., Durr, C., Kotzot, H., and D. Coyle. (2011). Additional Myths About LNG. Available online:
http://www.kbr.com/Newsroom/Publications/Technical-Papers/Additional-Myths-about-LNG.pdf.
Cheniere Energy. (2013). Resource Report 9 – Air and Noise Quality. Available online:
http://www.cheniere.com/CQP_documents/Expansion_RR09.pdf.
Coyle, D.A., Durr, C.A., and D.K. Hill. (1998). “Cost Optimization,” The Contractor’s Approach. Available online:
http://www.ivt.ntnu.no/ept/fag/tep4215/innhold/LNG%20Conferences/1998/Papers/7-3-Hill.PDF.
Chevron Australia. (2009). Gorgon Gas Development and Jansz Feed Gas Pipeline: Greenhouse Gas Abatement
Program. Available online: http://www.chevronaustralia.com/docs/default-source/default-document-
library/gorgon-emp-greenhouse-gas-abatement-program.pdf?sfvrsn=2.
Clean Energy Canada. (2013). The Cleanest LNG in the World? How to Slash Carbon Pollution from Wellhead to
Waterline in British Columbia’s Proposed Liquefied Natural Gas Industry. Available online:
http://cleanenergycanada.org/wp-content/uploads/2013/09/CEC_Cleanest_LNG_World.pdf.
Environment Canada. (2014). National Inventory Report: Greenhouse Gas Sources and Sinks in Canada. Available
online:
http://unfccc.int/national_reports/annex_i_ghg_inventories/national_inventories_submissions/items/8108.php.
Federal Energy Regulatory Commission. (May 2014). Environmental Assessment for the Cove Point Liquefaction
Project.http://www.ferc.gov/industries/gas/enviro/eis/2014/05-15-14-ea/ea.pdf.
Federal Energy Regulatory Commission. (June 2014). Corpus Christi LNG Project. Draft Environmental Impact
Statement. Available online: http://energy.gov/sites/prod/files/2014/10/f18/EIS-0493-FEIS-2014.pdf.
Federal Energy Regulatory Commission. (June 2014). Freeport LNG Liquefaction Project Phase II Modification
Project. Final Environmental Impact Statement. Available online:
http://energy.gov/sites/prod/files/2014/07/f17/EIS-0487-FERC-FEIS-2014.pdf.

Page 49
Nova Scotia LNG Facility GHG Mitigation Options Report
Federal Energy Regulatory Commission. (November 2014). Jordan Cove Draft Environmental Impact Statement.
Available online: https://www.ferc.gov/industries/gas/enviro/eis/2014/11-07-14-eis.asp.
GE. (2014). 6B.03 Heavy Duty Gas Turbine. Image available online:
https://powergen.gepower.com/content/dam/gepower-
powergen/global/en_US/documents/product/gas%20turbines/Posters/6b03-poster.pdf.
GE. (2014). LMS100 Brochure. Available online: https://www.ge-
distributedpower.com/component/cck/?task=download&file=seb_media_document&id=4094.
Government of British Columbia Environmental Assessment Office. (2014). Application for an Environmental
Assessment Certificate received from Pacific NorthWest LNG Limited Partnership. Available online:
http://a100.gov.bc.ca/appsdata/epic/html/deploy/epic_document_396_37423.html
Government of British Columbia Environmental Assessment Office. (2014). Application for an Environmental
Assessment Certificate received from LNG Canada Development Inc. Available online:
http://a100.gov.bc.ca/appsdata/epic/html/deploy/epic_document_398_38157.html.
Government of British Columbia Environmental Assessment Office. (2015). Application for an Environmental
Assessment Certificate received from Woodfibre LNG Ltd. Available online:
http://a100.gov.bc.ca/appsdata/epic/html/deploy/epic_document_408_38525.html.
International Gas Union. (2014). World LNG report 2014. Available online:
http://www.igu.org/sites/default/files/node-page-field_file/IGU%20-%20World%20LNG%20Report%20-
%202014%20Edition.pdf.
Hatch. (February 2014). Reviewing Electrical Substation Maintenance Practices at Nova Scotia Power. Available
online: http://www.hatch.ca/News_Publications/Energy_Innovations/February2014/novascotiapower.htm.
Hansen, O. et al. (2011). Monitoring CO2 Injection into a Fluvial Brine-Filled Sandstone Formation at the Snohvit
Field, Barents Sea. SEG San Antonio 2011 Annual Meeting. Available online:
http://www.slb.com/~/media/Files/technical_papers/seg/seg2011811.pdf.
Honore, A. (January 2011). Economic Recession and Natural Gas Demand in Europe: What Happened in 2008-
2011? The Oxford Institute for Energy Studies. Available online:
http://citeseerx.ist.psu.edu/viewdoc/download?doi=10.1.1.398.1589&rep=rep1&type=pdf.
Josten, M. and J. Kennedy (June 2008). BP Develops Studied Approach to Liquefaction in an Arctic Climate. LNG
Journal. June 2008 Issue, pp. 28-30.
Kleiner, F. and S. Kauffman. (2005). All Electric Driven Refrigeration Compressors in LNG Plants Offer Advantages.
Available online: http://www.energy.siemens.com/hq/pool/hq/energy-topics/pdfs/en/oil-
gas/1_All_electric_driven_refrigeration.pdf.

Page 50
Nova Scotia LNG Facility GHG Mitigation Options Report
Kotzot, H. Durr, C., Coyle, D., and C. Caswell. (2007). LNG Liquefaction – Not All Plants Are Created Equal. Available
online: http://www.kbr.com/newsroom/publications/technical-papers/lng-liquefaction-not-all-plants-are-created-
equal.pdf.
KPMG. (July 18, 2014). Pacific Northwest LNG Limited Partnership. Summary: Independent Review of Power
Options Evaluation and Selection Process. Available online: http://pacificnorthwestlng.com/wp-
content/uploads/2013/02/PNW_Partnership-report_v.19_WEB.pdf.
Liquefied Natural Gas Ltd. Improved LNG Process. Better Economics for Future Projects. Available online:
http://www.lnglimited.com.au/IRM/Company/ShowPage.aspx?CPID=1455&EID=56380866
Liquefied Natural Gas Limited. (2015). Bear Head LNG. Available online:
http://www.lnglimited.com.au/irm/content/bear-head-lng.aspx?RID=331.
Meher‐Homji, C.B., Matthews, T., Pelagotti, A., and H.P. Weyermann. (2007). Gas Turbines and Turbocompressors
for LNG Service. Proceedings of the Thirty-Sixth Turbomachinery Symposium. Available online:
http://turbolab.tamu.edu/proc/turboproc/T36/ch15-meher_homji.pdf.
Meher‐Homji, C.B. et al. (2011). World’s First Aeroderivative Based LNG Liquefaction Plant – Design, Operational
Experience and Debottlenecking. Proceedings of the First Middle East Turbomachinery Symposium. February 13-
16, 2011, Doha, Qatar. Available online: http://iagt.conferencematerial.mobi/files/iagt14/Cyrus-
%20METS%20Darwin%20LNG%20paper.pdf.
MIT. (2015) Snohvit Fact Sheet: Carbon Dioxide Capture and Storage Project. Available online:
https://sequestration.mit.edu/tools/projects/snohvit.html.
Nored, M. and A. Brooks. (2013). A Historical Review of Turbomachinery for LNG Applications. LNG 17 International
Conference & Exhibition on Liquefied Natural Gas. Available online:
http://www.gastechnology.org/Training/Documents/LNG17-proceedings/Mach-10-Marybeth_Nored.pdf.
PennEnergy. (August 4, 2014). BP’s $12B Tangguh LNG expansion project earns environmental permit. Available
online: http://www.pennenergy.com/articles/pennenergy/2014/08/oil-and-gas-bp-s-12b-tangguh-lng-expansion-
project-earns-permit.html.
Pieridae Energy. (September 2013). Goldboro LNG Environmental Assessment Report. Available online:
http://goldborolng.com/reviews-assessments/documents/environmental-assessment-full-report/.
Qatargas. (2013). Sustainability Report 2012. Available online:
https://www.qatargas.com/English/CorporateCitizenship/Documents/QatargasSustainabilityEnglish2012.pdf.
Ransbarger, W. (2007). A Fresh Look at LNG Process Efficiency. Available online:
http://lnglicensing.conocophillips.com/Documents/SMID_016_WeldonsPaperLNGIndustry.pdf.
Roberts, M.J., Petrowski, J.M., Liu, Y., and J.C. Brofenbrenner. (2002). Large Capacity Single Train AP-X™ Hybrid LNG
Process. Available online: http://www.airproducts.com/~/media/Files/PDF/industries/lng-large-capacity-single-
train-ap-xtm-hybrid-lng-process.pdf.

Page 51
Nova Scotia LNG Facility GHG Mitigation Options Report
Santos. (October 2009). Supplementary EIS Greenhouse Gas Management. Available online:
http://www.santosglng.com/media/pdf1624/AttachmentK_Greenhouse_Gas_Emissions.pdf.
Schmidt, W.P. (2013). Arctic LNG Plant Design: Taking Advantage of the Cold Climate. Liquefied Natural Gas 17
Conference: Liquefaction, Machinery and Onshore Facilities, Houston, US. Available online:
http://www.airproducts.com/~/media/Files/PDF/industries/lng/arctic-lng-plant-design.pdf.
Shah, P. et al. (2013). Refrigeration Compressor Driver Selection and Technology Qualification Enhances Value for
the Wheatstone Project. LNG 17 International Conference & Exhibition on Liquefied Natural Gas. Available online:
http://www.gastechnology.org/Training/Documents/LNG17-proceedings/2-5-Pankaj_Shah.pdf.
Statoil. (2010). 2009 Sustainability Report. Available online:
http://www.statoil.com/AnnualReport2009/en/Pages/default.aspx
van Osch, M.M.E., Belfroid, S.P.C., and M. Oldenburg. (2010). Marine Impact on Liquefaction Processes. Available
online: http://www.kgu.or.kr/download.php?tb=bbs_017&fn=PO4-4_vanOsch-p.pdf&rn=PO4-4_vanOsch-p.pdf.
Woodfibre LNG. (2014). Electric Drives & Seawater Cooling. Available online:
http://www.squamish.ca/assets/WLNG/WLNG-electric-drives-seawater-cooling-2014-07-17.pdf.
Woodside. (June 20, 2011). Pluto LNG Project Greenhouse Gas Abatement Program, Revision 2. Available online:
http://www.woodside.com.au/our-business/pluto/sustainability/documents/pluto_lng_project_-
_greenhouse_gas_abatement_program.pdf.
WorleyParsons. (September 17, 2008). Gladstone LNG Project – Fisherman’s Landing Environmental Impact
Statement – Volume 1. Available online:
http://www.lnglimited.com.au/irm/Company/ShowPage.aspx?CPID=1238.
WorleyParsons. (March 2010). Australia Pacific LNG Project, Volume 5: Attachments, Attachment 31: Greenhouse
Gas Assessment. Available online:
http://www.aplng.com.au/pdf/eis/Volume_5/Vol_5_Att_31_GreenhouseGasAssessment.pdf.