Geology and Ground-Water Resources of the Lawrenceville ...
51
GEOLOGY AND GROUND-WATER RESOURCES OF THE LAWRENCEVILLE AREA, GEORGIA By Melinda J. Chapman, Thomas J. Crawford, and W. Todd Tharpe U.S. GEOLOGICAL SURVEY Water-Resources Investigations Report 98-4233 Prepared in cooperation with the CITY OF LAWRENCEVILLE, GEORGIA Atlanta, Georgia 1999
Transcript of Geology and Ground-Water Resources of the Lawrenceville ...

GEOLOGY AND GROUND-WATER RESOURCES OF THE LAWRENCEVILLE AREA, GEORGIA
By Melinda J. Chapman, Thomas J. Crawford, and W. Todd Tharpe
U.S. GEOLOGICAL SURVEY
Water-Resources Investigations Report 98-4233
Prepared in cooperation with the
CITY OF LAWRENCEVILLE, GEORGIA
Atlanta, Georgia1999

U.S. DEPARTMENT OF THE INTERIOR
BRUCE BABBITT, Secretary
U.S. GEOLOGICAL SURVEY
Charles G. Groat, Director
The use of firm, trade, and brand names in this report is for identification purposes only and does not constitute endorsement by the U.S. Geological Survey.
For additional information write to:
District Chief U.S. Geological Survey 3039 Amwiler Road, Suite 130 Peachtree Business Center Atlanta, GA 30360-2824
Copies of this report can be purchased from:
U.S. Geological Survey Branch of Information Services Box 25286 Federal Center Denver, CO 80225

CONTENTS
Abstract.......................................................................................................................................................................................1
Introduction ...............................................................................................................................................................................2
Background.......................................................................................................................................................................2
Purpose and scope ............................................................................................................................................................4
Description of the study area ............................................................................................................................................4
Methods of investigation ..................................................................................................................................................5
Previous studies ................................................................................................................................................................5
Well and surface-water station numbering systems..........................................................................................................7
Acknowledgments ............................................................................................................................................................7
Regional geology .......................................................................................................................................................................7
Geologic mapping—interpretations and limitations.........................................................................................................7
Lithologic units ................................................................................................................................................................8
Amphibolite ...........................................................................................................................................................8
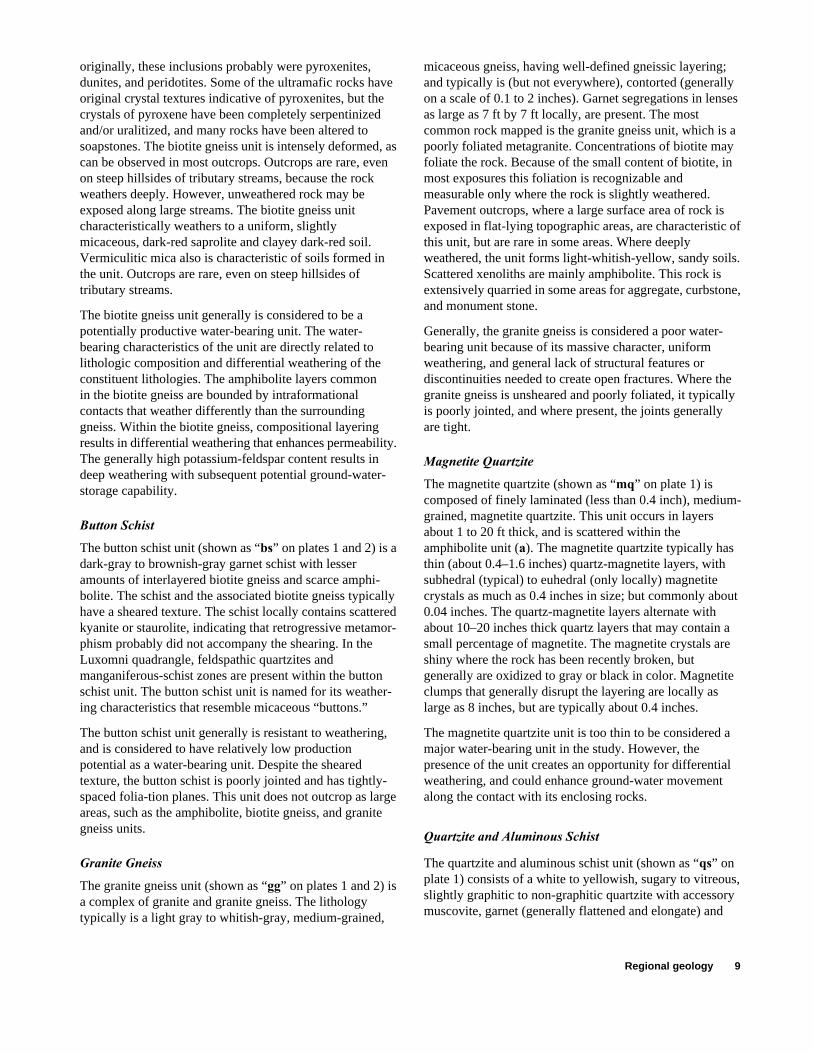
Biotite gneiss .........................................................................................................................................................8
Button schist ...........................................................................................................................................................9
Granite gneiss ........................................................................................................................................................9
Magnetite quartzite .................................................................................................................................................9
Quartzite and aluminous schist...............................................................................................................................9
Diabase dikes ........................................................................................................................................................10
Hydrogeologic sections .................................................................................................................................................10
Ground-water resources ...........................................................................................................................................................12
Well inventory and data compilation .............................................................................................................................12
City of Lawrenceville historical well records ......................................................................................................12
Well yields ............................................................................................................................................................12
Relation of well yield to lithology .................................................................................................................................13
Amphibolite .........................................................................................................................................................13
Biotite gneiss .......................................................................................................................................................16
Button schist ........................................................................................................................................................16
Granite gneiss .......................................................................................................................................................17
Quartzite and aluminous schist ............................................................................................................................17
Interpretation of borehole geophysical logs ..................................................................................................................17
Rhodes Jordan Wellfield.......................................................................................................................................20
Maltbie Street well................................................................................................................................................21
Pike Street well .....................................................................................................................................................21
Gwinnett County Airport well ..............................................................................................................................28
Analyses of ground-water levels.....................................................................................................................................28
Response of local ground-water levels to pumpage .............................................................................................29
Areal effects of ground-water withdrawals .........................................................................................................34
Ground-water quality......................................................................................................................................................34
Summary and conclusions .......................................................................................................................................................45
References cited .......................................................................................................................................................................45
Contents iii

ILLUSTRATIONS[Plates are in pocket in back of report]
Plate 1. Lithologic map showing the distribution of major rock types, fault contacts, and well locations in the Lawrenceville area, Georgia
2. Hydrogeologic sections showing general dip of lithologic units inferred from surface geologic mapping and subsurface lithologic and fracture data collected from wells in the Lawrenceville area, Georgia
Figure 1. Map showing location of (A) the study area in Gwinnett County and physiographic provinces in Georgia, and (B) the Rhodes Jordan Wellfield and observation wells in Lawrenceville, Georgia ........................................................................................................................ 3
2. Subsurface lithologic characteristics and fractures penetrated by wells 14FF08, 14FF26, 14FF27, and 14FF42.............................................................................................................................. 18
3. Fracture identification and relative comparison of fractures in Rhodes Jordan Wellfield well 14FF16 using borehole geophysical logs....................................................................................... 22
4. Fracture identification and relative comparison of fractures in Maltbie Street well 14FF08 using borehole geophysical logs ............................................................................................................ 24
5. Fracture identification and relative comparison of fractures in Pike Street well 14FF27 using borehole geophysical logs ............................................................................................................ 26
6. Fracture identification and relative comparison of fractures in Gwinnett County Airport well 14FF42 using borehole geophysical logs....................................................................................... 30
Figures 7-10. Hydrographs showing:
7. Continuous ground-water levels at the Rhodes Jordan Wellfield during June–September 1995 ............................................................................................................................ 32
8. An extended 18-day pumping period and ground-water-level recovery at the Rhodes Jordan Wellfield during September-October 1996................................................................................. 33
9. Influence of pumping from the bedrock aquifer on ground-water levels in the Rhodes Jordan Wellfield, October 1996, in (A) regolith well 14FF43, and (B) bedrock observation well 14FF16 ........................................................................................................................................... 35
10. Influence of pumping at the Rhodes Jordan Wellfield on ground-water levels in bedrock observation wells, May 1996–January 1997............................................................................ 36
Figure 11. Trilinear diagram of water-quality analyses of ground-water samples and City Lake sample collected during October–November 1995 ............................................................................................ 40
12. Trilinear diagram of water-quality analyses of ground-water samples and City Lake sample collected during August 1996 ............................................................................................................... 41
iv Contents

TABLES
Table 1. Records of wells inventoried in the Lawrenceville area, Georgia..................................................................... 14
2. Physical properties and concentrations of inorganic constituents in ground-water samples collected from the Rhodes Jordan Wellfield during October-November 1995 .......................................... 38
3. Physical properties and concentrations of inorganic constituents in ground-water samples collected from the Rhodes Jordan Wellfield and outlying bedrock observation wells during August 1996 ............ 39
4. Physical properties and concentrations of inorganic constituents in water samples collected from regolith wells and City Lake at the Rhodes Jordan Wellfield during August 1996 ................................... 42
5. Volatile organic compounds included in laboratory analyses .......................................................................... 43
6. Concentrations of volatile organic compounds detected in ground-water samples collected from the Rhodes Jordan Wellfield during October-November 1995 .......................................................... 44
7. Concentrations of volatile organic compounds detected in ground-water samples collected from the Rhodes Jordan Wellfield and outlying bedrock observation wells during August 1996 ........................... 44
CONVERSION FACTORS AND VERTICAL DATUM
Conversion FactorsMultiply by to obtain
Lengthinch 0.254 centimeter
foot (ft) 0.3048 meter
mile (mi) 1.609 kilometer
Volumetric Rategallon per day (gal/d) 3.785 x 10⁻³ cubic meter per day
million gallons per day (Mgal/d) 3.785 x 10⁻³ million cubic meters per day
gallon per minute (gal/min) 6.309 x 10⁻⁵ cubic meter per second
gallon per minute (gal/min) 2.228 x 10⁻³ cubic foot per second
Areasquare mile (mi2) 2.59 square kilometer
acre (ac) 4,047 meter squared
Concentrationmicrogram per liter (µg/L) 1 part per billion
Temperature
Temperature in degrees Fahrenheit (° F) can be converted to degrees Celsius (° C) as follows:
° C = (° F -32)/1.8
Temperature in degrees Celsius (° C) can be converted to degrees Fahrenheit (° F) as follows:
° F = 1.8 (° C) +32
Vertical DatumSea level: In this report “sea level” refers to the National Geodetic Vertical Datum of 1929 (NGVD of 1929)—a geodetic datum derived from a general adjustment of the first-order level nets of both the United States and Canada, formerly called Sea Level Datum of 1929.
Contents v

GEOLOGY AND GROUND-WATER RESOURCES OF THE LAWRENCEVILLE AREA, GEORGIA
By Melinda J. Chapman, Thomas J. Crawford, and W. Todd Tharpe
ABSTRACT
The population of the Atlanta Metropolitan area continues to grow at a rapid pace and the demand for water supplies steadily increases. Exploration for ground-water resources, as a supplement to surface-water supplies, is being undertaken by many city and county governments. The application of effective investigative methods to characterization of the complex igneous and metamorphic fractured bedrock aquifers of the Piedmont physiographic province is essential to the success of these ground-water exploration programs. The U.S. Geological Survey, in cooperation with the City of Lawrenceville, Ga., began a study in December 1994 to apply various investigative techniques for field characterization of fractured crystalline-bedrock aquifers near Lawrenceville.
Five major lithologic units were mapped in the Lawrenceville, Ga., area as part of an ongoing study of ground-water resources—amphibolite, biotite gneiss, button schist, granite gneiss, and quartzite/aluminous schist. These units generally are thin in outcrop width, have low angles of dip (nearly 0 to 20 degrees, dip reversals occur over short distances), and exhibit some shearing characteristics. The most productive unit for ground-water resources, on the basis of subsurface data collected through 1997, is the amphibolite. Historically, two wells drilled into this unit are recognized as having possibly the highest yields in the Piedmont region of northern Georgia. The City of Lawrenceville refurbished one well at the Rhodes Jordan Wellfield in 1990, and has pumped this well at an average rate of about 230 gallons per minute since 1995.
In general, the composition of water collected from the bedrock wells, regolith wells, and City Lake is similar;
calcium and bicarbonate are the dominant cation and anion, respectively. Water from the regolith wells and the lake have lower concentrations of major ions than does water from the bedrock wells. Many of the ground-water samples collected from the Rhodes Jordan Wellfield during October–November 1995, and from the wellfield and three additional observation well sites during August 1996, contain volatile organic compounds. Volatile organic compounds were detected in ground-water samples collected from several bedrock and regolith wells located in urban areas. Trace concentrations of tetrachloroethylene, trichloroethylene, 1,1-dichloroethane, trichlorofluoromethane, 1,1,1-trichloroethane, and cis-1,2-dichloroethene were detected. Methyl-tert-butyl-ether (MTBE)—a compound used to increase the octane level in gasoline—was detected at concentrations above expected urban background levels in bedrock wells in the Rhodes Jordan Wellfield. Concentrations of MTBE ranged from 0.6 to 12 micrograms per liter in October–November 1995, and from 0.6 to 26 micrograms per liter in August 1996.
Continuous ground-water-level data suggest that the fractured crystalline-bedrock aquifer (amphibolite unit) at the Rhodes Jordan Wellfield, generally is dewatered to a depth near a productive fracture during the regular pumping cycle of 18 hours per day, 5 days on and 2 days off per week. However, when the stress on the aquifer is increased by extending the pumping period up to as much as 18 days, or by pumping longer that 18 hours per day, the aquifer exhibits an unusual condition of recovery. Areal effects of pumping have been observed at distances of as much as one mile, extending across surface-water drainage divides.
Abstract 1

INTRODUCTION
Availability of water for public supply, industrial use, and landscape irrigation is a major factor in the economy and quality of life in large urban areas of the southeastern United States. Water resources in fractured crystalline-bedrock aquifers are becoming more important in the Atlanta Metropolitan area of northern Georgia as the need for water supplies escalates because of increased development and rapid population growth. The population increased from about 1.684 million in 1970, to nearly 2.834 million in 1990; an increase of more than 68 percent (U.S. Bureau of the Census, 1991). The water supply for the metropolitan area primarily is derived from surface water. Most of the population in the urban area depends on water from the Chattahoochee River for drinking water supply; however, the actual percentage of water used from this source largely is unknown (Marella and others, 1993). The largest impoundment is Lake Sidney Lanier, located upstream and northeast of the Atlanta Metropolitan area. Surface-water supplies require substantial storage capacity in impoundments to meet minimum supply requirements during periods of peak demand. Impoundments are extremely expensive to develop and are susceptible to drought. Ground-water resources have the reputation of being difficult to obtain in the Piedmont region because of the complex hydrogeology of the fractured igneous and metamorphic rocks. Although the quantity of ground water available from a well drilled in these fractured crystalline rocks may not be comparable to that of a reservoir, generally a few 100,000 gallons per day (gal/d), wells can serve as a primary resource in rural communities, and as supplemental resources in many suburban communities.
The City of Lawrenceville, Ga., a northeastern suburb of Atlanta (fig. 1), includes several of the fastest growing industrial and residential areas in the metropolitan area. The average demand for water ranges from a low of about 1.5 million gallons per day (Mgal/d) in the winter, to a high of about 2.9 Mgal/d in the summer (E&C Consulting Engineers, Inc., 1995). A small percentage of the city’s public water supply—about 10 percent—currently (1998) is obtained from ground-water sources, and projects have been initiated to expand ground-water development. The city is now investigating the possibility of using ground-water supplies to provide a primary water source to serve an estimated population of about 20,000 (Mr. Mike Bowie, City of Lawrenceville, oral commun., 1998). Well yields in this area, as well as in all igneous/metamorphic-rock terranes, are extremely variable and can range from zero to several hundred gallons per minute (gal/min). Thus, there is imminent need to improve methods of ground-water resource evaluation in these complex igneous/metamorphic-rock hydrogeologic settings.
The fractured crystalline-bedrock aquifers in this area of the Georgia Piedmont are comprised of metamorphic rocks, including schists, gneisses, and amphibolites, as well as igneous granitic rocks. These rocks have been exposed to intense heat and pressure during metamorphism, as well as structural deformation, and subsequent chemical and physical weathering. These forces have resulted in an extremely heterogeneous aquifer system characterized by a broad range of physical properties. Characterization of these fractured crystalline-bedrock aquifers often is difficult at any scale of investigation. Predictions of the availability of ground water in the Piedmont physiographic province are difficult because of the lack of detailed knowledge of the geology and its relation to the storage and flow of ground water. Conceptual advances have been made in relating the occurrence of ground water to geologic structures, rock type, and topographic setting; and the understanding and prediction of local hydrogeologic conditions has improved.
Background
The fractured crystalline-bedrock aquifers of the Lawrenceville area have proved to be a dependable source of ground water for more than 80 years. Four wells were drilled and used for municipal supply in Lawrenceville prior to initiation of the city’s purchase of surface water from Gwinnett County in the mid-1970’s. The first production well was drilled in 1912 by cable-tool methods at the Rhodes Jordan Park (fig.1). Original records indicate that the well had an estimated yield of as much as 400 gal/min. This well was used for municipal supply for several decades. The city reportedly pumped 200,000 gal/d from the well in 1942 (USGS site visit January 12, 1943, written commun.).
Three additional wells (fig. 1) were drilled in the 1940’s. An additional production well was drilled in 1945 near the 1912 well (14FF10) at Rhodes Jordan Park, in what has become known as the Rhodes Jordan Wellfield. A second well was drilled in 1947 at the Maltbie Street site. A third well was drilled at the Pike Street site in the 1940’s (Mr. Don Martin, City of Lawrenceville, oral commun., 1996). This historical well was located about 200 ft east of current well 14FF27. Drilling records are not available for the historical Pike Street well. The wells at the Rhodes Jordan Park and Maltbie Street site had high sustained yields. The Pike Street well yield was considered unreliable (Mr. Don Martin, City of Lawrenceville, oral commun., 1996). Subsequent to the shutdown of the wells in the 1970’s, the city refurbished the two wells at the Rhodes Jordan Park in 1990 (Special Environmental Services, 1991). The Maltbie Street well was revisited in 1995. The Pike Street well was apparently paved over during construction activities for an
2 Geology and Ground-Water Resources of the Lawrenceville Area, Georgia

Chatta
hooc
hee Rive
r
Cha
ttah
ooch
eeR
iver
Fall Line
G E O R G I A
COASTAL PLAIN
CUMBERLAND PLATEAU
BLUE RIDGE
PIEDMONT
Atlanta
VALLEY AND
RIDGE
Lawrenceville
Lawrenceville
Dacula
GwinnettCounty
STUDY AREA
0 10 MILES
0 10 KILOMETERS
02208118
City Lake
N Yellow River basin
14FF43
US Highway 29
RHODES JORDANWELLFIELDShoal C
reek
14FF08 Maltbie
Street Site) 1060
1040
1040
1020
1020
1020
1020
1040
1060
1000980
1000
1000
10401060
1080
1060
1040
1040
1020
1020
1100
1080
1060
1040
1100
1120
DRAINAGE-BASIN
BOUNDARY
14FF1714FF36
14FF10
14FF18
14FF16
14FF2614FF37
14FF3814FF39
14FF27
14FF27
14FF09 (Pike Street Site)
Figure 1. Location of (A) the study area in Gwinnett County and physiographic provinces in Georgia, and (B) the Rhodes Jordan Wellfield and observation wells in Lawrenceville, Georgia.
Gwinnett County AirportWell 14FF42
2 miles
A.
B.
Alcovy River basin
02208118
Base modified from U.S. Geological SurveyLawrenceville, Georgia; 1:24,000, 1992
Well and number
Stage recorder and number
0 250 METERS125EXPLANATION
1,000 FEET5000
Introduction 3

office park development; a new test well was drilled near the original well location in 1995. However, aquifer-test data from the 1995 Pike Street well suggest that the well does not yield enough ground water for development into a production well.
In December 1994, the U.S. Geological Survey (USGS) began a study in cooperation with the City of Lawrenceville, to determine hydrogeologic characteristics of fractured crystalline-bedrock aquifers (fig. 1). The objectives of the overall Lawrenceville study are to (1) evaluate the regional hydrogeologic setting of the Lawrenceville, Ga., study area by correlating subsurface and surface lithology; (2) delineate and characterize subsurface secondary fractures that control aquifer permeability; and (3) monitor the response of the bedrock ground-water system to pumpage by characterizing areal influence of ground-water pumping from the fractured bedrock aquifer system. Two scales of investigation are being conducted as part of the Lawrenceville study—regional and local.
Purpose and Scope
This report addresses results of the regional scale of an ongoing study that has focused on the identification of major lithologic units at the land surface, applications of borehole geophysical logs to lithologic identification and fracture characterization in the subsurface, and the response of the aquifer system to stress from pumping. Regional findings in the study area are presented to (1) describe lithologic units and the geologic setting; (2) characterize the hydrogeologic setting where subsurface data are available; and (3) evaluate ground-water availability and quality. An overall assessment of the availability of ground water is discussed in relation to geologic factors within each lithologic unit, such as characteristic fracturing of specific rock types. Applications of borehole geophysical logs include fracture delineation and characterization, as well as lithologic identification. Ground-water levels were monitored to evaluate the response of the aquifer to pumping.
Field work conducted as part of the regional study has included geologic mapping, the compilation of well-inventory data, collection of borehole geophysical logs, ground-water-level monitoring, collection of geologic core, well drilling, and ground-water-quality sampling. Regional surface lithologic units are described as a basis of correlation of current and future subsurface data. The surface expression of geologic contacts of lithologic units are presented at the 1:24,000 scale. From data compiled through 1997, subsurface lithologic and fracture data are available for nine bedrock wells at four sites—the Rhodes
Jordan Wellfield (two production wells (one in use) and four observation wells), the Maltbie Street well, the Pike Street well, and the Gwinnett County Airport well. The use of borehole geophysical logs in fracture delineation and qualitative comparison is presented and discussed for each of the four sites.
Description of the Study Area
The study area encompasses about 44 square miles (mi2) and includes the City of Lawrenceville in Gwinnett County, Ga., and is located about 20 mi northeast of Atlanta (fig. 1). The northeastern quarter of the Luxomni and the northern half of the Lawrenceville, 7 1/2-minute topographic quadrangles (plate 1) are included in the study area.
Lawrenceville is located in the Piedmont physiographic province, Winder Slope District of the Southern Piedmont Section (Clark and Zisa, 1976). Topography is gently rolling, with altitudes ranging from about 780 feet (ft) to 1,170 ft above mean sea level. The Winder Slope District is dissected by the headwater tributaries of major streams draining to the Atlantic Ocean (Clark and Zisa, 1976). The study area contains part of the headwaters for the Yellow River (west) and the Alcovy River (east). This area was selected because the geologic and hydrogeologic settings are representative of the fractured, crystalline metamorphic and igneous rocks of the Piedmont and Blue Ridge physiographic provinces in Georgia, and includes a rapidly growing urban area in need of increased water supply.
The climate of the study area generally is mild—having warm, humid summers, and temperate winters. The 1996 average annual temperature for the National Oceanic and Atmospheric Administration (NOAA) station at Winder, Ga., (station WINDER 1 SSE), located about 16 mi from Lawrenceville, was about 60 degrees Fahrenheit. Annual precipitation at Winder was about 52 inches during 1996 (National Oceanic and Atmospheric Administration, 1996).
Four well sites in the study area have been characterized at a local scale to better assess specific geologic controls on ground-water availability. The Rhodes Jordan Wellfield (RJWF, fig. 1) includes two bedrock production wells, four bedrock observation wells, and three regolith wells (1997). The wellfield encompasses an area of about 3 acres. A 25-acre recreational lake is near the wellfield in the Rhodes Jordan Park. Three additional single-well sites—Maltbie Street (about 0.9 mi N80W from RJWF), Pike Street (about 1.0 mi S80W from RJWF), and the Gwinnett County Airport well (about 1.8 mi N55E)—were studied as part of the regional investigation (fig. 1).
4 Geology and Ground-Water Resources of the Lawrenceville Area, Georgia

Methods of Investigation
The investigation of ground-water resources in the Lawrenceville area included geologic mapping; compilation of well information; and collection and analysis of borehole geophysical logs, well cores, ground-water-level data, and ground-water-quality samples. All data (geology, well characteristics, topography, hydrography, and roads) were digitized and incorporated into a spatially oriented database for geographic information system applications. All well-construction information is stored in the USGS Ground-Water Site Inventory (GWSI) database for subsequent retrieval.
Geologic mapping included the identification of regional lithologies and structural measurements, as well as the notation of textural characteristics and degree of development of foliation/compositional layering. The distribution of rock types and lithologic contacts were mapped in detail across the study area. General observations regarding potential structural and textural characteristics that may enhance ground-water availability also were noted in selected areas.
Compilation and assimilation and compilation of well data included construction and yield data obtained from the USGS GWSI database. Additional well information was compiled during field reconnaissance. Local water-well drillers, consultants, and well owners provided additional information. Well-inventory information included well depth, casing depth, construction, and yield, when available.
Well-yield data were related to lithologic, structural, and weathering characteristics of geologic units. Water-bearing potential of geologic units was evaluated by correlating rock type and structural features with characteristics of production zones in wells.
Borehole geophysical logs were used to determine characteristics of water-yielding zones. Fractures intersecting the borehole in bedrock wells were identified using an integrated suite of borehole geophysical logs—including caliper, focused resistivity, long- and short-normal resistivity, gamma, acoustic televiewer and velocity, spontaneous potential, fluid temperature and resistivity, deviation, heat-pulse flowmeter, video camera logs, and single-borehole radar surveys. As part of the local studies, subsequent to fracture zone identification, the orientation of fractures within each zone was interpreted from acoustic televiewer logs and directional borehole radar surveys (Chapman and Lane, 1996).
Drill core was collected from boreholes at the Rhodes Jordan Wellfield (well 14FF26) to a depth of about 380 ft and the Gwinnett County Airport (well 14FF42) to a depth
of about 600 ft. The coreholes remain open and currently (1998) are used as observation wells. A second observation well (14FF39) was later drilled, using air-rotary methods, near well 14FF26 to assess yield. It was completed to a depth of about 180 ft.
Ground-water-quality samples were collected from eight bedrock wells, and three regolith wells to characterize general ground-water quality (major ionic constituents) and to evaluate possible volatile organic compounds contamina-tion of ground water from urban activities. A sample also was collected from City Lake for a comparison of surface-water chemistry with chemical data from ground-water samples. Two sets of samples were collected—(1) October–November 1995, during a pumping shutdown; and (2) August 1996, during a period of sustained pumping. Water samples from the bedrock wells were collected using a submersible Redi-Flow 2 Grundfos pump. The sampling pump was first lowered below casing depth to remove stagnant casing water. Then, the pump was lowered to a fracture depth for sample collection. Water from bedrock wells was pumped until all field parameters (specific conductance, pH, temperature, and dissolved oxygen) stabilized. Regolith wells first were purged using a bailer, and then sampled by attaching a bottom-emptying device to the bailer.
Previous Studies
A complete presentation of hydrogeologic investigations in the Piedmont physiographic province of northern Georgia is beyond the scope of this report. However, Chapman and Peck (1997) listed and discussed several studies that have evaluated ground-water resources in the fractured crystal-line-bedrock aquifers of the Atlanta Metropolitan area.
Some of the more recent concepts of factors affecting ground-water availability in the fractured crystalline rocks of the Atlanta Metropolitan area were presented by Cressler and others (1983). The availability, quality, and quantity of ground water in fractured crystalline rocks and methods used for locating well sites were discussed. Cressler and others (1983) stated that wells could serve as alternative or supplemental sources of water supply. Results from that study indicated the highest well yields in the Atlanta area are associated with wells tapping contact zones between rocks of contrasting lithology, fault zones, stress-relief (horizontal) fractures, drainage features controlled by local structural characteristics, concentrated jointing within folded rocks, and shear zones. Topographic drainage features may or may not be related to underlying water-bearing features in the rocks. From data gathered using borehole geophysical logs of wells, Cressler and others
Introduction 5

(1983) determined that the size, spacing, and interconnection of water-bearing openings differ greatly from one rock type to another. Cressler and others (1983) determined that the range in well yield within an identified water-bearing unit is highly variable, and high-yielding wells are present in each unit. Local features in the rocks were recognized as generally controlling well yield. They also noted that water from wells open to mafic rock types contained higher concentrations of iron, magnesium, manganese, dissolved solids, and possibly chloride, than water from wells open to granitic rock in the Atlanta Metropolitan area. The pH of water samples collected from wells completed in mafic rocks also was relatively high compared with samples collected from wells completed in granitic rocks.
Previous regional geologic mapping, which included the Lawrenceville and Luxomni quadrangles, was compiled by McConnell and Abrams (1984). The data sources for the Luxomni quadrangle were Atkins and Higgins (1980) and a modification of the 1:24,000-scale reconnaissance map by Atkins and Morris (1982). The Lawrenceville quadrangle was modified from the 1:24,000-scale reconnaissance map by Dooley (unpublished).
Higgins and others (1988) published a study of the structure, stratigraphy, tectonostratigraphy, and evolution of the southernmost part of the Appalachian orogen. Major lithologic units in the vicinity of the Lawrenceville and Luxomni topographic 1:24,000 quadrangles were defined, named, and assigned to proposed thrust sheets; primarily the Zebulon thrust sheet and the Sandy Springs thrust sheet. Both of those thrust sheets are considered to be closely associated with a large outcrop area of Silurian and Devonian granites. Concepts and interpretations presented by Higgins and others (1988) are being revised and reinterpreted through more detailed mapping, such as that presented in this report.
As part of the refurbishment of the Rhodes Jordan production wells in the early 1990’s (wells 14FF10 and 14FF16, fig. 1), a hydrogeologic investigation was conducted by Special Environmental Services, Inc., (1991) and Radzieta (1993). The investigation was conducted in the vicinity of the Rhodes Jordan Wellfield and consisted of limited geologic structural mapping, well rehabilitation, and observation well drilling, a watershed analysis, assessment of potential sources of contamination, and aquifer testing. Four observation wells were drilled near the production wells, two tapping the deeper bedrock aquifer and two shallow wells tapping the regolith. One bedrock well was located along the principal geologic strike (N60E) from the production well, and the second was located perpendicular
to strike (N30W). Both of the bedrock wells tap biotite-hornblende gneisses and amphibolites, and have estimated yields of 150 gal/min along strike, and 100 gal/min perpendicular to strike. Using estimates of recharge to the aquifer through precipitation and infiltration applied to the watershed, the maximum yield available to a production well was estimated to be about 310 gal/min. The sustainable yield was estimated to be 200 to 250 gal/min.
In 1995, E&C Consulting Engineers, Inc., presented a plan for the development of ground-water resources in the Lawrenceville area. Phase I of their investigation included property as far as 1 mi outside the city limits, and consisted of the selection of favorable zones suitable for the develop-ment of ground-water resources. Zones were selected on the basis of interpretations from lineament analyses, geologic mapping, identification of soil types, characterization of watershed morphology, topography, areas of potential ground-water recharge, and identification of potential contaminant sources to the ground-water system. Phase II is planned to include the selection of test-well drilling sites using surface geophysical surveys. Six geologic units were identified: quartzite/schist, button schist, biotite gneiss/hornblende gneiss/amphibolite, schistose gneiss, hornblende gneiss/amphibolite, and the Lithonia Gneiss (E&C Consulting Engineers, Inc., written commun., 1995). Evidence of thrust faulting, including abrupt terminations of rock units, shear fabrics, and sheared limbs of folds near stratigraphic boundaries, were noted. Foliation/compositional layering was noted as having orientations northeast to north-south, and dipping less than 30 degrees (E&C Consulting Engineers, Inc., written commun., 1995).
The characterization of subsurface fractures at the Rhodes Jordan Wellfield was discussed in Chapman and others (1997) and in Chapman and Lane (1996). Fractures were delineated in four bedrock wells using borehole geophysical logs, in correlation with drilling and geologic logs where available. The most useful traditional geophysical logs were the caliper, focused resistivity, and acoustic televiewer. Additional comparison of fractures was made using heat-pulse flowmeter logs to determine vertical flow within the boreholes. More recent technology used to characterize subsurface fractures included directional borehole radar surveys, which propagate high-frequency electromagnetic signals into the rock (amphibolite) at distances of more than 100 ft from the well. Orientations (strike and dip) of fractures intersecting the wells were determined from acoustic televiewer logs and directional borehole radar surveys. These fracture orientations were then compared with interpretations of fracture strike from surface azimuthal resistivity surveys and surface geologic structural mapping.
6 Geology and Ground-Water Resources of the Lawrenceville Area, Georgia

In general, several productive (transmissive) fractures strike in the N10-60W direction. An additional dominant fracture set has strikes ranging from N80-90E and N80-90W. Secondary, or less transmissive fractures have strikes of N-S to N20E and N50-70E.
Well and Surface-Water Station Numbering Systems
Wells in Georgia are numbered using a system based on USGS topographic maps. Each 7 1/2-minute topographic quadrangle map in Georgia has been assigned a number and letter designation beginning at the southwest corner of the State. Numbers increase sequentially eastward through 39—letters advance northward through “Z,” then double-letter designations “AA” through “PP” are used. The letters “I,” “O,” “II,” and “OO” are not used. Wells and springs inventoried in each quadrangle are numbered sequentially beginning with “1.” Thus, the second well inventoried in the Lawrenceville quadrangle (designated 14FF) is designated 14FF02.
Wells in the USGS GWSI database are assigned a 15-digit identification number based on the latitude and longitude grid system. The first six digits denote the degrees, minutes, and seconds of latitude. The next seven digits the degrees, minutes, and seconds of longitude. The last two digits (assigned sequentially) identify wells within a one-second grid.
The USGS established a standard identification numbering system for all surface-water stations in 1950. Stations are numbered according to downstream order. Stations on a tributary entering upstream of a main-stream station are numbered before, and listed before that station. No distinction is made between continuous-record and partial-record stations. Each station has a unique number that includes a two-digit Part number (02 refers to natural drainage into the Eastern Gulf of Mexico) and 6 to 12-digit downstream order number within the part number. Gaps are left in the series of numbers to allow for new stations that may be established; hence, the numbers are not consecutive. All records for a drainage basin, encompassing more than one state, can easily be correlated by Part number and arranged in downstream order.
Acknowledgments
The authors would like to thank Mr. Bartow Jenkins, Mayor, City of Lawrenceville; and Mr. Don Martin, Director of Public Works, City of Lawrenceville, for their support in initiating and continuing this project. Special thanks go to Mr. Roy Wilson, City of Lawrenceville Water Department
Superintendent; and Mr. Mike Bowie, City of Lawrenceville, Water Treatment Plant Operator, for their enthusiastic support of field work conducted during this project. Appreciation also is extended to Mr. Juan Ruiz, E&C Consulting Engineers, Inc., for his support and cooperation throughout this study. Many thanks go to Mr. Andrew Clark, Kemron Environmental Services, Inc., for his cooperation in allowing the monitoring of ground-water levels in wells installed by Kemron near the Rhodes Jordan Wellfield. Appreciation also is extended to Mr. Mark Hubner, Middle Georgia Water Systems, for his support and exchange of information.
REGIONAL GEOLOGY
The Piedmont physiographic province of northern Georgia is composed of metamorphic and igneous rocks extending to an unknown depth below land surface. Ground-water exploration generally is conducted at depths of less than 1,000 ft, and in most cases, to a maximum depth of about 600 ft. In addition to the exposure of extreme heat and pressure from metamorphism, these rocks have been extensively folded and faulted. Primary porosity is virtually nonexistent. The igneous intrusions, although coarser-grained, also most often have extremely low primary porosity. Ground water in the fractured crystalline bedrock is stored in secondary porosity fractures. The term “fractures” includes openings along foliation planes, joints, stress-relief (erosional unloading) fractures, and brittle fractures related to faulting.
Geologic Mapping—Interpretations and Limitations
Geologic mapping in the study area included identifying rock types, grouping of rock types into lithologic units, delineating lithologic unit contacts, and selected structural measurements. Mapping was conducted using 1:24,000-scale topographic base maps. The study area includes parts of two 7 1/2-minute quadrangles in the Piedmont physiographic province of Georgia (fig. 1); the Lawrenceville and the Luxomni quadrangles. The geologic map presented in plate 1 of this report is a lithologic map; no stratigraphic order is given or implied, and no ages of rock units are given.
Geologic mapping of parts of the Lawrenceville and Luxomni quadrangles was conducted intermittently during 1991–95. Reconnaissance mapping was conducted in the Lawrenceville quadrangle during 1991–92 as part of the Athens, Ga., 30-minute x 60-minute project of the USGS National Geologic Mapping Program. The northern part of the Lawrenceville quadrangle and the northeastern part of
Regional geology 7

the Luxomni quadrangle were mapped during December 1994 to July 1995. The lithologic map of the Lawrenceville quadrangle is more accurate than the lithologic map of the Luxomni quadrangle because, by 1995, when part of the Luxomni quadrangle was mapped, the area was essentially suburban and exposures were extremely scarce. Therefore, some units were distinguished almost entirely on the basis of associated soil colors. For example, the biotite gneiss
(bg) generally weathers to an orange-colored soil, whereas the granite gneiss (gg) generally weathers to a tan or yellow-colored soil. In residential subdivisions, which cover more than 75 percent of the area in the Luxomni quadrangle, several factors had to be considered in separating the biotite gneiss (bg) from the granite gneiss (gg): (1) differences in color of soil resulting from differences in mineral composition of the units; (2) variations in soil color because of different degrees of weathering; (3) movement of soils during subdivision construction; (4) movement of soils during landscaping. Therefore, these units and their contacts are less constrained in such residential areas than in those areas where surburbanization is less encompassing, as in most of the Lawrenceville quadrangle. In areas having landscaped residential subdivisions, more reliable mapping data commonly are restricted to small ungrassed spots, some stretches of small creeks, and sparse outcrops and roadcuts.
Geologic mapping in the southeastern United States, an area of deep weathering and abundant vegetation, requires that all lithologic contacts be “projected.” Contacts are occasionally observed at precise points, along traverses, or while attempting to “walk the contact.” More often, contacts can be interpreted within a few feet or a few 10’s of feet—based on many and varied criteria; thus, they are “projected.” In some places, such as on broad floodplains or colluvium-covered slopes, projection accuracy may be off by a few 100’s of feet.
Other difficulties in mapping and interpreting the geology of the study area are a result of the low-angle dips of most structural features and of most map units. Dips of less than 10 degrees are very difficult to measure; foliation/schistosity, compositional layering/bedding, axial planes, and linear features typically exhibit dips of less than 10 degrees. The low-angle dips of mappable rock units result in contacts that “V” upstream. The lithologic patterns shown in plate 1 reflect those patterns that result from folding.
Lithologic Units
The lithologic map of the study area (plate 1) shows seven mappable units; five of these seven units are shown on section figures (plate 2). The units shown are, in no
stratigraphic or structural order: (1) amphibolite (a); (2) biotite gneiss (bg); (3) button schist (bs); (4) granite gneiss (gg); (5) magnetite quartzite (mq); (6) quartzite and aluminous schist (qs); and (7) diabase dikes (d). The magnetite quartzite unit and diabase dikes are considered minor units.
A major revision of the stratigraphic nomenclature in the Atlanta, Athens, and Cartersville 30-minute by 60-minute topographic quadrangles is currently (1998) underway (Thomas J. Crawford, State University of West Georgia, written commun., 1998). To correlate the lithologic units of this report with published named units would be misleading to the reader.
Amphibolite
The amphibolite unit (shown as “a” on plates 1 and 2) consists of a fine- to medium-grained, dark-green to greenish-black, massive to thinly laminated, hornblende-plagioclase and plagioclase-hornblende amphibolite, and hornblende gneiss. These rocks generally contain epidote and garnet, and also may be locally chloritic. Thinly
laminated, medium-grained, magnetite quartzite (mq) units about 1 to 20 ft thick, are common in and characteristic of, the amphibolite unit. This unit contains insignificant amounts (generally less than one percent) of fine- to medium-grained, generally amphibole-bearing granofels. These rocks, alter to an ocher color when partially weathered. The final weathering product of the amphibolite unit is a very characteristic dark-red clayey soil.
In the Lawrenceville area, highly productive yields (greater than 200 gal/min sustained yield) are obtainable from wells tapping the amphibolite unit. This unit typically is well jointed, but most joints appear to be tight at land surface. Differential weathering can occur parallel to the thin, but well-developed, compositional layering. Productive fracture zones appear to be the result of differential weathering at the intersection of low-angle foliation (compositional layering) and steeply-dipping joint planes.
Biotite Gneiss
The biotite gneiss unit (shown as “bg” on plates 1 and 2) consists of a gray to grayish-brown to dark-gray, medium- to coarse-grained, biotite-rich gneiss. This biotite gneiss typically is schistose in texture and often is pegmatitic. Regionally, the unit generally contains rare lenses and pods of hornblende-plagioclase amphibolite; locally, however, these lenses may be fairly common. Also, the biotite gneiss locally contains small red garnets. The biotite gneiss unit characteristically contains small pods and lenses of altered ultramafic rocks; typically, soapstones and serpentinites;
8 Geology and Ground-Water Resources of the Lawrenceville Area, Georgia
originally, these inclusions probably were pyroxenites, dunites, and peridotites. Some of the ultramafic rocks have original crystal textures indicative of pyroxenites, but the crystals of pyroxene have been completely serpentinized and/or uralitized, and many rocks have been altered to soapstones. The biotite gneiss unit is intensely deformed, as can be observed in most outcrops. Outcrops are rare, even on steep hillsides of tributary streams, because the rock weathers deeply. However, unweathered rock may be exposed along large streams. The biotite gneiss unit characteristically weathers to a uniform, slightly micaceous, dark-red saprolite and clayey dark-red soil. Vermiculitic mica also is characteristic of soils formed in the unit. Outcrops are rare, even on steep hillsides of tributary streams.
The biotite gneiss unit generally is considered to be a potentially productive water-bearing unit. The water-bearing characteristics of the unit are directly related to lithologic composition and differential weathering of the constituent lithologies. The amphibolite layers common in the biotite gneiss are bounded by intraformational contacts that weather differently than the surrounding gneiss. Within the biotite gneiss, compositional layering results in differential weathering that enhances permeability. The generally high potassium-feldspar content results in deep weathering with subsequent potential ground-water-storage capability.
Button Schist
The button schist unit (shown as “bs” on plates 1 and 2) is a dark-gray to brownish-gray garnet schist with lesser amounts of interlayered biotite gneiss and scarce amphi-bolite. The schist and the associated biotite gneiss typically have a sheared texture. The schist locally contains scattered kyanite or staurolite, indicating that retrogressive metamor-phism probably did not accompany the shearing. In the Luxomni quadrangle, feldspathic quartzites and manganiferous-schist zones are present within the button schist unit. The button schist unit is named for its weather-ing characteristics that resemble micaceous “buttons.”
The button schist unit generally is resistant to weathering, and is considered to have relatively low production potential as a water-bearing unit. Despite the sheared texture, the button schist is poorly jointed and has tightly-spaced folia-tion planes. This unit does not outcrop as large areas, such as the amphibolite, biotite gneiss, and granite gneiss units.
Granite Gneiss
The granite gneiss unit (shown as “gg” on plates 1 and 2) is a complex of granite and granite gneiss. The lithology typically is a light gray to whitish-gray, medium-grained,
micaceous gneiss, having well-defined gneissic layering; and typically is (but not everywhere), contorted (generally on a scale of 0.1 to 2 inches). Garnet segregations in lenses as large as 7 ft by 7 ft locally, are present. The most common rock mapped is the granite gneiss unit, which is a poorly foliated metagranite. Concentrations of biotite may foliate the rock. Because of the small content of biotite, in most exposures this foliation is recognizable and measurable only where the rock is slightly weathered. Pavement outcrops, where a large surface area of rock is exposed in flat-lying topographic areas, are characteristic of this unit, but are rare in some areas. Where deeply weathered, the unit forms light-whitish-yellow, sandy soils. Scattered xenoliths are mainly amphibolite. This rock is extensively quarried in some areas for aggregate, curbstone, and monument stone.
Generally, the granite gneiss is considered a poor water-bearing unit because of its massive character, uniform weathering, and general lack of structural features or discontinuities needed to create open fractures. Where the granite gneiss is unsheared and poorly foliated, it typically is poorly jointed, and where present, the joints generally are tight.
Magnetite Quartzite
The magnetite quartzite (shown as “mq” on plate 1) is composed of finely laminated (less than 0.4 inch), medium-grained, magnetite quartzite. This unit occurs in layers about 1 to 20 ft thick, and is scattered within the amphibolite unit (a). The magnetite quartzite typically has thin (about 0.4–1.6 inches) quartz-magnetite layers, with subhedral (typical) to euhedral (only locally) magnetite crystals as much as 0.4 inches in size; but commonly about 0.04 inches. The quartz-magnetite layers alternate with about 10–20 inches thick quartz layers that may contain a small percentage of magnetite. The magnetite crystals are shiny where the rock has been recently broken, but generally are oxidized to gray or black in color. Magnetite clumps that generally disrupt the layering are locally as large as 8 inches, but are typically about 0.4 inches.
The magnetite quartzite unit is too thin to be considered a major water-bearing unit in the study. However, the presence of the unit creates an opportunity for differential weathering, and could enhance ground-water movement along the contact with its enclosing rocks.
Quartzite and Aluminous Schist
The quartzite and aluminous schist unit (shown as “qs” on plate 1) consists of a white to yellowish, sugary to vitreous, slightly graphitic to non-graphitic quartzite with accessory muscovite, garnet (generally flattened and elongate) and
Regional geology 9

aluminosilicate minerals. This unit typically is present in layers about 1 to 4 ft thick, interlayered with feldspathic quartzite and garnetiferous quartzite schist. The quartzite is typically in contact with, and in most areas not mappable as a separate unit from, the aluminous schist. This quartzite and schist unit forms low topographic ridges that are 100 to 200 ft above intervening valleys, weathering to a quartz-rich saprolite/soil. The aluminous schist part of the unit typically is a tan- to yellow-weathering, sheared or button-textured, quartzose, garnet schist, and generally contains kyanite or staurolite.
A characteristic of the quartzite and aluminous schist unit in the study area is that the rocks are of high metamorphic grade and are partly granitized/migmatized; although these features are secondary, they are ubiquitous and serve as one of the identifying features of the quartzite and aluminous schist unit. Dikes and sills of “sweat-out” pegmatites pervade the schists, gneisses, and quartzites of the quartzite and aluminous schist unit (qs), and small bodies of granitoid are common. Quartzites in this unit are granular, thoroughly recrystallized, and typically contain garnet and aluminosilicate minerals (kyanite, staurolite, or sillimanite).
The quartzite and aluminous schist unit generally is considered to be a potentially productive water-bearing unit. Quartzite in the unit is commonly well jointed, having spacings of 4 to 12 inches as noted in outcrops. The quartzite also contains open foliation planes. Schists in the unit are well jointed, but joints are not as closely spaced as in the quartzite. This situation allows water to accumulate at the base of the quartzite and discharge as springs where gently dipping isoclines intersect stream valleys. However, because this rock unit is relatively thin and generally underlies high topographic areas, subsurface fractures in the quartzite may not receive adequate recharge for large ground-water yield and sustained production.
Diabase Dikes
Diabase dikes (shown as “d” on plate 1) consist of fine-to medium-grained, dark-gray to black, augite diabase, that locally contains small amounts of olivine, hypersthene, hornblende, magnetite, and pyrite. Dikes generally are about 16 to 66 ft wide. The diabase weathers to a dark-red clayey soil containing spheroidal boulders with unweathered rock inside an armoring, ocherous rind. Diabase dikes cross the study area in two major northwest-trending swarms containing hundreds of en-echelon dikes. Each swarm consists of closely spaced, thin, relatively short (from a few feet to about 0.3 mi), discontinuous, offset en-echelon dikes. The diabase dikes are mostly mapped on the basis of float and are therefore difficult to locate and accurately delineate. An early report about diabase dikes of the Georgia Piedmont by Lester and Allen (1950) shows the
general distribution and pervasive northwest trend of these dikes. A later report by Watts and Noltimier (1974) discusses the significance of paleomagnetism in these Mesozoic dikes.
The diabase dikes typically are well jointed, but are too thin to be considered a water-bearing unit. However, the presence of the dikes increases the probability for differential weathering, which could enhance ground-water movement along the contact of the dike with the adjacent country rock.
Hydrogeologic Sections
The structural geology of the study area is quite different from that generally presented in published studies of the southeast part of the Piedmont physiographic province. In the Lawrenceville area, areal distribution of lithologic units, measured planar and linear structural features, and subsurface lithologic data from wells all indicate the same two general relations of mappable rock units:
• rock units are inclined at very low to moderate angles, and dip direction varies over short distances; and
• relative structural position of lithologic units varies over short distances.
To illustrate these relations, hydrogeologic sections (plate 2) were constructed along alignments where sufficient subsurface information was available to allow reasonable projection of surface data. Subsurface lithologic units are projected into the sections as preliminary interpretations between well pairs, and between wells and surficial litho-logic contacts. As data collected for this study is expanded, interpretations of the subsurface hydrogeologic setting may differ from those in the sections shown on plate 2.
The vertical scale of the hydrogeologic sections (plate 2) is the same as the horizontal scale (i.e., no vertical exaggeration). This allows observation of “to-scale” relations among topography, horizontal distance, and subsurface features. A short distance (0.6 to 0.9 mi) was selected for the sections so that the subsurface lithologic and fracture data can be distinguished from interpretive surface lithologic contacts without difficulty.
All contacts on the hydrogeologic sections (plate 2) are shown as thrust faults, although not shown on plate 1. This interpretation is based on geologic mapping throughout the study area, combined with subsurface (corehole and well) data. The relative positions of the lithologic units at land surface, combined with structural data and apparent thicknesses, and the relative positions of the lithologic units and thicknesses in wells, suggest thrust faults as being an
10 Geology and Ground-Water Resources of the Lawrenceville Area, Georgia
applicable model for the contact relations between lithologic units. A general discussion of thrusting in the southernmost Appalachians in Georgia and Alabama is presented in Higgins and others (1988). Where subsurface data are available, interpretation of lithologic units is shown. Fractures tapped by each well or corehole are shown on the hydrogeologic sections, along with corresponding well yields, if any. Subsurface fracture dip angles were interpreted from directional borehole radar surveys and digital acoustic televiewer logs, and were projected into the section plane. Within the plane of each section, depiction of the direction and magnitude of dip of the lithologic units was constrained by available surface and subsurface data; projection between control points was based on relations observed during surface geologic mapping.
Hydrogeologic sections were constructed along three alignments (shown on plate 1):
A–A'—from the York Casket Company well (13FF12) to the Pike Street well (14FF27) along a N25W alignment;
B–B '—from the Maltbie Street well (14FF08) to the Pike Street well along a N10E alignment; and
C–C'—through the Rhodes Jordan corehole/well (14FF26), along a north-south alignment.
The alignments of these three hydrogeologic sections are roughly perpendicular to outcrop trend, and were selected to incorporate as much subsurface data as possible.
Section A–A' (plate 2) is the westernmost section, extending from the Pike Street well (A',14FF27), N25W to the York Casket company well (A,13FF12). An apparent antiformal structural crest is inferred to be present a short distance northwest of Redland Creek and the railroad. A known water-producing unit in the Lawrenceville area, the amphibolite, apparently is thicker toward the northwest. The interpreted subsurface contact between the biotite gneiss unit and the amphibolite unit at the York production well (13FF12) were projected from a nearby York monitoring well (MW-3D; Atlanta Environmental Management, 1995) located about 170 ft west-southwest of well 13FF12. This projected contact is a minimal depth, shown at the point of total depth of the well, which taps the biotite gneiss unit, (actual depth of the contact is unknown). The original air-lift yield of well 13FF12 was about 254 gal/min. This hydrogeologic section shows increasing thickness the amphibolite near the crest of the antiform at Redland Creek; compared with 80 ft at the Pike Street well on the south flank of the antiform. The variations in thickness probably are tectonic—the result of faulting and/or intraformational folding. Thickness of the amphibolite unit
in well 13FF12 is unknown. The variations in thickness probably are tectonic—the result of faulting and/or intraformational folding.
Section B–B ' (plate 2) is east of section A–A' extending from the Pike Street well (B ', 14FF27) N10E through the Maltbie Street well (14FF08), and beyond to the amphibolite-biotite gneiss contact. Along this alignment a large variation in thickness of the amphibolite unit is apparent -80 ft at the Pike St. well and greater than 350 ft at the Maltbie Street well. The Maltbie Street well is completed in the amphibolite to a total depth of about 350 ft. The total thickness of the amphibolite is indeterminate at this site. From the interpretation of average dip direction at land surface to the northeast, an apparent antiformal structural also may be present along this alignment, as in section A–A'. As discussed in section A–A', the variation in thickness of section B–B ' is interpreted as being the result of tectonic processes.
Section C–C ' (plate 2) is the easternmost section, extending from the granite gneiss-biotite gneiss contact south of the Rhodes Jordan wellfield (near C '), north through the wellfield corehole/well to the amphibolite-biotite gneiss contact, north of the railroad (C). The wellfield corehole began in amphibolite and tapped the amphibolite/biotite gneiss contact at a depth of about 292 ft. There are no definitive data for thickness of lithologic units north of the Rhodes Jordan Wellfield. From the interpretation of average dip direction at land surface to the north, an apparent antiformal structure also may be present along this alignment, as in sections A–A' and B–B '.
Because of the lack of detailed subsurface structural data, the fault contacts are represented as unmodified lines in the sections. Surface mapping shows large variations in strike orientations, and dip angle and orientation, over short distances within a single lithologic unit. This may be primarily intraformational, or it may also apply to the interpreted fault contacts. Surface exposures of contacts are not sufficient for this degree of resolution.
These three hydrogeologic sections indicate a broad antiform trending east-west. The crest of this antiform is coincident with a topographic low underlain by amphi-bolite, the major water-bearing unit in this area. Present-day surface drainage is directed onto a broad and long area of amphibolite unit outcrop. Well-developed foliation that parallels compositional layering, dips at low angles, and intersects several sets of closely spaced, generally steeply dipping joints, and numerous random fractures, creates a setting that is particularly conducive to ground-water movement and potentially high- yielding wells.
Regional geology 11

GROUND-WATER RESOURCES
Many factors must be considered to adequately assess ground-water resources in a fractured crystalline-rock hydrogeologic setting, such as the Piedmont physiographic province of northern Georgia. The hydrogeologic framework of Piedmont crystalline-bedrock aquifers in the Southeastern United States typically includes a weathered regolith zone overlying unweathered bedrock. Thickness of the regolith ranges from less than 1 ft in granitic rocks to more than 100 ft in a weathered gneiss. The regolith may include soil, alluvium, colluvium, and saprolite (weathered bedrock that retains original structural characteristics). The regolith generally has a porosity ranging from about 20 to 30 percent (Heath, 1984); but it can have low permeability if substantial clay is present. In some rock types, a transition zone may be as present between the regolith and the bedrock. The transition zone may be highly permeable, it consists of slightly weathered “blocks” of bedrock. The bedrock has been exposed to intense heat and pressure, and generally has a primary porosity of less than two percent. Bedrock permeability is controlled by secondary fracturing. Fractures include features such as joints and open foliation planes. Some rocks may respond differently to stresses such as faulting, folding, and metamorphism, and develop a stronger foliation and numerous joint planes that can enhance differential weathering and ground-water movement. Rocks also respond to “unloading” from weathering at the land surface, producing stress-relief fractures. These processes enhance and greatly control ground-water movement. Determination of the characteristics of the fracture pattern in an area can advance the understanding of permeability characteristics of a crystalline-bedrock aquifer.
Well Inventory and Data Compilation
The collection of well data included the compilation of records from the U.S. Geological Survey Ground-Water Site Inventory (GWSI) database, local drillers, consultants, and well owners. Data were field verified where possible. Twenty-nine bedrock (drilled) wells and eight regolith (bored) wells were inventoried in the study area (table 1). Yields range from about 3 to 471 gal/min. Total depths of bedrock wells range from about 105 to 605 ft. Depths of regolith wells range from about 15 to 40 ft.
City of Lawrenceville Historical Well Records
As mentioned previously, the City of Lawrenceville first drilled a production well in 1912 (well 14FF10; fig. 1, table 1) using cable-tool methods. This well, located at the current Rhodes Jordan Wellfield, was refurbished in 1990
(Special Environmental Services, 1991). During the post-World War II era, three additional wells were drilled; a second well at the Rhodes Jordan location (well 14FF16), a well on Maltbie Street (well 14FF08), and a well on Pike Street (well 14FF09). Drilling records are not available for the historical Pike Street well (14FF09).
The City of Lawrenceville historically is recognized as having two of the highest yielding wells in the Piedmont. These wells (14FF10 and 14FF16, plate 1; fig. 1) were located at the Rhodes Jordan Wellfield. Herrick and LeGrand (1949) stated that the City of Lawrenceville, population 2,223, derives its municipal water supply from two “deep” bedrock wells. These two wells had the highest reported yield, at that time, in the Georgia Piedmont. Water from the wells was treated by chlorination only. The first well, drilled in 1912, (well 14FF10; fig. 1; table 1), had an initial reported yield of about 470 gal/min, which had declined to less than 200 gal/min by 1947. A second production well, drilled in 1945 (well 14FF16; fig. 1; table 1), had a reported yield of about 400 gal/min, (USGS unpublished data, December, 1945). Historical records also indicate that this well was pumped at 471 gal/min for 6 hours, and had a pumping water level of about 110 ft. Both wells were reported to have penetrated “hornblendic rocks” (amphibolite), dipping to the southeast at 35 degrees (Herrick and LeGrand, 1949). Additional unpublished data from a USGS site visit in January 1948 also indicate that the Maltbie Street well (14FF08; fig.1; table 1; drilled in 1947) was initially tested at a rate of 365 gal/min for 20 hours, producing 18 ft of drawdown. The large ground-water production in the Lawrenceville area was linked to fault-block overthrusting, which was described to be at a low angle from the southeast (Herrick and LeGrand, 1949). Subjacent underlying rock beds were crushed and turned concave upward (dragged), which resulted in a zone of large and numerous openings in the rocks. Wells located to the northwest or southeast of the “belt of hornblendic rocks” were not expected to yield significant ground water. The quality of production-well water was said to be good overall, but mineralized (Herrick and LeGrand, 1949).
Well Yields
Well yields for the study area, based on available data included in this report, range from about 3 to more than 470 gal/min (table 1). The largest yield estimates, generally more than 400 gal/min, are from historical pumping information for the City of Lawrenceville municipal wells. Wells completed prior to about 1950 (Mr. Johnny Robinson, Robinson Well Company, oral commun., 1995) were drilled using cable-tool methods, the records from which do not provide an initial yield estimate. Yields from wells drilled
12 Geology and Ground-Water Resources of the Lawrenceville Area, Georgia

using a cable tool were estimated from aquifer tests or long-term pumping records. Later well drilling was accomplished using air-rotary methods, whereby cumulative air-lift yield estimates are recorded during drilling activities.
Relation of Well Yield to Lithology
Subsurface data collected from wells can be placed in a regional hydrogeologic framework by evaluating well characteristics in terms of mapped lithologic units. The lithologic units shown in plate 1—amphibolite (a), biotite gneiss (bg), and button schist (bs), granitic gneiss (gg), and quartzite and aluminous schist (qs)—are relatively thin; a few hundred's of feet to a few thousand's of feet in outcrop width. Geologic contacts and internal compositional differences within lithologic units in much of the study area are undulatory and inclined at low angles. The relative vertical position of the rock units varies areally, due to intrusive relations, recumbent folding, and (or) overthrusting. Because the rocks have complex intrusive and (or) structural relations, wells that begin in one rock unit at land surface may be drilled into, and produce water from, different lithologies below the surficial unit. Additionally, the “thinness” of these lithologic units may have resulted in different responses to tectonic stress and weathering than the same lithologies in a thicker, less complex geologic setting. However, these thin lithologic units may extend over large areas because of an undulatory, nearly horizontal, structural attitude combined with low topographic relief.
Comparison of well yields with lithologic units mapped at land surface, on a regional scale such as that of the study area, is difficult. Many factors must be considered before data can be accurately evaluated. Often, no subsurface lithologic information is available for domestic wells, which generally comprise the majority of the wells inventoried in the study area. Also, reported well yields can be inaccurate. Generally, domestic wells do not have yields as large as wells drilled for municipal or industrial purposes; however, a small yield, such as 5 gal/min, is sufficient for a single household. Consequently, domestic wells generally are shallower and do not encounter as many water-bearing zones as the deeper municipal or industrial wells; however, some domestic wells can have high initial air-lift yields of 100 gal/min or more.
An overall comparison of the well yield data shows that the amphibolite has notably higher yields than the other four major lithologic units (table 1); however, most exploration for public supply has been focused on areas where the amphibolite is near land surface. Historically, the municipal wells at the Rhodes Jordan Wellfield and Maltbie Street,
drilled in areas of amphibolite outcrops, are two of the most productive sites in the Piedmont physiographic province of Georgia. From limited data available at four well sites (data collected through 1997), subsurface fractures appear to be more numerous in the amphibolite compared with other rock types.
Examples of wells that have encountered extremely low yields are wells 14FF31 and 14FF35 (plate 1; table 1); these two wells were drilled into granitic gneiss. These wells were drilled to depths of about 600 ft, which is the typical total depth of exploration in the Piedmont, and yield only 3 and 4 gal/min, respectively; three “dry” wells were drilled on the same property prior to drilling well 14FF35.
Although the number of wells inventoried in the various units influences the comparison of well-yield data with lithologic units, a general comparison of potential water-bearing characteristics of each mappable unit is discussed in the following section. Subsurface well data are discussed where available.
Amphibolite
From the well-inventory-data compilation, yields for ten wells drilled in the amphibolite outcrop area range from about 10 to 471 gal/min (table 1) (although some wells may tap other lithologic units at depth); six wells have no associated yield information. Historically, this rock unit has been referred to as “hornblendic rocks” by geologists, and as “black granite,” by drillers. Five of the ten wells are located at the Rhodes Jordan Wellfield. Production zones in the known high-yielding municipal wells in the Lawrenceville area are located in the amphibolite unit. At the Rhodes Jordan Wellfield, five wells yield from about 100 to more than 400 gal/min, and the city well located at Maltbie Street (14FF08, fig. 1) was reported to yield more than 400 gal/min (table 1). Of the three domestic wells having yield data, the range is from about 25 to 60 gal/min. At a depth of about 423 ft in the Pike Street well (14FF27), a large fracture zone (initial yield of 50 gal/min) was encountered in the amphibolite. Overall aquifer-testing yield was less than the initial report of 100 gal/min (Mark Hubner, Middle Georgia Water Systems, oral commun., 1996).
Surface exposures of the amphibolite typically are highly jointed, as are other amphibolite units throughout the Piedmont physiographic province of Georgia, and strongly foliated (compositional layering). Strike and dip of the foliation is variable, even at the scale of a few acres, and joint set orientations are diverse. Core drilling was conducted at the Rhodes Jordan Wellfield to derive mineralogical, textural, and structural characteristics of the
Ground-water resources 13

, livestock; gal/min, gallons per minute; NOTE: Unsurveyed well altitudes were
Date nstructed
Reported yield
(gal/min)
Geologic unit at land surface
tober 1977 30 bg
pril 1963 45 bg
tober 1968 40 bs
ugust 1976 60 a
ugust 1972 254 bg
pril 1977 50 bg
1947 20 gg
1947 2/400 a
4/1940’s — gg
1912 270 a
ember 1977 23 bs
pril 1971 100 bs
une 1960 25 a
tember 1975 20 gg
1945 471 a
ember 1990 150 a
ember 1990 100 a
1958 5 bg
— 30 bg
— 30 bg
arch 1995 — a
arch 1995 8/100 gg
14G
eolo
gy an
d G
rou
nd
-Water R
esou
rces of th
e Law
renceville A
rea, Geo
rgia
Table 1. Records of wells inventoried in the Lawrenceville area, Georgia [Well type: B, bored or augered; D, drilled; Use of water: H, domestic; U, unused; d, destroyed; N, industrial; P, public supply; S—, data not available. Geologic unit: bg, biotite gneiss; bs, button schist; a, amphibolite; gg, granite gneiss; qs, quartzite schist. estimated from 1:24,000-scale topographic maps]
Well number
Owner Latitude LongitudeLand-surface
altitude (feet)
Well depth (feet)
Casing depth (feet)
Casing diameter (inches)
Well type
Use of water co
13FF05 David Brannon 33°55'35" 84°00'11" 1,030 325 30 6 D H Oc
13FF06 James A. Daily 33°59'38" 84°02'48" 1,045 234 43 6 D H A
13FF07 Elmore F. Stewart 33°59'33" 84°01'31" 1,020 128 89 6 D H Oc
13FF08 E.A. Barton 33°56'03" 84°01'13" 940 143 11 6 D H A
13FF12 York Casket Company 33°57'54" 84°00'02" 1,045 265 54 6 D N A
14FF05 David Manchester 33°55'01" 83°59'55" 940 105 39 6 D H A
14FF06 Dacula, Georgia 33°59'20" 83°53'47" 1,050 375 23 8 D d
14FF08 City of Lawrenceville 33°57'39" 83°59'40" 1/1,018.60 348 28 8 D U
14FF09 City of Lawrenceville 3/33°57'22" 3/83°59'43" 3/1,050 — — — D d
14FF10 City of Lawrenceville 33°57'34" 83°58'44" 5/993.29 1/177 20 8 D P
14FF11 Gerald Hanson 33°56'39" 83°57'16" 1,040 170 27 6 D H Nov
14FF12 Dr. Charles Brand 33°56'43" 83°56'14" 1,030 265 49 6 D H A
14FF13 Oscar M. Dunnagan 33°57'35" 83°56'35" 1,070 200 25 6 D H J
14FF14 James Banner 33°57'51" 83°54'46" 1,010 295 52 6 D H Sep
14FF16 City of Lawrenceville 33°57'35" 83°58'44" 5/994.64 302 7/6, 26 7/12,8 D P
14FF17 City of Lawrenceville 33°57'32" 83°58'47" 5/991.66 212 22 6 D U Nov
14FF18 City of Lawrenceville 33°57'32" 83°58'43" 5/999.36 162 24 6 D U Nov
14FF19 Jim Dunnagan 33°57'40" 83°56'49" 1,060 162 19 6 D H
14FF20 Dunnagan 33°57'33" 83°57'01" 1,040 130 13 6 D H
14FF21 Jim Dunnagan 33°57'44" 83°56'37" 1,060 200 13 6 D S
14FF26 City of Lawrenceville 33°57'33" 83°58'45" 5/993.38 380 33 4 D U M
14FF27 City of Lawrenceville 33°57'20" 83°59'43" 1/1,050.71 600 7/59, 91 7/10, 6 D U M
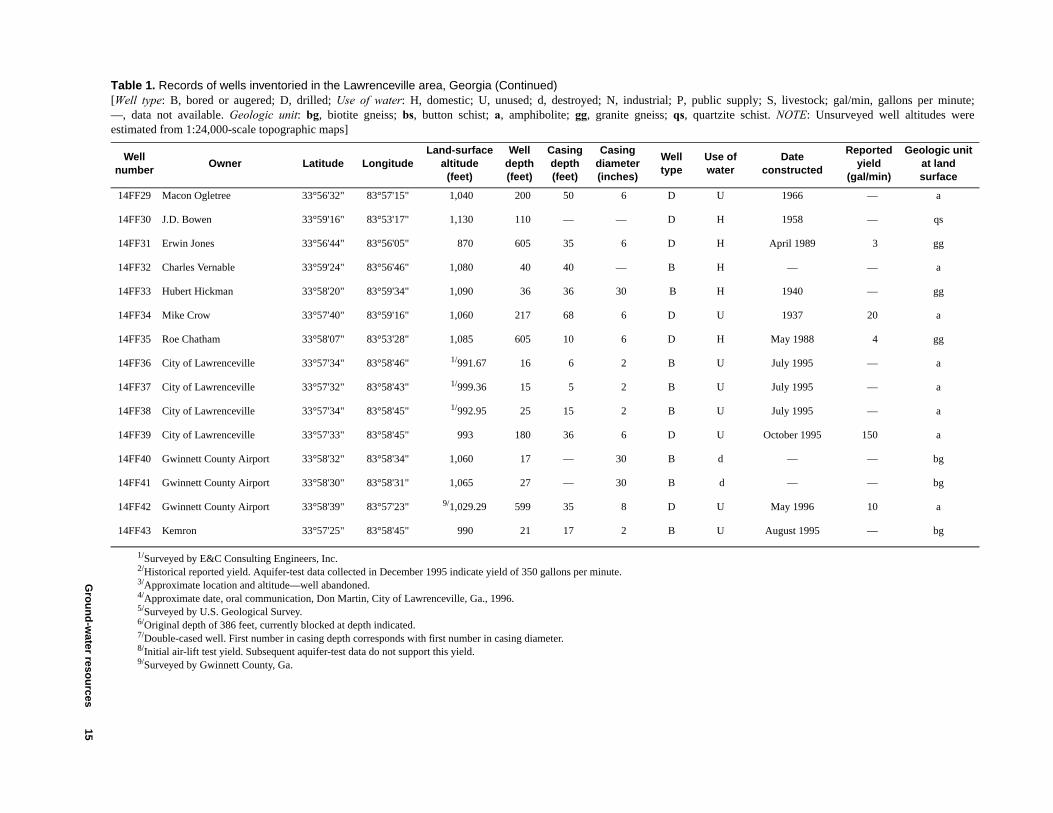
U 1966 — a
H 1958 — qs
H April 1989 3 gg
H — — a
H 1940 — gg
U 1937 20 a
H May 1988 4 gg
U July 1995 — a
U July 1995 — a
U July 1995 — a
U October 1995 150 a
d — — bg
d — — bg
U May 1996 10 a
U August 1995 — bg
public supply; S, livestock; gal/min, gallons per minute; quartzite schist. NOTE: Unsurveyed well altitudes were
Use of water
Date constructed
Reported yield
(gal/min)
Geologic unit at land surface
Gro
un
d-w
ater resou
rces
15
1/Surveyed by E&C Consulting Engineers, Inc.2/Historical reported yield. Aquifer-test data collected in December 1995 indicate yield of 350 gallons per minute.3/Approximate location and altitude—well abandoned.4/Approximate date, oral communication, Don Martin, City of Lawrenceville, Ga., 1996.5/Surveyed by U.S. Geological Survey.6/Original depth of 386 feet, currently blocked at depth indicated.7/Double-cased well. First number in casing depth corresponds with first number in casing diameter.8/Initial air-lift test yield. Subsequent aquifer-test data do not support this yield.9/Surveyed by Gwinnett County, Ga.
14FF29 Macon Ogletree 33°56'32" 83°57'15" 1,040 200 50 6 D
14FF30 J.D. Bowen 33°59'16" 83°53'17" 1,130 110 — — D
14FF31 Erwin Jones 33°56'44" 83°56'05" 870 605 35 6 D
14FF32 Charles Vernable 33°59'24" 83°56'46" 1,080 40 40 — B
14FF33 Hubert Hickman 33°58'20" 83°59'34" 1,090 36 36 30 B
14FF34 Mike Crow 33°57'40" 83°59'16" 1,060 217 68 6 D
14FF35 Roe Chatham 33°58'07" 83°53'28" 1,085 605 10 6 D
14FF36 City of Lawrenceville 33°57'34" 83°58'46" 1/991.67 16 6 2 B
14FF37 City of Lawrenceville 33°57'32" 83°58'43" 1/999.36 15 5 2 B
14FF38 City of Lawrenceville 33°57'34" 83°58'45" 1/992.95 25 15 2 B
14FF39 City of Lawrenceville 33°57'33" 83°58'45" 993 180 36 6 D
14FF40 Gwinnett County Airport 33°58'32" 83°58'34" 1,060 17 — 30 B
14FF41 Gwinnett County Airport 33°58'30" 83°58'31" 1,065 27 — 30 B
14FF42 Gwinnett County Airport 33°58'39" 83°57'23" 9/1,029.29 599 35 8 D
14FF43 Kemron 33°57'25" 83°58'45" 990 21 17 2 B
Table 1. Records of wells inventoried in the Lawrenceville area, Georgia (Continued)[Well type: B, bored or augered; D, drilled; Use of water: H, domestic; U, unused; d, destroyed; N, industrial; P, —, data not available. Geologic unit: bg, biotite gneiss; bs, button schist; a, amphibolite; gg, granite gneiss; qs, estimated from 1:24,000-scale topographic maps]
Well number
Owner Latitude LongitudeLand-surface
altitude (feet)
Well depth (feet)
Casing depth (feet)
Casing diameter (inches)
Well type

amphibolite at depth. About 292 ft of amphibolite was cored at well 14F26 (fig. 2). Compared with other amphibolite units in the Piedmont physiographic province (fig. 1), this unit appears to have a highly sheared foliation (stronger compositional layering), as well as significant concentrations of biotite and pyrite. Open-space mineralization, consisting primarily of zeolites (stilbite) and calcite, also was noted in the core samples.
Data collected from wells drilled into the amphibolite in the study area suggest that the amphibolite is more fractured at depth than are other lithologic units. These fractures are the secondary porosity and permeability that transmit ground water. Tectonic stresses, and later erosional unloading, probably created the closely spaced fractures in the amphibolite. The apparent increased presence of fracturing in the amphibolite may be related to the location of that unit at the crest of the apparent antiformal structure (indicated from the hydrogeologic sections shown in plate 2). Stress related to the folding may have enhanced fracturing potential of the amphibolite unit. In addition, well-developed compositional layering has created zones of weakness, which were vulnerable to both tectonic stress and weathering, which also enhanced ground-water movement. With this compositional layering and a fracture network, subsequent unloading by erosion of broad valleys, could have resulted in “stress release” and opening of the fracture system. The “stress release” discussed here is not a release of inherent stress associated with deep-seated igneous intrusions. Rather, it is more comparable to the upward expansion of the rock as a result of the removal of overlying rocks in broad valleys (elastic rebound). Large rock fragments noted during air-rotary drilling and from core samples often have fractures partially filled with minerals. Zeolites (stilbite) are the most abundant mineral, although epidote and iron sulfide minerals also are common. The presence of openings partly filled with mineral growth indicates that some of the stress-relief fractures have been open for considerable time.
Biotite Gneiss
From the well-inventory-data compilation, the range of yields for wells drilled into the biotite gneiss outcrop area (the well may tap other lithologic units at depth), is from about 5 to 254 gal/min (table 1). Of these seven wells having well yield data, six are domestic wells having yields that range from about 5 to 50 gal/min (table 1). A much higher yield of 254 gal/min was reported for well 13FF12, which was drilled for industrial purposes (plate 1). The corehole drilled at the Rhodes Jordan Wellfield (well 14FF26) penetrates the biotite gneiss at a depth of about 292 ft (fig. 2). The corehole continued in the biotite gneiss unit to a depth of about 320 ft, where the button schist was
penetrated. The biotite gneiss unit was again penetrated at a depth of about 355 ft and continued through the total depth of the corehole to about 380 ft. A significant fracture zone (potential production zone (PPZ)) was noted near the contact between the amphibolite unit and biotite gneiss unit at about 300 ft. The Pike Street well (14FF27) also penetrates the biotite gneiss unit from about 239–365 ft below land surface and 445–585 ft (fig. 2). A large fracture zone was noted during the drilling of this well at about 335–339 ft below land surface had an estimated yield of 50 gal/min. The biotite gneiss unit was penetrated at depths of about 100–255, 275–280 ft, 352–361 ft, and 382–600 in the Gwinnett County Airport corehole (well 14FF42; fig. 2). In this well, the biotite gneiss unit is mostly unfractured and mixed with layers of amphibolite.
Larger well yields are most probable where the biotite gneiss is strongly foliated and well jointed. The biotite gneiss generally is deeply weathered, due to the higher feldspar composition; therefore, the regolith could provide storage of shallow ground water that recharges the deeper fracture zones. Minor rock types within the biotite gneiss unit, such as pegmatites and quartz veins, respond differently to stress and weathering, and could also significantly enhance water-bearing potential. Quartz veins respond to stress in a “brittle” manner, and often are highly fractured or granulated. Pegmatites are coarser-grained than the biotite gneiss and consequently weather differently, providing pathways for ground-water movement. The biotite gneiss generally is well-foliated (compositional layering) and can have well-developed joints.
Button Schist
From the well-inventory-data compilation, the range of yields for a total of three domestic wells drilled into the button schist outcrop area (the well may tap other lithologic units at depth), is from about 23 to 100 gal/min (table 1). The button schist is interpreted as having resulted from shearing and recrystallization of the biotite gneiss. These two rock units have similar mineralogy, containing muscovite, biotite, feldspar, and quartz, but with an increase in muscovite over biotite in the schist. Although the button texture is related to intense shearing of the schist, the foliation planes generally are not open at the surface or at depth. In outcrop, the button schist does not weather deeply and does not contain prominent or regular jointing.
Sections of the button schist were retrieved from the two coreholes (wells 14FF26 and 14FF42, plate 1; figs. 1 and 2) drilled in the study area. A section of the button schist was retrieved from about 320–355 ft below land surface from the Rhodes Jordan Wellfield corehole (well 14FF26, fig. 2). The button schist also was penetrated in the Gwinnett County
16 Geology and Ground-Water Resources of the Lawrenceville Area, Georgia

Airport corehole (well 14FF42), in an alternating sequence with the biotite gneiss unit, at depths of about 255–275 ft, 280–352 ft, and 361–382 ft (fig. 2). Shear foliation in the button schist is strong and no fractures were observed in core samples.
Granite Gneiss
From the well-inventory-data compilation, the range of yields for a total of four wells having well yield data drilled into the granite gneiss outcrop area (the well may tap other lithologic units at depth), is from about 3 to 20 gal/min (table 1). This unit is known for “dry” wells, and may not yield enough water for domestic use. One property owner (well 14FF35, table 1) had to drill four wells, three of which were considered “dry.” An historical municipal well (14FF06, plate 1) owned by the City of Dacula yielded 20 gal/min. The Pike Street well (14FF27; fig. 1) penetrates the granite gneiss from land surface to a depth of about 178 ft (fig. 2). The estimate air-lift yield of this well was initially 100 gal/min; however, subsequent aquifer testing indicates a much lower overall yield. A sand collapse zone, yielding about 42 gal/min, was encountered in the Pike Street well (14FF27) within the granite gneiss, below apparent competent bedrock (original surface casing to 59 ft), from about 62–86 ft below land surface. This zone was sealed prior to well completion.
The physical characteristics of the granite gneiss vary throughout the study area, but it generally is granitic in texture and composition and is either massive or has only a weak foliation. Jointing is scarce and irregular in this lithologic unit. Generally, the granite gneiss is relatively uniform in composition, but depth of weathering is quite variable. In some areas, pavement outcrops are prominent, whereas in other areas, the granite gneiss is weathered to depths of several ten's of feet. In general, this lithologic unit is considered to have a little overall potential for high-yield wells. Massive granitic rocks can, however, yield significant quantities of water to wells if stress-relief fractures are present at depth. Because stress-relief fractures are nearly horizontal, there is little surface evidence for their presence.
Quartzite and Aluminous Schist
Yield information is not available for the only well (14FF30; plate 1) drilled in a quartzite and aluminous schist outcrop area (the well may tap other lithologic units at depth). In the subsurface, the quartzite and aluminous schist unit has only been identified in one well in the study area—the Pike Street well (14FF27, fig. 2). In this well, the unit occurs at a depth of about 178–239 ft below land sur-face. A fracture was noted near the contact with the over-lying granitic gneiss unit at a depth of about 178–179 ft.
Yield from this fracture was estimated to be about 8 to 10 gal/min.
Differential weathering is well developed in the quartzite and aluminous schist unit, as the felsic schist is much more susceptible to weathering than the siliceous quartzite. The schist generally is well foliated, but has fewer joints than the highly fractured quartzite, which most likely responded brittlely to tectonic stress and unloading during the most recent weathering cycle. The thickness of the quartzite is highly variable throughout the study area. Because of its resistance to weathering, the quartzite often underlies higher topographic areas and has little recharge potential. Although its physical characteristics suggest that the quartzite would be a potentially productive aquifer, its general thinness and typical high topographic position are not considered to be favorable hydrogeologic conditions for adequate ground-water yields in the study area.
Interpretation of Borehole Geophysical Logs
Subsurface information and lithology and fracture data, are available at four sites in the study area: (1) Rhodes Jordan Park Wellfield; (2) Maltbie Street; (3) Pike Street; and (4) the Gwinnett County Airport. Lithologic variations between these sites are shown in figure 2. In some areas, gamma logs can be used to distinguish rock types and lithologic units. Geologic core was collected from wells at the Rhodes Jordan Park (14FF26) and Gwinnett County Airport (14FF42), and cuttings were collected from the Pike Street well (14FF27). The lithology in the Maltbie Street well (14FF08) was interpreted from geophysical logs.
Of these four sites, the larger yielding wells, Rhodes Jordan Wellfield (14FF10, -16, -17, -18, -39) and Maltbie Street (14FF08), primarily penetrate the amphibolite unit (fig. 1). Production at the Rhodes Jordan Wellfield averages 230 gal/min. The Maltbie Street well (14FF08) has been tested at 350 gal/min. Originally projected to yield 100 gal/min, the Pike Street well (14FF27) penetrates five different lithologic units; however, subsequent aquifer testing suggests a much lower overall yield. The Gwinnett County Airport well (14FF42) penetrates three different lithologic units, and has an estimated yield of about 10 gal/min.
In resistive crystalline rocks, such as those in the Piedmont physiographic province of northern Georgia, fractures can be identified as distinctive anomalies on borehole geophysical logs. Typically, fractures are recognized most readily as an increase in borehole diameter on the caliper log, and a decrease in resistivity on electric logs (saturated fractures). Fractures intersecting the borehole in bedrock wells were identified using an integrated suite of borehole geophysical logs, including caliper, focused resistivity,
Ground-water resources 17

18 Geology and Ground-Water Resources of the Lawrenceville Area, Georgia
B
B
M
M
M
M
Biotite schist
14FF2614FF081,050
1,000
950
900
850
800
750
700
650
600
550
500
450
400
Feet
DATUM IS SEA LEVELNOT TO HORIZONTAL SCALE
Amphibolite/ Muscovite schist
Amphibolite/ Biotite gneiss
Interlayered Button schist/Biotite gneiss/ Amphibolite
Amphibolite/ Button schist
Quartzite
Granite gneiss
Quartzite and aluminous schist
Amphibolite
Button schist
Biotite gneiss
Fracture zone— Length tapped by borehole
Lithologic unit
Amphibolite
Biotite gneiss
Button schist
Granitic gneiss
Schist/Quartzite
Muscovite schist
Rock type
Potential pro- duction zone
Biotite gneiss/ Button schist
Figure 2. Subsurface lithologic characteristics and fractures tapped by wells 14FF08, 14FF26, 14FF27, and 14FF42. Fracture zones interpreted from well 14FF26 and 14FF42.
Rhodes Jordan Wellfieldsustained yield 230 gal/min(Yield data from 14FF39)
Aquifer test yield350 gallons per minute (gal/min)
Production zonedetermined fromaquifer test
PPZ
PPZ
PPZ
PPZ
PPZ
PPZ
75 gal/min
12 gal/min
75 gal/min

B
B
B
B B
B
B
B
B
B
B
B B
B
M
MM
M
M
MM
M
0 750500250
Gamma, in APIU(American Petroleum Institute Units)
14FF27 14FF421,050
1,000
950
900
850
800
750
700
650
600
550
500
450
400
Feet
Initial total yield100 gal/min
42 gal/min
Total estimated yield 10 gal/min
4 gal/min4 gal/min
50 gal/min
8-10 gal/min
50 gal/min
25 gal/min
Ground-water resources 19

long- and short-normal resistivity, natural gamma, acoustic televiewer and velocity, spontaneous potential, fluid temperature and resistivity, deviation, heat-pulse flowmeter, video camera logs, and single-borehole radar surveys. Subsequent to fracture zone identification, the orientation of each zone was interpreted from acoustic televiewer logs and directional borehole radar surveys.
Rhodes Jordan Wellfield
The Rhodes Jordan Park Wellfield (fig. 1) was the first local-scale study site in Lawrenceville. The wellfield includes a bedrock production well, five bedrock observation wells, and three regolith observation wells (data collected through 1997). Bedrock observation wells are located at distances of 10, 100, and 250 ft from the production well. The aquifer is a sheared and highly jointed amphibolite that is overlain by about 25 ft of regolith. A production well (14FF10, table 1) penetrating fracture zones in this aquifer supplies ground water to the City of Lawrenceville, at an average rate of about 230 gal/min. Four bedrock observation wells near the production well yield more than 100 gal/min each (the fifth well 14FF26 is a corehole and has no yield estimate). All of the bedrock observation wells respond within 10 minutes when the production well is pumped. Various borehole geophysical techniques and surface resistivity methods were used to characterize the fracture system. The geophysical interpretations were compared with surface geologic structural data recorded near the study site (Chapman and Lane, 1996; Chapman and others, 1997).
Subsurface lithologic data from the Rhodes Jordan Wellfield were obtained from historical drillers' logs of wells 14FF10 and 14FF16, geologists’ logs of wells 14FF17 and 14FF18, and the interpretation of borehole geophysical logs and geologic core samples collected as part of this study. The aquifer has been described as biotite hornblende gneiss/amphibolite. Historical drillers’ logs of well 14FF16 describe the rock as black, gray, and blue granite. The corehole drilled at the Rhodes Jordan Wellfield (fig. 2; plate 2; well 14FF26) provided essential geologic and hydrogeologic information regarding the mineralogical and textural characteristics of the amphibolite aquifer, as well as characteristics of water-bearing zones within the amphibolite. Well 14FF10, the current production well, has an estimated total depth (from historical drilling records) of about 386 ft; this well currently is blocked at about 177 ft (Mr. Jim Breakey, Atlanta Drilling and Exploration, Inc., oral commun.,1998). Based on this information, the corehole (well 14FF26; figs. 1 and 2; table 1) was drilled to a total depth of about 380 ft (fig. 2). As expected, the dominant lithologic unit from land surface to about 292 ft was the amphibolite. Below that depth, the biotite gneiss unit was penetrated to a depth of about 320 ft. The button
schist unit was penetrated from about 320–355 ft. The remainder of the borehole was identified as the biotite gneiss unit from about 355–380 ft.
Well 14FF39 (fig.1; table 1) was later drilled near the corehole (well 14FF26), by air-rotary methods, to a depth of about 180 ft to determine which fractures noted in the corehole would produce significant ground-water yield. The total estimated air-lift yield for well 14FF39 was more than 150 gal/min. Total depth of well 14FF39 was only about 180 ft due to high hydrostatic borehole pressure from productive fractures at about 120–125 ft and 170–185 ft. The maximum air-lift yield estimate from air-rotary drilling rigs is about 150 gal/min from a 6-inch diameter borehole (Mr. Johnny Robinson, Robinson Well Company, oral commun., 1995).
Interpretations of natural gamma logs indicate an overall recognizable lower baseline response for the amphibolite unit than for the other major lithologic units. The gamma log, a passive tool that measures total gamma radiation in a borehole within a selected energy range, generally reflects the presence of gamma-emitting radioisotopes such as potassium-40 and daughter products of the uranium and thorium-decay series (Keys, 1990). The gamma log of well 14FF26 (fig. 2) indicates lower gamma counts (in American Petroleum Institute units, APIU) within the amphibolite (0–292 ft below land surface), compared to the button schist and biotite gneiss at depth. The button schist and biotite gneiss units both contain much larger percentages of potassium feldspar compared to the amphibolite, which primarily contains calcium plagioclase feldspar. Many fracture zones within the amphibolite have corresponding gamma peaks (fig. 2). Secondary minerals in fracture zones may include clays (resulting from chemical breakdown of the crystalline rock), resulting in higher gamma readings, as compared with the amphibolite.
As a first step in aquifer characterization at the Rhodes Jordan Wellfield study site, depths to fracture zones were determined for each bedrock observation well. The identification of fracture zones within the amphibolite in well 14FF16 (plate 1; fig. 1; table 1) is shown in figure 3 (p. 22–23). This well was drilled in 1945, and while the driller's log does not list fracture zones specifically, zones at which the “old” well became “muddy” were noted at 42– 44 ft, 140 –170 ft, and 195 ft. Fractures are most readily identified from the caliper log, which shows borehole diameter enlargement, and electrical logs (focused resistivity). During drilling activities, borehole diameter generally is increased near fracture zones, as the bit is able to remove more material. In saturated, resistive crystalline rocks, fractures are identified as low resistivity anomalies (negative inflections). Images of fractures are produced
20 Geology and Ground-Water Resources of the Lawrenceville Area, Georgia

from acoustic televiewer logs. Based on interpretations of these logs, major fractures were identified in well 14FF16 at depths of about 43, 77–87, 92, 134, 169, 175, and 255 ft (fig. 3). During sustained pumping of production well 14FF10, the uppermost fractures at 43, 77–87, and 92 ft are regularly dewatered. However, drawdown rates are recognizably reduced near the 134 ft fracture, and the 134, 169, and 175 ft fractures have been interpreted as production zones. The deeper 255 ft fracture appears to be of a lesser magnitude, a contributing rather than a production zone fracture, from geophysical interpretations.
A relative comparison of fractures also was made using fluid conductivity, temperature, and heat-pulse flowmeter logs. Inflections or slope variations may be observed in fluid resistivity and temperature logs (fig. 3), as ground water moving into the borehole from a particular fracture zone may have different dissolved-solids concentrations or temperatures. Variations in the dissolved-solids concentra-tions are indicated by variations in the fluid resistivity logs. In well 14FF16, inflections were noted on both the fluid resistivity (increasing resistivity, lower dissolved solids) and temperature (increasing) logs near the fracture at 175 ft, and in the temperature log (increasing) near fracture at 255 ft. The heat-pulse flowmeter log (fig. 3) measures vertical flow rates within the borehole. A positive rate, or upward flow, was measured throughout well 14FF16, most likely because of the close proximity to production well 14FF10, located about 10 ft away. During the flowmeter logging of well 14FF16, nearby well 14FF10 was being pumped at a rate of about 230 gal/min, with the pump column set at about 160–170 ft. The highest flow rates of about 10 to 11 gal/min were measured near the 77–87 and 92 ft fracture zones. Turbulent flow was evident near the 134 ft fracture, suggesting direct connection with the production well at that depth. The fracture zones at 169 and 175 ft also were measured at about 7 gal/min. Overall, much less water was being contributed by the deepest fracture at 255 ft (fig. 3).
Maltbie Street Well
The Maltbie Street well (14FF08, plate 1; figs. 1 and 2; table 1) was drilled using cable-tool methods in 1947, to a total depth of about 350 ft. No drilling records or geologic information is available from historical records. However, using borehole geophysical logs, the rock type and characteristics of fracture zones were determined (figs. 2 and 4). From the low gamma readings (generally less than 100 APIU, fig. 2), the lithology of well 14FF08 was interpreted to be entirely that of the amphibolite unit. The rock type was later visually confirmed from the video log. Fracture delineation was accomplished using data primarily from the caliper and focused resistivity logs (fig. 4), and from acoustic televiewer logs. One fracture zone penetrated
by the Maltbie Street well intersects more than 10 ft of the borehole. The most significant fracture zones identified from borehole geophysical logs were delineated at depths of 48–54 ft, 101.5–115 ft, 185–191 ft, 205.5–210.5 ft, 222–227 ft, and 231–233 ft (figs. 2 and 4). Additional smaller, or contributing fracture zones were identified at 141.5–145 ft, 319.5–320.5 ft, 324–328 ft, and 343–346 ft. This well has very large (more than 15 inches in diameter) caliper peaks; the historical cable-tool drilling method apparently “cleans out” fracture zones better than modern air-rotary methods. Inflections were noted on the temperature and fluid resistivity logs near the 185–191 ft, and 233 ft fracture zones. An inflection also was noted on the fluid resistivity log near the 48–55 ft and 100–116 ft fracture zones. Inflections on the temperature and fluid resistivity logs identify fractures where water is moving into or out of the borehole.
A constant-discharge aquifer test was conducted using this well, in December 1995. The Maltbie Street well was pumped at a rate of 350 gal/min for a total of 96 hours, and had 62 ft of drawdown (U.S. Geological Survey, unpublished data, 1995). The pump was lowered to a depth near the 101.5–115 ft fracture zone, which is labeled as a production zone (PZ) in figure 4. Additionally, the deeper fractures at 185–191 ft, 205.5–210.5 ft, 222–227 ft, and 231–233 ft are interpreted as potential production zones (PPZ, fig. 4). The Maltbie Street well currently (1998) is used as an observation well. This well may be put into production within the next few years (Mr. Juan Ruiz, E&C Consulting Engineers, Inc., oral commun., 1997).
Pike Street Well
A test well (14FF27- Pike Street well; plate 1; fig. 1; table 1) was drilled by the City of Lawrenceville in March 1995 near an abandoned, former city supply well (14FF09) drilled in the 1940’s. The 1995 Pike Street well was drilled to a depth of about 600 ft. Geologic logs indicate that well 14FF27 penetrates five different lithologic units (figs. 2 and 5), including granite gneiss, quartzite and aluminous schist, biotite gneiss, amphibolite, and button schist. The biotite gneiss unit is repeated below the amphibolite unit (fig. 2). Surface casing in well 14FF27 is telescoped (table 1) because of a sand-collapse zone below the outer casing (10 inches, 0–59 ft), from about 62–86 ft, within apparent competent rock in the granite gneiss unit. This sand zone was cased off (6-inch casing, 0–91 ft) prior to the advance-ment of the borehole and produced about 42 gal/min. The open borehole below the telescoped casing produced about 100 gal/min from the initial air-lift test. Subsequent aquifer testing suggests that the yield of well 14FF27 is significantly less than 100 gal/min.
Ground-water resources 21
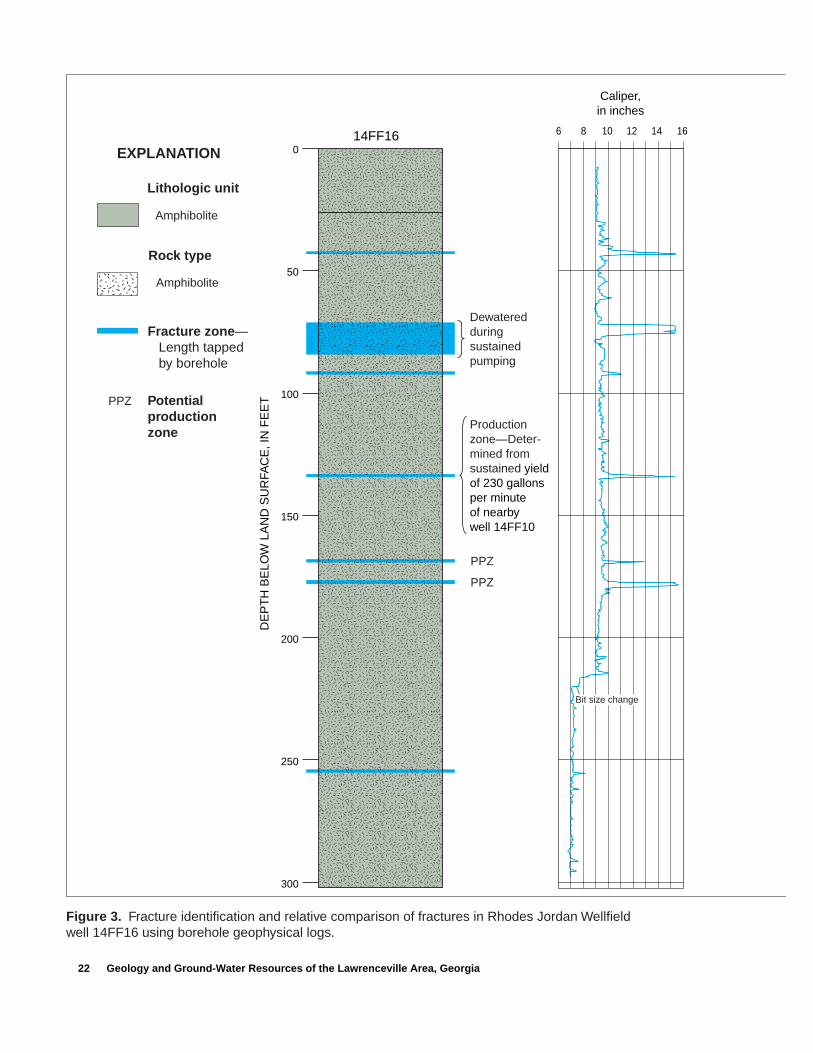
Amphibolite
Fracture zone— Length tapped by borehole
Potentialproductionzone
Lithologic unit
Amphibolite
Rock type
EXPLANATION
PPZ
PPZ
Productionzone—Deter-mined fromsustained yield of 230 gallonsper minuteof nearby well 14FF10
Dewateredduringsustainedpumping
PPZ
Caliper,in inches
6 8 10 12 14 16
Bit size change
0
50
100
150
200
250
300
DE
PT
H B
ELO
W L
AN
D S
UR
FAC
E, I
N F
EE
T
14FF16
Figure 3. Fracture identification and relative comparison of fractures in Rhodes Jordan Wellfield well 14FF16 using borehole geophysical logs.
22 Geology and Ground-Water Resources of the Lawrenceville Area, Georgia

Focused resistivity,in ohm-meters
Fluid resistivity,in ohm-meters
Temperature, indegrees Celsius
Heat-pulse flow meter, in gallons per minute
0 500 750250 1,000 1,250 1,500 1,750 35 40 45 50 17 17.5 18 0 2 4 6 8 10 12
Turbulent flow
Ground-water resources 23

0
50
100
150
200
250
300
350
14FF08
Caliper,in inches
96-hour constant-rate aquifer testyield of 350 gallons per minute
DE
PT
H B
ELO
W L
AN
D S
UR
FAC
E, I
N F
EE
T
PZ
PPZ
PPZ
PPZPPZ
5.5 8 10.5 13 15.5 18
Figure 4. Fracture identification and relative comparison of fractures in Maltbie Street well 14FF08 using borehole geophysical logs.
Amphibolite
Potentialproductionzone
Amphibolite
EXPLANATION
PPZ
Productionzone
PZ
Fracture zone— Length tapped by borehole
Lithologic unit
Rock type
24 Geology and Ground-Water Resources of the Lawrenceville Area, Georgia

Fluid resistivity,in ohm-m
Gamma, in APIU(American Petroleum Institute Units)
Temperature, indegrees Celsius
Focused resistivity,in ohm-m
0 50 100 200150 250 350300 15.5 16.516 17.517 18 35 40 45 50 550 500 750250 1,000 1,250 1,500 1,750
Ground-water resources 25

6 6.55 5.5 7 7.5
0
50
100
150
200
250
300
350
400
450
500
550
600
DE
PT
H B
ELO
W L
AN
D S
UR
FAC
E, I
N F
EE
T
Caliper,in inches
Original air-lift yield of 100 gallons per minute(gal/min); aquifer test suggests lower yield
Well 14FF27 Totalestimatedyield, ingal/min
4 gal/min
42 gal/min
4 gal/min
8–10 gal/min
50 gal/min
50 gal/min
25 gal/min
Granite gneiss
Granitic gneiss
Biotite gneiss
Schist/Quartzite
Muscovite schist
Biotite schist
Amphibolite
Biotite gneiss
Amphibolite
Button schist
Quartzite and aluminous schist
Amphibolite/ Muscovite schist
Amphibolite/ Button schist
Quartzite
Figure 5. Fracture identification and relative comparison of fractures in Pike Street well 14FF27 using borehole geophysical logs.
EXPLANATION
B
B
B
BB
BB
B
B
B
B B
B B
B
M
M MM
M
MM
MM
M
Fracture zone— Length tapped by borehole
Lithologic unit
Rock type
26 Geology and Ground-Water Resources of the Lawrenceville Area, Georgia

50 175 300 425 550 675 800 16 17 18 19 20 30 40 60 70 80 9050 100 110
Fluid resistivity,in ohm-m
Temperature, indegrees Celsius
Gamma, in APIU(American Petroleum Institute Units)
0 500250 750 1,000 1,200 1,500 1,750
Focused resistivity,in ohm-m
Ground-water resources 27

Four water-bearing fracture zones were observed during initial drilling of the Pike Street well (14FF27). Two frac-ture zones having the largest estimated yield of 50 gal/min each were noted. The first 50 gal/min fracture zone is within a minor amphibolite rock interpreted as part of the biotite gneiss unit (331–349 ft). The second 50 gal/min fracture zone is within the amphibolite unit (423–430 ft) (plate 2; fig. 2; fig. 5). Two additional water-bearing zones were noted near lithologic contacts and/or quartz-rich zones. A yield of about 8–10 gal/min was noted near the granite gneiss contact with the quartzite and aluminous schist unit (178–179 ft). A yield of about 25 gal/min was noted within a quartz-rich zone of amphibolite and biotite schist (534–536 ft) in the biotite gneiss unit (fig. 5).
From interpretations of borehole geophysical logs, fracture zones were delineated in the Pike Street well (14FF27) at depths of about 101–105 ft, 115–116 ft, 164–170 ft, 178–179 ft, 293–296 ft, 331–349 ft, 363-398 ft, 423–430 ft, 534–536 ft, and 571–572 ft (figs. 2 and 5). Good correlation of water-bearing zones and indicated fractured zones was observed from the caliper log and focused resistivity log of the Pike Street well (14FF27; figs. 2 and 5). The caliper log indicates an extensive fracture zone from about 330 to 420 ft. The focused resistivity log extends the zone of low resistivity, interpreted as fracture concentrations, from about 270–450 ft. Images of the fractures also were interpreted from the digital acoustic televiewer logs and video logs. Temperature and fluid resistivity inflections were noted near the 330–420 ft fracture zone.
Distinguishing lithologic units using the gamma logs is somewhat difficult in the Pike Street well. However, recognizably higher readings of more than 350 APIU from about 95–130 ft are associated with the granite gneiss (figs. 2 and 5).
Gwinnett County Airport Well
A corehole was drilled at the Gwinnett County Airport (well 14FF42; plate 1; fig. 2; table 1) in 1996 to expand the hydro-geologic database. This well was drilled to a total depth of about 600 ft; penetrating the amphibolite unit from land surface to about 100 ft. Below the amphibolite unit, a mixed sequence of the biotite gneiss unit and the button schist unit was noted from 100 to 600 ft (figs. 2 and 6). The well has a small estimated total yield of about 10 gal/min. The few fractures noted during drilling, and from the caliper and focused resistivity logs were from 40–41 ft, 66–69 ft, 76–79 ft and 81–83 ft in the amphibolite unit, and from about 361–363 ft in the biotite gneiss unit (fig. 6. p. 30–31). The tem-perature log indicates borehole flow near the 76–79 ft and 81–83 ft fractures. Additional fractures identified from core samples are shown in figure 6 (p. 30-31). Generally, the
biotite gneiss and button schist units are nearly imperme-able. The gamma log of well 14FF42 (figs. 2 and 6) shows much higher overall readings within the coarser, muscovite-rich button schist unit, and characteristically low readings within the amphibolite unit. The biotite gneiss unit had a comparable gamma baseline to the amphibolite unit. The biotite gneiss unit in this area is mixed, having significant layers of minor amphibolite (fig. 6, p. 30–31).
Analyses of Ground-Water Levels
A major objective of this study is to evaluate the effects of ground-water withdrawals on the bedrock aquifer in Lawrenceville. Continuous water-level data, recorded in wells at 30-minute intervals, have been collected from March 1995 through the present (June 1998). Analyses of continuous ground-water-level data suggest that the response of the aquifer (drawdown and recovery) is directly related to the volume removed and the overall stress on the ground-water system.
Tharpe and others (1997) discussed the effects of ground-water withdrawals at the Rhodes Jordan Wellfield on both local and areal bedrock water levels. Typical pumping cycles and the resulting drawdown and recovery in bedrock observation wells in the immediate vicinity of the produc-tion well, and two bedrock wells located at distances of 0.9 and 1.0 mi, were discussed. The usual pumping cycle at the wellfield is five days on and two days off. Drawdown in bedrock wells near the production well typically exceeds 70 ft during the first 5-day pumping cycle. The effects on nearby regolith ground-water levels also were analyzed dur-ing a one-month period. However, during the summer, when demand is high, the pumping period has been extended to as many as 62 days. When the well is allowed to recover for the usual 2-day weekend period, a net recovery is evident in bedrock ground-water levels when pumping resumes.
Tharpe and others (1997) also discussed the areal effects of pumping from the Rhodes Jordan Wellfield. Two bedrock observation wells located 0.9 mi N80W (Maltbie St. well 14FF08, plate 1, fig. 1) and 1.0 mi S80W (Pike St. well 14FF27) from the production well, were monitored. Weekly pumping cycles are evident in records of ground-water levels in both wells. The Maltbie Street well (14FF08) had the greater drawdown. Additional significance was noted, in that these two bedrock observation wells are located in a different drainage basin than the Rhodes Jordan Wellfield production well. The Rhodes Jordan Wellfield is located in the Alcovy River basin, the Maltbie Street observation well (14FF08) is located in the Yellow River basin, and the Pike Street observation well (14FF27) is located near the divide between the two basins.
28 Geology and Ground-Water Resources of the Lawrenceville Area, Georgia

Response of Local Ground-Water Levels to Pumpage
As part of this study, continuous ground-water-level data were collected from the Rhodes Jordan Wellfield since March 1995, to observe the response of the ground-water system to pumpage. In general, ground-water levels are measured by pressure transducers and recorded at 30-minute intervals. As other wells have been drilled or refurbished in the Lawrenceville area, the network of observation wells has expanded to include three additional sites; the Pike Street site in November 1995, Maltbie Street site in December 1995, and the Gwinnett County Airport site in June 1996. The effects of pumpage, both during net drawdown and net recovery conditions, have been documented across surface-water drainage divides.
Although a permit for withdrawal of up to 300,000 gal/d was issued for the Rhodes Jordan production well (14FF10) in 1993 (Mr. Juan Ruiz, E&C Consulting Engineers, Inc., oral commun., 1996), ground-water withdrawals at the Rhodes Jordan Wellfield only were periodic until the summer of 1995. If the daily pumping and recovery periods, as well as the pumping rate remain fairly constant, the bedrock aquifer is dewatered to a depth near a productive fracture, and the rate of drawdown gradually decreases. From geophysical log interpretations (not presented graphically in this report) and ground-water-level observations, the primary water-producing fractures are at depths of 128–130.5 ft and 172.5–178 ft in production well 14FF10. During mid-July through mid-September 1995, the production well was pumped for 62 consecutive days. Pumping duration averaged about 15 hours during this period, and the rate of withdrawal was about 245 gal/min. Data from observation well 14FF17 (fig. 7) show the response of ground-water levels in the bedrock aquifer during the pumping period that began on July 19, 1995, and ended on September 18, 1995. This extended pumping period yielded about 16.4 million gallons (Mgal) of ground water, and total drawdown was about 108 ft. Ground-water levels recovered to prepumping levels after about 11 days (Tharpe and others, 1997).
Various hydrologic conditions have been observed since pumping resumed at the Rhodes Jordan Wellfield on February 1, 1996, continuing through 1997. The bedrock ground-water system reached a full recovery after the shutdown of the production well 14FF10 on September 18, 1995, and maintained that level for several months. Pumping resumed in early February at a rate of about 230 gal/min. The primary pumping schedule used by the City of Lawrenceville, is 5 days on and 2 days off (weekend), resulting in weekly withdrawals ranging from about 1.2 to 1.5 Mgal (E&C Consulting Engineers, Inc., written
commun., 1996). The early drawdown during the first week (5 days) of pumping was about 75 ft; weekend recovery ranged from about 15 to 30 ft. As pumping continues, weekly and daily drawdown decrease, and ground-water levels approach equilibrium with the pumping rate. Although “steady-state” conditions may never actually occur, weekly net drawdown in the bedrock aquifer may be only 1 to 2 ft. In general, at the 230 gal/min pumping rate, the lowest ground-water levels observed have been about 135 ft below land surface at the Rhodes Jordan Wellfield.
As the demand for water supply in the City of Lawrenceville increased, particularly during the summer months, the pumping cycle was extended to as many as 62 days. When the pumping period was extended on a daily basis by the number of hours per day, or by several days (assuming the pumping rate remains constant), a unique hydrologic condition of net recovery was observed.
The unusual hydrologic condition of net recovery in the bedrock aquifer was observed after a 12-day pumping cycle in September 1996 (fig. 8). Well 14FF10 was pumped at an average rate of about 0.26 Mgal/d, and allowed to recover for only a few hours each day. Total volume pumped during this 12-day cycle was about 3.1 Mgal. At the conclusion of the 12-day pumping cycle, the well was shut down to recover for the usual 2-day weekend period. As the 5-day, weekly pumping cycle resumed, instead of the normal loss or decline of hydraulic head in the bedrock aquifer, the net effect was an increase, or gain, in bedrock ground-water levels of about 6 ft over a period of about 3 weeks (fig. 8). The weekly pumping volume did not decrease, but rather increased from 1.26 to 1.38 Mgal during the observed “recovery” period (Tharpe and others, 1997). This apparent recovery condition has been observed several times during this study.
The cause of the net recovery observed during pumping is indiscernible at this time. The areal influence of pumping may extend across a hydraulic boundary in the ground-water system, or the ground-water system may be exhibiting a pressure response, resulting in a more regional rate of recovery that is greater than pumping withdrawals at the Rhodes Jordan Wellfield. Or, the recovery may reflect the presence of steeper hydraulic gradients, from the over-stressed period, resulting in larger induced ground-water flow to the wellfield, that is apparently unaffected by the general 5-day pumping cycle. The influence of significant rainfall on bedrock ground-water levels is uncertain at this time. However, this unusual recovery response has been observed during relatively dry periods in the spring, summer, and fall.
Ground-water resources 29

5.5 6 6.5 714FF42
Caliper, in inches
DE
PT
H B
ELO
W L
AN
D S
UR
FAC
E, I
N F
EE
T
Total estimated yield10 gallons per minute
0
50
100
150
200
250
300
350
400
450
500
550
600
Amphibolite
Biotite gneiss
Button schist
Fracture
Amphibolite
Biotite gneiss
Interlayered Button schist/Biotite gneiss/ Amphibolite
Button schist
Amphibolite/ Biotite gneiss
Figure 6. Fracture identification and relative comparison of fractures in Gwinnett County Airport well 14FF42 using borehole geophysical logs.
Bit size change
Fracture zone— Length tapped by borehole
Lithologic unit
Rock type
EXPLANATION
30 Geology and Ground-Water Resources of the Lawrenceville Area, Georgia

0 500250 750 1,000 1,250 1,500 1,750 0 50 150100 200 250 350300 16 17 18 19
Focused resistivity,in ohm-m
Gamma, in APIU(American Petroleum Institute Units)
Temperature, indegrees Celsius
Ground-water resources 31

WAT
ER
LE
VE
L, IN
FE
ET
BE
LOW
LA
ND
SU
RFA
CE
Well 14FF17
August 1995
JulyJune
0
50
100
150
6 13 20 27 3 410 17 24 3129 7
September October
14 21 28
Figure 7. Continuous ground-water levels at the Rhodes Jordan Wellfield during June 29–October 4, 1995. (Data recorded in 30-minute intervals.)
32 Geology and Ground-Water Resources of the Lawrenceville Area, Georgia

60
70
80
90
100
110
120
130
WAT
ER
LE
VE
L, IN
FE
ET
BE
LOW
LA
ND
SU
RFA
CE
3 7 11 12 1515 19 23 27 31 4 8September October
Well 14FF17
3.12 million gallons(Mgal)
Pumping/recovery cycle
1.26Mgal
1.32Mgal
1.38Mgal
1.48Mgal
1996
Figure 8. An extended 18-day pumping period and ground-water-levelrecovery at the Rhodes Jordan Wellfield during September 3–October 15, 1996. (Data recorded in 30-minute intervals.)
Ground-water resources 33

Continuous ground-water-level data also indicate that ground-water withdrawals in the Rhodes Jordan Wellfield affect water levels in the overlying regolith near the production well. Weekly pumping cycles are evident in the hydrograph of regolith observation well 14FF43 (figs. 1, 2, and 9a), located about 950 ft southwest of bedrock production well 14FF10 (figs. 1, 2, and 9b, data from nearby observation well 14FF16)). The time lag for the response of water levels in well 14FF43 to the weekly cycles of the production well averaged about 8 hours during October 1996. During these 5-day pumping cycles, regolith ground-water levels in well 14FF43 declined a maximum of about 0.11 ft; whereas the water level in nearby bedrock well 14FF16 (fig. 9b), located about 15 ft from the pumped well, declined as much as 35 ft per weekly cycle (Tharpe and others, 1997).
Areal Effects of Ground-Water Withdrawals
Continuous ground-water-level data indicate that pumping at the Rhodes Jordan Wellfield directly affects water levels in the Maltbie Street well (14FF08, located about 0.9 mi N80W of the wellfield), and the Pike Street well (14FF27, located about 1 mi S80W of the wellfield) (figs. 1 and 10). The Maltbie Street well is in a separate surface-water drainage basin (Yellow River basin), compared with the Rhodes Jordan Wellfield, which is in the Alcovy River basin. The Pike Street well is located near the drainage divide between these two watersheds.
The areal effects of pumping are evident in the similarity between hydrographs from the Rhodes Jordan Wellfield, Maltbie Street, and Pike Street wells (shown in figs.10a, b, and c, respectively). In general, the magnitude of drawdown per weekly pumping cycle is greater in the Maltbie Street well (0.75 to 3.10 ft) than in the Pike Street well (0.34 to 0.82 ft). This indicates that the hydraulic connection between pumped well 14FF10 and observation well 14FF08 is greater than between wells 14FF10 and 14FF27. These observations suggest that ground-water recharge areas may not be limited to watershed basins, and suggest the presence of connecting fracture systems between the wells at a distance of at least 1 mi (Tharpe and others, 1997).
Ground-Water Quality
As part of the evaluation of the geochemical setting and potential impact of urban activities on ground-water quality in the fractured crystalline-bedrock aquifer near Lawrenceville, ground-water samples were collected during October–November 1995 from the Rhodes Jordan Wellfield (table 2), and from the wellfield and outlying bedrock observation wells during August 1996 (table 3). A sample of
surface water was collected from City Lake at the Rhodes Jordan Wellfield during both sampling events. The October–November 1995 samples are representative of a recovering ground-water system. After periodic pumping in the spring, and constant pumping from mid-July through mid-September 1995, the Rhodes Jordan production well (14FF10) was shutdown about 6 weeks prior to sampling. The August 1996 samples are representative of a stressed ground-water system. Well 14FF10 had been pumped, generally, on a 5-day-per-week schedule, since February 1996. Samples were analyzed for major ions and volatile organic compounds.
In general, the composition of water collected from the bedrock wells, regolith wells, and the lake is similar; calcium and bicarbonate are the dominant cation and anion, respectively (figs. 11 and 12). Two exceptions are samples collected from wells 14FF16 and 14FF42, which have sulfate as the dominant anion (tables 2 and 3). Sulfate concentrations were as high as 300 milligrams per liter (mg/L) in well 14FF16 in October 1995. A high concentration of iron, 44 mg/L, also was noted in the October 1995 sample from well 14FF16. Mixing problems were evident, as field parameters did not stabilize in well 14FF16 during that sampling event. Iron and sulfate concentrations have been observed to fluctuate during pumping in well 14FF10. These fluctuations most likely are related to variable oxidation/reduction conditions in the wells, during drawdown (dewatering of fracture zones) and subsequent recovery of ground-water levels during pump shutdown. The oxidation of minerals such as pyrite (FeS) in the rock and fractures in wells occurs during dewatering, breaking down pyrite through the oxidation of iron and dissolution of sulfate ions. The subsequent introduction of reduced bedrock ground water during recovery may return iron to solution (Hem, 1989).
Ground water collected from the regolith wells generally has lower concentrations of major ions (most likely from the lack of direct contact with crystalline bedrock), and has lower values of pH (most likely from the infiltration of acidic precipitation), than water from the bedrock wells. Analyses of ground-water samples collected during the two sampling events indicate that calcium concentrations range from about 9.8 to 60 mg/L in bedrock wells, from about 2.4 to 15 mg/L in regolith wells, and is about 8.9 and 8.6 mg/L in the lake samples (tables 2 and 4), respectively. Measurements of field alkalinities (bicarbonate concentrations) range from 45 to 103 mg/L in the bedrock wells, and from about 17 to 91 mg/L in the regolith wells. Water samples collected from the lake had an alkalinity value of 30 mg/L in August 1996. Specific-conductance field measurements range from 110 to 685 microSiemens per centimeter (µS/cm) for the bedrock wells, from
34 Geology and Ground-Water Resources of the Lawrenceville Area, Georgia
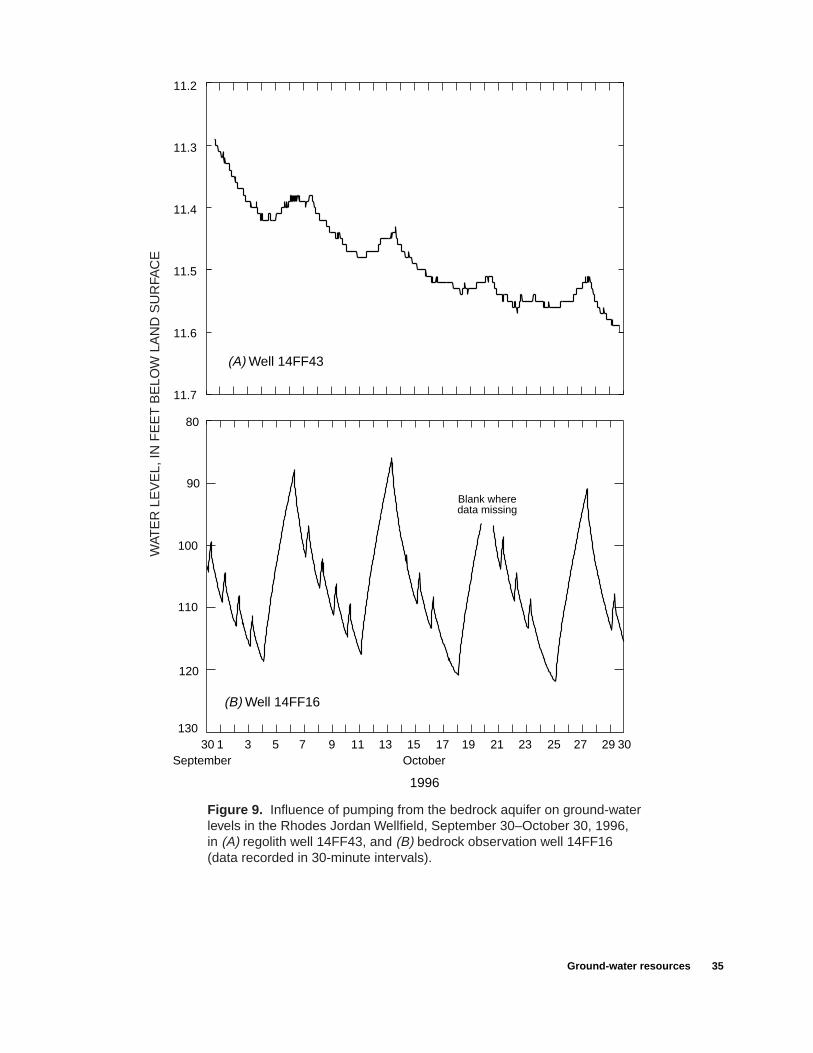
(A) Well 14FF43
11.2
11.3
11.4
11.5
11.6
11.7
80
90
100
110
120
1301 3 5 7 9 11 13 15 17 19 21 23 25 27 29 3030
October September
(B) Well 14FF16
Blank wheredata missing
WAT
ER
LE
VE
L, IN
FE
ET
BE
LOW
LA
ND
SU
RFA
CE
1996
Figure 9. Influence of pumping from the bedrock aquifer on ground-water levels in the Rhodes Jordan Wellfield, September 30–October 30, 1996,in (A) regolith well 14FF43, and (B) bedrock observation well 14FF16(data recorded in 30-minute intervals).
Ground-water resources 35

(A) Rhodes Jordan Wellfield Wells 14FF16, 14FF17, and 14FF18
40
60
80
100
120
140
160
May June July Aug Sept Oct Nov Dec Jan
1996 1997
(B) Maltbie Street Well 14FF08
WAT
ER
LE
VE
L, IN
FE
ET
BE
LOW
LA
ND
SU
RFA
CE
14
16
18
20
22
Blank where dataare missing
Blankwhere dataare missing
Figure 10. Influence of pumping at the Rhodes Jordan Wellfield on ground-water levels in bedrock observation wells, May 1, 1996 to January 20, 1997.
36 Geology and Ground-Water Resources of the Lawrenceville Area, Georgia

WAT
ER
LE
VE
L, IN
FE
ET
BE
LOW
LA
ND
SU
RFA
CE
(C) Pike Street Well 14FF27
May June July Aug Sept Oct Nov Dec Jan
1996 1997
12.0
12.5
13.0
13.5
14.0
14.5
15.0
Blank where dataare missing
Figure 10. Influence of pumping at the Rhodes Jordan Wellfield on ground-water levels in bedrock observation wells, May 1, 1996 to January 20, 1997—continued.
Ground-water resources 37

Table 2. Physical properties and concentrations of inorganic constituents in ground-water samples collected from the Rhodes Jordan Wellfield during October–November 1995
[mm, millimeter; mg/L, milligram per liter; µg/L, microgram per liter; µS/cm, microSiemens per centimeter at 25 degrees Celsius; CaCO3, calcium carbonate; <, less than; nd, none detected; na, not analyzed; —, not applicable]
Physical property or constituent,
in units
Reporting limit,
in units
Sampling site and date
Bedrock wells Regolith wellsSurface water
14FF16 10/31/95
14FF17 10/30/95
14FF18 10/30/95
14FF39 10/31/95
14FF36 11/06/95
14FF37 11/07/95
City Lake 11/06/95
Physical properties
Specific conductance (field), in µS/cm
1.0 685 215 227 243 80 na 85
Specific conductance (laboratory), in µS/cm
1.0 651 230 244 243 78 174 83
pH (field), in standard units — 6.3 7.1 6.9 6.6 5.4 na 6.4
pH (laboratory), in standard units
— 6.0 6.8 6.8 6.7 5.9 5.9 7
Water temperature (field), in degrees Celsius
— 17.9 17.3 18 17 na na 13
Dissolved oxygen (field), in mg/L
— 0.04 0.03 0.04 0.03 0.04 na 5.1
Air pressure (field), in mm of mercury
— na 746 746 na na na na
Major dissolved constituents
Hardness as CaCO3, in mg/L 1.0 253 95 88 104 24 65 29
Dissolved solids, in mg/L 1.0 505 153 157 151 52 119 47
Calcium, dissolved, in mg/L 0.02 60 26 23 25 3.5 13 8.9
Magnesium, dissolved, in mg/L 0.004 25 7.3 7.5 10 3.7 8.0 1.6
Sodium, dissolved, in mg/L 0.06 10 7.0 9.9 5.0 3.3 7.5 1.9
Potassium, dissolved, in mg/L 0.1 4.8 3.3 3.5 2.5 1.2 1.0 3.5
Alkalinity (field), in mg/L — 45 96 80 103 na na na
Alkalinity (laboratory), in mg/L 1.0 na 100 74 105 na 66 25
Sulfate, dissolved, in mg/L 0.1 300 10 30 13 1.3 13 6.8
Chloride, dissolved, in mg/L 0.1 6.7 4.9 8.2 3.9 4.0 3.3 1.8
Fluoride, dissolved, in mg/L 0.1 0.2 0.4 0.7 0.2 0.2 0.2 0.2
Bromide, dissolved, in mg/L 0.01 0.06 0.04 0.05 0.02 0.14 0.06 0.04
Silica, dissolved as Silicon oxide, in mg/L
0.05 46 33 28 27 14 31 6.1
Nitrite-Nitrate, dissolved as Nitrogen, in mg/L
0.05 nd nd nd nd 1.2 0.32 0.25
Iron, dissolved, in µg/L 10 44,000 760 1,800 970 17 <10 160
Manganese, dissolved, in µg/L 3.0 850 120 260 150 910 580 30
Carbon dioxide, dissolved, in mg/L
0.1 12.8 na na na na na na
38 Geology and Ground-Water Resources of the Lawrenceville Area, Georgia

Table 3. Physical properties and concentrations of inorganic constituents in ground-water samples collected from the Rhodes Jordan Wellfield and outlying bedrock observation wells during August 1996
[mm, millimeter; mg/L, milligram per liter; µg/L, microgram per liter; µS/cm, microSiemens per centimeter at 25 degrees Celsius; CaCO3, calcium carbonate; nd, none detected; na, not analyzed; —, not applicable]
Physical properties or constituent,
in units
Reporting limit
Bedrock well and sampling date
14FF08 08/13/96
14FF10 08/15/96
14FF16 08/15/06
14FF17 08/15/96
14FF18 08/15/96
14FF27 08/14/96
14FF39 08/15/96
14FF42 08/13/96
Physical properties
Specific conductance (field), in µS/cm
1.0 174 218 295 219 225 110 260 301
Specific conductance (laboratory), in µS/cm
1.0 209 238 320 238 239 122 282 335
pH (field), in standard units — 6.3 7.0 6.8 7.4 6.9 6.2 6.6 7.3
pH (laboratory), in standard units — 7.0 7.1 6.8 7.2 6.9 6.6 6.8 7.2
Water temperature (field), in degrees Celsius
— 17.1 18.0 19.2 19.0 19.3 18.1 18.5 18.6
Dissolved oxygen (field), in mg/L — 0.04 0.07 4.52 0.83 0.05 4.08 3.15 0.06
Air Pressure (field), in mm of mercury
— 734 740 740 740 740 738 740 734
Major constituents
Hardness as CaCO3, in mg/L 1.0 78 90 129 91 85 41 120 140
Dissolved solids, in mg/L 1.0 138 155 212 159 153 93 178 242
Calcium, dissolved, in mg/L 0.02 18 24 32 25 22.0 9.8 27 42
Magnesium, dissolved, in mg/L 0.004 8.0 7.4 12 7.0 7.2 3.9 13 9.6
Sodium, dissolved, in mg/L 0.06 7.4 8.8 6.6 11 9.4 7.9 5.8 5.7
Potassium, dissolved, in mg/L 0.1 3.8 3.4 3.4 3.3 3.4 2.5 2.7 2.9
Alkalinity (field), in mg/L 1.0 75 83 49 89 76 48 96 53
Alkalinity (laboratory), in mg/L 1.0 75 80 54 94 75 37 96 51
Sulfate, dissolved, in mg/L 0.1 17 24 91 13 28 4.2 39 110
Chloride, dissolved, in mg/L 0.1 5.9 6.7 3.8 7.1 7.5 7.7 3.9 1.4
Fluoride, dissolved, in mg/L 0.1 0.1 0.7 0.3 0.9 0.8 nd 0.2 nd
Bromide, in mg/L 0.01 0.03 0.07 0.03 0.06 0.05 0.04 0.02 0.06
Silica, dissolved, in mg/L 0.05 31 31 30 34 28 27 28 38
Nitrite-Nitrate, dissolved, in mg/L 0.05 0.06 nd 0.05 0.08 nd 1.7 0.1 0.06
Barium, total, in µg/L 100 nd na na na na na na na
Cobalt, total, in µg/L 0.1 2.0 na na na na na na na
Copper, total, in µg/L 0.1 nd na na na na na na na
Iron, dissolved, in µg/L 10 960 1,000 18 500 1,600 360 330 1,500
Lead, total, µg/L 1.0 nd na na na na na na na
Manganese, dissolved, in µg/L 3.0 94 170 190 110 270 17 160 110
Mercury, in mg/L 0.1 nd na na na na na na na
Nickel, total, in µg/L 0.1 5.0 na na na na na na na
Zinc, total, in µg/L 10 nd na na na na na na na
Cyanide, total, in mg/L 0.01 nd na na na na na na na
Carbon, organic, as C, dissolved, in mg/L
0.1 nd 0.2 na 0.2 0.2 nd 0.6 0.1
Carbon dioxide, dissolved, in mg/L 0.1 71.1 14.5 14.8 na na na na na
Ground-water resources 39

100
80 60 40
20
40
0 20 0 0 20 40 60 80 100
0
20
40
80
60
100
0
0
0
20
20
20
40
40
40
60
60
6080
8010
0
100
80
100100
1
80
80
100
60
60
40
40
20
20
0
0
80
100
60
40
20
0
100
80
60
MAG
NE
SIU
M
SU
LFAT
E P
LUS
CH
LOR
IDE
CA
RB
ON
ATE
PLU
S B
ICA
RB
ON
ATE
CA
LCIU
M P
LUS
MAG
NE
SIU
M
SO
DIU
M P
LUS
PO
TAS
SIU
M
SU
LFATE
62
4 7
5 3
53
24
1 7
6
624 7
5
3
1
CALCIUM CHLORIDE
PERCENT
PE
RC
EN
TP
ER
CE
NT
1 14FF16 Bedrock well 10-31-952 14FF17 Bedrock well 10-30-953 14FF18 Bedrock well 10-30-954 14FF39 Bedrock well 10-31-955 City Lake Surface water 11-06-956 14FF36 Regolith well 11-06-957 14FF37 Regolith well 11-07-95
Number Well ID Sampling-site type Date of sample
EXPLANATION
Figure 11. Trilinear diagram of water-quality analysis from ground-water and City Lakewater samples collected during October-November 1995.
40 Geology and Ground-Water Resources of the Lawrenceville Area, Georgia

100
80 60 4020
40
0 20 0 0 20 40 60 80 100
0
20
40
80
60
100
0
0
0
20
20
20
40
40
40
60
60
6080
8010
0
100
80
100100
80
80
100
60
60
40
40
20
20
0
0
80
100
60
40
20
0
100
80
60
MAG
NE
SIU
M
SU
LFAT
E P
LUS
CH
LOR
IDE
CA
RB
ON
ATE
PLU
S B
ICA
RB
ON
ATE
CA
LCIU
M P
LUS
MAG
NE
SIU
M
SO
DIU
M P
LUS
PO
TAS
SIU
M
SU
LFATE
CALCIUM CHLORIDE
PERCENT
PE
RC
EN
T
PE
RC
EN
T
1 14FF16 Bedrock well 08-15-962 14FF17 Bedrock well 08-15-963 14FF18 Bedrock well 08-15-964 14FF39 Bedrock well 08-15-965 City Lake Surface water 08-16-966 14FF36 Regolith well 08-16-967 14FF37 Regolith well 08-16-968 14FF38 Regolith well 08-16-969 14FF08 Bedrock well 08-13-96
10 14FF27 Bedrock well 08-14-9611 14FF42 Bedrock well 08-13-9612 14FF10 Bedrock well 08-15-96
43
1295
728
1
11
8 6
10257
912
34
1
11
115 2 10
6
7
84
9112 3
10
6
Number Well ID Sampling-site type Date of sample
EXPLANATION
Figure 12. Trilinear diagram of water-quality analysis from ground-water and City Lakewater samples collected during August 1996.
Ground-water resources 41

Table 4. Physical properties and concentrations of inorganic constituents in water samples collected from regolith wells and City Lake at the Rhodes Jordan Wellfield during August 1996
[mm, millimeter; mg/L, milligram per liter; µg/L, microgram per liter; µS/cm, microSiemens per centimeter at 25 degrees Celsius; CaCO3, calcium carbonate; <, less than; nd, none detected; na, not analyzed; —, not applicable]
Physical property or constituent,
in units
Reporting limit
Sampling site and date
Regolith wellSurface water
14FF36 08/16/96
14FF37 08/16/96
14FF38 08/16/96
City Lake08/16/96
Physical properties
Specific conductance (field), in µS/cm 1.0 59 147 180 87
Specific conductance (laboratory), in µS/cm 1.0 56 151 188 85
pH (field), in standard units — 5.2 6.0 6.5 7.8
pH (laboratory), in standard units — 6.3 6.3 6.6 6.9
Water temperature (field), in degrees Celsius — na na na na
Dissolved oxygen (field), in mg/L — na na na na
Air Pressure (field), in mm of mercury — na na na na
Major constituents
Hardness, as CaCO3, in mg/L 1.0 16 50 76 30
Dissolved solids, in mg/L 1.0 44 105 137 46
Calcium, dissolved, in mg/L 0.02 2.4 9.8 15 8.6
Magnesium, dissolved, in mg/L 0.004 2.4 6.2 9.3 2.1
Sodium, dissolved, in mg/L 0.06 3.3 7.9 6.1 2.7
Potassium, dissolved, in mg/L 0.1 1.1 0.8 0.8 2.5
Alkalinity (field), in mg/L 1.0 17 89 91 30
Alkalinity (laboratory), in mg/L 1.0 15 55 88 31
Sulfate, dissolved, in mg/L 0.1 1.0 13 2.8 6.0
Chloride, dissolved, in mg/L 0.1 3.9 3.0 3.5 2.3
Fluoride, dissolved, in mg/L 0.1 nd nd 0.2 0.1
Bromide, in mg/L 0.01 0.2 0.04 0.06 nd
Silica, dissolve, in mg/L 0.05 15 29 44 3.1
Nitrite-Nitrate, dissolved as Nitrogen, mg/L 0.05 1.3 0.49 0.26 0.05
Iron, dissolved, in µg/l 10 <10 <10 190 16
Manganese, dissolved, in µg/L 3.0 51 170 840 <3.0
Carbon, organic as C, dissolved, in mg/L 0.1 0.7 1.0 3.6 2.8
Cyanide, total, in mg/L 0.01 na na na na
42 Geology and Ground-Water Resources of the Lawrenceville Area, Georgia

59 to 180 µS/cm for the regolith wells, and are 85 and 87 µS/cm from the lake samples, respectively. Values of field pH range from about 6.2 to 7.4 for the bedrock wells, from about 5.2 to 6.5 for the regolith wells, and about 6.4 and 7.8, from the lake, respectively (tables 2, 3, and 4).
Results of the analyses for volatile organic compounds indicate the presence of nonregulated organic compounds in ground-water samples collected from the Rhodes Jordan Wellfield, and low-level concentrations of regulated compounds in samples collected from the Maltbie Street well (14FF08) and the Pike Street well (14FF27) (plate 1; fig. 1). A complete list of volatile organic compounds included in the analyses is presented in table 5. The primary nonregulated organic compound detected at the Rhodes Jordan Wellfield is methy-tert-butyl-ether (MTBE) (tables 6 and 7). MTBE was detected in all of the bedrock observation wells at the Rhodes Jordan Wellfield in October-November 1995, and in several of the bedrock wells in August 1996, except observation well 14FF17. This compound also was detected at a concentration of less than 1 microgram per liter (µg/L) at the Gwinnett County Airport well (14FF42) (table 7). Concentrations of MTBE detected in wells at the Rhodes Jordan Wellfield range from about 0.6 to 12 µg/L in samples collected during October–November 1995 (table 6), and about 0.6 to 26 µg/L in
samples collected during August 1996 (table 7). In quarterly samples of the Rhodes Jordan production well (14FF10) collected by Kemron Environmental Services, Inc., during September–October 1996, and January, March, and June 1997, concentrations of MTBE were somewhat consistent, ranging from about 21 to 25 µg/L (Kemron Environmental Services, Inc.,1997a–d).
Other organic compounds detected in the Lawrenceville wells include trace concentrations (less than 1 µg/L) at the Rhodes Jordan Wellfield of: tetrachloroethylene (PCE) in bedrock wells 14FF10 and 14FF16; and regolith wells 14FF37 and 14FF38 in August 1996 (table 6); 1,1-dichloroethane, cis-1,2-dichloroethene, and trichloroethylene (TCE) in well 14FF17, October–November 1995 (table 5); trichlorofluoromethane, and 1,1,1-trichloroethane in well 14FF37, October–November 1995 (table 6) and 1,1-dichlorethylene and 1,1,1-trichloroethane in August 1996 (table 7). Organic compounds detected in samples collected from the Maltbie Street well (14FF08) in August 1996 include 1.3 µg/L PCE, and less than 1 µg/L TCE, chloroform, and cis-1,2-dichloroethene (table 7). The sample collected from the Pike Street well (14FF27) in August 1996 contained 2.7 µg/L PCE and less than 1 mg/L chloroform (table 7).
Table 5. Volatile organic compounds included in laboratory analyses
DibromomethaneDichlorobromo-methaneCarbon tetrachloride1,2-DichloroethaneBromoformChlorodibromo-methaneChloroformTolueneBenzene ChlorobenzeneChloroethaneEthylbenzeneMethyl bromideMethyl chlorideMethylene chlorideTetrachloroethylene (PCE)Trichloroflouromethane1,1-Dichloroethane1,1-Dichloroethylene1,1,1-Trichloroethane
1,1,2-trichloroethane0-Dichlorobenzene1,2-Dichloropropane1,2-trans-dichloroethene1,2-trans-dichlorobenzene1,3-Dichlorobenzene1,4-Dichlorobenzene2-ChloroethylvinyletherDichlorodifluoromethaneNapthaleneTrans-1,3-DichloropropeneCis-1,3-DichloropropeneTrichloroethylene (TCE)HexachlorobutadieneVinyl chlorideCis-1,2-DichloroetheneStyrene1,1-Dichloropropene2,2-Dichloropropane 1,3-Dichloropropane
1,2,4-TrimethylbenzeneIsopropyl benzeneN-Propylbenzene1,3,5-Trimethylbenzene0-ChlorotolueneP-ChlorotolueneBromochloromethaneN-ButylbenzeneSec-butylbenzeneTert-butylbenzeneP-Isopropyltoluene1,2,3-Trichloropropane1,1,1,2-Tetrachloroethane1,2,3-Trichlorobenzene1,2-DibromoethaneMethyl-tert-butyl-ether (MTBE)XyleneBromobenzeneDibromochloropropaneTrichloro-trifluoroethane
Ground-water resources 43

Table 6. Concentrations of volatile organic compounds detected in ground-water samples collected from the Rhodes Jordan Wellfield during October–November 1995
[Concentrations are in micrograms per liter (µg/L); nd, none detected; reporting limit is 0.2 µg/L for all compounds; < 0.2, trace concentration detected]
Chemical compound, in units
Sampling site and date
Bedrock well Regolith well Surface water
14FF16 10/31/95
14FF17 10/30/95
14FF18 10/30/95
14FF39 10/31/95
14FF36 11/06/95
14FF37 11/05/95
City Lake 11/06/95
Trichloroflouromethane, in µg/L nd nd nd nd nd <0.2 nd
1,1-Dichloroethane, in µg/L nd <0.2 nd nd nd nd nd
1,1,1-Trichloroethane, in µg/L nd nd nd nd nd <0.2 nd
Trichloroethylene (TCE), in µg/L nd <0.2 nd nd nd nd nd
Cis-1,2-Dichloroethene, in µg/L nd <0.2 nd nd nd nd nd
Methyl-tert-buty-ether (MTBE), in µg/L 9.2 0.6 12.0 0.7 nd nd nd
Table 7. Concentrations of volatile organic compounds detected in ground-water samples collected from the Rhodes Jordan Wellfield and outlying bedrock wells during August 1996
[Concentrations are in micrograms per liter (µg/L); nd, none detected; reporting limit is 0.2 µg/L for all compounds; < 0.2, trace concentration detected]
Chemical compound
in units
Sampling site and date
Bedrock well Regolith wellSurface water
14FF08 08/15/96
14FF10 08/15/96
14FF16 08/13/96
14FF17 08/13/96
14FF18 08/15/96
14FF27 08/15/96
14FF39 08/15/96
14FF42 08/14/96
14FF36 08/16/96
14FF37 08/16/96
14FF38 08/16/96
City Lake 08/16/96
Chloroform, in µg/L
0.5 nd nd nd nd 0.2 nd nd nd nd nd nd
Tetrachloro- ethylene (PCE), in µg/L
1.3 0.6 0.3 nd nd 2.7 nd nd nd <0.2 1.3 nd
1,1-Dichloro-ethylene, in µg/L
nd nd nd nd nd nd nd nd nd <0.2 nd nd
1,1,1-Trichloro-ethane, in µg/L
nd nd nd nd nd nd nd nd nd 0.3 nd nd
Trichloro- ethylene (TCE), in µg/L
0.5 nd nd nd nd nd nd nd nd nd 0.2 nd
Cis-1,2-Dichloroethene, in µg/L
0.6 nd nd nd nd nd nd nd nd nd nd nd
Methyl-tert-butyl-ether (MTBE), in µg/L
nd 19 0.6 nd 26 nd 5.7 <0.2 nd nd nd nd
44 Geology and Ground-Water Resources of the Lawrenceville Area, Georgia

SUMMARY AND CONCLUSIONS
The exploration for ground-water resources is being undertaken by many local municipalities in the Atlanta Metropolitan area because of the continued rapid pace of population growth, and the corresponding increased demand for water supplies. The igneous and metamorphic fractured bedrock aquifers in this area of the Piedmont physiographic province are highly complex and often difficult to characterize. The application of effective methods of characterization is essential to the success of these ground-water exploration programs.
As part of an ongoing study conducted by the U.S. Geological Survey, in cooperation with the City of Lawrenceville, five major lithologic units were mapped in the Lawrenceville area at a scale of 1:24,000, as the basis of the regional hydrogeologic framework needed to apply field investigative techniques to characterize fractured crystalline-bedrock aquifers. These lithologic units are: granite gneiss, quartzite and aluminous schist, biotite gneiss, amphibolite, and button schist. These units generally are thin, a few hundred to a few thousand feet in outcrop width, and have low angles of dip (nearly 0 to 20 degrees). In many places, dip reversals occur over short distances inferring the presence of structural folding of the rocks. All of the units exhibit some shearing characteristics.
Of the five lithologic units mapped in the study area, the amphibolite unit has the most potential for the production of ground-water resources. From limited data available at four well sites (data collected through 1997), subsurface fractures appear to be more numerous in the amphibolite compared with other rock types. Historically, two wells at the Rhodes Jordan Wellfield and a well at the Maltbie Street site, were known to have possibly the highest sustained yields in the Piedmont physiographic province of northern Georgia. Sustained production at the Rhodes Jordan Wellfield during 1995–1997 averaged 230 to 250 gallons per minute. The Maltbie Street well was tested at 350 gallons per minute in 1995.
The apparent increased presence of fracturing in the amphibolite may be related to the location of that unit at the crest of the antiformal structure. Stress related to the folding may have enhanced fracturing potential of the amphibolite unit. Well-developed compositional layering also has created zones of weakness, vulnerable to both tectonic stress and weathering. With this compositional layering and a fracture network, subsequent unloading by erosion of broad valleys, could have resulted in “stress release” and opening of the fracture system. This envisioned “stress release” is comparable to the upward expansion of the rock as a result of the removal of overlying rocks in broad valleys (elastic rebound).
The composition of water collected from the bedrock wells, regolith wells, and City Lake is similar; calcium and bicarbonate are the dominant cation and anion, respectively. Concentrations of major ions generally are lower in water from the regolith wells and the lake than in water from the bedrock wells. High concentrations of iron (44 milligrams per liter) and sulfate (300 milligrams per liter) also were detected in samples from the bedrock wells. Volatile organic compounds were detected in most wells from water samples collected during October–November 1995 and August 1996.
Trace concentrations, generally less than 1 microgram per liter, of tetrachloroethylene, trichloroethylene, 1,1-dichloroethane, 1,1-dichloroethylene, trichlorofluoromethane, 1,1,1-trichloroethane, cis-1,2-dichloroethene, and chloroform were detected from bedrock wells located in urban areas. Elevated concentrations of one compound, methyl-tert-butyl-ether, commonly known as MTBE, were detected in wells at the Rhodes Jordan Wellfield. Detected concentrations of MTBE range from 0.6 to 12 micrograms per liter in October–November 1995, and from 0.6 to 26 micrograms per liter in August 1996. MTBE also was detected at a concentration of less than one microgram per liter in a sample from the Gwinnett County Airport well.
Analyses of continuous ground-water-level data suggest that the response of the aquifer (drawdown and recovery) is directly related to the volume of water removed and the overall stress on the ground-water system. If the daily pumping and recovery periods, as well as the pumping rate remain fairly constant, the aquifer is dewatered to a depth near a productive fracture, and the rate of drawdown gradually decreases. However, if the pumping period is extended on a daily basis (increased pumping hours), or by several days (assuming the pumping rate remains constant), a unique hydrologic condition of net recovery has been observed. The effects of pumpage, both during net drawdown and net recovery conditions, have been documented across surface-water drainage divides.
REFERENCES CITED
Atkins, R.L., and Higgins, M.W., 1980, Superimposed folding and its bearing on geologic history of the Atlanta, Georgia, area; Frey, R.W., ed., in Excursions in southeastern Geology: American Geological Institute, v. 1, p. 19–40.
Atkins, R.L., and Morris, L.J., 1982, Luxomni quadrangle, Georgia: Georgia Geologic Survey Open-File Geologic Map, scale 1:24,000.
Atlanta Environmental Management, 1995, Part B Permit application for post closure: Atlanta, Ga., revised May 24, 1995, 121 p.
Summary and Conclusions 45

Chapman, M.J., and Lane, J.W., Jr., 1996, Use of directional borehole radar and azimuthal square-array d.c. resistiv-ity methods to characterize a crystalline-bedrock aqui-fer, in Proceedings of the Symposium on the Application of Geophysics to Engineering and Environmental Problems, April 28–May 2, Keystone, Co., p. 833–842.
Chapman, M.J., and Peck, M.F., 1997, Ground-water resources of the upper Chattahoochee River basin in Georgia-Subarea 1 of the Apalachicola–Chattahoochee–Flint and Alabama-Coosa-Tallapoosa River basins: U.S. Geological Survey Open-File Report 96-363, 43 p.
Chapman, M.J., Hicks, D.W., Peck, M.F., and Tharpe, W.T., 1997, Characterization of a crystalline-rock aquifer near Lawrenceville, Georgia—Application of advances in borehole and surface geophysical methods, in Hatcher, K.J., ed., Proceedings of the Fifth Biennial Georgia Water Resources Conference, Athens, Ga., March 20–22, 1997: Athens, Ga., The University of Georgia, Institute of Natural Resources, Athens, Ga., p. 369–372.
Clark, W.Z., Jr., and Zisa, A.C., 1976, Physiographic map of Georgia: Georgia Geologic Survey State Map 4, 1 sheet, scale 1:2,000,000.
Cressler, C.W., Thurmond, C.J., and Hester, W.G., 1983, Ground water in the greater Atlanta region, Georgia: Georgia Geologic Survey Information Circular 63, 144 p.
Dooley, R.E., Lawrenceville, quadrangle, Georgia: Georgia Geologic Survey Open-File Geologic Map, unpublished, scale 1:24,000.
Heath, R.C., 1984, Ground-water regions of the United States: U.S. Geological Survey Water-Supply Paper 2242, 78 p.
Hem, J.D., 1989, Study and Interpretation of the chemical characteristics of natural water: U.S. Geological Survey Water-Supply Paper 2254, 3rd ed., 264 p.
Herrick, S.M., and LeGrand, H.E., 1949, Geology and ground-water resources of the Atlanta area, Georgia: Georgia Geologic Survey Bulletin 55, 124 p.
Higgins, M.W., Atkins, R.L., Crawford, T.J., Crawford, R.F., III, Brooks, Rebekah, and Cook, R.B., 1988, The structure, stratigraphy, tectonostratigraphy, and evolution of the southernmost part of the Appalachian orogen: U.S. Geological Survey Professional Paper 1475, 173 p.
Kemron Environmental Services, Inc., 1997a, Fifth quarterly monitoring report for the Circle M Food Mart #8, Lawrenceville, Gwinnett County, Georgia, Facility ID#0670010: Atlanta, Ga., unpublished, September 16, 1997, project no. 6316, 57 p.
———1997b, Fourth quarterly monitoring report for the Circle M Food Mart #8 site, Lawrenceville, Gwinnett County, Georgia, Facility ID#0670010: Atlanta, Ga., unpublished, July 23, 1997, Project no. 6316, 66 p.
———1997c, Third quarterly monitoring report for the Circle M Food Mart #8 site, Lawrenceville, Gwinnett County, Georgia, Facility ID#0670010: Atlanta, Ga., unpublished, April 24, 1997, Project no. 6316, 58 p.
———1997d, Second quarterly monitoring report for the Circle M Food Mart #8 site, Lawrenceville, Gwinnett County, Georgia, Facility ID#0670010: Atlanta, Ga., unpublished, February 6, 1997, Project no. 6316, 44 p.
Keys, W.S., 1990, Borehole geophysics applied to ground-water investigation: Techniques of Water-Resources Investigations of the United States Geological Survey, book 2, chapter E2, 150 p.
Lester, J.G., and Allen, A.T., Jr., 1950, Diabase of the Georgia Piedmont: Geological Society of America Bulletin 61, no. 11, p. 1217–1224.
Marella, R.L, Fanning, J.L., and Mooty, W.S., 1993, Estimated use of water in Apalachicola-Chattahoochee-Flint River basin during 1990, with State summaries from 1970 to 1990: U.S. Geological Survey Water-Resources Investigations Report 93-4084, 45 p.
McConnell, K.I., and Abrams, C.E., 1984, Geology of the Greater Atlanta region: Georgia Geologic Survey Bulletin 96, Georgia Department of Natural Resources, Environmental Protection Division, 127 p.
National Oceanic and Atmospheric Administration, 1996, Climatological data annual summary, Georgia: Asheville, N.C., v. 100, no. 13, 24 p.
Radzieta, David, 1993, The characterization of a layered saprolite/fractured bedrock aquifer, in Hatcher, K.J., ed., Proceedings of the Third Biennial Georgia Water Resources Conference, Athens, Ga., April 20–21, 1993: Athens, Ga., The University of Georgia, Institute of Natural Resources, p. 204–208.
Special Environmental Services, Inc., 1991, Hydrogeologic investigation for municipal water well data, City of Lawrenceville: Atlanta, Ga., unpublished, prepared for the City of Lawrenceville and Hayes, James, & Associates, January 1991, 50 p.
Tharpe, W. T., Peck, M.F., and Chapman, M.J., 1997, Analysis of ground-water withdrawals from a crystalline-rock aquifer near Lawrenceville, Georgia, in Hatcher, K.J., ed., Proceedings of the Fifth Biennial Georgia Water Resources Conference, Athens, Ga., March 20-22, 1997: Athens, Ga., The University of Georgia, Institute of Natural Resources, p. 488–491.
U.S. Bureau of the Census, 1991, Statistical abstract of the United States, 1991: Washington, D.C., U.S. Department of Commerce, 111th ed., 986 p.
Watts, Doyle, and Noltimier, H.C., 1974, Paleomagnetic study of diabase dikes of the Inner Piedmont of North Carolina and Georgia: American Geophysical Union Transactions, v. 55, no.7, p. 675.
46 Geology and Ground-Water Resources of the Lawrenceville Area, Georgia