Geochemical characterization and palynological studies...
19
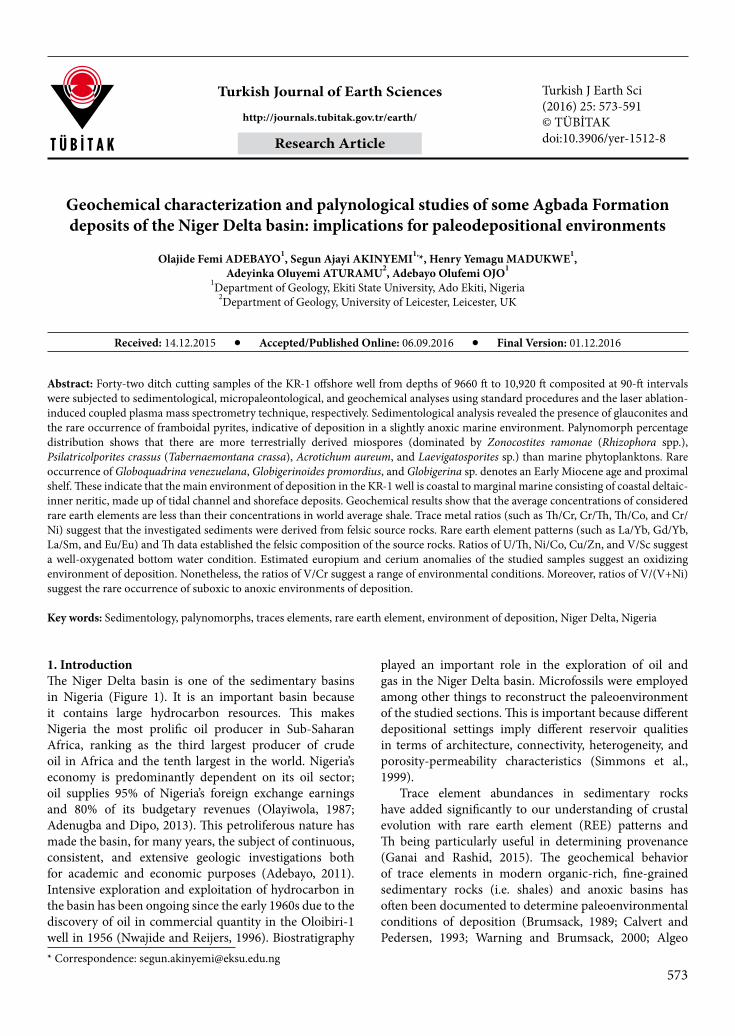
573 http://journals.tubitak.gov.tr/earth/ Turkish Journal of Earth Sciences Turkish J Earth Sci (2016) 25: 573-591 © TÜBİTAK doi:10.3906/yer-1512-8 Geochemical characterization and palynological studies of some Agbada Formation deposits of the Niger Delta basin: implications for paleodepositional environments Olajide Femi ADEBAYO 1 , Segun Ajayi AKINYEMI 1, *, Henry Yemagu MADUKWE 1 , Adeyinka Oluyemi ATURAMU 2 , Adebayo Olufemi OJO 1 1 Department of Geology, Ekiti State University, Ado Ekiti, Nigeria 2 Department of Geology, University of Leicester, Leicester, UK * Correspondence: [email protected] 1. Introduction e Niger Delta basin is one of the sedimentary basins in Nigeria (Figure 1). It is an important basin because it contains large hydrocarbon resources. is makes Nigeria the most prolific oil producer in Sub-Saharan Africa, ranking as the third largest producer of crude oil in Africa and the tenth largest in the world. Nigeria’s economy is predominantly dependent on its oil sector; oil supplies 95% of Nigeria’s foreign exchange earnings and 80% of its budgetary revenues (Olayiwola, 1987; Adenugba and Dipo, 2013). is petroliferous nature has made the basin, for many years, the subject of continuous, consistent, and extensive geologic investigations both for academic and economic purposes (Adebayo, 2011). Intensive exploration and exploitation of hydrocarbon in the basin has been ongoing since the early 1960s due to the discovery of oil in commercial quantity in the Oloibiri-1 well in 1956 (Nwajide and Reijers, 1996). Biostratigraphy played an important role in the exploration of oil and gas in the Niger Delta basin. Microfossils were employed among other things to reconstruct the paleoenvironment of the studied sections. is is important because different depositional settings imply different reservoir qualities in terms of architecture, connectivity, heterogeneity, and porosity-permeability characteristics (Simmons et al., 1999). Trace element abundances in sedimentary rocks have added significantly to our understanding of crustal evolution with rare earth element (REE) patterns and being particularly useful in determining provenance (Ganai and Rashid, 2015). e geochemical behavior of trace elements in modern organic-rich, fine-grained sedimentary rocks (i.e. shales) and anoxic basins has oſten been documented to determine paleoenvironmental conditions of deposition (Brumsack, 1989; Calvert and Pedersen, 1993; Warning and Brumsack, 2000; Algeo Abstract: Forty-two ditch cutting samples of the KR-1 offshore well from depths of 9660 ſt to 10,920 ſt composited at 90-ſt intervals were subjected to sedimentological, micropaleontological, and geochemical analyses using standard procedures and the laser ablation- induced coupled plasma mass spectrometry technique, respectively. Sedimentological analysis revealed the presence of glauconites and the rare occurrence of framboidal pyrites, indicative of deposition in a slightly anoxic marine environment. Palynomorph percentage distribution shows that there are more terrestrially derived miospores (dominated by Zonocostites ramonae (Rhizophora spp.), Psilatricolporites crassus (Tabernaemontana crassa), Acrotichum aureum, and Laevigatosporites sp.) than marine phytoplanktons. Rare occurrence of Globoquadrina venezuelana, Globigerinoides promordius, and Globigerina sp. denotes an Early Miocene age and proximal shelf. ese indicate that the main environment of deposition in the KR-1 well is coastal to marginal marine consisting of coastal deltaic- inner neritic, made up of tidal channel and shoreface deposits. Geochemical results show that the average concentrations of considered rare earth elements are less than their concentrations in world average shale. Trace metal ratios (such as /Cr, Cr/, /Co, and Cr/ Ni) suggest that the investigated sediments were derived from felsic source rocks. Rare earth element patterns (such as La/Yb, Gd/Yb, La/Sm, and Eu/Eu) and data established the felsic composition of the source rocks. Ratios of U/, Ni/Co, Cu/Zn, and V/Sc suggest a well-oxygenated bottom water condition. Estimated europium and cerium anomalies of the studied samples suggest an oxidizing environment of deposition. Nonetheless, the ratios of V/Cr suggest a range of environmental conditions. Moreover, ratios of V/(V+Ni) suggest the rare occurrence of suboxic to anoxic environments of deposition. Key words: Sedimentology, palynomorphs, traces elements, rare earth element, environment of deposition, Niger Delta, Nigeria Received: 14.12.2015 Accepted/Published Online: 06.09.2016 Final Version: 01.12.2016 Research Article
Transcript of Geochemical characterization and palynological studies...
573
httpjournalstubitakgovtrearth
Turkish Journal of Earth Sciences Turkish J Earth Sci(2016) 25 573-591copy TUumlBİTAKdoi103906yer-1512-8
Geochemical characterization and palynological studies of some Agbada Formation deposits of the Niger Delta basin implications for paleodepositional environments
Olajide Femi ADEBAYO1 Segun Ajayi AKINYEMI1 Henry Yemagu MADUKWE1Adeyinka Oluyemi ATURAMU2 Adebayo Olufemi OJO1
1Department of Geology Ekiti State University Ado Ekiti Nigeria2Department of Geology University of Leicester Leicester UK
Correspondence segunakinyemieksuedung
1 IntroductionThe Niger Delta basin is one of the sedimentary basins in Nigeria (Figure 1) It is an important basin because it contains large hydrocarbon resources This makes Nigeria the most prolific oil producer in Sub-Saharan Africa ranking as the third largest producer of crude oil in Africa and the tenth largest in the world Nigeriarsquos economy is predominantly dependent on its oil sector oil supplies 95 of Nigeriarsquos foreign exchange earnings and 80 of its budgetary revenues (Olayiwola 1987 Adenugba and Dipo 2013) This petroliferous nature has made the basin for many years the subject of continuous consistent and extensive geologic investigations both for academic and economic purposes (Adebayo 2011) Intensive exploration and exploitation of hydrocarbon in the basin has been ongoing since the early 1960s due to the discovery of oil in commercial quantity in the Oloibiri-1 well in 1956 (Nwajide and Reijers 1996) Biostratigraphy
played an important role in the exploration of oil and gas in the Niger Delta basin Microfossils were employed among other things to reconstruct the paleoenvironment of the studied sections This is important because different depositional settings imply different reservoir qualities in terms of architecture connectivity heterogeneity and porosity-permeability characteristics (Simmons et al 1999)
Trace element abundances in sedimentary rocks have added significantly to our understanding of crustal evolution with rare earth element (REE) patterns and Th being particularly useful in determining provenance (Ganai and Rashid 2015) The geochemical behavior of trace elements in modern organic-rich fine-grained sedimentary rocks (ie shales) and anoxic basins has often been documented to determine paleoenvironmental conditions of deposition (Brumsack 1989 Calvert and Pedersen 1993 Warning and Brumsack 2000 Algeo
Abstract Forty-two ditch cutting samples of the KR-1 offshore well from depths of 9660 ft to 10920 ft composited at 90-ft intervals were subjected to sedimentological micropaleontological and geochemical analyses using standard procedures and the laser ablation-induced coupled plasma mass spectrometry technique respectively Sedimentological analysis revealed the presence of glauconites and the rare occurrence of framboidal pyrites indicative of deposition in a slightly anoxic marine environment Palynomorph percentage distribution shows that there are more terrestrially derived miospores (dominated by Zonocostites ramonae (Rhizophora spp) Psilatricolporites crassus (Tabernaemontana crassa) Acrotichum aureum and Laevigatosporites sp) than marine phytoplanktons Rare occurrence of Globoquadrina venezuelana Globigerinoides promordius and Globigerina sp denotes an Early Miocene age and proximal shelf These indicate that the main environment of deposition in the KR-1 well is coastal to marginal marine consisting of coastal deltaic-inner neritic made up of tidal channel and shoreface deposits Geochemical results show that the average concentrations of considered rare earth elements are less than their concentrations in world average shale Trace metal ratios (such as ThCr CrTh ThCo and CrNi) suggest that the investigated sediments were derived from felsic source rocks Rare earth element patterns (such as LaYb GdYb LaSm and EuEu) and Th data established the felsic composition of the source rocks Ratios of UTh NiCo CuZn and VSc suggest a well-oxygenated bottom water condition Estimated europium and cerium anomalies of the studied samples suggest an oxidizing environment of deposition Nonetheless the ratios of VCr suggest a range of environmental conditions Moreover ratios of V(V+Ni) suggest the rare occurrence of suboxic to anoxic environments of deposition
Key words Sedimentology palynomorphs traces elements rare earth element environment of deposition Niger Delta Nigeria
Received 14122015 AcceptedPublished Online 06092016 Final Version 01122016
Research Article
574
ADEBAYO et al Turkish J Earth Sci
and Maynard 2004) Redox-sensitive trace element (TE) concentrations or ratios are among the main extensively used indicators of redox conditions in modern and ancient sedimentary deposits (eg Calvert and Pedersen 1993 Jones and Manning 1994 Crusius et al 1996 Dean et al 1997 1999 Yarincik et al 2000 Morford et al 2001 Pailler et al 2002 Algeo and Maynard 2004) Enrichments of redox-sensitive elements replicate the depositional environment of ancient organic carbon-rich sediments and sedimentary rocks as well and can consequently be used to reveal the likely paleodepositional conditions leading to their formation (Brumsack 1980 1986 Hatch and Leventhal 1992 Piper 1994) The degree of enrichmentdepletion is usually based on the elementAl ratio in a sample calculated relative to the respective elementAl ratio of a common standard material eg average marine shale (Turekian and Wedepohl 1961) The purpose of this paper is to interpret the paleoenvironmental changes during the deposition of the sediments in the studied section of the Niger Delta basin To achieve the objective a multidisciplinary approach combining sedimentological features and palynological and geochemical analyses was employed
2 The geologic setting of the basinThe present-day Niger Delta Complex is situated on the continental margin of the Gulf of Guinea in the southern part of Nigeria It lies between longitudes 4 degE and 88 degE and latitudes 3 degN and 6 degN (Figure 1)The onshore portion of the basin is delineated by the geology of southern Nigeria and southwestern Cameroon It is bounded in the north by outcrops of the Anambra Basin and the Abakaliki Anticlinorium and delimited in the west by the Benin Flank a northeast-southwest trending hinge line south of the West African basement massif The Calabar Flank a hinge line bordering the Oban massif defines the northeastern boundary The offshore boundary of the basin is defined by the Cameroon volcanic line to the east and the eastern boundary of the Dahomey Basin (the eastern-most West African transform-fault passive margin) to the west The evolution of the delta is controlled by pre- and synsedimentary tectonics as described by Evamy et al (1978) Ejedawe (1981) Knox and Omatsola (1987) and Stacher (1995) It is a large arcuate delta covering an area of about 300000 km2 (Kulke 1995) with a sediment volume of 500000 km3 (Hospers 1965) and a sedimentary thickness of over 10 km in the basin depocenter (Kaplan et al 1994)
Figure 1 Geological map of the Niger Delta (Weber and Daukoru 1975)
575
ADEBAYO et al Turkish J Earth Sci
The evolution of the basin has been linked to that of a larger sedimentary complex called the Benue-Abakaliki Trough The trough a NE-SW trending aborted rift basin with folded sedimentary fill runs obliquely across Nigeria (Figure 1) The Niger Delta basin is actually the youngest and the southernmost subbasin in the trough (Murat 1972 Reijers et al 1997)
The evolution of the trough which began in the Cretaceous during the opening of the South Atlantic led to the separation of the African and South American plates The tectonic framework of the continental margin along the western coast of Africa is controlled by Cretaceous fracture zones expressed as trenches and ridges in the deep Atlantic The fracture zone ridges subdivided the margin into individual basins and in Nigeria form the boundary faults of the Cretaceous Benue-Abakaliki Trough which cuts far into the West African Shield The rifting greatly diminished in the Late Cretaceous in the Niger Delta region (Ako et al 2004) A well section through the Niger Delta basin generally displays three vertical lithostratigraphic subdivisions namely a prodelta lithofacies a delta front lithofacies and upper delta top facies (Nwajide and Reijers 1996) These lithostratigraphic units correspond respectively to the Akata Formation (Paleocene-Recent) Agbada Formation (Eocene-Recent) and Benin Formation (Oligocene-Recent) (Short and Stauble 1967)
3 Materials and methods Forty-two ditch cutting samples of the KR-1 offshore well (Figure 2) were taken from depths of 9660 to 10920 ft at 90-ft interval (Figure 3) These were processed and analyzed for sedimentological palynological micropaleontological and geochemical studies31 Sedimentological analysisThe samples were subjected to sedimentological analysis using visual inspection and a binocular microscope Physical characteristics such as color texture hardness fissility and rock types were noted Dilute HCl (10) was added to identify the calcareous samples Fossil contents presence of accessory minerals and postdepositional effects such as ferruginization were determined32 Palynological preparationTen grams of each dry sample was crushed into small fractions between 025 mm and 25 mm Standard palynological processing procedures were employed (Faegri and Iversen 1989 Wood et al 1996) These included the digestion of the mineral matrix using dilute HCl for carbonates and concentrated HF for silicates Removal of the fluoride gel (formed during the HF treatment) was done using hot concentrated HCl and wet sieving the residue using a 10-microm polypropylene Estal Mono sieve The residues were oxidized and inorganic
materials were separated from the organic ones using ZnCl2 of specific gravity 20 Slides were mounted using Norland adhesive mounting medium and dried under UV light One slide per sample was analyzed under the optical microscope and the photomicrographs of well-preserved palynomorph specimens were taken using an Olympus CH30 transmitted light microscope (Model CH30RF200) with an attached camera Palynomorph identifications were done using the works of Germeraad et al (1968) and Evamy et al (1978) (ie Shell Oil Company Scheme 1978) The data were plotted using StrataBugs software at 15000 scale with depth on the y-axis and the identified taxa on the x-axis33 Foraminiferal preparationTwenty-five grams of each sample was processed for their foraminiferal content using the standard preparation techniques The weighed samples were soaked in kerosene and left overnight to disaggregate followed by soaking in detergent solution overnight The disaggregated samples were then washed-sieved under running tap water over a 63-microm mesh sieve The washed residues were then dried over a hot electric plate and sieved (when cooled) into three main size fractions namely coarse medium and fine (250- 150- and 63-microm meshes) Each fraction was examined under a binocular microscope All the foraminifera ostracodes shell fragments and other microfossils observed were picked with the aid of a picking needle and counted Foraminifera identification was made to genus and species levels where possible using the taxonomic scheme of Loeblich and Tappan (1964) and other relevant foraminiferal literature such as the works of Fayose (1970) Postuma (1971) Petters (1979a 1979b 1982) Murray (1991) and Okosun and Liebau (1999) 34 XRF and LA-ICPMS analysesThe pulverized ditch cutting samples were analyzed with X-ray fluorescence (XRF) and laser ablation-induced coupled plasma mass spectrometry (LA-ICPMS) techniques The elemental data for this work were acquired using XRF and LA-ICPMS analyses
The analytical procedures were as followsPulverized ditch cutting samples were analyzed for
major elements using an Axios instrument (PANalytical) with a 24-kW Rh X-ray tube The same set of samples was further analyzed for trace elements using LA-ICPMS instrumental analysis LA-ICPMS is a powerful and sensitive analytical technique for multielement analysis The laser was used to vaporize the surface of the solid sample while the vapor and any particles were then transported by the carrier gas flow to the ICP-MS The detailed procedures for sample preparation for both analytical techniques are reported below
576
ADEBAYO et al Turkish J Earth Sci
341 Fusion bead method for major element analysisbull Weigh 10000 plusmn 00009 g of milled samplebull Place in oven at 110 degC for 1 h to determine H2O+bull Place in oven at 1000 degC for 1 h to determine LOIbull Add 100000 plusmn 00009 g of Claisse flux and fuse in M4 Claissefluxer for 23 minbull Add 02 g of NaCO3 to the mix and preoxidize the sample+flux+NaCO3 at 700 degC before fusionbull Flux type Ultrapure Fused Anhydrous Li-Tetraborate-Li-Metaborate flux (6667 Li2B4O7 + 3283 LiBO2) and releasing agent Li-iodide (05 LiI)342 Pressed pellet method for trace element analysisbull Weigh 8 plusmn 005 g of milled powderbull Mix thoroughly with 3 drops of Mowiol wax binderbull Press pellet with pill press to pressure of 15 tbull Dry in oven at 100 degC for 30 min before analyzing
These analytical methods yielded data for 11 major elements reported as oxide percent by weight [SiO2 TiO2 Al2O3 Fe2O3 MgO MnO CaO Na2O K2O Cr2O3 and
P2O5] and 21 trace elements [Ni Cu Zn Ga Rb Sr Y Zr Nb Co V Pb Th U Ti Cr Ba La Ce Nd and P] reported as mgkg (ppm)
4 Results and discussion41 Sedimentological analysisLithologically the sequence is characterized by the alternation of shale and sandy shale facies (Figure 3) The shales are light gray fissile effervescent and slightly ferruginized while the sandy shales are light gray and ferruginous These sediments contain muscovite flakes There are few to common occurrences of glauconite while pyrite and shell fragments are rare to few Quartz grains within the sediments vary from fine to medium subangular to well-rounded and moderately sorted42 Palynological assemblagePalynomorph preservation in the analyzed sediments is fairly good with high concentration and diversity (see Figures 4 and 5) All the samples yielded common to
Figure 2 Simplified geologic map of Nigeria and location of KR-1 well (Adebayo et al 2015b)
577
ADEBAYO et al Turkish J Earth Sci
abundant assemblages that range from moderate to well preserved Dinoflagellate cysts are sporadically present and range in abundance from very rare to few and do not occur in all the samples
There are 256 pollen grains 220 spores 231 Botryococcus and Pediastrum 9 dinoflagellate cysts and 3 microforaminiferal wall linings making a total of 719 recovered palynomorphs The assemblage is dominated by angiospermous pollen with an equally significant occurrence of pteridophyte spores The angiosperms consist mainly of Tricolporites Tetraporites and Monoporites while Laevigatosporites Verrucatosporites and Polypodiaceoisporites are the dominant pteridophyte spores (Figures 4 and 5) The biostratigraphically
important palynomorphs recovered from the well are Zonocostites ramonae (Rhisophora sp) Psilatricolporites crassus (Tabermaemontana sp) Pachydermites diederixi (Symphonia globulifera) Retitricolporites irregularis (Amanoa sp) Praedapollis africanus and Verrucatosporites usmensis (Polypodium sp) (Figures 4 and 5) The palynomorph assemblage as a whole shows strong similarities with those previously identified in the San Jorge Gulf Basin southern Patagonia Argentina (Palamarczuk and Barreda 1998) and especially those from the Mazarredo Subbasin (Barreda and Palamarczuk 2000) dated as Early Miocene and Latest Oligocene-Early Miocene respectively The KR-1 well assemblage is also closely comparable to the Early Miocene interval
Figure 3 The lithology of the KR-1 well (after Adebayo et al 2015b)
578
ADEBAYO et al Turkish J Earth Sci
of coeval tropical-subtropical South American and Asian palynological assemblages (Graham 1977 Kogbe and Sowunmi 1980 Demchuk and Moore 1993) This palynofloral association the acme (or highest appearance datum HAD) of some of the few recovered dinoflagellate cysts (Lingulodinium machaerophorum Polysphaeridium zoharyi Hystrichokopoma rigaudiase) among the taxa found in the rocks of Miocene age (El-Beialy et al 2005) and the absence of Eocene and Oligocene forms such as Crassoretitriletes vanraadshooveni Bombacacidites sp
Operculodinium xanthium and Thalassiphora pelagica support the assignment of Early Miocene age43 Paleoenvironment of depositionThe reconstruction of the depositional environment of the studied well is based on some parameters such as palynomorph assemblage abundance diversity and frequency distribution as well as the relative abundance of Zonocostites ramonae to Monoporites annulatus freshwater algae organic wall microplanktons lithologic characters and accessory mineral contents Environmentally
Figure 4 Chart of recovered (a) palynomorph and (b) foraminiferal assemblages from the investigated intervals from KR-1 well Niger Delta (Adebayo et al 2015b)
D
ept
h (
ft)
9750
10000
10250
10500
10750
TD
Gamma Log( A P I )0 1 5 0
Lith
olo
gy
Deep Induction( o h m m m )0 2 2 00 0
Chr
onos
trat
igra
phy
9 6 6 0 0
1 0 9 2 0
Ear
ly M
ioce
ne
Per
iod
Epo
ch G
ER
ME
RA
AD
et
al
(196
8)
9 6 6 0 0
1 09 2 0
Ech
itric
olp
orite
s s
pino
sus
zon
eZo
ne
Eva
my
et a
l (
197
8)
9 6 6 0 0
1 0 9 2 0
P60
0Z
one
9 6 6 0 0
1 0 9 2 0
P62
0S
ub Z
one
A b s o l u t e a b u n d a n c e ( 5 m m = 3 c o u n t s )
Pra
eda
polli
s s
ppC
har
red
gram
inee
cu
tticl
eP
rieda
polli
s af
rica
nus
Psi
latri
colp
orite
s c
rass
us
Sap
ota
ceae
Pa
chyd
erm
ites
die
derix
iR
etit
ricol
por
ites
irre
gula
risS
tere
ispo
rite
s sp
pP
odoc
arpi
dite
s sp
p
Pro
xape
rtite
s c
ursu
sP
olle
n in
dete
rmin
ate
Pol
ypod
iace
oisp
orite
s s
pp
Psi
latr
icol
por
ites
spp
1
1 1 1 1
1 1 1
1 5 1
5 1
1
1 1 1 1
1 1
3 1
2 3 1
3 1 1
1 1 1
2 1 3
PollenA b s o l u t e a b u n d a n c e ( 5 m m = 5 c o u n t s )
Acr
osti
chum
aur
eum
Lae
viga
tosp
orit
es s
pp
Ver
ruc
atos
por
ites
spp
fun
gal s
por
eV
erru
cato
spor
ites
us
men
sis
Lyco
podi
um
sp
Mag
nas
tria
tites
how
ard
ii
2 4 1
2 0 8 2 2 2
2 7 3 3
3 3 1 7 7 1
7 2
6 1 1
9 5 1 1
6 1
5 2 2
1 1
2 1 3 4 1
1 2
3 2
7 2 1
Spore1
Bot
ryo
cocc
us
brau
nii
Pe
dias
trum
sp
2 3
1 8 2
2 6 1
6 1 7
7 2
1 3
2 2
1 6 1
1 2 6
2 1
6
2
3 2
ALBO2
Spi
nife
rites
sp
Tub
erc
ulod
iniu
m v
anca
mpo
ae
Hys
trich
okol
pom
a rig
aud
iae
Po
lysp
haer
idiu
m z
oha
ryi
Spi
nife
rites
ram
osus
Ling
ulo
din
ium
mac
hae
roph
oru
m
1 1
1
1
1 2 1
1
DC3
Mic
rofo
ram
inife
ra w
all l
inin
g
1
2
MW4
Zo
noco
sta
tite
s ra
mo
nae
1 5
1 0
1 0
1 5
8
1 0
2 0
9
2 0
1 0
1 0
5
2 0
4 0
ZO1
Mon
opo
rites
ann
ulat
us
2
6
3
3
1
1
MA
Div
ers
ity
Pol
len
5
1
4
3
3
2
1
4
2
2
3
3
3
3
Pollen
Tot
al c
ount
Pol
len
7
1
4
3
7
6
1
4
2
4
6
5
3
6
Pollen
Div
ersi
ty S
por
e
4
3
5
3
4
2
3
4
2
3
2
4
2
2
3
Spore
To
tal c
ount
Spo
re
3 0
7
3 4
3 3
5 8
9
8
1 6
7
9
2
2 0
3
5
1 0
Spore
Div
ersi
ty Z
ono
cos
tites
Ram
ona
e
2
1
1
1
1
1
1
1
1
1
1
1
1
1
1
ZO
Tot
al c
oun
t Z
onoc
ostit
es R
amon
ae
1 2
1 5
1 0
1 0
1 5
8
1 0
2 0
9
2 0
1 0
1 0
5
2 0
4 0
ZO
Div
ersi
ty M
onop
orit
es A
nnu
latu
s
2
1
1
1
1
1
1
MA
Tot
al c
ount
Mo
nopo
rite
s A
nnul
atu
s
5
2
6
3
3
1
1
MA
Div
ers
ity
Din
ofla
gella
te C
yst
s
1
2
1
1
3
1
DC
Tot
al c
oun
t D
inof
lage
llate
Cys
ts
3
2
1
1
4
1
DC
Div
ersi
ty B
otry
ococ
cus
And
Pe
dias
trum
2
1
2
2
2
2
1
1
2
2
2
1
1
2
ALBO
Tot
al c
oun
t B
otry
ococ
cus
And
Ped
ias
trum
5 0
2 3
2 0
2 7
6 8
9
1 3
2 2
1 7
1 8
3
6
2
5
ALBO
Sam
ple
sS
am
ple
de
pth
is
BA
SE
of
de
pth
ra
ng
e
9 7 5 0
9 8 4 0
9 9 3 0
1 0 0 2 0
1 0 1 1 0
1 0 2 0 0
1 0 2 9 0
1 0 3 8 0
1 0 4 7 0
1 0 5 6 0
1 0 6 5 0
1 0 7 4 0
1 0 8 3 0
1 0 9 2 0
BIODATUMS
De
pth
(ft
)
9750
10000
10250
10500
10750
TD
Well Name KR-1Well Code KR-1-PInterval 9660 - 10920 PALYNOMORPH DISTRIBUTION CHART OF KR-1Scale 15000
KR-1Chart date 18 August 2014 DEPT OF GEOLOGY EKITI STATE UNIVERSITY ADO EKITI NIGERIA
APPENDIX-3
CRYSTAL AGE LIMITEDLAGOS
Pr ojectChar t
DEM O KR- 1- P
Base Lithology
s halem uds tone
s andy m uds tone
Lithology Qualifiers
Lithology Accessories
Lithology StringersIGD Boundary Key
P o s s i b l e
P r o b a b l eC o n f i d e n t
U n c o n f o r m a b l e
U n c o n f o r m a b l e
f F a u l t
f F a u l t
Text Keys1 A b s o l u t e a b u n d a n c e ( 5 m m = 4 c o u n t s )
2 A b s o l u t e a b u n d a n c e ( 5 m m = 3 c o u n t s )3 A b s o l u t e a b u n d a n c e ( 5 m m = 2 c o u n t s )
4 A b s o l u t e a b u n d a n c e ( 5 m m = 1 0 c o u n t s )
Well Name KR-1Well Code KR-1-M
Interval 9660 - 10920 FORAM INIFERAL DISTRIBUTION CHART OF WELL KR-1Scale 15000
KR-1Chart date 20 February 2006 DEPT OF GEOLOGY EKITI STATE UNIVERSITY ADO - EKITI NIGERIA
APPENDIX-2
CRYSTAL AGE LIMITEDLAGOS
Pr ojectChar t
DEM O KR- 1- M
De
pth
(ft
)
9750
10000
10250
10500
10750
TD
Gamma Log( API )0 150
Lit
ho
log
y
Deep Induction( ohm m m )0 2 2000
Ch
ron
os
tra
tig
rap
hy
96500
10920
Ear
ly M
iocen
eP
eri
od
Ep
oc
h
Pla
nk
tic
Fo
ram
inif
era
Zo
ne
N5
amp Y
oung
er
Not
Yo
unge
rth
an N
5Z
on
e
Samples
Sam
ple
dep
th i
s B
AS
E o
f d
epth
ran
ge
9750
9840
9930
10020
10110
10200
10290
10380
10470
10560
10650
10740
10830
10920
To
tal c
ou
nt
Fo
ram
inife
ra P
lan
kto
nic
3
1
2
FOP
Di
ve
rsity
Fo
ram
inife
ra P
lan
kto
nic
5
1
2
FOP1
Pla
nk
tics
ind
ete
rmin
ate
Glo
big
erin
a c
ipe
roe
ns
is a
ng
us
tium
bili
ca
taG
lob
ige
rino
ide
s p
rae
bu
lloid
es
FOP
To
tal c
ou
nt
Fo
ram
inife
ra C
alc
are
ou
s
200
7
24
1
117
175
25
FOBC
Di
ve
rsity
Fo
ram
inife
ra C
alc
are
ou
s
15
4
9
1
14
11
6
FOBCSem i- quant it at ive ( Def ault Abundance Schem e)
Ca
nc
ris a
uric
ulu
sE
po
nid
es
sp
p
Ho
pk
ins
ina
bo
no
ni
en
sis
Le
ntic
ulin
a
ino
rna
taC
ibic
ido
ide
s u
ng
eria
nu
sF
lo
rilu
s
atla
nti
cu
s
Flo
rilu
s b
ou
ea
nu
mF
lor
ilus
sp
p
Le
ntic
ul
ina
gra
nd
is
No
nio
ne
lla
au
risU
vi
ge
rina
su
bp
ere
grin
aF
lo
rilu
s
ex
grc
os
tife
rum
Am
mo
nia
be
cc
ari
iE
pi
sto
min
ella
vitr
ea
Ep
on
ide
s c
f i
ojim
ae
ns
is
Fu
rse
nk
oin
a
pu
nc
tata
Ha
nz
aw
ai
a c
on
ce
ntr
ica
Po
roe
po
nid
es
la
tera
lisQ
uin
qu
elo
cu
lina
lam
arc
kia
na
Bo
livin
a s
pp
B
ulim
ine
lla a
ff s
ub
fu
sifo
rmis
Ca
lca
re
ou
s i
nd
ete
rmin
at
e
Briz
alin
a m
an
do
rov
ee
ns
isV
alv
ulin
eria
sp
p
Fora minife ra Calc areous
To
tal c
ou
nt
Fo
ram
inife
ra A
gg
lu
tina
ting
3
1
4
1
FOBA
Di
ve
rsity
Fo
ram
inife
ra A
gg
lutin
atin
g
1
1
2
1
FOBA1
Sh
ell
fra
gm
en
tsS
po
ng
es
Os
tra
co
d
Sc
ap
ho
po
da
Ga
st
rop
od
M M
To
tal c
ou
nt
Mic
rop
ala
eo
nto
log
y
150
9
26
1
1
121
3
3
180
30
M icro
Div
ers
ity
Mic
rop
ala
eo
nto
log
y
15
6
11
1
1
18
2
1
14
10
M icro PalaeoenvironmentPalaeoenvironment
Co
as
ta
l De
tlta
ic
Inn
er N
eri
tic
Mid
dle
N
erit
ic
Presence of Globigerinaciperoensis angustiumbilicata
Bioevents
De
pth
(ft
)
9750
10000
10250
10500
10750
TD
Base Lithologys halem uds tone
s andy m uds tone
Lith ology Stringer sIGD Boundary Key
PossiblePr obableConf ident
Unconf or m able
Uncon f or m able
f Fault
f Fault
Defa ult Abu ndanc e Sche mePr esent ( 1 )
Rar e ( 2 )
Com m on ( 5 )Abundant ( 15 )
Super Abundant ( 50 )+ Pr esent out side count
Text Keys1 Sem i- quant it at ive ( Def ault Abundance Schem e)
a
b
579
ADEBAYO et al Turkish J Earth Sci
important marker species such as Zonocostites ramonae (mangrove pollen) Monoporites annulatus (Poaceae pollen suggesting open vegetation found in coastal Savannah) Magnastriatites howardi (a small aquatic fern of alluvial plain and coastal swamps) Pachydermites diederixi (an angiosperm of coastal swamps) foraminiferal wall linings and dinocysts are recovered Lithologically glauconite and pyrite are the most important accessory minerals in the studied well that can be used for environmental deductions Glauconite forms only as an authigenic mineral during the early stage of the diagenesis of marine sediments It is extremely susceptible to subaerial weathering and is not known as a reworked second cycle detrital mineral (Selley 1976) The presence of glauconite in the sandy shales therefore indicates a marine origin On the other hand rare occurrence of pyrite in the shale bodies probably suggests a reducing condition during deposition
The studied sequence can be categorized into three sections based on significant changes in the occurrence of the recovered taxa (Figure 4) The lowermost section which lies between depths of 10920 and 10560 ft constituted a paleoecological zone It is characterized by the appreciable occurrence of organic wall microplanktons such as foraminiferal wall linings and
dinocysts (Palaeocystodinum spp) uphole decrease in the population of Monoporites annulatus rare occurrence of Botryococcus braunii and the paucity of fresh water forms represented by Pediastrum (Figures 4 and 5) This section is assigned to a marginal marine environment (Sarjeant 1974 Durugbo 2013) The depth between 10560 and 9930 ft belongs to a continental-mangrove environment based on the dominance of terrestrially derived taxa (Psiltricolporites crassus and Pachydermites diederixi) the acme of Zonocostites ramonae and the absence or rarity of microplanktons The topmost section which lies between 9930 and 9750 ft is a mixed environment that ranges from back-mangrove to brackish water swamp to marshes Though this section of the well is dominated by Botryococcus braunii and Zonocostites ramonae the significant presence of Psilatricolporites crassus and Acrotichum aureum (similar to Deltoidospora adriennis) (Figures 4 and 5) and the occurrence of microplanktons enable the suggestion of back-mangrove-brackish water swamp-marshes (Tomlinson 1986 Thanikaimoni 1987) 44 Trace elementAl ratios and enrichmentsThe enrichment factor (EF) for an individual element is equal to (elementAl)sample (elementAl) shale where the
Figure 5 Plates of recovered palynomorphs from the investigated intervals from the KR-1 well (1000times) 1 Laevigatosporites sp 2 Botryococcus braunii Kuumltzing 1849 3 Pachydermitesdiederixi Germeraad Hopping amp Muller 1968 4 Verrucatosporites sp 5 Palaeocystodinum sp 6 Monoporites annulatus van der Hammen 1954 7 Sapotaceae 8 Psilatricolporites crassus van der Hammen amp Wijmstra 1964 9 Retitricolporites irregularis van der Hammen amp Wijmstra 1964 10 charred Gramineae 11 microforaminiferal wall lining
580
ADEBAYO et al Turkish J Earth Sci
ratio in the numerator is that for the shale in question and the ratio in the denominator is that for a ldquotypicalrdquo shale (using data from Wedepohl 1971 1991) Any relative enrichment is then expressed by EF gt 1 whereas depletion elements have EF lt 1 This approach has been used by various authors to evaluate trace-element enrichments in modern and ancient sediments (eg Calvert and Pedersen 1993 Arnaboldi and Meyers 2003 Rimmer 2004 Brumsack 2006) Generally comparisons of VAl ratios in the Agbada Formation samples with world average shale (Wedepohl 1971) show high enrichment factors (EFV = 574ndash115) at some depth intervals such as 9660ndash9750 ft 9750ndash9840 ft 9840ndash9930 ft and 9930ndash10020 ft (Table 1) In contrast other investigated intervals were marked by low enrichment factors (EFV = 040ndash005) Compared with average shale MoAl ratios in the studied Agbada Formation samples show high enrichment factors (EFMo = 11545ndash556) in all the investigated depth intervals The observed variability in MoAl and VAl ratios in the studied Agbada Formation samples are indicative of a mixed environment of deposition (ie paralic setting) Compared with world average shale NiAl ratios in the Agbada Formation samples show high enrichment factors (EFNi = 521ndash121) at 9660ndash9750 ft 9750ndash9840 ft 9840ndash9930 ft and 9930ndash10020 ft depth intervals (Table 1) Alternatively other investigated depth intervals show low enrichment factors (EFNi = 081ndash027) In comparison with the world average shale CoAl ratios in the studied samples show high enrichment factors (EFCo = 1456ndash164) Variability in the enrichment of NiAl and CoAl ratios in the Agbada Formation samples indicate a mixed environment of deposition UAl ratios compared with average shale show high enrichment factors (EFU = 528ndash111) in samples taken at depth intervals such as 9660ndash9750 ft 9750ndash9840 ft 9840ndash9930 ft 9930ndash10020 ft 10650ndash10740 ft 10740ndash10830 ft and 10830ndash10920 ft (Table 1) Conversely other investigated depth intervals show low enrichment factors (EFU = 082ndash020) Compared with average shale CrAl ratios show high enrichment factors (EFCr = 1216ndash052) with the exception of the sample taken at the depth interval of 10020-10110 ft Lower UAl and CrAl ratios imply oxic bottom water conditions during deposition Compared with world average shale SrAl ratios in the Agbada Formation samples show high enrichment factors (EFSr = 460ndash101) at 10650ndash10740 ft 10740ndash10830 ft 10830ndash10920 ft 9840ndash9930 ft and 9930ndash10020 ft depth intervals Conversely low enrichment factors (EFSr = 099ndash019) were observed in other investigated depth intervals BaAl ratios in the studied samples compared with world average shale show high enrichment factors (EFBa = 5471ndash131) in all the investigated depth intervals Furthermore a relatively high enrichment of BaAl and SrAl ratios suggest well-oxygenated bottom water conditions during
deposition The CuAl ratios in Agbada Formation samples compared with world average shale show high enrichment factors (EFCu = 697ndash164) at 10380ndash10470 ft 10650ndash10740 ft 10740ndash10380 ft 10380ndash10920 ft 9660ndash9750 ft 9750ndash9840 ft 9840ndash9930 ft and 9930ndash10020 ft depth intervals Other investigated depth intervals show low enrichment factors (EFCu = 095ndash038) ZnAl ratios in the studied samples compared with world average shale show high enrichment factors (EFZn = 1292ndash079) with the exception of the sample taken at the 10020ndash10110 ft depth interval Compared with world average shale PbAl ratios for all samples show high enrichment factors (EFPb = 1835ndash080) with the exception of samples taken at 10020ndash10110 ft and 10200ndash10290 ft depth intervals
Going by the world average shale standard RbAl ratios show evidence of low enrichment factors (EFRb = 334ndash010) with the exception of the sample taken at the 9660ndash9750 ft depth interval Similarly compared with world average shale the YAl ratios in Agbada Formation samples show low enrichment factors (EFY = 438ndash104) Alternatively low enrichment factors (EFY = 098ndash009) were obtained in samples taken at 9660ndash9750 ft 9840ndash9930 ft 9930ndash10020 ft 10650ndash10740 ft and 10740ndash10830 ft depth intervals ZrAl ratios in Agbada Formation samples compared with world average shale show high enrichment factors (EFZr = 1142ndash092) with the exception of the sample taken at the 10020ndash10110 ft depth interval The studied Agbada Formation samples exhibit different degrees of trace-element enrichment with the approximate order of enrichment relative to world average shale as follows Mo gt Ba gt Pb gt Cr gt Co gt Zn gt Zr gt Cu gt V gt U gt Ni gt Sr gt Rb45 Provenance and paleoredox conditionsArmstrong-Altrin et al (2004) revealed that low contents of Cr imply a felsic provenance and high levels of Cr and Ni are essentially found in sediments derived from ultramafic rocks Nickel concentrations are lower in the Agbada Formation sediments compared with world average shale (WSA) (Table 2) but chromium shows higher contents Accordingly the low CrNi ratios in Agbada Formation samples are between 132 and 1093 This indicates that felsic components were the major components among the basement complex source rocks Some authors showed that ratios such as LaSc ThSc ThCo and ThCr are significantly different in felsic and basic rocks and may possibly allow constraints on the average provenance composition (Wronkiewicz and Condie 1990 Cullers 1994 1995 2000 Cox et al 1995 Cullers and Podkovyrov 2000 Nagarajan et al 2007) The ratios of ThCr (~003ndash009 average = ~005) CrTh (~1070ndash3064 average = ~2037) ThCo (~001ndash048 average = ~025) and CrNi (~132ndash1093 average = ~513) (Table 3) imply that the Agbada Formation sediments recovered from the KR-1 well were derived from felsic source
581
ADEBAYO et al Turkish J Earth Sci
Table 1 Trace element ratios and enrichments in the Agbada Formation Sediments compared to world average shale (WSA) (Wedepohl 1971)
Element WSA 9660ndash9750 ft
9750ndash9840 ft
9840ndash9930 ft
9930ndash10020 ft
10020ndash10110 ft
10110ndash10200 ft
Ni (ppm) 68 4625 3292 3060 3628 1817 2377(NiAl)104 77 4015 973 1089 999 204 285EF 521 126 141 130 027 037Co (ppm) 19 3522 12582 5160 5342 14973 10440(CoAl)104 21 3057 3717 1836 1471 1685 1252EF 1456 1770 874 701 802 596Cu (ppm) 45 4097 3268 2353 3758 1707 2929(CuAl)104 51 3556 965 837 1035 192 351EF 697 189 164 203 038 069Zn (ppm) 95 16373 17023 19674 28027 7706 16594(ZnAl)104 11 14212 5029 7002 7721 867 1990EF 1292 457 637 702 079 181V (ppm) 130 9913 5792 6657 7424 2574 5014(VAl)104 15 8605 1711 2369 2045 290 601EF 574 114 158 136 019 040Cr (ppm) 90 14285 15093 13535 19618 4671 10047(CrAl)104 102 12400 4459 4817 5404 526 1205EF 1216 437 472 530 052 118Ba (ppm) 580 89683 106347 51500 55606 76698 345512(BaAl)104 66 77849 31417 18329 15318 8630 41436EF 1180 476 278 232 131 628
Element WSA 9660ndash9750 ft
9750ndash9840 ft
9840ndash9930 ft
9930ndash10020 ft
10020ndash10110 ft
10110ndash10200 ft
10200ndash10290 ft
Rb (ppm) 140 6160 3190 3673 4158 1402 3227 2540(RbAl)104 16 5347 942 1307 1145 158 387 311EF 334 059 082 072 010 024 019Sr (ppm) 300 18024 11433 11334 12433 5711 15023 8792(SrAl)104 34 15645 3377 4034 3425 643 1802 1077EF 460 099 119 101 019 053 032Zr (ppm) 160 23675 18552 19599 20818 14783 25034 17902(ZrAl)104 18 20551 5481 6975 5735 1663 3002 2193EF 1142 304 388 319 092 167 122Pb (ppm) 22 2348 1596 2369 3542 1770 2182 1874(PbAl)104 25 2038 471 843 976 199 262 230EF 815 189 337 390 080 105 092U (ppm) 37 256 178 196 207 076 159 120(UAl)104 042 222 052 070 057 009 019 015EF 528 125 166 135 020 045 035Mo (ppm) 1 1330 1068 777 1286 494 569 470(MoAl)104 01 1155 316 276 354 056 068 058EF 11545 3155 2764 3541 556 682 576Y (ppm) 41 2322 1312 1540 1738 360 1082 867(YAl)104 46 2015 387 548 479 041 130 106EF 438 084 119 104 009 028 023
Table 1 (Continued)
582
ADEBAYO et al Turkish J Earth Sci
Table 1 (Continued)
Table 1 (Continued)
Element WSA 10290ndash10380 ft
10380ndash10470 ft
10470ndash10560 ft
10560ndash10650 ft
10650ndash10740 ft
10740ndash10830 ft
10830ndash10920 ft
Ni (ppm) 68 3660 5290 4183 4182 3977 5715 5448(NiAl)104 77 452 623 496 504 968 1093 932EF 059 059 081 064 065 126 142 121Co (ppm) 19 5908 3004 2901 3034 4751 3111 2966(CoAl)104 21 730 354 344 366 1157 595 507EF 348 169 164 174 551 283 242Cu (ppm) 45 3901 7207 3286 3802 3475 7520 5490(CuAl)104 51 482 849 390 458 846 1439 939EF 095 167 076 090 166 282 184Zn (ppm) 95 18482 33685 35401 21842 26323 37479 22220(ZnAl)104 11 2285 3969 4201 2632 6409 7171 3802EF 208 361 382 239 583 652 346V (ppm) 130 5522 10715 9892 9568 9375 10560 10366(VAl)104 15 068 126 117 115 228 202 177EF 005 008 008 008 015 013 012Cr (ppm) 90 16883 28278 45695 31678 27854 41302 19370(CrAl)104 102 2087 3332 5423 3818 6781 7902 3314EF 205 327 532 374 665 775 325Ba (ppm) 580 124817 115091 425803 401567 382619 1887296 519340(BaAl)104 66 15431 13561 50535 48396 93154 361098 88861EF 234 205 766 733 1411 5471 1346
Element WSA 10290ndash10380 ft
10380ndash10470 ft
10470ndash10560 ft
10560ndash10650 ft
10650ndash10740 ft
10740ndash10830 ft
10830ndash10920 ft
Rb (ppm) 140 3549 6337 6455 6409 6071 6174 5905(RbAl)104 16 439 747 766 772 1478 1181 1010EF 027 047 048 048 092 074 063Sr (ppm) 300 12435 23667 24957 21720 20015 52414 26004(SrAl)104 34 1537 2789 2962 2618 4873 10028 4449EF 045 082 087 077 143 295 131Zr (ppm) 160 16812 28800 31047 26410 30252 22966 27813(ZrAl)104 18 2078 3393 3685 3183 7365 4394 4759EF 115 189 205 177 409 244 264Pb (ppm) 22 2392 4281 3766 4627 3702 9592 4354(PbAl)104 25 296 504 447 558 901 1835 745EF 118 202 179 223 361 734 298U (ppm) 37 151 287 290 269 260 252 273(UAl)104 042 019 034 034 032 063 048 047EF 045 081 082 077 150 115 111Mo (ppm) 1 984 1228 618 544 432 3054 2661(MoAl)104 01 122 145 073 066 105 584 455EF 1216 1447 733 656 1051 5842 4552Y (ppm) 41 1209 2933 2578 2526 2402 2495 2635(YAl)104 46 149 346 306 304 585 477 451EF 032 075 067 066 127 104 098
583
ADEBAYO et al Turkish J Earth Sci
rocks Rare earth element mobilization can occur during chemical weathering of bedrock and source bedrock REE signatures are preserved in the weathering profile because there is no net loss of REE abundance (Condie et al 1991 Cullers et al 2000 Kutterolf et al 2008) Therefore REE ratios such as LaYb GdYb LaSm and EuEu(where Eu = europium anomalies) of sediments are considered to be similar to provenance and are usually used to determine bulk source composition (Kutterolf et al 2008 Dabard and Loi 2012) REE patterns and Th data of the
investigated Agbada Formation sediments indicate the felsic composition of source rocks
Trace element ratios like NiCo VCr CuZn and UTh were used to evaluate paleoredox conditions (Hallberg 1976 Jones and Manning 1994) The ratio of uranium to thorium may be used as a redox indicator with the UTh ratio being higher in organic-rich mudstones (Jones and Manning 1994) UTh ratios below 125 suggest oxic conditions of deposition whereas values above 125 indicate suboxic and anoxic conditions (Dill et al 1988
Table 2 Major element (wt ) and trace element (mgkg) abundances of Agbada Formation sediments and world shale average (WSA) nd Not determined
Element Al2O3 CaO Cr2O3 Fe2O3 K2O MgO MnO Na2O P2O5 SiO2 TiO2 LOI Total As Ni
WSA 167 220 nd 690 360 260 nd 160 016 5890 078 nd 9344 10 68
9660ndash9750 ft 1568 151 002 731 159 116 005 055 022 5880 095 1093 9876 nd 4625
9750ndash9840 ft 776 112 002 440 091 076 003 030 013 7621 050 752 9966 nd 3292
9840ndash9930 ft 987 087 002 440 099 079 003 036 012 7320 061 823 9950 nd 3060
9930ndash10020 ft 1104 122 003 535 116 091 004 046 012 6823 069 942 9868 nd 3628
10020ndash10110 ft 218 042 001 150 047 030 001 011 003 9202 019 240 9963 nd 1817
10110ndash10200 ft 640 135 001 310 100 079 002 029 007 7807 047 664 9821 nd 2377
10200ndash10290 ft 531 082 001 257 080 053 002 023 007 8241 035 621 9932 nd 1977
10290ndash10380 ft 686 145 003 455 105 082 003 031 011 7469 043 831 9863 nd 3660
10380ndash10470 ft 1592 251 002 873 161 125 006 060 019 4878 089 1648 9704 nd 5290
10470ndash10560 ft 1679 303 004 853 166 149 007 066 027 4836 100 1558 9749 nd 4183
10560ndash10650 ft 1575 237 006 678 172 137 004 067 017 5052 094 1713 9752 nd 4182
10650ndash10740 ft 1542 137 004 672 169 125 004 056 016 5758 086 1246 9815 nd 3977
10740ndash10830 ft 1528 118 004 588 165 105 004 056 014 6031 090 1151 9852 nd 5715
10830ndash10920 ft 1603 306 003 873 172 131 006 055 019 4704 087 1319 9279 nd 5448
Element Mn U Mo V Cr Co Ba Sr Y Zr La Rb Cu Zn PbWSA 850 37 1 130 90 19 580 300 41 160 41 140 45 95 22
9660ndash9750 ft 7559 256 1330 9913 14285 3522 89683 18024 2322 23675 5128 6160 4097 16373 2348
9750ndash9840 ft 14461 178 1068 5792 15093 12582 106347 11433 1312 18552 2796 3190 3268 17023 1596
9840ndash9930 ft 14528 196 777 6657 13535 5160 51500 11334 1540 19599 3375 3673 2353 19674 2369
9930ndash10020 ft 21304 207 1286 7424 19618 5342 55606 12433 1738 20818 3737 4158 3758 28027 3542
10020ndash10110 ft 52307 076 494 2574 4671 14973 76698 5711 360 14783 741 1402 1707 7706 1770
10110ndash10200 ft 32091 159 569 5014 10047 10440 345512 15023 1082 25034 2410 3227 2929 16594 2182
10200ndash10290 ft 2712 120 470 4255 9893 8931 97962 8792 867 17902 1773 2540 1818 10612 1874
10290ndash10380 ft 27414 151 984 5522 16883 5908 124817 12435 1209 16812 2463 3549 3901 18482 2392
10380ndash10470 ft 47064 287 1228 10715 28278 3004 115091 23667 2933 28800 5820 6337 7207 33685 4281
10470ndash10560 ft 4528 290 618 9892 45695 2901 425803 24957 2578 31047 5340 6455 3286 35401 3766
10560ndash10650 ft 41391 269 544 9568 31678 3034 401567 21720 2526 26410 5178 6409 3802 21842 4627
10650ndash10740 ft 23235 260 432 9375 27854 4751 382619 20015 2402 30252 5051 6071 3475 26323 3702
10740ndash10830 ft 21323 252 3054 10560 41302 3111 1887296 52414 2495 22966 5008 6174 7520 37479 9592
10830ndash10920 ft 28062 273 2661 10366 19370 2966 519340 26004 2635 27813 5081 5905 5490 22220 4354
584
ADEBAYO et al Turkish J Earth Sci
Table 3 Trace and rare earth element ratios of the studied Agbada Formation sediments
Sample name NiCo VCr UTh CrNi VSc LaSc LaYb GdYb LaTh LaSm ThYb
9660ndash9750 ft 131 069 019 309 580 300 2269 307 384 613 591
9750ndash9840 ft 026 038 023 458 392 189 2113 284 362 623 583
9840ndash9930 ft 059 049 021 442 427 217 2122 282 371 655 572
9930ndash10020 ft 068 038 020 541 474 239 2154 282 359 612 599
10020ndash10110 ft 012 055 033 257 198 057 1381 196 317 631 435
10110ndash10200 ft 023 050 023 423 361 173 1956 254 349 627 560
10200ndash10290 ft 022 043 026 500 318 132 2027 274 377 662 537
10290ndash10380 ft 062 033 022 461 401 179 1923 276 355 568 542
10830ndash10920 ft 176 038 019 535 645 351 2007 287 384 583 523
10380ndash10470 ft 144 022 019 1093 630 340 2034 278 358 613 568
10470ndash10560 ft 138 030 018 757 590 319 1946 281 355 580 548
10560ndash10650 ft 084 034 018 700 561 302 1965 258 353 603 557
10650ndash10740 ft 184 026 018 723 672 319 2131 307 356 573 599
10740ndash10830 ft 184 054 019 356 648 318 1958 283 362 568 541
Minimum 012 022 018 257 198 057 1381 196 317 568 435
Maximum 184 069 033 1093 672 351 2269 307 384 662 599
Average 094 041 021 540 493 245 1999 275 360 608 554
Standart deviation 064 013 004 218 146 090 204 027 017 030 042
Sample name ThU UPb EuEu VNi CrTh ThCo ThCr CuZn ThSc V(Ni+V)
9660ndash9750 ft 523 011 072 214 1070 038 009 025 078 068
9750ndash9840 ft 435 011 067 176 1956 006 005 019 052 064
9840ndash9930 ft 465 008 068 218 1487 018 007 012 058 069
9930ndash10020 ft 503 006 071 205 1887 019 005 013 066 067
10020ndash10110 ft 307 004 078 142 2000 002 005 022 018 059
10110ndash10200 ft 434 007 078 211 1456 007 007 018 050 068
10200ndash10290 ft 391 006 072 215 2105 005 005 017 035 068
10290ndash10380 ft 458 006 073 151 2434 012 004 021 050 060
10830ndash10920 ft 528 007 068 203 1865 050 005 021 091 067
10380ndash10470 ft 514 008 070 237 3064 051 003 009 095 070
10470ndash10560 ft 543 006 071 229 2174 048 005 017 090 070
10560ndash10650 ft 551 007 073 236 1947 030 005 013 086 070
10650ndash10740 ft 559 003 087 185 2932 045 003 020 090 065
10740ndash10830 ft 515 006 071 190 1380 047 007 025 088 066
Minimum 307 003 067 142 1070 002 003 009 018 059
Maximum 559 011 087 237 3064 051 009 025 095 070
Average 480 007 073 201 1983 027 005 018 068 066
Standart deviation 071 002 005 029 560 019 002 005 024 004
Table 3 (Continued)
585
ADEBAYO et al Turkish J Earth Sci
Nath et al 1997 Jones and Manning 1994) The studied sediments show low UTh ratios (~018ndash033 average = 021) (Tables 3 and 4) which imply that the Agbada Formation sediments were deposited in an oxygenated bottom water condition ThU ratios in the sediments range between ~559 and 307 with an average value of ~480 which indicates oxidizing conditions ThU ratios are high in oxidizing conditions and low in reducing conditions (Kimura and Watanabe 2001)
A few authors have used the VCr ratio as an indicator of bottom water oxygenated condition (Bjorlykke 1974 Shaw et al 1990 Nagarajan et al 2007) Chromium is mainly incorporated in the detrital fraction of sediments and it may substitute for Al in the structure of clays (Bjorlykke 1974) Vanadium may be bound to organic matter by the amalgamation of V4+ into porphyrins and it is normally found in sediments deposited in reducing environments (Shaw et al 1990 Kimura and Watanabe 2001) VCr ratios above 2 indicate anoxic conditions whereas values below 2 imply oxic conditions (Jones and Manning 1994) The VCr ratios in Agbada Formation sediments range from ~022 to 069 with an average value of ~041 (Tables 3 and 4) which indicates that Agbada Formation sediments were deposited in an oxic depositional condition Numerous authors have used the NiCo ratio as a redox indicator (Bjorlykke 1974 Brumsack 2006 Nagarajan et al 2007) NiCo ratios below 5 indicate oxic environments whereas ratios above 5 suggest suboxic and anoxic environments (Jones and Manning 1994) The NiCo ratios vary between ~012 and 358 with an average value of ~111 (Table 2) implying that Agbada Formation sediments were deposited in a well-oxygenated bottom water condition The CuZn ratio is also used as a redox parameter (Hallberg 1976) High CuZn ratios indicate reducing depositional conditions while low CuZn ratios suggest oxidizing conditions (Hallberg 1976) Consequently the low CuZn ratios vary between ~005 and 022 with an average value of ~017 in the studied Agbada Formation sediments (Tables 3 and
4) suggesting sediment deposition under oxic conditions V(Ni+V) ratios below 046 indicate oxic environments but ratios above 054 to 082 suggest suboxic and anoxic environments (Hatch and Levanthal 1992) The V(Ni + V) ratios in the Agbada Formation sediments encountered at the KR-1 well vary between ~059 and 070 with an average value of ~066 which suggests that there might be rare occurrence of suboxic to anoxic environments of deposition VSc ratios below 91 indicate an oxic environment of deposition (Hetzel et al 2009) The VSc ratios in the Agbada Formation sediments vary between ~198 and 672 with an average value of ~493 which indicates an oxic environment of deposition (Tables 3 and 4) Based on REE studies of the early Cretaceous sediments numerous geoscientists convincingly argued that the REE patterns (including Eu anomalies) though mostly dependent on their provenance can also be controlled by fO2 and sedimentary environment (Ganai and Rashid 2015) They observed that when fO2 is low (a reducing environment) the sediments deposited should be characterized by low REE values and a positive europium anomaly (Eu) whereas sediments deposited in oxidizing conditions (ie fO2 is high) should be characterized by high total REE and Eu depletion (Ganai and Rashid 2015) As a result it appears that the Agbada Formation sediments recovered from the KR-1 well which are characterized by high total REEs and strong negative Eu anomaly were deposited in an oxidizing environment46 Rare earth element geochemistryA comparison of the REE contents in this study and a number of works on the behavior of REEs in secondary environments is shown in Table 5 Standards that are normally used include the world shale average (WSA) as calculated by Piper (1974) from published analyses (Haskin and Haskin 1964 Wedepohl 1995) the North American Shale Composite (NASC) analyzed by Gromet et al (1984) the Upper Continental Crust (UCC) with several slightly different values reported by several authors (eg Wedepohl 1969ndash1978 McLennan
Table 4 Some trace element ratios to evaluate paleoredox conditions
Element ratios Oxic Dysoxic Suboxic to anoxic Euxinic
NiCo1 lt5 5ndash7 gt7VCr1 lt2 2ndash425 gt425UTh1 lt075 075ndash125 gt125V(Ni + V)2 lt046 046ndash060 054ndash082 gt084VSc3 lt91
1 Jones and Manning 1994 2 Hatch and Levantal 1992 3Akinyemi et al 2013 Adebayo et al 2015a
586
ADEBAYO et al Turkish J Earth Sci
1989 Rudnick and Gao 2003) but with rather similar interelement concentrations the Post-Archean Australian Shale (PAAS) proposed by McLennan (2001) and finally an average of chondrites (Schmidt et al 1963) The
concentrations of the REEs in these standards represent two compositional extremes of siliciclastic source-rocks one felsic (WSA UCC PAAS and NASC) and the second ultramafic (chondrites) (Piper and Bau 2013)
Table 5 Comparison of normalized rare earth element (REE) contents with literature data
Element WSA UCC PAAS NASC Aver chondrites
9660ndash9750 ft
9750ndash9840 ft
9840ndash9930 ft
9930ndash10020 ft
10020ndash10110 ft
10110ndash10200 ft
10200ndash10290 ft
La 41 30 3820 311 032 5128 2796 3375 3737 741 2410 1773
Ce 83 64 7960 667 090 10779 5813 6952 7676 1701 5037 3819
Pr 101 71 883 77 013 1196 644 762 869 181 541 415
Nd 38 26 3390 274 057 4528 2423 2835 3230 598 2060 1502
Sm 75 45 555 559 021 837 449 516 611 118 384 268
Eu 161 088 108 118 007 181 090 107 127 028 088 060
Gd 635 38 466 49 031 693 376 449 489 105 313 240
Tb 123 064 077 085 005 090 052 055 064 016 042 028
Dy 55 35 468 417 030 499 285 335 381 073 230 168
Ho 134 08 099 102 007 090 053 063 071 015 049 033
Er 375 23 285 284 021 240 148 164 194 042 110 088
Tm 063 033 041 084 003 035 018 024 026 010 018 014
Yb 353 22 282 306 018 090 052 055 064 016 042 028
Lu 061 032 043 046 003 033 019 021 025 008 018 014
sumREE 27165 14637 184773 15781 3393 2441635 132155 157094 1756255 36525 11341 8449
Element WSA UCC PAAS NASC Aver chondrites
10290ndash10380 ft
10380ndash10470 ft
10470ndash10560 ft
10560ndash10650 ft
10650ndash10740 ft
10740ndash10830 ft
10830ndash10920 ft
La 41 30 3820 311 032 2463 5820 5340 5178 5051 5008 5081
Ce 83 64 7960 667 090 5294 12413 11131 10918 10382 10518 10723
Pr 101 71 883 77 013 579 1369 1248 1235 1161 1190 1212
Nd 38 26 3390 274 057 2276 5197 4727 4716 4364 4520 4662
Sm 75 45 555 559 021 434 998 872 892 838 874 895
Eu 161 088 108 118 007 094 204 183 190 177 228 188
Gd 635 38 466 49 031 354 833 731 747 662 722 734
Tb 123 064 077 085 005 048 112 102 100 094 100 098
Dy 55 35 468 417 030 249 639 576 546 500 540 570
Ho 134 08 099 102 007 049 116 101 103 096 099 100
Er 375 23 285 284 021 133 319 278 277 257 247 275
Tm 063 033 041 084 003 018 043 039 037 036 035 036
Yb 353 22 282 306 018 048 112 102 100 094 100 098
Lu 061 032 043 046 003 017 042 036 034 034 034 037
sumREE 27165 14637 18477 15781 339 12052 28215 25463 25072 23744 24213 24707
WSA (Piper 1974) UCC (Wedepohl 1969ndash1978 McLennan 1989 Rudnick and Gao 2003) PAAS (McLennan 2001) NASC (Gromet et al 1984) average chondrites (Schmidt et al 1963)
587
ADEBAYO et al Turkish J Earth Sci
Table 5 shows that the concentration range of La in Agbada Formation sediments is from ~5820 to 741 ppm with an average value of ~3850 ppm and standard deviation of ~1596 The average value of La in Agbada Formation samples is lower than in WSA (Table 5) but higher than those of other standards such UCC PAAS NASC and average chondrites
Cerium contents in studied samples range between ~12413 and 1701 ppm with an average value of ~ 8082 ppm and standard deviation of ~3327 The average value of Ce in the studied samples is relatively lower than in WSA and less than that of UCC PAAS NASC and average chondrites The concentration range of Pr in the studied sediments is between ~1369 and 181 ppm with an average value of ~ 900 ppm and standard deviation of ~378 The average concentration value of Pr in Agbada Formation samples is less than in WSA but higher than those of other standards Concentration levels of Nd range from ~5197 to 598 ppm with an average value of ~3402 ppm and standard deviation of ~1457 The average concentration level of Nd is less than in WSA but higher than those of other standards
Concentration levels of Sm in Agbada Formation sediments range from ~998 to 118 ppm with an average value of ~642 and standard deviation of ~279 Concentration levels of Eu in the studied samples range between ~228 and 028 ppm with an average value of ~139 ppm and standard deviation of ~061 The average concentration of Sm is less than in WSA but higher than those of the other commonly used standards (Table 5)
The concentration levels of Gd range from ~833 to 105 ppm with an average value of ~532 ppm and standard deviation of ~228 The average value of Gd in the studied samples is less than in WSA but less high than those of the other commonly used standards The levels of Tb in Agbada Formation sediments range between ~833 and 105 ppm with an average value of ~072 ppm and standard deviation of ~031 The average concentration level of Tb in studied samples is less than in WSA PAAS and NASC but higher than in UCC and average chondrites Concentration levels of Dy in studied samples range between ~639 and 073 ppm with an average value of ~399 ppm and standard deviation of ~177 The average value of Dy in Agbada Formation sediments is higher than in UCC and average chondrites but lower than in the other considered standards The content levels of Ho in studied samples range from ~116 to 015 ppm with an average value of ~ 074 ppm and standard deviation of ~031 The average concentration value of Ho in studied samples is less than those of all considered commonly used standards Concentration levels of Er range from ~319 to 042 ppm with an average value of ~198 ppm and standard deviation of 031 The average concentration of Er in studied samples
is higher than in average chondrites but lower than in the other standards Concentration levels of Tm in studied samples range between ~043 and 010 ppm with an average value of ~028 ppm and standard deviation of ~011 The average concentration of Tm in studied samples is higher than in average chondrites but lower than in other considered standards The contents of Yb in Agbada Formation sediments range from ~112 to 016 ppm with an average value of ~072 ppm and standard deviation of ~031 The average concentration of Yb in studied samples is higher than in average chondrites but lower than in other considered standards Contents of Lu in Agbada Formation sediments range from ~042 to 008 ppm with an average value of ~027 ppm and standard deviation of ~010 The average concentration level of Lu is higher than in average chondrites but lower than its concentration in other considered standards
Cerium anomaly may perhaps be quantified by comparing the measured concentration (Ce) with an expected concentration (Ce) obtained by interpolating between the values of the neighboring elements Ce anomalies in shales of the anoxic facies are attributed to eustatic sea level changes (Wilde et al 1996) Similar to Mn Ce4+ is less soluble under oxic conditions whereas under anoxic conditions it will be mobilized leading to the depletion in Ce in anoxic sediments relative to those deposited under oxic conditions A negative Ce anomaly would be indicative of postdepositional remobilization of Ce in the water column
Table 6 shows two different values given for the Ce anomaly which are based on different calculations Taylor and McLennan (1985) suggested the use of the geometric mean Ce = radic(LaPr) The ratio CeCe is then a measure of the anomaly with values greater than unity being termed positive Wilde et al (1996) promoted the use of the arithmetic mean Ce = (La+Pr)2 and calculated the logarithm of the ratio CeCe Both calculations lead to the same values as Ce by KR-1 well samples mostly showing positive anomaly values Therefore the Agbada Formation sediments were deposited under oxic conditions which indicates the incorporation of this cerium from the water column
5 ConclusionsLithologically glauconite and rare pyrite are the most important accessory minerals in the studied well indicating a slightly anoxic marginal marine environment of deposition while the palynomorph percentage distribution shows that there are more terrestrially derived miospores (dominated by Zonocostites ramonae Psilatricolporites crassus Arostichum aurium and Laevigatosporites sp) than marine phytoplanktons These indicate that the main
588
ADEBAYO et al Turkish J Earth Sci
environment of deposition in the KR-1 well is coastal to marginal marine consisting of coastal deltaic-inner neritic made up of tidal channel and shoreface deposits (Adeigbe et al 2013) Geochemical results show that the average concentrations of considered REEs are less than their concentrations in WSA Trace metal ratios such as ThCr CrTh ThCo and CrNi suggest that the sediments were derived from felsic source rocks REE patterns such as LaYb GdYb LaSm and EuEu and Th data confirmed the felsic composition of the sediments Ratios of UTh NiCo CuZn and VSc indicate well-oxygenated bottom water conditions Estimated Eu and Ce anomalies obtained from the studied samples suggest an oxidizing
environment of deposition Nonetheless the ratios of VCr suggest a range of environmental conditions Moreover ratios of V(Ni+V) suggest rare suboxic to anoxic environments of deposition
AcknowledgmentsThe authors sincerely acknowledge the technical assistance of the final-year students who participated in the fieldwork (SedimentaryPetroleum Geology Option 20122013 and 20142015 academic sessions) The authors would also like to acknowledge Ms Riana Rossouw LA-ICP-MS laboratory of the University of Stellenbosch for multielement analysis
Table 6 Ce anomaly for Agbada Formation sediments (two quantification approaches are given)
Authors Equations 9660ndash9750 ft
9750ndash9840 ft
9840ndash9930 ft
9930ndash10020 ft
10020ndash10110 ft
10110ndash10200 ft
10200ndash10290 ft
Taylor and McLennan (1985) Ce = radic(LaPr) 2476 1342 1604 1802 366 1142 857
CeCe 435 433 434 426 464 441 445Wilde et al (1996) Ce = (La + Pr)2 5726 3118 3756 4171 832 2680 1980
Log (CeCe) 064 064 064 063 067 064 065
Authors Equations 10290ndash10380 ft
10380ndash10470 ft
10470ndash10560 ft
10560ndash10650 ft
10650ndash10740 ft
10740ndash10830 ft
10830ndash10920 ft
Taylor and McLennan (1985) Ce = radic(LaPr) 2463 5820 5340 5178 5051 5008 5081
CeCe 215 213 208 211 206 210 211Wilde et al (1996) Ce = (La + Pr)2 3695 8730 8009 7766 7577 7511 7622
Log (CeCe) 033 033 032 032 031 032 032
Ce = Cerium anomaly
References
Adebayo OF (2011) Biostratigraphy Sequence Stratigraphic Analysis of Three Offshore Wells from the Niger Delta Nigeria PhD University of Ado Ekiti Ado Ekiti Nigeria
Adebayo OF Akinyemi SA Madukwe HY Aturamu AO Ojo AO (2015a) Paleoenvironmental studies of Ahoko Shale south eastern Bida basin Nigeria insight from palynomorph assemblage and trace metal proxies International Journal of Scientific and Research Publications 5 1-16
Adebayo OF Ojo AO Aturamu AO (2015b) Foraminiferal and calcareous nannofossil studies of KR-1 well offshore Southwest Niger Delta Basin Nigeria Elixir Earth Science 79 30323-30328
Adeigbe OC Ola-Buraimo AO Moronhunkola AO (2013) Palynological characterization of the Tertiary offshore Emi-1 well Dahomey Basin Southwestern Nigeria International Journal of Scientific and Technological Research 2 58-70
Adenugba AA Dipo SO (2013) Non-oil exports in the economic growth of Nigeria a study of agricultural and mineral resources J Educ Soc Res 3 403-418
Akinyemi SA Adebayo OF Ojo OA Fadipe OA Gitari WM (2013) Mineralogy and geochemical appraisal of paleo-redox indicators in Maastrichtian outcrop shales of Mamu Formation Anambra Basin Nigeria J Nat Sci Res 10 48-64
Ako BD Ojo SB Okereke CS Fieberg FC Ajayi TR Adepelumi AA Afolayan JFO Afolabi O Ogunnusi HO (2004) Some observation from gravitymagnetic data interpretation of the Niger Delta NAPE Bulletin 17 4-8
Algeo TJ Maynard JB (2004) Trace-element behavior and redox facies in core shales of Upper Pennsylvanian Kansas-type cyclothems Chem Geol 206 289-318
589
ADEBAYO et al Turkish J Earth Sci
Arnaboldi M Meyers PA (2003) Geochemical evidence for paleoclimatic variations during deposition of two Late Pliocene sapropels from the Vrica section Calabria Palaeo Palaeo Palaeo 190 257-271
Barreda VD Palamarczuk S (2000) Palinomorfos continentales y marinos de la Formacioacuten Monte Leoacuten en su aacuterea tipo provincia de Santa Cruz Argentina Ameghiniana 37 3-12 (in Spanish)
Bjorlykke K (1974) Geochemical and mineralogical influence of Ordovician island arcs on epicontinental clastic sedimentation a study of Lower Palaeozoic sedimentation in the Oslo region Norway Sedimentology 21 251-272
Brumsack HJ (1980) Geochemistry of Cretaceous black shales from the Atlantic Ocean (DSDP Legs 11 14 36 and 41) Chem Geol 31 1-25
Brumsack HJ (1986) The inorganic geochemistry of Cretaceous black shales (DSDP Leg 41) in comparison to modern upwelling sediments from the Gulf of California In Summerhayes CP Shackleton NJ editors North Atlantic Palaeoceanography London UK Geological Society of London Special Publications pp 447-462
Brumsack HJ (1989) Geochemistry of recent TOC-rich sediments from the Gulf of California and the Black Sea Geol Rundsch 78 851-882
Brumsack HJ (2006) The trace metal content of recent organic carbon-rich sediments implications for Cretaceous black shale formation Palaeo Palaeo Palaeo 232 344-361
Calvert SE Pedersen TF (1993) Geochemistry of recent oxic and anoxic marine sediments implications for the geological record Mar Geol 113 67-88
Condie KC Marais DJD Abbott D (2001) Precambrian superplumes and supercontinents a record in black shales carbon isotopes and paleoclimates Precambrian Res 106 239-260
Condie KC Wilks M Rosen DM Zlobin VL (1991) Geochemistry of metasediments from the Precambrian Hapschan Series eastern Anabar Shield Siberia Precambrian Res 50 37-47
Cox R Lowe DR Cullers RL (1995) The influence of sediment recycling and basement composition on evolution of mudrock chemistry in the southwestern United States Geochim Cosmochim Ac 59 2919-2940
Crusius J Calvert S Pedersen T Sage D (1996) Rhenium and molybdenum enrichments in sediments as indicators of oxic suboxic and sulfidic conditions of deposition Earth Planet Sc Lett 145 65-78
Cullers RL (1994) The controls on the major and trace element variation of shales siltstones and sandstones of Pennsylvanian-Permian age from uplifted continental blocks in Colorado to platform sediment in Kansas USA Geochim Cosmochim Ac 58 4955-4972
Cullers RL (1995) The controls on the major and trace element evolution of shales siltstones and sandstones of Ordovician to Tertiary age in the Wet Mountains region Colorado USA Chem Geol 123 107-131
Cullers RL (2000) The geochemistry of shales siltstones and sandstones of Pennsylvanian-Permian age Colorado USA implications for provenance and metamorphic studies Lithos 51 305-327
Cullers RL Podkovyrov VN (2000) Geochemistry of the Mesoproterozoic Lakhanda shales in southeastern Yakutia Russia implications for mineralogical and provenance control and recycling Precambrian Res 104 77-93
Dabard MP Loi A (2012) Environmental control on concretion-forming processes examples from Paleozoic terrigenous sediments of the North Gondwana margin Amorican Massif (Middle Ordovician and Middle Devonian) and SW Sandinia (Late Ordovician) Sediment Geol 267 93-103
Dean WE Gardner JV Piper DZ (1997) Inorganic geochemical indicators of glacial-interglacial changes in productivity and anoxia of the California continental margin Geochim Cosmochim Ac 61 4507-4518
Dean WE Piper DZ Peterson LC (1999) Molybdenum accumulation in Cariaco basin sediment over the past 24 ky a record of water-column anoxia and climate Geology 27 507-510
Demchuk TD Moore TA (1993) Palynofloral and organic characteristics of a Miocene bog-forest Kalimantan Indonesia Org Geochem 20 119-134
Dill HG Teshner M Wehner H (1988) Petrography inorganic and organic geochemistry of Lower Permian Carboniferous fan sequences (Brandschiefer Series) FRG constraints to their palaeogeography and assessment of their source rock potential Chem Geol 67 307-325
Durugbo EU (2013) Palynostratigraphy age determination and depositional environments of Imo Shale Exposures at the OkigwePort Harcourt Express Road Junction Okigwe South-eastern Nigeria Greener Journal of Physical Science 3 255-272
Ejedawe JE (1981) Patterns of incidence of oil reserves in Niger Delta Basin AAPG Bull 65 1574-1585
El-Beialy SY Mahmoud MS Ali SA (2005) Insights on the age climate and environment of the Miocene Rudeis and Kareem formations GS-78-1 well Gulf of Suez Egypt a palynological approach Rev Espanola Micropaleont 37 273-289
Evamy DD Haremboure J Kamerling P Knaap WA Mollot FA Rowlands PH (1978) Hydrocarbon habitat of Tertiary Niger Delta AAPG Bull 62 1-39
Faegri K Iversen J (1989)Textbook of Pollen Analysis New York NY USA John Wiley amp Sons
Fayose EA (1970) Stratigraphical paleontology of Afowo-1 well southern Nigeria J Min Geol 5 1-97
Ganai JA Rashid SA (2015) Rare earth element geochemistry of the Permo-Carboniferous clastic sedimentary rocks from the Spiti Region Tethys Himalaya significance of Eu and Ce anomalies Chin J Geoch 34 252-264
Germeraad JJ Hopping GA Muller J (1968) Palynology of Tertiary sediments from tropical areas Rev Palaeobot Palyno 6 189-348
590
ADEBAYO et al Turkish J Earth Sci
Graham A (1987) Miocene communities and paleoenvironments of southern Costa Rica Am J Bot 74 1501-1518
Gromet PL Dymektev FP Haskin LA Korotev RO (1984) The North American shale composite its composition major and minor element characteristics Geochim Cosmochim Ac 48 2469-2482
Hallberg RO (1976) A geochemical method for investigation of palaeoredox conditions in sediments Ambio Spec Rep 4 139-147
Haskin MA Haskin L (1964) Rare earth elements in European shales a redetermination Science 748 507-509
Hatch JR Leventhal JS (1992) Relationship between inferred redox potential of the depositional environment and geochemistry of the Upper Pennsylvanian (Missourian) Stark Shale Member of the Dennis Limestone Wabaunsee County Kansas USA Chem Geol 99 65-82
Hetzel A Boumlttcher ME Wortmann UG Brumsack H (2009) Paleo-redox conditions during OAE 2 reflected in Demerara Rise sediment geochemistry (ODP Leg 207) Palaeo Palaeo Palaeo 273 302-328
Hopping CA (1967) Palynology and the oil industry Rev Palaeobot Palyno 2 23-48
Hospers J (1965) Gravity field and structure of the Niger Delta Nigeria West Africa Geol Soc Am Bull 76 407-422
Jones B Manning DAC (1994) Comparison of geological indices used for the interpretation of palaeoredox conditions in ancient mudstones Chem Geol 111 111-129
Kaplan A Lusser CU Norton IO (1994) Tectonic Map of the World Panel 10 Scale 110000000 Tulsa OK USA American Association of Petroleum Geologists
Kimura H Watanabe Y (2001) Oceanic anoxia at the Precambrian-Cambrian boundary Geology 21 995-998
Knox GJ Omatsola EM (1987) Development of the Cenozoic Niger Delta in terms of the ldquoEscalator Regressionrdquo model and impact on hydrocarbon distribution In Proceedings of the KNGMG Symposium Coastal Lowlands Geology and Geotechnology Dordrecht the Netherlands Kluwer pp 181-202
Kogbe CA Sowunmi MA (1980) The age of the Gwandu Formation (Continental Terminal) in North-Western Nigeria Ann Min Geol 28 43-53
Kulke H (1995) Nigeria In Kulke H editor Regional Petroleum Geology of the World Part II Africa America Australia and Antarctica Berlin Germany Gebruder Borntraeger pp 143-172
Kutterolf S Diever R Schacht U Krawinkel H (2008) Provenance of the Carboniferous Hodiwipfel Formation (Karawanken Mountains AustriSlovenia) geochemistry versus petrography Sediment Geol 203 246-266
Loeblich AR Jr Tappan H (1964) Treatise on Invertebrate Paleontology Part C Protista Vols 1 and 2 Sarcodina Chiefly ldquoThecamoebiansrdquo and Foraminiferida Lawrence KS USA University of Kansas Press
McLennan SM (1989) Rare earth elements in sedimentary rocks influence of provenance and sedimentary processes Rev Miner Geochem 21 169-200
McLennan SM (2001) Relationships between the trace element composition of sedimentary rocks and upper continental crust Geochem Geophy Geosys 2 1-24
Morford JL Russell AD Emerson S (2001) Trace metal evidence for changes in the redox environment associated with the transition from terrigenous clay to diatomaceous sediment Saanlich Inlet BC Mar Geol 174 355-369
Murat RC (1972) Stratigraphy and paleogeography of the Cretaceous and Lower Tertiary in Southern Nigeria In Dessauvagie TFJ Whiteman AJ editors African Geology Ibadan Nigeria University of Ibadan pp 261-269
Murray JW (1991) Ecology and Paleontology of Benthic Foraminifera London UK Longman
Nagarajan R Madhavaraju J Nagendral R Armstrong-Altrin JS Moutte J (2007) Geochemistry of Neoproterozoic shales of the Rabanpalli Formation Bhima Basin Northern Karnataka southern India implications for provenance and paleoredox conditions Rev Mex Cienc Geol 24 150-160
Nath BN Bau M Rao BR Rao ChM (1997) Trace and rare earth elemental variation in Arabian Sea sediments through a transect across the oxygen minimum zone Geochim Cosmochim Ac 61 2375-2388
Nwajide CS Reijers TJA (1996) Sequence architecture in outcrop examples from the Anambra Basin Nigeria NAPE Bulletin 11 23-32
Okosun EA Liebau A (1999) Foraminiferal biostratigraphy of Eastern Niger Delta Nigeria NAPE Bulletin 14 136-156
Olayiwola PO (1987) Petroleum and Structural Change in a Developing Country The Case of Nigeria New York NY USA Praeger
Pailler D Bard E Rostek F Zheng Y Mortlock R van Geen A (2002) Burial of redox-sensitive metals and organic matter in the equatorial Indian Ocean linked to precession Geochim Cosmochim Ac 66 849-865
Palamarczuk S Barreda VD (1998) Bioestratigrafıa de dinoflagelados de la Formacion Chenque (Mioceno) provincia del Chubut Ameghiniana 35 415-426 (in Spanish)
Petters SW (1979a) Nigerian Paleocene benthonic foraminiferal biostratigraphy paleoecology and paleobiologeography Mar Micropaleontol 4 85-99
Petters SW (1979b) Some Late Tertiary foraminifera from parabe-1 well Eastern Niger Delta Rev Esp Micropaleontol 11 1190-133
Petters SW (1982) Central West African Cretaceous-Tertiary benthic foraminifera and stratigraphy Palaeontographica Abt A 179 1-104
Piper DZ (1974) Rare-earth elements in the sedimentary cycle a summary Chem Geol 14 285-304
Piper DZ (1994) Seawater as the source of minor elements in black shales phosphorites and other sedimentary rocks Chem Geol 114 95-114
591
ADEBAYO et al Turkish J Earth Sci
Piper DZ Bau M (2013) Normalized rare earth elements in water sediments and wine identifying sources and environmental redox conditions American Journal of Analytical Chemistry 4 69-83
Postuma JA (1971) Manual of Planktonic Foraminifera New York NY USA Elsevier Publishing
Reijers TJA Petters SW Nwajide CS (1997) The Niger Delta Basin In Selley RC editor African Basins-Sedimentary Basin of the World 3 Amsterdam the Netherlands Elsevier Science pp 151-172
Rimmer SM (2004) Geochemical paleoredox indicators in DevonianndashMississippian black shales Central Appalachian Basin (USA) Chem Geol 206 373-391
Rudnick RL Gao S (2003) Composition of the continental crust In Holland HD Turekian KK editors Treatise on Geochemistry New York NY USA Elsevier pp 1-64
Sarjeant WAS (1974) English Jurassic dinoflagellate cysts and acritarch a re-examination of some type and figure specimen Geosci Man 1 1-25
Schmidt RA Smith RH Lasch JE Mosen AW Olehy DA Vasilevshis J (1963) Abundances of fourteen rare-earth elements scandium and yttrium in meteoritic and terrigenous matter Geochim Cosmochim Ac 27 577-622
Selley RC (1976) An Introduction to Sedimentology London UK Academic Press
Shaw TJ Geiskes JM Jahnke RA (1990) Early diagenesis in differing depositional environments the response of transition metals in pore water Geochim Cosmochim Ac 54 1233-1246
Short KC Stauble AJ (1967) Outline of geology of Niger Delta AAPG Bull 51 761-779
Simmons MD Bidgood MD Brenac P Crevello PD Lambiase JJ Morley CK (1999) Microfossil assemblages as proxies for precise palaeoenvironmental determination ndash an example from Miocene sediments of northwest Borneo In Jones RW Simmons MD editors Biostratigraphy in Production and Development Geology London UK Geological Society of London Special Publications pp 219-241
Stacher P (1995) Present understanding of the Niger Delta hydrocarbon habitat In Oti MN Postma G editors Geology of Deltas Rotterdam the Netherlands AA Balkema pp 257-267
Thanikaimoni G (1987) Mangrove Palynology Pondicherry India Institut francais de Pondichery Travaux de la Section Scientifique et Technique
Tomlinson PB (1986) The Botany of Mangroves Cambridge UK Cambridge University Press
Turekian KK Wedepohl KH (1961) Distribution of the elements in some major units of the Earthrsquos crust Geol Soc Am Bull 72 175-192
Warning B Brumsack HJ (2000) Trace metal signatures of eastern Mediterranean sapropels Palaeo Palaeo Palaeo 158 293-309
Weber KJ Daukoru EM (1975) Petroleum geological aspects of the Niger Delta J Min Geol 12 9-32
Wedepohl KH (1969ndash1978) Handbook of Geochemistry IndashIV Berlin Germany Springer-Verlag
Wedepohl KH (1971) Environmental influences on the chemical composition of shales and clays In Ahrens LH Press F Runcorn SK Urey HC editors Physics and Chemistry of the Earth Oxford UK Pergamon pp 305-333
Wedepohl KH (1991) The composition of the upper earthrsquos crust and the natural cycles of selected metals Metals in natural raw materials In Merian E editor Metals and Their Compounds in the Environment Weinheim Germany VCH pp 3-17
Wedepohl WE (1995) The composition of the continental crust Geochim Cosmochim Ac 59 1217-1232
Wilde P Quinby-Hunt MS Erdtmann BD (1996) The whole-rock cerium anomaly a potential indicator of eustatic sea-level changes in shales of the anoxic facies Sediment Geol 101 43-53
Wood GD Gabriel AM Lawson JC (1996) Palynological techniques - processing and microscopy In Jansonius J McGregor V editors Palynology Principles and Applications Dallas TX USA American Association of Stratigraphic Palynologists pp 29-50
Wronkiewicz DJ Condie KC (1990) Geochemistry and mineralogy of sediments from the Ventersdorp and Transvaal Supergroups South Africa Cratonic evolution during the early Proterozoic Geochim Cosmochim Ac 54 343-354
Yarincik KM Murray RW Lyons TW Peterson LC Haug GH (2000) Oxygenation history of bottom waters in the Cariaco Basin Venezuela over the past 578000 years results from redox-sensitive metals (Mo V Mn and Fe) Paleoceanography 15 593-604
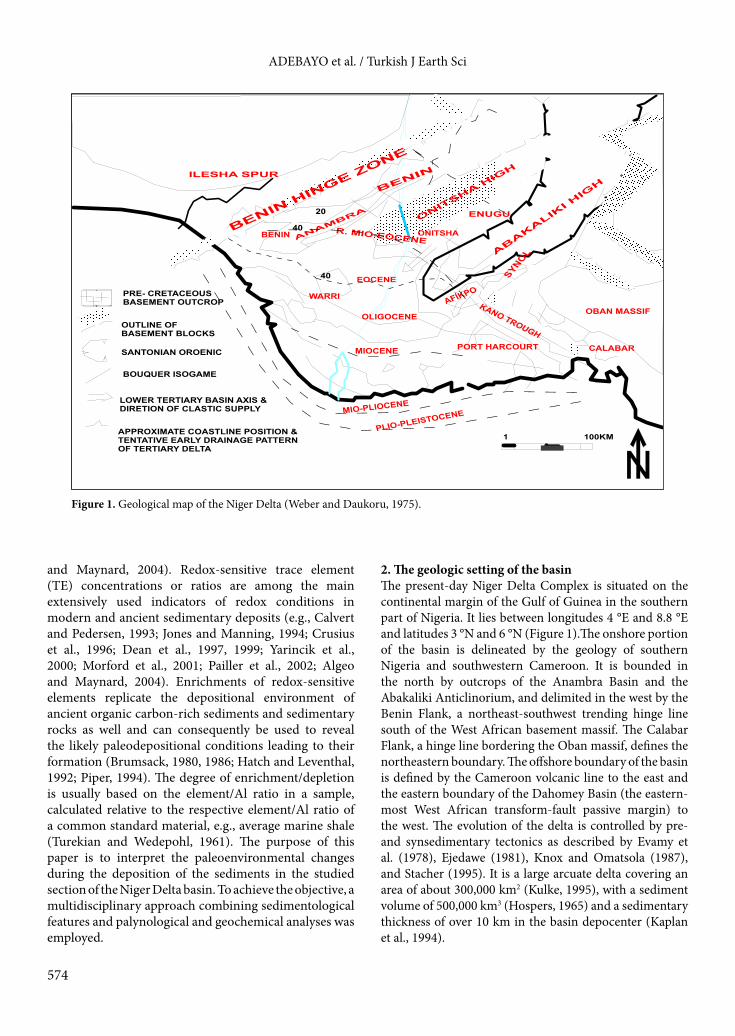
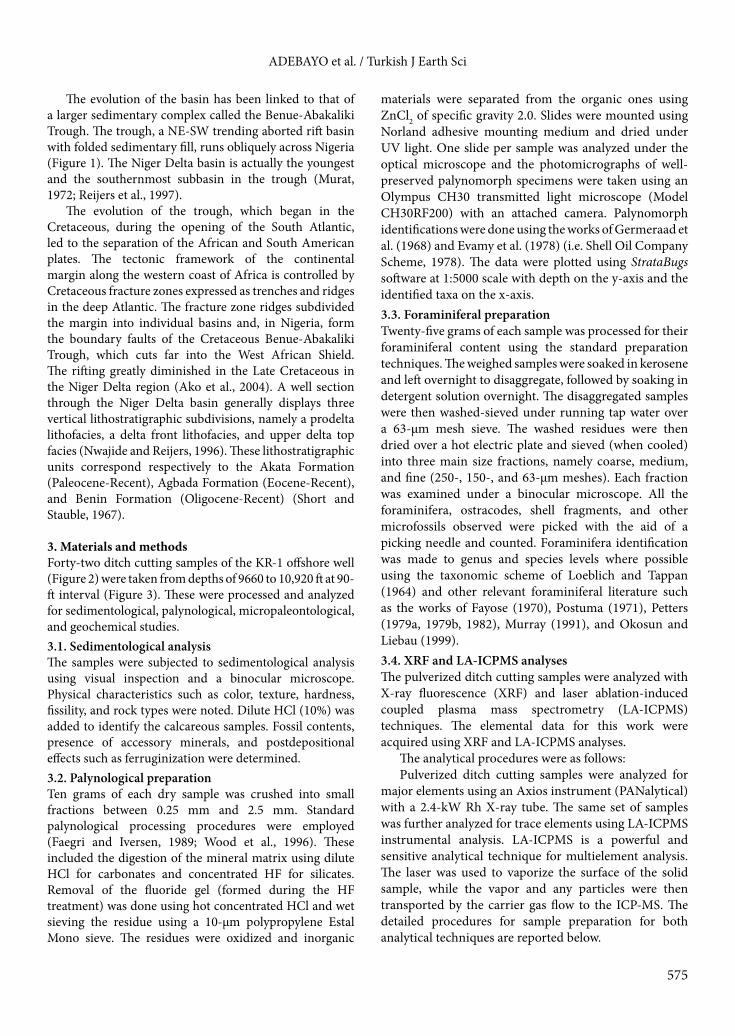
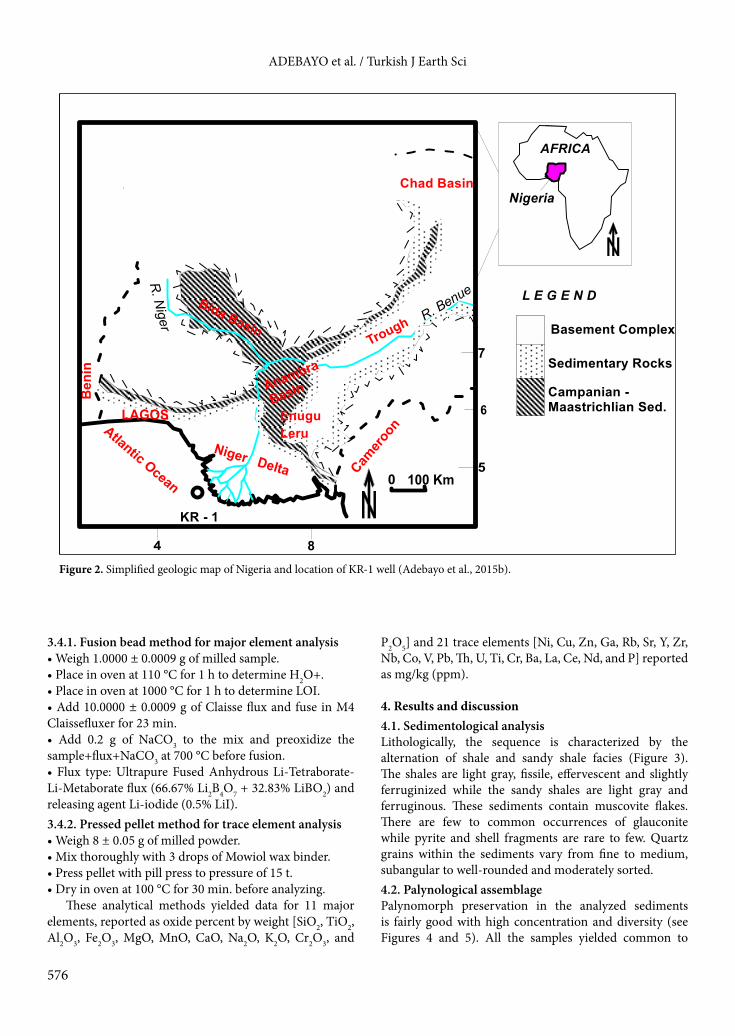
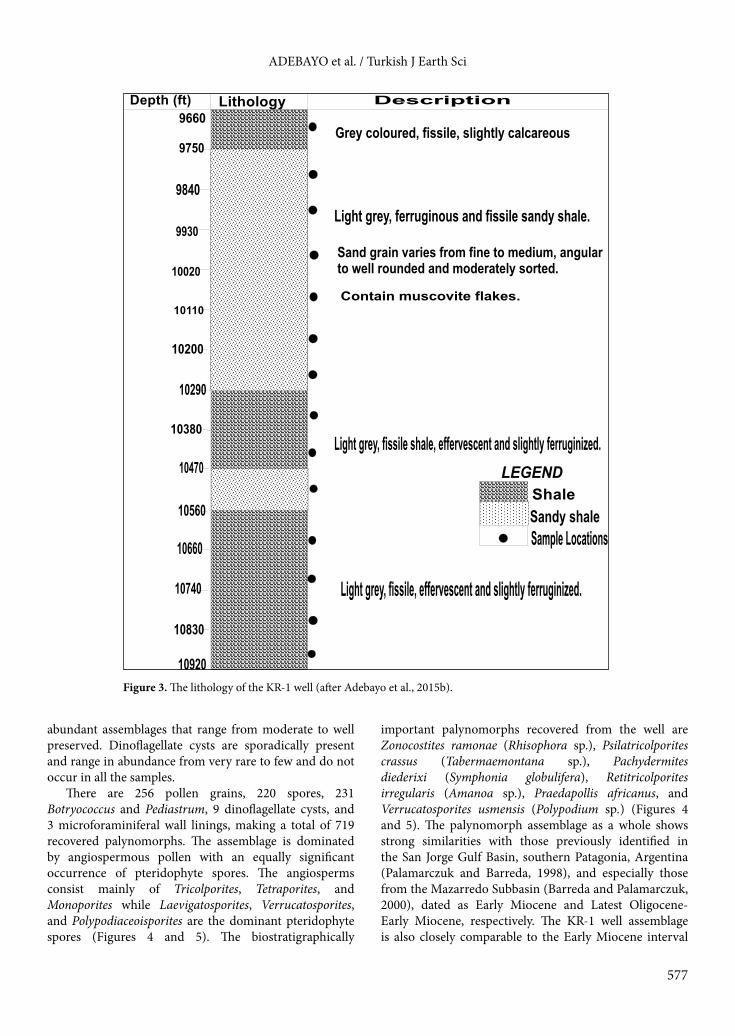
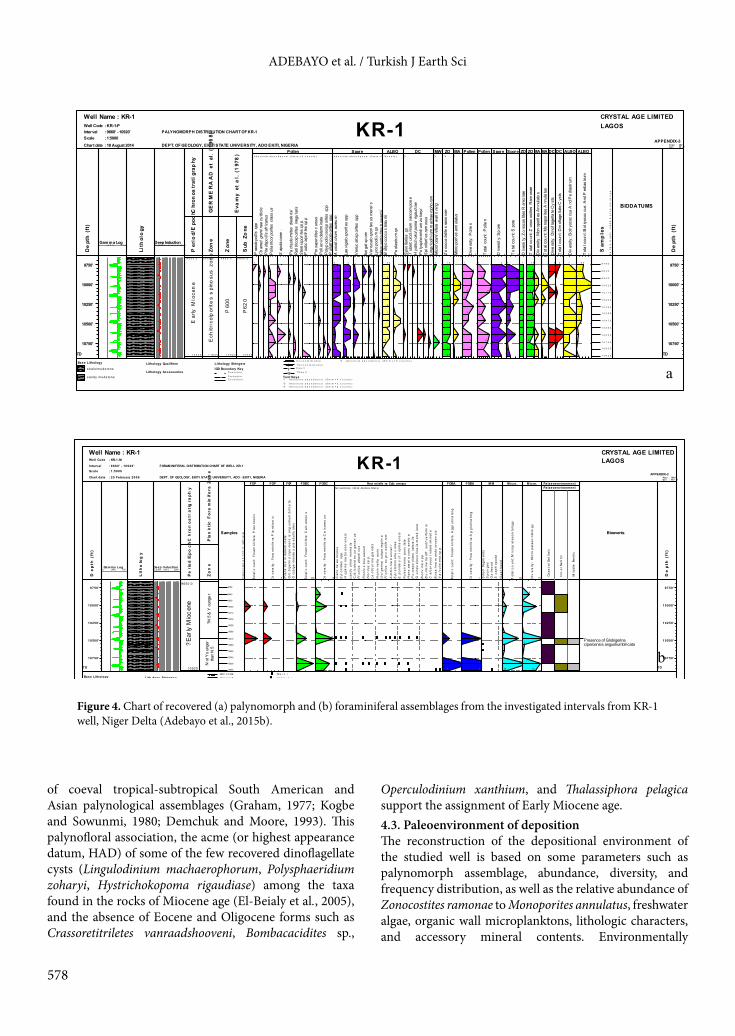
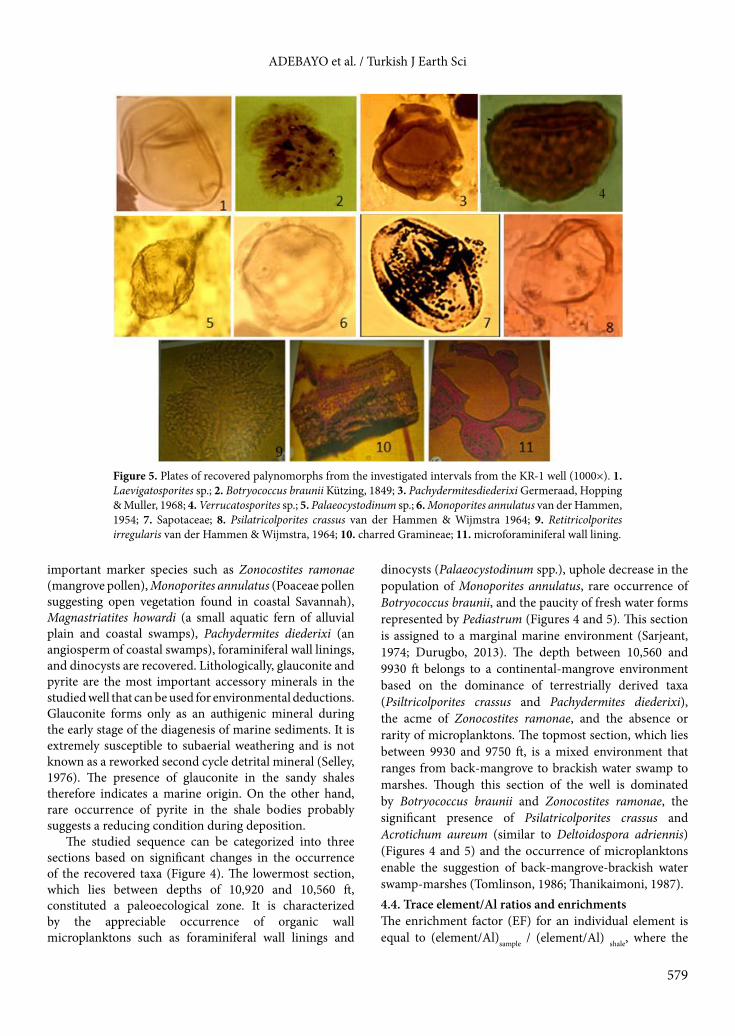
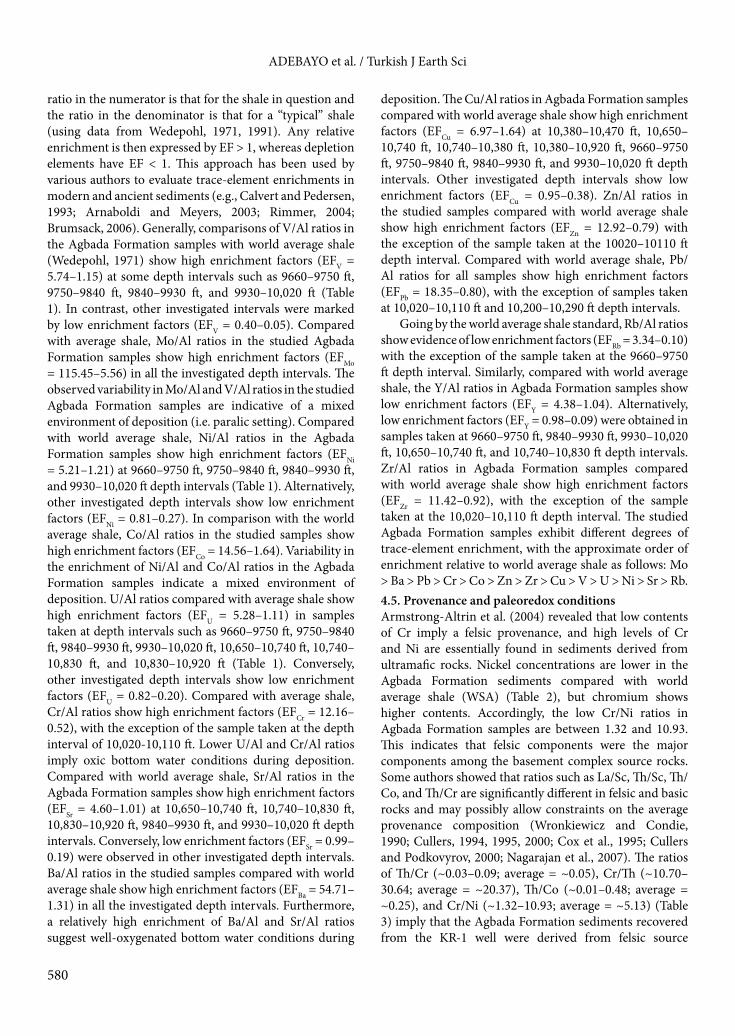
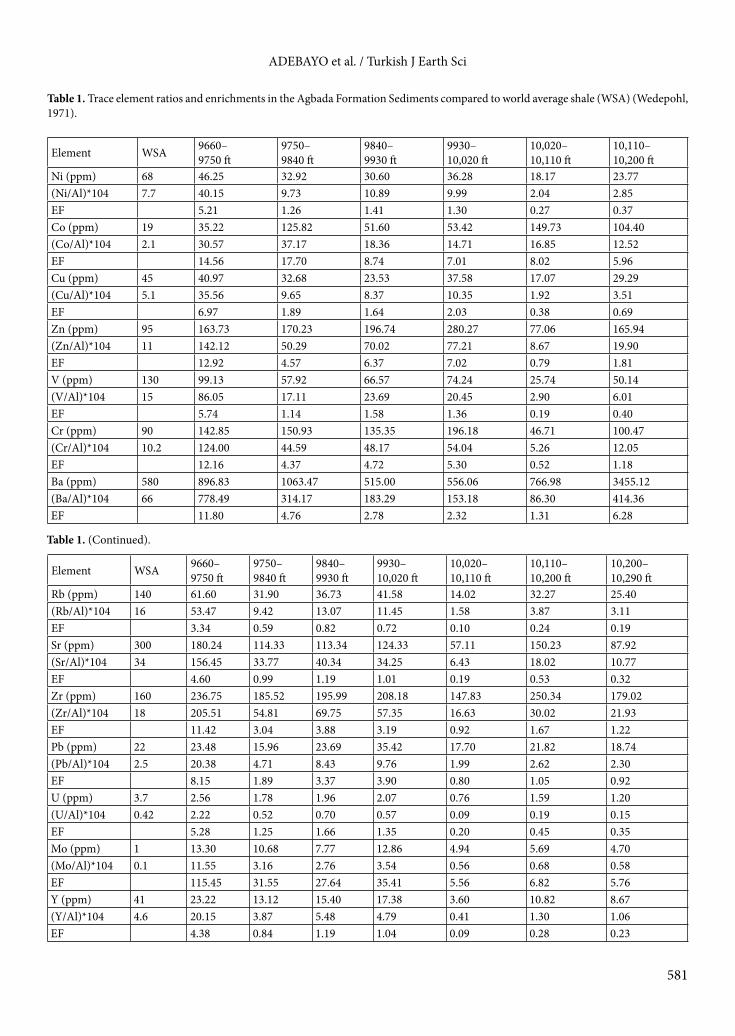
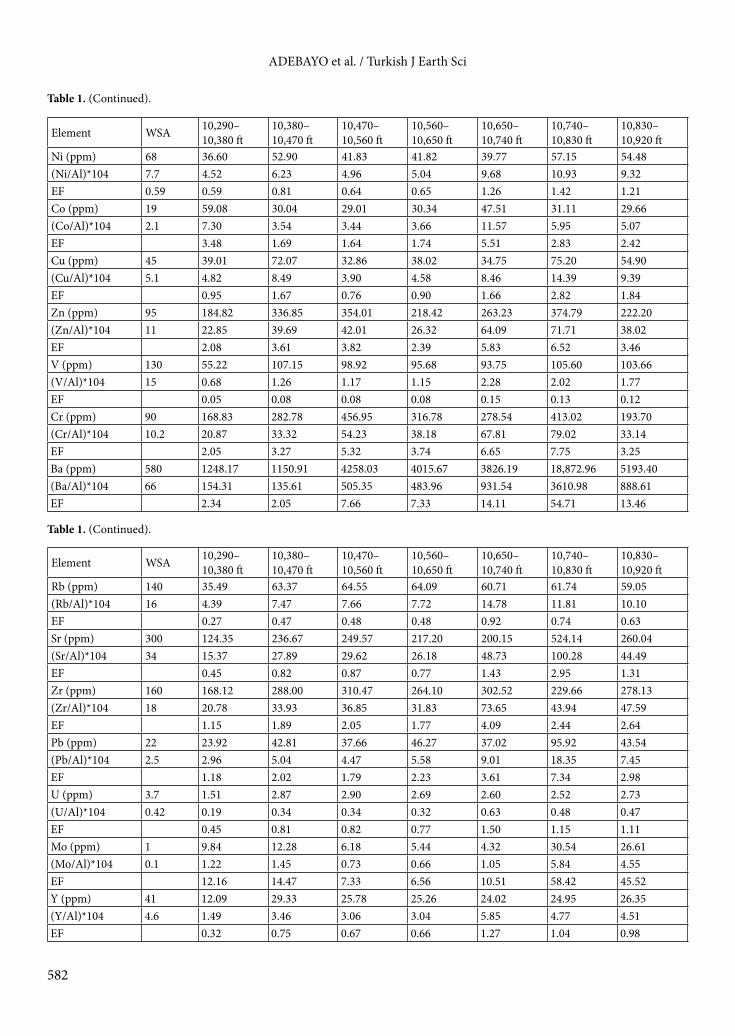
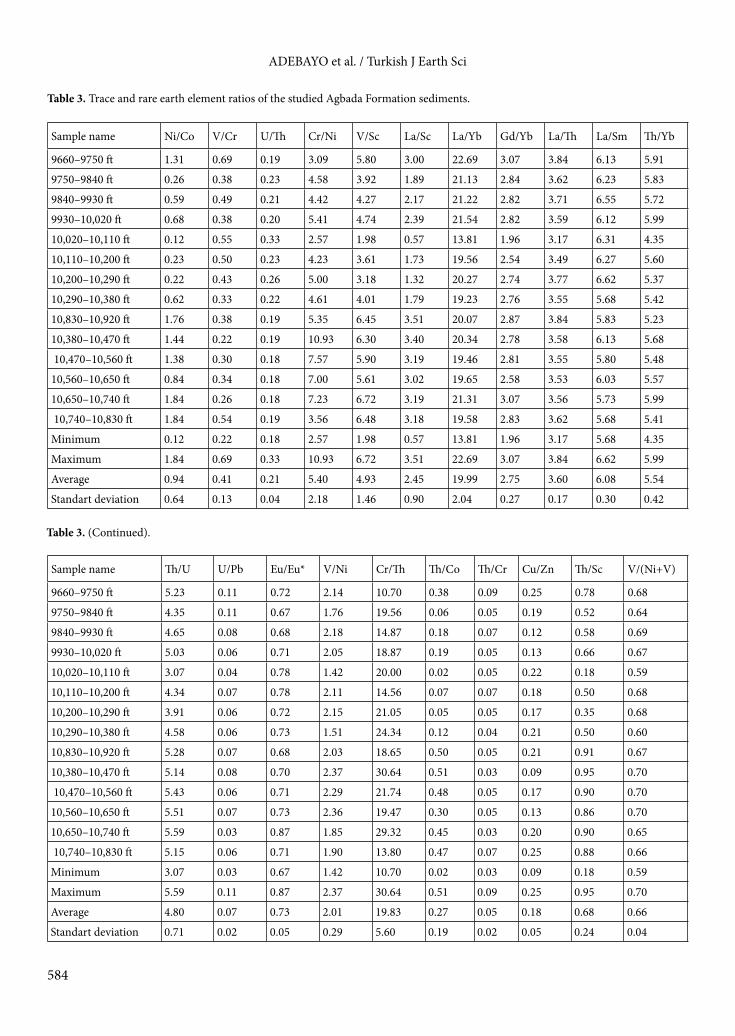
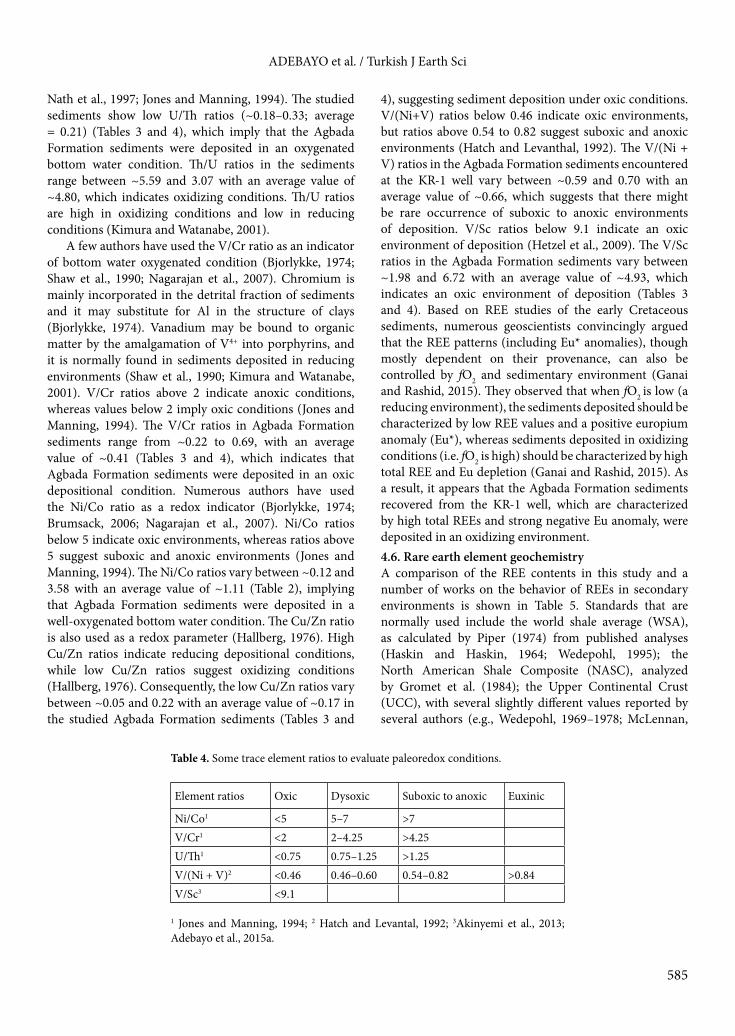
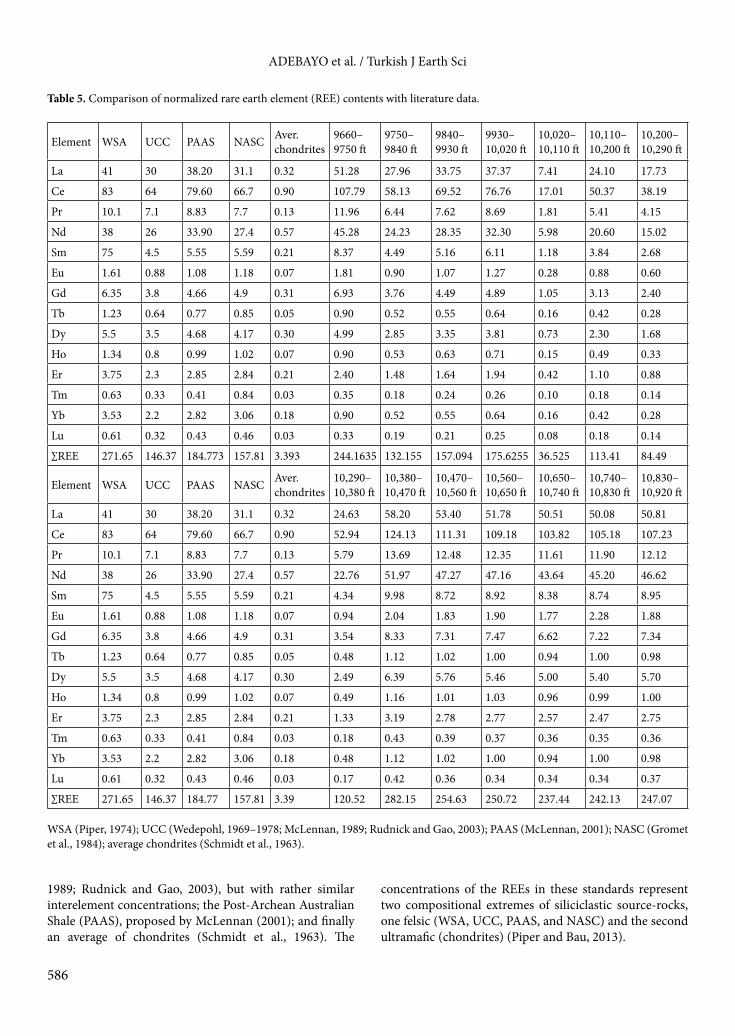
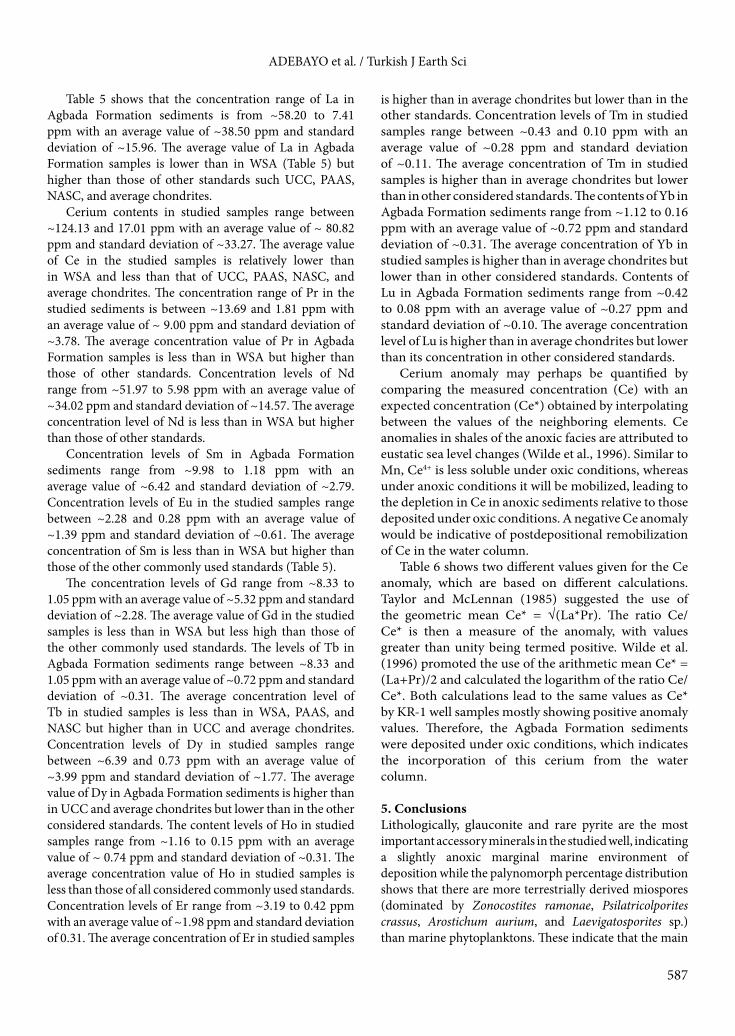
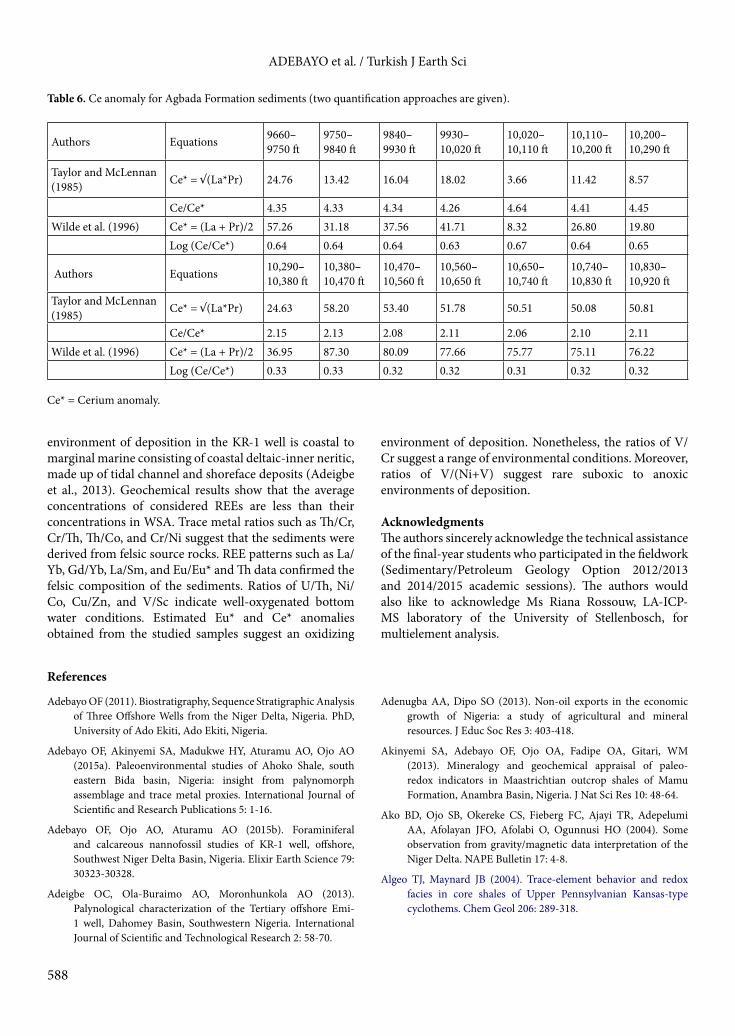