ATMOSPHERIC ABUNDANCES RETRIEVED FROM … ABUNDANCES RETRIEVED FROM IUVS/MAVEN STEL- ... S. Jain, J....
4
ATMOSPHERIC ABUNDANCES RETRIEVED FROM IUVS/MAVEN STEL- LAR OCCULTATIONS. R. V. Yelle, H. Gr¨ oller, T. Koskinen, Lunar and Planetary Laboratory, University of Arizona, Tucson, AZ, USA ([email protected]), F. Montmessin, G. Lacombe, F. Lef` evre, LATMOS, Universit´ e Versailles Saint-Quentin / CNRS, Guyancourt, France, S. Jain, J. Deighan, N. M. Schneider, Laboratory for Atmospheric and Space Physics, University of Colorado, Boulder, CO, USA. Introduction We present CO2,O2, and O3 profiles observed with the Imaging Ultraviolet Spectrograph (IUVS) on the Mars Atmosphere and Volatile EvolutioN (MAVEN) mission. The density profiles are derived from stellar occultations in the FUV and the MUV wavelength range (Jakosky et al., 2015; McClintock et al., 2014). The FUV channel is sensitive to CO2 and O2 while the MUV channel is sensitive to CO2,O3, and clouds and aerosols. FUV oc- cultations can also detect high altitude clouds. Altitudes between around 90 km and 150 km are covered with the FUV channel and from around 30 km up to 90 km with the MUV channel. After calculating the transmis- sion spectrum we apply a spectral inversion using the Levenberg-Marquardt least squares fitting algorithm to get the best fit. The line-of-sight column densities are inverted to determine local number densities using the Tikhonov regularization scheme. A detailed description of stellar occultations executed with the IUVS instru- ment and the applied pipeline to retrieve the number densities can be found in (Gr¨ oller et al., 2015) and (Sandel et al., 2015). CO 2 and O 2 Number Densities Figure 1 shows the variability with solar longitude of the CO2 and O2 number densities (upper and middle panel) and the O2 mixing ratio (lower panel) at an alti- tude of 120 km. Each color represent a different stellar occultation campaign and the gray circles in the upper panel show the CO2 number densities from stellar occul- tations executed with SPICAM onboard Mars Express (Forget et al., 2009). The CO2 number densities inferred from IUVS stellar occultations show the same LS de- pendency as those from SPICAM, however, the average CO2 number density seems to be slightly lower. The O2 number densities show s similar LS variation as the CO2. Though the O2 mixing ratio shows a high variabil- ity with values between 2 and 7 × 10 -3 , the mean value is constant with solar longitude. Figure 1: Solar longitude dependency of the retrieved CO2 and O2 number density and the O2 mixing ratio at an altitude of 120 km. Each color represent a single stellar occultation campaign. In addition, the CO2 number densities from SPI- CAM/MEX stellar occultations shown in Forget et al. (2009) are included as gray circles in the upper panel.
Transcript of ATMOSPHERIC ABUNDANCES RETRIEVED FROM … ABUNDANCES RETRIEVED FROM IUVS/MAVEN STEL- ... S. Jain, J....

ATMOSPHERIC ABUNDANCES RETRIEVED FROM IUVS/MAVEN STEL-LAR OCCULTATIONS.
R. V. Yelle, H. Groller, T. Koskinen, Lunar and Planetary Laboratory, University of Arizona, Tucson, AZ, USA([email protected]), F. Montmessin, G. Lacombe, F. Lefevre, LATMOS, Universite Versailles Saint-Quentin /CNRS, Guyancourt, France, S. Jain, J. Deighan, N. M. Schneider, Laboratory for Atmospheric and Space Physics,University of Colorado, Boulder, CO, USA.
Introduction
We present CO2, O2, and O3 profiles observed with theImaging Ultraviolet Spectrograph (IUVS) on the MarsAtmosphere and Volatile EvolutioN (MAVEN) mission.The density profiles are derived from stellar occultationsin the FUV and the MUV wavelength range (Jakoskyet al., 2015; McClintock et al., 2014). The FUV channelis sensitive to CO2 and O2 while the MUV channel issensitive to CO2, O3, and clouds and aerosols. FUV oc-cultations can also detect high altitude clouds. Altitudesbetween around 90 km and 150 km are covered withthe FUV channel and from around 30 km up to 90 kmwith the MUV channel. After calculating the transmis-sion spectrum we apply a spectral inversion using theLevenberg-Marquardt least squares fitting algorithm toget the best fit. The line-of-sight column densities areinverted to determine local number densities using theTikhonov regularization scheme. A detailed descriptionof stellar occultations executed with the IUVS instru-ment and the applied pipeline to retrieve the numberdensities can be found in (Groller et al., 2015) and (Sandelet al., 2015).
CO2 and O2 Number Densities
Figure 1 shows the variability with solar longitude ofthe CO2 and O2 number densities (upper and middlepanel) and the O2 mixing ratio (lower panel) at an alti-tude of 120 km. Each color represent a different stellaroccultation campaign and the gray circles in the upperpanel show the CO2 number densities from stellar occul-tations executed with SPICAM onboard Mars Express(Forget et al., 2009). The CO2 number densities inferredfrom IUVS stellar occultations show the same LS de-pendency as those from SPICAM, however, the averageCO2 number density seems to be slightly lower. TheO2 number densities show s similar LS variation as theCO2. Though the O2 mixing ratio shows a high variabil-ity with values between 2 and 7× 10⁻³, the mean valueis constant with solar longitude.
10-10
10-9
10-8
10-7
CO
2 Num
ber D
ensity [k
g m−3]
N Spring Eq
uinox
N Sum
mer Solstice
N Autum
n Eq
uinox
N W
inter S
olstice
Aphelion at L
S = 71◦
Perih
elion at L
S = 251
◦
120 km
Campaign #1Campaign #3
Campaign #5Campaign #6
Campaign #7 SPICAM
10-13
10-12
10-11
10-10
O2 Num
ber D
ensity [k
g m−3]
N Spring Eq
uinox
N Sum
mer Solstice
N Autum
n Eq
uinox
N W
inter S
olstice
Aphelion at L
S = 71◦
Perih
elion at L
S = 251
◦
120 km
0 30 60 90 120 150 180 210 240 270 300 330 360Solar Longitude LS [ ◦ ]
10-4
10-3
10-2
10-1
O2 M
ixing Ratio
N Spring Eq
uinox
N Sum
mer Solstice
N Autum
n Eq
uinox
N W
inter S
olstice
Aphelion at L
S = 71◦
Perih
elion at L
S = 251
◦
120 km
Figure 1: Solar longitude dependency of the retrieved CO2
and O2 number density and the O2 mixing ratio at an altitudeof 120 km. Each color represent a single stellar occultationcampaign. In addition, the CO2 number densities from SPI-CAM/MEX stellar occultations shown in Forget et al. (2009)are included as gray circles in the upper panel.
Atmospheric Abundances retrieved from IUVS/MAVEN stellar occultations
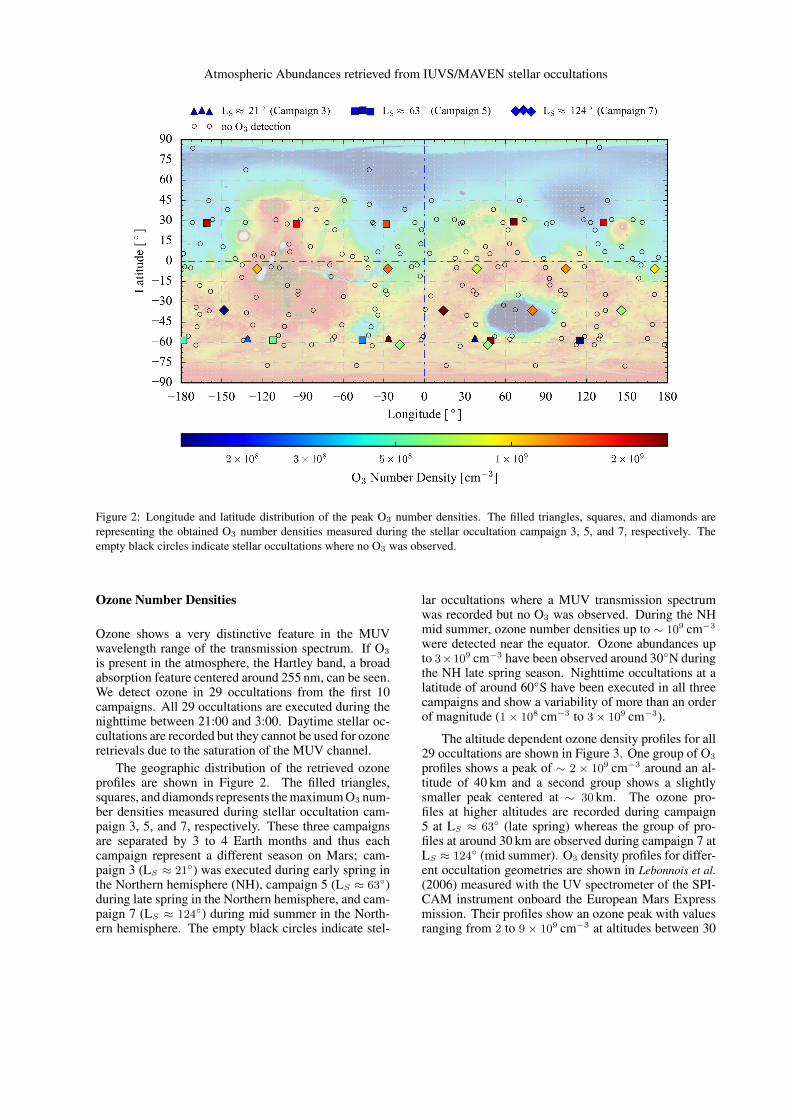
Figure 2: Longitude and latitude distribution of the peak O3 number densities. The filled triangles, squares, and diamonds arerepresenting the obtained O3 number densities measured during the stellar occultation campaign 3, 5, and 7, respectively. Theempty black circles indicate stellar occultations where no O3 was observed.
Ozone Number Densities
Ozone shows a very distinctive feature in the MUVwavelength range of the transmission spectrum. If O3
is present in the atmosphere, the Hartley band, a broadabsorption feature centered around 255 nm, can be seen.We detect ozone in 29 occultations from the first 10campaigns. All 29 occultations are executed during thenighttime between 21:00 and 3:00. Daytime stellar oc-cultations are recorded but they cannot be used for ozoneretrievals due to the saturation of the MUV channel.
The geographic distribution of the retrieved ozoneprofiles are shown in Figure 2. The filled triangles,squares, and diamonds represents the maximum O3 num-ber densities measured during stellar occultation cam-paign 3, 5, and 7, respectively. These three campaignsare separated by 3 to 4 Earth months and thus eachcampaign represent a different season on Mars; cam-paign 3 (LS ≈ 21◦) was executed during early spring inthe Northern hemisphere (NH), campaign 5 (LS ≈ 63◦)during late spring in the Northern hemisphere, and cam-paign 7 (LS ≈ 124◦) during mid summer in the North-ern hemisphere. The empty black circles indicate stel-
lar occultations where a MUV transmission spectrumwas recorded but no O3 was observed. During the NHmid summer, ozone number densities up to ∼ 109 cm−3
were detected near the equator. Ozone abundances upto 3×109 cm−3 have been observed around 30◦N duringthe NH late spring season. Nighttime occultations at alatitude of around 60◦S have been executed in all threecampaigns and show a variability of more than an orderof magnitude (1× 108 cm−3 to 3× 109 cm−3).
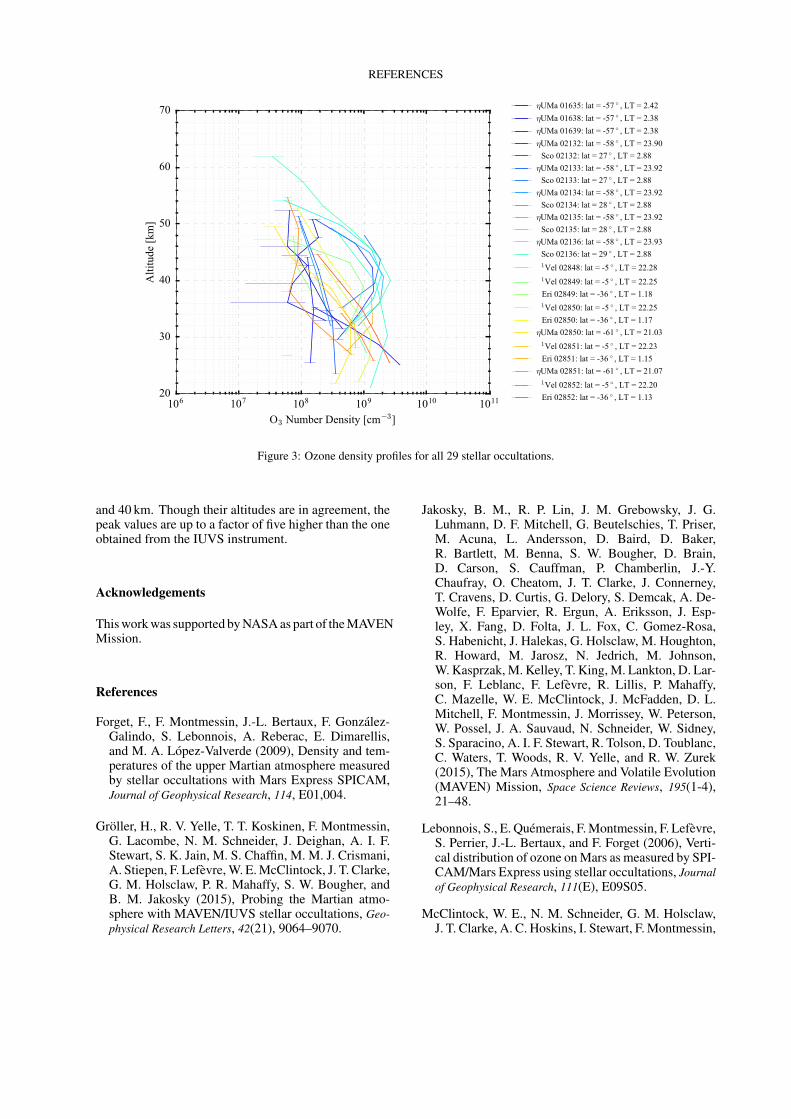
The altitude dependent ozone density profiles for all29 occultations are shown in Figure 3. One group of O3
profiles shows a peak of ∼ 2 × 109 cm−3 around an al-titude of 40 km and a second group shows a slightlysmaller peak centered at ∼ 30 km. The ozone pro-files at higher altitudes are recorded during campaign5 at LS ≈ 63◦ (late spring) whereas the group of pro-files at around 30 km are observed during campaign 7 atLS ≈ 124◦ (mid summer). O3 density profiles for differ-ent occultation geometries are shown in Lebonnois et al.(2006) measured with the UV spectrometer of the SPI-CAM instrument onboard the European Mars Expressmission. Their profiles show an ozone peak with valuesranging from 2 to 9 × 109 cm−3 at altitudes between 30
REFERENCES
106 107 108 109 1010 1011
O3 Number Density [cm−3]
20
30
40
50
60
70
Altitude [k
m]
ηUMa 01635: lat = -57 ◦ , LT = 2.42ηUMa 01638: lat = -57 ◦ , LT = 2.38ηUMa 01639: lat = -57 ◦ , LT = 2.38ηUMa 02132: lat = -58 ◦ , LT = 23.90κSco 02132: lat = 27 ◦ , LT = 2.88ηUMa 02133: lat = -58 ◦ , LT = 23.92κSco 02133: lat = 27 ◦ , LT = 2.88ηUMa 02134: lat = -58 ◦ , LT = 23.92κSco 02134: lat = 28 ◦ , LT = 2.88ηUMa 02135: lat = -58 ◦ , LT = 23.92κSco 02135: lat = 28 ◦ , LT = 2.88ηUMa 02136: lat = -58 ◦ , LT = 23.93κSco 02136: lat = 29 ◦ , LT = 2.88γ1Vel 02848: lat = -5 ◦ , LT = 22.28
γ1Vel 02849: lat = -5 ◦ , LT = 22.25αEri 02849: lat = -36 ◦ , LT = 1.18γ1Vel 02850: lat = -5 ◦ , LT = 22.25αEri 02850: lat = -36 ◦ , LT = 1.17ηUMa 02850: lat = -61 ◦ , LT = 21.03
γ1Vel 02851: lat = -5 ◦ , LT = 22.23αEri 02851: lat = -36 ◦ , LT = 1.15ηUMa 02851: lat = -61 ◦ , LT = 21.07
γ1Vel 02852: lat = -5 ◦ , LT = 22.20αEri 02852: lat = -36 ◦ , LT = 1.13
Figure 3: Ozone density profiles for all 29 stellar occultations.
and 40 km. Though their altitudes are in agreement, thepeak values are up to a factor of five higher than the oneobtained from the IUVS instrument.
Acknowledgements
This work was supported by NASA as part of the MAVENMission.
References
Forget, F., F. Montmessin, J.-L. Bertaux, F. Gonzalez-Galindo, S. Lebonnois, A. Reberac, E. Dimarellis,and M. A. Lopez-Valverde (2009), Density and tem-peratures of the upper Martian atmosphere measuredby stellar occultations with Mars Express SPICAM,Journal of Geophysical Research, 114, E01,004.
Groller, H., R. V. Yelle, T. T. Koskinen, F. Montmessin,G. Lacombe, N. M. Schneider, J. Deighan, A. I. F.Stewart, S. K. Jain, M. S. Chaffin, M. M. J. Crismani,A. Stiepen, F. Lefevre, W. E. McClintock, J. T. Clarke,G. M. Holsclaw, P. R. Mahaffy, S. W. Bougher, andB. M. Jakosky (2015), Probing the Martian atmo-sphere with MAVEN/IUVS stellar occultations, Geo-physical Research Letters, 42(21), 9064–9070.
Jakosky, B. M., R. P. Lin, J. M. Grebowsky, J. G.Luhmann, D. F. Mitchell, G. Beutelschies, T. Priser,M. Acuna, L. Andersson, D. Baird, D. Baker,R. Bartlett, M. Benna, S. W. Bougher, D. Brain,D. Carson, S. Cauffman, P. Chamberlin, J.-Y.Chaufray, O. Cheatom, J. T. Clarke, J. Connerney,T. Cravens, D. Curtis, G. Delory, S. Demcak, A. De-Wolfe, F. Eparvier, R. Ergun, A. Eriksson, J. Esp-ley, X. Fang, D. Folta, J. L. Fox, C. Gomez-Rosa,S. Habenicht, J. Halekas, G. Holsclaw, M. Houghton,R. Howard, M. Jarosz, N. Jedrich, M. Johnson,W. Kasprzak, M. Kelley, T. King, M. Lankton, D. Lar-son, F. Leblanc, F. Lefevre, R. Lillis, P. Mahaffy,C. Mazelle, W. E. McClintock, J. McFadden, D. L.Mitchell, F. Montmessin, J. Morrissey, W. Peterson,W. Possel, J. A. Sauvaud, N. Schneider, W. Sidney,S. Sparacino, A. I. F. Stewart, R. Tolson, D. Toublanc,C. Waters, T. Woods, R. V. Yelle, and R. W. Zurek(2015), The Mars Atmosphere and Volatile Evolution(MAVEN) Mission, Space Science Reviews, 195(1-4),21–48.
Lebonnois, S., E. Quemerais, F. Montmessin, F. Lefevre,S. Perrier, J.-L. Bertaux, and F. Forget (2006), Verti-cal distribution of ozone on Mars as measured by SPI-CAM/Mars Express using stellar occultations, Journalof Geophysical Research, 111(E), E09S05.
McClintock, W. E., N. M. Schneider, G. M. Holsclaw,J. T. Clarke, A. C. Hoskins, I. Stewart, F. Montmessin,
REFERENCES
R. V. Yelle, and J. Deighan (2014), The Imaging Ultra-violet Spectrograph (IUVS) for the MAVEN Mission,Space Science Reviews, 1–50.
Sandel, B. R., H. Groller, R. V. Yelle, T. T. Koski-
nen, N. K. Lewis, J.-L. Bertaux, F. Montmessin, andE. Quemerais (2015), Altitude profiles of O2 on Marsfrom SPICAM stellar occultations, Icarus, 252, 154–160.