Genome-wide differential expression of genes and small ... · Mapping of clean RNA-seq reads on the...
20
Supplementary Information for: Genome-wide differential expression of genes and small RNAs in testis of two different porcine breeds and at two different ages Yao Li 1 , Jialian Li 1,2 , Chenchi Fang 1 , Liang Shi 3 , Jiajian Tan 3 , Yuanzhu Xiong 1 , Bin Fan 1,2 , Changchun Li 1* 1 Key Lab of Agriculture Animal Genetics, Breeding, and Reproduction of Ministry of Education, College of Animal Science and Technology, Huazhong Agricultural University, Wuhan, 430070, People's Republic of China; 2 Guangxi Yangxiang Pig Gene Technology limited Company, Guigang, 537120, People's Republic of China; 3 Guangxi Yangxiang Incorporated Company, Guigang, 537100, People's Republic of China. *the corresponding author (email: [email protected]) Supplementary files note: supplementary Figures S1-10 and supplementary Tables S1-10, S13-15, S19, S23. The following supplementary material is available: Supplementary Figure S1. RNA mapping distribution.
Transcript of Genome-wide differential expression of genes and small ... · Mapping of clean RNA-seq reads on the...

Supplementary Information for:
Genome-wide differential expression of genes and small RNAs in testis of two
different porcine breeds and at two different ages
Yao Li1, Jialian Li1,2, Chenchi Fang1, Liang Shi3, Jiajian Tan3, Yuanzhu Xiong1, Bin Fan1,2, Changchun Li1*
1Key Lab of Agriculture Animal Genetics, Breeding, and Reproduction of Ministry of Education, College of Animal
Science and Technology, Huazhong Agricultural University, Wuhan, 430070, People's Republic of China; 2Guangxi
Yangxiang Pig Gene Technology limited Company, Guigang, 537120, People's Republic of China; 3Guangxi
Yangxiang Incorporated Company, Guigang, 537100, People's Republic of China.
*the corresponding author (email: [email protected])
Supplementary files note: supplementary Figures S1-10 and supplementary Tables S1-10, S13-15, S19, S23.
The following supplementary material is available:
Supplementary Figure S1. RNA mapping distribution.

The first row: LW1-a, LW2-a, LW3-a; the second row: LW1-b, LW2-b, LW3-b; the third row: LC1-a, LC1-a, LC1-a; the
last row: LC1-b, LC1-b, LC1-b. (LW: Large White , LC: Lu Chuan; a: mature testis, b: immature testis)
Supplementary Figure S2. Correlation analyses of the gene expression between paired samples.
Supplementary Figure S3. Cluster analysis of gene expression of samples.

Immature and mature testicular tissue samples gather together, respectively, but the uniformity is poorer in
mature testes (a) than immature testes (b), which can been seen in LC3-a and LW1-a.
Supplementary Figure S4. GO term of inter-breed comparison of DEGs.

The Top 20 GO (biological process) Term analyses of DEGs of LC_a vs LW_a and LC_b vs LW_b.
Supplementary Figure S5. Correlation analyses of the miRNA expression between paired samples.
Supplementary Figure S6. Novel miRNAs in mature (a) and immature (b) testes.
Supplementary Figure S7a. FI network of TDETGs in LW pigs in within-breed comparisons.

The effect of the interaction is represented by arrows, bar-headed lines, straight line and imaginary line. "->" for
activating/catalyzing, "-|" for inhibition, "-" for FIs extracted from complexes or inputs, and "---" for predicted FIs.
Supplementary Figure S7b. FI network of TDETGs in LC pigs in within-breed comparisons.

Supplementary Figure S7c. FI network of TDETGs in inter-breed comparison at maturity stage.
Supplementary Figure S8a. miRNA–mRNA–piRNA integrated network in LC pigs.

Comparison between after and before sexual maturity in inner-breed. DDU: down-regulated piRNA and
down-regulated mRNA and up-regulated miRNA, UDU: up-regulated piRNA and down-regulated mRNA and
up-regulated miRNA. "->" for activating, "-|" for inhibition.
Supplementary Figure S8b. miRNA–mRNA–piRNA integrated network in LW pigs.
Comparison between after and before sexual maturity in inner-breed. DDU: down-regulated piRNA and

down-regulated mRNA and up-regulated miRNA, UDU: up-regulated piRNA and down-regulated mRNA and
up-regulated miRNA, UUD: up-regulated piRNA and up-regulated mRNA and down-regulated miRNA. "->" for
activating, "-|" for inhibition.
Supplementary Figure S9. Biological process of integrated network of RNA and miRNA. Analyses depend on
inner-breed comparison, and results are in both LW and LC pigs.
Supplementary Figure S10. Integrated network analysis of RNA and miRNA in inter-breed.

The results only represent the network in inter-breed comparison at maturity.
Supplementary Table S1. Obtain the high-quality RNA clean reads
Sample Raw data Clean reads
LW1-a 2438162 2246841(92.15%)
LW2-a 2448939 2218752(90.60%)
LW3-a 3367069 3089913(91.77%)
LC1-a 4512122 4159869(92.19%)
LC2-a 2837099 2615279(92.18%)
LC3-a 4332083 3989819(92.10%)
LW1-b 3411905 2317171(67.91%)
LW2-b 3395784 2363920(69.61%)
LW3-b 3179151 2224767(69.98%)
LC1-b 3077475 2159918(70.18%)
LC2-b 2498815 1728193(69.16%)
LC3-b 2770407 1970250(71.12%)
Supplementary Table S2. Mapping of clean RNA-seq reads on the Sus scrofa’s genome
Sample Clean reads Total mapped Unique mapped Multiple mapped
LW1-a 2246841 1907758(84.91%) 1723410(90.34%) 184348(9.66%)
LW2-a 2218752 1835106(82.71%) 1650903(89.96%) 184203(10.04%)
LW3-a 3089913 2600459(84.16%) 2345938(90.21%) 254521(9.79%)

LC1-a 4159869 3556881(85.50%) 3219265(90.51%) 337616(9.49%)
LC2-a 2615279 2215327(84.71%) 2012503(90.84%) 202824(9.16%)
LC3-a 398919 3398838(85.19%) 3077310(90.54%) 321528(9.46%)
LW1-b 2317171 1857687(80.17%) 1633535(87.93%) 224152(12.07%)
LW2-b 2363920 1999660(84.59%) 1754792(87.75%) 244868(12.25%)
LW3-b 2224767 1878919(84.45%) 1658473(88.27%) 220446(11.73%)
LC1-b 2159918 1736211(80.38%) 1520925(87.60%) 215286(12.40%)
LC2-b 1728193 1378546(79.77%) 1220488(88.53%) 158058(11.47%)
LC3-b 1970250 1557523(79.05%) 1371784(88.07%) 185739(11.93%)
Total mapped% = Total mapped/ Clean reads; Total mapped: clean reads mapped on the Sus scrofa's genome;
Unique mapped% = Unique mapped/ Total mapped; Unique mapped: reads mapped only one region to the
reference genome;
Multiple mapped% = Multiple mapped/ Total mapped; Multiple mapped: reads mapped more than one region to
the reference genome.
Supplementary Table S3. Mapped reads on expressed genes
Sample Total genes in Sus
scrofa’s genome
Expressed genes (mapped
reads number>0)
Expressed genes (mapped
reads number>10)
LW1-a 26235 16845(64.21%) 9766(57.98%)
LW2-a 26235 16849(64.22%) 9671(57.40%)
LW3-a 26235 17658(67.31%) 11152(63.16%)
LC1-a 26235 18286(69.70% 12130(66.33%)
LC2-a 26235 17445(66.50%) 10837(62.12%)
LC3-a 26235 17980(68.53%) 11560(64.29%)
LW1-b 26235 17262(65.80%) 9690(56.13%)
LW2-b 26235 17587(67.04%) 10062(57.21%)
LW3-b 26235 17573(66.98%) 10116(57.57%)
LC1-b 26235 17771(67.74%) 10238(57.61%)
LC2-b 26235 17010(64.84%) 9114(53.58%)
LC3-b 26235 17272(65.84%) 9374(54.27%)
Expressed genes (mapped reads number> 0): This column is the number of expressed gene and the proportion of
the total genes of pig genome;
Expressed genes (mapped reads number> 10): This column list the number of mapped reads number> 10 and the

proportion of mapped reads number> 10 to mapped reads number> 0
Supplementary Table S4. Obtain the high-quality sRNA clean reads
Sample Raw data Clean reads
LW1-a 9637482 8475007(87.94%)
LW2-a 6833191 6677570(97.72%)
LW3-a 6850400 6297075(91.92%)
LC1-a 11565119 11268970(97.44%)
LC2-a 2324114 2072267(89.16%)
LC3-a 5528729 5062403(91.57%)
LW1-b 5758978 3845999(66.78%)
LW2-b 6550138 5493010(83.86%)
LW3-b 5820998 3783088(64.99%)
LC1-b 6123056 4127967(67.42%)
LC2-b 6179004 3404493(55.10%)
LC3-b 4705610 4197678(89.21%)
Supplementary Table S5. Mapping of sRNA clean reads on the Sus scrofa’s genome
Sample Clean reads Total mapped Unique mapped Multiple mapped
LW1-a 8475007 7891818(93.12%) 5678414(71.95%) 2213404(28.05%)
LW2-a 6677570 6205609(92.93%) 4536239(73.10%) 1669370(26.90%)
LW3-a 6297075 5757759(91.44%) 4465332(77.55%) 1292427(22.45%)
LC1-a 11268970 10488082(93.07%) 8666805(82.63%) 1821277(17.37%)
LC2-a 2072267 1971506(95.14%) 1551348(78.69%) 420158(21.31%)
LC3-a 5062403 4759252(94.01%) 3817784(80.22%) 941468(19.78%)
LW1-b 3845999 3458534(89.93%) 2790978(80.70%) 667556(19.30%)
LW2-b 5493010 5110836(93.04%) 3562361(69.70%) 1548475(30.30%)
LW3-b 3783088 3465021(91.59%) 2708148(78.16%) 756873(21.84%)
LC1-b 4127967 3621892(87.74%) 2973537(82.10%) 648355(17.90%)
LC2-b 3404493 2887427(84.81%) 2187424(75.76%) 700003(24.24%)
LC3-b 4197678 3939476(93.85%) 2810665(71.35%) 1128811(28.65%)
Total mapped% = Total mapped/ Clean reads;Total mapped: clean reads mapped on the Sus scrofa's genome;
Unique mapped% = Unique mapped/ Total mapped; Unique mapped: reads mapped only one region to the
reference genome;
Multiple mapped% = Multiple mapped/ Total mapped; Multiple mapped: reads mapped more than one region to
the reference genome.
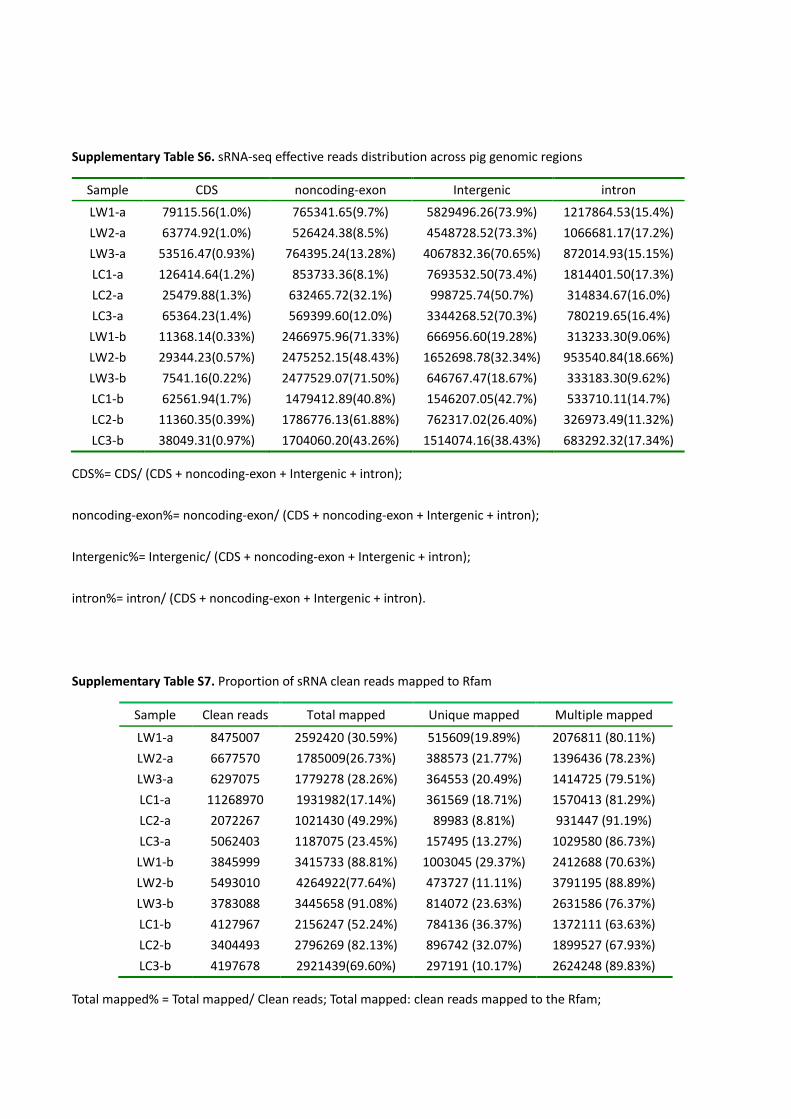
Supplementary Table S6. sRNA-seq effective reads distribution across pig genomic regions
Sample CDS noncoding-exon Intergenic intron
LW1-a 79115.56(1.0%) 765341.65(9.7%) 5829496.26(73.9%) 1217864.53(15.4%)
LW2-a 63774.92(1.0%) 526424.38(8.5%) 4548728.52(73.3%) 1066681.17(17.2%)
LW3-a 53516.47(0.93%) 764395.24(13.28%) 4067832.36(70.65%) 872014.93(15.15%)
LC1-a 126414.64(1.2%) 853733.36(8.1%) 7693532.50(73.4%) 1814401.50(17.3%)
LC2-a 25479.88(1.3%) 632465.72(32.1%) 998725.74(50.7%) 314834.67(16.0%)
LC3-a 65364.23(1.4%) 569399.60(12.0%) 3344268.52(70.3%) 780219.65(16.4%)
LW1-b 11368.14(0.33%) 2466975.96(71.33%) 666956.60(19.28%) 313233.30(9.06%)
LW2-b 29344.23(0.57%) 2475252.15(48.43%) 1652698.78(32.34%) 953540.84(18.66%)
LW3-b 7541.16(0.22%) 2477529.07(71.50%) 646767.47(18.67%) 333183.30(9.62%)
LC1-b 62561.94(1.7%) 1479412.89(40.8%) 1546207.05(42.7%) 533710.11(14.7%)
LC2-b 11360.35(0.39%) 1786776.13(61.88%) 762317.02(26.40%) 326973.49(11.32%)
LC3-b 38049.31(0.97%) 1704060.20(43.26%) 1514074.16(38.43%) 683292.32(17.34%)
CDS%= CDS/ (CDS + noncoding-exon + Intergenic + intron);
noncoding-exon%= noncoding-exon/ (CDS + noncoding-exon + Intergenic + intron);
Intergenic%= Intergenic/ (CDS + noncoding-exon + Intergenic + intron);
intron%= intron/ (CDS + noncoding-exon + Intergenic + intron).
Supplementary Table S7. Proportion of sRNA clean reads mapped to Rfam
Sample Clean reads Total mapped Unique mapped Multiple mapped
LW1-a 8475007 2592420 (30.59%) 515609(19.89%) 2076811 (80.11%)
LW2-a 6677570 1785009(26.73%) 388573 (21.77%) 1396436 (78.23%)
LW3-a 6297075 1779278 (28.26%) 364553 (20.49%) 1414725 (79.51%)
LC1-a 11268970 1931982(17.14%) 361569 (18.71%) 1570413 (81.29%)
LC2-a 2072267 1021430 (49.29%) 89983 (8.81%) 931447 (91.19%)
LC3-a 5062403 1187075 (23.45%) 157495 (13.27%) 1029580 (86.73%)
LW1-b 3845999 3415733 (88.81%) 1003045 (29.37%) 2412688 (70.63%)
LW2-b 5493010 4264922(77.64%) 473727 (11.11%) 3791195 (88.89%)
LW3-b 3783088 3445658 (91.08%) 814072 (23.63%) 2631586 (76.37%)
LC1-b 4127967 2156247 (52.24%) 784136 (36.37%) 1372111 (63.63%)
LC2-b 3404493 2796269 (82.13%) 896742 (32.07%) 1899527 (67.93%)
LC3-b 4197678 2921439(69.60%) 297191 (10.17%) 2624248 (89.83%)
Total mapped% = Total mapped/ Clean reads; Total mapped: clean reads mapped to the Rfam;

Unique mapped% = Unique mapped/ Total mapped; Unique mapped: reads mapped only one region to the Rfam;
Multiple mapped% = Multiple mapped/ Total mapped; Multiple mapped: reads mapped more than one region to
the Rfam.
Supplementary Table S8. Rfam classification.
Type LW1-a LW2-a LW3-a LC1-a LC2-a LC3-a LW1-b LW2-b LW3-b LC1-b LC2-b LC3-b
Cisreg 24925 8156 8709 8363 5693 10192 3525 17830 1734 4657 2659 11165
0.96% 0.46% 0.49% 0.43% 0.56% 0.86% 0.10% 0.42% 0.05% 0.22% 0.10% 0.38%
lncRNA 10290 3169 4602 3647 2390 4313 925 5316 607 1634 1391 4022
0.40% 0.18% 0.26% 0.19% 0.23% 0.36% 0.03% 0.12% 0.02% 0.08% 0.05% 0.14%
miRNA 1129235 761621 1070490 1233916 841206 809523 3291679 3679088 3351574 2010638 2679873 2589648
43.56% 42.67% 60.16% 63.87% 82.36% 68.19% 96.37% 86.26% 97.27% 93.25% 95.84% 88.64%
rRNA 104842 48369 70645 142081 51054 66996 23450 97680 13145 22908 18195 43834
4.04% 2.71% 3.97% 7.35% 5.00% 5.64% 0.69% 2.29% 0.38% 1.06% 0.65% 1.50%
sRNA 5596 1832 1594 2162 2056 2527 658 7796 280 683 416 2761
0.22% 0.10% 0.09% 0.11% 0.20% 0.21% 0.02% 0.18% 0.01% 0.03% 0.01% 0.09%
snRNA 162407 62647 109223 86962 28852 57000 48943 169480 29435 50853 45576 86650
6.26% 3.51% 6.14% 4.50% 2.82% 4.80% 1.43% 3.97% 0.85% 2.36% 1.63% 2.97%
tRNA 1025018 859155 451477 395774 60357 186347 35592 192118 41975 48511 37929 104035
39.54% 48.13% 25.37% 20.49% 5.91% 15.70% 1.04% 4.50% 1.22% 2.25% 1.36% 3.56%
Others 130107 40060 62538 59077 29822 50177 10961 95614 6908 16363 10230 79324
5.02% 2.24% 3.51% 3.06% 2.92% 4.23% 0.32% 2.24% 0.20% 0.76% 0.37% 2.72%
The percentage is the ratio of each type in the total types.
All reads which could be aligned to Rfam database were counted by the type of ncRNA in Rfam, the percentage
was the ration that the reads of each sample could be matched to the ncRNA compare to the reads of each sample
could matched to the Rfam.
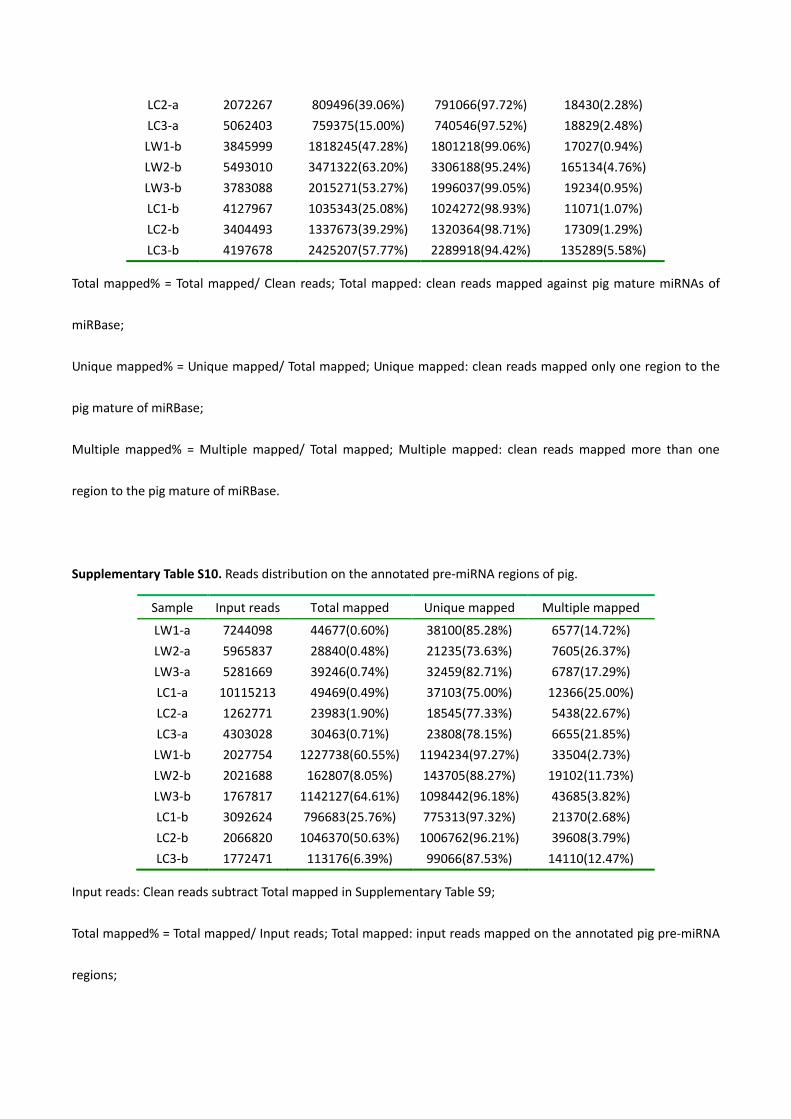
Supplementary Table S9. Clean reads mapping to mature miRNAs of pig miRBase.
Sample Clean reads Total mapped Unique mapped Multiple mapped
LW1-a 8475007 1050909(12.40%) 1027582(97.78%) 23327(2.22%)
LW2-a 6677570 711733(10.66%) 690032(96.95%) 21701(3.05%)
LW3-a 6297075 1015406(16.13%) 992016(97.70%) 23390(2.30%)
LC1-a 11268970 1153757(10.24%) 1113588(96.52%) 40169(3.48%)
LC2-a 2072267 809496(39.06%) 791066(97.72%) 18430(2.28%)
LC3-a 5062403 759375(15.00%) 740546(97.52%) 18829(2.48%)
LW1-b 3845999 1818245(47.28%) 1801218(99.06%) 17027(0.94%)
LW2-b 5493010 3471322(63.20%) 3306188(95.24%) 165134(4.76%)
LW3-b 3783088 2015271(53.27%) 1996037(99.05%) 19234(0.95%)
LC1-b 4127967 1035343(25.08%) 1024272(98.93%) 11071(1.07%)
LC2-b 3404493 1337673(39.29%) 1320364(98.71%) 17309(1.29%)
LC3-b 4197678 2425207(57.77%) 2289918(94.42%) 135289(5.58%)
Total mapped% = Total mapped/ Clean reads; Total mapped: clean reads mapped against pig mature miRNAs of
miRBase;
Unique mapped% = Unique mapped/ Total mapped; Unique mapped: clean reads mapped only one region to the
pig mature of miRBase;
Multiple mapped% = Multiple mapped/ Total mapped; Multiple mapped: clean reads mapped more than one
region to the pig mature of miRBase.
Supplementary Table S10. Reads distribution on the annotated pre-miRNA regions of pig.
Sample Input reads Total mapped Unique mapped Multiple mapped
LW1-a 7244098 44677(0.60%) 38100(85.28%) 6577(14.72%)
LW2-a 5965837 28840(0.48%) 21235(73.63%) 7605(26.37%)
LW3-a 5281669 39246(0.74%) 32459(82.71%) 6787(17.29%)
LC1-a 10115213 49469(0.49%) 37103(75.00%) 12366(25.00%)
LC2-a 1262771 23983(1.90%) 18545(77.33%) 5438(22.67%)
LC3-a 4303028 30463(0.71%) 23808(78.15%) 6655(21.85%)
LW1-b 2027754 1227738(60.55%) 1194234(97.27%) 33504(2.73%)
LW2-b 2021688 162807(8.05%) 143705(88.27%) 19102(11.73%)
LW3-b 1767817 1142127(64.61%) 1098442(96.18%) 43685(3.82%)
LC1-b 3092624 796683(25.76%) 775313(97.32%) 21370(2.68%)
LC2-b 2066820 1046370(50.63%) 1006762(96.21%) 39608(3.79%)
LC3-b 1772471 113176(6.39%) 99066(87.53%) 14110(12.47%)
Input reads: Clean reads subtract Total mapped in Supplementary Table S9;
Total mapped% = Total mapped/ Input reads; Total mapped: input reads mapped on the annotated pig pre-miRNA
regions;

Unique mapped% = Unique mapped/ Total mapped; Unique mapped: input reads mapped only one region to the
pig pre-miRNA regions;
Multiple mapped% = Multiple mapped/ Total mapped; Multiple mapped: input reads mapped more than one
region to the pig pre-miRNA regions.
Supplementary Table S13. Statistical analyses of expressed mature miRNA and pre-miRNA.
mature miRNA
pre-miRNA
Sample TPM>0 TPM>10
TPM>0 TPM>10
LW1-a 269 209
264 264
LW2-a 268 228
240 240
LW3-a 259 211
237 237
LC1-a 277 232
253 243
LC2-a 250 196
222 222
LC3-a 247 198
245 245
LW1-b 261 177
257 179
LW2-b 288 218
266 253
LW3-b 242 169
247 178
LC1-b 253 181
256 191
LC2-b 257 186
258 190
LC3-b 282 223
260 247
TPM: transcripts per million, TPM(miRNA) = reads(miRNA) /total reads *10^6.
Supplementary Table S14. DE miRNAs in pig breeds
within-breed comparison
inter-breed comparison
Large White
Lu Chuan
Mature
Immature
LW-a vs LW-b
Up DE
miRNAs
LW-a vs LW-b
Down DE
miRNAs
LC-a vs LC-b
Up DE
miRNAs
LC-a vs LC-b
Down DE
miRNAs
LW-a vs
LC-a Up DE
miRNAs
LW-a vs
LC-a Down
DE miRNAs
LW-b vs
LC-b Up DE
miRNAs
LW-b vs
LC-b Down
DE miRNAs
(37) (17)
(20) (23)
(2) (1)
(0) (1)
miR-1 let-7f
miR-1271 let-7f
miR-1249 miR-31
miR-34c
miR-101 miR-10b
miR-133a-3p miR-10b
miR-196a
miR-1249 miR-148a-3p
miR-143-5p miR-124a
miR-129a miR-181a
miR-145-5p miR-127
miR-129b miR-181d-5p
miR-153 miR-148a-3p
miR-133a-3p miR-184
miR-190a miR-149

miR-133a-5p miR-194b-5p
miR-205 miR-181a
miR-133b miR-199a-5p
miR-21 miR-181d-5p
miR-135 miR-221-3p
miR-218 miR-184
miR-143-5p miR-221-5p
miR-218-5p miR-194b-5p
miR-145-5p miR-301
miR-22-3p miR-199a-5p
miR-153 miR-361-5p
miR-29c miR-206
miR-183 miR-362
miR-31 miR-214
miR-1839-5p miR-370
miR-34c miR-221-5p
miR-190a miR-376a-5p
miR-3613 miR-27b-5p
miR-190b miR-450c-5p
miR-486 miR-301
miR-192 miR-542-3p
miR-628 miR-361-5p
miR-193a-3p
miR-9 miR-362
miR-196b
miR-9-1 miR-370
miR-196b-5p
miR-9-2 miR-376a-5p
miR-205
miR-450c-3p
miR-217
miR-450c-5p
miR-218
miR-542-3p
miR-218-5p
miR-218b
miR-299
miR-29a
miR-29c
miR-34c
miR-3613
miR-421-5p
miR-4336
miR-493-3p
miR-582
miR-9
miR-9-1
miR-9-2
Note: The red markers represent co-expressed up-regulated DE miRNAs and the green markers represent
co-expressed down-regulated DE miRNAs in LC and LW pig
Supplementary Table S15. Novel miRNAs
LW-b LC-b LW-a LC-a
NC_010461.4_33692 NC_010461.4_33692 NC_010451.3_32832 NC_010451.3_32832
NC_010461.4_34341 NC_010461.4_34341 NC_010461.4_34341 NC_010461.4_34341
NC_010461.4_34356 NC_010461.4_34356 NC_010461.4_34356 NC_010461.4_34356
NC_010461.4_34336 NC_010461.4_34336 NC_010461.4_34332 NC_010461.4_33692

NC_010461.4_34344 NC_010461.4_34344 NC_010461.4_33692 NC_010461.4_34332
NC_010447.4_21912 NC_010444.3_16017 NC_010461.4_34336 NC_010461.4_34336
NC_010445.3_17465 NC_010451.3_32832 NC_010461.4_34344 NC_010461.4_34344
NC_010461.4_34360 NC_010461.4_34332 NC_010461.4_34354 NC_010445.3_17465
NC_010461.4_34354 NC_010445.3_17465 NC_010461.4_34360 NC_010447.4_21912
NC_010461.4_34366 NC_010461.4_34360 NC_010461.4_34366 NC_010461.4_34354
NC_010461.4_34332 NC_010461.4_34366 NC_010445.3_17465 NC_010461.4_34366
NC_010451.3_32832 NC_010461.4_34354 NC_010450.3_31375 NC_010461.4_34360
NW_003537647.2_34962 NC_010447.4_21912 NC_010444.3_16017 NC_010450.3_31375
NW_003539007.1_35808 NW_003539007.1_35808 NC_010454.3_1921 NC_010454.3_1921
NC_010451.3_33131 NC_010450.3_31375 NC_010447.4_21912 NC_010444.3_16017
NC_010444.3_15468 NC_010444.3_15468 NW_003537647.2_34962 NW_003537647.2_34962
NW_003613308.1_35776 NW_003613308.1_35776 NC_010456.4_6619 NC_010445.3_17469
NC_010456.4_6619 NC_010456.4_6619 NC_010451.3_33131 NC_010451.3_33131
NW_003541201.1_37278 NC_010451.3_33131 NC_010445.3_17741 NC_010456.4_6619
NC_010450.3_31375 NC_010454.3_1921 NC_010445.3_17469 NC_010451.3_33218
NC_010461.4_33630 NW_003541201.1_37278 NW_003539007.1_35812 NC_010458.3_9500
NC_010454.3_1921 NW_003537647.2_34962 NC_010461.4_34362 NC_010461.4_34362
NC_010445.3_17469 NC_010455.4_3901 NC_010447.4_22737 NC_010461.4_33769
NC_010448.3_23529 NC_010461.4_33630 NC_010445.3_18048 NC_010445.3_18048
NC_010458.3_9500 NC_010449.4_26094 NC_010445.3_17585 NC_010458.3_9717
NC_010445.3_18466 NW_003613164.1_35268 NW_003541201.1_37278 NC_010461.4_33630
NC_010453.4_1281 NW_003539007.1_35812 NC_010458.3_9717 NW_003613233.1_35475
NC_010453.4_1283 NC_010445.3_17469 NW_003613233.1_35475 NC_010447.4_22737
NC_010454.3_2163 NC_010453.4_1281 NC_010449.4_26094 NW_003541201.1_37278
NC_010455.4_3927 NC_010453.4_1283 NW_003613164.1_35268 NC_010445.3_18466
NW_003541037.1_37122 NC_010447.4_22737 NC_010458.3_9500 NC_010449.4_26094
NC_010452.3_815 NC_010451.3_33218 NC_010444.3_15340 NW_003613164.1_35268
NC_010452.3_817 NC_010445.3_17741 NC_010445.3_18466 NC_010455.4_4737
NC_010445.3_17585 NC_010445.3_18192 NC_010461.4_33630 NC_010445.3_17741
NC_010455.4_3901 NC_010450.3_31798 NC_010445.3_18465 NC_010444.3_15340
NW_003539007.1_35812 NC_010458.3_9717 NC_010448.3_23529 NC_010455.4_3901
NC_010445.3_18048 NC_010461.4_33705 NC_010461.4_33769 NC_010448.3_24453
NC_010451.3_33218 NW_003613233.1_35475 NC_010461.4_34346 NC_010448.3_23529
NC_010444.3_15340 NC_010461.4_34362 NW_003540104.2_36305 NW_003539007.1_35812
NC_010461.4_34362 NC_010461.4_34346 NC_010444.3_15530 NC_010447.4_22444
NC_010461.4_34346 NC_010445.3_18048 NC_010445.3_17996 NC_010461.4_33447
NC_010451.3_32298 NC_010448.3_23529 NC_010454.3_1960 NW_003613252.1_35533
NC_010451.3_32967 NC_010458.3_9500 NC_010444.3_15468 NC_010444.3_15530
NC_010461.4_33769 NC_010461.4_33699 NC_010446.4_19989 NC_010446.4_19989
NC_010444.3_15530 NC_010461.4_33769 NC_010446.4_19991 NC_010446.4_19991
NC_010445.3_18465 NC_010444.3_15340 NC_010446.4_19995 NC_010446.4_19995
NC_010445.3_18692 NC_010445.3_18465 NC_010447.4_22330 NC_010443.4_14695
NC_010446.4_19989 NC_010445.3_18466 NC_010451.3_32298 NC_010447.4_22330

NC_010446.4_19991 NC_010445.3_18692 NC_010451.3_32967 NC_010454.3_2164
NC_010446.4_19995 NC_010447.4_21208 NC_010461.4_33705 NC_010456.4_7944
NC_010455.4_4477 NC_010455.4_2919 NW_003541037.1_37122 NC_010458.3_9718
NC_010456.4_6570 NC_010455.4_4477 NW_003613073.1_34900 NC_010461.4_34346
NC_010461.4_33638 NC_010456.4_7944 NW_003613308.1_35776 NW_003613073.1_34900
NC_010461.4_33705 NC_010461.4_33638 NC_010444.3_15371 NW_003613233.1_35476
NW_003540104.2_36305 NW_003541037.1_37122 NC_010448.3_25494 NC_010451.3_32298
NW_003613497.1_36815
NC_010455.4_3901 NC_010451.3_32967
NC_010461.4_33638 NC_010445.3_18465
NC_010443.4_11897 NC_010447.4_22319
NC_010447.4_22319 NC_010448.3_23540
NC_010447.4_22416 NC_010448.3_23542
NC_010448.3_23540 NW_003539007.1_35808
NC_010448.3_23542
NC_010448.3_25577
NC_010455.4_3927
NC_010455.4_4477
NC_010456.4_6437
NC_010456.4_7944
NC_010457.4_8785
NC_010461.4_33483
NC_010461.4_34358
NW_003539007.1_35808
NC_010447.4_22444
NC_010451.3_33218
TPM: transcripts per million; TPM(miRNA) = reads(miRNA) /total reads *10^6.
Supplementary Table S19. Total number of DE miRNA targets overlap with DEGs. TDETGs: the true differential
expression target genes come from the results that the target genes of DE miRNAs and the DEGs overlapped.
DE miRNA
sample
Down miRNA
target Gene NO.
Up miRNA target
Gene NO.
Total
TDETGs
within-breed comparison
LW-a vs LW-b 1612 2029 3641
LC-a vs LC-b 1697 1146 2843
inter-breed comparison
LW-a vs LC-a 21 71 92
LW-b vs LC-b 37 0 37

Supplementary Table S23. Primers for Real-time quantitative PCR of differential gene and miRNA
gene or miRNA
Name Primer Primer sequence(5’→3’)
Product
Length(bp) TM(℃)
CCNI CCNI-F CAAACCAGAAGTGCCAGTCA
127 60
CCNI-R CCCGTCATAGAAGTCATCCA
SPATA24 SPATA24-F CCAGAAGCAGCAGGAGAACT
129 60 SPATA24-R ATAACGGGAAGGCGACAAC
KHDRBS3 KHDRBS3-F CCTACGGACAAGAGGAGTGG
140 60 KHDRBS3-R GGACTGGTGGAGAGTGGCTA
TSGA10 TSGA10-F TAGGGACGGAGAGGTTTGAA
127 60 TSGA10-R GCTCGTTCTGGTGAGTGACA
GGNBP2 GGNBP2-F AAGGGAGCAGTAGCAGTGTCA
140 60 GGNBP2-R GTCCATCCAACAACCTCTGG
COL6A2 COL6A2-F CCCAACTCCCAAGTGTCTGT
131 60 COL6A2-R AGCCCAAAGCCAACCAAG
CD34 CD34-F CTCCCTCATCTTCCCTCTGA
142 60 CD34-R GAGTCCAGTTCCAGCCTCTG
ssc-RPL32 ssc-RPL32-F CGGAAGTTTCTGGTACACAATGTAA
96 60 ssc-RPL32-R TGGAAGAGACGTTGTGAGCAA
ssc-miR-301 ssc-miR-301-RT GTCGTATCCAGTGCAGGGTCCGAGGTATTCGCACTGGATACGACGCTTTG
72 60 ssc-miR-301-F GCGGCGGCAGTCCAATAGTATTG
ssc-miR-194b-5p ssc-miR-194b-5p-RT GTCGTATCCAGTGCAGGGTCCGAGGTATTCGCACTGGATACGACTCCACA
74 60 ssc-miR-194b-5p-F GCGGCGGTGTAACAGCGACTCC
ssc-miR-10b ssc-miR-10b-RT GTCGTATCCAGTGCAGGGTCCGAGGTATTCGCACTGGATACGACACAAAT
74 60 ssc-miR-10b-F GCGGCGGTACCCTGTAGAACCG
ssc-miR-148a-3p ssc-miR-148a-3p-RT GTCGTATCCAGTGCAGGGTCCGAGGTATTCGCACTGGATACGACACAAAG
78 60 ssc-miR-148a-3p-F GCGGCGGTCAGTGCACTACAGAAC
ssc-miR-181d-5p ssc-miR-181d-5p-RT GTCGTATCCAGTGCAGGGTCCGAGGTATTCGCACTGGATACGACAACCCA
70 60 ssc-miR-181d-5p-F GCGGCGGAACATTCATTGTTGTC
ssc-miR-181a ssc-miR-181a-RT GTCGTATCCAGTGCAGGGTCCGAGGTATTCGCACTGGATACGACAACTCA
74 60 ssc-miR-181a-F GCGGCGGAACATTCAACGCTGTC
ssc-miR-133a-3p ssc-miR-133a-3p-RT GTCGTATCCAGTGCAGGGTCCGAGGTATTCGCACTGGATACGACCAGCTG
74 60 ssc-miR-133a-3p-F GCGGCGGTTGGTCCCCTTCAAC
ssc-miR-145-5p ssc-miR-145-5p-RT GTCGTATCCAGTGCAGGGTCCGAGGTATTCGCACTGGATACGACAAGGGA
74 60 ssc-miR-145-5p-F GCGGCGGGTCCAGTTTTCCCAG
Reverse primer: Primer-R ATCCAGTGCAGGGTCCGAGG
U6 U6-F CTCGCTTCGGCAGCACA
106 62 U6-R/RT AACGCTTCACGAATTTGCGT
The following supplementary tables could be seen in the files presented as the excel format.
Supplementary Table S11. Pathways within the breeds for DEGs.
Supplementary Table S12. Pathways between the breeds for DEGs.
Supplementary Table S16. The secondary structure and sequence of the predicted novel miRNAs.
Supplementary Table S17. Biological processes for target genes of DE gene-derived piRNAs.
Supplementary Table S18. Pathway for target genes of DE gene-derived piRNAs.
Supplementary Table S20. Biological processes within the breeds for TDETGs.
Supplementary Table S21. Pathway for TDETGs.
Supplementary Table S22. Biological processes between the breeds for TDETGs.

![Supplemental Table S1 Summary of mapped RNA reads ENSRNOG00000005341 Upp2 uridine phosphorylase 2 [Source:RGDSymbol;Acc:1308188]2.96 ENSRNOG00000054959 Mmp11 matrix metallopeptidase](https://static.fdocuments.in/doc/165x107/61178deb9ad86a53044a91b6/supplemental-table-s1-summary-of-mapped-rna-reads-ensrnog00000005341-upp2-uridine.jpg)