Genesys Interactive Insights 8 · 9 Performance Management: Value Proposition Interactive Insights...
65
Genesys Interactive Insights 8 Vittorio Noce Michiel Buurman September 11, 2012
Transcript of Genesys Interactive Insights 8 · 9 Performance Management: Value Proposition Interactive Insights...

Genesys Interactive Insights 8
Vittorio Noce Michiel Buurman September 11, 2012

2 2
2
Class Topics
Lesson 1 - Introduction to Interactive Insights Lesson 2 - Using InfoView to Access and View Reports Lesson 3 - Creating a Report

Introduction to Interactive Insights
Lesson 1

4 4
Lesson Objectives
After completing this lesson, you will be able to: • Describe Interactive Insights
• List the types of reports provided by Interactive Insights
• Describe Interactive Insights architecture
• Name major Business Objects applications
• Name the benefits of Interactive Insights
4

5 5
Reporting and Ad-hoc analytics tool for Genesys Info Mart • Provides reports according to business needs
• Provides summarized/aggregated data as well as interaction and agent activity detail
• Enables analysis, modification and creation of reports
• Delivered with the power of BusinessObjects Enterprise (BOE) XI, Release 3.1
Genesys Interactive Insights

6 6
Genesys Performance Management
Solution Reporting
Genesys Performance Management
Advisors Suite Web-Based, real-time analytic and
management application
Interactive Insights Web-based BI application
Info Mart Star schema, detailed, historical
interaction data base
CC Analyzer CC Pulse+

7 7
Voice Chat Email
25% of consumers use 1 or 2 channels
22% of consumers use 5 channels
23% of consumers use 5+ channels
52% of consumers use 3 or 4 channels
Real-Time Decisions Executive Elevation
Trends That Are Forcing Change

8 8
Enable timelier and more accurate
decisions
Gain visibility into the operational
performance
Focusing on business alignment
What is driving today’s CEOs?
Performance Management

9 9
Performance Management: Value Proposition
Interactive Insights
• II is a historical data analysis tool, allowing diverse users to
analyze past performance to gain an understanding of how the
operation of the contact center affected business
• Uses Info Mart as the data source but hides complexity from user
(using an Interactive Insights Universe)
• Provides drills and filters for root cause analysis, a Query &
Analysis tool for report generation + some “canned” reports
• Any user can tailor the reports to show the data relevant to them

10 10
Capabilities Matrix for Insights
Bringing data together.. Insights
Normalize data from various sources
Unify multi-channel reporting
Secure history of interaction details
Providing coherent and useful answers…
Understand operations from a business perspective
Capture business outcomes and standard metrics
Focus on exceptions and root-cause
Empowering users to act
Explore outcomes without IT

11 11
Architecture and Data Flow Diagram
Interaction Concentrator
Voice Details
Interaction Concentrator
Outbound Details
Interaction Concentrator
Multimedia Details
Interaction Concentrator
Configuration details
Genesys Info Mart Database
GIM Server
GIDB
Fact &
Dimension
Tables
IDB IDB IDB IDB IDB IDB
Transform
Extract
Aggregation
Tables
Aggregation
(Optional)

12 12
Interactive Insights Architecture
Interactive Insights Universe
Info Mart DB
BOE Servers
Interactive Insights Reports

13 13
Genesys Info Mart
Genesys Info Mart Database is the source of data for Interactive Insights reports
The Info Mart Server extracts, transforms, and loads interaction level contact center data into Info Mart Database tables
The Reporting and Analytics Aggregates engine—an optional Info Mart component that is mandatory for Interactive Insights operation—compiles data from these tables and stores it within aggregated data tables
Use of these aggregates drastically improves query performance when you run the Interactive Insights reports.
14 14
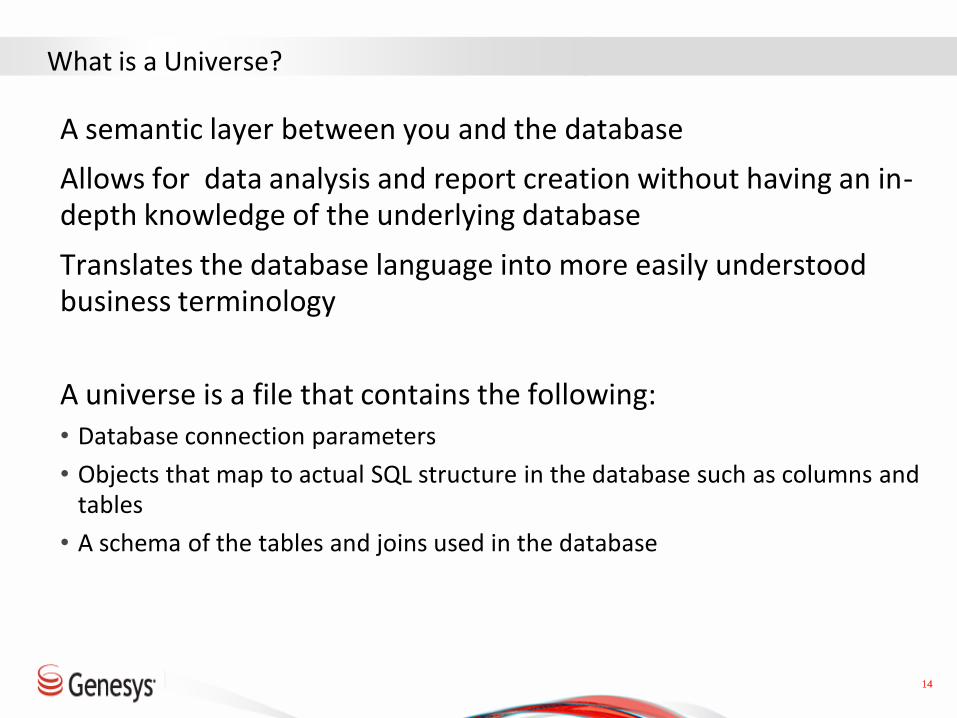
What is a Universe?
A semantic layer between you and the database
Allows for data analysis and report creation without having an in-depth knowledge of the underlying database
Translates the database language into more easily understood business terminology
A universe is a file that contains the following:
• Database connection parameters
• Objects that map to actual SQL structure in the database such as columns and tables
• A schema of the tables and joins used in the database
15 15
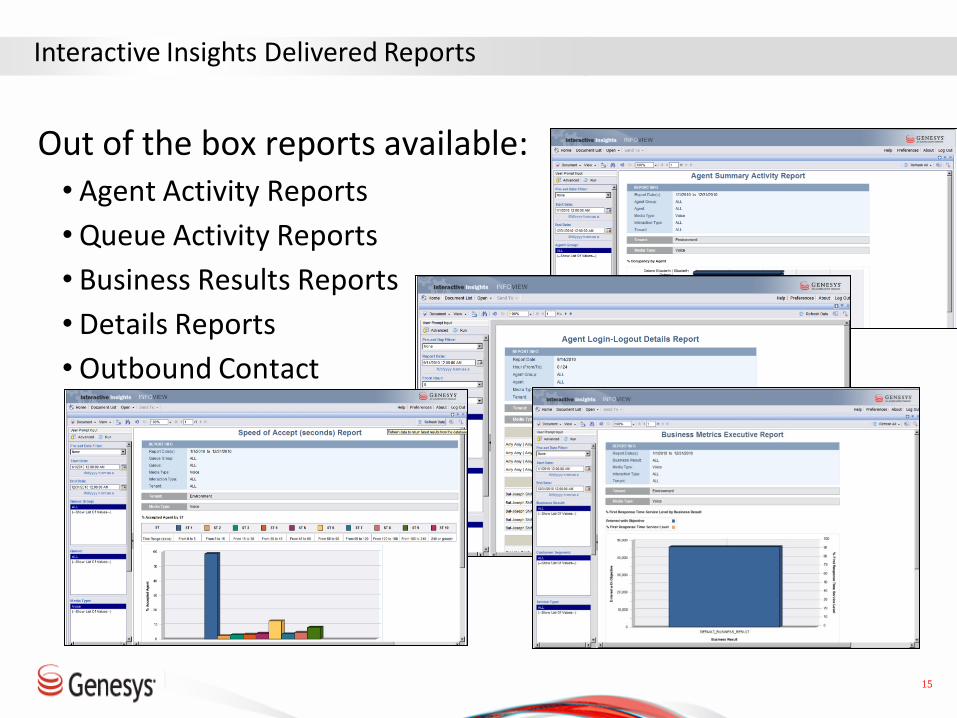
Out of the box reports available: • Agent Activity Reports
• Queue Activity Reports
• Business Results Reports
• Details Reports
• Outbound Contact
Interactive Insights Delivered Reports

16 16
Interactive Insights Report Creation
BusinessObjects supports a number of different report types. Interactive Insights reports are built using Web Intelligence (WEBI)

17 17
Business Objects Applications
Major Business Objects Enterprise applications used in Interactive Insights: • Designer – Windows application used to create and modify a
Universe
• Central Management Console – web application used for administration
• InfoView – web application used to access Reports and view/run/schedule/modify them
• Web Intelligence (WEBI) Java Report Panel - Advanced report building/editing tool
• Rich client – Windows application used to view/create/edit WEBI reports

18 18
BOE Designer – GI2 Universe
Classes
Dimensions
Measures
Universe Pane Structure Pane

19 19
The Central Management Console or CMC is a web-based tool which offers a single interface for administrative tasks.
Business Objects Applications - Central Management Console
20 20
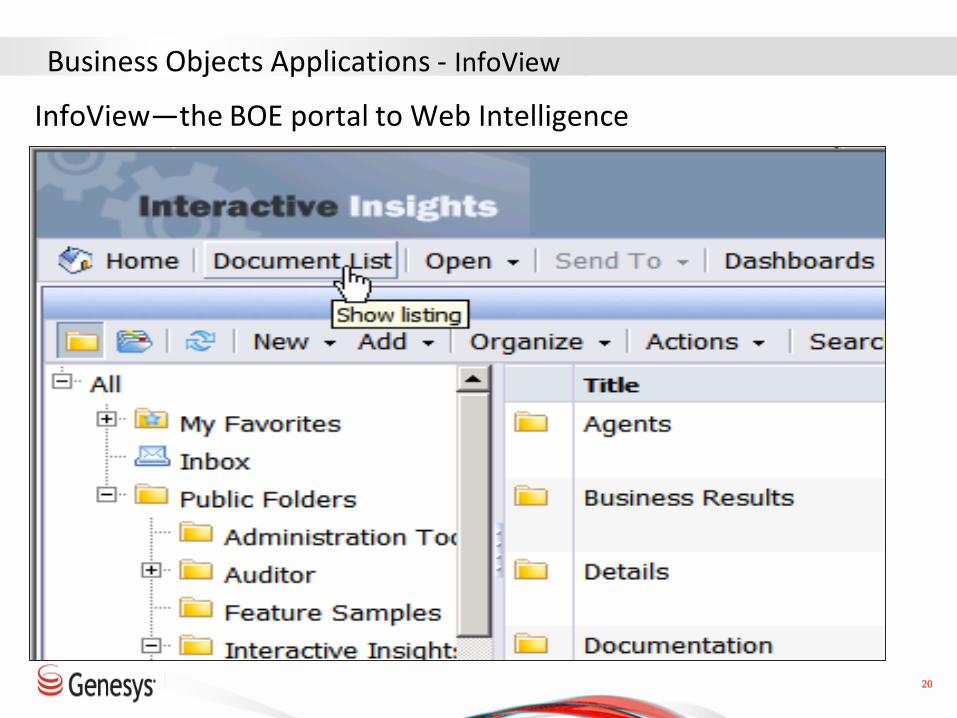
Business Objects Applications - InfoView
InfoView—the BOE portal to Web Intelligence

21 21
Business Objects Applications - Java Report Panel
The Java Report Panel is used to edit an existing query/report or to create a new report • To Access the Java Report Panel from an existing report, click the
Edit button

22 22
Business Objects Applications - Java Report Panel
In Java Report Panel a report can be redesigned or the underlying query can be updated, or a new report can be created
Toolbars
Report Tabs

23 23
Benefits of Genesys Interactive Insights
• Fast deployment time
• 30+ out-of-the-box reports as of 8.1.1
• Built-in hierarchies, reducing the total number of reports needed • Date/Time (Year – Quarter – Month – (Week) – Day – Hour – Subhour)
• Agent Group – Agent
• Queue Group – Queue
• Service Type – Service Subtype
• Certain key-value-pairs of data available out-of-the-box:
• Business Result
• Customer Segment
• Service Type
• Service Subtype
• Actionability, Influence and Sentiment for social media
• Extendable with user attached-data (10 dimensions and 16 measures)
© 2012, Genesys Telecommunications Laboratories, Inc. All rights reserved.

24 24
Typical Business Questions answered by Genesys Interactive Insights
Interactive Insights will help business users to get greater insight into their operations. Some examples of information available are:
• How did my agents perform ? Not too many transfers, customers put on hold, handle time too long, etc. ?
• When did my agents login and logout. Did they work the contracted number of hours ?
• What is the performance by business result, customer segment or service ?
• How much time was spent in a non-available state and for which reasons ?
• How many interactions were abandoned from queues or how long did it take for interactions to be answered from queues ?
© 2012, Genesys Telecommunications Laboratories, Inc. All rights reserved.

25 25
Lesson Summary
Having completed this lesson, you should now be able to: • Describe Interactive Insights
• List the types of reports provided by Interactive Insights
• Describe Interactive Insights architecture
• Name major Business Objects applications
• Name the benefits of using Interactive Insights
25

Using InfoView to Access and View Reports
Lesson 2
27 27
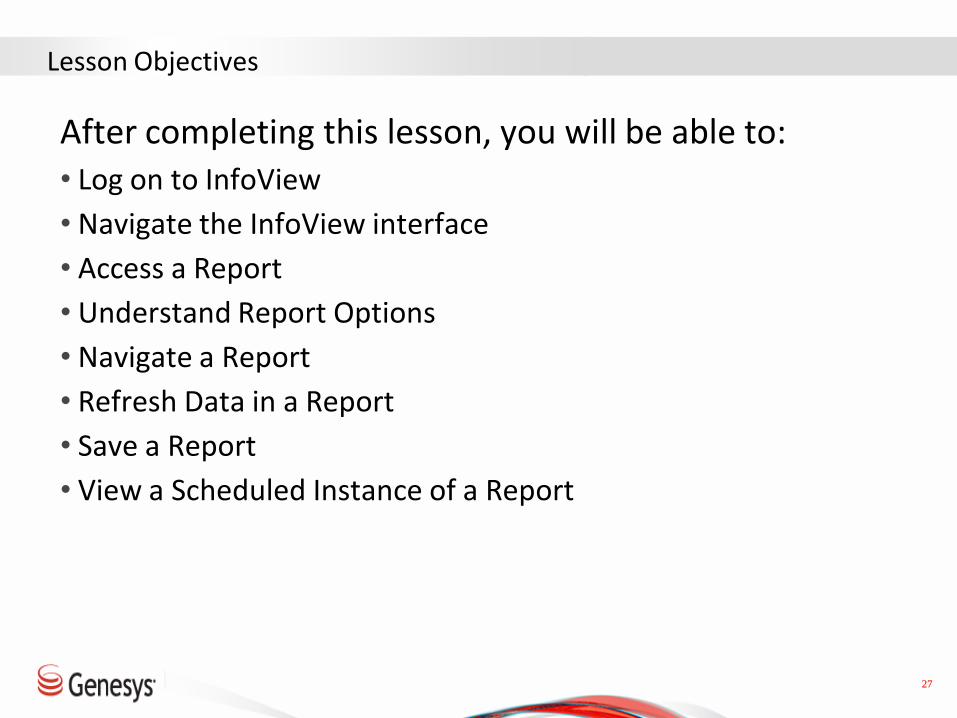
Lesson Objectives
After completing this lesson, you will be able to: • Log on to InfoView
• Navigate the InfoView interface
• Access a Report
• Understand Report Options
• Navigate a Report
• Refresh Data in a Report
• Save a Report
• View a Scheduled Instance of a Report

28 28
Logging In to InfoView
InfoView is a browser-based client application

29 29
Logging In to InfoView
InfoView supports role-based access control, and Interactive Insights has four default groups: • Administrator
• Report Developer
• Report Editor
• Report Viewer
As a user, you will have a defined level of access to the system which will determine what capabilities you have.

30 30
InfoView Homepage
The default homepage
Header
Panel
Workspace
Panel

32 32
Preferences
Preferences determine how you log on to InfoView and what view is displayed when you do.

34 34
InfoView Folders
Reports can be access through folders. There are two types of folders in the Documents section: • Personal Folders (My Favorites)
• Public Folders

36 36
Working with Folders
Depending on the user’s rights… • Files can be Copied and Moved between Folders
• Copy enables you to edit the new object while keeping the original version
• Move enables you to reorganize objects, by relocating them from one folder to another
• Delete objects within folders

38 38
Creating Shortcuts
Shortcuts are objects that point to objects in other folders.
You can create shortcuts rather than copying or moving documents

39 39
Opening a Report
To open a report, either double click on the report, or right click and choose View

40 40
InfoView Workspace
Document List Refresh Data Prompt
Data Refresh Status
Report Tabs Left Pane Display Options
User Preferences Open/Close
Save as/Save

41 41
Refresh Data
1. Click “Refresh Data” button
2. Edit the
prompts to
the desired
values
42 42
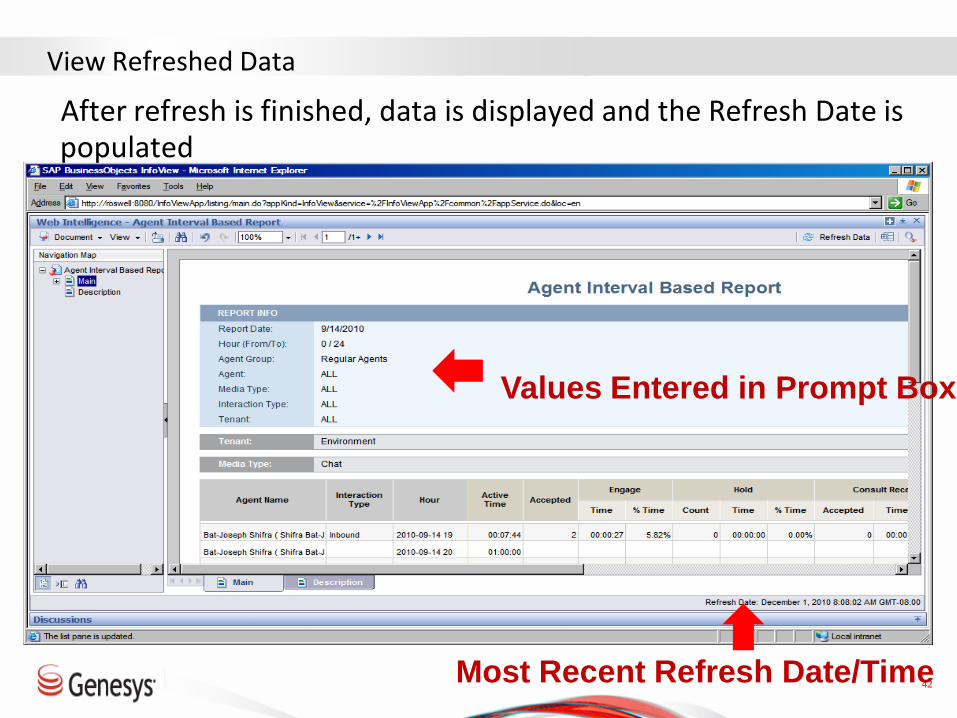
View Refreshed Data
After refresh is finished, data is displayed and the Refresh Date is populated
Most Recent Refresh Date/Time
Values Entered in Prompt Box

43 43
Web Intelligence provides the ability to drill-up and drill-down within a report
Drill Up and Drill Down changes the viewing perspective: for example from agent to agent group; from month to quarter.
Drill-up and Drill-down Features

44 44
Several of the Standard out-of-the-box reports can provide very granular data
Finding Granular Data in Report Links

45 45
Saving a Report
Depending on your permissions, you may save a report to a Folder by moving it
You can also save a local copy of a report in Excel, PDF and CSV formats

46 46
Viewing Scheduled Reports
Reports can be scheduled to run a regular basis (daily, weekly, etc.)
Scheduled reports can be distributed to user inboxes, the folder from which they were scheduled, and attached to emails
In the folder from which they were scheduled, the most recent instance and previous instances can be viewed

47 47
Instances
To view scheduled instances from their folder, right click and select either…
• View Latest Instance
• History
Viewing Scheduled Reports from Folder

48 48
Viewing Scheduled Reports from Folder
When History is selected, a second screen opens from which you can choose the instance of the report you would like to view
Select instance
49 49
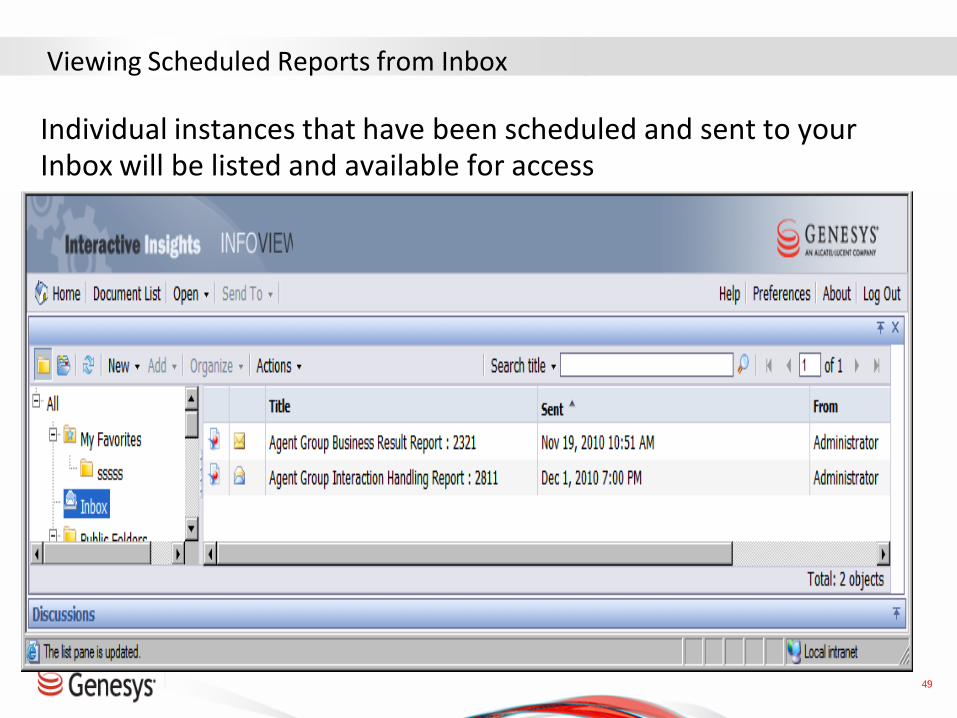
Viewing Scheduled Reports from Inbox
Individual instances that have been scheduled and sent to your Inbox will be listed and available for access

50 50
Lesson Summary
Now that you have completed this lesson, you should be able to:
• Log on to InfoView
• Navigate the InfoView interface
• Access a Report
• Understand Report Options
• Navigate a Report
• Refresh Data in a Report
• Save a Report
• View a Scheduled Instance of a Report

Creating a Report
Lesson 3

52 52
Lesson Objectives
After completing this lesson, you will be able to: • Access the Java Report panel
• Describe the purpose of the Query View and Report View
• Create a basic report
• Apply a filter
• Use tables, sections, and charts

53 53
Java Report Panel
In Java Report Panel a report can be redesigned or the underlying query can be updated, or a new report can be created.
Toolbars
Report
Tabs
Left Pane
Display
Options

54 54
Edit an Existing Report
• To Access the Java Report Panel from an existing report, click the Edit button

55 55
Create a New Report

56 56
Edit Query View – Work with data and query
Edit Report View – Work with data presentation
Two Java Report Panel Views

57 57
Edit Query
Data
Tab

58 58
Object - is a component named with a business naming standard that maps to data in the database or calls a database function or uses other objects from within the same universe
Each object can be qualified as a dimension, a detail or a measure
Universe contains Classes and Objects: Objects
Classes
Dimensions
Details
Measures

59 59
Query Filters
Query filters retrieve a subset of available data
Interactive Insights Universe comes with several pre-defined filters

60 60
Use the SQL button to open the SQL Viewer.
Using the SQL Viewer

61 61
Edit Report
Toolbars
Data
Tab

62 62
Report Manager Tabs
Tabs in the Report Manager: • Data - Displays the universe objects,
formulas and variables that can be included in the report.
• Templates - Displays the tables, charts and cells that can be included in the report.
• Map - Displays a hierarchical map of the report components (for examples tables, cells, sections, filters).
• Properties - Displays the editable properties used to configure the appearance and behavior of the report.

63 63
Tables
Initially, when you create a new document and run the query the first time to display the results, Web Intelligence generates a report that includes all of the results in a vertical table.
You can modify the table’s organization, remove or add data, change the table type to display the results differently or insert other tables.
There are four basic table types: • Vertical (the default)
• Horizontal
• Crosstab
• Form

64 64
Change the Table to Horizontal
Click and drag the Horizontal Table template onto the table in the Report Panel.

65 65
Creating Sections
Sections allow you to split report data into smaller chunks
You can create sections by moving a cell from a table onto the report background

66 66
Add Data to the Chart
Add data to the chart by dragging objects from the data tab onto the chart

67 67
Creating a Chart
Choose a chat type from the Templates tab

68 68
Lesson Summary
Now that you have completed this lesson, you should be able to:
• Access the Java Report panel
• Describe the purpose of the Query View and Report View
• Create a basic report
• Apply a filter
• Use tables, sections, and charts

Thank You