Gainesboro G1
24
Gainesboro Machines Tools Corp. Adil Bouzoubaa Med Amine Bekkal Hafida Hannaoui Zineb Abdou
-
Upload
aminebekkal -
Category
Documents
-
view
51 -
download
2
description
case study gainesboro
Transcript of Gainesboro G1

Gainesboro Machines Tools Corp.
Adil BouzoubaaMed Amine BekkalHafida HannaouiZineb Abdou

Overview of Gainesboro Machine Tools
Case Issues
Technical Part
Conclusion
Outline

• Gainesboro Corporation was founded in 1923 in Concord, New Hampshire by James Gaines and David Scarboro.
• Designed and manufactured of machinery parts including presses, dies and molds.
• In the 1940s: armored-vehicle and tank parts, miscellaneous equipment for the world war two .
• After the war; the company concentrated on the production of industrial presses and molds, for plastics as well as metals
• By 1975, the company had developed a reputation as an innovative producer of industrial machinery and machine tools.
Background

• In the 1980s : entered the CAD/ CAM field• In the 1990s: Gainesboro helped set the standard for CAD/CAM• 1990s-2000s: Gainesboro fell behind some of its competition
Background

• Goal : Average annual compound rate of 15%• Strategy • - The mix of production would shift substantially • -Expand aggressively in the international area• -Expand through joint ventures and acquisitions of small software
companies
Company’s Goal and Strategy

• Goal : Average annual compound rate of 15%• Strategy • - The mix of production would shift substantially • -Expand aggressively in the international area• -Expand through joint ventures and acquisitions of small software
companies
Company’s Goal and Strategy

Issues
• The impact of hurricane katrina• The stock of gainseboro had fallen 18% to
$22,15

Issues
• Ashley swenson, the chief financial officer, has to decide whether to payout dividends or repurchase the stock
• she has to decide the number of payout • Swenson thought of 3 options of the dividends
policy and she has to decide which one she should recommend

1st Option
• Zero-dividends payout policy• Transition from a traditional industry to high-tech
entreprise

2nd Option
• 40% dividends payout policy• Using debt to pay dividends
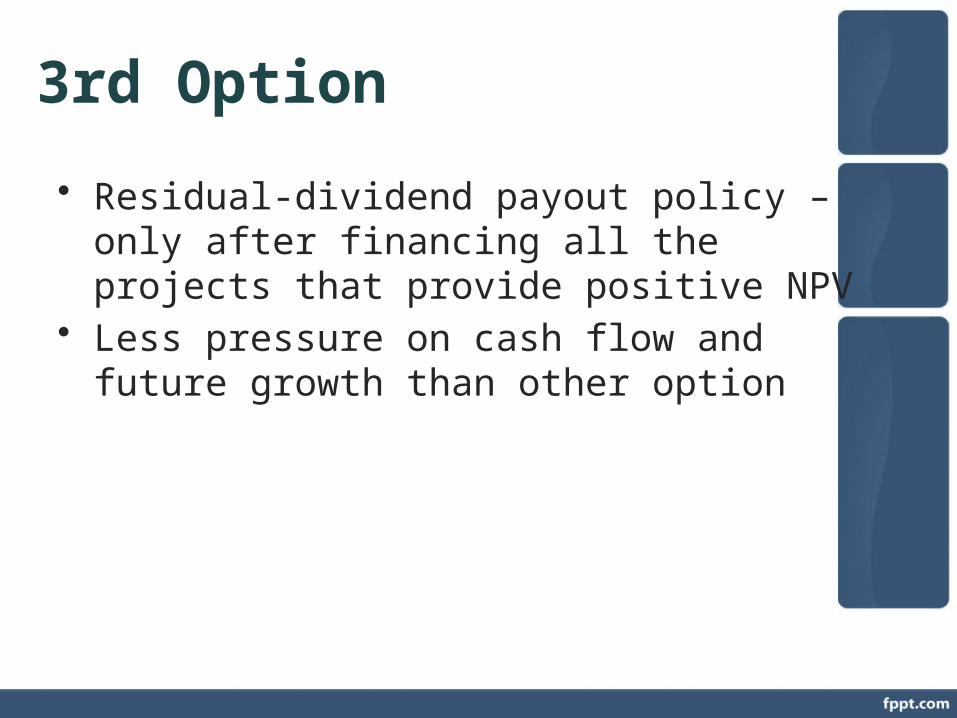
3rd Option
• Residual-dividend payout policy – only after financing all the projects that provide positive NPV
• Less pressure on cash flow and future growth than other option

• Signals to shareholders that Gainesboro commits to Futur Growth and International Expanding
• Implies that Gainesboro is shifting it’s Traditional machine tool to CAD/CAMPros
• The campaign is costly approximately $10 Mil• No Empirical Evidence ever showed that
there’s a positive corelation between name change and Stock price
Cons
Name Change Campaign

Dividend Payout Policy

40% Dividend Payout40% of dividend payout 2005 2006 2007 2008 2009 2010 2011Sales Growth Rate 15% 15% 15% 15% 15% 15% 15%Net Income as % of sales 2.1% 4.0% 5.0% 5.5% 6.0% 5.6% 8.0%Diveidend-Payout Ratio 40% 40% 40% 40% 40% 40% 40%
2005 2006 2007 2008 2009 2010 2011Sales 870.1 1000.7 1150.8 1323.4 1521.9 1750.1 2012.7Sources:Net Income 18.1 40.0 57.5 72.8 91.3 98.0 160.0Depreciation 22.5 25.5 30 34.5 40.5 46.5 52.5Total 40.6 65.5 87.5 107.3 131.8 144.5 212.5
Uses:Capital Expenditures 43.8 50.4 57.5 66.2 68.5 78.8 90.6Change in working capital 19.5 22.4 25.8 29.6 34 38.5 44.3Total 63.3 72.8 83.3 95.8 102.5 117.3 134.9
Excess Cash/ Borrowing Needs -22.7 -7.3 4.2 11.5 29.3 27.2 77.6Dividend 7.2 16.0 23.0 29.1 36.5 39.2 64.0Total excess cash/borrowing -29.9 -23.3 -18.8 -17.6 -7.2 -12.0 13.6
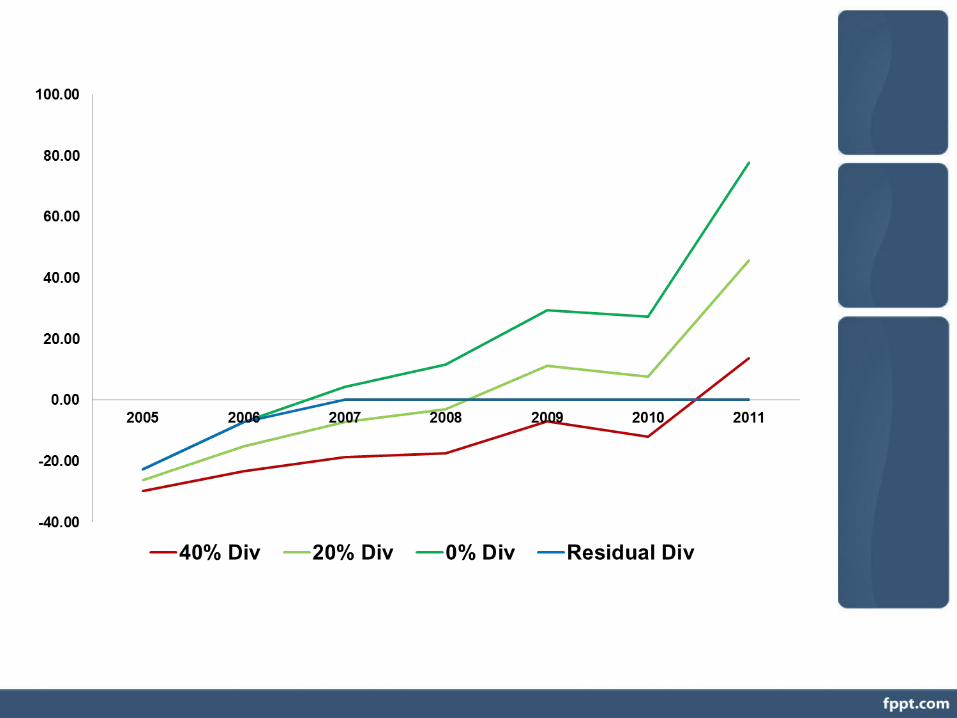
Dividend per share 0.4 0.8 1.3 1.6 2.0 2.1 3.5

0% Dividend Payout0% of dividend payout 2005 2006 2007 2008 2009 2010 2011Sales Growth Rate 15% 15% 15% 15% 15% 15% 15%Net Income as % of sales 2.1% 4.0% 5.0% 5.5% 6.0% 5.6% 8.0%Diveidend-Payout Ratio 0% 0% 0% 0% 0% 0% 0%
2005 2006 2007 2008 2009 2010 2011Sales 870.1 1000.7 1150.8 1323.4 1521.9 1750.1 2012.7Sources:Net Income 18.1 40.0 57.5 72.8 91.3 98.0 160.0Depreciation 22.5 25.5 30 34.5 40.5 46.5 52.5Total 40.6 65.5 87.5 107.3 131.8 144.5 212.5
Uses:Capital Expenditures 43.8 50.4 57.5 66.2 68.5 78.8 90.6Change in working capital 19.5 22.4 25.8 29.6 34 38.5 44.3Total 63.3 72.8 83.3 95.8 102.5 117.3 134.9
Excess Cash/ Borrowing Needs -22.7 -7.3 4.2 11.5 29.3 27.2 77.6Dividend 0.0 0.0 0.0 0.0 0.0 0.0 0.0Total excess cash/borrowing -22.7 -7.3 4.2 11.5 29.3 27.2 77.6
Dividend per share 0.0 0.0 0.0 0.0 0.0 0.0 0.0

• It’s a growing company and needs to invest back the retained earnings
• Borrowing for dividend Payement can be avoided • Can be positioned as high growth and high
technology firm• Cash flow will be positive by 2007 Pros
• The board of directors will break their Commitment to shareholders
• DPS fallen from 1.03 to near zero• Stock brokers have a negative sentiments• Value oriented investors(13%), Long-term
retirement people(26%)Cons
0% Dividend Payout

Residual Dividend PayoutResidual dividend payout 2005 2006 2007 2008 2009 2010 2011Sales Growth Rate 15% 15% 15% 15% 15% 15% 15%Net Income as % of sales 2.1% 4.0% 5.0% 5.5% 6.0% 5.6% 8.0%Diveidend-Payout Ratio 0% 0% 0% 0% 0% 0% 0%
2005 2006 2007 2008 2009 2010 2011Sales 870.1 1000.7 1150.8 1323.4 1521.9 1750.1 2012.7Sources:Net Income 18.1 40.0 57.5 72.8 91.3 98.0 160.0Depreciation 22.5 25.5 30 34.5 40.5 46.5 52.5Total 40.6 65.5 87.5 107.3 131.8 144.5 212.5
Uses:Capital Expenditures 43.8 50.4 57.5 66.2 68.5 78.8 90.6Change in working capital 19.5 22.4 25.8 29.6 34 38.5 44.3Total 63.3 72.8 83.3 95.8 102.5 117.3 134.9
Excess Cash/ Borrowing Needs -22.7 -7.3 4.2 11.5 29.3 27.2 77.6Dividend 0.0 0.0 4.2 11.5 29.3 27.2 77.6Total excess cash/borrowing -22.7 -7.3 0.0 0.0 0.0 0.0 0.0
Dividend per share 0.0 0.0 0.2 0.6 1.6 1.5 4.2
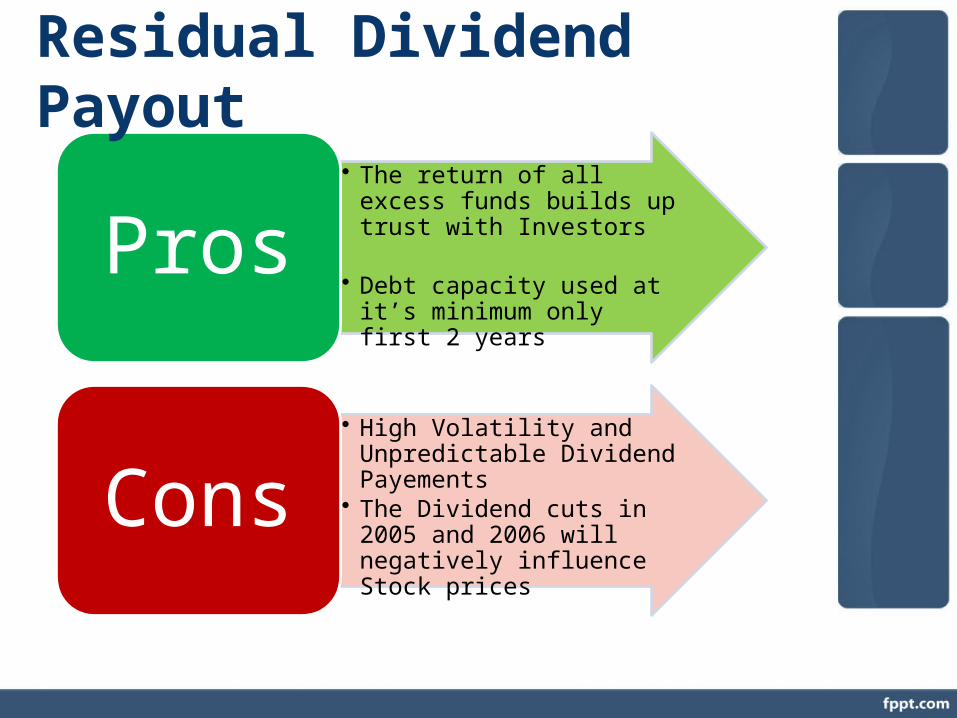
• The return of all excess funds builds up trust with Investors
• Debt capacity used at it’s minimum only first 2 yearsPros
• High Volatility and Unpredictable Dividend Payements
• The Dividend cuts in 2005 and 2006 will negatively influence Stock pricesCons
Residual Dividend Payout

20% Dividend Payout40% of dividend payout 2005 2006 2007 2008 2009 2010 2011Sales Growth Rate 15% 15% 15% 15% 15% 15% 15%Net Income as % of sales 2.1% 4.0% 5.0% 5.5% 6.0% 5.6% 8.0%Diveidend-Payout Ratio 20% 20% 20% 20% 20% 20% 20%
2005 2006 2007 2008 2009 2010 2011Sales 870.1 1000.7 1150.8 1323.4 1521.9 1750.1 2012.7Sources:Net Income 18.1 40.0 57.5 72.8 91.3 98.0 160.0Depreciation 22.5 25.5 30 34.5 40.5 46.5 52.5Total 40.6 65.5 87.5 107.3 131.8 144.5 212.5
Uses:Capital Expenditures 43.8 50.4 57.5 66.2 68.5 78.8 90.6Change in working capital 19.5 22.4 25.8 29.6 34 38.5 44.3Total 63.3 72.8 83.3 95.8 102.5 117.3 134.9
Excess Cash/ Borrowing Needs -22.7 -7.3 4.2 11.5 29.3 27.2 77.6Dividend 3.6 8.0 11.5 14.6 18.3 19.6 32.0Total excess cash/borrowing -26.3 -15.3 -7.3 -3.0 11.0 7.6 45.6
Dividend per share 0.2 0.4 0.65 0.8 1.0 1.1 1.7

• Consistent with Gainesboro historical Dividend payout Policy ( Avg Payout Ratio “1989 – 2000”= 28% )
• The Continuous Div Growth may attract additional Investors
• Cash flow will be positive by 2009Pros
• Borrowing for Dividend Payement needed for the first 4 years
• Not a strong signal that the Management is confident about the company’s futur growth
Cons
20% Dividend Payout

20% Dividend Payout

Share Repurchase
Assumption Repurchase at Current Price
Share repurchase price $22.15
Excess Cash year 2007 (0% Div) $4 200 000
# Shares Repurchased 189 616
# Outstanding Shares Before Repurchase 18 600 000
# Outstanding Shares after Repurchase 18 789 616
Earnings 2007 $87 500 000
EPS before repurchase $4.70
EPS after repurchase $4.66

Conclusion• Maintains Board Commitment to pay
Dividends• Comprising strategy for Investors who want to
receive Dividends and value growth• Positive future Cash Flows > 2009• Stable Div/share Growth
20% Div
• The new name will better reflect the company’s shift to CAD/CAM
• « Gainesboro Advanced Systems International Inc » transfers two main strategies to Investors: High Technology & International Expanding
Name Change