FY2013 Results Presentation sales growth +3% Space growth +9% Online sales in 25 markets Strong...
34
FY2013 Results Presentation 19 March 2014
Transcript of FY2013 Results Presentation sales growth +3% Space growth +9% Online sales in 25 markets Strong...

FY2013 Results Presentation
19 March 2014

2
Disclaimer
This document is of a purely informative nature and does not constitute an offer to sell, exchange or buy, or the
solicitation of an offer to buy, securities issued by any of the companies mentioned herein.
This document contains forward-looking statements. All statements other than statements of historical fact included
herein, including, without limitation, those regarding our financial position, business strategy, management plans and
objectives for future operations are forward-looking statements. Any such forward-looking statements are subject to
risk and uncertainty and thus could differ materially from actual results.
Some of these risks include, amongst others, ongoing competitive pressure in the sector, consumer tastes and
spending trends, economic, political, regulatory and trade conditions in the markets where the Inditex Group is
present or in the countries where the Group’s products are manufactured or distributed.
The risks and uncertainties that could affect the forward-looking statements are difficult to predict. The company
assumes no obligation to publicly revise or update its forward-looking statements in the case of unexpected
changes, events or circumstances that could affect them. Given the uncertainties of forward-looking statements, we
caution readers not to place undue reliance on these statements.
For a discussion of these and other factors that may affect forward looking statements and the Inditex Group’s
business, financial conditions and results of operations, see the documents and information communicated by the
company to the Comisión Nacional del Mercado de Valores (the Spanish Securities Commission).
The contents of this disclaimer should be taken into account by all persons or entities.

Overview

4
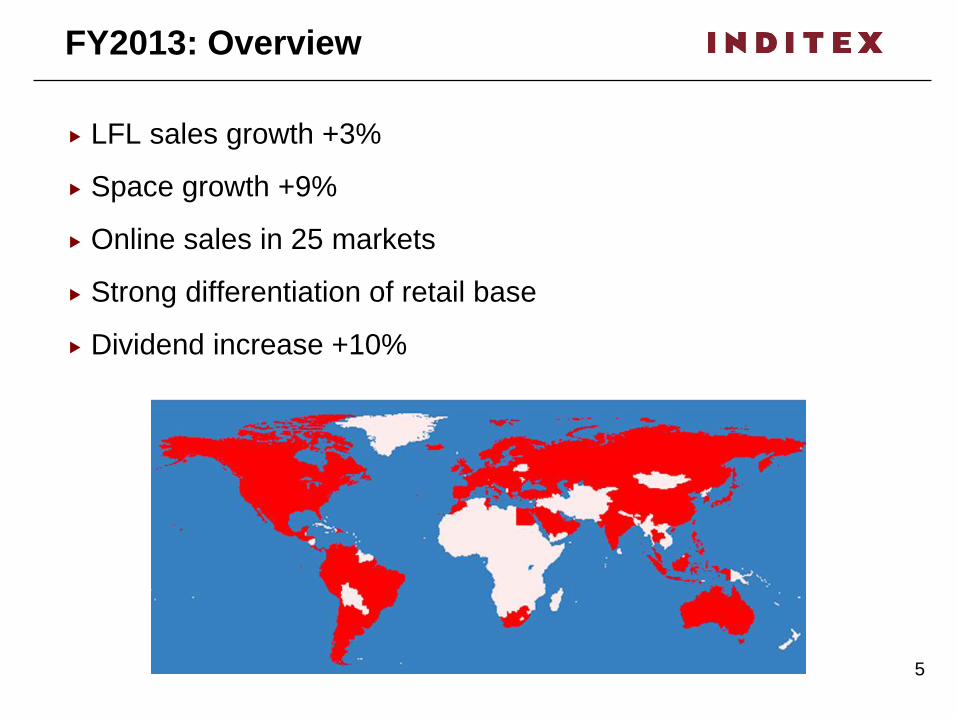
FY2013: Overview
Global growth opportunities: Multi-concept / Multi-channel
Strong expansion and satisfactory sales growth
Tight control of operating expenses
Strong investment in the business
Increased shareholder remuneration
5
FY2013: Overview
LFL sales growth +3%
Space growth +9%
Online sales in 25 markets
Strong differentiation of retail base
Dividend increase +10%

Financial Summary

€ million FY13 FY12 % 13/12 2yr CAGR
Net sales 16,724 15,946 5% 10%
Gross profit 9,923 9,529 4% 10%
EBITDA 3,926 3,913 0% 10%
EBIT 3,071 3,117 -1% 10%
Net income 2,377 2,361 1% 11%
7
FY2013 Highlights

8
Satisfactory sales growth
€ million FY13 FY12 % 13/12 2yr CAGR
Sales 16,724 15,946 5% 10%
Sales growth in local currencies +8%
Strong LFL sales +3%
Currency translation -3%
Underlying space contribution +7%
Reported sales reflect demanding comparables,
currency translation and store optimisation plan

9
Strong space growth
sqm. FY2013 FY2012 % 13/12
Total space 3,441,969 3,161,448 9%
Strong expansion of selling area in prime locations
281,000 square metres added to the retail base

FY2013 Store sales (%)
10
14.2% 14.0%
20.7% 19.7%
45.4% 45.9% Europe ex-Spain
19.7% 20.4%
Global sales platform
Store sales: Includes sales in OMS and franchises
Americas
Spain
Asia & RoW Europe
Ex-Spain
Spain
Asia &
Americas FY2012
Europe ex-Spain
Asia & RoW
Spain
Americas
11
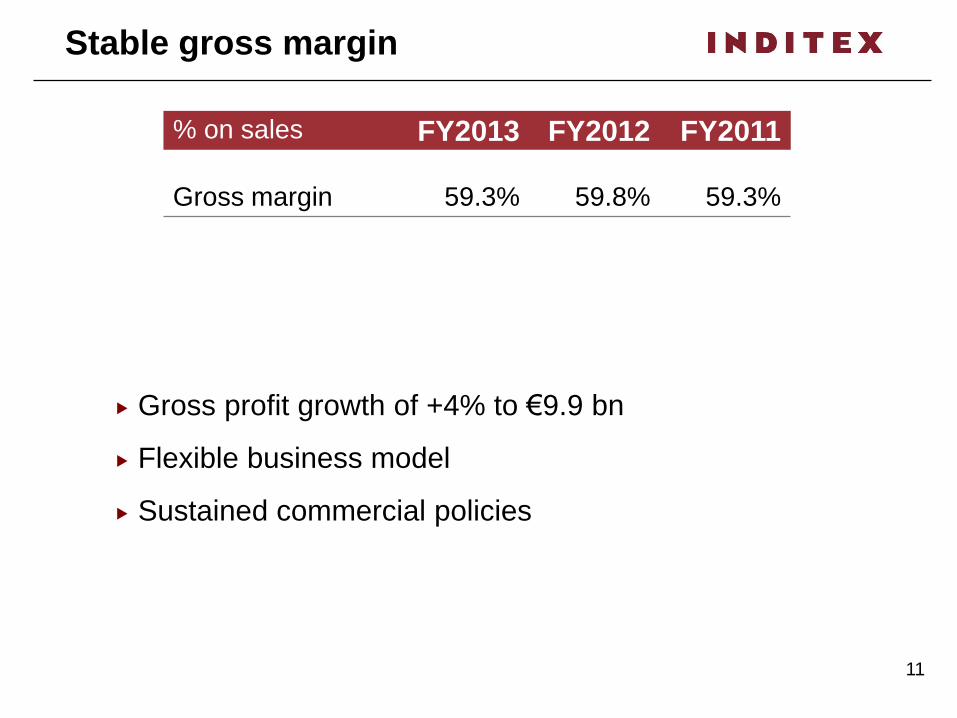
Stable gross margin
% on sales FY2013 FY2012 FY2011
Gross margin 59.3% 59.8% 59.3%
Gross profit growth of +4% to €9.9 bn
Flexible business model
Sustained commercial policies

12
Tight control of operating expenses
€ million FY2013 %13/12
Personnel expenses 2,698 6%
Rental expenses 1,656 8%
Other operating expenses 1,644 8%
Total 5,998 7%
Strong growth in LFL sales and space
13
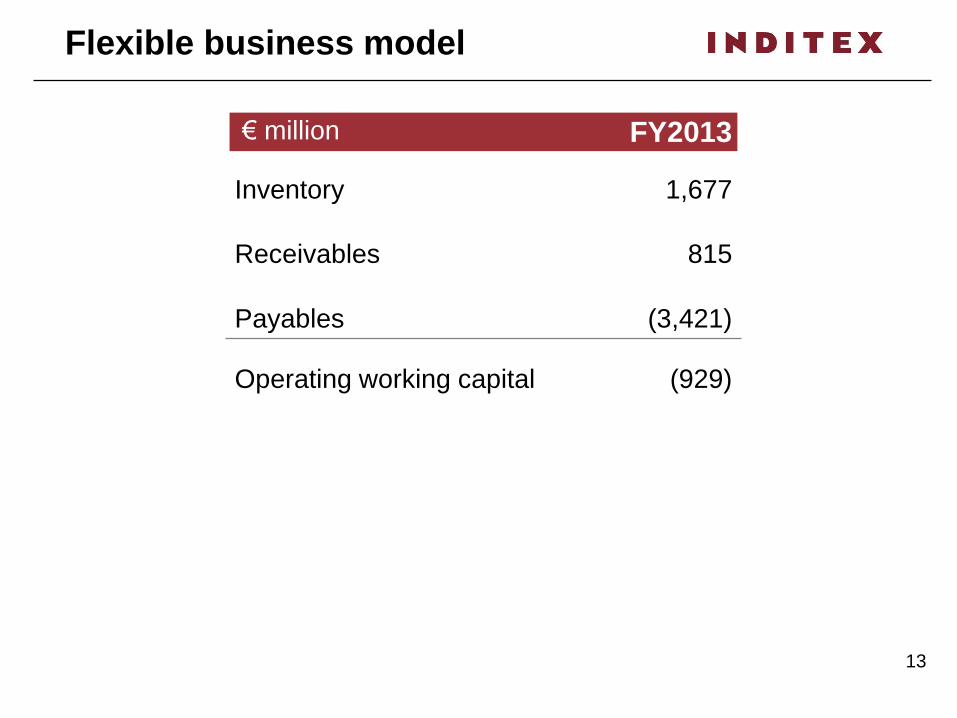
Flexible business model
€ million FY2013
Inventory 1,677
Receivables 815
Payables (3,421)
Operating working capital (929)

14
Cash flow
€ million FY2013
Funds from operations 2,949
CAPEX 1,240
Dividends 1,378

15
Investment for future growth
Zara & Zara Home HQ’s
Pull&Bear Cabanillas DC

Inditex concepts

17
Sales by concept
Concept FY2013
Zara 64.6%
Non Zara 35.4%
Pull&Bear 7.1%
Massimo Dutti 7.7%
Bershka 9.3%
Stradivarius 6.0%
Oysho 2.1%
Zara Home 2.7%
Uterqüe 0.4%
Zara
Non Zara

18
€ million FY2013 % 13/12 2yr CAGR
Net Sales 10,804 2% 10%
EBIT 2,089 (6%) 10%
Zara
Store optimisation plan for Zara completed in 2013
Reported sales reflect strong comparable, currency
translation and store optimisation plan

19
Concepts
Continued growth for the concepts
Strong performance of Zara Home, Massimo Dutti,
Pull&Bear and Oysho

Outlook

21
Strong space growth
238,939
251,332
322,468
280,521
2009 2010 2011 2012 2013
m2 2,348,709
3,441,969
Diversified global platform
Prime locations

22
Global online sales
Business model perfectly fit for online
Strong growth potential
Ongoing online expansion

23
Continued optimisation of retail base
2012-2014: Increased differentiation of retail proposition
Enlargement of global flagships
Rollout of new image in stores worldwide
Larger new stores
24
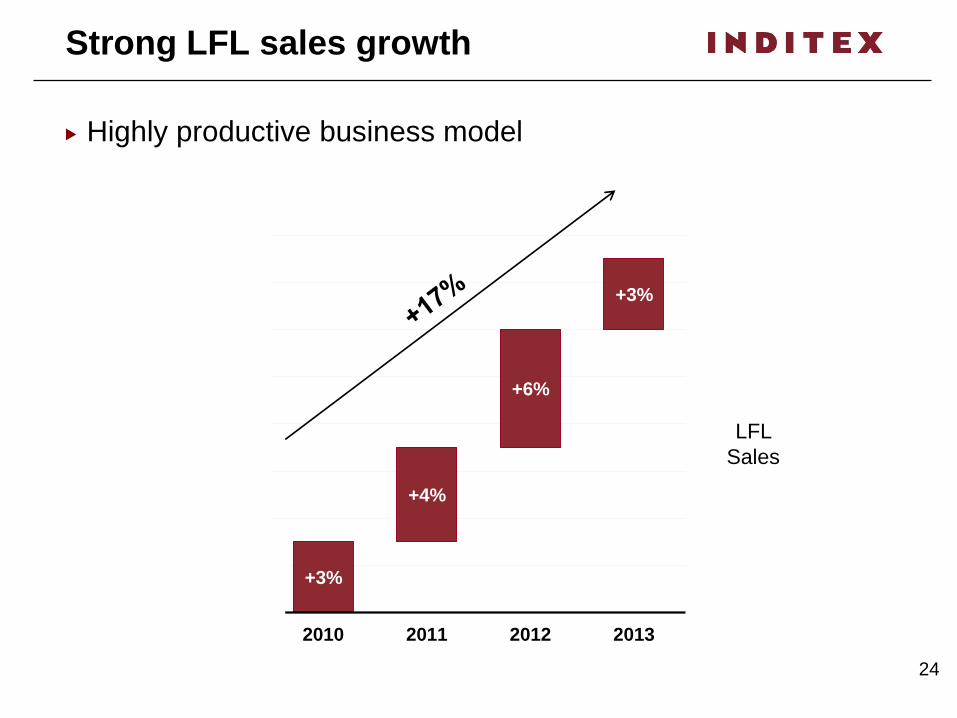
Strong LFL sales growth
+3%
+4%
+6%
+3%
2010 2011 2012 2013
Highly productive business model
LFL
Sales
25
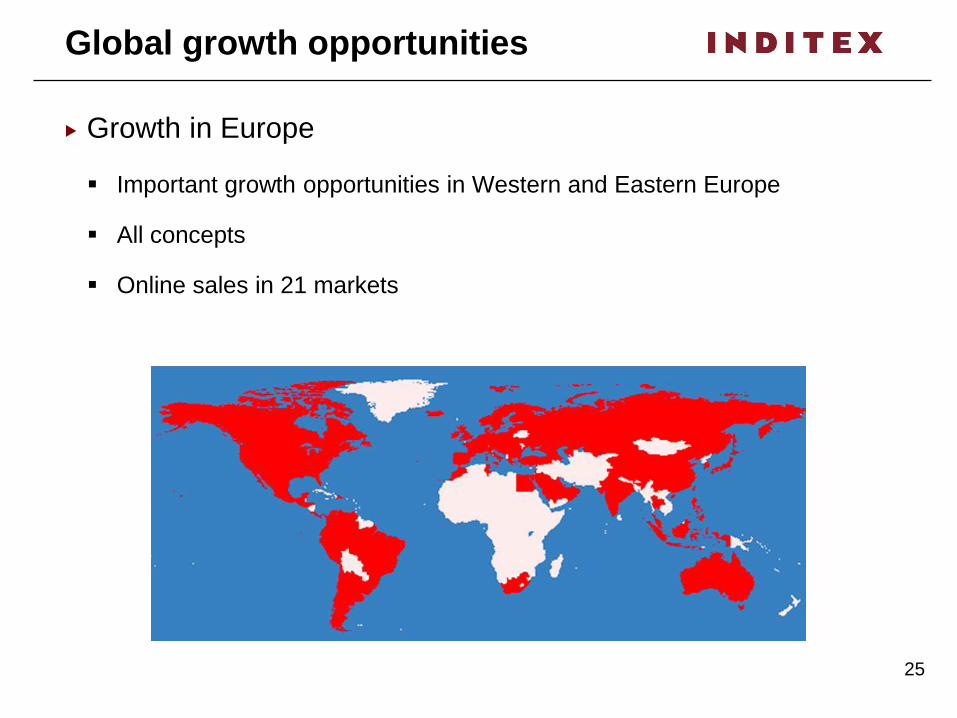
Global growth opportunities
Growth in Europe
Important growth opportunities in Western and Eastern Europe
All concepts
Online sales in 21 markets

26
Global growth opportunities
Growth in Asia: Leverage strategic presence
Strong growth opportunities
Presence in all key markets
Multi-concept & online sales expansion. Zara online in China and Japan.
27
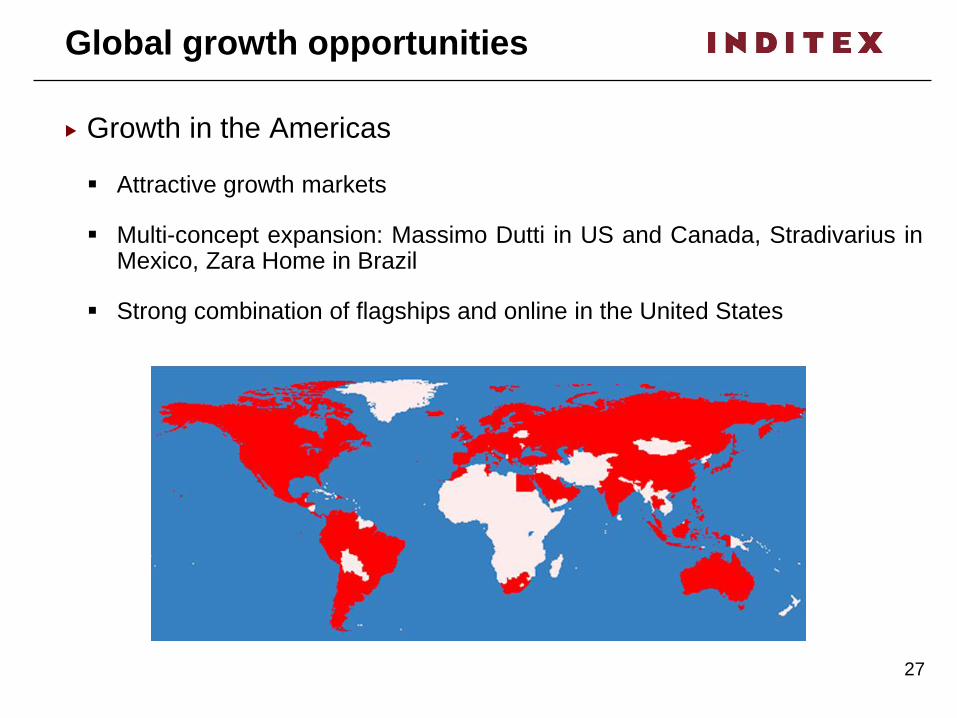
Global growth opportunities
Growth in the Americas
Attractive growth markets
Multi-concept expansion: Massimo Dutti in US and Canada, Stradivarius in Mexico, Zara Home in Brazil
Strong combination of flagships and online in the United States

28
Global growth opportunities
Australia and South Africa
Ongoing expansion

Global online sales
From 29 Oct 2007 Zara Home Europe: Austria, Belgium, Denmark, France,
Germany, Greece, Ireland, Italy, Luxembourg,
Monaco, Netherlands, Portugal, Spain, Sweden,
UK, Switzerland, Norway, Finland, Poland
2 Sept 2010 Zara Spain, Portugal, France, Germany, Italy, UK
4 Nov 2010 Zara Netherlands, Belgium, Luxembourg, Austria,
Ireland
3 March 2011 Zara Switzerland, Monaco, Sweden, Denmark,
Norway
From 6 Sept 2011 Massimo Dutti, Bershka, Pull&Bear,
Stradivarius, Oysho, Uterqüe
Europe
7 Sept 2011 Zara United States
20 Oct 2011 Zara Japan
7 March 2012 Zara Poland
5 Sep 2012 Zara China
Oct. 2012 Massimo Dutti, Zara Home United States
6 March 2013 Zara Canada
28 Aug 2013 Zara Russian Federation
1 October 2013 Massimo Dutti, Bershka, Stradivarius, Oysho Russian Federation
March/April 2014 Zara Greece, Romania
Autumn/Winter 2014 Zara South Korea, Mexico
Progressive roll-out All Concepts Globally

30
South Korea & Mexico online sales
Zara: Autumn/Winter 2014
Progressive rollout in all markets

31
FY2014: Outlook
Strong space growth and conversion rates in line with long-
term targets
450-500 Gross openings / Selective absorption of 80-100 small
units (mainly non-Zara concepts)
Capital Expenditure c. €1.35 billion
32
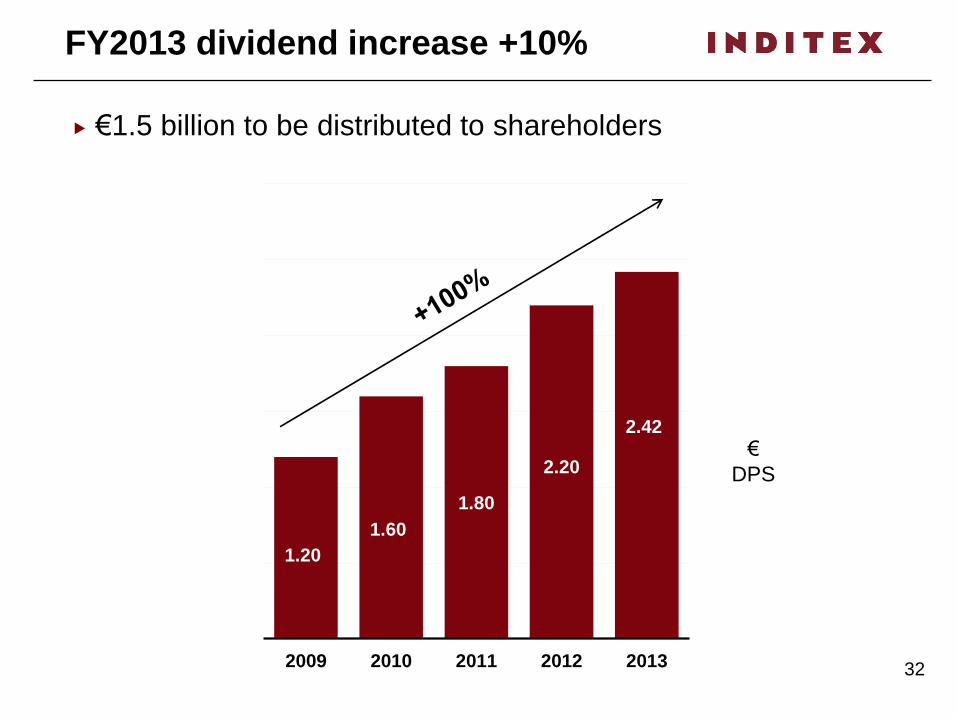
FY2013 dividend increase +10%
€1.5 billion to be distributed to shareholders
1.20
1.60
1.80
2.20
2.42
2009 2010 2011 2012 2013
€
DPS
33
FY2013: Outlook
Store sales in local currencies have increased +12% from
1 February to 15 March 2014
The Spring/Summer season is influenced by the
performance over the Easter period due to its significant
sales volumes

FY2013 Results Presentation
Q&A
19 March 2014