FUZZY CLUSTERING FOR IMPROVED POSITIONING
12
International Journal on Information Theory (IJIT), Vol.4, No.4, October 2015 DOI : 10.5121/ijit.2015.4402 9 FUZZY CLUSTERING FOR IMPROVED POSITIONING H. Kiwan and Y. Morgan Software Systems Engineering, University of Regina ABSTRACT In this research, we focused on developing positioning system based on common short-range wireless. So we developed a system that assumes the existence of a number of fixed access points (5+) and employ arrival difference (TDOA) with Kalman filter. We also discuss multiple / tri-lateration and evaluate some of the root causes dilution of precision (DOP) positioning using Kalman Filter. This article presents a simpler approach fuzzy clustering (SFCA) to support the short-range positioning. We use fixed access points calibrated at 2.4 GHz. We use real time data observed in the application of our model offline. We have extended the model to mimic the signals communications (DSRC) 5.9 GHz dedicated short range, as defined in 1609.x. IEEE The results are compared in each case with respect to the metering plate need Differential Global Positioning System (DGPS) captured in the same test. We kept Line-of-Sight (LOS) in all our clear assessment and use of vehicles (<60 km / h) moving at low speed. Two different options for implementing the SFCA are presented, analysed and compared the two. KEYWORDS: RAP, DSRC, WiFi 1. INTRODUCTION Since precise positioning using DGPS RTK can provide centimetre level accuracy only when the quality of the signal and the plural satellite signals are available. Urban canyons, tunnels, forests and construction sites are excellent examples congested environments DGPS RTK cannot work well. At least DGPS RTK requires four satellites with good geometry placement. In fact, many commercial systems often fail to resolve ambiguities of transport stage, unless (5+) satellites are present. Therefore, in order to maintain the level of accuracy in centimetres in such environments, a method for replacing and / or increased RTK DGPS signal is a necessary suboptimal condition. [1] 802.11 using street signs are proposed. Due to the wide availability of 802.11 signals in urban areas, we will focus on the availability of (5+) signs and centre the document in the position estimation model object using five 802.11 signals. While there are a limited number clustering algorithms in the initial number of groups are known before collation more known or computational algorithms complexity are, or can detect that the groups do not overlap, where the data points are closely clustered around a number of isolated centres. There are different approaches to strengthen the construction and analysis. One is the hierarchical approach, which divides all data supplied to two groups, then a partition of these two groups of two groups, and the partition continues until the desired number of groups or a certain criterion is met number is reached. While the hierarchical approach makes sense to group analysis, methods based on this approach [2][3][4] are complex calculations and are not a good choice for real-time applications. Another approach is to direct single-level or split directly down to the desired number of data sets. Generally, the direct approach is simple enough so that the hierarchical computational approach. In this article, we present a clustering algorithm based on the direct approach with the
-
Upload
ijitjournal -
Category
Technology
-
view
133 -
download
1
Transcript of FUZZY CLUSTERING FOR IMPROVED POSITIONING

International Journal on Information Theory (IJIT), Vol.4, No.4, October 2015
DOI : 10.5121/ijit.2015.4402 9
FUZZY CLUSTERING FOR IMPROVED POSITIONING
H. Kiwan and Y. Morgan
Software Systems Engineering, University of Regina
ABSTRACT
In this research, we focused on developing positioning system based on common short-range wireless. So
we developed a system that assumes the existence of a number of fixed access points (5+) and employ
arrival difference (TDOA) with Kalman filter. We also discuss multiple / tri-lateration and evaluate some
of the root causes dilution of precision (DOP) positioning using Kalman Filter. This article presents a
simpler approach fuzzy clustering (SFCA) to support the short-range positioning. We use fixed access
points calibrated at 2.4 GHz. We use real time data observed in the application of our model offline. We
have extended the model to mimic the signals communications (DSRC) 5.9 GHz dedicated short range, as
defined in 1609.x. IEEE The results are compared in each case with respect to the metering plate need
Differential Global Positioning System (DGPS) captured in the same test. We kept Line-of-Sight (LOS) in
all our clear assessment and use of vehicles (<60 km / h) moving at low speed. Two different options for
implementing the SFCA are presented, analysed and compared the two.
KEYWORDS:
RAP, DSRC, WiFi
1. INTRODUCTION
Since precise positioning using DGPS RTK can provide centimetre level accuracy only when the
quality of the signal and the plural satellite signals are available. Urban canyons, tunnels, forests
and construction sites are excellent examples congested environments DGPS RTK cannot work
well. At least DGPS RTK requires four satellites with good geometry placement. In fact, many
commercial systems often fail to resolve ambiguities of transport stage, unless (5+) satellites are
present. Therefore, in order to maintain the level of accuracy in centimetres in such environments,
a method for replacing and / or increased RTK DGPS signal is a necessary suboptimal condition.
[1] 802.11 using street signs are proposed. Due to the wide availability of 802.11 signals in urban
areas, we will focus on the availability of (5+) signs and centre the document in the position
estimation model object using five 802.11 signals. While there are a limited number clustering
algorithms in the initial number of groups are known before collation more known or
computational algorithms complexity are, or can detect that the groups do not overlap, where the
data points are closely clustered around a number of isolated centres. There are different
approaches to strengthen the construction and analysis. One is the hierarchical approach, which
divides all data supplied to two groups, then a partition of these two groups of two groups, and
the partition continues until the desired number of groups or a certain criterion is met number is
reached. While the hierarchical approach makes sense to group analysis, methods based on this
approach [2][3][4] are complex calculations and are not a good choice for real-time applications.
Another approach is to direct single-level or split directly down to the desired number of data
sets. Generally, the direct approach is simple enough so that the hierarchical computational
approach. In this article, we present a clustering algorithm based on the direct approach with the
International Journal on Information Theory (IJIT), Vol.4, No.4, October 2015
10
number of known or assumed specified groups. The initial group consists ofSFCA algorithm and
an iterative process based on a square criterion minimum average rating. SFCA be shown to
converge faster compared with existing known methods [5], the performance and computational
complexity. Since the selection of initial cluster centres often affects the results of clustering
algorithms and the amount of calculation needed, an effective method for determining a
reasonable set of initial cluster centres distributed based on component analysis is presented. Also
note that our claim of faster convergence and effective initial cluster centre cannot be generalized
because our assessment focuses on the application of main.Pendant positioning this time, the
evolution of real-time applications require precise positioning vehicles (RAP) in conditions that
are not favourable for GPS and the level of sub-centimetre accuracy. RAP has the fundamental
solutions for precision fitting, Bus Rapid Transit (RBT), platoons, smart cars and other vehicle
applications [6] [7]. In all these applications, the ability to accurately assess the results of objects
in automated movements that save time and money. In the example of precision reception,
manual hitch of a truck on a narrow shelf of time consuming and causes damage to the vehicle
and the platform. Alternatively, automatic coupling can achieve an accuracy of <1 cm and runs
faster than humans and a possible accuracy to be achieved by humans. In all these types of
applications, RAP is essential to facilitate these applications [8] [9].Systems increase GPS
satellite and always suffered dilution of precision (DOP) in adverse conditions where they
blocked the satellite signals and low elevation angles tri-lateration distort the geometry diluted
and the accuracy of the calculated position significantly. There have been several attempts to
increase satellite solutions with other wireless signals, especially with the cellular signal as in
[10] [11] and with broadband as in [12] [13]. Other researchers avoid altogether and built on road
GPS markers, such as magnetic guidance systems as in [6] [8] [9] .Our research focuses on the
use of high availability urban environment 802.11 signals. We discussed some of the factors
behind short-range wireless DOP. We extend our solution to mimic the 5.9GHz dedicated short
range communications (DSRC) and believe that the short-range nature enriches DSRC computing
RAP follows: [14] [19]
a) DSRC uses high availability low latency (HALL) channel that can be utilized for
positioning by utilizing round trip msg.
b) DSRC relies on Line-of-Sight (LoS) which would be available to all roaming vehicles.
c) The 5.9 GHz signal is strong and has relatively close proximity to roaming vehicles. The
elevation angle and close proximity improve accuracy.
Furthermore, DSRC has been viewed as the natural communication media for VII and
IntelliDrive initiatives. Therefore, we applied our scheme on both 802.11 and 5.9 GHz DSRC.
[14][7]
Our proposed scheme apply extended Kalman filter (EKF) for the observed signal. The resultant
is subjected to a simple observation from 802.11. Then, the problem becomes to investigate the
accuracy varying from the actual observed data. Signals from different sources are grouped using
the CFSP to provide reliable weight differentiated data available. The study illustrates the result
of analysis accuracy and precious introduced a combined approach which has the potential to
initiate new approach to advanced and complex. The rest of the paper is organized as follows; the
second section provides information about propagation technique used channel is provided.
Section three highlights the main convergence mechanisms of system aspects. The fourth section
of the test environment and equipment used are described. Section Five evaluate and analyse the
results. Section six concludes and discusses future work.

International Journal on Information Theory (IJIT), Vol.4, No.4, October 2015
11
2. CHANNEL PROPAGATION MODEL
To clarify our ideas, suppose in an environment, objects are moving freely in any direction in
space. At any point in time an accurate camera can capture the location of all objects as described
in
Figure 1.a. If the same camera captures a second location of the moving objects, they could be at
different locations as described in
Figure 1.b. Assuming that the camera is accurate enough that no movement happens during the
limited time the picture was taken, then, at any given point in time each object is located in a
unique position defined by three coordinates Λi = (xi, yi, zi) relative to a known absolute location.
Also bear in mind that the selected set of coordinates could be angular, Cartesian, or any other
coordinate system.
OX 4
Figure 1:Mobile Environment with Random Motion
Now assume a wireless signal has N resolvable propagation paths between the transmitter and
receiver. Since each reflector propagates multiple signals, and we potentially have multiple
reflected signals, we shall select the strongest reflected signal. We also use the multipath signal
parameters; Angle of Departure (AoD φi), Angle of Arrival (AoA θi), and delay of Arrival (DoA
τi). All of (φi, θi, and τi) can be measured using any available technique with respect to common
bearing direction. Then, as illustrated in
Figure 2, let (xΛ, yΛ), (xo, yo), and (xi, yi) be the true position of, respectively, the signal source, the
object of interest, and the ith reflective point where (xo, yo), and (xi, yi) are unknown. Let ρ'i, ρ"i be
the lengths of the segments forming the ith path respectively. Finally, let φi and θi be the angles of
departure and arrival for the ith path from the source to the object of interest.
From
Figure 2, we obtain φi and θi as a function of the locations of the mobile target and the reflection
point.

International Journal on Information Theory (IJIT), Vol.4, No.4, October 2015
12
Antenna Arrayr'
Antenna A
rray
Figure 2: A Multi-path Propagation Channel Model
)arctan(),,,(
)arctan(),,,(
si
si
iiooi
oi
oi
iiooi
xx
yyyxyx
xx
yyyxyx
−
−=
−
−=
ϕ
θ… 1
Equation 1 applies for i=1, …, N. Then assuming c is the, corrected, propagation speed, the Time
Difference of Arrival (TDoA) can be determined by:
Niandc
yxyx iiiooi
,,2
)(),,,( 1
K=
−=
ρρτ
… 2
Whereρi = ρ'i+ ρ"i, and:
22
22
)()(
)()(
sisii
oioii
yyxx
yyxx
−+−=′′
−+−=′
ρ
ρ … 3
Since we need to obtain the unknown position (xo, yo) from the known position (xΛ, yΛ), given the
uncertainty in ( iϕ̂ , iθ̂ and iτ̂ ), we apply expected statistical error in measuring (φi, θi, and τi) such
that:
i
i
i
nyxyx
nyxyx
nyxyx
iiooii
iiooii
iiooii
ϕ
θ
τ
ϕϕθθ
ττ
+=+=
+=
),,,(ˆ),,,(ˆ),,,(ˆ
…4
where (i
nϕ ,i
nθ , and i
nτ ) are the statistical errors, i=1, …, N for iϕ̂ and iθ̂ , but i=2, …, N iτ̂ .
Therefore, when the number of paths N ≥ 3, we get (3N–1) measurements and (2N+2) unknown
parameters. The problem yields a non-linear estimation problem that can be solved using machine
learning or stochastic learning automata. In this article, we choose to solve it using later approach.

International Journal on Information Theory (IJIT), Vol.4, No.4, October 2015
13
In that approach, all nodes cooperate to arrive to better relative ranging. Therefore, the collective
behavior of the selected set of nodes, or a cluster, are guaranteed to converge, since the
accumulation of relative distances will naturally tend to marginalize low accuracy ranging in
favor of the multiplicity of better accuracy ranging. Further, since the boundaries of the selected
set of nodes (a cluster of nodes) are finite, the problem lends itself to deterministic finite
automata. In the following section, we discuss the formulation of the automata model.
3. SFCA RATE OF CONVERGENCE
The performance rate of convergence of SFCA algorithms based on the criteria mentioned in
Section 2.1, including the LMS criterion, depend upon the initial classification of the data set.
[15]Proposed a procedure to find distributed initial cluster centers based on the comparison of the
distances between various data points. However, their procedure requires a large amount of
computation when the data size or the number of clusters is large enough like the case when
clustering wireless signals. Now, we would like to present a simple method for generating initial
cluster centers for the data set.
Assume that the p components of X are linearly independent and p≤ N. Then, T is a positive
definite and symmetric matrix and there exists a matrix C such that
==
p
t
d
d
d
DCTC
0
0
2
1
O 5
Wheredi: i=1, 2, …, p; are eigenvalues of T arranged in the order d1≥ d2≥ …≥dp, and the row ci
of C is the eigenvector associated with the eigenvalue di. Now the distributed initial cluster
centers can be found as follows:
Apply the orthogonal transformation C to the data set, i.e., X→Y = CX 6.
1) Based on the principal component analysis, and assuming that for i= 1, 2, …, p, the random
variable Yki= CXk. Letthe first R-1 components of Yi, i = 1, 2,…, N, toform the corresponding
vectors ui of Yi.
For each Yi classify Yi. with group θj if
jkRk
uu kiji
≠=
−<−
&,,2,1
,22
L
αα 7
2) Find the mean vector of Yi's classified to individual groups in Step (3). These mean vectors
are the initial cluster centers.
International Journal on Information Theory (IJIT), Vol.4, No.4, October 2015
14
It is noted that, in case R-1 >p, the above procedure can still be used by employing generalized
linear machines so that the number of components of the vector X is increased from p to q such
that R-1 ≤q.
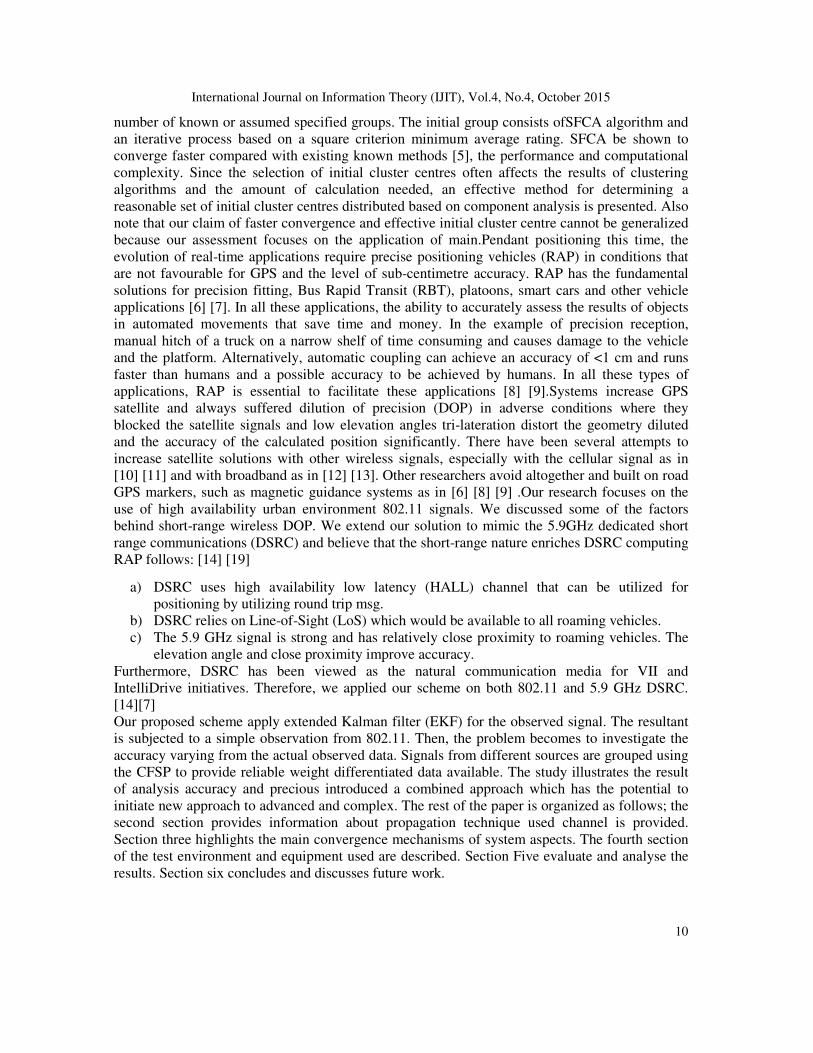
4. TESTING ENVIRONMENT
To test the proposed approach, we implemented five points 802.11 access capabilities, but easily
reconfigurable DSRC 5.9 GHz to imitate. The unit used Technocom multiband configurable
network (MCNU) is illustrated in Figure 3. The units were implanted at the locations shown in
Figure 4. The two test configurations were maintained over Innovation Drive (circular disc) and
Goulbourn long way (a straight line to the left). In both cases, the MCNU units were replaced so
that their signals are available through the observation path along Innovation Drive and then
along the path Goulbourn.MCNU units and the exact distances between the units were calibrated
using.We calculated laser measurement to an accuracy of <1 mm. The relative distances using
laser measurements were validated carful and location of each MCNU was recorded. All MCNU
was placed at a height of 1.75 m, which corresponds to the elevation of the antenna mounted on
the vehicle. Used neutralized rise issues relevant to the line of sight and simplifies the problem in
two dimensions as expected. The vehicle was driven at a speed of 20-40 kilometers per hour
roaming.
Figure 3: Multiband Configurable Network Unit
The temperature during the test varies from + 5° to + 10° C. The temperature radio can heat
slightly during the test. The average time to convert radios used in this condition was 200 ps and
worst case performance of the oscillator is 20 ppm. The test was conducted in late May 2009. The
software runs on PCs developed after collecting data from field observation. The system uses the
extended Kalman filter (EKF) using 2.4 steps and then using the 5.9 GHz band. After two phase
estimates are applied. First, the clock offset unknown receiver position, and only the difference
between simple differential receivers’ ambiguities. Secondly, the only difference estimators
floating ambiguity estimator then differ with laser measurement (for precision laser measurement
derived). This process is double difference ambiguity estimates.

International Journal on Information Theory (IJIT), Vol.4, No.4, October 2015
15
Figure 4: Satellite Image of Test Area
Object position using Kalman filter models as a random walk process with the right sound for
dynamic limited operations, such as topography. We began to discuss the state of the shift clock
receiver as a random walk. However, the error level was high enough to suggest an alternative
approach. Reference UTC Therefore, we adopted synchronized already used by the DSRC 5.9
GHz and, therefore, the shift clock was based entirely on each update without filtration.
5. EVALUATION AND ANALYSIS
To benefit from the test conducted, corresponding to the time data was collected and observes the
signal before and after the application of the Kalman filter. We conducted the test using the
MCNU material that can be adjusted to simulate WLAN or DSRC. One interesting observation is
the effect of the actual speed error rate as illustrated in Figure 5. The actual error here was
normalized to neutralize the effect of the distance. The figure shows that the higher the vehicle
speed is higher than the percentage of actual error. This arrangement resembles tests Goulbourn,
when the vehicle operates in a nearly straight line. The trend shows greater error rate continued in
all practice sessions, regardless of the use of the WiFi or DSRC. Also the relationship appears to
be linear and constant in all our tests. The test results at very low speeds (<5 km / h) or relatively
high speeds (> 55 km / h) have been marginalized in our test tools and environment have
difficulty handling these speeds.
Figure 5: Speed vs Actual Error
In both the accuracy of upper and lower speed based on no closer wireless devices that showed
better results. Figure 6 shows the absolute value of the estimated standard error in position against
the fixed distance to the wireless device. The figure also shows results for different vehicle
speeds. The straight lines expressing the WiFi test, while dotted lines express the DSRC test.
0.0
2.0
4.0
6.0
8.0
0 20 40 60
% A
ve
rag
e R
an
ge
Err
or
Speed (Kph)
Actual Error vs SpeedWiFi
DSRC
International Journal on Information Theory (IJIT), Vol.4, No.4, October 2015
16
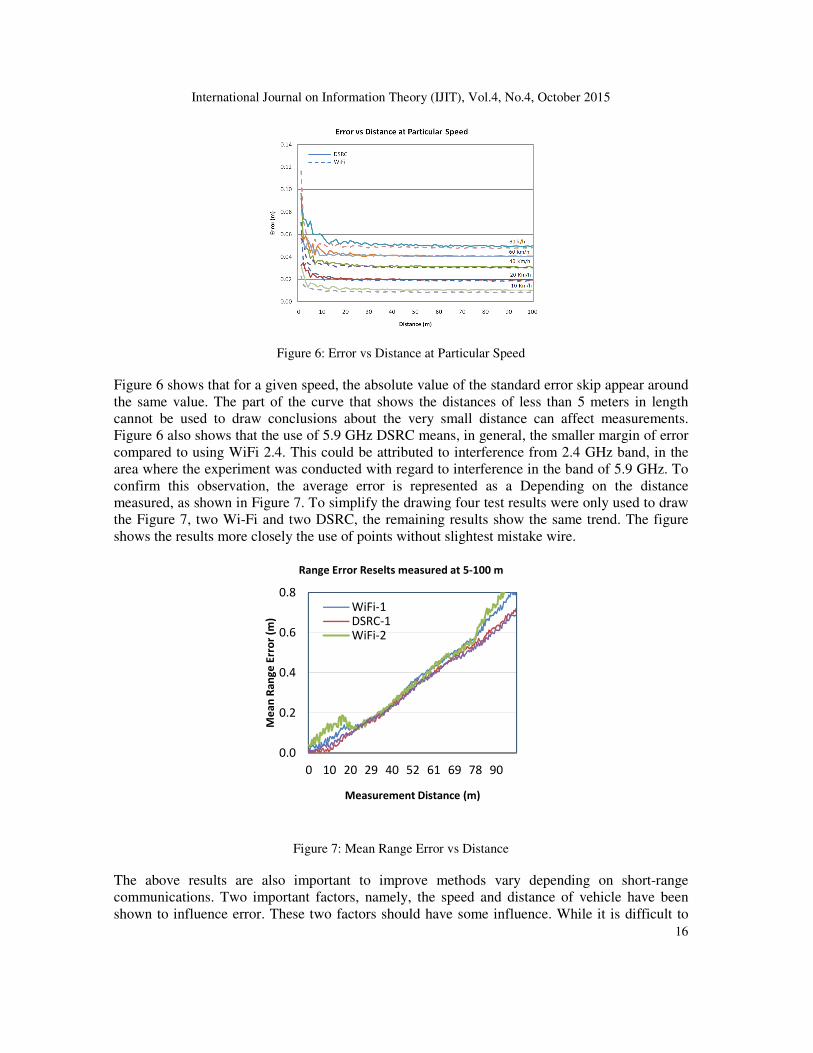
Figure 6: Error vs Distance at Particular Speed
Figure 6 shows that for a given speed, the absolute value of the standard error skip appear around
the same value. The part of the curve that shows the distances of less than 5 meters in length
cannot be used to draw conclusions about the very small distance can affect measurements.
Figure 6 also shows that the use of 5.9 GHz DSRC means, in general, the smaller margin of error
compared to using WiFi 2.4. This could be attributed to interference from 2.4 GHz band, in the
area where the experiment was conducted with regard to interference in the band of 5.9 GHz. To
confirm this observation, the average error is represented as a Depending on the distance
measured, as shown in Figure 7. To simplify the drawing four test results were only used to draw
the Figure 7, two Wi-Fi and two DSRC, the remaining results show the same trend. The figure
shows the results more closely the use of points without slightest mistake wire.
Figure 7: Mean Range Error vs Distance
The above results are also important to improve methods vary depending on short-range
communications. Two important factors, namely, the speed and distance of vehicle have been
shown to influence error. These two factors should have some influence. While it is difficult to
0.0
0.2
0.4
0.6
0.8
0 10 20 29 40 52 61 69 78 90
Me
an
Ra
ng
e E
rro
r (m
)
Measurement Distance (m)
Range Error Reselts measured at 5-100 m
WiFi-1
DSRC-1
WiFi-2

International Journal on Information Theory (IJIT), Vol.4, No.4, October 2015
17
identify the exact influence, the trend seems clear, higher speeds lead to greater errors. However,
these results were obtained in an almost ideal environment Clear line of sight and in the presence
of relatively fewer wireless noises. In addition, all tests were conducted road shows Goulbourn, a
street almost straight. When replication test drive innovation (circular) Results showed relatively
high levels of error. Therefore, a series of tests were performed to study the effect of relative
rotation angle. The relative rotation angle is defined here as the angle between the directions of
the vehicle at the time of observation in relation to the steering angle of the vehicle above five
points. Figure 8 shows the error of relative rotation angles. The figure shows that, the larger the
angle, the greater the likelihood of greater error. However, it is difficult to show a clear
relationship.
Figure 8: Ranging Error vs Relative Rotation Angle
This number confirms the findings of other studies using UWB where the angle of rotation tends
to cause less dilution of precision. There have been efforts to include the angle of arrival (AOA)
the use process. However, most previous attempts have focused on cellular signal; we intend to
expand our work to include AoA as part of our ongoing investigations. [16][14]
-0.10
-0.05
0.00
0.05
0.10
-90 -60 -30 0 30 60 90
Err
or
Re
lati
ve
to
Ra
ng
e
Relative Rotation Angleo
Error Distribution vs Rlative Rotation Angleo
Test 1
Test 2
Test 3
Test 4

International Journal on Information Theory (IJIT), Vol.4, No.4, October 2015
18
Figure 9: Overall Estimated Precision Errors
Positioning accuracy measured in our experiment was in line with our expectations. However, the
observed accuracy remains below desired. Although the average positional error remains much
higher than the level of 1 cm long, our results confirm the findings of other researchers as
[12][17][13] wherein the use of UWB sends assessments We experienced the same average error
here and illustrated in Figure 9. Figure 9 shows the average standard errors observed in all our
trials and the vehicle speed is represented before. DSRC has always shown better results in low
margins. In addition, the upward trend in the errors associated with increasing the distance varies
continuously and can be seen in Figure 9.
6. CONCLUSION AND FUTURE WORK
Although the results have met is encouraging, more work needs to be done to improve the
accuracy and lower error rate. We are working on the following sources of error to mitigate the
observed error and improve the performance of our technology. What follows is a description of
some of the ongoing work to improve our system.
6.1 Threshold Detection Classifiers:
The receiver of granularity can be used to help a classifier time. The classifier time good
electrical pulse signal received notes. In our application, the detection limit of the method for
detecting we constant energy pulses and evaluated using the thin edge reducing the time. This
classification shall be calibrated to draw the line carefully to avoid false detections due to noise
peaks and keep the limit to the desired operation. This task can be automated and can be the
subject of study itself.[18]
6.2 Geometric Walk Error:
Carefully calibrated limit of detection classifiers continue to suffer from foot geometric errors.
[16] Defined geometric foot fault is caused by amplitude and pulse shape variations create
geometric synchronization error gears. Jitter in time determines the accuracy in measuring the
0.040
0.045
0.050
0.055
0.060
0.065
0.070
10 20 30 40 50 60
Me
an
Est
ima
ted
/ A
ctu
al R
an
ge
Speed (Km/h)
Estimated vs Actual Precision (m)
WiFi
DSRC

International Journal on Information Theory (IJIT), Vol.4, No.4, October 2015
19
distance, a signal to noise function (SNR). Short Geometric is a major concern and can
significantly dilute the accuracy precision. Albite no other known sources of error and the signal
to noise ratio (SNR), signal availability, time and granularity other factors that will continue to
influence accuracy. We firmly believe that we must remain focused on the small number of
sources of error at a time, especially the error sources that can be neutralized in a controlled test
environment. [14] [7] this research raised based on EKF and use multi-lateration and use of short-
range communication such as Wi-Fi and DSRC. We have the availability of multiple signals (5+)
along our experience. To the best of our knowledge, there has been no similar research in this
area using the same wireless technology. Moreover, our accuracy corresponds to those obtained
by the nearest wireless technologies such as UWB [13], which increases our confidence in the
results and focus.
REFERENCES
[1] Manandhar, D., Honda, K. and Murai, S. Accuracy assessment and improvement for level survey
using real time kinematic (RTK) GPS 1999.
[2] L. MicóCorresponding, J. Oncina and R. C. Carrasco, A fast branch & bound nearest neighbour
classifier in metric spaces, in Pattern Recognition Letters, vol. 17, issue 7, June 1996, pp. 731-739.
[3] P. Yina and L. Chen, A new non-iterative approach for clustering, in Pattern Recognition Letters, vol.
15, issue 2, February 1994, pp. 125-133.
[4] P. Wang, X. Zhao, L. Wan, and M. Cai, A Hybrid Cluster Analysis Method Based on GA and FCM
for Automatically Identifying Joint Sets, in the Journal of University of Science and Technology
Beijing. vol. 26, no. 3, June 2004, pp. 227-232.
[5] A. Amir, and M. Lindenbaum, A generic grouping algorithm and its quantitative analysis, in the IEEE
transaction on Pattern Analysis and Machine Intelligence, vol. 20, issue 2, June 1998, pp. 168-185.
[6] Kamewaka, S., Uemura, S. A magnetic guidance method for automated guided vehicles 1987
[7] Jie Du, Barth, M. J. Next-Generation Automated Vehicle Location Systems: Positioning at the Lane
Level 2008
[8] H.G. Xu, C.X. Wang, R.Q. Yang and M. Yang, Extended Kalman Filter Based Magnetic Guidance
for Intelligent Vehicles, Intelligent Vehicles Symposium 2006, June-2006, Tokyo, Japan.
[9] P. Santos, S. Hole, C. Filloy and D. Fournier, Magnetic vehicle guidance, Emerald Group Publishing
Limited, pp: 132–135, vol. 28, issue 2, 2008.
[10] D. Manandhar', K. Honda' and S. Murai, Accuracy Assessment and Improvement for Level Survey
using Real Time Kinematic (RTK) GPS, in the proceedings of the IEEE International Geosciences
and Remote Sensing Symposium, IGARSS '99, pp: 882-885, vol: 2, Hamburg-Germany.
[11] Drane, C., Macnaughtan, M. and Scott, C. Positioning GSM telephones 1998
[12] Fontana, R.J., Ultra Wideband Precision Geolocation System, US Patent US006054950, Assigned to
Multispectral Solutions Inc. April 2000.
[13] Fontana, R.J., Experimental Results from an Ultra Wideband Precision Geolocation System,
Ultrawideband, Short Pulse Electromagnetic 5. Edited by P. D. Smith and S. R. Cloude, Kluwer
Academic /Plenum Publisher, pp 215-223.
[14] Guolin Sun, Jie Chen, Wei Guo and Liu, K. J. R. Signal processing techniques in network-aided
positioning: a survey of state-of-the-art positioning designs 2005.
[15] G. Chrysanthakopoulos, W.L.J. Fox, R.T. Miyamoto, R.J. Marks, M.A. El-Sharkawi, and M. Healy,
A fuzzy-logic autonomous agent applied as a supervisory controller in a simulated environment, in
the IEEE Transactions on Fuzzy Systems, vol. 12, issue 1, 2004, pp. 107-122.
[16] M. Amann, st al, Laser ranging: a critical review of usual techniques for distance measurement,
Society of photo-optical instrumentation ehgineers, vol: 40, num. 1, pp: 10-19.
[17] Hohman, D., Murdock, T., Westerfield, E., Hattox, T. and Kusterer, T. GPS roadside integrated
precision positioning system 2000

International Journal on Information Theory (IJIT), Vol.4, No.4, October 2015
20
[18] V Kukshya, H. Krishnan and C. Kellum, Performance Evaluation of a System for Estimating Relative
Positions of Vehicles During GPS Outages, Intelligent Vehicles Symposium 2006, June-2006, Tokyo,
Japan.
[19] Y. Morgan, Notes on DSRC and WAVE Standards Suite, Its Architecture, Design, and
Characteristics, in the IEEE-JCST, vol. 12, no. 4, September 2010.