Fuzzy Clustering in Context - ReStore Clustering in Context.pdf · Caveat on FS/QCA vs. Fuzzy...
32
Fuzzy Fuzzy Clustering in Clustering in Context Context Wendy Olsen, July 2004 Wendy Olsen, July 2004 [email protected] Please cite as: Olsen W. 2004 Fuzzy Clustering in Context. Paper presented as part of the Focusing on the Case Workshop series, July 2004.
Transcript of Fuzzy Clustering in Context - ReStore Clustering in Context.pdf · Caveat on FS/QCA vs. Fuzzy...

Fuzzy Fuzzy Clustering in Clustering in
ContextContextWendy Olsen, July 2004Wendy Olsen, July 2004
Please cite as:
Olsen W. 2004 Fuzzy Clustering in Context. Paper presented as part of the Focusing on the Case Workshop series, July 2004.

Fuzzy ClusteringFuzzy Clustering• A fuzzy cluster analysis breaks a
population of cases down into groups.
• It gives each case a measure of its distance from the core, or central point, of each hypothetical ‘group’ in the typology.
• The data-reduction which occurs uses cluster analysis principles.

Summary of PresentationSummary of Presentation• Comparison with QCA• Procedures used, and software• Assumptions necessary to Fuzzy
Clustering• Illustration using time-use patterns• Example using Sri Lankan Data• Exploration of another example

Characteristics of a fuzzy Characteristics of a fuzzy cluster analysiscluster analysis
• The group centres are hypothetical, and membership is fuzzy.
• Each group of cases has a central point in space, which is the ‘centre of gravity’ that minimises the distance from its members to its centre.
• The technique is spatially based and multi-dimensional
• Measurement metrics matter!
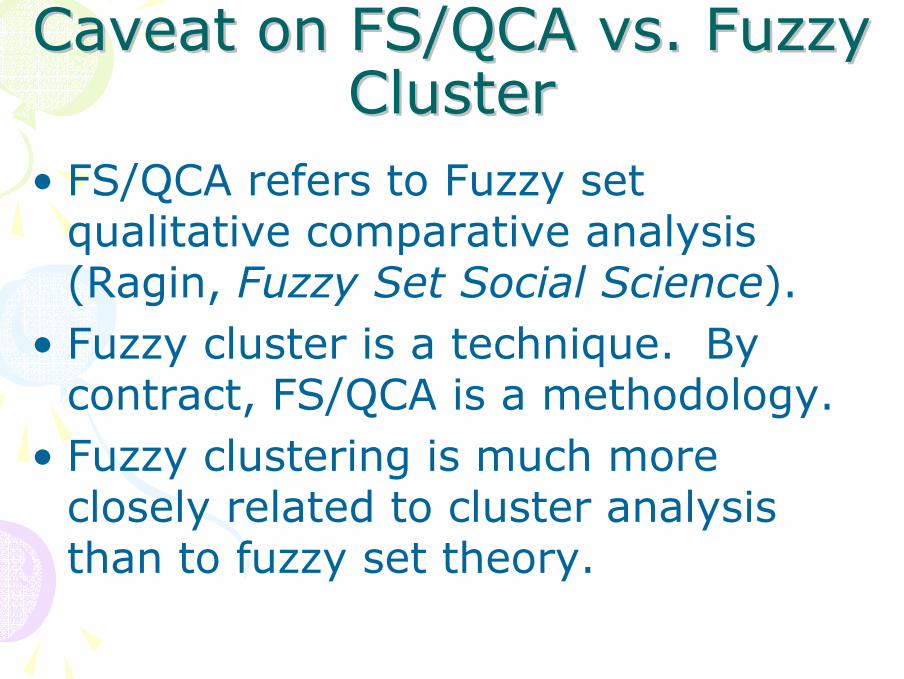
Caveat on FS/QCA vs. Fuzzy Caveat on FS/QCA vs. Fuzzy ClusterCluster
• FS/QCA refers to Fuzzy set qualitative comparative analysis (Ragin, Fuzzy Set Social Science).
• Fuzzy cluster is a technique. By contract, FS/QCA is a methodology.
• Fuzzy clustering is much more closely related to cluster analysis than to fuzzy set theory.

FS/QCA: FS/QCA: What is being covered in the What is being covered in the September 22/23 workshopSeptember 22/23 workshop
• The FS/QCA methodology is first and foremost qualitative and comparative.
• You create a series of cases which are substantively differentiated.
• Some comparative ‘variables’ take the form of non-crisp ‘sets’, with 0,.2,.5, 1.0 being values put into the table. 0.5 means ‘not in either set’.
• (rather than 0 and 1, numbers implying a crisp set)• For K dimensions, QCA has K crisp sets, giving through
permutations the no. of possible configurations.• For K dimensions, fuzzy set QCA has K fuzzy sets, giving
an infinite number of permutations as configurations.
• FS/QCA examines which factors are necessary and/or sufficient to the outcome.

What procedures are used What procedures are used in fuzzy in fuzzy clusteringclustering??
• We have several algorithms to choose from (Everitt). None are available in SPSS but K-cluster analysis using Classify menu option in SPSS [i.e. Quick Cluster] will give a typology somewhat similar to what you will get from FCLUSTER or CLUSTAN.
• Ideally you would have overlapping cluster memberships, but using SPSS K-Cluster you have mutually exclusive memberships and only 1 distance per case, even if you have some number of clusters >1.
• Some algorithms minimise the distance to the centre of gravity, and others maximise the likelihood of having placed each case correctly either ‘in’ a cluster or near its related centres of gravity.
• CLUSTAN is needed to do true fuzzy cluster analysis. You then get multiple distance variables: each case has a distance to the centre of gravity of each cluster.

The KThe K--means methodmeans method• The mean distance between cases
and their cluster centres are minimised.
• The number of clusters must be specified by you, the user, in advance. This is a disadvantage but, through iterations, you may find that you need fewer clusters.– (More clusters takes longer.)

The CLUSTAN methodThe CLUSTAN method• CLUSTAN is a package aimed
precisely at doing cluster analysis and visualising the results. It is worth getting if you intend to use the cluster analysis for any audience other than experts.
• You can then demonstrate the ‘clouds’ to them using graphics.

Connections with related Connections with related techniquestechniques
• Correspondence analysis allows us to consider not only the rows (i.e. placing the cases in the space) but also the variables (e.g. placing the high values of age into the space too, allowing variables to become part of the definition of a latent dimension, Axis 1)
• Principal components analysis and ANOVA are closely related but give us factors discriminating amongst the whole population of cases, rather than giving a typology.

How to do FCLUSTERHow to do FCLUSTER• Choose your variables.
– For K-clustering, you need to use only normally distributed variables.
– In CLUSTAN you have the option to use categorical variables.
– Ordinal variables must be binarised or converted to a measurement metric.
• Decide on how many clusters (max) you want.
• Run Classify > K-Cluster.• Examine results.

An Exemplar An Exemplar –– in Briefin Brief• Time use diaries record various
activities over the course of one weekday and one weekend day for 8000 persons, UK 2000.
• The individual minutes-per-day spent on each non-work activity is the topic of a study of practices of consumption (Warde, Olsen, et al.)

Report
112.1409 22.5294 66.9415 19.5718 28.3250 81.04043927 3927 3927 3927 3927 3927
54.47444 40.60960 41.05933 29.22918 43.36162 60.35103111.4133 13.7441 74.3817 75.2832 23.2281 67.9525
4168 4168 4168 4168 4168 416853.71436 31.31775 42.01348 55.65556 33.40015 52.81864111.7663 18.0057 70.7725 48.2583 25.7005 74.3013
8095 8095 8095 8095 8095 809554.08228 36.38847 41.71688 52.76837 38.63677 56.97111
MeanNStd. DeviationMeanNStd. DeviationMeanNStd. Deviation
gendermale
female
Total
sum of eatingout, eating athome and at
work,entertainingand visiting
mins pe eat_out
eating athome (inc sechome 2000)minutes per
day
preparingmeals orsnacksminutesper day
sum ofreading
books andmagazinesand others
mins per day
sum ofleisure andobligatorytravel mins
per day
FCLUSTER ResultsFCLUSTER Results• Examine the means of the clusters for
each continuous variable. These describe how different they are.
• You can ‘save’ the cluster membership and the distance variable. Now you can use the results to see which cases are typical, and which atypical (regress distance on some X var’s, using Cluster dummy QCL-1
• Examine the results.

Report
Mean
127.6242 7.6536 102.1136 79.3687 53.6528 49.4085175.4903 116.0787 39.9339 23.8879 18.0659 163.5921
76.1974 13.7200 46.7366 29.9907 13.7287 89.0830103.5234 23.2065 63.4906 44.9256 26.8372 84.8385
Cluster Number of Case123Total
sum of eatingout, eating athome and at
work,entertainingand visiting
mins pe eat_out
eating athome (inc sechome 2000)minutes per
day
preparingmeals orsnacksminutesper day
sum ofreading
books andmagazinesand others
mins per day
sum ofleisure andobligatorytravel mins
per day
Naming the clusters: seeking to label and describe the groups which best typologise the people, which are perhaps:
Cluster 1: Elder people who cook a lot and don’t eat out; there are more women here; ‘elderly’
Cluster 2: Younger people who eat out lots and do lots of leisure travel such as walking or cycling.
Cluster 3: Younger people who spend ages travelling to work or school and have no leisure travel.

Final Cluster Centers
53.65 18.07 13.73
102.11 39.93 46.74
6 7 7
79.37 23.89 29.99
59 41 39.66 .46 .47
19.68 122.29 23.23
29.73 41.31 65.85
7.65 116.08 13.72
sum of reading booksand magazines andothers mins per dayeating at home (inc sechome 2000) minutesper dayhousehold incomeband (gross ie beforedeductions) - per year(source: hhld qstnpreparing meals orsnacks minutes per dayage last birthdayGenderLeisure travel minutesper dayobligatory travelminutes per dayeat_out
1 2 3Cluster

Test for change over time:Test for change over time:Classification Tablea
7055 187 97.4408 445 52.2
92.6
Observed.001.00
elderly
Overall Percentage
Step 1.00 1.00
elderly PercentageCorrect
Predicted
The cut value is .500a.
Variables in the Equation
.071 .003 526.675 1 .000 1.0741.436 29.367 .002 1 .961 4.206
-2877.183 58733.629 .002 1 .961 .000
ageyearConstant
Step1
a
B S.E. Wald df Sig. Exp(B)
Variable(s) entered on step 1: age, year.a.

Assumptions of F ClusterAssumptions of F Cluster• Fuzzy cluster assumptions vary depending
upon which software you are using.– If you use K-Means in SPSS, all variables must
be continuous and normally distributed. However if you break this rule, your results might be durable (compared with meeting this rule)
– In other packages, you can have a mixture of categorical and Gaussian variables.
• Your ordinal variables’ measurement metrics are highly influential if you put the variables in as if they were continuous.– Such matters are the subject of FS/QCA.

Fuzzy Cluster: WHY?Fuzzy Cluster: WHY?• Integrating qualitative and quantitative
analysis may require a two-stage approach.– First reduce a large data set using clusters,
and locate ideal types and/or typical cases.– Then gather or re-examine qualitative small-
scale data on similar cases! use QCA or FS/QCA
– Draw conclusions which are generalisable.

How to Test Whether an Ordinal Variable is How to Test Whether an Ordinal Variable is Ordinal or NominalOrdinal or Nominal
• For a variable to be ordinal with respect to the other variables that are in the set, i.e. in the causal complex you are exploring [or which together proxy for some latent factor or factors that discriminate cases], you can run a test.
• Use correspondence analysis or HOMALS. Find the weights that correspond to each element in your ordinal variable after putting it in ‘as if’ it were nominal.
• If they rise monotonically, or vice versa, then you have a good argument for ordinality.
• However, since the variable is not normally distributed, you still ‘break the rules’ of K-means clustering if you put the variable in.

Help with HOMALSHelp with HOMALS• An intriguing set of slides assists you
in using correspondence analysis or HOMALS,
• And also introduces PRINCALS via CATPCA, an SPSS 11 and 12 menu item which allows for ordinal variables in principal components analysis. See [email protected]
• Richard Bell (also via RM website)

Example using Sri Lankan Example using Sri Lankan DataData
• Context: financial exclusion is a form of social exclusion.
• A theoretical model – 3 theories:– T1: Structural divisions lead to financial
exclusion, so gender (feminist theory), class (Marxist), and location (geographers) influence the odds of having a bank loan
– T2: Furthermore, religion and culture influence one’s interest in bank loans Lunt and the sociologists and market researchers; JournEconPsych.
– T3: Other loan sources offer an alternative to bank loans, too. (Substitutes economics; social policy)

Variables Operationalising Variables Operationalising Theories T1 and T3Theories T1 and T3
• Household income• Land owned• Gender• Age and age-squared• Whether teetotal• Religion: Sinhala Buddhist / Muslim• Personal use of banks• Others in household using banks• Personal use of non-bank credit• Others in hhold using non-bank credit

Variables Operationalising Variables Operationalising Theory T2Theory T2
• Attitudes, as reflected in a series of Likert scale questions.
• Each is scaled 1 to 5.
• With this ‘metric’ taken as if it were a continuous distribution, we do apparently get ‘normal distributions’

Exercise: Cluster the cases Exercise: Cluster the cases by the attitudes expressedby the attitudes expressed
• You would be working on the sociological and economic-psychology aspects of the underlying reality.– Market research is closely related to these.
• Please refer to the web site for the sample data set on Sri Lankan attitudes to banking.
• There are 21 Likert Scales and a few demographics.
• Do a cluster analysis after carefully selecting just five or ten attitude Q’s.
• Use K-means to examine the distance of cases from their cluster means.

Means of Selected VariablesMeans of Selected Variables
Report
4.03 4.03 3.63 3.25 3.93205 205 205 205 205.877 .915 .740 1.058 .872
MeanNStd. Deviation
Some peoplehave
unbearablelevel of
indebtedness
Debt is astone around
the neck
Getting loansenables
people tomake
imporantpurches
Savings in thebank is not atall priority for
me
I like to saveand keepmoney on
side for uselater

Results of Cluster AnalysisResults of Cluster Analysis
Report
3.20 3.80 3.80 1.20 1.00 2.40
5 5 5 5 5 5
1.304 .447 .447 .447 .000 1.140
3.36 3.26 3.14 3.26 3.88 3.55
42 42 42 42 42 42
.692 .857 .521 .989 .453 .772
4.20 4.34 3.69 3.19 3.90 4.01
70 70 70 70 70 70
.528 .535 .733 .822 .684 .602
4.27 3.91 3.77 3.27 4.32 4.14
44 44 44 44 44 44
.924 1.030 .711 1.208 .708 .632
4.42 4.58 3.92 3.72 3.94 4.11
36 36 36 36 36 36
.996 .770 .806 1.085 1.013 .785
4.05 4.05 3.63 3.27 3.92 3.92
197 197 197 197 197 197
.873 .905 .741 1.061 .869 .765
Mean
N
Std. Deviation
Mean
N
Std. Deviation
Mean
N
Std. Deviation
Mean
N
Std. Deviation
Mean
N
Std. Deviation
Mean
N
Std. Deviation
Cluster
1: Don’t dislike debt
1
2: Like debt, not savings
2
3: Prefer savings to debt
3
4: Like savings
4
5: Debt worries yet no savings
5
Total
Some peoplehave
unbearablelevel of
indebtedness
Debt is astone around
the neck
Getting loansenablespeople to
makeimportantpurchases
Savings in thebank is not atall priority for
me
I like to saveand keepmoney on
side for uselater
if one cansave up
money, onecan invest it
later in auseful way

Sample Results from KSample Results from K--means means ClusteringClustering
Each row represents one actual case.
Cluster Distance from centre1 3.949681 3.346641 2.607681 5.196151 3.660602 1.814842 2.106302 2.555732 2.555732 2.54639
Why not choose a case near the centre of each cluster for further study?

Another exemplarAnother exemplar• You may wish to use data-reduction
merely for the purpose of generating an outcome-variable across lots of cases
• This outcome-variable, which is a typology, can be used in QCA with small-N in a qualitative study.
• The typology from fuzzy cluster procedures would be a fuzzy set!
Variables To Be Used to Variables To Be Used to Proxy the Outcome TypesProxy the Outcome Types
• Personal use of nationalised bank(s)• Personal use of private or rural bank(s)• Personal savings in banks• Others in household using banks etc.• Personal use of non-bank credit etc.• Others in hhold using non-bank credit etc.
– More variables at this stage doesn’t matter– Using categorical instead of continuous variables is fine
as long as you use the appropriate form of cluster analysis
– Exploring the results helps you decide whether there is one outcome or two or three. (how large a typology)
Note: in the national data-set for Sri Lanka 1996-97, we have explicit indicators of all the same variables, i.e. use of each type of banking service. I could derive the clusters from this set before going to villages.

An analogy with labourAn analogy with labour--market researchmarket research
• Labour market participation occurs in several forms – employment contracts, casual piecework, paid overtime, unpaid overtime, temporary jobs, and self-employment. The outcome might require clustering. Types-of-worker exist.
• You can then engage in qualitative research, comparative research, etc.
• You have successfully integrated quantitative analysis at stage 1 with qualitative analysis at stage 2, and yet the latter is not made marginal.

Further readingFurther reading• Everitt’s book is good on cluster analysis.• See Warde, et al., working papers on the
web regarding ‘changing practices in the UK using time-use data’ (Cultures of Consumption programme of ESRC)
• See Olsen, chapter on triangulation, on our website, for background to mixed methods.
• See Olsen, background paper on the Sri Lankan research, consisting of a chapter, on our website.