
Future steel vehicel
43
Future Steel Vehicle Phase I - Executi ve Summary
-
Upload
suribabumech -
Category
Documents
-
view
219 -
download
0
Transcript of Future steel vehicel

8/8/2019 Future steel vehicel
http://slidepdf.com/reader/full/future-steel-vehicel 1/42
Future Steel Vehicle
Phase I - Executive Summary

8/8/2019 Future steel vehicel
http://slidepdf.com/reader/full/future-steel-vehicel 2/42

8/8/2019 Future steel vehicel
http://slidepdf.com/reader/full/future-steel-vehicel 3/42
Future Steel Vehicle
Contents
1 Executive summary 1
1.1 Project Objectives . . . . . . . . . . . . . . . . . . . . . . . . . . . . . . . . . . . . 1
1.1.1 FSV Project Phases Overview . . . . . . . . . . . . . . . . . . . . . . . . 2
1.2 Vehicle Size & Powertrains . . . . . . . . . . . . . . . . . . . . . . . . . . . . . . . 3
1.2.1 Vehicle Size . . . . . . . . . . . . . . . . . . . . . . . . . . . . . . . . . . . 3
1.2.2 FSV Advanced Powertrain Options & Performances . . . . . . . . . . . . 4
1.3 Future Steel Vehicle Design & Layout . . . . . . . . . . . . . . . . . . . . . . . . . 51.3.1 FSV Front-End . . . . . . . . . . . . . . . . . . . . . . . . . . . . . . . . . 5
1.4 Future Steel Vehicle-1 (FSV-1) . . . . . . . . . . . . . . . . . . . . . . . . . . . . . 7
1.4.1 FSV1 - (PHEV20) . . . . . . . . . . . . . . . . . . . . . . . . . . . . . . . . 7
1.4.2 FSV-1 - BEV . . . . . . . . . . . . . . . . . . . . . . . . . . . . . . . . . . 8
1.5 Future Steel Vehicle -2 (FSV-2) . . . . . . . . . . . . . . . . . . . . . . . . . . . . . 91.5.1 FSV-2 (PHEV40) . . . . . . . . . . . . . . . . . . . . . . . . . . . . . . . . 9
1.5.2 FSV-2- FCEV . . . . . . . . . . . . . . . . . . . . . . . . . . . . . . . . . . 10
1.6 FSV - Estimated Masses . . . . . . . . . . . . . . . . . . . . . . . . . . . . . . . . 11
1.7 FSV Cost of Ownership . . . . . . . . . . . . . . . . . . . . . . . . . . . . . . . . . 13
1.8 Environmental Impact . . . . . . . . . . . . . . . . . . . . . . . . . . . . . . . . . . 15
1.8.1 FSV Fuel Economy and CO2 Emissions . . . . . . . . . . . . . . . . . . . 151.9 Well-to-Pump Assessment . . . . . . . . . . . . . . . . . . . . . . . . . . . . . . . 171.10 FSV-1 - Environmental Assessment . . . . . . . . . . . . . . . . . . . . . . . . . . 18
1.10.1 FSV-1 - Pump-to-Wheel CO2 Emissions . . . . . . . . . . . . . . . . . . . 18
1.10.2 FSV-1 - Well-to-Wheel CO2 Emissions . . . . . . . . . . . . . . . . . . . . 19
1.11 FSV-2 - Environmental Assessment . . . . . . . . . . . . . . . . . . . . . . . . . . 20
1.11.1 FSV-2 - Pump-to-Wheel CO2 Emissions . . . . . . . . . . . . . . . . . . . 20
1.11.2 FSV-2 - Well-to-Wheel CO2 Emissions . . . . . . . . . . . . . . . . . . . . 211.12 Technology Assessment . . . . . . . . . . . . . . . . . . . . . . . . . . . . . . . . 22
1.12.1 Future Advanced Powertrains Summary . . . . . . . . . . . . . . . . . . . 22
1.12.2 Advanced Powertrain Technologies . . . . . . . . . . . . . . . . . . . . . . 23
1.12.3 Steel Technologies . . . . . . . . . . . . . . . . . . . . . . . . . . . . . . . 29
1.12.4 Automotive Technology Assessment . . . . . . . . . . . . . . . . . . . . . 32
1.13 Future Safety Requirements . . . . . . . . . . . . . . . . . . . . . . . . . . . . . . 35
1.14 Fuel Economy Requirements . . . . . . . . . . . . . . . . . . . . . . . . . . . . . . 36
I

8/8/2019 Future steel vehicel
http://slidepdf.com/reader/full/future-steel-vehicel 4/42

8/8/2019 Future steel vehicel
http://slidepdf.com/reader/full/future-steel-vehicel 5/42
Future Steel Vehicle
1.0 Executive summary
1.1 Project Objectives
The future direction of the transportation industry is being influenced by an increasing demand
for better fuel economy, and to reduce emissions that result in greenhouse gas induced global
warming. Increasing vehicle efficiency and the use of alternate low-carbon content fuels will notonly reduce petroleum consumption, but also decrease the carbon footprint associated with the
burning of fossil fuels. The use of advanced powertrains will lead to an increased focus on vehicle
weight reduction and hence, material selection.
This project will illustrate to WorldAutoSteel member companies, the new advanced powertraintechnologies that are now being cultivated to fruition towards the year 2020 and beyond. In the
Future Steel Vehicle program, EDAG’s focus is on a holistic approach to the concept development
of innovative vehicle layout and optimized vehicle architecture. The proposed designs will offer
advanced high-strength, steel intensive solutions to answer the call of reduced weight vehicles,
resulting in a lighter, more fuel and cost efficient vehicle that will reduce the carbon footprint as-
sociated with the growing automotive market. Use of advanced high-strength steels and the latest
manufacturing processes, which reflect state-of-the-art or future trends, are the primary designobjectives. The Future Steel Vehicle development program will focus on the achievement of fu-
ture crash and safety requirements coupled with the demonstration of low CO2 emissions, and
affordability of a steel intensive vehicle architecture using advanced powertrain technologies.
The main objectives of the FSV program can be broken down into five goals, which encompassthe use of advanced high-strength steels:
1. Identify advanced powertrains and their impact on vehicle architecture
2. Investigate steels capability to meet the structural needs of advanced powertrain vehicles
3. Investigate vehicle weight reduction potential with the use of Advanced High-Strength Steels
(AHSS), advanced manufacturing processes, and the use of computer aided structural opti-
mization4. Understand the loads imposed by advanced powertrains on the vehicle structure, thus iden-
tifying the requirements for new grades of steel for optimized low-mass vehicle structural
applications and design
5. Identify new opportunities for steel uses in advanced powertrains and related infrastructures
1
8/8/2019 Future steel vehicel
http://slidepdf.com/reader/full/future-steel-vehicel 6/42
Future Steel Vehicle 1 Executive summary
1.1.1 FSV Project Phases Overview
The Future Steel Vehicle program is split into the following three phases:
Phase I: Engineering study (2008 - July, 2009)
Phase II: Concept design (August, 2009 - 2010)
Phase III: Demonstration of hardware (2010-2011)
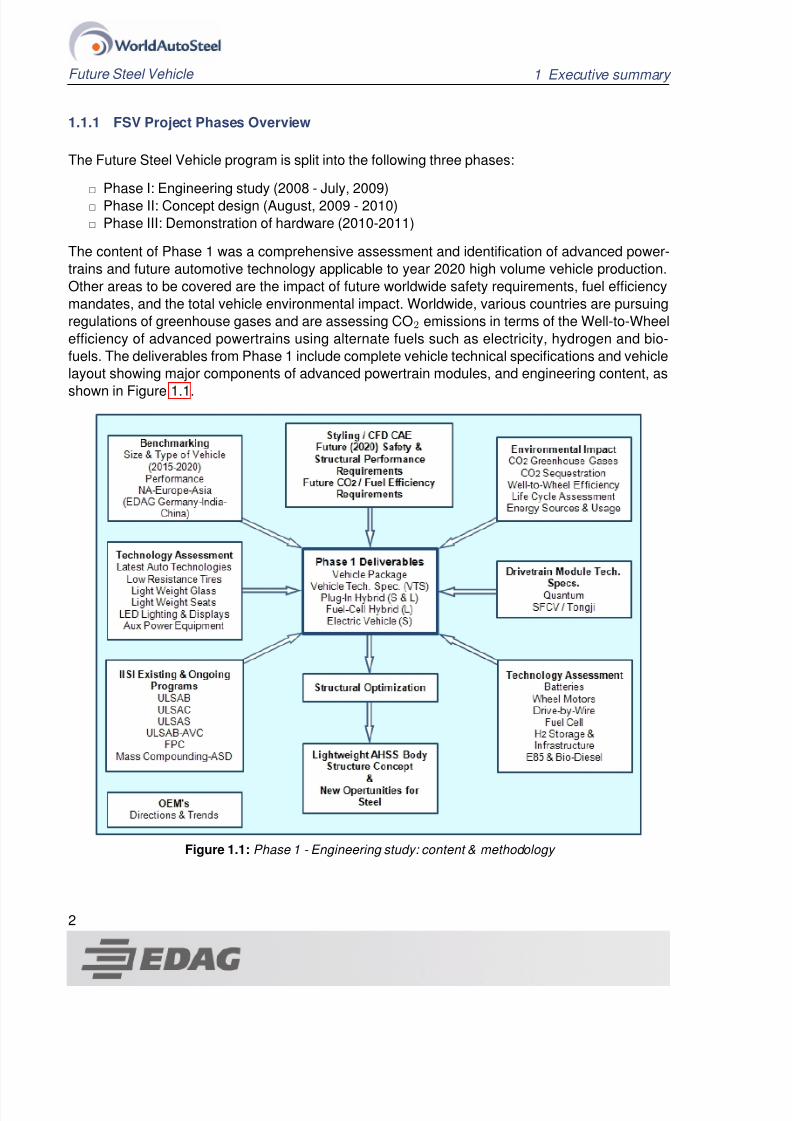
The content of Phase 1 was a comprehensive assessment and identification of advanced power-
trains and future automotive technology applicable to year 2020 high volume vehicle production.
Other areas to be covered are the impact of future worldwide safety requirements, fuel efficiency
mandates, and the total vehicle environmental impact. Worldwide, various countries are pursuing
regulations of greenhouse gases and are assessing CO2 emissions in terms of the Well-to-Wheel
efficiency of advanced powertrains using alternate fuels such as electricity, hydrogen and bio-
fuels. The deliverables from Phase 1 include complete vehicle technical specifications and vehiclelayout showing major components of advanced powertrain modules, and engineering content, as
shown in Figure 1.1.
Figure 1.1: Phase 1 - Engineering study: content & methodology
2

8/8/2019 Future steel vehicel
http://slidepdf.com/reader/full/future-steel-vehicel 7/42
1.2 Vehicle Size & Powertrains Future Steel Vehicle
1.2 Vehicle Size & Powertrains
1.2.1 Vehicle Size
Worldwide market analysis shows that over 70% of the cars sold in today’s marketplace share
two vehicle sizes: the small Car, (A & B Class) up to 4,000 mm long, and the mid-class car,
(C & D class) up to 4,900 mm long. To encompass both segments of the worldwide market,
the Future Steel Vehicle program includes two vehicle sizes, FSV-1 and FSV-2. The packagingspecifications and vehicle performance for each of the vehicles were determined to be acceptable
and appropriate for each class of vehicle, in line with worldwide OEM trends.
The determination of vehicle interior dimensions and luggage space requirements were based on
each vehicle size and its intended usage. FSV-1 is a small vehicle mainly intended for city and
shorter daily driving and, in terms of size, FSV-2 is at the low-end of the mid-size range of vehicles,intended for long range driving with larger luggage carrying capacity. The FSV-1 and FSV-2 layout
and capacities are shown in Table 1.1.
FSV1 Occupants: FSV2 Occupants:
Front Row Seating: 2 Front Row Seating: 2
Rear Row Seating: 2+ Rear Row Seating: 3
Class Front Leg Room Rear Leg Room Luggage
[mm] [mm] [Liters]
FSV-1 1070 825 250
FSV-2 1070 925 370A 1055 760 170
B 1065 850 340
C 1070 877 370
D 1075 961 450
Table 1.1: FSV-1 and FSV-2 vehicle capacity
3

8/8/2019 Future steel vehicel
http://slidepdf.com/reader/full/future-steel-vehicel 8/42
Future Steel Vehicle 1 Executive summary
1.2.2 FSV Advanced Powertrain Options & Performances
The assessment of the announcements from automobile manufacturers shows progress on vari-
ous technologies that include:
1. Conventional Internal Combustion Engine (ICE) based, smaller more efficient gasoline/diesel
vehicles
2. Hybrid Electric Vehicles (HEV) predominantly using fossil-based petroleum fuels
3. Plug-in Hybrid Electric Vehicles (PHEV) with a limited range of distance driven in electric
mode using electricity from the power grid. This option offers a significant reduction in fossil
based petroleum usage, especially when the daily distances driven are close to the vehicle’s
electric range, with any additional distance driven using fossil based petroleum fuels
4. Battery Electric Vehicles (BEV) with a driving range of approximately 200 km
5. Fuel Cell Electric Vehicles (FCEV) using hydrogen gas as a fuel source
Assessment of year 2015 to 2020 powertrain component mass, cost and sizes were taken into ac-
count when determining the suitability of each powertrain for each vehicle size. The powertrains
chosen for the smaller vehicle (FSV-1) included Plug-in Hybrid (PHEV20) and Battery Electric
Vehicle (BEV). For the smaller car, the Fuel Cell Electric Vehicle (FCEV) powertrain was not im-
plemented due to excessive cost and complexity involved with hydrogen storage and fuel stackinstallation. For the larger vehicle (FSV-2) the BEV option was not included due to the larger and
more costly battery requirements for larger vehicles. The chosen powertrain options and perfor-
mance parameters are shown in Table 1.2.
Plug-in Hybrid (PHEV) Fuel Cell (FCEV) Battery Electric (BEV)
FSV 1 PHEV 20 BEV
Electric Range - 32km (20mi)
Total Range - 500km Total Range - 250km
Max Speed -150km/h Max Speed -150km/h
0-100km/h 11-13s 0-100km/h 11-13s
FSV 2 PHEV 40 FCEV
Electric Range - 64km (40mi)
Total Range - 500km Total Range - 500km
Max Speed - 161km/h Max Speed - 161km/h
0-100km/h 10-12s 0-100km/h 10-12s
Table 1.2: Powertrain options & performance
4
8/8/2019 Future steel vehicel
http://slidepdf.com/reader/full/future-steel-vehicel 9/42
1.3 Future Steel Vehicle Design & Layout Future Steel Vehicle
1.3 Future Steel Vehicle Design & Layout
Results of technology assessment and powertrain component feasibility studies conducted by
Quantum and Shanghai Fuel Cell Vehicles (SFCV), were used for vehicle layout studies. Several
layouts were analyzed for each vehicle and powertrain for efficient usage of packaging space andvehicle mass distribution. For the two chosen vehicle sizes, it became apparent that a common
platform theme can be developed, utilizing shared technologies in a modular fashion between the
following four vehicle powertrain variants:
1. FSV-1 - Battery Electric Vehicle (BEV)
2. FSV-1 - Plug-In Hybrid Electric with a 32 km (20 mile) all-electric range (PHEV20)
3. FSV-2 - Plug-In Hybrid Electric with a 65 km (40 mile) all-electric range (PHEV40)
4. FSV-2 - Fuel Cell Hybrid Electric Vehicle (FCEV)
1.3.1 FSV Front-End
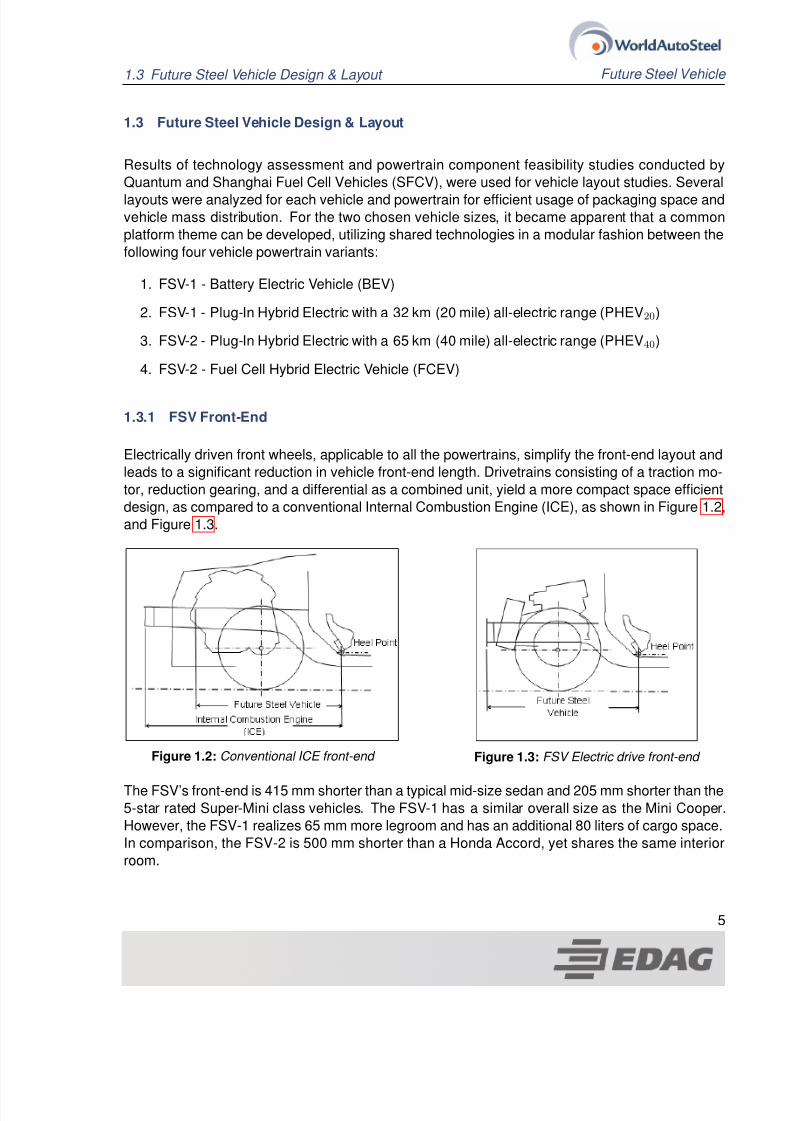
Electrically driven front wheels, applicable to all the powertrains, simplify the front-end layout and
leads to a significant reduction in vehicle front-end length. Drivetrains consisting of a traction mo-
tor, reduction gearing, and a differential as a combined unit, yield a more compact space efficient
design, as compared to a conventional Internal Combustion Engine (ICE), as shown in Figure 1.2,
and Figure 1.3.
Figure 1.2: Conventional ICE front-end Figure 1.3: FSV Electric drive front-end
The FSV’s front-end is 415 mm shorter than a typical mid-size sedan and 205 mm shorter than the5-star rated Super-Mini class vehicles. The FSV-1 has a similar overall size as the Mini Cooper.
However, the FSV-1 realizes 65 mm more legroom and has an additional 80 liters of cargo space.
In comparison, the FSV-2 is 500 mm shorter than a Honda Accord, yet shares the same interior
room.
5

8/8/2019 Future steel vehicel
http://slidepdf.com/reader/full/future-steel-vehicel 10/42
Future Steel Vehicle 1 Executive summary
The electric drive proposed for the FSV vehicles is similar to the drive used on the Honda Clarity
FCEV as illustrated in Figure 1.4 [1], yet much smaller.
Figure 1.4: Compact Electric Drive
The size of conventional internal combustion engines, and HEV powertrains, generally restrict
the size and shape of body structural members in the front-end, leading to an inefficient use of
materials. The FSV front-end frees up space for an optimized front-end structure. The front-end
rails, which play a major role in controlling and absorbing energy in front crashes, can be optimizedfor section shape and hence, minimizing mass. See Figure 1.5 for the front-end rail structure.
Figure 1.5: Front-end rail
1Source: Honda Motor Company
6

8/8/2019 Future steel vehicel
http://slidepdf.com/reader/full/future-steel-vehicel 11/42
1.4 Future Steel Vehicle-1 (FSV-1) Future Steel Vehicle
1.4 Future Steel Vehicle-1 (FSV-1)
FSV-1 is a 4-door hatchback, 3,700 mm long, designed to accept two powertrain options: Plug-In
Hybrid Electric Vehicle - PHEV20 and Battery Electric Vehicle - BEV. Both powertrains share a
common front-end and common front wheel drive traction motor. The traction motor is rated at apeak power of 67 kW (49 kW continuous power).
1.4.1 FSV1 - (PHEV20)
The PHEV20 will have an all-electric range of 32 km (20 miles) on a fully charged battery pack.
The battery pack is a lithium-ion manganese based cell with a 5 kWh capacity (45 kg mass, 36-
liter volume). The battery pack charging time, using a 110 V, 10 amp electric service is 3.4 hours
(using 220 V/15 amp, is 1.1 hours). The extended range of 500 km for PHEV20 is provided by
a rear mounted 1.0L-3 cyl gasoline engine/generator set, mounted just ahead of the rear axle,
leading to a 50/50 vehicle mass split between front and rear wheels. This packaging arrangementuses the space underneath the rear floor where conventional vehicles place the spare tire. The
arrangement is similar to Daimler’s Smart-For-Two and Mitsubishi’s i-Minicar production vehicles.
The FSV installation will be simpler, as the engine does not drive the wheels or any belt driven
auxiliary devices.
The under floor structure for the PHEV20 has to be adapted to accommodate the 5 kWh battery
pack in the tunnel under the front floor. The engine/generator set mounted under the rear floor
will require careful consideration for packaging the rear suspension, and sufficient structure to
handle all the dynamic and rear impact crash loading. The layout for PHEV20 is a rear sub-frame
assembly that can support the engine/generator mounts, and rear multi-link suspension that will
form the basis of the rear structure. See Figure 1.6 for PHEV20 layout.
Figure 1.6: PHEV 20 powertrain layout
7

8/8/2019 Future steel vehicel
http://slidepdf.com/reader/full/future-steel-vehicel 12/42
Future Steel Vehicle 1 Executive summary
1.4.2 FSV-1 - BEV
The FSV-1 BEV is designed to have a range of 250 km. To achieve this range, the energy storage
capacity of the battery pack has to be 35 kWh (347 kg mass, 280 liter volume). The charging time
for this battery pack using a 110 V, 10 amp electric service is 23.9 hours (using 220 V/15 amp, is8 hours). Packaging this size of a battery into a small vehicle is a major challenge. The battery
extends forward from underneath the rear seat occupants floor into the tunnel and below the front
floor. The under floor structures not only have to support the significant weight of the battery
during road loading, but also protect it when subjected to frontal, side and rear crash impact
loads. Presently, it is envisioned that a full-size under floor longitudinal member, coupled with
several cross members and additional tunnel reinforcements, will be required, leading to a possibleapplication for high-strength steel sections. See Figure 1.7 for BEV underbody.
Figure 1.7: BEV underbody
8

8/8/2019 Future steel vehicel
http://slidepdf.com/reader/full/future-steel-vehicel 13/42
1.5 Future Steel Vehicle -2 (FSV-2) Future Steel Vehicle
1.5 Future Steel Vehicle -2 (FSV-2)
The FSV-2 is a 4-door sedan, 4,350 mm long, and designed to accept two powertrain options:
A Plug-in Hybrid Electric Vehicle - PHEV40 A Fuel Cell Electric Vehicle - FCEV
Both powertrains share a common front-end and a common front wheel drive traction motor pack-age. The traction motors rated peak power is 75 kw (55 kw of continuous power).
1.5.1 FSV-2 (PHEV40)
The PHEV40 vehicle will have an all-electric range of 64 km (40 miles) on a fully charged battery.The battery pack is a lithium-ion manganese based cell with a 11.7 kWh capacity (105 kg mass,
86 liter volume). The charging time for this battery pack using a 110 V, 10 amp electric service is
8 hours (using 220 V/15 amp, is 2.7 hours). A rear mounted 1.4 L - 4 cyl gasoline engine/generator
set provides the PHEV40 with an extended range of 500 km.
Presently, other driving strategies are being investigated that could considerably reduce the sizeof the engine/generator.
The component packaging and structural challenges for this vehicle are similar to the PHEV20.
See Figure 1.8 for PHEV40 illustration.
Figure 1.8: FSV-2 (PHEV 40 )
9

8/8/2019 Future steel vehicel
http://slidepdf.com/reader/full/future-steel-vehicel 14/42
Future Steel Vehicle 1 Executive summary
1.5.2 FSV-2- FCEV
The FCEV - Fuel Cell Electric Vehicle has an all-electric driving range of 500 km. The FCEV en-
ergy source is electricity generated by the hydrogen fuel cell system. A fuel cell is a device that
uses hydrogen (or hydrogen-rich fuel) and oxygen to create electricity by an electro-chemical pro-cess. Fuel cells use the chemical energy of hydrogen to cleanly and efficiently produce electricity,
with water and heat as by-products. See Figure 1.9 for FCEV illustration.
Figure 1.9: FSV-2 - FCEV
The FCEV has a usable hydrogen storage capacity of 3.4 kg, with an internal volume of 95 liters,that is stored at 65 Mpa at 15◦C. The fuel-cell stack system has 240 cells, which has a combined
weight of 92 kg producing 65 kW of power. The battery pack used in conjunction with this system
is a lithium-ion manganese based cell with 2.3 kWh capacity, and weighs 27 kg with a 25-liter
volume.
The challenges of the FCEV underbody structure is to provide sufficient support and protection tothe fuel stack assembly packaged in the front floor tunnel, and the high-pressure hydrogen tank
under the rear floor. The under body-structure will require extensive new structural members to
meet stiffness requirements and crash loads.
10

8/8/2019 Future steel vehicel
http://slidepdf.com/reader/full/future-steel-vehicel 15/42
1.6 FSV - Estimated Masses Future Steel Vehicle
1.6 FSV - Estimated Masses
The mass estimates, shown in Table 1.3 and Table 1.4 for FSV-1 and FSV-2 were based on the
previously described vehicle layouts and calculated using the Mass Compounding Program.
Table 1.3: FSV-1 mass estimates (all in kg)
11

8/8/2019 Future steel vehicel
http://slidepdf.com/reader/full/future-steel-vehicel 16/42
Future Steel Vehicle 1 Executive summary
Table 1.4: FSV-2 mass estimates (all in kg)
The powertrain component masses were obtained from simulations with PSAT (Powertrain System
Analysis Toolkit) conducted by Quantum. The estimated masses of a similar (to FSV-1) sized ICEvehicle and a HEV (2010 and 2020) are also shown for comparison purposes.
The mass reductions that can be achieved by other future technologies, smaller vehicle foot print
of FSV, and body-structure mass reduction by use of advanced high-strength steels, lead to sig-
nificant mass reductions of the FSV.
12

8/8/2019 Future steel vehicel
http://slidepdf.com/reader/full/future-steel-vehicel 17/42
1.7 FSV Cost of Ownership Future Steel Vehicle
1.7 FSV Cost of Ownership
The following costs were calculated based on vehicle total life of 200,000 km (125,000 miles).
Other assumptions include:
For PHEV20 - 50% of distance traveled in electric mode, 50% of the distance traveled in HEV
mode
For PHEV40 - 70% of distance traveled in electric mode, and 30% of the distance traveled in
HEV mode
Cost of electricity - $0.12 per kWh
Cost of gasoline - $1.18 per liter ($4.50 US per gallon)
Cost of hydrogen gas - $5.00 /kg, as currently charged by some stations in California on the
Hydrogen Highway
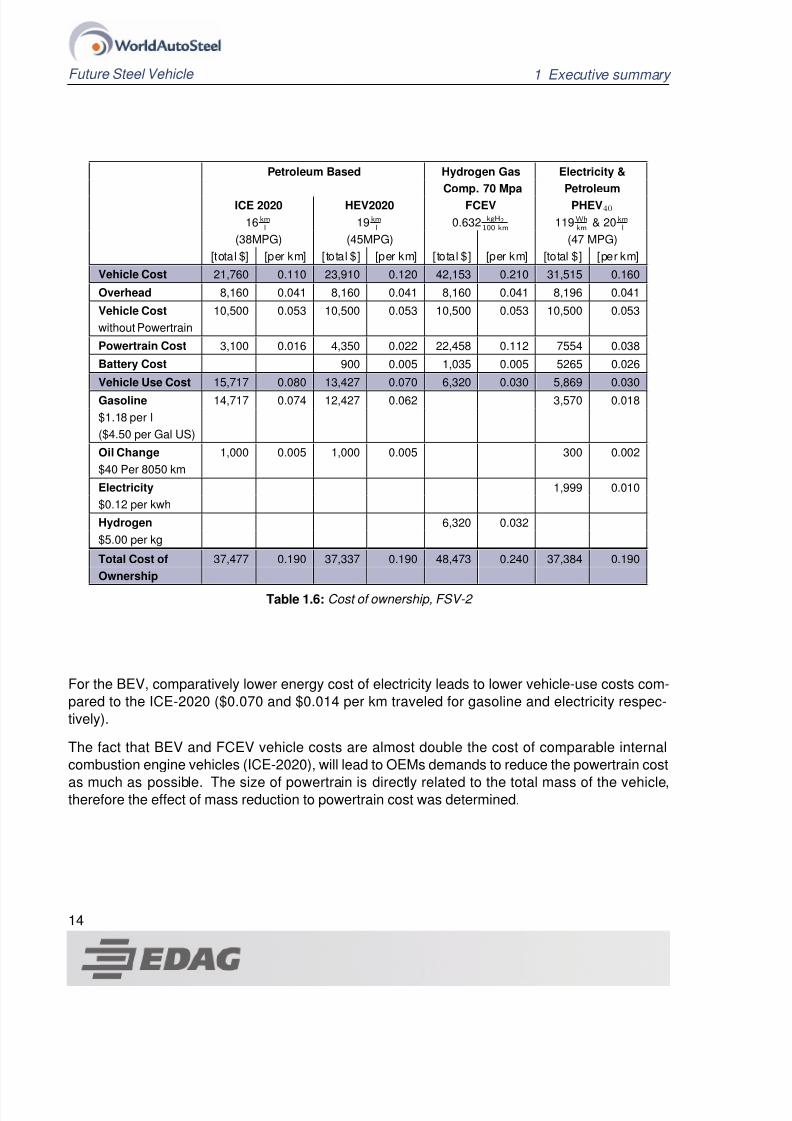
As shown in Table 1.5, and Table 1.6, the advanced powertrains higher costs leads to significantly
higher vehicle costs. However, the total cost of ownership is not significantly different between the
various options except for FCEV, which is 26% higher.
Petroleum Based FSV-1 Dual Fuel Based
Electricty form Grid and Petroleum
ICE 2020 HEV 2020 BEV - EV PHEV20
18 kml
27.2 kml
114 Whkm
106 Whkm
& 26.7 kml
(42.7 MPG) (64 MPG) (62.7 MPG)
[total $] [per km] [total $] [per km] [total $] [per km] [total $] [per km]
Vehicle Cost 16,250 0.081 18,090 0.090 32,535 0.163 22,810 0.114
Overhead 6,094 0.030 6,094 0.030 6,094 0.030 6,094 0.030
Vehicle Cost 7,746 0.039 7,746 0.039 7,746 0.039 7,746 0.039without Powertrain
Powertrain Cost 2,350 0.012 3,350 0.017 2,945 0.015 6720 0.034
Battery Cost 60 900 0.005 15,750 0.079 2250 0.011
Vehicle Use Cost 14,097 0.070 9,738 0.050 2,731 0.014 6,232 0.030
Gasoline 13,097 0.065 8,738 0.044 4,460 0.022
$1.18 per l
($4.50 per gal US)
Oil Change $40 1,000 0.005 1,000 0.005 500 0.003
$40 per 8,000 km
Electricity 2,731 0.014 1,272 0.006
$0.12per kwhTotal Cost of 30,346 0.152 27,828 0.139 35,266 0.176 29,041 0.145
Ownership
Table 1.5: Cost of ownership, FSV-1
13
8/8/2019 Future steel vehicel
http://slidepdf.com/reader/full/future-steel-vehicel 18/42
Future Steel Vehicle 1 Executive summary
Petroleum Based Hydrogen Gas Electricity &
Comp. 70 Mpa Petroleum
ICE 2020 HEV2020 FCEV PHEV40
16 kml
19 kml
0.632 kgH2100 km
119 Whkm
& 20 kml
(38MPG) (45MPG) (47 MPG)
[total $] [per km] [total $] [per km] [total $] [per km] [total $] [per km]
Vehicle Cost 21,760 0.110 23,910 0.120 42,153 0.210 31,515 0.160
Overhead 8,160 0.041 8,160 0.041 8,160 0.041 8,196 0.041
Vehicle Cost 10,500 0.053 10,500 0.053 10,500 0.053 10,500 0.053
without Powertrain
Powertrain Cost 3,100 0.016 4,350 0.022 22,458 0.112 7554 0.038
Battery Cost 900 0.005 1,035 0.005 5265 0.026
Vehicle Use Cost 15,717 0.080 13,427 0.070 6,320 0.030 5,869 0.030
Gasoline 14,717 0.074 12,427 0.062 3,570 0.018
$1.18 per l
($4.50 per Gal US)
Oil Change 1,000 0.005 1,000 0.005 300 0.002
$40 Per 8050 km
Electricity 1,999 0.010
$0.12 per kwh
Hydrogen 6,320 0.032
$5.00 per kg
Total Cost of 37,477 0.190 37,337 0.190 48,473 0.240 37,384 0.190
Ownership
Table 1.6: Cost of ownership, FSV-2
For the BEV, comparatively lower energy cost of electricity leads to lower vehicle-use costs com-
pared to the ICE-2020 ($0.070 and $0.014 per km traveled for gasoline and electricity respec-
tively).
The fact that BEV and FCEV vehicle costs are almost double the cost of comparable internal
combustion engine vehicles (ICE-2020), will lead to OEMs demands to reduce the powertrain cost
as much as possible. The size of powertrain is directly related to the total mass of the vehicle,therefore the effect of mass reduction to powertrain cost was determined.
14
8/8/2019 Future steel vehicel
http://slidepdf.com/reader/full/future-steel-vehicel 19/42
1.8 Environmental Impact Future Steel Vehicle
1.8 Environmental Impact
1.8.1 FSV Fuel Economy and CO2 Emissions
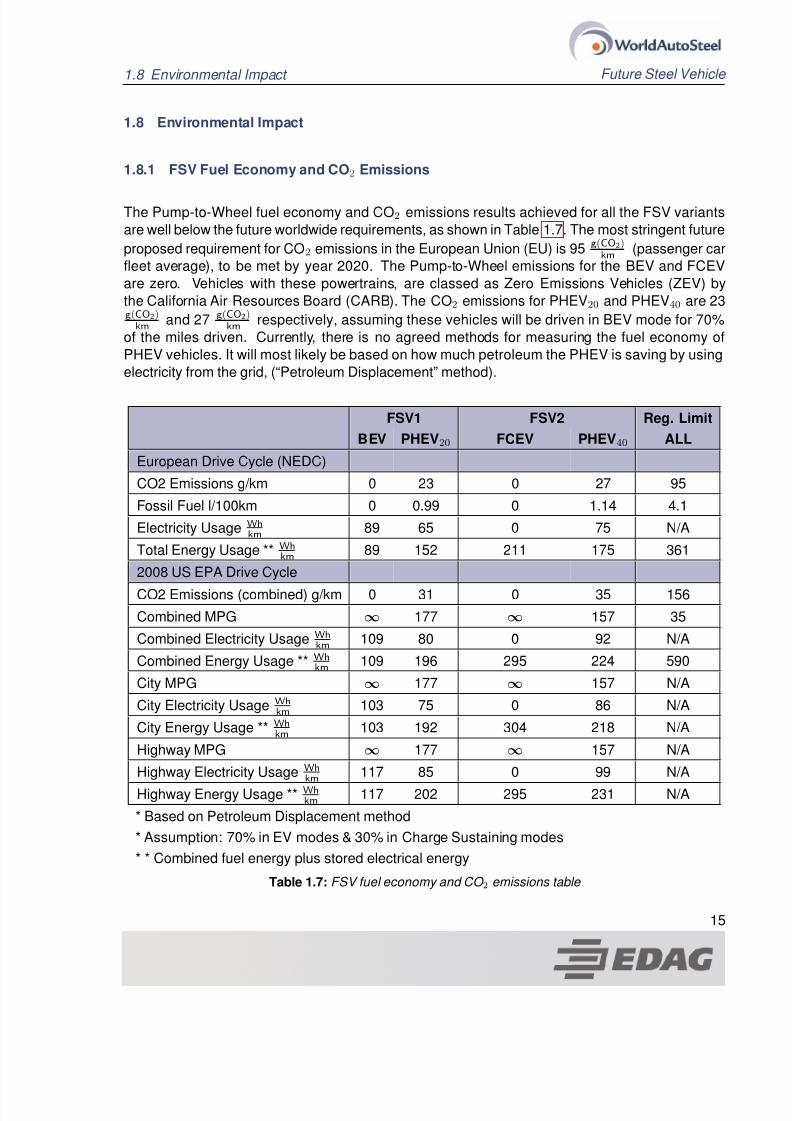
The Pump-to-Wheel fuel economy and CO2 emissions results achieved for all the FSV variants
are well below the future worldwide requirements, as shown in Table 1.7. The most stringent future
proposed requirement for CO2 emissions in the European Union (EU) is 95g(CO2)
km(passenger car
fleet average), to be met by year 2020. The Pump-to-Wheel emissions for the BEV and FCEV
are zero. Vehicles with these powertrains, are classed as Zero Emissions Vehicles (ZEV) by
the California Air Resources Board (CARB). The CO2 emissions for PHEV20 and PHEV40 are 23g(CO2)
kmand 27 g(CO2)
kmrespectively, assuming these vehicles will be driven in BEV mode for 70%
of the miles driven. Currently, there is no agreed methods for measuring the fuel economy of
PHEV vehicles. It will most likely be based on how much petroleum the PHEV is saving by using
electricity from the grid, (“Petroleum Displacement” method).
FSV1 FSV2 Reg. Limit
BEV PHEV20 FCEV PHEV40 ALL
European Drive Cycle (NEDC)
CO2 Emissions g/km 0 23 0 27 95
Fossil Fuel l/100km 0 0.99 0 1.14 4.1
Electricity Usage Whkm
89 65 0 75 N/A
Total Energy Usage ** Whkm
89 152 211 175 361
2008 US EPA Drive Cycle
CO2 Emissions (combined) g/km 0 31 0 35 156
Combined MPG ∞ 177 ∞ 157 35
Combined Electricity Usage Whkm
109 80 0 92 N/A
Combined Energy Usage ** Whkm
109 196 295 224 590
City MPG ∞ 177 ∞ 157 N/A
City Electricity Usage Whkm
103 75 0 86 N/A
City Energy Usage ** Whkm
103 192 304 218 N/A
Highway MPG ∞ 177 ∞ 157 N/A
Highway Electricity Usage Whkm
117 85 0 99 N/A
Highway Energy Usage ** Whkm
117 202 295 231 N/A
* Based on Petroleum Displacement method
* Assumption: 70% in EV modes & 30% in Charge Sustaining modes
* * Combined fuel energy plus stored electrical energy
Table 1.7: FSV fuel economy and CO 2 emissions table
15

8/8/2019 Future steel vehicel
http://slidepdf.com/reader/full/future-steel-vehicel 20/42
Future Steel Vehicle 1 Executive summary
Figure 1.10 from “Japan - Ministry of Land, Infrastructure, Transport and Tourism” shows how the
FSV CO2 emissions compared with other gasoline, diesel and HEV vehicle technologies. As can
be seen, the FSV’s emissions are very close to being in the ZEV class of vehicles.
Figure 1.10: FSV fuel economy and CO 2 emissions
It is interesting to note the slope of each technologies data set in the above graph for ICE, HEV,
and FSV are progressively trending lower, indicating proportionally lower CO2 emissions as indi-
cated by the slope of the line, with respect to proportional mass increases, (not to be confused with
total mass increases). This is mainly due to future vehicles using regenerative braking systems,
whereas the ICE system can not utilize regenerative braking. The FSV has the most effective re-generative braking system due to having a higher power electric motor and larger capacity battery,
when compared to the less effective units in the HEV’s.
16

8/8/2019 Future steel vehicel
http://slidepdf.com/reader/full/future-steel-vehicel 21/42
1.9 Well-to-Pump Assessment Future Steel Vehicle
1.9 Well-to-Pump Assessment
The Well-to-Pump assessment for all possible future sources of FSV vehicle fuels was done using
Argonne National Lab programs “Greet 1.8B”. The sources of energy (fuels) considered included
the following:
Electricity (US mix, Europe, China, Japan, India, 100% coal and 100% renewable)
Gasoline and diesel from petroleum
Bio-fuels, ethanol and bio-diesel
Hydrogen gas and liquid made using electrolysis process and from natural gas
Table 1.8 shows electricity generation efficiencies, CO2 and other emissions during electricity
production using various feed-stocks. These results are used to calculate the “Well-to-Wheel”energy quantities shown in results for the FSV in the following section.
Feedstocks [%] USA Europe China Japan India Coal USA
Green Mix
Coal 50.7 29.5 79 28.1 68.7 100 0
Natural Gas 18.9 9.9 0 21 8.9 0 0
Oil 2.7 4.5 2.4 13.2 4.5 0 0
Nuclear 18.7 31 2.1 27.7 2.5 0 20
Biomass 1.3 2.1 0 0 0 0 0
Others 7.7 13 16.5 10 15.4 0 80
100 100 100 100 100 0 100
Electricity Pathway:
Efficiency [%] 37.9 44.2 35 41.6 35.1 30.7 91.5
CO2 [g/kWh] 750.6 520.3 973 596.7 923.5 1201.3 0
VOC [g/kWh] 0.07 0.05 0.08 0.06 0.08 0.09 0
Nox [g/kWh] 0.82 0.61 1.05 0.76 1.01 1.26 0
Sox [g/kWh] 1.8 1.25 2.64 1.74 2.46 3.15 0
Table 1.8: Well-to-Pump results (electricity generation)
17

8/8/2019 Future steel vehicel
http://slidepdf.com/reader/full/future-steel-vehicel 22/42
Future Steel Vehicle 1 Executive summary
1.10 FSV-1 - Environmental Assessment
1.10.1 FSV-1 - Pump-to-Wheel CO2 Emissions
The Pump-to-Wheel CO2 emissions for each FSV vehicle is shown in Figure 1.11. The limit of
95g(CO2)
kmshown in the figure, is the CO2 regulation proposed for the European Union to come into
effect by 2020.
Figure 1.11: FSV-1 Pump-to-Wheel CO 2 emissions
The gasoline representative baseline vehicle shown in Table 1.11 is a conventional vehicle with a
gasoline powered internal combustion engine. For each PHEV, both Charge Sustaining (CS) and
Charge Depleting (CD) all-electric driving modes are also shown. On a Pump-to-Wheel basis, all
four FSV Powertrain variants will emit less than 95g(CO2)
km. The PHEVs and BEV produce zero CO2
from the tailpipe when driven in all-electric mode.
18

8/8/2019 Future steel vehicel
http://slidepdf.com/reader/full/future-steel-vehicel 23/42
1.10 FSV-1 - Environmental Assessment Future Steel Vehicle
1.10.2 FSV-1 - Well-to-Wheel CO2 Emissions
There are also CO2 emissions from the production of fossil fuels, renewable fuel, or electricity. So
a Well-to-Wheel analysis is very important for a comprehensive evaluation of vehicle emissions.
Adding the Well-to-Pump emissions factor to each vehicle, the Well-to-Wheel CO2 emissions areattained, as shown in Figure 1.12. It can be observed that the PHEV in Charge Depleting, all-
electric mode, and the BEV have zero tailpipe CO2 emissions. However, their carbon footprint is
not zero due to emissions from the production of fuel.
Figure 1.12: FSV-1 Well-to-Wheel CO 2 emissions
19

8/8/2019 Future steel vehicel
http://slidepdf.com/reader/full/future-steel-vehicel 24/42
Future Steel Vehicle 1 Executive summary
1.11 FSV-2 - Environmental Assessment
1.11.1 FSV-2 - Pump-to-Wheel CO2 Emissions
An environmental assessment of FSV-2 was also conducted using the Well-to-Wheel CO2 emis-sions. The results of the assessment are shown in the Figure 1.13 and Figure 1.14.
Figure 1.13: FSV-2 Pump-to-Wheel CO 2 emissions
20

8/8/2019 Future steel vehicel
http://slidepdf.com/reader/full/future-steel-vehicel 25/42
1.11 FSV-2 - Environmental Assessment Future Steel Vehicle
1.11.2 FSV-2 - Well-to-Wheel CO2 Emissions
Figure 1.14: FSV-2 Well-to-Wheel CO 2 emissions
Even though FCEV (H2-NG) and FCEV (H2-elec) have zero tailpipe CO2 emissions, their carbon
footprint is not zero due to CO2 emissions from production of their respective energy source. The
H2 FCEV Well-to-Wheel CO2 emissions has a strong dependence on where its hydrogen comes
from. In the best case scenario, it is only marginally better than the PHEV40 operating in Charge
Sustaining mode. It is envisioned that in the 2015 - 2020 time frame, electrical power available for
FCEV H2 electrolytic hydrogen production will come from the utility grid much like today’s PHEVs,(power generation infrastructure will not evolve rapidly) and its carbon footprint will be much greater
than any of the other PHEV variants.
21

8/8/2019 Future steel vehicel
http://slidepdf.com/reader/full/future-steel-vehicel 26/42
Future Steel Vehicle 1 Executive summary
1.12 Technology Assessment
1.12.1 Future Advanced Powertrains Summary
A feasibility study was performed to determine the powertrain architectures, components, perfor-mance, cost, and mass of four powertrain variants predicted to be in volume production by major
automotive OEMs in the 2015-2020 timeframe. The study included the evaluation of currentlyused as well as emerging powertrain technologies. These include high voltage batteries of vary-
ing chemistries, ultra-capacitors, traction and wheel motors, and power electronics, as well as
hydrogen storage and infrastructure.
For the purpose of the Future Steel Vehicle studies, a common transaxle sub-assembly consistingof a traction motor, reduction gearing, and differential, were selected. Two different power internal
combustion engine/generator assemblies can electrically power the transaxle sub-assembly, by
a fuel cell system, or by a large capacity high voltage battery. Each of these powertrain options
has its unique fuel storage capacity, high voltage battery size, weight, and cooling configurationsresulting in a new body-structure design and challenges.
For the complex fuel cell system, Shanghai Fuel Cell Vehicles (SFCV) performed a separate pow-
ertrain sub-system study in conjunction with Tongji University. The integration studies of the fuel
cell sub-system into the vehicle powertrain systems were supported jointly by Quantum Technolo-
gies and SFCV. The cost, mass, fuel consumption, and Green-House-Gas (GHG) emission values
(Pump-to-Wheel) for the different FSV vehicles are summarized in Table 1.9.
Mass 2015 Cost Consumption, Urban Dynamometer Driving Schedule
Charge GreenhouseDepleting Sustaining Gas
Electricity Gasoline Hydrogen (Pump-to-Wheel)
[kg] [$ US] [ Whkm
] [ L100 km
] [ Kg
100 km] [ g CO2
km]
BEV 449 18.695 88.9 0 0 0
FCEV 326 23.493 N/A 0 0.632 0
PHEV40 469 12.819 107 3.81 0 88.6
PHEV20 343 8.970 92.5 3.31 0 76.9
Table 1.9: Powertrain mass, cost, fuel consumption, and GHG emissions
As a general conclusion, costs of battery technology, fuel cell engines, and hydrogen fuel storageare the greatest challenges. Battery costs are predicted to reduce quicker than both fuel cell and
hydrogen storage technology, therefore for 2015 - 2020, PHEV and BEV vehicles will have the
highest probability of large volume market acceptance. FCEV vehicles will likely not be in volumeproduction before 2020 and possibly later if cost reductions take longer.
22

8/8/2019 Future steel vehicel
http://slidepdf.com/reader/full/future-steel-vehicel 27/42
1.12 Technology Assessment Future Steel Vehicle
1.12.2 Advanced Powertrain Technologies
Five major topics considered in the evaluation and use of advanced powertrain technologies are:
1. Battery technology2. Fuel cell technology
3. Electric motors
4. Internal combustion engines5. Advanced powertrain energy sources
1.12.2.1 Battery Technology Assessment
Battery technologies currently used and under development for hybrid or full electric automotive
applications are:
Nickel Metal Hydride (Ni-MH) - today’s mainstream battery technology for automotive traction
applications
Lithium-Ion
In the past 10 years, rechargeable battery energy storage capacities have been rapidly improved
upon and costs have been relatively stable due to mature manufacturing processes for consumer
products. This is realized by the increase demand in new technologies for consumer products,
(cell phones, power tools, etc.). Many of these technologies have proven themselves with excellentproduct performance and reliability records.
Manufacturing cost and energy storage capacity advantages have caused an industry shift from
Ni-MH to Li-Ion battery technology, thus allowing OEM application specific deployment of newchemistry and cylindrical or prismatic cells.
Automotive high-voltage battery technology is typically utilizing this mass production technology
for cylindrical cells, which are connected in series (strings) and parallel, to achieve the voltage
levels and desired storage capacity. However, these high-voltage energy batteries require safety
measures for crash and service.
Temperature control of individual cells and battery packs as a whole has proven to be one of the
key areas for automotive battery development in order to increase durability and provide accept-
able operation performance under extreme climate conditions (i.e. cold-start or continuous high
output at high ambient temperatures).
Ongoing product development and validation cycles paralleled with the ramp-up of manufacturing
capacity for large batteries for PHEV deployment is expected in the years 2015 to 2020. How-
ever, substantial ongoing marketing activity for prototype technology may not be as rapidly turned
into large volume production as might be anticipated. Therefore, new market incentives may be
required to offset the high cost of large capacity batteries for plug-in and all-electric vehicle appli-
cations.
23

8/8/2019 Future steel vehicel
http://slidepdf.com/reader/full/future-steel-vehicel 28/42
Future Steel Vehicle 1 Executive summary
For phases 2 and 3 of the FSV program, the FSV engineering team recommends the use of battery
technology because it is safe, energy and cost efficient, and lightweight. For the 2015 and forward
timeframe, lithium-ion batteries using manganese oxide technology shows great potential to meet
those requirements. See Table 1.10 for FSV battery recommendations.
Battery Technology Assessment
Status Prediction Selection
2008 2015-2020 FSV
Dominating Technology Ni-MH Li-Ion Li-Ion
Power Density kW/kg 1.1 1-4 2.5
Energy Density Wh/kg 45 90 - 170 130
Battery Pack Technology Assessment
Capacity kWh 10 (max) 1.5 - 40 2.3 - 35
Cost $ USD/ kWh 500 400-700 450
Future Steel Vehicle Concept
Capacity Weight Volume Cost*
(kWh) (kg) (Liters) ($ USD)
PHEV20 5 58.2 47 $2,350
PHEV40 11.7 136.5 103 $5,365
BEV 35 346.5 280 $15,850
FCEV 2.3 27.3 25 $1,035
* Cost shown is for the battery system including battery controller
and plug-in charging system
Table 1.10: Battery recommendation for FSV
24
8/8/2019 Future steel vehicel
http://slidepdf.com/reader/full/future-steel-vehicel 29/42
1.12 Technology Assessment Future Steel Vehicle
1.12.2.2 Fuel Cell Technology Assessment
The Shanghai Fuel Cell Vehicle Company (SFCV) in cooperation with Tongji University, Shanghai
China, studied the fuel cell engine, its sub-systems, and its components separately.
The fuel cell engine technical assessment results and recommendations were documented in
separate reports that are part of the combined Future Steel Vehicle Phase 1 effort. Close attention
was given to integration of those results into the vehicle and powertrain packaging, weight and
costs analysis. The necessary fuel cell engine performance parameters, established to meet
vehicle performance requirements were co-developed with Quantum Technologies while utilizingthe Powertrain System Analysis Toolkit (PSAT).
In recent years, fuel cell system development has proven more challenging in solving the tech-
nical and commercial viability of a large-scale production deployment. Substantial efforts are
still required in cost efficient on-board hydrogen storage as well as fuel cell engine development.Integration of hydrogen fuel cell and storage technology in existing vehicle platforms yields unsat-
isfactory vehicle packaging compromises leading to potential consumer dissatisfaction.
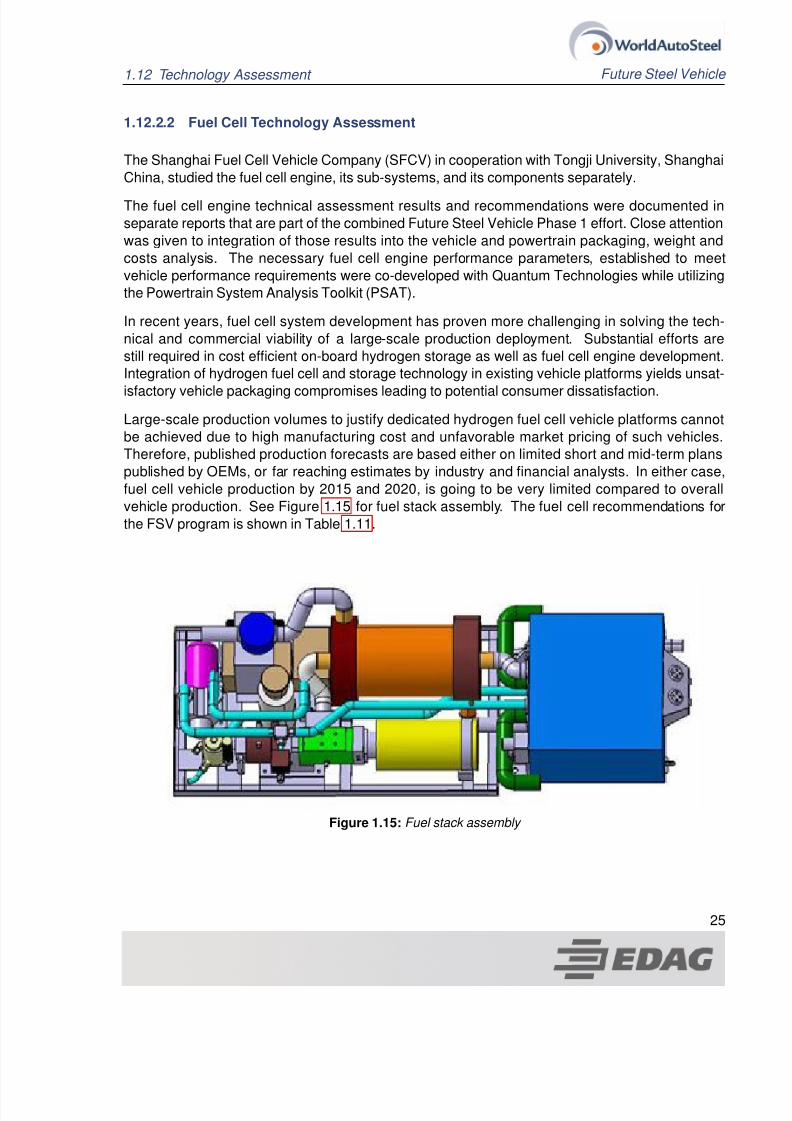
Large-scale production volumes to justify dedicated hydrogen fuel cell vehicle platforms cannot
be achieved due to high manufacturing cost and unfavorable market pricing of such vehicles.Therefore, published production forecasts are based either on limited short and mid-term plans
published by OEMs, or far reaching estimates by industry and financial analysts. In either case,
fuel cell vehicle production by 2015 and 2020, is going to be very limited compared to overall
vehicle production. See Figure 1.15 for fuel stack assembly. The fuel cell recommendations for
the FSV program is shown in Table 1.11.
Figure 1.15: Fuel stack assembly
25

8/8/2019 Future steel vehicel
http://slidepdf.com/reader/full/future-steel-vehicel 30/42
Future Steel Vehicle 1 Executive summary
Fuel Cell Technology Assessment
Status Prediction Selection
2008 2015-2020 FSV
Dominating Technology PEM* PEM* PEM*
Power Output (net) kW 40 - 100 50 - 170 65
Efficiency % 45 - 56 50 - 62 50 - 62
Power Density kW/kg 0.8 - 1.9 ∼2.0 2
Cost [$USD] $ USD/ kW 1,500-2,900 ∼100 - 200 155
Hydrogen Storage Technology Assessment
Status Prediction Selection
2008 2015-2020 FSVDominating Technology Compressed Gas Compressed
Pressure MPa 35 50 - 70 70
Tank Material Carbon Composite Aluminum Liner Plastic Liner Plastic Liner
H20 Volume Capacity Liters 80 - 220 70 - 150 95
Hydrogen Capacity (net) kg 1.7 - 5.0 1.6 - 5.4 3.4
Future Steel Vehicle Concept
Capacity Weight Volume Cost
Without Cooling System (net) [kg] [Liters] [$ USD]
Fuel Cell Engine 65 kW 92 67 $10,081
Hydrogen Storage 3.4 kg 87 120 $7,919
* Polymer Electrolyte Membrane
Table 1.11: Fuel cell recommendation for FSV
26

8/8/2019 Future steel vehicel
http://slidepdf.com/reader/full/future-steel-vehicel 31/42
1.12 Technology Assessment Future Steel Vehicle
1.12.2.3 Electric Motor Technology Assessment
Electric motor development is shifting from industrial designs to meet customized automotive dura-
bility, weight, and cost requirements. Electrification of powertrains, allows fossil fuel energy recov-
ery for a substantial reduction in fuel consumption and CO2 emissions. However, plug-in technol-ogy requires bigger electric motors and battery capacity suitable for all-electric operation in normal
drive cycles.
Electric motors/generators are very efficient relative to an ICE, but they are at their maximum op-
erating efficiency only in a narrow rpm range. Electric motor efficiency improvements are primarilyextending the efficient operating range and power density. By focusing on magnet arrangement
and coil designs, motor efficiency is optimized for the operating range the unit will be spending
most of its service life in. For larger speed ranges, multi-speed transmissions are typically used,
especially if the motor is used as an auxiliary power supply in typical hybrid vehicle configura-
tions. If the motor is required to provide full traction power, a single speed gear reduction may be
sufficient.
Electric motor/generators are closely coupled with DC power inverter hardware and software
for optimized performance, efficiency and electro-magnetic emission resistance. For power and
speed regulation, permanent magnets are used to electronically commutate (converts alternating
electric current to direct current or vice versa) using variable voltage and variable frequency.
To ensure optimized efficiency of the generator and traction motors, the motor manufacturer
matches the set to their respective power inverters. High efficiency allows the simplification or
complete elimination of transmissions in series architectures based on performance, weight, cost
and packaging considerations. The integrated traction drive concept, (series integrated gener-
ator/traction motor set without a transmission), offers the best compromise for the Future Steelvehicle. With internal scaling of the motor, the size of the motor components are engineered to
operate at their maximum efficiency for the mass and power requirements of the vehicle applica-tion. By using internal scaling of the motor in addition to optimal gear reductions, it will be possible
to support a modular powertrain design concept, and therefore reduce development and potential
tooling cost at the same time. The recommendations for the FSV program are summarized in
Table 1.12.
Units Current BEV PHEV20 FCEV PHEV40
Peak Power kW Varies 67 67 75 75
Continuous Power kW Varies 49 49 55 55
Max Torque Nm Varies 270 270 240 240
Max Efficiency % 95 96 96 95 95
Specific Cost $/kW 40 26 26 26 26Specific Power kW/kg 1.2 1.63 1.63 1.63 1.63
Specific Power kW/l 3.2 4.8 3.3 3.3 3.3
Physical Volume l Varies 14 14 23 23
Table 1.12: Electric motor recommendations for FSV
27

8/8/2019 Future steel vehicel
http://slidepdf.com/reader/full/future-steel-vehicel 32/42
Future Steel Vehicle 1 Executive summary
1.12.2.4 Advanced Internal Combustion Engines
Internal combustion engine technology is a mature technology with incremental potential for ef-
ficiency improvements. The current fuels of choice for the light-duty vehicle market are gasoline
and diesel, used with their respective engine type (Otto and Diesel Cycle). See Table 1.13 forinternal combustion engine recommendations for FSV.
PHEV20 PHEV40
1.0 L , 3-cylinder , water cooled 1.4 L , 4-cylinder , water cooled
Gasoline fuel Gasoline fuel
Normally aspirated Normally aspirated
Direct fuel injection Direct fuel injection
50 kW peak power 70 kW peak power
Cylinder orientation tilted to approach horizontal Cylinder orientation tilted to approach horizontal
Torque and power curves matched with generator for
maximum fuel efficiency and CO2 emission reduction
Torque and power curves matched with generator for
maximum fuel efficiency and CO2 emission reductionAll accessories electric powered (no belt drive) All accessories electric powered (no belt drive)
Generator used for engine start (no starter motorrequired)
Generator used for engine start (no starter motorrequired)
Table 1.13: Internal combustion engine recommendations - PHEV 20 and PHEV 40
28

8/8/2019 Future steel vehicel
http://slidepdf.com/reader/full/future-steel-vehicel 33/42
1.12 Technology Assessment Future Steel Vehicle
1.12.3 Steel Technologies
A number of steel forming technologies will be adopted for the Future Steel Vehicle (FSV) to take
advantage of the benefits of Advanced High Strength Steel (AHSS). Use of these steels result in
a substantial mass savings by a reduction in material thickness with an increase in strength andpart performance.
The WorldAutoSteel-FSV steel portfolio will be utilized during the material selection process with
the aid of full vehicle analysis to determine material grade and thickness. The available steel
ranges from “mild steel” to advanced high strength “martensitic steel”. The basic types are thefollowing:
Mild (Mild steel)
BH (Bake Hardenable)
IF (Interstitial Free)
DP (Dual Phase)
CP (Complex Phase)
SF (Stretch Flange)
FB (Ferrite Bainite)
HT (Heat Treatable)
HSLA (High Strength Low Alloy)
TRIP (Transformed Induced Plasticity)
MS (Martensitic)
MnB (Boron)
LIP (Light Induced Plasticity)
The full range of steels available for the Future Steel Vehicle is shown in Table 1.14.
29

8/8/2019 Future steel vehicel
http://slidepdf.com/reader/full/future-steel-vehicel 34/42
Future Steel Vehicle 1 Executive summary
Table 1.14: Range of steels available for FSV
30

8/8/2019 Future steel vehicel
http://slidepdf.com/reader/full/future-steel-vehicel 35/42
1.12 Technology Assessment Future Steel Vehicle
From the steel portfolio, a primary formed blank or tube is produced from any of the following:
Conventional single steel grade
Laser welded blank
Laser welded tube, both constant
Laser welded coils
High-frequency induction welded
Variable walled tubes
The primary formed blank or tube, is then formed to the final part geometry using a number ofmanufacturing processes such as:
Stamping
Roll forming
Hot stamping, both direct and in-direct
Hydroforming
Figure 1.16 is a flow chart from the steel portfolio to the technology portfolio.
Figure 1.16: Steel portfolio to technology portfolio flow diagram
31

8/8/2019 Future steel vehicel
http://slidepdf.com/reader/full/future-steel-vehicel 36/42
Future Steel Vehicle 1 Executive summary
1.12.4 Automotive Technology Assessment
1.12.4.1 Drive-by-Wire
As a part of the engineering assessment on Drive-by-Wire systems as viable options for main-stream production on FSV-1 and FSV-2 by 2020, three types of Drive-by-Wire systems were looked
at:
1. Brake-by-Wire
2. Throttle-by-Wire
3. Steer-by-Wire
Based on the research, the FSV engineering team strongly believes that of the three systems, onlyBrake-by-Wire and Throttle-by-Wire are viable production oriented technologies, as these provide
a mass savings of approximately 3 kgs, and packaging advantages that significantly change the
front-end structure of the vehicle while overcoming its current design challenges. “By-Wire sys-
tems” require robust and reliable 42V battery systems, and since both FSV-1 and FSV-2 have high-performance and high-voltage batteries as standard options, this technology provides a means for
the FSV team to engineer optimized front-end packaging while reaping many other benefits of
such a system.
At present, there are “partial” Brake-by-Wire systems that have some type of fail-safe hydraulic
backup built into the system that provides minimal braking (limp home condition) in case of a
complete electrical failure in the vehicle and/or the Brake-by-Wire system. However, all future
development work currently being undertaken in terms of fault tolerant electronics in this regard,lead us to conclude that a complete Brake-by-Wire system with no hydraulic backup will be a
production technology of the future (2020).
With the timeframe that FSV-1 and FSV-2 vehicles are targeted for production, The FSV engineer-ing team believes that Steer-by-Wire is not a viable technology due to its inherent challenges interms of safety and reliability of the system and its fault tolerance. The sizes of the components
required are similar to a conventional steering system and the use of Steer-by-Wire does not lead
to any significant mass saving. It is understood that at present, the use of a steering wheel is es-
sential for regular high-speed driving. This necessitates similar structural mounting requirements
as a conventional steering system to minimize vibrations, in addition to stiffness requirements,
which in turn leads to locating the airbag in the steering wheel.
On the FSV structure, the positioning of the steering rack will not yield any additional packaging
gains as the front length has been reduced to the minimum required to meet the 5-star NCAP
crash rating.
32

8/8/2019 Future steel vehicel
http://slidepdf.com/reader/full/future-steel-vehicel 37/42
1.12 Technology Assessment Future Steel Vehicle
1.12.4.2 Lightweight Components - Technical Assessment
Investigations of new automotive technologies on the horizon were investigated to assess the
impact of mass reduction and packaging space implications without sacrificing vehicle function
or safety. The reduction in trim and component mass generally leads to a total reduction in thevehicle’s mass and also a reduction of body-structure mass (Mass Compounding).
The following automotive technologies were investigated:
Glazing
LED lighting
Instrument panel displays
Lightweight seating
Table 1.15 illustrates the compared component weight savings between conventional vehicles and
the proposed Future Steel Vehicle, thus proving the FSV’s considerable weight advantage.
Item Generic Weight FSV Weight Mass Savings
[kg] [kg] [%]
Glazing 44 31 29.5
Lighting 10 6.3 37
I/P Display 2.2 0.2 91
Seating 65 42 35.4
Totals 121.2 79.5
Mass Savings [kg] 41.7
Table 1.15: Component weight savings - conventional vehicles versus Future Steel Vehicle
The compounding effect of a 41.7 kg weight savings on the vehicle and body is a mass reduction
of 10 kg on the body-structure.
33

8/8/2019 Future steel vehicel
http://slidepdf.com/reader/full/future-steel-vehicel 38/42
Future Steel Vehicle 1 Executive summary
1.12.4.3 FSV Wheels and Tires
The FSV-1 and FSV-2 are designed to accept a 15-inch wheel. The specific tire size, wheel and
mass for both vehicles are shown in Table 1.16.
Vehicle Tire Size Wheel Type Mass [kg] Mass [lbs]
FSV1 P175/65R15 Steel 14.1 31
FSV2 P175/65R15 Steel 14.1 31
Table 1.16: FSV wheels & tires
Low-rolling resistance tires are designed to improve the fuel efficiency of a vehicle by minimizing
the energy wasted as heat as the tire rolls down the road. Tire companies are conducting signif-
icant research and development in this area as approximately 5-15% of the fuel consumed by atypical car is used to overcome rolling resistance of the tires.
A 2003 California Energy Commission (CEC) [2] preliminary study estimated that adoption of low-
rolling resistance tires could save 1.5-4.5% of all gasoline consumption.
Rolling Resistance Coefficient (RRC) is the value of the rolling resistance force divided by the
wheel load. A lower coefficient means the tires will use less energy to travel. The Society of
Automotive Engineers (SAE) has developed test practices to measure the RRC of tires. These
tests (SAE J1269 and SAE J2452) are usually performed on new tires. When measured by using
these standard test practices, most new passenger tires have reported RRCs ranging from 0.008to 0.014.
All calculations for FSV are assuming a RRC target equal to 0.007.
1.12.4.4 Auxiliary Equipment & Power Management Systems
As a part of the engineering assessment on new automotive technologies that are viable for pro-
duction by the year 2020, the FSV engineering team assessed the impact of auxiliary equipment
power demand loads on the vehicles performance and All Electric Range (AER).
A major portion of the auxiliary energy demand comes from the vehicle’s air conditioning system,
and our research has revealed that reducing this load significantly affects vehicle performance
and range. A number of new technologies will be available for mainstream production for FSV-1and FSV-2 by 2020 that will help reduce this parasitic load and provide FSV-1 and FSV-2 with
enhanced performance and range.
The study has also led the team to conclude that reducing and optimizing A/C load may be the
most efficient way of designing the propulsion system and battery to arrive at a very balanced (in
2Source:Chris Calwell, Travis Reeder, Technical report, Green Seal Environmental Partners, Inc., March 2003.
34

8/8/2019 Future steel vehicel
http://slidepdf.com/reader/full/future-steel-vehicel 39/42
1.13 Future Safety Requirements Future Steel Vehicle
terms of cost and size) design while achieving the set performance targets. Studies conducted by
leading national labs have shown that peak A/C loads reduce the range of an electric vehicle by
as much as 38%.
In this study, a combination of proven methods and systems for FSV-1 and FSV-2 were usedto achieve performance targets while maintaining optimized propulsion and power management
systems. These methods and systems include the following:
Advanced glazing (solar reflective glass)
Solar reflective paint
Cabin recirculation strategies (active sunroof ventilation)
1.13 Future Safety Requirements
The FSV engineering team conducted an assessment of proposed future (2010-2020) global
safety regulations in comparison to the current requirements, with the intention to understandthe implication of new regulations on the design of the FSV-1 and FSV-2, and to incorporate all
the necessary structural changes on the FSV to meet and exceed these upcoming regulatory
specifications by a comfortable safety margin.
The estimated mass, cost and fuel economy impacts of these new requirements (over vehicle
lifetime) are shown in Table 1.17.
Regulation Timeline Mass Cost [$ US] Fuel Used
Roof Crush/Rollover 2016 ∼ 2 kg N/A N/A
Electronic Stability 2011 ∼ 1 kg 92.00 9.8 l (2.6 ga)
Control (ESC)
Pole Impact 2011 ∼ 6-8 kg 208.00 N/A
Frontal Impact TBD TBD N/A N/A
Bumper Impact 2008 1 kg N/A N/A
Ped-Pro 2011 1-2 kg N/A N/A
Table 1.17: Estimated mass, cost and fuel economy impacts
35

8/8/2019 Future steel vehicel
http://slidepdf.com/reader/full/future-steel-vehicel 40/42
Future Steel Vehicle 1 Executive summary
1.14 Fuel Economy Requirements
The results from our research into future fuel economy requirements have shown that most of the
countries are currently working on regulations that mandate the amount of CO2 emissions allowed
for passenger cars.
On May 19 2009, the US EPA and California Air Resources Board (CARB) passed regulations thatmandate the average fleet fuel economy to be 15.09 km
l(35.5 miles
gallon) by 2016. The US government
also unveiled new national auto standards that will accelerate increases in fuel economy, and
impose the first-ever national Greenhouse Gas Emissions (GHG) standard on cars and trucks by
comprehending the California proposal into US national law, and proposing to set a GHG limit of
155 g(CO2)km
(250 g(CO2)m
) in 2016.
European regulations demand that the average passenger car fleet CO2 emissions be within 130g(CO2)
kmby 2012, and proposals to reduce this number to 95 g(CO2)
kmby the year 2020 are currently
being discussed by the European Commission.
Summary of future fuel economy requirements is shown in Table 1.18.
CO2 Emissions Fuel Economy
Gasoline Diesel
year [ g(CO2)km
] [mpg] [km/l] [mpg] [km/l]
2008 200 27.46 11.67 31.51 13.39
2008 160 34.33 14.59 39.39 16.74
2016 155 35.50 15.09 41.19 17.51
2012 130 42.25 17.96 48.48 20.602012 120 45.77 19.45 52.52 22.32
2020 95 57.82 24.57 66.34 28.20
Table 1.18: CO 2 emission requirements
Data source: US EPA[3]
3CO2 emissions from a gallon of gasoline = 2,421 g x 0.99 x (44/12) = 8,788 g = 8.8 kg/gallon = 19.4 lbs/gallonCO2 emissions from a gallon of diesel = 2,778 g x 0.99 x (44/12) = 10,084 g = 10.1 kg/gallon = 22.2 lbs/gallon
36

8/8/2019 Future steel vehicel
http://slidepdf.com/reader/full/future-steel-vehicel 41/42
Future Steel Vehicle
List of Figures
1.1 Phase 1 - Engineering study: content & methodology . . . . . . . . . . . . . . . . 2
1.2 Conventional ICE front-end . . . . . . . . . . . . . . . . . . . . . . . . . . . . . . 5
1.3 FSV Electric drive front-end . . . . . . . . . . . . . . . . . . . . . . . . . . . . . . 5
1.4 Compact Electric Drive . . . . . . . . . . . . . . . . . . . . . . . . . . . . . . . . . 6
1.5 Front-end rail . . . . . . . . . . . . . . . . . . . . . . . . . . . . . . . . . . . . . . 6
1.6 PHEV20 powertrain layout . . . . . . . . . . . . . . . . . . . . . . . . . . . . . . . 71.7 BEV underbody . . . . . . . . . . . . . . . . . . . . . . . . . . . . . . . . . . . . . 8
1.8 FSV-2 (PHEV40) . . . . . . . . . . . . . . . . . . . . . . . . . . . . . . . . . . . . . 91.9 FSV-2 - FCEV . . . . . . . . . . . . . . . . . . . . . . . . . . . . . . . . . . . . . . 10
1.10 FSV fuel economy and CO2 emissions . . . . . . . . . . . . . . . . . . . . . . . . 16
1.11 FSV-1 Pump-to-Wheel CO2 emissions . . . . . . . . . . . . . . . . . . . . . . . . 18
1.12 FSV-1 Well-to-Wheel CO2 emissions . . . . . . . . . . . . . . . . . . . . . . . . . 19
1.13 FSV-2 Pump-to-Wheel CO2 emissions . . . . . . . . . . . . . . . . . . . . . . . . 201.14 FSV-2 Well-to-Wheel CO2 emissions . . . . . . . . . . . . . . . . . . . . . . . . . 21
1.15 Fuel stack assembly . . . . . . . . . . . . . . . . . . . . . . . . . . . . . . . . . . 25
1.16 Steel portfolio to technology portfolio flow diagram . . . . . . . . . . . . . . . . . . 31
A

8/8/2019 Future steel vehicel
http://slidepdf.com/reader/full/future-steel-vehicel 42/42
Future Steel Vehicle
List of Tables
1.1 FSV-1 and FSV-2 vehicle capacity . . . . . . . . . . . . . . . . . . . . . . . . . . . 3
1.2 Powertrain options & performance . . . . . . . . . . . . . . . . . . . . . . . . . . . 4
1.3 FSV-1 mass estimates (all in kg) . . . . . . . . . . . . . . . . . . . . . . . . . . . . 11
1.4 FSV-2 mass estimates (all in kg) . . . . . . . . . . . . . . . . . . . . . . . . . . . . 12
1.5 Cost of ownership, FSV-1 . . . . . . . . . . . . . . . . . . . . . . . . . . . . . . . 13
1.6 Cost of ownership, FSV-2 . . . . . . . . . . . . . . . . . . . . . . . . . . . . . . . 141.7 FSV fuel economy and CO2 emissions table . . . . . . . . . . . . . . . . . . . . . 15
1.8 Well-to-Pump results (electricity generation) . . . . . . . . . . . . . . . . . . . . . 171.9 Powertrain mass, cost, fuel consumption, and GHG emissions . . . . . . . . . . . 22
1.10 Battery recommendation for FSV . . . . . . . . . . . . . . . . . . . . . . . . . . . 24
1.11 Fuel cell recommendation for FSV . . . . . . . . . . . . . . . . . . . . . . . . . . . 26
1.12 Electric motor recommendations for FSV . . . . . . . . . . . . . . . . . . . . . . . 27
1.13 Internal combustion engine recommendations - PHEV20 and PHEV40 . . . . . . . 281.14 Range of steels available for FSV . . . . . . . . . . . . . . . . . . . . . . . . . . . 30
1.15 Component weight savings - conventional vehicles versus Future Steel Vehicle . 33
1.16 FSV wheels & tires . . . . . . . . . . . . . . . . . . . . . . . . . . . . . . . . . . . 34
1.17 Estimated mass, cost and fuel economy impacts . . . . . . . . . . . . . . . . . . 35
1.18 CO2 emission requirements . . . . . . . . . . . . . . . . . . . . . . . . . . . . . . 36


