Functional studies on factor VIII variants containing ...hss.ulb.uni-bonn.de/2012/3013/3013.pdf ·...
120
Functional studies on factor VIII variants containing different lengths of the B-domain AND The construction of a new helper vector for the production of helper-dependent adenovectors Dissertation zur Erlangung des Doktorgrades (Dr. rer. nat.) der Mathematisch-Naturwissenschaftlichen Fakultät der Rheinischen Friedrich-Wilhelms-Universität Bonn vorgelegt von Zaid A. Y. Aburubaiha aus Theban, Jordanien Bonn 2012
Transcript of Functional studies on factor VIII variants containing ...hss.ulb.uni-bonn.de/2012/3013/3013.pdf ·...

Functional studies on factor VIII variants containing different lengths of the B-domain
AND
The construction of a new helper vector for the production of helper-dependent
adenovectors
Dissertation
zur
Erlangung des Doktorgrades (Dr. rer. nat.)
der
Mathematisch-Naturwissenschaftlichen Fakultät
der
Rheinischen Friedrich-Wilhelms-Universität Bonn
vorgelegt von
Zaid A. Y. Aburubaiha
aus
Theban, Jordanien
Bonn 2012

2
Angefertigt mit Genehmigung der
Mathematisch Naturwissenschaftlichen Fakultät der
Rheinischen Friedrich-Wilhems-Universität Bonn
1. Referent: Priv.-Doz. Dr. rer. nat. R. Schwaab
2. Referent: Prof. Dr. N. Koch
Tag der Promotion: 18.09.2012
Erscheinungsjahr: 2012

3
To my parents, my loving wife and my little sweet kids

4
Acknowledgements
I owe my deepest gratitude to PD Dr. Rainer Schwaab who made this thesis possible. I
sincerely thank him for his supervision of this work, his continuous support, and for all
discussions and help during this work. My sincere thanks for Prof. Dr. Norbert Koch for accepting to be my co-referee for this work.
I am thankful for our previous Institute director Prof. Dr. P. Hanfland and our current Institute
director Prof. Dr. J. Oldenburg who kindly allowed me to do this work in the Institute of
Experimental Hematology and Transfusion Medicine.
I wish to thank Dr. med. H.-H. Brackmann and Prof. Dr. med. B. Pötzsch for their help in
measuring the activity levels of my samples in their Hemophilia Laboratory. My thanks also
for their lab. technicians especially Mrs Linden.
I am grateful to the previous and current colleagues in the molecular biology research group:
Dr M. Srour, Dr. T. Albert, Alexandra Schmitt and Dr. J. Grupp for the great working
environment and the technical help throughout this work.
My thanks also to Prof. Dr. J. Oldenburg previous and current coworkers: Dr. O. El-Maari,
Dr. A. Pavlova, Dr. M. Watzka, Dr. P. Westhofen, Dr. J. Müller, Dr. H. Brondke, Milka
Marinova, Katrin Czogalla and Judith Junen for the friendly working environment they
supported. I am also thankful to all the other coworkers of the institute.
My great appreciation to all my friends in Bonn especially Mahmoud Srour, Ursula
Herbiniaux, Jelena Stojanovic, Arijit Biswas, Hamideh Yadegari and Anne Thomas for the
good time we spent together and for their direct support whenever I needed.
Finally, I owe my loving thanks for my wife Rawan Hussein and my family. Without their
support it would have been impossible for me to finish this work.

5
Posters and presentations associated with this study
Aburubaiha Z, Srour M, Oldenburg J, Schwaab R. The inclusion of short lengths of the
factor VIII B-domain into the BDD-rFVIII eliminates the assay discrepancy and improves the
overall expression and functionality of the BDD-rFVIII. World Federation of Haemophilia-
2012 World Congress: Paris, France, 08-12.07.2012. (Accepted as poster presentation).
Aburubaiha Z, Srour M, Schwaab M, Oldenburg J. Functional studies on factor VIII protein
variants containing different lengths of the B-domain. 54. Jahrestagung der Gesellschaft für
Thrombose und Hämostaseforschung (GTH): Nürnberg, Germany, 24-27.02.2010. (Oral
presentation).
Aburubaiha Z, Srour M, Fechner H, Oldenburg J, Schwaab R. Construction of a new helper
vector for the production of helper-dependent adenovectors for the use in hemophilia gene
therapy. XXII Congress of the International Society on Thrombosis and Hemostasis (ISTH):
Boston, USA, 11-16.07.2009. (Poster presentation).
Previous publications Srour MA, Grupp J, Aburubaiha Z, Albert T, Brondke H, Oldenburg J, Schwaab R.
Modified Expression of Coagulation Factor VIII by addition of a glycosylation site at the N-
terminus of the protein. Ann. Hematology 2008 Feb;87(2): 107-12.
Majeed HA, El-khateeb M, El-shanti H, Rabaiha ZA, Tayeh M. The Spectrum of Familial
Mediterranean Fever Gene Mutations in Arabs; Report of a Large Series. Semin Arthritis
Rheum 2005 Jun;34(6): 813-8.
Al-Alami JR, Tayeh MK, Najib DA, Abu-Rubaiha ZA, Majeed HA, Al-Khateeb MS, El-
Shanti HI. Familial Mediterranean Fever Mutation Frequencies and Carriers Among a Mixed
Arabic Population. Saudi Med J 2003 Oct 24: 1055-9.
Majeed HA, El-Shanti H, Al-Khateeb MS, Rabaiha ZA. Genotype/Phenotype Correlations in
Arab patients with Familial Mediterranean Fever. Semin Arthritis Rheum 2002
June;31(6):371-376.

6
Abbreviations Ad5 Adenovirus type 5
AdV Adenovector
aPTT Activated partial thromboplastine time
ATCC American Type Culture Collection
bp Base pair
BSA Bovine serum albumin
CHO Chinese Hamster Ovary cell line
CMV Cytomegalovirus
COS monkey kidney cell line
CTL Cytotoxic T-lymphocytes
ddNTP Dideoxynucleoside triphosphate
DEPC Diethyl pyrocarbonate
DHFR Dihydrofolate reductase
DMEM Dulbecco’s Modified Eagle’s Medium
DMSO Dimethyl sulfoxide
DNA Deoxynucleic acid
dNTP Deoxynucleoside triphosphate
DPBS Dulbecco’s phosphate buffered saline
DSMZ Deutsche Sammlung von. Mikroorganismen und
Zellkulturen GmbH
E (1-4) Early DNA regions in Ad5 genome
EDTA Ethylenediamintetraacetic acid
FBS Fetal bovine serum
Fig. Figure
FVIII:Ag Factor VIII antigen
FVIII:C Factor VIII activity
hAAT Human alpha1 antitrypsin
HEK 293 Human embryonic kidney 293 cells
hr Hour
HRP Horseradish peroxidase
HT supplement Hypoxanthine Thymidine supplement
IMDM Iscove’s Modified Dulbecco’s Medium
IPTG Isopropyl-beta-D-thiogalactopyranoside

7
ITR Inverted terminal repeat
IU International unit
iu infectious unit
kb kilo base pair
L (1-5) Late DNA regions in Ad5 genome
LB broth Luria-Bertani broth
MCS Multiple cloning site
min minute
MLP Adenovirus major late promoter
MMTV Mouse Mammary Tumor Virus promoter
MTX Methotrexate
nt Nucleotide
OD Optical density
ori Origin of replication
pA Polyadenylation signal
PAGE Polyacrylamid gel electrophoresis
PCR Polymerase chain reaction
PVDF Polyvinylidene difluoride
RCA Replication competent adenovirus
RE Restriction enzymes
RNA Ribonucleic acid
rpm Round per minute
RT Room temperature
SAP Shrimp Alkaline Phosphatase
SDS Sodium dodecyl sulfate
SOC Super Optimal broth with Catabolite repression
TAE Tris acetate EDTA buffer
TBS Tris buffered saline
SV40 Simian virus 40
UV Ultraviolet
V Volt
vp viral particle
vWF von Willebrand factor
wt Wild type
8
Contents
1. Introduction ...................................................................................................................... 12
1.1 Factor VIII: Function in blood coagulation ..................................................................... 12
1.2 Structure, biosynthesis and life cycle of factor VIII ....................................................... 14
1.2.1 Factor VIII gene ................................................................................................ 14
1.2.2 Biosynthesis and processing of factor VIII ....................................................... 15
1.2.3 Factor VIII protein structure ............................................................................. 16
1.2.4 Factor VIII in circulation ................................................................................. 17
1.3 Hemophilia A ................................................................................................................. 19
1.3.1 Phenotype ........................................................................................................ 19
1.3.2 Assessment ...................................................................................................... 20
1.3.3 Current therapy and side effects ....................................................................... 21
1.4 Recombinant factor VIII molecules ................................................................................ 22
1.5 Gene therapy for hemophilia A ....................................................................................... 24
1.5.1 Overview .......................................................................................................... 24
1.5.2 Adenoviruses as vectors for hemophilia A gene therapy ................................ 26
1.5.3 Recombinant baculoviruses as efficient gene delivery systems ...................... 29
1.6 Objectives of the study ................................................................................................... 31
1.6.1 Functional studies on factor VIII protein variants containing different lengths
of the B-domain .............................................................................................. 31
1.6.2 Construction of a new helper vector for the production of helper-dependent
adenovectors for the use in hemophilia gene therapy ..................................... 32
2. Materials and methods .................................................................................................. 33
2.1 Materials .......................................................................................................................... 33
2.1.1 Chemicals and reagents .................................................................................... 33
2.1.2 Buffers and solutions ........................................................................................ 34
2.1.3 Primers ............................................................................................................. 36
2.1.3.1 Primers used in the construction of B-domain deleted expression
plasmids ................................................................................................ 36
2.1.3.2 Primers used in verifying the constructed B-domain deleted expression
plasmids ............................................................................................... 37
9
2.1.3.3 Primers used for construction and verifying the plasmid, bacmid and viral
constructs of Bac-AAV2-Ad5, Bac-AAV2-Rep and Bac-EGFP .......... 38
2.1.4 Cell lines and culture media ............................................................................. 38
2.1.5 Plasmids and Vectors ....................................................................................... 39
2.2 Molecular biology methods ............................................................................................ 39
2.2.1 Isolation of plasmid DNA, bacmid DNA and extra chromosomal DNA ........ 39
2.2.2 Isolation of total RNA from cells grown in monolayer ................................... 40
2.2.3 Measurement of isolated DNA/RNA concentration ........................................ 41
2.2.4 Agarose gel electrophoresis ............................................................................. 41
2.2.5 PCR .................................................................................................................. 41
2.2.6 DNA sequencing .............................................................................................. 43
2.2.7 DNA restriction and ligation ............................................................................ 43
2.2.8 Transformation and electroporation of E.coli cells .......................................... 44
2.2.9 Construction of factor VIII expression plasmids with various truncated B
domain regions ................................................................................................. 44
2.2.10 Construction of recombinant bacmid DNA containing the adenovirus
helper genome ................................................................................................ 47
2.3 Cell culture ...................................................................................................................... 51
2.3.1 Cultivation and storage of cells ........................................................................ 51
2.3.2 Transient expression of B-domain deleted constructs in mammalian cell
lines ................................................................................................................. 51
2.3.2.1 Transfection .......................................................................................... 51
2.3.2.2 Expression studies ................................................................................ 52
2.3.3 Generation of stable cell lines expressing various factor VIII protein
variants in CHO-DHFR[-] cells ....................................................................... 53
2.3.3.1 Transfection, selection and amplification of CHO-DHFR[-] ............... 53
2.3.3.2 Limited dilution cloning and sub cloning ............................................. 54
2.3.4 Generation of helper recombinant baculovirus in insect cells ......................... 55
2.3.4.1 Transfection of Sf9 cells ....................................................................... 55
2.3.4.2 Amplification of P1 viral stock ............................................................. 56
2.3.4.3 Plaque assay .......................................................................................... 57
2.3.4.4 Virus preparation .................................................................................. 57
2.3.4.5 Verifying the purified virus by PCR analysis ....................................... 58
2.3.5 Rescuing the helper dependant adenovirus in HEK 293T cells ....................... 58

10
2.4 Biochemical methods ...................................................................................................... 60
2.4.1 Purification of factor VIII protein expressed in culture medium ..................... 60
2.4.2 Factor VIII activity assays................................................................................ 60
2.4.2.1 Clotting assay ........................................................................................ 60
2.4.2.2 Chromogenic assay ............................................................................... 61
2.4.3 Factor VIII antigen assay ................................................................................. 61
2.4.4 Purified factor VIII cleavage by thrombin and western blot analysis .............. 62
3. Results .............................................................................................................................. 63
3.1 Functional studies on factor VIII protein variants containing different lengths of the
B- domain ....................................................................................................................... 63
3.1.1 Construction (cloning) of expression plasmids containing different lengths
of the B-domain .................................................................................................. 63
3.1.2 Transient expression of different B-domain deleted plasmids in three mam-
malian cell lines .................................................................................................. 68
3.1.3 Functional studies on different B-domain deleted plasmids transiently
expressed in COS-7 cells .................................................................................... 71
3.1.4 Generation of stable cell lines in CHO-DHFR[-] cells ........................................ 73
3.1.5 Purification and thrombin activation of different recombinant FVIII
proteins ................................................................................................................ 75
3.2 Construction of a new helper vector for the production of helper-dependent adeno-
vectors for the use in hemophilia gene therapy ............................................................. 77
3.2.1 Construction of the plasmid pBac-AAV2-Ad5 ................................................... 77
3.2.2 Generation of the bacmid bBac-AAV2-Ad5 ....................................................... 80
3.2.3 Generation of helper recombinant baculovirus in insect cells ............................. 82
3.2.3.1 Transfection of SF9 cells with bacmid DNA and collection of P1
viral stock ............................................................................................. 82
3.2.3.2 Amplification of P1 viral stock ............................................................. 83
3.2.3.3 Viral purification: Plaque assay ............................................................ 83
3.2.3.4 PCR analysis of the purified virus ........................................................ 84
3.2.4 Rescuing the helper dependent adenovirus in HEK 293T cells .......................... 86

11
4. Discussion ......................................................................................................................... 88
4.1 Functional studies on factor VIII protein variants containing different lengths of
the B-domain ................................................................................................................... 88
3.2 Construction of a new helper vector for the production of helper-dependent adeno-
vectors for the use in hemophilia gene therapy .............................................................. 94
5. Summary .......................................................................................................................... 100
5.1 Functional studies on factor VIII protein variants containing different lengths of
the B-domain ................................................................................................................... 100
5.2 Construction of a new helper vector for the production of helper-dependent adeno-
vectors for the use in hemophilia gene therapy ............................................................. 101
6. References ........................................................................................................................ 103 7. Appendix ......................................................................................................................... 120
Lebenslauf ........................................................................................................................... 121

12
1. Introduction
1.1 Factor VIII: Function in blood coagulation
To maintain the integrity of the vascular system which is critical to all higher organisms with
closed circulatory systems, a complex, highly regulated system has evolved, consisting of
extensive interactions between the endothelial cell lining of the blood vessels, the blood
platelet, and an intricate cascade of plasma proteins (Davie et al., 1991; Flier and Underhill,
1992; Broze, 1992; Colman et al., 1994 and Schafer, 1994).
The coagulation cascade was one of the first biologic systems associated with human diseases
to be studied in detail at the biochemical level (Ratnoff, 1991). It is an ordered cascade
consisting of a plasma protease activating an inactive zymogene target to an active protease
form, which subsequently acts on the next step in the cascade (Fig. 1). It is traditionally
divided into the „intrinsic“ and „extrinsic“ pathways, but the biologic significance of this
distinction has been recently questioned. The extrinsic pathway is now viewed as the major
mechanism of coagulation under most circumstances, while the intrinsic pathway boost the
coagulation.
Coagulation begins almost instantly after an injury to the blood vessel has damaged the
endothelium lining the vessel. Exposure of the blood to proteins such as tissue factor initiates
changes to blood platelets. Platelets immediately form a plug at the site of injury; this is called
primary hemostasis. Secondary hemostasis occurs simultaneously (Fig. 1): The sequential
activation of plasma proteases in the intrinsic pathway of coagulation leading to the localized
generation of thrombin, which then converts the fibrinogen to cross-linked fibrin polymers
that strengthen the platelet plug (Furie B and Furie BC, 2005). FVIII is proteolytically
activated by activated factor X (FXa) and thrombin. FVIII has no enzymatic activity of its
own, but once activated, it acts as a cofactor to increase the maximal velocity of FX activation
by activated factor IX (FIXa) in an order of 10.000 in the presence of negatively charged
phospholipids and calcium (Kaufman 1992). In the next step, FXa acts in the presence of
activated factor V (FVa), negatively charged phospholipids, and calcium to activate
prothrombin to thrombin. Thrombin then enhances fibrin production and subsequently
activated factor XIII (XIIIa) leads to the cross-linking of fibrin monomers.

13
Figure 1: The coagulation cascade. The intrinsic cascade (which has less in vivo significance in normal physiological circumstances than the extrinsic cascade) is initiated when blood and exposed negatively charged surfaces comes in contact to each other. The extrinsic pathway is initiated upon vascular injury which leads to exposure of tissue factor, TF (also identified as factor III), a subendothelial cell-surface glycoprotein that binds on phospholipids. The green dotted arrow represents a point of crossover between the extrinsic and intrinsic pathways. The two pathways converge at the activation of factor X to Xa. Active factor Xa hydrolyzes and activates prothrombin to thrombin. Beside this function, Factor Xa has a role in the further activation of factor VII to VIIa as depicted by the green arrow. The role of thrombin is to convert fribrinogen to fibrin and to activate factor XIII to XIIIa. (also termed transglutaminase). However, thrombin can also activate factors XI, VIII and V furthering the cascade. In the last step of coagulation, factor XIIIa cross-links fibrin polymers solidifying the clot. HMWK = high molecular weight kininogen. PK = prekallikrein. PL = phospholipid. Coagulation factor VIII (FVIII) is one of the key components of blood coagulation cascade
(Mann 1999). It circulates in the bloodstream as a complex with von Willebrand factor
(vWF), which protects and stabilizes FVIII (Saenko et al., 1999). Deficiency of FVIII activity
leads to hemophilia A, a congenital bleeding tendency of variable severity that is caused by
distinct FVIII gene mutations (Kemball-Cook et al., 1998).
2
Figure 1: The coagulation cascade. The intrinsic cascade (which has less in vivo significance in normal physiological circumstances than the extrinsic cascade) is initiated when blood and exposed negatively charged surfaces comes in contact to each other. The extrinsic pathway is initiated upon vascular injury which leads to exposure of tissue factor, TF (also identified as factor III), a subendothelial cell-surface glycoprotein that binds on phospholipids. The green dotted arrow represents a point of crossover between the extrinsic and intrinsic pathways. The two pathways converge at the activation of factor X to Xa. Active factor Xa hydrolyzes and activates prothrombin to thrombin. Beside this function, Factor Xa has a role in the further activation of factor VII to VIIa as depicted by the green arrow. The role of thrombin is to convert fribrinogen to fibrin and to activate factor XIII to XIIIa. (also termed transglutaminase). However, thrombin can also activate factors XI, VIII and V furthering the cascade. In the last step of coagulation, factor XIIIa cross-links fibrin polymers solidifying the clot. HMWK = high molecular weight kininogen. PK = prekallikrein. PL = phospholipid.
Coagulation factor VIII (FVIII) is one of the key components of blood coagulation cascade
(Mann 1999). It circulates in the bloodstream as a complex with von Willebrand factor
(vWF), which protects and stabilizes FVIII (Saenko et al., 1999). Deficiency of FVIII
activity leads to hemophilia A, a congenital bleeding tendency of variable severity that is
caused by distinct FVIII gene mutations (Kemball-Cook et al., 1998).

14
1.2 Structure, biosynthesis and life cycle of factor VIII
1.2.1 Factor VIII gene
The FVIII gene has been localized to the distal Giemsa staining band positioned on the long
arm of the X chromosome, Xq28 (Poustka et al., 1991; Freije and Schlessinger 1992). It is
oriented with its 5’ untranslated region toward the telomere and thus it is transcribed toward
the centromere. It spans over 180 kb, and -as such- is one of the largest genes known. The
FVIII gene (Fig. 2) comprises 26 exons, which encode for a polypeptide chain of 2351 amino
acids. This includes a signal peptide of 19 amino acids and a mature protein of 2332 amino
acids (Wood et al., 1984; Vehar et al., 1984 and Toole et al., 1984).
The coding sequences (26 exons) range from 69 to 262 bp except for exon 26 and exon 14.
While exon 26 is nearly 2 kb and primarily contains 3’ untranslated sequence, exon 14 is the
largest exon (3.1 kb). The FVIII cDNA and mRNAs are approximately 9kb (Thompson
2003).
Introns vary from 0.2 kb for intron 17 to 32 kb for intron 22. Within intron 22, there are two
distinct non-FVIII gene elements controlled by a bidirectional promoter (Levinson et al.,
1990). The first, is a FVIII-associated A gene (F8A), a single exon transcribed in the opposite
direction. Homologous recombination between the F8A gene and one of two almost identical
copies that are localized telomeric of the FVIII gene leads to FVIII gene interruption and
accounts for nearly half of the families with severe hemophilia A (Kemball-Cook et al.,
1998). The second gene, F8B, represents an initial new first exon that is transcribed in the
same direction as FVIII and includes FVIII’s exons 23 to 26 (Levinson et al., 1992). The first
intron of the FVIII gene contains a 1-kb sequence, int1h-1, that is repeated in opposite
direction outside of the 5’ FVIII gene in a distance of 140 kb. (Bagnall et al., 2002). These
sequences provide additional sites of homologous recombination events, accounting for
approximately 5% of families with severe hemophilia A.

15
Figure 2: Factor VIII gene. The 26 exons (e) and their intervening sequences (i) are shown. Exon 14 is the largest follwed by exon 26, which is composed primarily of 3’ untranslated sequences (ut). Within the large intron 22 are the A and B genes that share a bidirectional promotor (◊ and arrows). (Thompson 2003).
1.2.2 Biosynthesis and processing of factor VIII
Factor VIII mRNA has been demonstrated in a variety of tissues, including spleen, lymph
nodes, liver, and kidney (Wion et al., 1985; Levinson et al., 1992; Elder et al., 1993).
However, the liver most likely provides the primary source of FVIII (Lenting et al., 1998).
Studies on factor VIII biosynthesis and secretion have been limited by the lack of human cell
lines that properly express significant amounts of FVIII. The best evidence for the
intracellular synthetic pathways comes from nonhuman, mammalian cell lines (like COS and
CHO cell lines) transfected with FVIII cDNA. These studies showed that, in general, FVIII is
poorly expressed (Thompson 2003). Low expression is associated with a low level of steady-
state mRNA (Kaufman et al., 1989) and inefficient secretion (Dorner et al., 1987).
FVIII is synthesized as a 2351-amino-acid single chain precursor from which a 19-amino-acid
signal peptide is cleaved upon translocation into the lumen of the endoplasmic reticulum
(ER). In the ER, high mannose oligosaccharides are added to multiple asparagine (Asn)
residues within the FVIII molecule, a process known as glycosylation (Kaufman 1992).
Within the ER, factor VIII appears to interact with a number of chaperone proteins, including
calreticulin, calnexin, and the Immunoglobulin-binding protein (BiP) (Dorner et al., 1989;
Marquette et al., 1995; Swaroop et al., 1997; Pipe et al., 1998). Due to the interaction with
these chaperone proteins, a significant proportion of the FVIII molecules are retained within
the ER, thereby limiting the transport of FVIII to the Golgi apparatus (Lenting et al., 1998).
Release from Bip is energy dependent and necessary before FVIII can be transported to the
Golgi apparatus, basically by another chaperone protein, the endoplasmatic reticulum-Golgi
intermediate compartment-53 (ERGIC-53). The interaction with ERGIC-53 is mannose
dependent and primarily involves Asn-linked oligosaccharides within the B domain
(Moussalli et al., 1999; Cunningham et al., 2001; Pipe 2009). Within the Golgi, Asn-linked
4
Figure 2: Factor VIII gene. The 26 exons (e) and their intervening sequences (i) are shown. Exon 14 is the largest follwed by exon 26, which is composed primarily of 3’ untranslated sequences (ut). Within the large intron 22 are the A and B genes that share a bidirectional promotor (! and arrows). (Thompson 2003).
1.2.2 Biosynthesis and processing of factor VIII
Factor VIII mRNA has been demonstrated in a variety of tissues, including spleen, lymph
nodes, liver, and kidney (Wion et al., 1985; Levinson et al., 1992; Elder et al., 1993).
However, the liver most likely provides the primary source of FVIII (Lenting et al., 1998).
Studies on factor VIII biosynthesis and secretion have been limited by the lack of human cell
lines that properly express significant amounts of FVIII. The best evidence for the
intracellular synthetic pathways comes from nonhuman, mammalian cell lines (like COS and
CHO cell lines) transfected with FVIII cDNA. These studies showed that, in general, FVIII is
poorly expressed (Thompson 2003). Low expression is associated with a low level of steady-
state mRNA (Kaufman et al., 1989) and inefficient secretion (Dorner et al., 1987).
FVIII is synthesized as a 2351-amino-acid single chain precursor from which a 19-amino-acid
signal peptide is cleaved upon translocation into the lumen of the endoplasmic reticulum
(ER). In the ER, high mannose oligosaccharides are added to multiple asparagine (Asn)
residues within the FVIII molecule, a process known as glycosylation (Kaufman 1992).
Within the ER, factor VIII appears to interact with a number of chaperone proteins, including
calreticulin, calnexin, and the Immunoglobulin-binding protein (BiP) (Dorner et al., 1989;
Marquette et al., 1995; Swaroop et al., 1997; Pipe et al., 1998). Due to the interaction with
these chaperone proteins, a significant proportion of the FVIII molecules are retained within
the ER, thereby limiting the transport of FVIII to the Golgi apparatus (Lenting et al., 1998).
Release from Bip is energy dependent and necessary before FVIII can be transported to the
Golgi apparatus, basically by another chaperone protein, the endoplasmatic reticulum-Golgi
intermediate compartment-53 (ERGIC-53). The interaction with ERGIC-53 is mannose
dependent and primarily involves Asn-linked oligosaccharides within the B domain
(Moussalli et al., 1999; Cunningham et al., 2001; Pipe 2009). Within the Golgi, Asn-linked
carbohydrates are modified, O-linked sugars are added to specific Ser and Thr residues within

16
carbohydrates are modified, O-linked sugars are added to specific Ser and Thr residues within
the B domain, disulfide bonding and protein folding occur, and six Tyr residues (within the
three acidic peptide sequences) are sulfated (Fig. 3) (Thompson 2003). Sulfation of tyrosine
residues increases the procoagulant activity of FVIII and is required for high affinity
interaction with vWF (Pittman et al., 1992; Leyte et al., 1991). In addition, FVIII is among
the many proteins that undergo intracelullar proteolysis (Kaufman et al., 1988, van de Ven
WJM et al., 1990, Hutton 1990). FVIII is cleaved after residues 1313 and 1648 within the B
domain to generate a 200 kDa amino-terminal-derived heavy chain (A1-a1-A2-a2-B) and an
80 kDa carboxy-terminal-derived light chain (a3-A3-C1-C2), giving rise to the heterodimeric
molecule that circulates in plasma (Kaufman 1992) (Fig. 4 A and B).
1.2.3 Factor VIII protein structure
Analysis of the deduced primary structure determined from the cloned FVIII cDNA showed
the presence of a discrete domain structure: A1-a1-A2-a2-B-a3-A3-C1-C2 (Wood et al.,
1984; Vehar et al., 1984; Toole et al., 1984 and Fay 2006) (Fig. 3). The A domains of FVIII
occur twice in the heavy and once in the light chain and have 30% homology to each other.
The C domains occur twice in the carboxy terminus of the FVIII light chain and exhibit
homology to proteins that bind glycoconjugates and negatively charged phospholipids (Poole
et al., 1981; Stubbs et al., 1990). The B domain, encoded by a single large exon of 3.1 kb
(Exon 14), has no known homology to other proteins, and contains 18 of the 25 potential
asparagine (N)-linked glycosylation sites within FVIII (Kaufman 1992; Pipe 2009). The A
domains are bordered by short spacers (a1, a2, and a3) that contain clusters of Asp and Glu
residues, the so-called acidic regions (Lenting et al., 1998).
The three homologous A domains bind Ca2+ and are essential for catalytic cofactor activity
(Lollar et al., 1993). The short acidic sequences between A1 and A2 and at the A2-B and B-
A3 junctions contain sulfated Tyr residues (Pittmann et al., 1992). Most of the large, central B
domain can be deleted without losing FVIII activity (Pittman et al., 1993; Eaton et al., 1986).
The acidic sequence connecting B with A3 (Glu1649-Arg1689) contains a major vWF-binding
site (Foster et al., 1988) that requires sulfation of Tyr1680 for vWF binding (Leyte et al., 1991).
C1 and C2 domains have homologies with FV and a class of lectins (Kane and Davie, 1988).
These carboxy-terminal domains contribute to vWF, FIX, FX binding, and also help FVIIIa to

17
bind to phospholipids (Thompson 2003). In addition, thrombin and FXa appear to bind to a
site on the surface of C2 domain (Nogami et al., 2000 and 1999).
Figure 3: The factor VIII protein. Mature factor VIII consists of 2332 amino acids, which are arranged in a discrete domain structure: A1 (residues 1-336), A2 (373-710), B (741-1648), A3 (1690-2019), C1 (2020-2172) and C2 (2173-2332). The A domains are bordered by acidic regions a1 (337-372), a2 (711-740) and a3 (1649- 1689) (Lenting et al., 1998).
1.2.4 Factor VIII in circulation:
FVIII circulates at 0.2 ug/ml in plasma as a heterodimer that is processed from a single
polypeptide upon secretion from the cell (Kaufman 1992) (Fig. 4 B). It circulates in complex
with vWF, an association that not only stabilizes and protects FVIII, but also helps to localize
FVIII to sites of vessel wall damage (Fay and Jenkins 2005; Lenting et al., 2010). The half-
life of FVIII is much shorter than that of vWF. About 95% of FVIII is bound at any time to
vWF in vivo with a molar ratio of about 1:50 (Vlot et al., 1995).
Recent evidence suggests that the extrinsic pathway may be the most significant physiologic
initiator of FVIIIa generation. FVII initiates the FVIII activation and FXa and thrombin
generation provide positive feedback to amplify FVIII activation (Kaufman 1992). Activation
of FVIII proceeds by limited proteolysis catalyzed by thrombin or factor Xa, with the former
likely representing the physiologic activator (Pieters et al., 1989; Fay 2004). Thrombin binds
to the sulfonated acidic peptides a1, a2, and a3 and cleaves peptide bonds after Arg372, Arg740,
Arg1689, respectively (Thompson 2003) (Fig. 4 B and C). In detail: cleavage within the heavy
chain after Arg740 generates a 90-kDa polypeptide (A1-A2), which is subsequently cleaved
after Arg372 to generate polypeptides of 50 (A1) and 43 (A2) kDa. Cleavage of the FVIII
heavy chain at Arg372 is essential to expose a factor IXa-interactive site (Fay et al., 2001),
6
Figure 3: The factor VIII protein. Mature factor VIII consists of 2332 amino acids, which are arranged in a discrete domain structure: A1 (residues 1-336), A2 (373-710), B (741-1648), A3 (1690-2019), C1 (2020-2172) and C2 (2173-2332). The A domains are bordered by acidic regions a1 (337-372), a2 (711-740) and a3 (1649-1689) (Lenting et al., 1998).
1.2.4 Factor VIII in circulation:
FVIII circulates at 0.2 ug/ml in plasma as a heterodimer that is processed from a single
polypeptide upon secretion from the cell (Kaufman 1992) (Fig. 4 B). It circulates in complex
with vWF, an association that not only stabilizes and protects FVIII, but also helps to localize
FVIII to sites of vessel wall damage (Fay and Jenkins 2005; Lenting et al., 2010). The half-
life of FVIII is much shorter than that of vWF. About 95% of FVIII is bound at any time to
vWF in vivo with a molar ratio of about 1:50 (Vlot et al., 1995).
Recent evidence suggests that the extrinsic pathway may be the most significant physiologic
initiator of FVIIIa generation. FVII initiates the FVIII activation and FXa and thrombin
generation provide positive feedback to amplify FVIII activation (Kaufman 1992). Activation
of FVIII proceeds by limited proteolysis catalyzed by thrombin or factor Xa, with the former
likely representing the physiologic activator (Pieters et al., 1989; Fay 2004). Thrombin binds
to the sulfonated acidic peptides a1, a2, and a3 and cleaves peptide bonds after Arg372, Arg740,
Arg1689, respectively (Thompson 2003) (Fig. 4 B and C). In detail: cleavage within the heavy
chain after Arg740 generates a 90-kDa polypeptide (A1-A2), which is subsequently cleaved
after Arg372 to generate polypeptides of 50 (A1) and 43 (A2) kDa. Cleavage of the FVIII
heavy chain at Arg372 is essential to expose a factor IXa-interactive site (Fay et al., 2001),
whereas cleavage at Arg740 removes the B domain or its fragments from A2 subunit (Fay and
Jenkins 2005). Concomitantly, the 80 kDa light chain (A3-C1-C2) is cleaved after Arg1689 to

18
whereas cleavage at Arg740 removes the B domain or its fragments from A2 subunit (Fay and
Jenkins 2005). Concomitantly, the 80 kDa light chain (A3-C1-C2) is cleaved after Arg1689 to
generate a 73-kDa polypeptide (Eaton et al., 1986). Furthermore, cleavage at 1689 releases
FVIII from vWF, relieving the vWF inhibition of FVIII-phospholipid interaction (Pittman and
Kaufman, 1989; Hill-Eubanks et al., 1989) and permitting the interaction of FVIII with
platelets where it interact with FIXa and FX.
Inactivation of the cofactor comprises two distinct pathways: spontaneous dissociation and
proteolytic degradation. Activated FVIII may be inactivated through spontaneous dissociation
of the A2-domain (43-kDa subunit) (Fig. 4 D) from the rest of the molecule. The association
of A2 subunit with the A1/A3–C1–C2 dimer is a weak interaction by affinity forces and
dissociation of A2 represents the primary mechanism for the observed lability of FVIIIa and
the self-dampening of factor X activity (Eaton et al., 1986). FVIIIa is proteolytically degraded
within the heavy chain by various enzymes; such as factor IXa, factor Xa and activated
protein C (APC) (Koedam et al., 1990; Rick et al., 1990; O’Brien et al., 1992). APC cleaves
FVIIIa after residues 336 and 562 and FXa cleaves it after residues 336 and 36 (Eaton et al.,
1986; Fay et al., 1991) (Fig. 4). Cleavage at position 336 in FVIIIa releases a1, the acidic
sequence that interconnects the A1 and the A2 domain. Because of this release, the A2
domain dissociates more rapidly from the factor VIIIa heterotrimer (Fay et al., 1993). This
acidic spacer has been proposed to comprise a binding site for the substrate factor X (Regan et
al., 1996; Lapan and Fay 1997), indicating that release of this site results in impaired
substrate binding. Thus, cleavage at Arg336 affects both intramolecular (A2 domain
dissociation) and intermolecular (FVIII-FX) interactions (Lenting et al., 1998). Inactivation
most closely correlates with cleavage at residue 562. Arg562, which is part of the A2 domain
sequence that comprises a factor IXa interactive site, is exclusively cleaved by APC (Fay et
al., 1991). It seems conceivable that loss of cofactor activity due to cleavage at this site reflect
the loss of the ability to interact with factor IXa (Lenting et al., 1998). The activation of
protein C by thrombin is regulated by thrombomodulin on the endothelial cell surface (Esmon
1989).
FVIII is removed from the blood circulation at least in part by binding to low-density
lipoprotein-related receptor protein (LRP) on the surface of hepatic endothelial cells
(Schwartz et al., 2000). This binding is facilitated by cell surface heparans (Sarafanov et al.,
2001).

19
Figure 4: Scheme of proteolytic conversions of factor VIII in the course of processing, activation and inactivation. HC: heavy chain; LC: light chain; APC, activated protein C; FXa, activated factor X. (modified of Khrenov et al., 2006).
1.3 Hemophilia A
1.3.1 Phenotype
Hemophilia A (OMIM 306700) is the most common inherited severe bleeding disorder. Its X-
linked pattern of inheritance was first recognized by Jewish scholars in the second century
AD (Ingram, 1976; Ratnoff, 1991). Hemophilia A is a heterogeneous disorder resulting from
defects in the FVIII gene that lead to a reduction in the circulating levels of functional FVIII.
The reduction in activity can be due to a decreased amount of FVIII protein, the presence of a
functionally abnormal protein, or a combination of both. In patients with hemophilia, clot
formation is delayed because thrombin generation is markedly decreased. The clot that is
formed is friable and easily dislodged, thus resulting in excessive bleeding and poor wound
healing (Christiansen et al., 2010; Williams Hematology, 5th edition, 1995).
The clinical manifestations of hemophilia A vary considerably and range from severe
bleedings already visible shortly after birth until very mild phenotypes that are only diagnosed
very late in life and during operations (Jones and Ratnoff, 1991; Hoyer, 1994; Furie et al.,
8
Figure 4: Scheme of proteolytic conversions of factor VIII in the course of processing, activation and inactivation. HC: heavy chain; LC: light chain; APC, activated protein C; FXa, activated factor X. (modified of Khrenov et al., 2006).
1.3 Hemophilia A
1.3.1 Phenotype
Hemophilia A (OMIM 306700) is the most common inherited severe bleeding disorder. Its X-
linked pattern of inheritance was first recognized by Jewish scholars in the second century
AD (Ingram, 1976; Ratnoff, 1991). Hemophilia A is a heterogeneous disorder resulting from
defects in the FVIII gene that lead to a reduction in the circulating levels of functional FVIII.
The reduction in activity can be due to a decreased amount of FVIII protein, the presence of a
functionally abnormal protein, or a combination of both. In patients with hemophilia, clot
formation is delayed because thrombin generation is markedly decreased. The clot that is
formed is friable and easily dislodged, thus resulting in excessive bleeding and poor wound
healing (Christiansen et al., 2010; Williams Hematology, 5th edition, 1995).
The clinical manifestations of hemophilia A vary considerably and range from severe
bleedings already visible shortly after birth until very mild phenotypes that are only diagnosed

20
1994). The severity of the disease can be predicted quite accurately from the level of residual
FVIII activity. Patients with very low or no FVIII activity (<1%) are affected with severe
hemophilia A, whereas those with FVIII levels of 1-5% have moderate and those with 5-25%
FVIII activity have mild hemophilia. FVIII levels above 25% are generally associated with a
normal phenotype.
Classic (severe) hemophilia is characterized by excessive bleeding into various parts of the
body. Soft tissue hematomas and hemarthroses are highly characteristic of the disease.
Severely affected patients with hemophilia may experience bleeding without known trauma.
Hemarthroses become frequent at about the time the patient begins to walk. Without effective
treatment, recurrent hemarthroses, resulting in chronic hemophilic arthropathy, occur by
young adulthood and are highly characteristic of the severe form of the disorder. Moderately
affected patients with hemophilia have occasional hematomas and hemarthroses, usually, but
not always, associated with known trauma. Although hemarthroses occur in moderately
affected patients, hemarthropathy is less disabling than that occurring in severely affected
patients. Mildly affected patients have infrequent bleeding episodes, and the disease may go
undiagnosed for years, only to be discovered because of excessive hemorrhage
postoperatively, following trauma, or after the toss and tumble of contact sports. Female
carriers of the disease have roughly 50% FVIII activity and experience no bleeding difficulty,
even with surgical procedures (Williams Hematology, 5th edition, 1995).
A broad spectrum of genetic defects within the FVIII gene has been identified, resulting in a
range of hemophilia phenotypes determined by the amount of residual FVIII activity
(Tuddenham et al., 1994; Hoyer, 1994; Antonarakis et al., 1995a). The frequency of
hemophilia A in the population is estimated to be approximately 1:10 000-1:5000 of all born
males (Soucie et al., 1998). As predicted by the Haldane hypothesis, about one-third of cases
appear to be new mutations. A large number of hemophiliacs have been studied at the DNA
level (Tuddenham et al., 1994) and a regularly update database of known mutations can be
assessed at: http://hadb.org.uk/
1.3.2 Assessment
Patients with severe hemophilia A characteristically have a prolonged activated partial
thrompoplastin time (APTT) (see section 2.4.2.1) and a prolonged whole blood clotting time

21
Different combinations of APTT reagents and instrumentation exhibit widely varying
sensitivities to FVIII levels. Functional FVIII activity (FVIII: C) is measured by clotting
assays. FVIII protein is measured by immunologic assays of FVIII antigen (FVIII: Ag), which
will detect both normal and abnormal FVIII molecules. If the FVIII antigen level is normal,
but the clotting activity is reduced, the patient has a dysfunctional FVIII molecule. FVIII
activity is expressed as percent of normal (normal: 100% FVIII: C) or as units per milliliter of
plasma (normal range: 1U/ml). One unit FVIII per ml is 100 percent of normal (William’s
Hematology, 5th edition, 1995).
1.3.3 Current therapy and side effects
Treatment of hemophilia A rests on replacement of the deficient FVIII activity. Hemophilia A
was initially treated with unpurified plasma, which contains 1 U/mL of FVIII activity. The
cryoprecipitate fraction of the plasma was subsequently shown to be enriched for FVIII
activity, thus permitting administration of smaller volume. Over the past three decades, highly
purified FVIII concentrates have become the main therapy for hemophilia A. Standard
commercial concentrates are prepared from plasma that has been generally pooled from 2000-
200,000 donors. Unfortunately, the purification process used until the mid-1980s failed to
inactivate common viral contaminants, including hepatitis B and C, cytomegalovirus (CMV)
and HIV. As a result, all these infections were nearly uniform among patients heavily treated
during the late 1970s and early 1980s. To prevent possible viral infections, purification
methods were developed to inactivate all these viruses by detergent or heat treatment.
Monoclonal antibody purification procedures further improved the quality of these products.
As a result, all currently available FVIII concentrates are thought to be free of viral hazard
(Brettler and Levine, 1989; Hoyer 1994; Furie et al., 1994).
With the advent of recombinant biotechnology, cloning of the FVIII gene led to the
development and production of the first generation of commercially available recombinant
FVIII (rFVIII) products, heralding a new era of viral safety in the treatment of hemophilia A
(Tuddenham 2003).
Newly diagnosed and previously untreated patients are generally managed with recombinant
FVIII or highly purified plasma-products, whereas most clinicians prefer the former. Many
hemophiliacs are followed in comprehensive clinics, where they receive multidisciplinary

22
care. A dose of FVIII of approximately 50 U/kg will generally raise the level from 0% to
100%. The half-life of FVIII is approximately eight hours, requiring repeated doses in case of
severe hemophilia (2-3 times a week) or treatment by continuous infusion. Therapy is
monitored by following the FVIII activity level. A FVIII level of 50% or more should achieve
normal homeostasis, even under extreme conditions.
Approximately 10-20% of patients develop inhibitor antibodies to FVIII that dramatically
complicate therapy. These antibodies can reach extremely high titers, and infusions of
sufficient FVIII to overwhelm the inhibitor may often be impractical. A variety of strategies
have been used to treat these inhibitors, including immunosuppression and various regimens
to induce tolerance (Hoyer, 1994; Furie et al., 1994). The most commonly used protocol to
eradicate inhibitors is still the ‘Bonn protocol’ (Brackmann et al., 1996).
1.4 Recombinant factor VIII molecules
The first generation of rFVIII molecules was produced by insertion of a full-sequence human
FVIII cDNA into expression vectors, yielding what is typically referred to as ‘full-length’
rFVIII (FL-rFVIII), which is biochemically and functionally similar to plasma-derived FVIII
(pdFVIII) (Eaton et al., 1987). In 1992, the company Baxter in conjunction with the Genetics
Institute introduced the world’s first genetically engineered factor VIII under the name of
‘Recombinate’. Then in February 1993, Genetech produced second recombinant factor VIII
product named ‘Kogenate’. The ‘first generation’ of recombinant products used animal
products in the culture medium and contained human albumin added as a stabilizer.
As the B-domain is not required for FVIII procoagulant activity (Andersson et al., 1986),
bioengineering of the FVIII molecule by removing the B-domain was found to dramatically
improve the yield of rFVIII (Dorner et al., 1987), enhancing expression of rFVIII as much as
20-fold (Pittman et al., 1993). The removal of the B-domain coding sequence brought several
advantages compared to the full-length molecule. The shorter cDNA led to a large increase of
FVIII mRNA amounts (Pittman et al., 1993; Pipe et al., 1998; Pittman et al., 1994) that
resulted in an improved production of a 170 kDa FVIII protein, secreted as an association of
heavy chain (A1-A2; 90 kDa) and light chain (A3-C1-C2; 80 kDa) (Pittman et al., 1993).
Such advantages rendered the BDD-FVIII more attractive for producing recombinant FVIII
compared to the FL-rFVIII (Sandberg et al., 2001). In addition, the limited size of the cDNA
23
construct allowed its insertion in most viral vectors that were used for gene therapy studies
(Chao et al., 2000; Connelly et al., 1996; Gnatenko et al., 1999; VandenDriessche et al.,
1999).
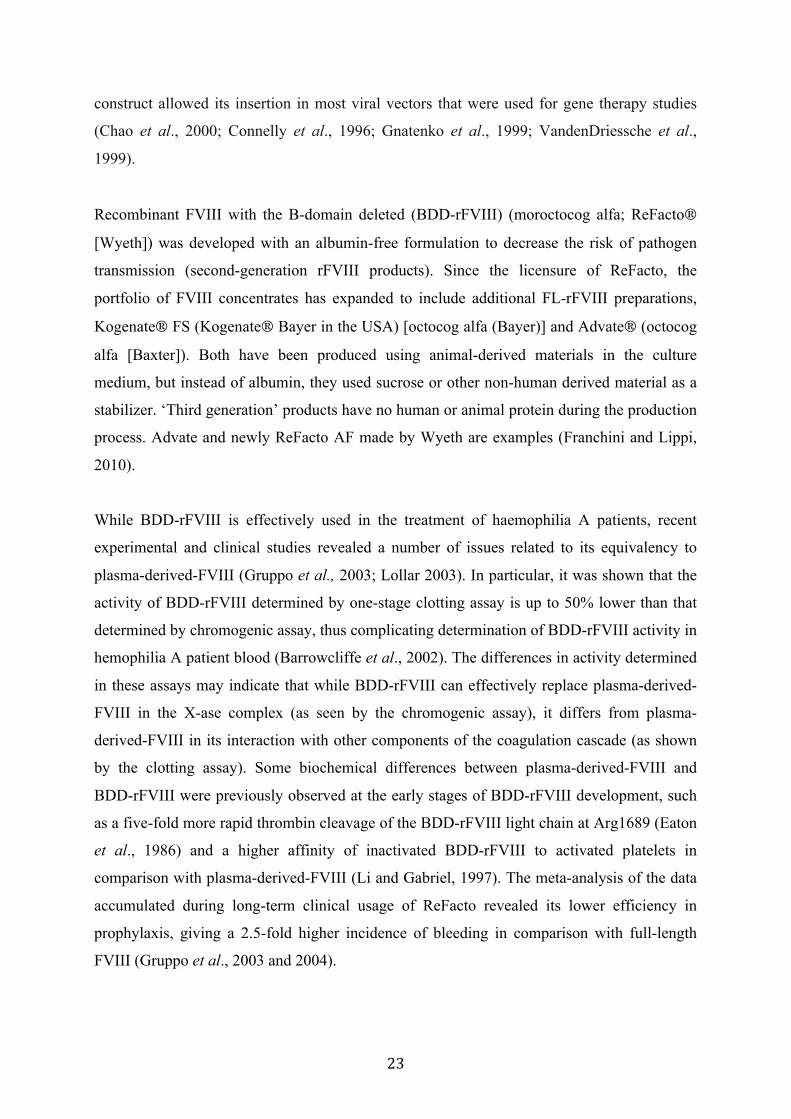
Recombinant FVIII with the B-domain deleted (BDD-rFVIII) (moroctocog alfa; ReFacto
[Wyeth]) was developed with an albumin-free formulation to decrease the risk of pathogen
transmission (second-generation rFVIII products). Since the licensure of ReFacto, the
portfolio of FVIII concentrates has expanded to include additional FL-rFVIII preparations,
Kogenate FS (Kogenate Bayer in the USA) [octocog alfa (Bayer)] and Advate (octocog
alfa [Baxter]). Both have been produced using animal-derived materials in the culture
medium, but instead of albumin, they used sucrose or other non-human derived material as a
stabilizer. ‘Third generation’ products have no human or animal protein during the production
process. Advate and newly ReFacto AF made by Wyeth are examples (Franchini and Lippi,
2010).
While BDD-rFVIII is effectively used in the treatment of haemophilia A patients, recent
experimental and clinical studies revealed a number of issues related to its equivalency to
plasma-derived-FVIII (Gruppo et al., 2003; Lollar 2003). In particular, it was shown that the
activity of BDD-rFVIII determined by one-stage clotting assay is up to 50% lower than that
determined by chromogenic assay, thus complicating determination of BDD-rFVIII activity in
hemophilia A patient blood (Barrowcliffe et al., 2002). The differences in activity determined
in these assays may indicate that while BDD-rFVIII can effectively replace plasma-derived-
FVIII in the X-ase complex (as seen by the chromogenic assay), it differs from plasma-
derived-FVIII in its interaction with other components of the coagulation cascade (as shown
by the clotting assay). Some biochemical differences between plasma-derived-FVIII and
BDD-rFVIII were previously observed at the early stages of BDD-rFVIII development, such
as a five-fold more rapid thrombin cleavage of the BDD-rFVIII light chain at Arg1689 (Eaton
et al., 1986) and a higher affinity of inactivated BDD-rFVIII to activated platelets in
comparison with plasma-derived-FVIII (Li and Gabriel, 1997). The meta-analysis of the data
accumulated during long-term clinical usage of ReFacto revealed its lower efficiency in
prophylaxis, giving a 2.5-fold higher incidence of bleeding in comparison with full-length
FVIII (Gruppo et al., 2003 and 2004).

24
1.5 Gene therapy for hemophilia A
1.5.1 Overview
The ambitious objective of gene therapy is to edit a defective gene sequence in situ to achieve
complete reversion of a disease phenotype for the lifetime of the patient. In spite of recent
successes in site-specific correction of defective gene sequences, the focus of most gene
therapy strategies to date is on gene addition rather than gene replacement (Urnov et al.,
2005). This simplified approach relies on a delivery mechanism to provide a correct copy of
the defective gene in somatic cells without removal of the error-containing genomic sequence.
Hemophilia A and B are among the most extensively researched diseases in the field of gene
therapy (Murphy and High 2008). Virtually every emerging gene delivery strategy, whether in
vivo or ex vivo, viral or non-viral, has been tested in the hemophilia animal models (Kaufman
1999). Gene transfer approaches for hemophilia are attractive because available clotting factor
concentrates have not completely (1) allay the fears of possible viral contamination, specially
plasma-derived concentrates, (2) alleviate chronic debilitating joint disease, or (3) resolve the
extreme expense of replacement therapy (Azzi et al., 2001; Zakrzewska et al., Fischer et al.,
2001). Additional important factors driving interest in gene transfer approaches in hemophilia
are (1) the detailed understanding of factor VIII gene, as well as structure, function, and
biology of the factor VIII protein (Kaufman 1999); (2) the beneficial clinical effects expected
to occur with even modest degrees of correction (1–5% of normal levels) (Nilsson et al.,
1992; Ljung 1999); (3) the availability of standardized coagulation assays to monitor factor
expression; (4) the capacity of multiple target organs to secrete and perform the required post-
translational modifications of FVIII (Yao et al., 1991; Arruda et al., 2001; Fakharzadeh et al.,
2000; Rosenberg et al., 2000); and (5) the availability of canine and mouse hemophilia
models that phenotypically mimic the human disease ( Bi et al., 1995; Lin et al., 1997; Evans
et al., 1989; Hough et al., 2002).
Ex vivo and in vivo approaches are being pursued for hemophilia gene therapy. Ex vivo gene
therapy involves the isolation of cells from the patient followed by expansion and genetic
modification in culture with vectors expressing FVIII and subsequent re-administration of
engineered cells to the patient. Successful ex vivo gene therapy requires efficient engraftment
of the engineered cells leading to sustained FVIII production in circulation (Chuah et al.

25
2001). Different cell types have been considered as potential targets for ex vivo hemophilia
gene therapy (Hortelano et al., 1996; Page and Brownlee 1997; Fakherzadeh et al., 2000).
Roth et al., 2001 have used ex vivo-transduced fibroblasts to transfer factor VIII in patients
with severe hemophilia A. Most ex vivo gene therapy strategies have relied on the use of
retroviral vectors and to a more limited extent on non-viral gene transfer systems.
Alternatively, in vivo gene therapy involves the administration of a gene transfer vector
encoding FVIII directly to the patient leading to in situ genetic modification of the target
cells. Intravenous administration of a FVIII vector would be a more cost-effective treatment
than ex vivo protocols. However, the main disadvantage of in vivo gene therapy based on viral
vectors is that a host immune response towards the viral vector would preclude vector re-
administration, if more than one injection would be required to achieve therapeutic FVIII
levels (Chuah et al., 2001).
Hemophilia gene therapy requires the use of a gene delivery system that is efficient, safe,
non-immunogenic and allows long-term gene expression. Both viral vectors as well as non-
viral vectors have been considered for the development of hemophilia gene therapy (High
2003). In general, viral-vector mediated gene transfer is far more efficient than non-viral gene
transfer and is therefore the method of choice. The viral vectors are of retroviral, lentiviral,
adenoviral and adeno-associated viral (AAV) origin, each with their own advantages and
limitations (Chuah et al., 2001).
Five different gene therapy Phase I clinical trials were initiated between 1998 and 2001 for
the treatment of hemophilia using different gene delivery systems (Kay et al., 2000; Roth et
al., 2001; Manno et al., 2003 and Powell et al., 2003). Three of them dealt with hemophilia
A. The first was initiated by injecting a Moloney murine leukemia virus-based retroviral
vector encoding B-domain deleted factor VIII. Doses ranging from 2.7 * 107 transducing units
(TU)/kg to 4.4 * 108 TU/kg were tested. Factor VIII levels above 1% were sporadically
detected but didn’t correlate with the dose administered; thus the signs of clinical
improvement following vector infusion were modest at best (Powell et al., 2003). These
findings were consistent with animal studies suggesting that efficient retroviral transduction
of hepatocytes would require higher doses of viral vectors and a stimulation of cell division of
hepatocytes.
A second Phase I clinical trial was initiated to test the safety of a high capacity (gutless)

26
adenoviral vector encoding human factor VIII. Because of a priori concerns regarding
immunogenicity, the trial was constructed to monitor carefully changes of liver function tests
or platelet count. The first subject, enrolled at the lowest dose of 4.3 * 1010 vector particles
(vp)/kg, experienced inflammation, fever and myalgia upon vector infusion; these symptoms
are commonly observed with infusion of adenoviral vectors. The subject also experienced
thrombocytopenia and an elevation in serum transaminases. The experiment resulted in
having 1% of normal factor VIII levels for several months (Chuah et al., 2004). Due to safety
concerns and disappointing results, no additional subjects were enrolled in this trial.
One non-viral delivery method was also tested as a clinical trial (Roth et al., 2001) consisting
of transplantation of factor VIII-transduced autologous fibroblasts. After isolation from skin
biopsy, patient cells were transfected with a plasmid encoding a human factor VIII cDNA ex
vivo and stable transfectants were selected. Single clones were expanded and tested for factor
VIII expression level, as well as tumorigenicity and microbial safety. After reimplantation
into the omentum, only a modest and temporary positive effect could be observed. The
treatment was well tolerated and leaves the possibility of future attempts open using more
potent expression systems for the ex vivo transduction and selection process.
1.5.2 Adenoviruses as vectors for hemophilia A gene therapy
Adenoviruses have several attractive features that make them particularly well suited for
vector development and gene therapy. The genome has a size of 36 kb, which after (partial)
deletion leaves a relatively large packaging capacity. Adenoviruses can infect and express
genes at high levels in many different cell types and host cell replication is not required for
expression, so nondividing cells such as hepatocytes are readily infected. There are at least 50
different human serotypes, sub grouped A to G, which are commonly associated with mild
diseases. Most adenoviral vectors currently used are derived from serotypes 2 and 5, which
are endemic and cause upper respiratory tract infection (Chuah et al., 2001; Vorburger and
Hunt, 2002). No known malignant tumors have resulted from adenovirus infection. Given that
they have been used in live virus vaccine studies for many years without problems, they have
a long-standing safety record (Thorrez et al., 2004).
The difference between an adenovirus and its cognate vector is that the parental virus can
replicate and infect other cells after infection, whereas adenoviral vectors can enter a cell, but

27
cannot use the cell to replicate. This impaired replication is due to the lack of at least one of
the essential viral regulatory genes, which is replaced by the gene of interest, in our case
FVIII. Although adenoviral vectors cannot replicate, they do retain all of the other essential
properties, including the tropism of the parental viruses from which they are derived.
Adenoviral vectors are relatively easy to manufacture at high concentrations (>1010 infectious
units [iu] / mL) (Thorrez et al., 2004). They are well suited for hepatic gene delivery, but
their main disadvantage is that the host immune response limits the duration of transgene
expression and the ability to re-administer the vector (Schagen et al., 2004). A second
inherent limitation to the duration of transgene expression is that the adenoviral DNA is not
integrated into the host genome but is maintained episomally. Hence, dividing cells will
gradually lose the adenoviral vector along with its potentially therapeutic gene. However, this
also implies that there is virtually no risk of neoplastic transformation caused by insertional
mutagenesis (Thorrez et al., 2004).
The first-generation adenoviral vectors that were developed contained a deletion of the entire
E1A and part of the E1B regions of the adenoviral genome (Kozarsky and Wilson 1993;
Krougliak 1995) (Fig. 5A). This deletion allowed the insertion of an expression cassette up to
8 kb. The E1 and other missing genes necessary for vector assembly are complemented in
trans using appropriate packaging cells that express these genes (Berkner 1988).
Acute and chronic toxic and lethal effects were observed frequently in nonhuman primates
and other animals (including mice, rabbits and dogs) that receive high doses of replication-
deficient adenoviral vectors (Connelly et al., 1996; Lozier et al., 1999). Several clinical trials
based on adenoviral vectors had to be discontinued because of acute inflammatory responses
and severe morbidity and mortality in some patients (National Institutes of Health
Recombinant DNA Advisory Committee Assessment of adenoviral vector safety and toxicity,
2002).
This cellular immune response could be attenuated by further reducing viral gene expression.
This was initially accomplished by alteration or deletion of additional early viral genes such
as E2 or E4 (Armentano et al., 1995; Gao et al., 1996; Yeh et al., 1996) (Fig. 5B/C). Despite
the fact that those second-generation vectors did not reveal any detectable de novo vector
DNA synthesis or de novo viral gene expression in transduced cells, there was no significant
difference in gene transfer and expression compared to first-generation adenoviral vectors

28
(Gorziglia et al., 1996). Further attenuation of the adenoviral vector backbone by removal of
E1/E2/E3/E4 diminished vector toxicity further; however, the duration of transgene
expression was reduced (Fig. 5D) (Andrews et al., 2001).
High-capacity (HC) adenoviral vectors are the ultimate adenoviral vector modification which
comprises a vector containing only the cis-acting elements necessary for replication and
packaging, but lacking all adenoviral genes (Morral et al., 1999) (Fig. 5E). HC adenoviral
vectors, also called gutted or gutless, fully-deleted (FD) and helper-dependent (HD)
adenovectors can theoretically accommodate up to 37 kb of insert (Kochanek 1999; Schiedner
et al., 1998; Parks and Graham 1997). Production of HC adenoviral vectors depends on the
use of helper viruses that provide all missing functions in trans but cannot be packaged
because of mutations in their packaging signal (Kochanek et al., 1996, Mitani et al., 1995;
Clemens et al., 1996). As expected, High-capacity vectors give rise to prolonged transgene
expression (Morsy et al., 1998; Schiedner et al., 1998; Balague et al., 2000; Zou et al., 2000)
showing a significantly reduced acute and chronic hepatotoxicity as well as reduced
inflammatory responses compared with first-generation adenoviral vectors (Schiedner et al.,
1998), even in large animal models such as primates or dogs (Morral et al., 1999; Chuah et
al., 2003), which are more susceptible to the toxic side effects of adenoviral vectors than mice
(Gallo-Pen et al., 2001; Schnell et al., 2001).
The positive effect of HC vectors could be seen when comparing mice treated with HC
vectors to mice treated with early generation vectors. HC vector-treated mice displayed 10-
fold higher FVIII expression levels that were sustained for at least 9 months (Reddy et al.,
2002). It is not certain whether these vectors could give rise to life-long transgene expression
because several studies demonstrated a slow but significant decline in transgene expression
(Balague et al., 2000; Reddy et al., 2002). This may be due to the low turnover rate of
hepatocytes leading to the gradual loss of the high- capacity adenoviral vector. The complete
absence of de novo expression of adenoviral gene expression in the cells that are transduced
with the HC adenoviral vectors is expected to prevent the induction of cytotoxic T
lymphocytes (CTL), provided the transgene itself is non immunogenic.

29
Figure 5: Comparison of deletions in the adenoviral genome for different generations of adenoviral vectors.
WT, wild type; HC, high capacity and ITR, inverted terminal repeats (Thorrez et al., 2004).
1.5.3 Recombinant baculoviruses as efficient gene delivery systems
Baculoviruses comprise a diverse group of arthropod viruses (Miller 1997). The best-studied
member of this family, Autographa californica nuclear polyhedrosis virus (AcMNPV) is a
large enveloped virus with a double-stranded, circular DNA genome of around 130 kb.
Baculoviruses usually possess a rod shaped capsid (40 to 50 nm in diameter and 200 to 400
nm in length). Within the protein capsid, the nucleoprotein core contains the condensed DNA
genome (O’Reilly et al., 1992). The complete sequence of the viral genome has been
determined (Ayres et al., 1994). The application of recombinant baculoviruses for the
expression of recombinant proteins in insect cells was first described in the early 1980s
(Smith et al., 1983; Pennock et al., 1984). Since these initial reports, the baculovirus insect
cell expression system has been extensively developed and used for the production of
numerous recombinant proteins in insect cells (O’Reilly et al., 1994; Kost et al., 2000). The
most commonly used insect host cell lines are the Sf9 and Sf21AE lines originally derived
from Spodoptera frugiperda pupal ovarian tissue (Vaughn et al., 1977) and the BTI-Tn-5B1-4
line, also known as ‘High 5 cells’, derived from Trichoplusia ni egg cell homogenates
(Granados et al., 1994).
Besides expression of proteins, the baculovirus AcMNPV has been recently reported to work
as a functional vector for gene delivery in mammalian cells of various origins (Kost and
Condreay 2002; Pieroni and La Monica, 2001; Sandig and Strauss, 1996). Several years ago,
18
with the HC adenoviral vectors is expected to prevent the induction of cytotoxic T
lymphocytes (CTL), provided the transgene itself is non immunogenic.
Figure 5: Comparison of deletions in the adenoviral genome for different generations of adenoviral vectors. WT, wild type; HC, high capacity and ITR, inverted terminal repeats (Thorrez et al., 2004).
1.5.3 Recombinant baculoviruses as efficient gene delivery systems
Baculoviruses comprise a diverse group of arthropod viruses (Miller 1997). The best-studied
member of this family, Autographa californica nuclear polyhedrosis virus (AcMNPV) is a
large enveloped virus with a double-stranded, circular DNA genome of around 130 kb.
Baculoviruses usually possess a rod shaped capsid (40 to 50 nm in diameter and 200 to 400
nm in length). Within the protein capsid, the nucleoprotein core contains the condensed DNA
genome (O’Reilly et al., 1992). The complete sequence of the viral genome has been
determined (Ayres et al., 1994). The application of recombinant baculoviruses for the
expression of recombinant proteins in insect cells was first described in the early 1980s
(Smith et al., 1983; Pennock et al., 1984). Since these initial reports, the baculovirus insect
cell expression system has been extensively developed and used for the production of
numerous recombinant proteins in insect cells (O’Reilly et al., 1994; Kost et al., 2000). The
most commonly used insect host cell lines are the Sf9 and Sf21AE lines originally derived
from Spodoptera frugiperda pupal ovarian tissue (Vaughn et al., 1977) and the BTI-Tn-5B1-4
line, also known as ‘High 5 cells’, derived from Trichoplusia ni egg cell homogenates
(Granados et al., 1994).

30
baculovirus was shown to infect hepatic cell lines and express foreign genes under the control
of mammalian promoters (Boyce et al., 1996; Hofmann et al., 1995). Subsequently,
recombinant baculoviruses has been shown to transduce foreign genes into additional cell
lines, including those of non-hepatic origin (Shoji et al., 1997).
The use of recombinant baculovirus vectors for gene delivery in mammalian cells has been
widely documented over the last few years. Baculovirus has been demonstrated to be a very
efficient vector in a variety of cell lines due to a general non-tissue-specific uptake
mechanism, and transcription machinery regulated intracellularly by epigenetic factors. Its
large insert capacity, the ease of production at high titer and the lack of cytotoxicity are the
basic feature of this vector. This vector has been successfully used for therapeutic studies in
vitro (e.g. the testing of antiviral compounds) or ex vivo (e.g. anticancer therapy) but has also
been developed as a safe and efficient vector suitable for in vivo gene therapy. The most
recent examples of gene delivery in vivo in liver, skeletal muscle and the central nervous
system of mice and rats shows that it is worth to further develop baculovirus-derived vectors
capable to prolong in vivo gene expression. Baculoviral vectors are suitable for the treatment
of acquired or inherited diseases in humans (Pieroni and La Monica, 2001). Since baculovirus
promoters are silent in mammalian cells, no virus replication occurs. In addition, no cytotoxic
effects mediated by this virus in mammalian cells have been reported (Sollerbrant et al.,
2001).

31
1.6 Objectives of the study
1.6.1 Functional studies on factor VIII protein variants containing different lengths of
the B-domain
The aim of this part of the study is to evaluate the importance and the effect of the B domain
region on factor VIII (FVIII) expression and activity and to generate a B-domain deleted
recombinant FVIII (BDD-rFVIII) containing the minimal B-domain sequence required for
optimal thrombin binding and FVIII activation. This BDD-rFVIII should show the minimal
(or no) discrepancy between the clotting assay and the chromogenic activity assay.
For this purpose, several FVIII expression plasmids containing various lengths of the B-
domain (approximately 100, 200, 300, 400 amino acids starting from the amino terminus of
the B domain) as well as a B-domain deleted construct will be constructed and expressed
transiently and stably. FVIII activity should be assessed in culture medium and from purified
products, whereas FVIII antigen should be assessed from culture medium and cellular lysates.
Purified FVIII products will also be cleaved by thrombin and analysed by western blotting.
FVIII constructs should be expressed at the beginning in three mammalian cell lines (COS-7,
HEK 293T and CHO) and the cell line that shows the highest expression level in terms of
FVIII activity level in culture medium should then be used for further expression and
functional analysis of the constructs. Additionally, the constructs should also be expressed
stably in CHO-DHFR[-] cell line.
To evaluate the importance of the B-domain region, the different FVIII constructs (containing
different lengths of the B-domain) should be compared to the BDD construct in terms of: 1)
Activity level using clotting and chromogenic assays, 2) Assay discrepancy of both activity
assays, 3) Expression level in terms of the total amount of FVIII produced; in medium as well
as trapped inside cells), 4) Functionality in terms of FVIII specific activity and 5) FVIII
activation by thrombin.

32
1.6.2 Construction of a new helper vector for the production of helper-dependent
adenovectors for the use in hemophilia gene therapy
The aim of this part of the study is to design a novel helper system for the production of a
helper-dependent adenovector (HD-AdV) carrying a B-domain-deleted factor VIII-cDNA
without any contamination with a helper virus. For this, a packaging deficient, replication-
competent adenovirus Helper genome will be delivered to the HD-AdVs containing cells by a
recombinant Baculovirus / Adenovirus hybrid. This Helper genome should provide (in trans)
all of the functions necessary for the propagation of HD-AdVs.
In designing our novel helper genome, we will use only Ad5 genes (nts 4000 to 35832)
necessary for replication and packaging of HD-AdV. The helper genome will be deleted of
the 5'ITR (nts 1-190), the packaging signal (nts 191-358), the 3'ITR (nts 35833-35935) and
the E1/E3 region, thus rendering it replication incompetent and packaging incompetent. As
the replication of the Ad5 helper genome will result in HD-AdV production, its replication
will be achieved by fusing the AAV2-ITRs (5'ITR; 3'ITR) into the helper genome construct.
AAV2-ITRs can then serve as origins of replication given that the AAV2-rep78/68 genes are
provided in trans.
For augmentation of this DNA construct, (AAV2[5'ITR] /Ad5/ AAV2[3'ITR]), it will be
integrated into the Baculovirus genome. This hybrid helper vector "Bac-AAV2-Ad5" can then
be propagated to high titers in Sf9 insect cells.
Once the Bac-AAV2-Ad5 helper virus is produced, it can be used to rescue the HD-AdV in
HEK 293 cells. For this, HEK 293 cells, already transfected with the HD-AdV, will be
infected with Bac-AAV-Ad5 and Bac-AAV2-Rep (a baculoviral construct carrying the
Rep78/68 genes) viruses. Inside the cells, the AAV2-ITRs should function as an origin of
replication and as a termination signal supported by the Rep78/68 protein synthesized by Bac-
AAV2-Rep virus. Additionally, the Ad5 genome of the helper vector will provide all Ad5
proteins necessary for replication and packaging of HD-AdV.
33
2. Materials and methods:
2.1 Materials
2.1.1 Chemicals and reagents
Chemicals and reagents used in this study are listed below in alphabetical order after the
supplier's name. All chemicals were of analytical grade.
Applied Biosystems BigDye terminator; Template suppression reagent (Weiterstadt)
Bio-Rad PVDF membrane; Precision protein standards; (Muenchen) (10-250Kda); 7.5% SDS-PAGE gels
Biozym Agarose LE (Hess. Oldendorf)
Dade Behring Human FVIII-deficient plasma; (Marburg) Lyophilized standard human plasma
Diagnostica Stago Asserachrom VIII:CAg (France)
Fermantas 1 Kb DNA ladders (St.Leon-Rot)
Fluka Chloroform:isoamylalcohol (24:1); chloroform; (Neu Ulm) Formamide; Formaldehyde; SDS; Ethidium bromide (10 mg/ml); glycine; Tris base; Nonidet-P40; Luminol
GE Healthcare FVIII-select; PD-10 columns; PD-10 buffer reservoir (Freiburg)
Invitrogen All tissue culture media; EDTA-Trypsin; D-PBS; (Leek, Niederland) Phenol:chloroform:isoamylalcohol (25:24:1); Platinum Taq DNA polymerase; EDTA; Ethanol; Methanol; Isopropanol; Glycerol; Sodium chloride; Sodium acetate; Sodium citrate; Lipofectamine 2000; Cellfectin; Penicillin/ streptomycin solution (100x) DH5α competent cells; HT supplement (50x); Trizol; SuperScript III Reverse Transcriptase

34
Millipore Ultracel-30K Amicon ultra centrifugal filters (Ireland)
New England Biolabs All restriction enzymes, 1 Kb DNA ladder (Schwalbach/Taunus)
Nunc Nalgene Tissue culture dishes, plates, flasks and pipettes (Wiesbaden)
PeqLab Pwo DNA polymerase (Erlangen)
Qiagen Mini- and Maxi-Plasmid kits; DNeasy kit; Gel Extraction (Hilden) kit
Roche dNTP mix (10 mM); Expand long template PCR Kit; (Mannheim) Proteinase K; BSA (20 mg/ml); DNA molecular weight marker X ; T4 DNA ligase; SAP; Klenow enzyme; CompleteTM protease inhibitor cocktail
Sartorius stedim biotech Vivaspin 20 columns (30,000 MWCO) (Gottingen)
Sigma Cesium chloride; DMSO; Tween 20; LB broth and Agar; (Deisenhofen) Ampicillin; p-Coumaric acid; Methotrexate; Dialyzed FBS; Insect cell culture tested FBS; DEPC
Stratagene Competent cells (XL10-Gold, BJ5183) (Heidelberg)
Thermoscientific Pierce centrifuge columns (~30µm pore size) (USA)
2.1.2 Buffers and solutions
Buffer A 20 mM Imidazol 1 M Sodium chloride 20 mM Calcium chloride 200 ppm Tween-80
Buffer B 20 mM Imidazol 1.5 M Sodium chloride 50% Ethylene glycol 20 mM Calcium chloride 200 ppm Tween-80
35
Cell lysis buffer 20 mM Tris-HCL, pH 8.0 150 mM Sodium chloride
1 mM EDTA 0.5 % Nonidet-40 CompleteTM protease inhibitor cocktail(added before Use)
DNA gel loading buffer 0.25 % Bromophenol blue 40 % (w/v) Sucrose in water
Laemmli sample buffer 62.5 mM Tris-HCL, pH 6.8 25 % Glycerol 2 % SDS 0.01% Bromophenol blue Add 50 µl of β-Mercaptoethanol per 950 µl buffer Before use
Protein electrode running 250 mM Tris base, pH 8.3 buffer (10x) 1.92 M Glycine 1 % SDS
Solution I 15 mM Tris-HCL, pH 8.0 10 mM EDTA 100 µg/ml RNase A
Solution II 0.2 N Sodium hydroxide 1% SDS
Solution A 0.1 M Tris-HCl, pH 8.6, 200 ml 50 mg Luminol
Solution B DMSO, 10 ml 11 mg para-Hydroxycoumaric acid
TAE (50x) 2 M Tris-base (pH 8.0) 1 M Glacial acetic acid 0.05 M EDTA (pH 8.0)
TBS (10x) 200 mM Tris base, pH 7.6 1.379 M Sodium citrate
Thrombin buffer (10x) 200 mM Tris-HCl. pH 8.4 1.5 M NaCl 25 mM CaCl2
TE buffer 10 mM Tris (pH 8.0) 1 mM EDTA

36
Western blocking buffer 1x TBS 0.1 % Tween-20 5 % Skimmed milk
Towbin (Transfer) 25 mM Tris base, pH 8.3 buffer 192 mM Glycine 20 % Methanol
2.1.3 Primers
All primers are in 5'-3' –orientation. Sense primers end up with (s) while antisense ones with (a).
2.1.3.1 Primers used in the construction of B-domain deleted expression plasmids
Table 1: Primers used in the construction of B-domain deleted expression plasmids.
25
2.1.3 Primers
All primers are in 5'-3' –orientation. Sense primers end up with (s) while antisense ones with
(a).
2.1.3.1 Primers used in the construction of B-domain deleted expression plasmids
Primer name Primer sequence
pMTF8-6085Ns CAT CGA CGT ACT TCG CGA CTG TGC TCT CAA AAC CCA CC
pMTF8-6068SNs GCT CAG CAA CTA GTT GCC ATC GAC GTA CTT CGC GAC TG
pMTF8-7310Aa ATC CGG AAT AAT GAA GTC TGG CCA GC
pMTF8-3369Na CTA TGG ACT TCG CGA GAA GCT TCT TGG TTC AAT GGC
pMTF8-3671Na GTA TAC TCT TCG CGA GTG ATG GAG CTG TGG CCT GAA G
pMTF8-3973Na GAC GAC GCT TCG CGA ATC ATT ATT TTC TTC ACT CAA G
pMTF8-4243Na GAC GAC GCT TCG CGA TTC TAA TAT ATT TTG CCA GAC TG
pMTF8-4551Na CAG GAC TCT TCG CGA TTT TTC TGG TCC TAA GGA TAC
pMTF8-1689s CTT GAA TTC AGG CCT CAT TGG AGC C
Table 1: Primers used in the construction of B-domain deleted expression plasmids.
2.1.3.2 Primers used in verifying the constructed B-domain deleted expression plasmids
Primer name Primer sequence
FVIII-210a AAG GCA CAG AAA GAA GCA GG
FVIII-172s ATG CAA ATA GAG CTC TCC ACC
FVIII-681s ACT GTG CCT TAC CTA CTC AT
FVIII-1203s AGT AGA CAG CTG TCC AGA GG
FVIII-1770s AGT GAC TGT AGA AGA TGG GC
FVIII-2311s TCA GAC TTT CGG AAC AGA GG
FVIII-2821s ACA ACT GCA GCA ACA GAG TTG
FVIII-3297s GAA TAG TCC ATC AGT CTG GC
FVIII-3862s CCT CAG ATA CAT ACA GTG AC
FVIII-4381s AGA TCT CCA TTA CCC ATT GC
FVIII-4906s AAG CTA TTG GAT CCT CTT GC
FVIII-5406s TGT CCC TCA GTT CAA GAA AG
FVIII-5941s TCC CTG CAA TAT CCA GAT GG
FVIII-6501s GAA GTT CTC CAG CCT CTA CA
FVIII-7001s AGG AGT TCC TCA TCT CCA GC
pMT2-487s TCC ACT CGC TCC AGG GTG
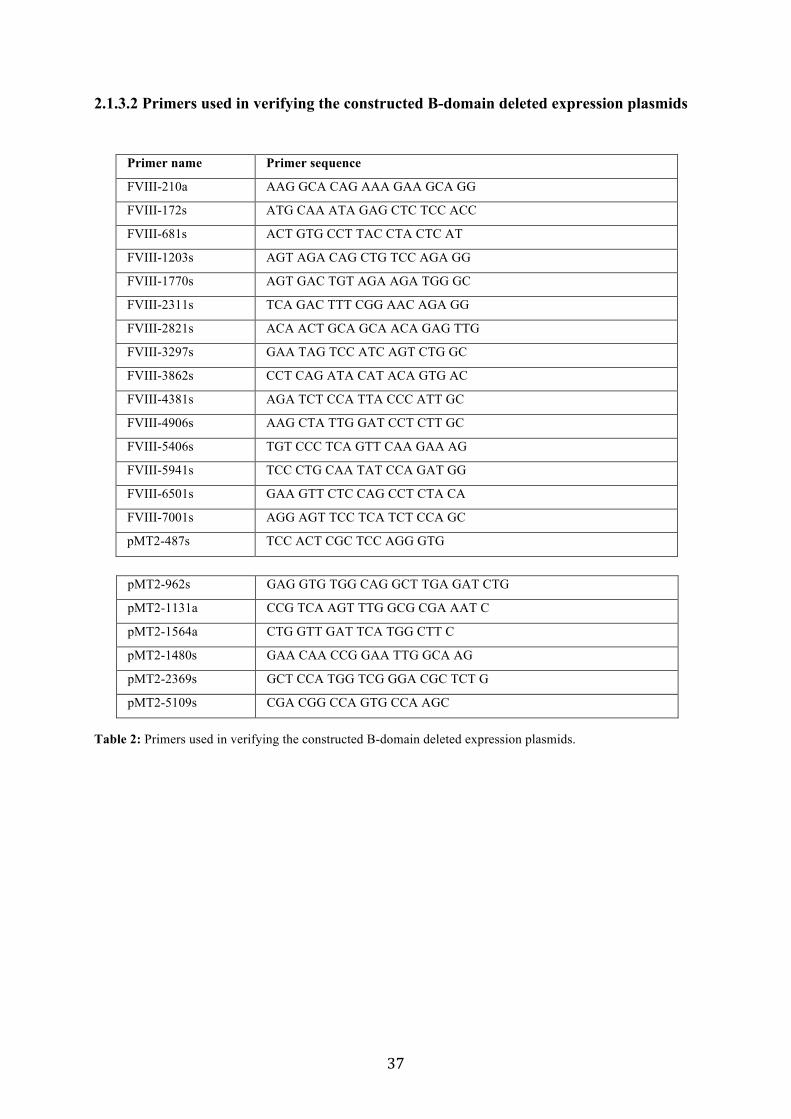
37
2.1.3.2 Primers used in verifying the constructed B-domain deleted expression plasmids
Table 2: Primers used in verifying the constructed B-domain deleted expression plasmids.
25
2.1.3 Primers
All primers are in 5'-3' –orientation. Sense primers end up with (s) while antisense ones with
(a).
2.1.3.1 Primers used in the construction of B-domain deleted expression plasmids
Primer name Primer sequence
pMTF8-6085Ns CAT CGA CGT ACT TCG CGA CTG TGC TCT CAA AAC CCA CC
pMTF8-6068SNs GCT CAG CAA CTA GTT GCC ATC GAC GTA CTT CGC GAC TG
pMTF8-7310Aa ATC CGG AAT AAT GAA GTC TGG CCA GC
pMTF8-3369Na CTA TGG ACT TCG CGA GAA GCT TCT TGG TTC AAT GGC
pMTF8-3671Na GTA TAC TCT TCG CGA GTG ATG GAG CTG TGG CCT GAA G
pMTF8-3973Na GAC GAC GCT TCG CGA ATC ATT ATT TTC TTC ACT CAA G
pMTF8-4243Na GAC GAC GCT TCG CGA TTC TAA TAT ATT TTG CCA GAC TG
pMTF8-4551Na CAG GAC TCT TCG CGA TTT TTC TGG TCC TAA GGA TAC
pMTF8-1689s CTT GAA TTC AGG CCT CAT TGG AGC C
Table 1: Primers used in the construction of B-domain deleted expression plasmids.
2.1.3.2 Primers used in verifying the constructed B-domain deleted expression plasmids
Primer name Primer sequence
FVIII-210a AAG GCA CAG AAA GAA GCA GG
FVIII-172s ATG CAA ATA GAG CTC TCC ACC
FVIII-681s ACT GTG CCT TAC CTA CTC AT
FVIII-1203s AGT AGA CAG CTG TCC AGA GG
FVIII-1770s AGT GAC TGT AGA AGA TGG GC
FVIII-2311s TCA GAC TTT CGG AAC AGA GG
FVIII-2821s ACA ACT GCA GCA ACA GAG TTG
FVIII-3297s GAA TAG TCC ATC AGT CTG GC
FVIII-3862s CCT CAG ATA CAT ACA GTG AC
FVIII-4381s AGA TCT CCA TTA CCC ATT GC
FVIII-4906s AAG CTA TTG GAT CCT CTT GC
FVIII-5406s TGT CCC TCA GTT CAA GAA AG
FVIII-5941s TCC CTG CAA TAT CCA GAT GG
FVIII-6501s GAA GTT CTC CAG CCT CTA CA
FVIII-7001s AGG AGT TCC TCA TCT CCA GC
pMT2-487s TCC ACT CGC TCC AGG GTG
26
pMT2-962s GAG GTG TGG CAG GCT TGA GAT CTG
pMT2-1131a CCG TCA AGT TTG GCG CGA AAT C
pMT2-1564a CTG GTT GAT TCA TGG CTT C
pMT2-1480s GAA CAA CCG GAA TTG GCA AG
pMT2-2369s GCT CCA TGG TCG GGA CGC TCT G
pMT2-5109s CGA CGG CCA GTG CCA AGC
Table 2: Primers used in verifying the constructed B-domain deleted expression plasmids.
2.1.3.3 Primers used for construction and verifying the plasmid, bacmid and viral
constructs of Bac-AAV2-Ad5, Bac-AAV2-Rep and Bac-EGFP
Primer name Primer sequence
AAV2-321s ATG CCG GGG TTT TAC GAG
AAV2-1382s CGG GTG CGT AAA CTG GAC
AAV2-289MLs GGT CTC AAC ACG CGT TTG AAG CGG GAG GTT TGA ACG
AAV2-2310NHa GGA TAT CAA GCT AGC CTC TGC GGG CTT TGG TGG TGG
Ad5-4231a CTC TGC AGT GGT GCT ACC
Ad5-35823a GGC GGA GTA ACT TGT ATG TG
Ad5-35832Bga CGG CTG ACA GAT CTG TTT TAG GGC GGA GTA ACT TGT
Ad5-34943s TGG GCG GCG ATA TAA AAT GC
Ad5-4000Bgs CGT TGA CTA GAT CTG AAG GCT TCC TCC CCT CCC AAT GC
CMV-1Ecos CGT CGC GAA TTC TTA GTT ATT AAT AGT AAT CAA TTA C
GFP-1329Ha CTT GTG AAG CTT TTA CTT GTA CAG CTC GTC CAT GCC
MMTV-591Bsps GAC GCG CTG TCC GGA GTC CCT AGA AGT AAA AAA GGG
MMTV-1347Bama GTA TCA TAT GGA TCC CCG ACC TGA GGG TGA CCG GGA
BGH-2532NMBs GCG CGG ATC CAC GCG TCG TAT GCT AGC TAG CCT GTG CCT
TCT AGT
BGH-2916EcoRa GCA GCG CCT GAA TTC CAA GGG ACA TCT TCC CAT TC
M13F GTTTTCCCAGTCACGAC
M13R CAGGAAACAGCTATGAC
Table 3: Primers used in the construction and verification of plasmid and bacmid baculovirus
recombinant vectors.

38
2.1.3.3 Primers used for construction and verifying the plasmid, bacmid and viral
constructs of Bac-AAV2-Ad5, Bac-AAV2-Rep and Bac-EGFP
Table 3: Primers used in the construction and verification of plasmid and bacmid baculovirus recombinant
vectors.
2.1.4 Cell lines and culture media
Table 4: Cell lines and culture media * All media contain Glutamax and were obtained from Invitrogen.
26
pMT2-962s GAG GTG TGG CAG GCT TGA GAT CTG
pMT2-1131a CCG TCA AGT TTG GCG CGA AAT C
pMT2-1564a CTG GTT GAT TCA TGG CTT C
pMT2-1480s GAA CAA CCG GAA TTG GCA AG
pMT2-2369s GCT CCA TGG TCG GGA CGC TCT G
pMT2-5109s CGA CGG CCA GTG CCA AGC
Table 2: Primers used in verifying the constructed B-domain deleted expression plasmids.
2.1.3.3 Primers used for construction and verifying the plasmid, bacmid and viral
constructs of Bac-AAV2-Ad5, Bac-AAV2-Rep and Bac-EGFP
Primer name Primer sequence
AAV2-321s ATG CCG GGG TTT TAC GAG
AAV2-1382s CGG GTG CGT AAA CTG GAC
AAV2-289MLs GGT CTC AAC ACG CGT TTG AAG CGG GAG GTT TGA ACG
AAV2-2310NHa GGA TAT CAA GCT AGC CTC TGC GGG CTT TGG TGG TGG
Ad5-4231a CTC TGC AGT GGT GCT ACC
Ad5-35823a GGC GGA GTA ACT TGT ATG TG
Ad5-35832Bga CGG CTG ACA GAT CTG TTT TAG GGC GGA GTA ACT TGT
Ad5-34943s TGG GCG GCG ATA TAA AAT GC
Ad5-4000Bgs CGT TGA CTA GAT CTG AAG GCT TCC TCC CCT CCC AAT GC
CMV-1Ecos CGT CGC GAA TTC TTA GTT ATT AAT AGT AAT CAA TTA C
GFP-1329Ha CTT GTG AAG CTT TTA CTT GTA CAG CTC GTC CAT GCC
MMTV-591Bsps GAC GCG CTG TCC GGA GTC CCT AGA AGT AAA AAA GGG
MMTV-1347Bama GTA TCA TAT GGA TCC CCG ACC TGA GGG TGA CCG GGA
BGH-2532NMBs GCG CGG ATC CAC GCG TCG TAT GCT AGC TAG CCT GTG CCT
TCT AGT
BGH-2916EcoRa GCA GCG CCT GAA TTC CAA GGG ACA TCT TCC CAT TC
M13F GTTTTCCCAGTCACGAC
M13R CAGGAAACAGCTATGAC
Table 3: Primers used in the construction and verification of plasmid and bacmid baculovirus
recombinant vectors.
27
2.1.4 Cell lines and culture media
Cells Culture Medium* Source of cells
HEK 293T DMEM high glucose AG Prof. W Poller (Freie Universität, Berlin)
COS-7 DMEM high glucose DSMZ (Braunschweig)
CHO-DHFR[-] IMDM + HT supplement DSMZ (Braunschweig)
Sf9 Grace's supplemented ATTC (Manassas, VA, USA)
Table 4: Cell lines and culture media
* All media contain Glutamax and were obtained from Invitrogen.
2.1.5 Plasmids and Vectors
Name Source
pMT2-FVIII Dr Rainer Schwaab (Srour et al., 2008)
pFastBac-1 Invitrogen (Leek, Niederland)
pShuttle-CMV Stratagene (Heidelberg)
pAdEasy-1 Stratagene (Heidelberg)
pTRUF5 Prof. Kleinschmidt (DKFZ, Heidelberg)
Mini-Ad5 Dr Stefan Kochanek (Uniklinik Ulm)
pDG Prof. Kleinschmidt (DKFZ, Heidelberg)
pTRE-Luc-Ad5 BD Clontech (Palo Alto, USA)
pEGFP-C1 BD Clontech (Palo Alto, USA)
Table 5: Plasmids and vectors.

39
2.1.5 Plasmids and Vectors
Table 5: Plasmids and vectors.
2.2 Molecular biology methods
2.2.1 Isolation of plasmid DNA, bacmid DNA and extra chromosomal DNA
Plasmid DNA was isolated from E.coli cultures (DH5α strain; Invitrogen and BJ5183;
Stratagene) grown in LB broth at 37°C by shaking at 225 rpm for 16 hours. Ampicillin
(50µg/ml) was used as a selection agent. Mini- and Maxi-plasmid preparations were
performed depending on further use of the plasmid. For plasmid analysis by PCR, restriction
mapping or DNA sequencing the QIAprep Spin Miniprep kit (Qiagen) was used. If plasmid
was isolated for use in cell culture transfection experiments, the QIAGEN Plasmid Maxi kit
(Qiagen) was used. Plasmid isolation was performed according to the instructions of the kit
supplier.
Bacmid DNA was isolated from E.coli cultures (DH10Bac strain; Invitrogen) grown in LB
broth at 37°C by shaking at 225 rpm for 16 hours. Kanamycin (50 µg/ml), gentamicin (7
µg/ml) and tetracycline (10 µg/ml) were used as selection agents. Bacmid isolation was
performed according to the Bac-to-Bac Baculovirus Expression System manual (Invitrogen).
Briefly, 1.5 ml bacterial culture was centrifuged at 14.000 x g for 1 min. The cell pellet was
resuspended in 300 µl of Solution I, gently mixed and a 300 µl Solution II was then added,
gently mixed and incubated at RT for 5 min. Slowly and while mixing gently 0.3 ml of 3 M
27
2.1.4 Cell lines and culture media
Cells Culture Medium* Source of cells
HEK 293T DMEM high glucose AG Prof. W Poller (Freie Universität, Berlin)
COS-7 DMEM high glucose DSMZ (Braunschweig)
CHO-DHFR[-] IMDM + HT supplement DSMZ (Braunschweig)
Sf9 Grace's supplemented ATTC (Manassas, VA, USA)
Table 4: Cell lines and culture media
* All media contain Glutamax and were obtained from Invitrogen.
2.1.5 Plasmids and Vectors
Name Source
pMT2-FVIII Dr Rainer Schwaab (Srour et al., 2008)
pFastBac-1 Invitrogen (Leek, Niederland)
pShuttle-CMV Stratagene (Heidelberg)
pAdEasy-1 Stratagene (Heidelberg)
pTRUF5 Prof. Kleinschmidt (DKFZ, Heidelberg)
Mini-Ad5 Dr Stefan Kochanek (Uniklinik Ulm)
pDG Prof. Kleinschmidt (DKFZ, Heidelberg)
pTRE-Luc-Ad5 BD Clontech (Palo Alto, USA)
pEGFP-C1 BD Clontech (Palo Alto, USA)
Table 5: Plasmids and vectors.

40
K+-acetate (pH 5.5) was added and the mixture was cooled on ice for 10 min. After 10 min
centrifugation at 14.000 x g, the supernatant was transferred to a new microcentrifuge tube
containing 0.8 ml isopropanol, gently inverted several times and cooled on ice for 10 min.
The sample was then centrifuged at 14.000 x g for 15 min. and the pellet was washed with 0.5
ml 70% ethanol, and centrifuged for 5 min at 14.000 x g. The DNA pellet was then air dried
at RT for 5 to 10 min and dissolved in 40 µl of TE buffer.
Extra chromosomal DNA was isolated from mammalian cells using a modified Hirt
procedure (Arad, 1998). Trypsinized cells (106-107) were suspended in 250 µl 50 mM Tris-
HCL (pH 7.5), 10 mM EDTA containing 100 µg/ml RNase A and lysed by the addition of
250 µl 1.2% SDS. The suspension was gently mixed and allowed to stand at RT for 5 min.
Cellular debris and chromosomal DNA were precipitated by the addition of 350 µl of 3 M
CsCl, 1 M K+- acetate and 0.67 M acetic acid. The suspension was then gently mixed and
incubated on ice for 15 min. After centrifugation at 14.000 x g, the supernatant was loaded
onto a QIAprep Spin Column (Qiagen). The column was washed with 750 µl 80 mM K+-
acetate, 10 mM Tris- HCL (pH 7.5), 40 µM EDTA and 60% ethanol. DNA was then eluted
with 50µl TE buffer or ddH2O.
To gain a very pure DNA, samples were extracted with phenol/chloroform for the removal of
proteins (e.g. enzymes) or to reduce salt concentration. DNA samples were suspended in 200
µl ddH2O and extracted once with one volume of phenol: chloroform: isoamylalcohol (ratio
25:24:1) followed by centrifugation at 3.000 rpm for 5 min. The upper layer containing the
DNA was precipitated by adding 0.1 volume of 3M Na+-acetate (pH 4.8) and two volumes of
prechilled ethanol, and allowed to stay at -80°C for at least 30 min. After centrifugation at
14.000 rpm for 15 min, the DNA pellet was washed once with 1 ml of 70 % prechilled
ethanol, vacuum dried and dissolved in TE buffer or ddH2O.
2.2.2 Isolation of total RNA from cells grown in monolayers
Total RNA was prepared from monolayer cell cultures using Trizol reagent according to the
supplier recommendations. Cells were washed with ice cold PBS then lysed by adding Trizol
reagent (1 ml per 10 cm2) and scraped with cell scraper. Cell lysate was then passed several
times through a pipette and vortexed thoroughly. Homogenized samples were incubated 5 min
at room temperature and centrifuged to remove cell debris. Supernatants were then mixed
41
with chloroform (0.2 ml per 1.0 ml Trizol), vortexed vigorously for 15 seconds and then
incubated at room temperature for 2 to 3 min. After centrifugation at 12,000 xg at 4 °C for 15
min, the upper aqueous phase containing RNA were moved carefully into a fresh tube. RNA
was then precipitated by mixing with isopropanol (0.5 ml per 1.0 ml Trizol), incubating at
room temperature for 10 min and centrifugation at 12000 xg at 4 °C for 10 min. RNA pellet
was then washed once with 75% ethanol and air or vacuum dried and dissolved in DEPC-
treated water.
2.2.3 Measurement of isolated DNA/RNA concentrations
DNA and RNA concentration was determined by measuring OD at 260 nm, where 1.0 OD
represents 50 µg DNA/ml and 40 µg RNA/ml (Sambrook and Russell, 2001).
2.2.4 Agarose gel electrophoresis
Nucleic acids were separated according to their size in agarose gel matrix by electrophoresis.
The concentration of agarose varied (0.6-2%) depending on the size of the DNA fragments
expected. Ethidium bromide (0.5 µg/ml) was included in the agarose gel for visualization of
the DNA fragments under UV (λ 302 nm) light (Sambrook et al., 1989). Samples were mixed
with gel loading buffer before loading in the gel. The gels were run at 100-150 V in 1x TEA
buffer. DNA molecular weight markers or ladders (marker X [Roche] and 1 kb ladders
[Fermentas and New England Biolabs]) were used to determine the size of DNA fragments.
2.2.5 PCR
An analytical and preparative polymerase chain reaction (PCR) was used. Anaytical PCR was
performed using Platinum Taq DNA polymerase (Invitrogen) and was used to analyze
plasmids, bacmids and baculovirus plaques. Preparative PCRs were performed using the
proof reading Pwo DNA polymerase (PeqLab) and generated fragments were used for
cloning. For DNA fragments longer than 2 kb, a preparative long distance (LD) PCR was
performed using a mixture of Pfu (a proof reading polymerase) and Taq DNA polymerase
(Roche). The fidelity of Pfu and Pwo is 12x and 10x more effective than Taq, respectively.

42
Typical PCR reactions are shown in following table:
Table 6: Constituents of PCR reactions using different amplification enzymes.
*All primers used are listed in section II.1.3.
Thermal cycling of PCR using Taq and Pwo were as follows: 5 min initial denaturation at
94°C followed by 35 cycles [each cycle consisted of denaturation at 94°C for 30 sec,
annealing at 50-60°C for 30 sec, and extension at 72°C for 1min/kb (with a time increment of
20 sec/cycle in the last 20 cycles for Pwo)]; and a final extension step at 72°C for 10 min.
The LD PCR was performed as follows: initial denaturation at 94°C for 2 min. followed by 30
cycles [each consisted of denaturation 94°C for 10 sec, annealing at 60-62°C for 30 sec with
time decrement of 0.2°C/cycle, and extension at 68°C for 1 min/kb (with a time increment of
20 sec/cycle for the last 20 cycles)] and a final extension at 68°C for 7 min. The annealing
temperature used depends on the melting temperature of the primers. PCRs were performed
using GeneAmp PCR system 9700, Perkin Elmer.
For purification, the PCR products were subjected to agarose gel electrophoresis as described
in section II.2.3 and the target DNA band was then excised and purified using the QIAquik
Gel extraction kit (Qiagen) according to the instructions of the kit supplier.
30
2.2.4 Agarose gel electrophoresis
Nucleic acids were separated according to their size in agarose gel matrix by electrophoresis.
The concentration of agarose varied (0.6-2%) depending on the size of the DNA fragments
expected. Ethidium bromide (0.5 !g/ml) was included in the agarose gel for visualization of
the DNA fragments under UV (" 302 nm) light (Sambrook et al., 1989). Samples were mixed
with gel loading buffer before loading in the gel. The gels were run at 100-150 V in 1x TEA
buffer. DNA molecular weight markers or ladders (marker X [Roche] and 1 kb ladders
[Fermentas and New England Biolabs]) were used to determine the size of DNA fragments.
2.2.5 PCR
An analytical and preparative polymerase chain reaction (PCR) was used. Anaytical PCR was
performed using Platinum Taq DNA polymerase (Invitrogen) and was used to analyze
plasmids, bacmids and baculovirus plaques. Preparative PCRs were performed using the
proof reading Pwo DNA polymerase (PeqLab) and generated fragments were used for
cloning. For DNA fragments longer than 2 kb, a preparative long distance (LD) PCR was
performed using a mixture of Pfu (a proof reading polymerase) and Taq DNA polymerase
(Roche). The fidelity of Pfu and Pwo is 12x and 10x more effective than Taq, respectively.
Typical PCR reactions are shown in following table:
Components Final concentrations
PCR type Taq Pwo LD (Pfu + Taq)
10x buffer, -Mg2+ 1x 1x 1x
MgCl2 50 mM 1.5 mM -- 2.25 mM
MgSO4 25mM -- 4 mM --
dNTPs 10 mM 200 !M 400 !M 500 !M
Sense primer* 100 !M 1 !M 1 !M 0.33 !M
Antisense primer* 100 !M 1 !M 1 !M 0.33 !M
Polymerase 1 U 1 U 2.5 U
Template 50-200 ng 50-200 ng 10-30 ng
ddH2O Up to 25 !l Up to 50 !l Up to 50 !l
Table 6: Constituents of PCR reactions using different amplification enzymes.
*All primers used are listed in section II.1.3.
43
2.2.6 DNA sequencing
DNA sequencing was performed to analyze plasmids, bacmids, baculoviruses and to verify
DNA fragments before and after cloning. A cycle sequencing reaction was performed by
mixing DNA template (100-200 ng PCR product or 200-500 ng plasmid DNA) with 20 pmol
of sense or antisense primer, 2 µl of BigDye terminator (contains fluorescent labeled ddNTPs,
dNTPs, AmpliTaq DNA polymerase FS and Taq buffer) from Applied Biosystems and
ddH2O to a total volume of 10 µl. The thermal cycling was performed using GeneAmp PCR
system 9700 (Perkin Elmer) as follows: initial denaturation at 96°C for 2 min followed by 25
cycles (each consist of 10 sec denaturation at 96°C, 5 sec annealing at 50-55°C and 4 min
extension at 60°C).
Cycle sequencing products were purified by mixing them with 90 µl ddH2O, 250 µl ethanol
and 10 µl of 3 M Na+-acetate (pH 4.6), followed by precipitation at 14.000 rpm for 15 min.
The pellet was then washed once with 70% ethanol, vacuum dried, resuspended in 20 µl
Template Suppression Reagent (TSR; Applied Biosystems), denatured at 90°C for 2 min,
chilled on ice and subjected to sequencing using the ABI Prism 310 Genetic Analyzer (Perkin
Elmer).
2.2.7 DNA restriction and ligation
DNA fragments, intended for cloning, were generated by PCR (section II.2.4) and included
restriction site linkers that were created and inserted into the 5'-end of the respective primers.
The DNA fragment (insert) and the plasmid (to be cloned in it) were restricted with restriction
enzymes (RE). The restriction reaction which included 0.2-1.0 µg of DNA, 5-10 units of RE
and 1x RE buffer was incubated at 37°C for 1-2 hours. RE and their buffers were obtained
from New England Biolabs. The RE reaction was scaled up according to the amount of DNA
needed. The restricted DNA fragments were then purified by phenol/chloroform or agarose
gel electrophoresis purification. Restricted fragments were blunt ended when needed with
Klenow fragment (Roche). Before ligation, restricted DNA fragments with blunt ends or
complementary cohesive ends were dephosphorylated by shrimp alkaline phosphatase (SAP)
to prevent self-ligation. Dephosphorylation was performed using 0.5 unit of SAP (New
England Biolabs) per 1 µg DNA at 37°C for one hour. Fifty to 100 ng of each restricted insert
and plasmid (insert to plasmid ratio is ≥ 3:1) were ligated using T4 DNA ligase (Roche) at 15-
25°C for 15 min.

44
2.2.8 Transformation and electroporation of E.coli cells
Competent E.coli cells (DH5α strain; Invitrogen and XL10-Gold strain; Stratagene) were
transformed with 20-50 ng of ligation products using heat-shock. These bacterial cells were
used for routine cloning during construction or propagation of plasmids. For the construction
of large plasmids by homologous recombination (He et al., 1998), the electroporation
competent RecA+ E.coli strain (BJ5183 strain; Stratagene) was used. Briefly, 1 µg of
linearized and dephosphorylated transfer shuttle plasmid and a 100 ng of supercoiled acceptor
plasmid (plasmid containing the Ad5 genome) were mixed with competent BJ5183 cells on
ice and then subjected to electroporation using the Cell-Electroporator E.coli system (Gibco-
Invitrogen). The electroporation parameters were set at 400 Volt, 330 µF, low-charge, low Ω
and voltage booster at 4 kΩ.
Transformed or electroporated cells were grown for one hour in LB broth at 37°C while
shaking at 225rpm. Then a 100-250 µl of bacterial culture were plated on LB-agar containing
ampicillin or gentamicin depending on the type of the antibiotic resistance gene in the
plasmid used. LB-agar plates were incubated for 14-16 hours. Clones were picked and
cultured in LB
broth. After propagation of bacteria, plasmids were isolated by mini-preparation. Because the
BJ5183 strain is unstable and its plasmid yield is very low, selected clones from this strain
were transformed in XL10-Gold cells (suited for propagation of large plasmids) for further
analysis and propagation of the plasmid.
2.2.9 Construction of factor VIII expression plasmids with various truncated B- domain
regions
The pMT2-FVIII plasmid (Srour et al., 2008) containing the full-length factor VIII cDNA (nt
# 1111 to 8386) was used as starting material (figure 6). First, the pMT2-FVIII plasmid was
cut with ApaI (cuts at 4411 and 7302) and SpeI (cuts at 1695) and the large fragment (7548
bp) representing the plasmid backbone and the rest of FVIII cDNA was gel extracted (Fig. 7,
step 1). Then a Pwo-PCR fragment was created by two round PCR using the pMT2-FVIII as a
template, first using the primer pair pMTF8-6085Ns / pMTF8-7310Aa that includes an NruI
restriction site at the 5'-end and second, using the primers pMT2F8-6068SNS / pMTF8-
7310Aa which adds an SpeI restriction site 5' to the NruI site (Fig. 7, step 2). The PCR

45
product was then cut with SpeI and ApaI, gel extracted and cloned into plasmid pMT2-FVIII
which was cut with SpeI /ApaI (large fragment) to generate pMT2-F8-SNA plasmid (8808
bp) (Fig. 7, step 3). Cloning was verified by DNA sequencing and digestion with SalI (gives
two fragments one represents FVIII cDNA (~3 Kb in pMT2-F8-SNA) and one represents the
pMT2 plasmid (~5.8 Kb)).
Figure 6: Schematic representation of pMT2-FVIII expression plasmid containing the full length FVIII cDNA
(7056 bp plus 214 bp of 3’UTR; GeneBank accession # M14113; nts # 172-7227 + 3’UTR nts # 7228-7440).
The pMT2-F8-SNA plasmid was then cut with SpeI and NruI and the large fragment (~8790
bp) was gel extracted (Fig. 7, step 4). Fragments (AàE) containing various lengths of the B-
domain region were then amplified (Fig. 7, step 5) using the pMT2-FVIII plasmid as a
template by Pwo-PCR or LD-PCR according to table 6 where the antisense primers hold an
NruI restriction site. The amplified fragments were then cut with SpeI and NruI (Fig. 7, step
6), gel extracted and cloned separately into plasmid pMT2-F8-SNA which has been cut with
SpeI / NruI to generate the plasmids pMT2-F8-BDD (aa 743/1634), pMT2-F8-101 (aa
844/1634), pMT2-F8-202 (aa 945/1634), pMT2-F8-292 (aa 1043/1634) and pMT2-F8-394
(aa 1137/1634) (see table 7). The plasmids were then verified by DNA sequencing and Sal I
digestion.
33
broth. After propagation of bacteria, plasmids were isolated by mini-preparation. Because the
BJ5183 strain is unstable and its plasmid yield is very low, selected clones from this strain
were transformed in XL10-Gold cells (suited for propagation of large plasmids) for further
analysis and propagation of the plasmid.
2.2.9 Construction of factor VIII expression plasmids with various truncated B-
domain regions
The pMT2-FVIII plasmid (Srour et al., 2008) containing the full-length factor VIII cDNA (nt
# 1111 to 8386) was used as starting material (figure 6). First, the pMT2-FVIII plasmid was
cut with ApaI (cuts at 4411 and 7302) and SpeI (cuts at 1695) and the large fragment (7548
bp) representing the plasmid backbone and the rest of FVIII cDNA was gel extracted (Fig. 7,
step 1). Then a Pwo-PCR fragment was created by two round PCR using the pMT2-FVIII as a
template, first using the primer pair pMTF8-6085Ns / pMTF8-7310Aa that includes an NruI
restriction site at the 5'-end and second, using the primers pMT2F8-6068SNS / pMTF8-
7310Aa which adds an SpeI restriction site 5' to the NruI site (Fig. 7, step 2). The PCR
product was then cut with SpeI and ApaI, gel extracted and cloned into plasmid pMT2-FVIII
which was cut with SpeI /ApaI (large fragment) to generate pMT2-F8-SNA plasmid (8808
bp) (Fig. 7, step 3). Cloning was verified by DNA sequencing and digestion with SalI (gives
two fragments one represents FVIII cDNA (~3 Kb in pMT2-F8-SNA) and one represents the
pMT2 plasmid (~5.8 Kb)).
Figure 6: Schematic representation of pMT2-FVIII expression plasmid containing the full length FVIII cDNA
(7056 bp plus 214 bp of 3’UTR; GeneBank accession # M14113; nts # 172-7227 + 3’UTR nts # 7228-7440).

46
Figure 7: Schematic representation of the construction of various expression plasmids containing different
lengths of the B domain. Steps 1,2 and 5 were performed using the pMT2-FVIII vector containing the full length
FVIII cDNA (nts # 1111 to 8386). The B domain spans nts # 3388 to 6112 (aa 740 to 1648).
Table 7: Different amplified fragments and the corresponding end plasmids.
34
The pMT2-F8-SNA plasmid was then cut with SpeI and NruI and the large fragment (~8790
bp) was gel extracted (Fig. 7, step 4). Fragments (A!E) containing various lengths of the B-
domain region were then amplified (Fig. 7, step 5) using the pMT2-FVIII plasmid as a
template by Pwo-PCR or LD-PCR according to table 6 where the antisense primers hold an
NruI restriction site. The amplified fragments were then cut with SpeI and NruI (Fig. 7, step
6), gel extracted and cloned separately into plasmid pMT2-F8-SNA which has been cut with
SpeI / NruI to generate the plasmids pMT2-F8-BDD (aa 743/1634), pMT2-F8-101 (aa
844/1634), pMT2-F8-202 (aa 945/1634), pMT2-F8-292 (aa 1043/1634) and pMT2-F8-394
(aa 1137/1634) (see table 7). The plasmids were then verified by DNA sequencing and Sal I
digestion.
Figure 7: Schematic representation of the construction of various expression plasmids containing different
lengths of the B domain. Steps 1,2 and 5 were performed using the pMT2-FVIII vector containing the full length
FVIII cDNA (nts # 1111 to 8386). The B domain spans nts # 3388 to 6112 (aa 740 to 1648).
35
Product Primer pair Product size End plasmid
Size
End plasmid
name
A pMTF8-1689s /
pMTF8-3369Na ~1694 bp
10485 bp
(BDD) pMT2-F8-BDD
B pMTF8-1689s /
pMTF8-3671Na ~2000 bp
10788 bp
(101 aa/B) pMT2-F8-101
C pMTF8-1689s /
pMTF8-3973Na ~2303 bp
11091 bp
(202 aa/B) pMT2-F8-202
D pMTF8-1689s /
pMTF8-4243Na ~2573 bp
11361 bp
(292 aa/B) pMT2-F8-292
E pMTF8-1689s /
pMTF8-4551Na ~2879 bp
11667 bp
(394 aa/B) pMT2-F8-394
Table 7: Different amplified fragments and the corresponding end plasmids.
2.2.10 Construction of recombinant bacmid DNA containing the adenovirus
helper genome
The plasmid pFastBac1 (Invitrogen) (Fig. 8 A) was used as a basic plasmid for the following
cloning steps. The DNA fragments Ad5-L and Ad5-R (2707 bp; L corresponds to Ad5 nts
4000 to 5781 plus Pme I & Eco RI restriction sites, while R corresponds to Ad5 nts 43935 to
35832; GeneBank# NC_001406) were amplified by LD-PCR from pShuttle-CMV
(Stratagene) using the primer pairs Ad5-4000Bgs / Ad5-3832Bga, cut with Bg1II, gel
extracted and cloned between the AAV2 ITRs of plasmid pTRUF5 (obtained from Prof.
Kleinschmidt, Heidelberg University; the plasmid contains the AAV2 5'- and 3'-ITRs
corresponding to nts 1 to 145 & 4530 to 4675, respectively on AAV2 genome; GeneBank #
AF043303) which was cut before with Bg1II and gel extracted to generate pTRUF5-Ad5LR.
The fragment AAV2-5'ITR/Ad5LR/AAV2-3'ITR was cut from pTRUF5-Ad5LR with BspHI,
blunt ended and cloned into pFastBac1, cut with NotI and blunt ended to generate the shuttle
plasmid pBac-AAV2-Ad5LR (Fig. 8 B).
The Ad5 genome was then cloned from pAdEasy-1 (Stratagene; Fig. 8 C) into the shuttle
plasmid pBac-AAV2-Ad5LR (Fig. 8 B) by homologous recombination in bacterial cells
(section 2.2.7). For this, the shuttle plasmid was linearized with PmeI (cuts between the two
Ad5 homologous sequences), purified by phenol/chloroform purification and

47
2.2.10 Construction of recombinant bacmid DNA containing the adenovirus helper
genome
The plasmid pFastBac1 (Invitrogen) (Fig. 8 A) was used as a basic plasmid for the following
cloning steps. The DNA fragments Ad5-L and Ad5-R (2707 bp; L corresponds to Ad5 nts
4000 to 5781 plus Pme I & Eco RI restriction sites, while R corresponds to Ad5 nts 43935 to
35832; GeneBank# NC_001406) were amplified by LD-PCR from pShuttle-CMV
(Stratagene) using the primer pairs Ad5-4000Bgs / Ad5-3832Bga, cut with Bg1II, gel
extracted and cloned between the AAV2 ITRs of plasmid pTRUF5 (obtained from Prof.
Kleinschmidt, Heidelberg University; the plasmid contains the AAV2 5'- and 3'-ITRs
corresponding to nts 1 to 145 & 4530 to 4675, respectively on AAV2 genome; GeneBank #
AF043303) which was cut before with Bg1II and gel extracted to generate pTRUF5-Ad5LR.
The fragment AAV2-5'ITR/Ad5LR/AAV2-3'ITR was cut from pTRUF5-Ad5LR with BspHI,
blunt ended and cloned into pFastBac1, cut with NotI and blunt ended to generate the shuttle
plasmid pBac-AAV2-Ad5LR (Fig. 8 B).
The Ad5 genome was then cloned from pAdEasy-1 (Stratagene; Fig. 8 C) into the shuttle
plasmid pBac-AAV2-Ad5LR (Fig. 8 B) by homologous recombination in bacterial cells
(section 2.2.7). For this, the shuttle plasmid was linearized with PmeI (cuts between the two
Ad5 homologous sequences), purified by phenol/chloroform purification and
dephosphorylated with SAP. One µg linearized plasmid was mixed with 100 ng pAdEasy-1
and added to 40 µl of BJ8153 electro competent bacterial cells. The DNA-bacteria mixture
was then transferred into a 0.15 cm gap cuvette and electroporated to generate the plasmid
pBac-AAV2-Ad5 (35,824 bp) containing the Ad5 genome (Fig. 8 D). The pBac-AAV2-Ad5
selected clones were verified by DNA sequencing using the primers Ad5-4231a (covers the
5'-ITR region and confirms the presence of the 5’ end of the Ad5 genome) and Ad5-35687s
(covers the 3'-ITR region and confirms the presence of the 3’ end of the Ad5 genome), by
Taq-PCR using the primers Ad5-4000xs / Ad5-7000a (confirms the presence of part of the
Ad5 genome which reflect an intact construct) and by digestion with SmaI (gives the
following fragments: 6447, 11, 195 [5'-ITR], 2463, 6480, 1398, 4456, 1455, 3540, 3386, 230,
652, 2278, 2262, 550 [3'-ITR] and 11 bp).

48
Figure 8: Construction of the pBac-AAV2-Ad5.
To support the AAV-ITRs replication in trans, a Rep-protein is needed. For this, The MMTV-
LTR promoter (757 bp; nts 591 to 1347 on MMTV genome; GeneBank#V01175) was
amplified from pDG plasmid using primers MMTV-591Bsps / MMTV-1347Bama and cloned
at BspE1 / BamHI sites in pFastBac1 plasmid to generate pBac-MMTV (~5387 bp; digestion
of pFastBac1 with BspE1 / BamHI removes the insect PH promoter). The bGH polyA signal
(258 bp; most of it matches nt# 75 to 299 according to GeneBank # AF117346) plus 126 bp
from the 5' end of ß-globin polyA were amplified from pTRE2-Luc-Ad5 (Clontech) using
primers BGH-2532NMBs / BGH-2916EcoRa and cloned into BamHI / EcoRI sites of
pFastBac1-MMTV to generate pBac-MMTV-bGH (~5780). pBac-AAV2-Rep (~7802 bp)
was then constructed by amplifying the AAV2-Rep genes (2022 bp; nt 289 to 2310;
GeneBank# AF043303) from pDG plasmid using primers AAV2-289MLs / AAV2-2310NHa
and cloning them at MluI / NheI sites in pBac-MMTV-bGH (Fig. 9).
36
dephosphorylated with SAP. One !g linearized plasmid was mixed with 100 ng pAdEasy-1
and added to 40 !l of BJ8153 electro competent bacterial cells. The DNA-bacteria mixture
was then transferred into a 0.15 cm gap cuvette and electroporated to generate the plasmid
pBac-AAV2-Ad5 (35,824 bp) containing the Ad5 genome (Fig. 8 D). The pBac-AAV2-Ad5
selected clones were verified by DNA sequencing using the primers Ad5-4231a (covers the
5'-ITR region and confirms the presence of the 5’ end of the Ad5 genome) and Ad5-35687s
(covers the 3'-ITR region and confirms the presence of the 3’ end of the Ad5 genome), by
Taq-PCR using the primers Ad5-4000xs / Ad5-7000a (confirms the presence of part of the
Ad5 genome which reflect an intact construct) and by digestion with SmaI (gives the
following fragments: 6447, 11, 195 [5'-ITR], 2463, 6480, 1398, 4456, 1455, 3540, 3386, 230,
652, 2278, 2262, 550 [3'-ITR] and 11 bp).
Figure 8: Construction of the pBac-AAV2-Ad5.
To support the AAV-ITRs replication in trans, a Rep-protein is needed. For this, The MMTV-
LTR promoter (757 bp; nts 591 to 1347 on MMTV genome; GeneBank#V01175) was
amplified from pDG plasmid using primers MMTV-591Bsps / MMTV-1347Bama and cloned
at BspE1 / BamHI sites in pFastBac1 plasmid to generate pBac-MMTV (~5387 bp; digestion

49
Figure 9: Schematic representation of pBac-AAV2-Rep and pBac-EGFP.
Expression of the AAV2-Rep gene was tested in both Sf9 and 293T cells. SF9 cells were
transfected with plasmid pBac-AAV2-Rep using Cellfectin reagent, incubated for 48 hours
and then used for total RNA preparation using Trizol reagent (see section 2.2.2). 293T cells
were transfected with pBac-AAV2-Rep and pDG (contains the Rep gene expression cassette
that were used for pBac-AAV2-Rep cloning) plasmids using Lipofectamin 2000, incubated
for 48 hours and then used for total RNA preparation using Trizol reagent. Total RNA was
subject to RT PCR using Superscript III reverse transcriptase followed by Taq-PCR using the
primer pairs AAV2-2310a / AAV2-1380s (which give a product of 1 kb) and AAV2-2310a /
AAV2-321s (which give a PCR product of 2 kb).
As a positive control for transfecting insect cells, the plasmid pBac-EGFP was constructed
(Fig. 9). The CMV-EGFP was amplified from pEGFP-C1 using the primer pair CMV-
1Ecos/GFP-1329Ha. The resulting amplification product was digested with EcoRI/HindIII
and cloned in EcoRI/HindIII digested pFastBac1.
Recombinant bacmids were constructed by site-specific transposition in DH10Bac bacterial
cells [contains the baculovirus shuttle vector (bacmid) bMON14272 (136 kb); Invitrogen]
(Fig. 10). Twenty five µl of DH10Bac were mixed with 0.25 ng of shuttle plasmid pBac-
AAV2-Ad5 in a 15 ml round-bottom polypropylene tube and incubated on ice for 30 min.
Cells were heat shocked at 42°C for 45 seconds, incubated on ice for 2 min and a 250 µl SOC
medium was then added to them. Transformed cells were incubated 4 hours at 37°C while
shaking at 225 rpm and then diluted 1:10 and 1:100 with SOC medium. One hundred µl of
each dilution were plated on LB agar plates containing 50 µg /ml kanamycin, 7 µg/ml
gentamicin, 10 µg/ml tetracycline, 100 µg/ml Bluo-gal and 40 µg/ml IPTG. Plates were
incubated at 37°C for 48 hours. Ten white colonies were picked, restreaked on new LB agar
containing the above mentioned selection agents and incubated for 24 hours. One white
colony from each plate were picked and cultured in 2.5 ml LB broth containing the three
antibiotics and incubated at 37°C overnight.
37
of pFastBac1 with BspE1 / BamHI removes the insect PH promoter). The bGH polyA signal
(258 bp; most of it matches nt# 75 to 299 according to GeneBank # AF117346) plus 126 bp
from the 5' end of ß-globin polyA were amplified from pTRE2-Luc-Ad5 (Clontech) using
primers BGH-2532NMBs / BGH-2916EcoRa and cloned into BamHI / EcoRI sites of
pFastBac1-MMTV to generate pBac-MMTV-bGH (~5780). pBac-AAV2-Rep (~7802 bp)
was then constructed by amplifying the AAV2-Rep genes (2022 bp; nt 289 to 2310;
GeneBank# AF043303) from pDG plasmid using primers AAV2-289MLs / AAV2-2310NHa
and cloning them at MluI / NheI sites in pBac-MMTV-bGH (Fig. 9).
Figure 9: Schematic representation of pBac-AAV2-Rep and pBac-EGFP.
Expression of the AAV2-Rep gene was tested in both Sf9 and 293T cells. SF9 cells were
transfected with plasmid pBac-AAV2-Rep using Cellfectin reagent, incubated for 48 hours
and then used for total RNA preparation using Trizol reagent (see section 2.2.2). 293T cells
were transfected with pBac-AAV2-Rep and pDG (contains the Rep gene expression cassette
that were used for pBac-AAV2-Rep cloning) plasmids using Lipofectamin 2000, incubated
for 48 hours and then used for total RNA preparation using Trizol reagent. Total RNA was
subject to RT PCR using Superscript III reverse transcriptase followed by Taq-PCR using the
primer pairs AAV2-2310a / AAV2-1380s (which give a product of 1 kb) and AAV2-2310a /
AAV2-321s (which give a PCR product of 2 kb).
As a positive control for transfecting insect cells, the plasmid pBac-EGFP was constructed
(Fig. 9). The CMV-EGFP was amplified from pEGFP-C1 using the primer pair CMV-
1Ecos/GFP-1329Ha. The resulting amplification product was digested with EcoRI/HindIII
and cloned in EcoRI/HindIII digested pFastBac1.
Recombinant bacmids were constructed by site-specific transposition in DH10Bac bacterial
cells [contains the baculovirus shuttle vector (bacmid) bMON14272 (136 kb); Invitrogen]

50
Figure 10: Generation of recombinant bacmid DNA “bBac-AAV2-Ad5”.
Recombinant bacmid DNA (bBac-AAV2-Ad5; bBac-EGFP; bBac-AAV2-Rep) was isolated
according to section 2.2.1. Recombinant bacmid (bBac-AAV2-Ad5) was analyzed by Taq-
PCR using M13 forward / M13 reverse primers (confirms the presence of the plasmid insert:
an empty bacmid gives a ~270 bp PCR product, a transposed bacmid gives no product as Taq
polymerase cannot amplify such large insert >35 kb), M13 forward /Ad5-4231a primers
(covers the 5'-ITR region, confirms the presence of the 5’end of the Ad5 genome and gives
~3.1 kb PCR product), M13 reverse / Ad5-35687s primers (covers the 3'-ITR region,
confirms the presence of the 3’end of the Ad5 genome and gives ~1.55 kb PCR product) and
Ad5- 4000xs / Ad5-7000a primers (confirms the presence of Ad5 genome and gives ~3.0 kb
PCR product). bBac-EGFP was characterized by Taq PCR using the M13 forward and M13
reverse primers. The presence of the EGFP gene resulted in a 3.6 kb fragment.
bBac-AAV2-Rep was analyzed by Taq-PCR using M13 forward / M13 reverse primer pair
(confirms the presence of the plasmid insert: an empty bacmid gives a ~270 bp PCR product,
a transposed bacmid gives a ~5.3 kb PCR product), M13 forward / MMTV-1347a primers
(covers the 5’ AAV2-Rep construct end and gives a ~2.3 kb PCR product) and AAV2-321s /
M13 reverse primers (covers the 3’ AAV2-Rep construct end and gives a ~2.8 kb PCR
product).
38
(Fig. 10). Twenty five !l of DH10Bac were mixed with 0.25 ng of shuttle plasmid pBac-
AAV2-Ad5 in a 15 ml round-bottom polypropylene tube and incubated on ice for 30 min.
Cells were heat shocked at 42°C for 45 seconds, incubated on ice for 2 min and a 250 !l SOC
medium was then added to them. Transformed cells were incubated 4 hours at 37°C while
shaking at 225 rpm and then diluted 1:10 and 1:100 with SOC medium. One hundred !l of
each dilution were plated on LB agar plates containing 50 !g /ml kanamycin, 7 !g/ml
gentamicin, 10 !g/ml tetracycline, 100 !g/ml Bluo-gal and 40 !g/ml IPTG. Plates were
incubated at 37°C for 48 hours. Ten white colonies were picked, restreaked on new LB agar
containing the above mentioned selection agents and incubated for 24 hours. One white
colony from each plate were picked and cultured in 2.5 ml LB broth containing the three
antibiotics and incubated at 37°C overnight.
Figure 10: Generation of recombinant bacmid DNA “bBac-AAV2-Ad5”.
Recombinant bacmid DNA (bBac-AAV2-Ad5; bBac-EGFP; bBac-AAV2-Rep) was isolated
according to section 2.2.1. Recombinant bacmid (bBac-AAV2-Ad5) was analyzed by Taq-
PCR using M13 forward / M13 reverse primers (confirms the presence of the plasmid insert:
an empty bacmid gives a ~270 bp PCR product, a transposed bacmid gives no product as Taq
polymerase cannot amplify such large insert >35 kb), M13 forward /Ad5-4231a primers
51
2.3 Cell culture
2.3.1 Cultivation and storage of cells
Cell lines (HEK 293T, COS-1 and CHO-DHFR[-]) were grown in their respective media
(section II.1.4) supplied with 10% fetal bovine serum (FBS), 100 U/ml of Penicillin-G and
100 µg/ml of Streptomycin, and 5% CO2 at 37°C (Freshney, 2000).
Cells were grown in different tissue culture dishes or plates (Nunc) of different sizes
depending on the type of the experiment. For cell expansion, cells were washed with
Dulbecco's-PBS, trypsinized with Trypsin-EDTA (Invitrogen) and seeded at the appropriate
ratio in new dishes. Stocks of cell lines were prepared in freezing medium (70% culture
medium, 20% FBS and 10% DMSO) and maintained in liquid nitrogen (Freshney, 2000).
2.3.2 Transient expression of B-domain deleted constructs in mammalian cell lines
2.3.2.1 Transfection
Transfection of expression plasmids in the three animal cell lines was performed on liposomal
basis using the transfection reagent Lipofectamine 2000 (Invitrogen) according to the
instructions of the supplier. Transient transfections were done in 6-well plates with cells
grown to ~90% confluence in an antibiotic free medium. First, 4 µg of each expression
plasmid was diluted in 250 µl Opti-MEM I (reduced serum medium; Invitrogen) while a 10 µl
Lipofectamine 2000 (1 mg/ml) was diluted in 250 µl Opti-MEM I, separately. After 5 min
incubation at RT, both mixtures were combined, mixed gently and incubated 20 min at RT.
500 µl of DNA-Lipofectamine 2000 complexes were then added to the respective well
containing cells and medium and mixed gently by rocking the plate back and forth. The plate
was then incubated at 37°C and 5% CO2 for 4 hours. Then the medium was replaced by the
respective normal medium. The efficiency of transfection was controlled by the transfection
of an eGFP expression plasmid pEGFP-C1.

52
2.3.2.2 Expression studies
Expression experiments were done in three mammalian cell lines: HEK 293, COS-7 and
CHO-DHFR[-]. One day before each expression experiment, 1 * 106 cells in 2 ml growth
medium were plated per well so that they reached ~90% confluency at the time of
transfection. The cell culture media used were without phenol red as it interferes with FVIII
activity measurement. Expression experiments were performed using the five plasmids
containing the B-domain deleted constructs along with pMT2-FVIII (contains the full length
factor VIII cDNA) and pMT2-FVIII-BDD (Bonn-BDD; codes for a truncated factor VIII
protein in which amino acid 852 is joined to amino acid 1524; Srour et al., 2008; Fig. 11). All
the expression experiments were performed using the same DNA and Lipofectamine 2000
quantities. Twenty-four hours after transfection, growth medium was replaced with a fresh
medium, collected 24 hours later (48 hours after transfection), and then again a fresh medium
was added and collected 24 hours later (72 hours after transfection). The two medium
collections were centrifuged at 700 x g at 4°C for 5 min, aliquoted and stored at -80°C.
Figure 11: Schematic representation of pMT2-FVIII-BDD (BONN-BDD) expression plasmid containing the
FVIII-B domain deleted (FVIII-BDD) cDNA, which is the same as FVIII full length except that most of the B-
domain is deleted from nts 2795 to 4804 (nucleotides order is according to Gene Bank # M14113).
Aliquots were used to measure factor VIII activity using the clotting and the chromogenic
assays (section 2.4.2). Factor VIII antigen (in culture medium) was quantified by ELISA
(section 2.4.3) for the cell line that showed the highest factor VIII activity. The specific factor
VIII activity was then calculated. In each expression experiment, the expression plasmids
were transfected in triplicates (3 wells for each expression plasmid) along with two negative
control wells (no DNA) and one positive control well (pEGFP-C1).
41
Figure 11: Schematic representation of pMT2-FVIII-BDD (BONN-BDD) expression plasmid containing the
FVIII-B domain deleted (FVIII-BDD) cDNA, which is the same as FVIII full length except that most of the B-
domain is deleted from nts 2795 to 4804 (nucleotides order is according to Gene Bank # M14113).
Aliquots were used to measure factor VIII activity using the clotting and the chromogenic
assays (section 2.4.2). Factor VIII antigen (in culture medium) was quantified by ELISA
(section 2.4.3) for the cell line that showed the highest factor VIII activity. The specific factor
VIII activity was then calculated. In each expression experiment, the expression plasmids
were transfected in triplicates (3 wells for each expression plasmid) along with two negative
control wells (no DNA) and one positive control well (pEGFP-C1).
2.3.3 Generation of stable cell lines expressing various factor VIII protein
variants in CHO-DHFR[-] cells
2.3.3.1 Transfection, selection and amplification of CHO-DHFR[-]
Transfection. 20 !g of ethanol precipitated linearized (cut with MluI) DNA of each
expression plasmid (pMT2-F8-BDD, pMT2-F8-202, pMT2-F8-394 and pMT2-FVIII) and 50
!l Lipofectamine 2000 was used to transfect CHO-DHFR[-] cells which were grown in
IMDM (containing hypoxanthine thymidin reagent; Invitrogen) to 90% confluence in 10 cm ø
dishes. DNA-Lipofectamine complexes were incubated with the cells for 4 hours. Growth
medium containing the complexes was then removed and 3 ml of 10% glycerin were added to
the cells for 2 min to facilitate the DNA uptake by cells (Sambrook and Russell, 2001). Cells
were then washed by PBS and 10 ml of fresh growth medium was added.
53
2.3.3 Generation of stable cell lines expressing various factor VIII protein variants in
CHO-DHFR[-] cells
2.3.3.1 Transfection, selection and amplification of CHO-DHFR[-]
Transfection. 20 µg of ethanol precipitated linearized (cut with MluI) DNA of each
expression plasmid (pMT2-F8-BDD, pMT2-F8-202, pMT2-F8-394 and pMT2-FVIII) and 50
µl Lipofectamine 2000 was used to transfect CHO-DHFR[-] cells which were grown in
IMDM (containing hypoxanthine thymidin reagent; Invitrogen) to 90% confluence in 10 cm ø
dishes. DNA-Lipofectamine complexes were incubated with the cells for 4 hours. Growth
medium containing the complexes was then removed and 3 ml of 10% glycerin were added to
the cells for 2 min to facilitate the DNA uptake by cells (Sambrook and Russell, 2001). Cells
were then washed by PBS and 10 ml of fresh growth medium was added.
Selection. After 48 hours, transfected cells were splitted into five 10 cm ø dishes at 1:15 ratio
using a 10 ml selection medium (IMDM containing dialyzed FBS [Sigma] and deficient in
hypoxanthine and thymidin). To each dish a different Methotrexate (MTX; a selection and
amplification agent; Sigma) quantity was added (20 nM, 50 nM, 100 nM, 200 nM and 400
nM). The selection medium did not contain nucleosides so that only cells that have the
expression plasmid (containing the DHFR gene) could grow. The selection medium and the
respective MTX quantity was changed every two days until a well-defined new colonies
appear (2-3 weeks). Colonies were then pooled and tested for productivity by assaying factor
VIII activity in culture medium. Productive dishes were passaged (splitted and let grow) 4
times and the productivity was assessed each time. Dishes that kept the productivity over
passaging were expanded to several dishes for storage, amplification and cloning.
Amplification. Productive dishes were amplified by splitting the cells in a higher MTX
concentration steps (5x, 10x, 20x and 50x for example). In each new MTX concentration step
the cells were maintained until confluency, passaged 4 times and then the productivity was
assessed. Cells that showed higher productivity were expanded for storage, cloning and a
further amplification step.

54
2.3.3.2 Limited dilution cloning and sub cloning
Productive pooled clones were cloned by serial dilution in 96 well plates (Corning protocol,
MA, USA) (Fig. 12). Cells were trypsinized and 2 * 104 cells/ml cell suspension was
prepared. In a 96 well plate, a 100 µl selective medium was added in all wells except well A1
(see diagram below), then 200 µl of the cell suspension was added to well A1. Using a single
channel pipettor, 100 µl were quickly transferred from A1 to B1 and mixed by gently
pipetting. Using the same tip, this 1:2 dilution was repeated down the entire column, ending
by discarding 100 µl from H1. Using an 8-channel micropipettor, 100 µl additional medium
was added to each well in column 1, mixed by gentle pipetting and then 100 µl was
transferred quickly from column 1 (A1 through H1) to column 2 (A2 through H2). Using the
same tips, these 1:2 dilutions were repeated across the entire plate, discarding 100 µl from
each of the wells of the last column (A12 through H12) so that all the wells ended up with
100 µl of cell suspension. The final volume in all wells was then brought to 200 µl by adding
100 µl medium to each well. Cells were allowed to settle down at 37°C for one hour and wells
were then checked for the presence of single cells using an inverted microscope. Wells
containing single cells were marked and followed until they had formed detectable clones
(approximately 2 weeks incubation at 37°C in a CO2 incubator). Single colonies were then
sub-cultured into a larger vessel (24-well plate) and the productivity (FVIII activity) was then
assessed upon confluency. Highly productive clones were then propagated into 6-well plates
followed by 10 cm ø dishes for storage, amplification and sub-cloning. Sub-cloning increases
the likelihood that the cells originated from a single cell and possibly gives higher productive
clones. It was performed using the cloning protocol.
Figure 12: Schematic representation of serial dilutions in 96-well plate.
43
containing single cells were marked and followed until they had formed detectable clones
(approximately 2 weeks incubation at 37°C in a CO2 incubator). Single colonies were then
sub-cultured into a larger vessel (24-well plate) and the productivity (FVIII activity) was then
assessed upon confluency. Highly productive clones were then propagated into 6-well plates
followed by 10 cm ø dishes for storage, amplification and sub-cloning. Sub-cloning increases
the likelihood that the cells originated from a single cell and possibly gives higher productive
clones. It was performed using the cloning protocol.
Figure 12: Schematic representation of serial dilutions in 96-well plate.
2.3.4 Generation of helper recombinant baculovirus in insect cells were performed
according to the Bac-to-Bac Baculovirus Expression System manual instructions (Invitrogen).
2.3.4.1 Transfection of Sf9 cells
Insect cells (Sf9 cell line, ATCC # CRL-1711) were grown in supplemented Grace's Insect
Cell Culture Medium (Invitrogen) at 27°C supplied with 10% Insect Cell Culture Tested FBS
(Sigma), 50 U/ml penicillin and 50 !g/ml streptomycin. Sf9 cells were seeded at 9*105 cells
per well in a 6-well plate and allowed to attach at 27°C for one hour prior to transfection. For
each transfection sample, 1 !g of purified bacmid DNA (section II.2.1) were diluted in 100 !l
of unsupplemented Grace's medium (Invitrogen), and a 6 !l well mixed Cellfectin reagent
(Invitrogen) were diluted in a 100 !l unsupplemented Grace's medium, separately. Both
mixtures were then combined, mixed gently and incubated at RT for 15 to 45 min. During this

55
2.3.4 Generation of helper recombinant baculovirus in insect cells: were performed
according to the Bac-to-Bac Baculovirus Expression System manual instructions (Invitrogen).
2.3.4.1 Transfection of Sf9 cells
Insect cells (Sf9 cell line, ATCC # CRL-1711) were grown in supplemented Grace's Insect
Cell Culture Medium (Invitrogen) at 27°C supplied with 10% Insect Cell Culture Tested FBS
(Sigma), 50 U/ml penicillin and 50 µg/ml streptomycin. Sf9 cells were seeded at 9*105 cells
per well in a 6-well plate and allowed to attach at 27°C for one hour prior to transfection. For
each transfection sample, 1 µg of purified bacmid DNA (section II.2.1) were diluted in 100 µl
of unsupplemented Grace's medium (Invitrogen), and a 6 µl well mixed Cellfectin reagent
(Invitrogen) were diluted in a 100 µl unsupplemented Grace's medium, separately. Both
mixtures were then combined, mixed gently and incubated at RT for 15 to 45 min. During this
incubation time, media was removed from cells and washed once with 2 ml unsupplemented
Grace's medium. To each DNA: lipid complex, 0.8 ml unsupplemented Grace's medium was
added, mixed gently and the complexes were added then to each well containing the cells.
After 5 hours incubation at 27°C, DNA: lipid complexes were removed and a 2 ml
supplemented Grace's medium was added to the cells (Fig. 13).
Figure 13: Production of recombinant Baculovirus particles “Bac-AAV2-Ad5”.
44
incubation time, media was removed from cells and washed once with 2 ml unsupplemented
Grace's medium. To each DNA: lipid complex, 0.8 ml unsupplemented Grace's medium was
added, mixed gently and the complexes were added then to each well containing the cells.
After 5 hours incubation at 27°C, DNA: lipid complexes were removed and a 2 ml
supplemented Grace's medium was added to the cells (Fig. 13).
Figure 13: Production of recombinant Baculovirus particles “Bac-AAV2-Ad5”.
Budded viruses should be released into the medium 72 hours after transfection. Virally-
infected insect cells typically show the following characteristics: Increased cell diameter and
size of cell nuclei (first 24 hours), cessation of cell growth, granular appearance as a sign of
viral budding, detachment (24-72 hours) and cell lysis (>72 hours). Once the cells appear
infected, the virus was harvested from cell culture medium by collecting the medium in a
sterile 15 ml snap-cap tube, and subsequent centrifugation at 500 xg for 5 min. The clarified
supernatant containing the virus was then transferred into a fresh snap-cap tube and labeled as
the P1 viral stock.

56
Budded viruses should be released into the medium 72 hours after transfection. Virally-
infected insect cells typically show the following characteristics: Increased cell diameter and
size of cell nuclei (first 24 hours), cessation of cell growth, granular appearance as a sign of
viral budding, detachment (24-72 hours) and cell lysis (>72 hours). Once the cells appear
infected, the virus was harvested from cell culture medium by collecting the medium in a
sterile 15 ml snap-cap tube, and subsequent centrifugation at 500 xg for 5 min. The clarified
supernatant containing the virus was then transferred into a fresh snap-cap tube and labeled as
the P1 viral stock.
2.3.4.2 Amplification of P1 viral stock
The P1 viral stock is a small-scale, low-titer stock (generally ranges from 1*106 to 1*107
plaque forming units (pfu)/ml). Amplification of P1 allows the production of a P2 viral stock
with a titer ranging from 1*107 to 1*108 pfu/ml. To amplify the P1 viral stock, cells
(2*106/well in 6-well plate) were infected at a multiplicity of infection (MOI) ranging from
0.05 to 0.1. MOI is defined as the number of virus particles per cell.
To calculate how much viral stock must be added to obtain a specific MOI, the following
formula was used: MOI(pfu/ml) * number of cells Inoculum required (ml)= (.............................................) Titer of viral stock (pfu/ml)
Assuming a titer of 5*106 pfu/ml and 2*106 cells/well (2 ml culture) which has to be infected
by an MOI of 0.1 then:
0.1 pfu/ml * 2 * 106 cells Inoculum required (ml)=........................................... = 0.04 ml 5* 106 pfu/ml So, 0.04 ml of P1 viral stock was used to infect Sf9 cells (seeded one hour before infection in
6-well plates at 2*106 cells /well). Forty eight hours post-infection, medium containing virus
was collected in 15 ml snap-cap tubes, centrifuged at 500 xg for 5 min, and then the
supernatant was transferred to a fresh tube labeled P2 viral stock.

57
2.3.4.3 Plaque assay To determine the titer of the baculoviral stock and to plaque purify the virus, plaque assay
was performed. The clarified baculoviral stock P2 was diluted in supplemented Grace's Insect
Medium without FBS to an 8-log serial dilution (10-1 to 10-8). Sf9 cells were seeded into 6-
well plates at 1 * 106 cells /well, allowed to settle at RT for 1.0 hour and then checked using
an inverted microscope for attachment and for 50% confluence. Medium was then removed
and 1.0 ml of each viral dilution (10-3 to 10-8) was added to the cells and incubated at RT for
1.0 hour. The medium containing the virus was then removed starting from the highest
dilution to the lowest. Then a 2 ml plaquing medium (Supplemented Grace's Insect Medium
containing 10% FBS and 2% agarose; Invitrogen) was added to the cells, and the agarose
overlaying the cells was allowed to harden at RT for 20 min. Now, cells were incubated in a
27°C humidified incubator for 7-10 days until plaques were visible and ready to count. The
titer of the viral stock was then calculated according to the following formula:
1 Titer (pfu/ml) = number of plaques * dilution factor * ................................... ml of inoculum / well 2.3.4.4 Virus preparation
A viral stock from a single viral clone was generated by plaque purifying the baculovirus. For
this, Sf9 cells were seeded into 6-well plate at 1 * 106 cells /well and let be settled at RT for
1.0 hour. Using a sterile Pasteur pipette and bulb, a clear plaque was picked and the agarose
plug (containing the virus) was transferred into a 1.5 ml microcentrifuge tube containing 500
µl supplemented Grace's medium, and then mixed well by vortexing. 100 µl of the agarose
plug solution was then added to each well. Cells were incubated in a 27°C humidified
incubator for 72 hours. Medium containing the virus was then collected in a sterile 15 ml
snap-cap tubes, centrifuged at 500 x g for 5 min and clarified supernatant (the plaque-purified
viral stock) was then transferred to fresh snap-cap tubes. This viral stock was then amplified
according to section 2.3.4.2.

58
2.3.4.5 Verifying the purified virus by PCR analysis
Purified viral DNA was extracted from viral stock using the extra chromosomal DNA
isolation protocol (section 2.2.1). Viral DNA (vBac-AAV2-Ad5 and vBac-AAV2-Rep) was
verified by Taq-PCR using the same approach followed in verifying Bacmid DNA (section
2.2.10).
2.3.5 Rescuing the helper dependant adenovirus in HEK 293T cells (Figure 14)
The ability of the baculovirus to infect HEK 293 cells were tested by infecting 90 % confluent
cultures with 200 µl vBac-EGFP P2 viral stock in 6-well plates once at 37 °C for one hour
and once at 28 °C for 4 hours.
To rescue the helper dependant adenovirus in HEK 293 cells, cells were splitted into 6-well
plates (8 wells total) one day before transfection at 1 * 106 cells/well. On 90% confluence,
cells were transfected (section 2.3.2.1) with PmeI linearized mini-Ad5 helper dependent
vector (pAd5-AAT-hf8) (6 wells) by lipofection along with a negative control well (no DNA)
and a positive control (of transfection) well (pBac-EGFP). One day after transfection, HEK
293 cells were infected with different concentrations of Bac-AAV2-Ad5 particles (using
different MOI) in combination with vBac-AAV2-Rep according to table 8 with the last well
(well#8) infected with vBac-AAV2-Rep only as a negative control for the helper dependent
adenovirus production.
Table 8: Infection mixtures used to rescue the helper dependent adenovirus in HEK 293 cells.
47
cells were transfected (section 2.3.2.1) with PmeI linearized mini-Ad5 helper dependent
vector (pAd5-AAT-hf8) (6 wells) by lipofection along with a negative control well (no DNA)
and a positive control (of transfection) well (pBac-EGFP). One day after transfection, HEK
293 cells were infected with different concentrations of Bac-AAV2-Ad5 particles (using
different MOI) in combination with vBac-AAV2-Rep according to table 8 with the last well
(well#8) infected with vBac-AAV2-Rep only as a negative control for the helper dependent
adenovirus production.
Well#1: Negative control
Well#3: vBac-AAV2-Ad5 Plaque 9 at 2000 MOI + vBac-Rep Plaque 1 at 200 MOI
Well#5: vBac-AAV2-Ad5 Plaque 16 at 2000 MOI + vBac-Rep Plaque 1 at 200 MOI
Well#7: vBac-AAV2-Ad5 Plaque 5 at 2000 MOI + vBac-Rep Plaque 1 at 200 MOI
Well#2: Positive control (pBac-EGFP)
Well#4: vBac-AAV2-Ad5 Plaque 9 at 500 MOI + vBac-AAV2-Rep Plaque 1 at 200 MOI
Well#6: vBac-AAV2-Ad5 Plaque 16 at 500 MOI + vBac-AAV2-Rep Plaque 1 at 200 MOI
Well#8: vBac-AAV2-Rep Plaque at 200 MOI
Table 8: Infection mixtures used to rescue the helper dependent adenovirus in HEK 293 cells.
Figure 14: Rescuing the helper dependant adenovirus in HEK 293 cells.
The detailed infection protocol of HEK 293 cells was according to Kenoutis et al. 2006. For
this, HEK 293 cells were washed with D-PBS and the viral mixtures prepared in 0.5 ml D-
PBS were added to each corresponding well. After 4-6 hours incubation at 28 °C, mixtures
were removed and 2 ml complete medium (DMEM) were added. Cytopathic effects and signs

59
Figure 14: Rescuing the helper dependant adenovirus in HEK 293 cells.
The detailed infection protocol of HEK 293 cells was according to Kenoutis et al. 2006. For
this, HEK 293 cells were washed with D-PBS and the viral mixtures prepared in 0.5 ml D-
PBS were added to each corresponding well. After 4-6 hours incubation at 28 °C, mixtures
were removed and 2 ml complete medium (DMEM) were added. Cytopathic effects and signs
of viral production were followed over five days. Culture medium was collected from
corresponding wells and used for FVIII: Ag ELISA after 10x concentration. Cells were
trypsinized and lysed in PBS by 4 rounds of freeze /thaw cycles (freezing for 5 min in dry ice
/ ethanol bath and thawing at 37°C). Lysates (200 µl) were used for extra chromosomal DNA
isolation and /or used for a second round of infection in which fresh (new) 90% confluent
HEK 293 cells in 6-well plates were infected with 200 µl lysates at 37°C for 45 min after
being infected with the Helper vector for one hour at RT. Signs of viral production were
followed over 4 days. Cells were then freezed and thawed as mentioned above and lysates
were used for extra chromosomal DNA isolation (section 2.2.1) and for a third round of
infection using the same protocol mentioned above for the second round of infection.
FVIII: Ag was assessed in medium and extra chromosomal DNA was digested by DpnI to test
whether it is the original transfected DNA or a newly produced DNA in HEK 293 cells,
which was under the support of our designed hybrid helper vector.
47
cells were transfected (section 2.3.2.1) with PmeI linearized mini-Ad5 helper dependent
vector (pAd5-AAT-hf8) (6 wells) by lipofection along with a negative control well (no DNA)
and a positive control (of transfection) well (pBac-EGFP). One day after transfection, HEK
293 cells were infected with different concentrations of Bac-AAV2-Ad5 particles (using
different MOI) in combination with vBac-AAV2-Rep according to table 8 with the last well
(well#8) infected with vBac-AAV2-Rep only as a negative control for the helper dependent
adenovirus production.
Well#1: Negative control
Well#3: vBac-AAV2-Ad5 Plaque 9 at 2000 MOI + vBac-Rep Plaque 1 at 200 MOI
Well#5: vBac-AAV2-Ad5 Plaque 16 at 2000 MOI + vBac-Rep Plaque 1 at 200 MOI
Well#7: vBac-AAV2-Ad5 Plaque 5 at 2000 MOI + vBac-Rep Plaque 1 at 200 MOI
Well#2: Positive control (pBac-EGFP)
Well#4: vBac-AAV2-Ad5 Plaque 9 at 500 MOI + vBac-AAV2-Rep Plaque 1 at 200 MOI
Well#6: vBac-AAV2-Ad5 Plaque 16 at 500 MOI + vBac-AAV2-Rep Plaque 1 at 200 MOI
Well#8: vBac-AAV2-Rep Plaque at 200 MOI
Table 8: Infection mixtures used to rescue the helper dependent adenovirus in HEK 293 cells.
Figure 14: Rescuing the helper dependant adenovirus in HEK 293 cells.
The detailed infection protocol of HEK 293 cells was according to Kenoutis et al. 2006. For
this, HEK 293 cells were washed with D-PBS and the viral mixtures prepared in 0.5 ml D-
PBS were added to each corresponding well. After 4-6 hours incubation at 28 °C, mixtures
were removed and 2 ml complete medium (DMEM) were added. Cytopathic effects and signs

60
2.4 Biochemical methods
2.4.1 Purification of factor VIII protein expressed in culture medium
FVIII containing medium (300 ml) collected from stable cell line cultures was concentrated
10x using Vivaspin 20 columns (30,000 MWCO). Concentrated medium was then mixed with
0.5 ml FVIII-Select beads (monoclonal anti-FVIII antibody beads) and shaken at 4°C for 2
hours. Beads were then pelleted (2 min centrifugation at 2000 rpm), resuspended in buffer A,
loaded onto a 2 ml pierce column and washed 4 times with buffer A (after each addition of
buffer A, the column was centrifuged at 200 rpm for 2 min). FVIII was then eluted with
buffer B and 8 batches were collected (beads were suspended 8 times with 0.5 ml buffer B
and centrifuged for 5 min at 200 rpm, each time the eluate was collected in a new tube).
Batches were assayed for FVIII activity and the productive batches were pooled and buffer
exchanged on a PD-10 desalting columns with buffer A. Eluates were then concentrated using
Amicon Ultracel (30K) filters and concentrates were then tested for FVIII-activity and FVIII-
antigen. For activity assays (see section 2.4.2), purified FVIII was diluted in human FVIII-
deficient plasma and for antigen quantitation (section 2.4.3); purified FVIII was diluted in
buffer A. For testing the purity of the purified FVIII, approximately 1 U FVIII (measured by
FVIII: Ag ELISA) were digested with human alpha thrombin and detected by western
blotting (see section 2.4.4).
2.4.2 Factor VIII activity assays
FVIII activity (FVIII: C) was measured in conditioned medium using the clotting assay which
is based on the measurement of activated Partial Thromboplastin Time (aPTT) and / or the
chromogenic assay that is based on the activation of a chromogenic substrate. In both assays,
conditioned medium was treated as a plasma sample.
2.4.2.1 Clotting assay
Clotting assays are based on the measurement of aPTT (Turi and Peerschke, 1986; Ray and
Hawson, 1989; Van den Besselaar et al., 1993) using ACLTM-analysis systems
(Instrumentation Laboratories) that work on centrifugational analyzer principle. Sample to be
tested was mixed with FVIII-deficient plasma and then the intrinsic coagulation pathway was

61
activated by the addition of bovine cephaline and microcrystalline kieselguhr. Clot formation
was initiated by adding Ca+2 and the machine starts to measure the change in light scattering.
When the maximum scattering was attained, time (reflects aPTT measurement) was stopped.
Time of measured samples was converted into % using a standard curve that the machine
plots automatically from three standard plasma dilutions. A 100% value corresponds to the
average FVIII: C in normal pooled plasma. Samples with activities higher than 100% were
diluted. Samples with low activity values were evaluated by an additional standard curve for
low values. ACLTM-analysis system was operated according the manufacturer specifications.
The pipetting of reagents and samples was done automatically. In each measurement, standard
plasma was included as a positive control and a conditioned medium from cells that do not
secret FVIII was included as a negative control.
2.4.2.2 Chromogenic assay
In the chromogenic assay (van Dieijen et al., 1981), FVIII: C was measured by the generation
of factor Xa using "Factor VIII Chromogenic assay" kit (Dade Behring, Marburg). In this
assay, FVIII is activated by the addition of thrombin. Activated FVIII (FVIIIa) works as a
cofactor with FIXa, Phospholipids and Ca+2 in the activation of FX to FXa. FXa activity is
measured through the hydrolysis of FXa-specific p-nitroaniline substrate. The initial rate of
release of p-nitroanaline measured spectrophotometrically at 405 nm is proportional to FXa
activity that reflects FVIII: C in the sample. The assay was performed automatically on MLA
Electra 900C coagulation analyzer. Samples were diluted 1:41 using 0.9% sodium chloride
and results were calculated according to an automatically plotted standard curve. In each
measurement, two control plasmas were run: Control Plasma N (normal range) and Control
Plasma P (pathologic range).
2.4.3 Factor VIII antigen assay
FVIII antigen concentration (FVIII:Ag) was measured using FVIII:Ag-ELISA (Asserachrom
VIII:Ag; Diagnostica Stago; Girma et al., 1998). Two monoclonal antibodies (mAb) directed
against distinct epitopes of the human FVIII light chain have been used in this sandwich-
ELISA. The first mAb was immobilized on wells of microtiter plates. FVIII-containing
samples were incubated at 20°C for 2 hours. Following washing, the second antibody,
coupled to peroxidase, was incubated at 20°C for 2 hours. Bound antibody was measured by
62
incubating with tetramethybenzidin for 5 minutes, blocking the reaction with 50 µl of 1 M
H2SO4 and reading absorbance at 450 nm. Control plasma, containing 1 U/ml FVIII: C as
estimated by comparing with the International standard, was used as a reference (100%). The
ELISA was done according to the manufacturer recommendations. The standard curve was
made by diluting the control plasma. The detection limit of this assay was 0.5% of FVIII.
2.4.4 Purified factor VIII cleavage by thrombin and western blot analysis
For western blot analysis of purified FVIII products (F8-BDD, F8-202, F8-394 and F8-Full),
approximately 1 U containing aliqoutes (as measured by FVIII:Ag, section II.4.3) were mixed
with Laemmli buffer, and heat denatured at 95°C for 5 min. For complete thrombin digestion,
aliquotes containing 1 U FVIII were digested with 0.5 nM human alpha thrombin (FIIa) in 1x
FIIa buffer at 37°C for 4 min. The reaction was then stopped by the addition of laemmli
buffer and heat denaturing. For the A2 domain cleavage by thrombin, a master mix for 10
reactions (1 U FVIII, 0.5 nM FIIa and 1x FIIa buffer per reaction) was prepared at 37°C.
Aliquots were taken after the addition of FIIa every 15 seconds and reactions were stopped
directly by mixing with laemmli buffer. Samples were then heat denatured at 95°C for 5 min.
Heat denatured proteins were then separated by electrophoresis over SDS-polyacrylamide
gels (7.5%). The proteins were transferred onto a PVDF membrane using a tank blotting
apparatus (BioRad). The FVIII proteins were visualized by incubating the membrane with
monoclonal anti-human FVIII A2 domain antibody (Green Mountain Antibodies; USA) using
a 1:800 dilution, followed by incubation with a peroxidase conjugated anti-mouse IgG
(1:4000 dilution). The final detection was achieved by adding 4 ml solution A, 400 µl solution
B and 1.2 µl H2O2. Evaluation of bands was carried out using a chemillumiscence
documentation system (Alpha Innotech).

63
3. Results:
3.1 Functional studies on factor VIII protein variants containing different lengths of the
B-domain:
3.1.1 Construction (cloning) of expression plasmids containing different lengths of the B-
domain
The expression plasmids containing different lengths of the factor VIII B-domain region were
constructed according to the cloning strategy that is detailed in section II.2.8 and documented
in figure 15. The pMT2-F8-SNA intermediate vector (8808 bp; containing the SpeI / NruI /
ApaI sites) was constructed by digesting pMT2-FVIII with ApaI and SpeI which will remove
most of the middle part of FVIII cDNA (Fig. 7 step 1 and Fig. 15 B, lane 1). In the next step,
a PCR fragment covering the end part of the B domain and part of the light chain (from
position 6068 to position 7310 in pMT2-FVIII sequence) was created by two PCR rounds, the
first PCR resulted in 1.25 kb fragment and introduced an NruI restriction site at the 5’-end,
the second PCR resulted in a 1.27 kb fragment and introduced an SpeI restriction site 5’ to the
NruI site (Fig. 7 step 2 and Fig. 15 A lane 1 / 2 and B lane 2). This fragment was then cloned
into the large fragment that resulted from step 1. The large fragment contains the pMT2
vector backbone and the beginning as well as the end of FVIII cDNA (Fig. 7 step 3). The
selected pMT2-F8-SNA clones were confirmed to be correct by SalI digestion. This digestion
resulted in a 5.8 kb fragment representing the vector backbone and a 3.0 kb factor VIII
fragment (Fig. 15C). Clones were further confirmed by DNA sequencing.
The different DNA fragments (AàE) containing various lengths of the B-domain region were
amplified by PCR using the primer combinations listed in table 7 (Fig. 7 step 5 and Fig. 15 D
and E). Those fragments were cloned into pMT2-F8-SNA which has been digested with SpeI
and NruI (Fig. 7 step 4 and Fig. 15 F) to generate the plasmids pMT2-F8-BDD (10485 bp),
pMT2-F8-101 (10788 bp), pMT2-F8-202 (11091), pMT2-F8-292 (11361 bp) and pMT2-F8-
394 (11667 bp) (see appendix). Several clones were picked for each plasmid and tested to
have the correct plasmid size by linearizing them with MluI (Fig.15 G) and by digesting them
with SalI, which removes the FVIII cDNA from the vector (Fig.15 H).

64
Figure 7 (repeat): Schematic representation of the construction of various expression plasmids containing
different lengths of the B domain. Steps 1,2 and 5 were performed using the pMT2-FVIII vector containing the
full length FVIII cDNA (nts # 1111 to 8386). The B domain spans nts # 3388 to 6112 (aa 740 to 1648).
A schematic representation of the various B domain deleted constructs on the protein level in
comparison to the commercially available recombinant BDD-FVIII (ReFacto) and to the full
length FVIII protein is shown in figure 16. The level of the B-domain glycosylation (the
number of glycosylated positions) is also shown in the same figure.
Figure 15 (next page): Overview of the various cloning steps used to construct the B-domain deleted
expression plasmids. (A) The first PCR product that resulted in 1.25 kb fragment and the introduction of an
NruI restriction site at the 5’-end. (B) Lane 2 shows the second PCR product which resulted in a 1.27 kb
fragment and the introduction of an SpeI restriction site 5’ to the NruI site; Lane 1 shows the pMT2-FVIII
plasmid digested with SpeI and ApaI. (C) Lane 1-3 represents SalI digestion (which releases the FVIII-cDNA
from the pMT2 vector) of three pMT2-F8-SNA clones; Lane 4 represent SalI digestion of pMT2-FVIII
containing the full length FVIII-cDNA. (D and E): The amplified different DNA fragments (AàE) containing
various lengths of the B-domain. (F) SpeI/NruI (S/N) digestion of pMT2-F8-SNA (see Fig. 7; step 4). (G) MluI
digestion of the different B-domain deleted plasmids. (H) SalI digestion of the different B-domain deleted
plasmids. M: DNA molecular weight marker X (0.07 – 12.2 kb; Roche).
53
Figure 7 (repeat): Schematic representation of the construction of various expression plasmids containing
different lengths of the B domain. Steps 1,2 and 5 were performed using the pMT2-FVIII vector containing the
full length FVIII cDNA (nts # 1111 to 8386). The B domain spans nts # 3388 to 6112 (aa 740 to 1648).
A schematic representation of the various B domain deleted constructs on the protein level in
comparison to the commercially available recombinant BDD-FVIII (ReFacto) and to the full
length FVIII protein is shown in figure 16. The level of the B-domain glycosylation (the
number of glycosylated positions) is also shown in the same figure.
Figure 15 (next page): Overview of the various cloning steps used to construct the B-domain deleted
expression plasmids. (A) The first PCR product that resulted in 1.25 kb fragment and the introduction of an
NruI restriction site at the 5’-end. (B) Lane 2 shows the second PCR product which resulted in a 1.27 kb
fragment and the introduction of an SpeI restriction site 5’ to the NruI site; Lane 1 shows the pMT2-FVIII
plasmid digested with SpeI and ApaI. (C) Lane 1-3 represents SalI digestion (which releases the FVIII-cDNA
from the pMT2 vector) of three pMT2-F8-SNA clones; Lane 4 represent SalI digestion of pMT2-FVIII
containing the full length FVIII-cDNA. (D and E): The amplified different DNA fragments (A!E) containing
various lengths of the B-domain. (F) SpeI/NruI (S/N) digestion of pMT2-F8-SNA (see Fig. 7; step 4). (G) MluI
digestion of the different B-domain deleted plasmids. (H) SalI digestion of the different B-domain deleted
plasmids. M: DNA molecular weight marker X (0.07 – 12.2 kb; Roche).
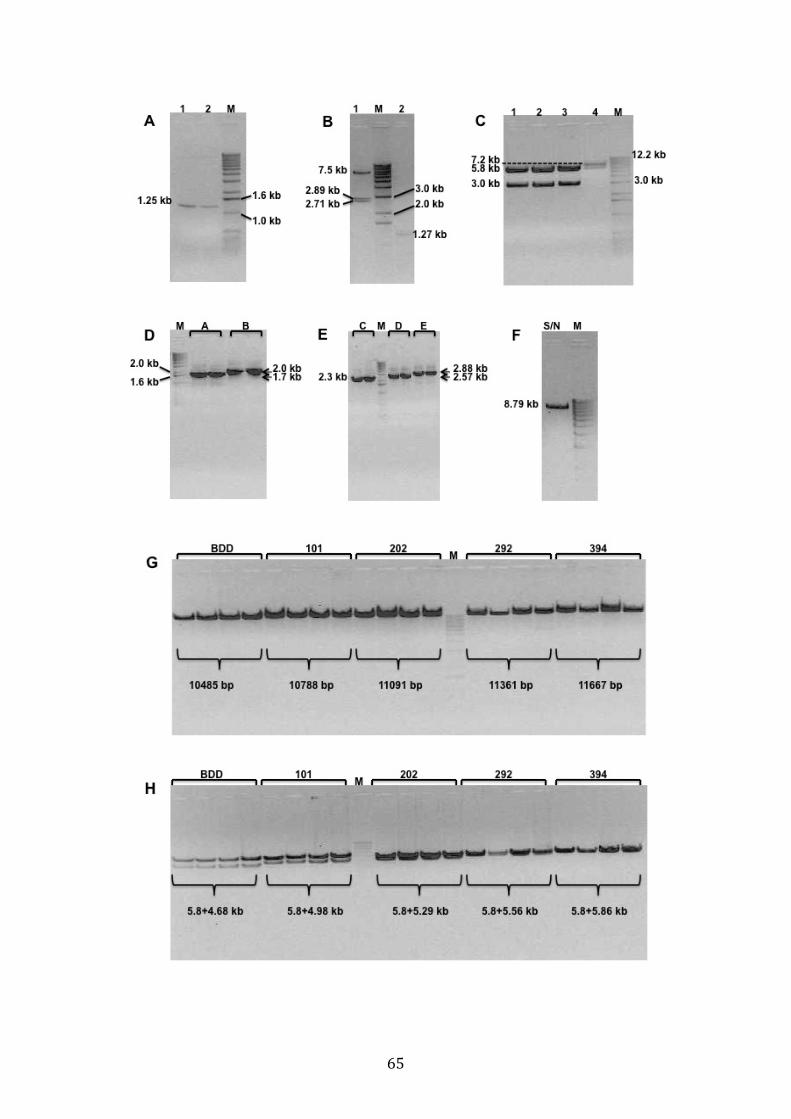
65
54

66
Figure 16: Schematic representation of the various B-domain deleted constructs on the protein level and the
corresponding number of glycosylation sites within the B domain.
One correct clone from each plasmid was amplified by maxi culture to be used in expression
experiments. All maxi prepared clones were re-tested by MluI and SalI digestion (Fig. 17)
and confirmed to be correct by DNA sequencing. Figure 18 shows the DNA sequence of
different B-domain deleted constructs across the deleted region. Maxi-prepared DNA
confirmed by restriction analysis and DNA sequencing was used for expression studies.
Figure 17: Maxi prepared plasmid DNA of various B-domain deleted expression plasmids. Lane 1: MluI
digested plasmids, Lane 2: SalI digested plasmids. L2: Gene Ruler 1kb DNA ladder (0.25 – 10 kb; Fermantas).
55
Figure 16: Schematic representation of the various B-domain deleted constructs on the protein level and the
corresponding number of glycosylation sites within the B domain.
One correct clone from each plasmid was amplified by maxi culture to be used in expression
experiments. All maxi prepared clones were re-tested by MluI and SalI digestion (Fig. 17) and
confirmed to be correct by DNA sequencing. Figure 18 shows the DNA sequence of different
B-domain deleted constructs across the deleted region. Maxi-prepared DNA confirmed by
restriction analysis and DNA sequencing was used for expression studies.
Figure 17: Maxi prepared plasmid DNA of various B-domain deleted expression plasmids. Lane 1: MluI
digested plasmids, Lane 2: SalI digested plasmids. L2: Gene Ruler 1kb DNA ladder (0.25 – 10 kb; Fermantas).

67
Figure 18: Representative DNA sequences of the different plasmids showing the DNA sequence across the
deleted part of the B-domain region in each plasmid. A: pMT2-F8-BDD, B: pMT2-F8-101, C: pMT2-F8-202, D:
pMT2-F8-292 and E: pMT2-F8-394.
56
Figure 18: Representative DNA sequences of the different plasmids showing the DNA sequence across the
deleted part of the B-domain region in each plasmid. A: pMT2-F8-BDD, B: pMT2-F8-101, C: pMT2-F8-202, D:
pMT2-F8-292 and E: pMT2-F8-394.

68
3.1.2 Transient expression of different B-domain deleted plasmids in three mammalian
cell lines
Transfection. The three cell lines were transfected by lipofection at 90% confluency. The
transfection efficiency by Lipofectamine 2000 (Invitrogen) was checked by observing the
intensity of the eGFP fluorescence 24 hours after transfection. The transfection with the eGFP
containing plasmid (pEGFP-C1) was done in parallel along with the transfection of different
B-domain deleted plasmids in the three cell lines (Fig. 19).
FVIII activity. Two one-day (24 hours) medium collections were performed: 48 and 72 hours
after transfection. The media were clarified by centrifugation and assayed for factor VIII
activity using the clotting assay (section 2.4.2.1).
Factor VIII activity (FVIII: C), given in percentage is shown for each cell line in figure 20 A,
B and C. Within the two medium collections, the COS-7 cell line showed the highest
expression level with an activity range of 20 to 56 % among all expressed plasmids, followed
by HEK 293T with a range of 11.2 to 41.1 % FVIII: C and the CHO cell line with a range of
1.7 to 7.5 % FVIII: C. Negative controls (no DNA in the transfection mixtures) showed no
factor VIII activity.
The first medium collection (48 hours after transfection) showed higher activity in HEK 293T
and COS-7 cells for all the expressed plasmids while the second medium collection (72 hours
after transfection) showed higher activity in CHO cells.

69
Figure 19: Lipofection efficiency as a transfection method in various cell lines used. A, C and E: Non-
transfected negative control cultures of HEK 293T, COS-7 and CHO cell lines respectively. B, D and F: 24
hours pEGFP-C1 transfected cultures of HEK 293T, COS-7 and CHO cell lines respectively.
Activity levels for different constructs in different cell lines were compared in each medium
collection (Fig. 20 D and E). In comparison to the BDD construct, the data showed that the
FVIII activity levels are generally higher in the constructs containing added lengths of the B-
domain in COS-7 and HEK 293T cells. Additionally, with the exception of the 292 construct,
the different constructs showed an in increase in the FVIII: C with the increase in the B-
domain length in both cell lines (COS-7 and HEK 293T).
58
Figure 19: Lipofection efficiency as a transfection method in various cell lines used. A, C and E: Non-
transfected negative control cultures of HEK 293T, COS-7 and CHO cell lines respectively. B, D and F: 24
hours pEGFP-C1 transfected cultures of HEK 293T, COS-7 and CHO cell lines respectively.
Activity levels for different constructs in different cell lines were compared in each medium
collection (Fig. 20 D and E). In comparison to the BDD construct, the data showed that the
FVIII activity levels are generally higher in the constructs containing added lengths of the B-
domain in COS-7 and HEK 293T cells. Additionally, with the exception of the 292 construct,
the different constructs showed an in increase in the FVIII: C with the increase in the B-
domain length in both cell lines (COS-7 and HEK 293T).

70
Figure 20: Transient expression of the different constructs in HEK 293T, COS-7 and CHO-DHFR[-] cell
lines. A, B and C: FVIII: C in two medium collections for different constructs in CHO, 293T and COS-7 cells
respectively. D and E: Activity levels for different constructs in different cell lines were compared for each
medium collection. All data are means ± SD.
59
Figure 20: Transient expression of the different constructs in HEK 293T, COS-7 and CHO-DHFR[-] cell
lines. A, B and C: FVIII: C in two medium collections for different constructs in CHO, 293T and COS-7 cells
respectively. D and E: Activity levels for different constructs in different cell lines were compared for each
medium collection. All data are means ± SD.

71
3.1.3 Functional studies on different B-domain deleted plasmids transiently expressed in
COS-7 cells
The COS-7 cell line that showed the highest factor VIII expression (section 3.1.2) was used
for further functional assessment of the different B-domain deleted plasmids. For this, COS-7
cells were transfected with the different constructs at 90% confluence. Conditioned medium
and cellular lysates collected 48 hours after transfection were used for activity and antigen
assessment. All activity and antigen values mentioned in this section are per one million cells
per milliliter.
FVIII activity and antigen. Collected media were clarified by centrifugation and assayed for
factor VIII activity using the clotting and the chromogenic assays (section 2.4.2). For factor
VIII antigen determination, an ELISA assay was used (section 2.4.3). After medium
collection, cells were washed directly with PBS, trypsinized, counted and then lysed. Lysates
were only used for antigen quantification.
FVIII Activity levels of the two different assay methods are shown in figure 21 A. The
clotting assay showed a slightly higher value than the chromogenic assay for all the
constructs. However, for the BDD construct, the FVIII: C of chromogenic assay was higher
than FVIII: C of clotting assay. As already seen before (3.1.2), the data show that the activity
levels are higher in the constructs containing added lengths of the B-domain in comparison to
the BDD construct. With the exception of the 292 construct, the different constructs showed
an in increase in the FVIII: C with the increase in the B-domain length in both assays
methods.
Antigen levels in both the conditioned medium and cellular lysates are shown in figure 21 B.
For all expressed plasmids, the FVIII: Ag levels in the medium are much lower than in the
lysates. With the exception of the 292 construct, the FVIII: Ag levels are higher in the
expression of the constructs containing added lengths of the B-domain in comparison to the
BDD construct in medium and lysates. The different constructs showed an increase in the
FVIII: Ag with the increase in the B-domain length in the medium except for the 292
construct.

72
Figure 21: Activity and antigen levels of the different constructs expressed in COS-7 cell line for 48 hours.
(A) FVIII: C levels in conditioned medium using the clotting and the chromogenic assays. (B) FVIII: Ag levels
in medium and in cellular lysates. All data are means ± SD; *: p value < 0.05.
Specific activity. The functionality of the different constructs was evaluated by their specific
activity. The specific activity was calculated by dividing the activity of each construct
(measured by the clotting assay) by its corresponding FVIII: Ag value (measured by ELISA)
in medium. Considering that normal plasma has an activity of one unit per milliliter and
assuming that the one unit FVIII contains 0.15 µg FVIII protein per milliliter (FVIII
concentration varies in different publications with a range of 100-300 ng / ml), then the
optimal specific activity of FVIII is 6.67 U/µg.
Figure 22 A shows the calculated specific activities of FVIII expressed from different
constructs. The data shows that all the constructs are functional with specific activities above
the calculated optimal specific activity. The different constructs containing added lengths of
the B-domain show higher specific activity in comparison to the BDD construct.
Interestingly, the 292 construct that has the lowest FVIII: C and FVIII: Ag compared to the
other constructs showed the highest specific activity.
Total expressed FVIII. The total expressed FVIII protein of the different constructs is
measured as the sum of the quantity of protein secreted into the medium and that retained in
cellular lysates (Fig. 22 B). Data indicate that the different constructs containing added
lengths of the B-domain show the higher total protein quantity. With the exception of the 292
construct, the total expressed FVIII increased with the increase in the B-domain length.
61
Figure 21: Activity and antigen levels of the different constructs expressed in COS-7 cell line for 48 hours.
(A) FVIII: C levels in conditioned medium using the clotting and the chromogenic assays. (B) FVIII: Ag levels
in medium and in cellular lysates. All data are means ± SD; *: p value < 0.05.
Specific activity. The functionality of the different constructs was evaluated by their specific
activity. The specific activity was calculated by dividing the activity of each construct
(measured by the clotting assay) by its corresponding FVIII: Ag value (measured by ELISA)
in medium. Considering that normal plasma has an activity of one unit per milliliter and
assuming that the one unit FVIII contains 0.15 !g FVIII protein per milliliter (FVIII
concentration varies in different publications with a range of 100-300 ng / ml), then the
optimal specific activity of FVIII is 6.67 U/!g.
Figure 22 A shows the calculated specific activities of FVIII expressed from different
constructs. The data shows that all the constructs are functional with specific activities above
the calculated optimal specific activity. The different constructs containing added lengths of
the B-domain show higher specific activity in comparison to the BDD construct. Interestingly,
the 292 construct that has the lowest FVIII: C and FVIII: Ag compared to the other constructs
showed the highest specific activity.
Total expressed FVIII. The total expressed FVIII protein of the different constructs is
measured as the sum of the quantity of protein secreted into the medium and that retained in
cellular lysates (Fig. 22 B). Data indicate that the different constructs containing added
lengths of the B-domain show the higher total protein quantity. With the exception of the 292
construct, the total expressed FVIII increased with the increase in the B-domain length.

73
Figure 22: Specific activity of the different expressed FVIII proteins and the total expressed FVIII in
COS-7 cells. (A) The specific activity of different constructs as unit per µg FVIII in conditioned medium. (B)
The total expressed FVIII (in medium and cellular lysate) of the different constructs.
3.1.4 Generation of stable cell lines in CHO-DHFR[-] cells
Linearized, ethanol precipitated expression plasmids representing the different B-domain
deleted constructs were transfected by lipofection into CHO-DHFR[-] cells (see section
2.3.3.1). Two days later, the cells were splitted.
Selection. Transfected cells were selected for plasmid uptake by culturing them in nucleoside
deficient complete medium and in different concentrations of MTX. The medium was
changed every second day until well-defined new colonies appeared 2-3 weeks after selection
(see Fig. 23). New colonies were then pooled and assayed for FVIII: C upon confluency. As a
result, only the CHO-BDD, CHO-202, CHO-394 and CHO-full-length cultures showed FVIII
productivity at a certain MTX concentration upon selection (see table 9, selection part).
Productive cultures were expanded into many dishes for storage, amplification and cloning.
Limited dilution cloning. Productive cultures from the four stable cultures were cloned by
limited dilution cloning (see section 2.3.3.2). For this, minimums of three serially diluted 96-
well plates were made for each stable culture. Approximately, 20 to 40 wells per construct
were marked as having a single cell. Single cells were followed for two weeks until they
reached full colonies. A maximum of 24 colonies arose from single cells were propagated into
24-well plates, each in a well until a confluent culture is reached. Conditioned medium was
then collected and assayed for FVIII productivity.
62
Figure 22: Specific activity of the different expressed FVIII proteins and the total expressed FVIII in
COS-7 cells. (A) The specific activity of different constructs as unit per !g FVIII in conditioned medium. (B)
The total expressed FVIII (in medium and cellular lysate) of the different constructs.
3.1.4 Generation of stable cell lines in CHO-DHFR[-] cells
Linearized, ethanol precipitated expression plasmids representing the different B-domain
deleted constructs were transfected by lipofection into CHO-DHFR[-] cells (see section
2.3.3.1). Two days later, the cells were splitted.
Selection. Transfected cells were selected for plasmid uptake by culturing them in nucleoside
deficient complete medium and in different concentrations of MTX. The medium was
changed every second day until well-defined new colonies appeared 2-3 weeks after selection
(see Fig. 23). New colonies were then pooled and assayed for FVIII: C upon confluency. As a
result, only the CHO-BDD, CHO-202, CHO-394 and CHO-full-length cultures showed FVIII
productivity at a certain MTX concentration upon selection (see table 9, selection part).
Productive cultures were expanded into many dishes for storage, amplification and cloning.
Limited dilution cloning. Productive cultures from the four stable cultures were cloned by
limited dilution cloning (see section 2.3.3.2). For this, minimums of three serially diluted 96-
well plates were made for each stable culture. Approximately, 20 to 40 wells per construct
were marked as having a single cell. Single cells were followed for two weeks until they
reached full colonies. A maximum of 24 colonies arose from single cells were propagated into
24-well plates, each in a well until a confluent culture is reached. Conditioned medium was
then collected and assayed for FVIII productivity.

74
Figure 23: Examples of well-defined new colonies appeared 2-3 weeks after selection procedure. (A) A new
colony appeared upon selection of pMT2-F8-BDD transfected cells. (B) A new colony appeared upon selection
of pMT2-F8-394 transfected cells.
With this approach, a few productive clones were identified with increased FVIII: C for each
stable culture. The highest identified productive clones (CHO-BDD clone F2, CHO-202 clone
G3, CHO-394 clone F4 and CHO-Full clone C6) are listed in table 9 (cloning part) with their
respective MTX concentration and FVIII: C. Productive clones were expanded for storage,
amplification and sub-cloning.
Amplification. Clones that still show low FVIII: C after the cloning procedure (CHO-202
clone G3 and CHO-394 clone F4) was amplified (section 2.3.3.1). One amplification step
(MTX concentration from 200 nM to 800 nM) for CHO-394 clone F4 was enough to increase
the productivity more than four times (16% to 77%) and several amplification steps (MTX
concentration from 400 nM to 6.0 µM) were required for CHO-202 clone G3 to increase the
productivity more than 5 times (5% to 28%) (Table 9, Amplification). The new more
productive cultures were also expanded, stored and further sub-cloned.
Sub-cloning. Sub-cloning was performed for moderately productive cell lines (CHO-BDD
clone F2, CHO-202 clone G3 and CHO-394 clone F4) using the same limited dilution
approach (see limited dilution cloning section) to guarantee the clonality of the new cell lines
and to obtain a higher productive cell lines. The MTX concentration corresponds to the latest
concentration used (in amplification or in cloning steps). Sub-cloning resulted in the
following high productive cell lines: CHO-BDD clone F2H1, CHO-202 clone G3E6 and
CHO-394 clone F4F3 (Table 9, Sub-cloning).
63
Figure 23: Examples of well-defined new colonies appeared 2-3 weeks after selection procedure. (A) A new
colony appeared upon selection of pMT2-F8-BDD transfected cells. (B) A new colony appeared upon selection
of pMT2-F8-394 transfected cells.
With this approach, a few productive clones were identified with increased FVIII: C for each
stable culture. The highest identified productive clones (CHO-BDD clone F2, CHO-202 clone
G3, CHO-394 clone F4 and CHO-Full clone C6) are listed in table 9 (cloning part) with their
respective MTX concentration and FVIII: C. Productive clones were expanded for storage,
amplification and sub-cloning.
Amplification. Clones that still show low FVIII: C after the cloning procedure (CHO-202
clone G3 and CHO-394 clone F4) was amplified (section 2.3.3.1). One amplification step
(MTX concentration from 200 nM to 800 nM) for CHO-394 clone F4 was enough to increase
the productivity more than four times (16% to 77%) and several amplification steps (MTX
concentration from 400 nM to 6.0 !M) were required for CHO-202 clone G3 to increase the
productivity more than 5 times (5% to 28%) (Table 9, Amplification). The new more
productive cultures were also expanded, stored and further sub-cloned.
Sub-cloning. Sub-cloning was performed for moderately productive cell lines (CHO-BDD
clone F2, CHO-202 clone G3 and CHO-394 clone F4) using the same limited dilution
approach (see limited dilution cloning section) to guarantee the clonality of the new cell lines
and to obtain a higher productive cell lines. The MTX concentration corresponds to the latest
concentration used (in amplification or in cloning steps). Sub-cloning resulted in the
following high productive cell lines: CHO-BDD clone F2H1, CHO-202 clone G3E6 and
CHO-394 clone F4F3 (Table 9, Sub-cloning).
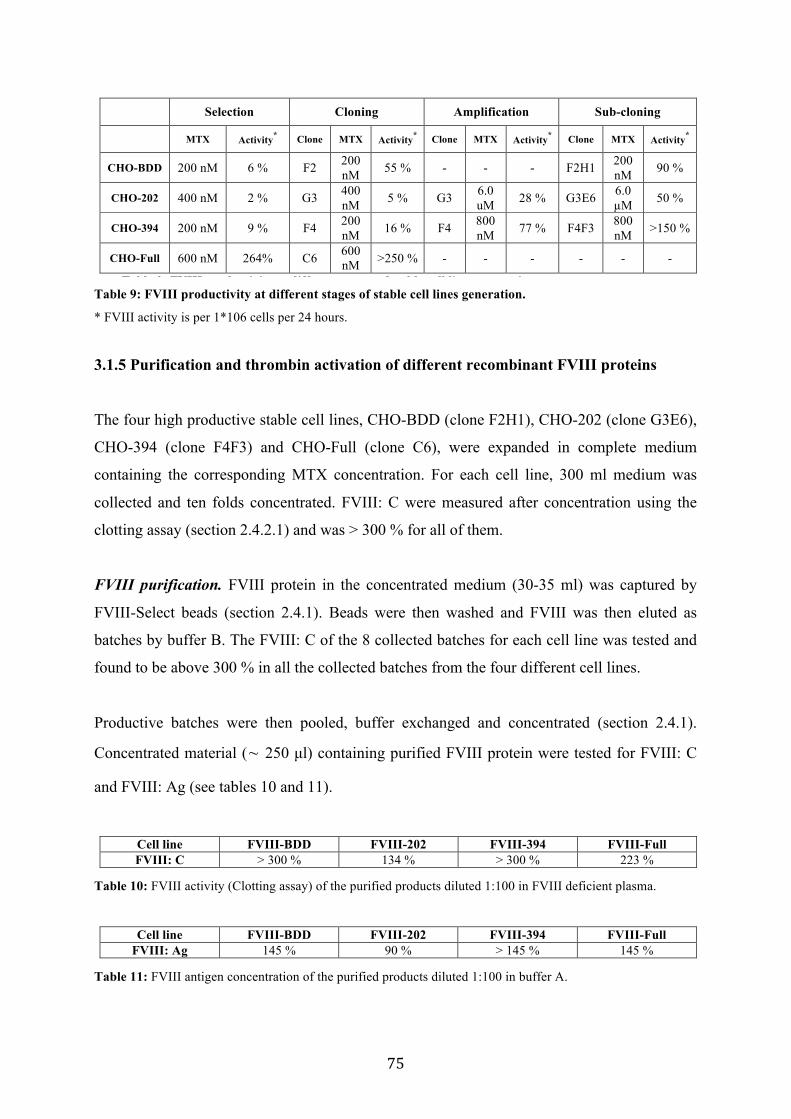
75
Table 9: FVIII productivity at different stages of stable cell lines generation.
* FVIII activity is per 1*106 cells per 24 hours.
3.1.5 Purification and thrombin activation of different recombinant FVIII proteins
The four high productive stable cell lines, CHO-BDD (clone F2H1), CHO-202 (clone G3E6),
CHO-394 (clone F4F3) and CHO-Full (clone C6), were expanded in complete medium
containing the corresponding MTX concentration. For each cell line, 300 ml medium was
collected and ten folds concentrated. FVIII: C were measured after concentration using the
clotting assay (section 2.4.2.1) and was > 300 % for all of them.
FVIII purification. FVIII protein in the concentrated medium (30-35 ml) was captured by
FVIII-Select beads (section 2.4.1). Beads were then washed and FVIII was then eluted as
batches by buffer B. The FVIII: C of the 8 collected batches for each cell line was tested and
found to be above 300 % in all the collected batches from the four different cell lines.
Productive batches were then pooled, buffer exchanged and concentrated (section 2.4.1).
Concentrated material (∼ 250 µl) containing purified FVIII protein were tested for FVIII: C
and FVIII: Ag (see tables 10 and 11).
Table 10: FVIII activity (Clotting assay) of the purified products diluted 1:100 in FVIII deficient plasma.
Table 11: FVIII antigen concentration of the purified products diluted 1:100 in buffer A.
64
Selection Cloning Amplification Sub-cloning
MTX Activity* Clone MTX Activity* Clone MTX Activity* Clone MTX Activity*
CHO-BDD 200 nM 6 % F2 200 nM 55 % - - - F2H1 200
nM 90 %
CHO-202 400 nM 2 % G3 400 nM 5 % G3 6.0
uM 28 % G3E6 6.0 !M 50 %
CHO-394 200 nM 9 % F4 200 nM 16 % F4 800
nM 77 % F4F3 800 nM >150 %
CHO-Full 600 nM 264% C6 600 nM >250 % - - - - - -
Table 9: FVIII productivity at different stages of stable cell lines generation. * FVIII activity is per 1*106 cells per 24 hours.
3.1.5 Purification and thrombin activation of different recombinant FVIII proteins
The four high productive stable cell lines, CHO-BDD (clone F2H1), CHO-202 (clone G3E6),
CHO-394 (clone F4F3) and CHO-Full (clone C6), were expanded in complete medium
containing the corresponding MTX concentration. For each cell line, 300 ml medium was
collected and ten folds concentrated. FVIII: C were measured after concentration using the
clotting assay (section 2.4.2.1) and was > 300 % for all of them.
FVIII purification. FVIII protein in the concentrated medium (30-35 ml) was captured by
FVIII-Select beads (section 2.4.1). Beads were then washed and FVIII was then eluted as
batches by buffer B. The FVIII: C of the 8 collected batches for each cell line was tested and
found to be above 300 % in all the collected batches from the four different cell lines.
Productive batches were then pooled, buffer exchanged and concentrated (section 2.4.1).
Concentrated material (! 250 !l) containing purified FVIII protein were tested for FVIII: C
and FVIII: Ag (see tables 10 and 11).
Cell line FVIII-BDD FVIII-202 FVIII-394 FVIII-Full FVIII: C > 300 % 134 % > 300 % 223 %
Table 10: FVIII activity (Clotting assay) of the purified products diluted 1:100 in FVIII deficient plasma.
Cell line FVIII-BDD FVIII-202 FVIII-394 FVIII-Full FVIII: Ag 145 % 90 % > 145 % 145 %
Table 11: FVIII antigen concentration of the purified products diluted 1:100 in buffer A.

76
FVIII activation by thrombin. Purified FVIII proteins were activated by thrombin (Factor
IIa) and the A2 domain cleavage (see fig. 4) was assessed according to section 2.4.4. For this,
a master mixture for ten reactions (1 U FVIII, 0.5 nM FIIa and 1x FIIa buffer per reaction)
was prepared at 37 °C. Aliqoutes were collected every 15 seconds and reactions were stopped
by mixing them with sample loading buffer directly. Samples were then heat denatured and
run over PAGE, western blotted against PVDF membrane and detected by an antibody
against the A2 domain. Figure 24 show the western blots of the A2 generation for the purified
FVIII- BDD and FVIII-394 proteins. The rate of A2 generation was calculated as a
percentage by dividing the generated A2 domain band density (integrated density value) by
the total A2 density in the reaction (A2 domain band, A1+A2 domains band and any
undigested FVIII material). Data in figure 25 show that the BDD construct is slightly faster
activated as compared to the 394 construct, since it showed higher A2 generation at point zero
and reached a 50% A2 generation in a shorter time.
Figure 24: Western blots demonstrating A2 generation of purified FVIII-BDD and FVIII-394 proteins at
different time points after thrombin digestion.
65
FVIII activation by thrombin. Purified FVIII proteins were activated by thrombin (Factor
IIa) and the A2 domain cleavage (see fig. 4) was assessed according to section 2.4.4. For this,
a master mixture for ten reactions (1 U FVIII, 0.5 nM FIIa and 1x FIIa buffer per reaction)
was prepared at 37 °C. Aliqoutes were collected every 15 seconds and reactions were stopped
by mixing them with sample loading buffer directly. Samples were then heat denatured and
run over PAGE, western blotted against PVDF membrane and detected by an antibody against
the A2 domain. Figure 24 show the western blots of the A2 generation for the purified FVIII-
BDD and FVIII-394 proteins. The rate of A2 generation was calculated as a percentage by
dividing the generated A2 domain band density (integrated density value) by the total A2
density in the reaction (A2 domain band, A1+A2 domains band and any undigested FVIII
material). Data in figure 25 show that the BDD construct is slightly faster activated as
compared to the 394 construct, since it showed higher A2 generation at point zero and
reached a 50% A2 generation in a shorter time.
Figure 24: Western blots demonstrating A2 generation of purified FVIII-BDD and FVIII-394 proteins at
different time points after thrombin digestion.

77
Figure 25: Rate of A2 domain generation measured in 15-second intervals. The BDD construct shows a
higher A2 generation at point zero and over time a faster A2 generation than the 394 construct.
3.2 Construction of a new helper vector for the production of helper-dependent
adenovectors for the use in hemophilia gene therapy
3.2.1 Construction of the plasmid pBac-AAV2-Ad5
The shuttle plasmid pBac-AAV2-Ad5LR (∼8777 bp) was generated by introducing an
AAV2- 5’ITR / Ad5LR / AAV2-3’ITR construct into the basic plasmid pFastBac-1 (see
section 2.2.10). The shuttle plasmid was then linearized with PmeI (Fig. 26 A), purified,
dephosphorylated and then mixed with pAdEasy-1 containing the adenoviral genome from
3.5 to 36 kb (Fig. 26 B) in BJ8153 electrocompetent cells. The cells were then electroporated.
Electroporation resulted in the introduction of the Ad5-genome into the shuttle plasmid by
homologous recombination and the generation of pBac-AAV2-Ad5 (∼35824 bp). Figure 26
C shows a mini prepared DNA of several picked pBac-AAV2-Ad5 clones from the
electroporation plates. Possibly correct clones are those that show a super coiled and a relaxed
band above the marker level (above the 12.2 kb band), which reflect a size of ∼35 kb. Those
clones were further characterized by restriction enzyme analysis. Clones that showed smaller
size fragments (lower than 12.2 kb band) were neglected (those clones are marked by an x in
fig. 26 C). Possibly correct clones were stabilized by transforming them into XL10-Gold
bacteria; DNA was then mini prepared (Fig. 27 A).
66
Figure 25: Rate of A2 domain generation measured in 15-second intervals. The BDD construct shows a
higher A2 generation at point zero and over time a faster A2 generation than the 394 construct.
3.2 Construction of a new helper vector for the production of helper-dependent
adenovectors for the use in hemophilia gene therapy
3.2.1 Construction of the plasmid pBac-AAV2-Ad5
The shuttle plasmid pBac-AAV2-Ad5LR (!8777 bp) was generated by introducing an AAV2-
5’ITR / Ad5LR / AAV2-3’ITR construct into the basic plasmid pFastBac-1 (see section
2.2.10). The shuttle plasmid was then linearized with PmeI (Fig. 26 A), purified,
dephosphorylated and then mixed with pAdEasy-1 containing the adenoviral genome from
3.5 to 36 kb (Fig. 26 B) in BJ8153 electrocompetent cells. The cells were then electroporated.
Electroporation resulted in the introduction of the Ad5-genome into the shuttle plasmid by
homologous recombination and the generation of pBac-AAV2-Ad5 (!35824 bp). Figure 26 C
shows a mini prepared DNA of several picked pBac-AAV2-Ad5 clones from the
electroporation plates. Possibly correct clones are those that show a super coiled and a relaxed
band above the marker level (above the 12.2 kb band), which reflect a size of !35 kb. Those
clones were further characterized by restriction enzyme analysis. Clones that showed smaller
size fragments (lower than 12.2 kb band) were neglected (those clones are marked by an x in
fig. 26 C). Possibly correct clones were stabilized by transforming them into XL10-Gold
bacteria; DNA was then mini prepared (Fig. 27 A).
0
10
20
30
40
50
60
70
80
90
0 50 100 150
A2
dom
ain
gene
ratio
n (%
)
Time (seconds)
BDD
394

78
Figure 26: Cloning of pBac-AAV2-Ad5. (A) Linearization of the shuttle plasmid pBac-AAV2-Ad5LR (∼8.7 kb). (B) pAdEasy-1 (∼34 kb). (C) Mini prepared clones picked from the electroporation plates. Lanes labeled with x stands for wrong clones (don’t have the expected size). L3: 1kb DNA ladder (0.5 – 10 kb; New England Biolabs); M: DNA molecular weight marker X (0.07 – 12.2 kb; Roche). Clones with correct size (clones 1,2,4,5and 6 in Fig. 27 A) were further characterized by
restriction analysis and DNA sequencing of the adenoviral construct borders. Digestion with
SmaI (which should give the following fragments: 6447, 11, 195 [5'-ITR], 2463, 6480, 1398,
4456, 1455, 3540, 3386, 230, 652, 2278, 2262, 550 [3'-ITR] and 11 bp) confirmed the
presence of the Ad5 genome insert, however showed a deletion in the 3’ITR region.
Normally, SmaI should cut twice in each ITR region, however the loss of its cut sites in the
3’ITR (positions 34153 and 34164 in the pBac-AAV2-Ad5 genome) resulted in joining the
fragments 6447,550 and 11 bp in one band: 7008 bp (Fig. 27 B).
Figure 27: Characterization of pBac-AAV2-Ad5. (A) DNA mini preparation of selected clones after transforming
the possible correct pBac-AAV2-Ad5 clones into XL10-Gold bacteria. (B) SmaI map of pBac- AAV2-Ad5 clones that
shows the absence of 6447, 550 and 11 bp fragments and the presence of a 7 kb band instead. M: DNA molecular
weight marker X (0.07 – 12.2 kb; Roche). L2: Gene Ruler 1kb DNA ladder (0.25 – 10 kb; Fermentas).
67
Figure 26: Cloning of pBac-AAV2-Ad5. (A) Linearization of the shuttle plasmid pBac-AAV2-Ad5LR (!8.7
kb). (B) pAdEasy-1 (!34 kb). (C) Mini prepared clones picked from the electroporation plates. Lanes labeled
with x stands for wrong clones (don’t have the expected size). L3: 1kb DNA ladder (0.5 – 10 kb; New England
Biolabs); M: DNA molecular weight marker X (0.07 – 12.2 kb; Roche).
Clones with correct size (clones 1,2,4,5and 6 in Fig. 27 A) were further characterized by
restriction analysis and DNA sequencing of the adenoviral construct borders. Digestion with
SmaI (which should give the following fragments: 6447, 11, 195 [5'-ITR], 2463, 6480, 1398,
4456, 1455, 3540, 3386, 230, 652, 2278, 2262, 550 [3'-ITR] and 11 bp) confirmed the
presence of the Ad5 genome insert, however showed a deletion in the 3’ITR region.
Normally, SmaI should cut twice in each ITR region, however the loss of its cut sites in the
3’ITR (positions 34153 and 34164 in the pBac-AAV2-Ad5 genome) resulted in joining the
fragments 6447,550 and 11 bp in one band: 7008 bp (Fig. 27 B).
Figure 27: Characterization of pBac-AAV2-Ad5. (A) DNA mini preparation of selected clones after
transforming the possible correct pBac-AAV2-Ad5 clones into XL10-Gold bacteria. (B) SmaI map of pBac-
AAV2-Ad5 clones that shows the absence of 6447, 550 and 11 bp fragments and the presence of a 7 kb band
instead. M: DNA molecular weight marker X (0.07 – 12.2 kb; Roche). L2: Gene Ruler 1kb DNA ladder (0.25 –
10 kb; Fermentas). 67
Figure 26: Cloning of pBac-AAV2-Ad5. (A) Linearization of the shuttle plasmid pBac-AAV2-Ad5LR (!8.7
kb). (B) pAdEasy-1 (!34 kb). (C) Mini prepared clones picked from the electroporation plates. Lanes labeled
with x stands for wrong clones (don’t have the expected size). L3: 1kb DNA ladder (0.5 – 10 kb; New England
Biolabs); M: DNA molecular weight marker X (0.07 – 12.2 kb; Roche).
Clones with correct size (clones 1,2,4,5and 6 in Fig. 27 A) were further characterized by
restriction analysis and DNA sequencing of the adenoviral construct borders. Digestion with
SmaI (which should give the following fragments: 6447, 11, 195 [5'-ITR], 2463, 6480, 1398,
4456, 1455, 3540, 3386, 230, 652, 2278, 2262, 550 [3'-ITR] and 11 bp) confirmed the
presence of the Ad5 genome insert, however showed a deletion in the 3’ITR region.
Normally, SmaI should cut twice in each ITR region, however the loss of its cut sites in the
3’ITR (positions 34153 and 34164 in the pBac-AAV2-Ad5 genome) resulted in joining the
fragments 6447,550 and 11 bp in one band: 7008 bp (Fig. 27 B).
Figure 27: Characterization of pBac-AAV2-Ad5. (A) DNA mini preparation of selected clones after
transforming the possible correct pBac-AAV2-Ad5 clones into XL10-Gold bacteria. (B) SmaI map of pBac-
AAV2-Ad5 clones that shows the absence of 6447, 550 and 11 bp fragments and the presence of a 7 kb band
instead. M: DNA molecular weight marker X (0.07 – 12.2 kb; Roche). L2: Gene Ruler 1kb DNA ladder (0.25 –
10 kb; Fermentas).

79
DNA sequencing across the 5’ITR region (using the primer Ad5-4231a, see section 2.2.10)
revealed an intact 5’ITR. DNA sequencing across the 3’ITR region using the primer Ad5-
35687s confirmed a 3’ITR deletion from nt 34120 until 34249 (Fig. 28).
pBac-EGFP and pBac-AAV2-Rep were constructed according to the cloning strategy outlined
in section 2.2.10. Expression of the AAV2-Rep gene was tested in both Sf9 and 293T cells.
SF9 cells were transfected with pBac-AAV2-Rep for 48 hours and total RNA was then
extracted (see section 2.2.2 and 2.2.10). Total RNA was subject for RT PCR using
Superscript III reverse transcriptase. Taq-PCR was performed using the primer pairs AAV2-
2310a / AAV2-1380s and AAV2-2310a / AAV2-321s. Both gave the expected PCR product
of 1.0 kb and 2.0 kb, respectively (Fig. 29 lanes 2 &3 and 5 & 6). 293T cells were transfected
with pBac-AAV2-Rep and pDG (as a positive control for Rep gene expression) plasmids for
48 hours and total RNA was then extracted (see section 2.2.2 and 2.2.10). Again, total RNA
was subjected for RT PCR using the primer pairs AAV2-2310a / AAV2-1380s and AAV2-
2310a / AAV2-321s. Both gave the expected product of 1.0 kb and 2.0 kb, respectively (Fig.
29 lanes 8 & 9 for pDG and 10 & 11 for pBac-AAV2-Rep using the first primer pair and
lanes 13 & 14 for pDG and 15 & 16 for pBac-AAV2-Rep using the second primer pair).
Figure 28: DNA sequence of pBac-AAV2-Ad5 3’ITR region. The white arrow indicates the deletion place
where the pBac-AAV2-Ad5 sequence stopped at position 34121 and continued at position 34250.
68
DNA sequencing across the 5’ITR region (using the primer Ad5-4231a, see section 2.2.10)
revealed an intact 5’ITR. DNA sequencing across the 3’ITR region using the primer Ad5-
35687s confirmed a 3’ITR deletion from nt 34120 until 34249 (Fig. 28).
pBac-EGFP and pBac-AAV2-Rep were constructed according to the cloning strategy outlined
in section 2.2.10. Expression of the AAV2-Rep gene was tested in both Sf9 and 293T cells.
SF9 cells were transfected with pBac-AAV2-Rep for 48 hours and total RNA was then
extracted (see section 2.2.2 and 2.2.10). Total RNA was subject for RT PCR using
Superscript III reverse transcriptase. Taq-PCR was performed using the primer pairs AAV2-
2310a / AAV2-1380s and AAV2-2310a / AAV2-321s. Both gave the expected PCR product
of 1.0 kb and 2.0 kb, respectively (Fig. 29 lanes 2 &3 and 5 & 6). 293T cells were transfected
with pBac-AAV2-Rep and pDG (as a positive control for Rep gene expression) plasmids for
48 hours and total RNA was then extracted (see section 2.2.2 and 2.2.10). Again, total RNA
was subjected for RT PCR using the primer pairs AAV2-2310a / AAV2-1380s and AAV2-
2310a / AAV2-321s. Both gave the expected product of 1.0 kb and 2.0 kb, respectively (Fig.
29 lanes 8 & 9 for pDG and 10 & 11 for pBac-AAV2-Rep using the first primer pair and
lanes 13 & 14 for pDG and 15 & 16 for pBac-AAV2-Rep using the second primer pair).
Figure 28: DNA sequence of pBac-AAV2-Ad5 3’ITR region. The white arrow indicates the deletion place
where the pBac-AAV2-Ad5 sequence stopped at position 34121 and continued at position 34250.

80
Figure 29: Testing the expression of the AAV2-Rep gene in SF9 and 293T cells. RT-PCR for Rep expression
in SF9 cells (lanes 1 to 6) and in 293T cells (lanes 7 to 16). Lanes 1,4,7 and 12 are negative controls. M: DNA
molecular weight marker X (0.07 – 12.2 kb; Roche).
3.2.2 Generation of the bacmid bBac-AAV2-Ad5
Recombinant bacmids were generated by site-specific transposition in DH10Bac cells that
contain the baculovirus shuttle vector (bacmid). The plasmids pBac-AAV2-Ad5, pBac-EGFP
and pBac-MMTV-bGH-AAVRep served as shuttle vectors to generate the recombinant
bacmids bBac-AAV2-Ad5, bBac-EGFP and bBac-AAV2-Rep respectively in DH10Bac cells
according to the protocol detailed in section 2.2.10.
Recombinant bacmid DNA was isolated according to Bac-to-Bac Baculovirus Expression
System manual (section 2.2.1). Figure 30 A shows six selected bBac-AAV2-Ad5 clones.
Those clones were characterized by Taq-PCR analysis. When we amplified them with M13
forward and reverse primers (which cover all the insert region), no product could be seen
(Fig. 30 B) which reflects the presence of our expected very large insert within the bacmid
DNA. After amplifying them with M13 forward / Ad5-4231a primers we could see a ∼3.1 kb
product (Fig. 30 D left) which confirms the presence of the 5’ITR end. The amplification of
the 3’ITR-end (primers Ad5-35687s / M13 reverse) resulted in a ∼1.55 kb product (Fig. 30 D
right) which confirms the presence of the 3’ITR end. Figure 32 C shows an example of empty
bacmids where amplification by M13 forward and reverse primers resulted in a 273 bp
product. bBac-EGFP was used as a positive control for M13 forward and reverse
amplifications (marked P; Fig. 30 B and C) and resulted in a product of ∼ 3.6 kb.
69
Figure 29: Testing the expression of the AAV2-Rep gene in SF9 and 293T cells. RT-PCR for Rep expression
in SF9 cells (lanes 1 to 6) and in 293T cells (lanes 7 to 16). Lanes 1,4,7 and 12 are negative controls. M: DNA
molecular weight marker X (0.07 – 12.2 kb; Roche).
3.2.2 Generation of the bacmid bBac-AAV2-Ad5
Recombinant bacmids were generated by site-specific transposition in DH10Bac cells that
contain the baculovirus shuttle vector (bacmid). The plasmids pBac-AAV2-Ad5, pBac-EGFP
and pBac-MMTV-bGH-AAVRep served as shuttle vectors to generate the recombinant
bacmids bBac-AAV2-Ad5, bBac-EGFP and bBac-AAV2-Rep respectively in DH10Bac cells
according to the protocol detailed in section 2.2.10.
Recombinant bacmid DNA was isolated according to Bac-to-Bac Baculovirus Expression
System manual (section 2.2.1). Figure 30 A shows six selected bBac-AAV2-Ad5 clones.
Those clones were characterized by Taq-PCR analysis. When we amplified them with M13
forward and reverse primers (which cover all the insert region), no product could be seen
(Fig. 30 B) which reflects the presence of our expected very large insert within the bacmid
DNA. After amplifying them with M13 forward / Ad5-4231a primers we could see a !3.1 kb
product (Fig. 30 D left) which confirms the presence of the 5’ITR end. The amplification of
the 3’ITR-end (primers Ad5-35687s / M13 reverse) resulted in a !1.55 kb product (Fig. 30 D
right) which confirms the presence of the 3’ITR end. Figure 32 C shows an example of empty
bacmids where amplification by M13 forward and reverse primers resulted in a 273 bp
product. bBac-EGFP was used as a positive control for M13 forward and reverse
amplifications (marked P; Fig. 30 B and C) and resulted in a product of ! 3.6 kb.

81
Figure 30: Characterization of bBac-AAV2-Ad5 by Taq-PCR. (A) Isolated bacmid DNA from a selected
bBac-AAV2-Ad5 clones. Those clones were characterized by Taq-PCR using M13 forward and reverse primers
(Image B), M13 forward / Ad5-4231a primers (Image D left) and Ad5-35687s / M13 reverse primers (Image D
right). (C) Is an example of empty bacmids. P: bBac-EGFP as a positive control for M13 forward and reverse
amplifications. L3: 1kb DNA ladder (0.5 – 10 kb; New England Biolabs); M: DNA molecular weight marker X
(0.07 – 12.2 kb; Roche).
bBac-AAV2-Rep was also characterized by Taq-PCR. Amplifying 10 selected clones by M13
forward and reverse primers resulted in a 5.3 kb PCR product in clones 1,2,3,5,6,7,8 and 9
and a 273 bp PCR product in clones 4 and 10 (Fig. 31 A). While the 5.3 kb product confirms
the existence of an MMTV(promoter)-AAVRep insert in the bacmid DNA, the 273 bp
product indicates empty clones. To further confirm the presence and the integrity of the
MMTV(promoter)-AAVRep insert, the 5’-end of the insert were amplified with M13 forward
/ MMTV-1347a primers and the 3’-end were amplified with AAV2-321s / M13 reverse
primers. Both resulted in the expected 2.3 kb and 2.8 kb PCR products in the same positive
clones respectively (Fig. 31 B & C).
70
Figure 30: Characterization of bBac-AAV2-Ad5 by Taq-PCR. (A) Isolated bacmid DNA from a selected
bBac-AAV2-Ad5 clones. Those clones were characterized by Taq-PCR using M13 forward and reverse primers
(Image B), M13 forward / Ad5-4231a primers (Image D left) and Ad5-35687s / M13 reverse primers (Image D
right). (C) Is an example of empty bacmids. P: bBac-EGFP as a positive control for M13 forward and reverse
amplifications. L3: 1kb DNA ladder (0.5 – 10 kb; New England Biolabs); M: DNA molecular weight marker X
(0.07 – 12.2 kb; Roche).
bBac-AAV2-Rep was also characterized by Taq-PCR. Amplifying 10 selected clones by M13
forward and reverse primers resulted in a 5.3 kb PCR product in clones 1,2,3,5,6,7,8 and 9
and a 273 bp PCR product in clones 4 and 10 (Fig. 31 A). While the 5.3 kb product confirms
the existence of an MMTV(promoter)-AAVRep insert in the bacmid DNA, the 273 bp
product indicates empty clones. To further confirm the presence and the integrity of the
MMTV(promoter)-AAVRep insert, the 5’-end of the insert were amplified with M13 forward
/ MMTV-1347a primers and the 3’-end were amplified with AAV2-321s / M13 reverse
primers. Both resulted in the expected 2.3 kb and 2.8 kb PCR products in the same positive
clones respectively (Fig. 31 B & C).

82
Figure 31: Characterization of bBac-AAV2-Rep by Taq-PCR. Ten isolated bBac-AAV2-Rep clones were
characterized by Taq-PCR using M13 forward and reverse primers (Image A), M13 forward / MMTV-1347a
primers (Image B) and AAV2-321s / M13 reverse primers (Image C). L1: Gene Ruler DNA ladder mix (0.1 – 10
kb; Fermantas).
3.2.3 Generation of helper recombinant baculovirus in insect cells
3.2.3.1 Transfection of SF9 cells with bacmid DNA and collection of P1 viral stock
SF9 cells (Fig. 32 A) were seeded at 9 * 105 cells per well in 6 well plates. After attachment,
they were transfected with 1.0 µg purified bacmid DNA (bBac-AAV2-Ad5 and/or bBac-
AAV2-Rep) according to section II.3.4.1. Two days after transfection, SF9 cells showed an
increase in cellular diameter. Three days after transfection, SF9 cells showed a cessation of
growth, cellular swelling and granular appearance which indicates viral budding (Fig. 32 B,
C). One day later, cells show massive detachment and lysis.
Medium were collected on the fourth day after transfection in sterile tubes, centrifuged and
the clarified supernatant containing the virus was then transferred into a fresh tube and labeled
as P1 viral stock for vBac-AAV2-Ad5 as well as for vBac-AAV2-Rep.
71
Figure 31: Characterization of bBac-AAV2-Rep by Taq-PCR. Ten isolated bBac-AAV2-Rep clones were
characterized by Taq-PCR using M13 forward and reverse primers (Image A), M13 forward / MMTV-1347a
primers (Image B) and AAV2-321s / M13 reverse primers (Image C). L1: Gene Ruler DNA ladder mix (0.1 – 10
kb; Fermantas).
3.2.3 Generation of helper recombinant baculovirus in insect cells
3.2.3.1 Transfection of SF9 cells with bacmid DNA and collection of P1 viral stock
SF9 cells (Fig. 32 A) were seeded at 9 * 105 cells per well in 6 well plates. After attachment,
they were transfected with 1.0 !g purified bacmid DNA (bBac-AAV2-Ad5 and/or bBac-
AAV2-Rep) according to section II.3.4.1. Two days after transfection, SF9 cells showed an
increase in cellular diameter. Three days after transfection, SF9 cells showed a cessation of
growth, cellular swelling and granular appearance which indicates viral budding (Fig. 32 B,
C). One day later, cells show massive detachment and lysis.
Medium were collected on the fourth day after transfection in sterile tubes, centrifuged and
the clarified supernatant containing the virus was then transferred into a fresh tube and labeled
as P1 viral stock for vBac-AAV2-Ad5 as well as for vBac-AAV2-Rep.

83
Figure 32: Transfection of SF9 cells: (A) confluent wild type SF9 culture (10x magnification). (B) SF9 cells
three days after transfection with bBac-AAV2-Ad5 (10x magnification). The cells show cellular swelling and
granular appearance. (C) A 20x magnification of a part of foto (B) where arrows indicate cells with granulation
due to viral budding.
3.2.3.2 Amplification of P1 viral stock
To obtain a higher titer ranging from 1 * 107 to 1 * 108 pfu/ml, P1 viral stock was amplified in
SF9 cells. 0.04 ml P1 viral inoculum were used to infect SF9 cells seeded at 2 * 106 cells per
well in 6-well plates. Two days after infection, SF9 cells showed all the signs of infection
(Increased cell diameter, cessation of growth, granular appearance, detachment and cell lysis).
Medium containing the virus was collected, pelleted and the clarified supernatant was
transferred into a fresh tube labeled P2 viral stock.
3.2.3.3 Viral purification: Plaque assay
Clarified baculoviral stock P2 (from vBac-AAV2-Ad5 and vBac-AAV2-Rep) was diluted to
an 8-log serial dilution and 1.0 ml inoculum was used to infect wild type SF9 cells seeded at 1
* 106 cells per well in 6-well plates for one hour (see section 2.3.4.3). The medium was then
replaced by a plaquing medium and plates were incubated until plaques formation.
72
Figure 32: Transfection of SF9 cells: (A) confluent wild type SF9 culture (10x magnification). (B) SF9 cells
three days after transfection with bBac-AAV2-Ad5 (10x magnification). The cells show cellular swelling and
granular appearance. (C) A 20x magnification of a part of foto (B) where arrows indicate cells with granulation
due to viral budding.
3.2.3.2 Amplification of P1 viral stock
To obtain a higher titer ranging from 1 * 107 to 1 * 108 pfu/ml, P1 viral stock was amplified in
SF9 cells. 0.04 ml P1 viral inoculum were used to infect SF9 cells seeded at 2 * 106 cells per
well in 6-well plates. Two days after infection, SF9 cells showed all the signs of infection
(Increased cell diameter, cessation of growth, granular appearance, detachment and cell lysis).
Medium containing the virus was collected, pelleted and the clarified supernatant was
transferred into a fresh tube labeled P2 viral stock.
3.2.3.3 Viral purification: Plaque assay
Clarified baculoviral stock P2 (from vBac-AAV2-Ad5 and vBac-AAV2-Rep) was diluted to
an 8-log serial dilution and 1.0 ml inoculum was used to infect wild type SF9 cells seeded at 1
* 106 cells per well in 6-well plates for one hour (see section 2.3.4.3). The medium was then
replaced by a plaquing medium and plates were incubated until plaques formation.

84
Ten days later, plaques were visible at all viral dilutions wells (Fig. 33) and countable only at
the highest dilution (10-8). Infection with vBac-AAV2-Ad5 P2 viral stock resulted in the
appearance of 50 plaques at 10-8 dilution, which reflects a viral titer of 5 * 109 pfu/ml.
Infection with vBac-AAV2-Rep P2 viral stock resulted in the appearance of 40 plaques at 10-8
dilution, which reflects a viral titer of 4 * 109 pfu/ml. The titer of the viral stock was then
calculated according to the following formula:
1 Titer (pfu/ml) = number of plaques * dilution factor * ........................... ml of inoculum / well
Figure 33: Palques of vBac-AAV2-Ad5 in SF9 cells. (A) 10 days after infection with vBac-AAV2-Ad5 (10x
magnification). (B) Is a 20x magnification of the plaque in photo A.
A viral stock from single viral clones was generated by plaque purification. Clear well
separated plaques were picked (20 plaques for vBac-AAV2-Ad5 and 10 for vBac-AAV2-
Rep) and each agarose plug was transferred separately into 500 µl Grace’s medium, mixed
and used to infect one well of SF9 cells seeded at 1 * 106 cells per well in 6-well plates. Three
days later, the plaque purified viral stock was collected and then amplified according to
section 2.3.4.2.
3.2.3.4 PCR analysis of the purified virus
Purified viral DNA was extracted from the purified amplified viral stock using the extra
chromosomal DNA isolation protocol (see section 2.2.1). Two viral DNA clones (originating
from two different plaques) from vBac-AAV2-Ad5 as well as from vBac-AAV2-Rep were
verified by Taq-PCR.
73
Ten days later, plaques were visible at all viral dilutions wells (Fig. 33) and countable only at
the highest dilution (10-8). Infection with vBac-AAV2-Ad5 P2 viral stock resulted in the
appearance of 50 plaques at 10-8 dilution, which reflects a viral titer of 5 * 109 pfu/ml.
Infection with vBac-AAV2-Rep P2 viral stock resulted in the appearance of 40 plaques at 10-8
dilution, which reflects a viral titer of 4 * 109 pfu/ml. The titer of the viral stock was then
calculated according to the following formula:
1 Titer (pfu/ml) = number of plaques * dilution factor * ……………………… ml of inoculum / well
Figure 33: Palques of vBac-AAV2-Ad5 in SF9 cells. (A) 10 days after infection with vBac-AAV2-Ad5 (10x
magnification). (B) Is a 20x magnification of the plaque in photo A.
A viral stock from single viral clones was generated by plaque purification. Clear well
separated plaques were picked (20 plaques for vBac-AAV2-Ad5 and 10 for vBac-AAV2-
Rep) and each agarose plug was transferred separately into 500 !l Grace’s medium, mixed
and used to infect one well of SF9 cells seeded at 1 * 106 cells per well in 6-well plates. Three
days later, the plaque purified viral stock was collected and then amplified according to
section 2.3.4.2.
3.2.3.4 PCR analysis of the purified virus
Purified viral DNA was extracted from the purified amplified viral stock using the extra
chromosomal DNA isolation protocol (see section 2.2.1). Two viral DNA clones (originating
from two different plaques) from vBac-AAV2-Ad5 as well as from vBac-AAV2-Rep were
verified by Taq-PCR.
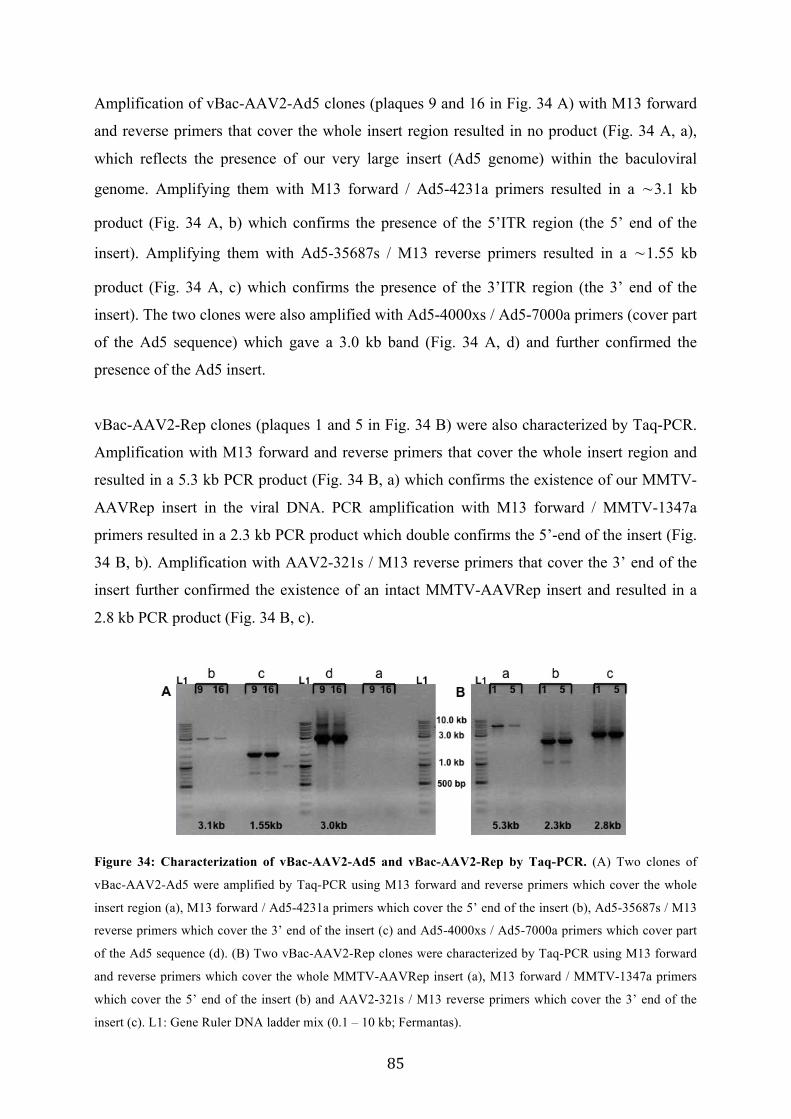
85
Amplification of vBac-AAV2-Ad5 clones (plaques 9 and 16 in Fig. 34 A) with M13 forward
and reverse primers that cover the whole insert region resulted in no product (Fig. 34 A, a),
which reflects the presence of our very large insert (Ad5 genome) within the baculoviral
genome. Amplifying them with M13 forward / Ad5-4231a primers resulted in a ∼3.1 kb
product (Fig. 34 A, b) which confirms the presence of the 5’ITR region (the 5’ end of the
insert). Amplifying them with Ad5-35687s / M13 reverse primers resulted in a ∼1.55 kb
product (Fig. 34 A, c) which confirms the presence of the 3’ITR region (the 3’ end of the
insert). The two clones were also amplified with Ad5-4000xs / Ad5-7000a primers (cover part
of the Ad5 sequence) which gave a 3.0 kb band (Fig. 34 A, d) and further confirmed the
presence of the Ad5 insert.
vBac-AAV2-Rep clones (plaques 1 and 5 in Fig. 34 B) were also characterized by Taq-PCR.
Amplification with M13 forward and reverse primers that cover the whole insert region and
resulted in a 5.3 kb PCR product (Fig. 34 B, a) which confirms the existence of our MMTV-
AAVRep insert in the viral DNA. PCR amplification with M13 forward / MMTV-1347a
primers resulted in a 2.3 kb PCR product which double confirms the 5’-end of the insert (Fig.
34 B, b). Amplification with AAV2-321s / M13 reverse primers that cover the 3’ end of the
insert further confirmed the existence of an intact MMTV-AAVRep insert and resulted in a
2.8 kb PCR product (Fig. 34 B, c).
Figure 34: Characterization of vBac-AAV2-Ad5 and vBac-AAV2-Rep by Taq-PCR. (A) Two clones of
vBac-AAV2-Ad5 were amplified by Taq-PCR using M13 forward and reverse primers which cover the whole
insert region (a), M13 forward / Ad5-4231a primers which cover the 5’ end of the insert (b), Ad5-35687s / M13
reverse primers which cover the 3’ end of the insert (c) and Ad5-4000xs / Ad5-7000a primers which cover part
of the Ad5 sequence (d). (B) Two vBac-AAV2-Rep clones were characterized by Taq-PCR using M13 forward
and reverse primers which cover the whole MMTV-AAVRep insert (a), M13 forward / MMTV-1347a primers
which cover the 5’ end of the insert (b) and AAV2-321s / M13 reverse primers which cover the 3’ end of the
insert (c). L1: Gene Ruler DNA ladder mix (0.1 – 10 kb; Fermantas). 74
Amplification of vBac-AAV2-Ad5 clones (plaques 9 and 16 in Fig. 34 A) with M13 forward
and reverse primers that cover the whole insert region resulted in no product (Fig. 34 A, a),
which reflects the presence of our very large insert (Ad5 genome) within the baculoviral
genome. Amplifying them with M13 forward / Ad5-4231a primers resulted in a !3.1 kb
product (Fig. 34 A, b) which confirms the presence of the 5’ITR region (the 5’ end of the
insert). Amplifying them with Ad5-35687s / M13 reverse primers resulted in a !1.55 kb
product (Fig. 34 A, c) which confirms the presence of the 3’ITR region (the 3’ end of the
insert). The two clones were also amplified with Ad5-4000xs / Ad5-7000a primers (cover part
of the Ad5 sequence) which gave a 3.0 kb band (Fig. 34 A, d) and further confirmed the
presence of the Ad5 insert.
vBac-AAV2-Rep clones (plaques 1 and 5 in Fig. 34 B) were also characterized by Taq-PCR.
Amplification with M13 forward and reverse primers that cover the whole insert region and
resulted in a 5.3 kb PCR product (Fig. 34 B, a) which confirms the existence of our MMTV-
AAVRep insert in the viral DNA. PCR amplification with M13 forward / MMTV-1347a
primers resulted in a 2.3 kb PCR product which double confirms the 5’-end of the insert (Fig.
34 B, b). Amplification with AAV2-321s / M13 reverse primers that cover the 3’ end of the
insert further confirmed the existence of an intact MMTV-AAVRep insert and resulted in a
2.8 kb PCR product (Fig. 34 B, c).
Figure 34: Characterization of vBac-AAV2-Ad5 and vBac-AAV2-Rep by Taq-PCR. (A) Two clones of
vBac-AAV2-Ad5 were amplified by Taq-PCR using M13 forward and reverse primers which cover the whole
insert region (a), M13 forward / Ad5-4231a primers which cover the 5’ end of the insert (b), Ad5-35687s / M13
reverse primers which cover the 3’ end of the insert (c) and Ad5-4000xs / Ad5-7000a primers which cover part
of the Ad5 sequence (d). (B) Two vBac-AAV2-Rep clones were characterized by Taq-PCR using M13 forward
and reverse primers which cover the whole MMTV-AAVRep insert (a), M13 forward / MMTV-1347a primers
which cover the 5’ end of the insert (b) and AAV2-321s / M13 reverse primers which cover the 3’ end of the
insert (c). L1: Gene Ruler DNA ladder mix (0.1 – 10 kb; Fermantas).

86
3.2.4 Rescuing the helper dependent adenovirus in HEK 293T cells
The ability of the baculovirus to infect HEK 293 was tested. Confluent HEK 293 cells were
infected with 200 µl vBac-EGFP P2 viral stock once for one hour at 37 °C and once for four
hours at 28 °C (see infection protocol, section 2.3.5). One day after infection, cultures were
observed under UV light and found to be efficiently infected in both conditions as can be seen
by GFP fluorescence (Fig. 35).
HEK 293 cells were transfected at 90% confluence with a linearized mini-Ad5 helper
dependent vector (pAd5-AAT-hf8), which contains the human factor VIII cDNA, by
lipofection in 6-well plates. Cells were then infected with vBac-AV2-Ad5 clones at 2000 and
500 MOI in combination with vBac-AAV2-Rep particles at 200 MOI as detailed in table 8.
One well was infected only with vBac-AAV2-Rep as a negative control for infection.
Infection mixtures were incubated with cells for 5 hours and medium was changed then.
Figure 35: The ability of the baculovirus to infect HEK 293 cells. A: HEK 293 cells infected with vBac-
EGFP for one hour at 37 °C. B: HEK 293 cells infected with vBac-EGFP for four hours at 28 °C.
Four days after infection (five days after transfection), medium was collected and cells were
washed with PBS and lysed by four rouds of freeze / thaw cycles. Medium was concentrated
10 times, assayed for FVIII: Ag and showed no FVIII antigen in all wells. Extra chromosomal
DNA was isolated from cellular lysates according to section 2.2.1. Gel elctrophoresis of 2 µl
of the extracted extra chromosomal DNA showed a fragment representing the size of a
linearized mini-Ad5 helper dependent vector in all the wells (Fig. 36, lanes marked a).
75
3.2.4 Rescuing the helper dependent adenovirus in HEK 293T cells
The ability of the baculovirus to infect HEK 293 was tested. Confluent HEK 293 cells were
infected with 200 !l vBac-EGFP P2 viral stock once for one hour at 37 °C and once for four
hours at 28 °C (see infection protocol, section 2.3.5). One day after infection, cultures were
observed under UV light and found to be efficiently infected in both conditions as can be seen
by GFP fluorescence (Fig. 35).
HEK 293 cells were transfected at 90% confluence with a linearized mini-Ad5 helper
dependent vector (pAd5-AAT-hf8), which contains the human factor VIII cDNA, by
lipofection in 6-well plates. Cells were then infected with vBac-AV2-Ad5 clones at 2000 and
500 MOI in combination with vBac-AAV2-Rep particles at 200 MOI as detailed in table 8.
One well was infected only with vBac-AAV2-Rep as a negative control for infection.
Infection mixtures were incubated with cells for 5 hours and medium was changed then.
Figure 35: The ability of the baculovirus to infect HEK 293 cells. A: HEK 293 cells infected with vBac-
EGFP for one hour at 37 °C. B: HEK 293 cells infected with vBac-EGFP for four hours at 28 °C.
Four days after infection (five days after transfection), medium was collected and cells were
washed with PBS and lysed by four rouds of freeze / thaw cycles. Medium was concentrated
10 times, assayed for FVIII: Ag and showed no FVIII antigen in all wells. Extra chromosomal
DNA was isolated from cellular lysates according to section 2.2.1. Gel elctrophoresis of 2 !l
of the extracted extra chromosomal DNA showed a fragment representing the size of a
linearized mini-Ad5 helper dependent vector in all the wells (Fig. 36, lanes marked a).

87
To decide whether the extracted extra chromosomal DNA resulted from the original
introduced plasmid or has been produced inside HEK 293 cells under the support of our
helper hybrid virus, the extra chromosomal DNA was digested with DpnI. Gel electrophoresis
of 10 µl DpnI digested DNA showed the disappearance of the extra chromosomal DNA
fragment (Fig. 36, lanes marked b). Cellular lysates were used for a second round of infection
(according to section 2.3.5). No signs of viral production were seen over four days. Cells were
then lysed and lysates were used for extra chromosomal DNA isolation. DpnI digestion
showed the same result. Lysates (from the second round of infection) were used for a third
round of infection that showed the same result.
The disappearance (digestion) of the extra chromosomal DNA after DpnI digestion indicates
that it was all from bacterial origin and our designed helper hybrid virus (vBac-AAV2-Ad5 in
combination with vBac-AAV2-Rep) could not support an in vivo production of the helper
dependent vector.
Figure 36: DpnI digestion of extra chromosomal DNA. Extra chromosomal DNA was isolated from cellular
lysates (lanes marked a) representing different infection wells (wells 3à8 according to table 8). DpnI digestion
showed no product indicating totally degraded material (lanes b). L2: Gene Ruler 1kb DNA ladder (0.25 – 10
kb; Fermantas).
76
To decide whether the extracted extra chromosomal DNA resulted from the original
introduced plasmid or has been produced inside HEK 293 cells under the support of our
helper hybrid virus, the extra chromosomal DNA was digested with DpnI. Gel electrophoresis
of 10 !l DpnI digested DNA showed the disappearance of the extra chromosomal DNA
fragment (Fig. 36, lanes marked b). Cellular lysates were used for a second round of infection
(according to section 2.3.5). No signs of viral production were seen over four days. Cells were
then lysed and lysates were used for extra chromosomal DNA isolation. DpnI digestion
showed the same result. Lysates (from the second round of infection) were used for a third
round of infection that showed the same result.
The disappearance (digestion) of the extra chromosomal DNA after DpnI digestion indicates
that it was all from bacterial origin and our designed helper hybrid virus (vBac-AAV2-Ad5 in
combination with vBac-AAV2-Rep) could not support an in vivo production of the helper
dependent vector.
Figure 36: DpnI digestion of extra chromosomal DNA. Extra chromosomal DNA was isolated from cellular
lysates (lanes marked a) representing different infection wells (wells 3!8 according to table 8). DpnI digestion
showed no product indicating totally degraded material (lanes b). L2: Gene Ruler 1kb DNA ladder (0.25 – 10 kb;
Fermantas).

88
4. Discussion:
4.1 Functional studies on factor VIII protein variants containing different lengths of the
B-domain
Haemophilia A is an X-linked hereditary deficiency of functional coagulation factor VIII
(FVIII). In the absence of treatment, patients with severe haemophilia A (plasma levels of
FVIII below 1% of normal) will suffer repeated bleeds, often in muscles and joints. To
prevent this development, patients with severe haemophilia A are treated with recombinant or
plasma-derived FVIII concentrates (Christiansen et al., 2010). Recombinant FVIII has
become the preferred form of factor replacement for hemophilia A patients as it eliminates the
risk of transmission of human blood-borne infections (Rogoff et al., 2002; Key and Negrier,
2007). Current developments in rFVIII technology have enabled the production of rFVIII
devoid of any human protein exposure during the cell culture fermenting process and in final
formulation (Mitterer et al., 2003).
Two forms of recombinant FVIII are currently manufactured: full-length recombinant FVIII
(FL-rFVIII) and B-domain-deleted recombinant FVIII (BDD-rFVIII). While BDD-rFVIII is
effectively used in the treatment of haemophilia A patients, recent experimental and clinical
studies revealed a number of issues related to its equivalency to pd-FVIII (Gruppo et al.,
2003; Lollar 2003; Mikaelsson et al., 2001). In particular, it was shown that the activity of
BDD-rFVIII determined by one-stage clotting assay is up to 50% lower than that determined
by chromogenic assay, thus complicating determination of BDD-rFVIII activity in
haemophilia A patient’s blood (Barrowcliffe et al., 2002). The meta-analysis of the data
accumulated during long-term clinical usage of BDD-rFVIII revealed its lower efficiency in
prophylaxis, giving a higher incidence of bleeding in comparison with full-length FVIII
(Gruppo et al., 2003 and 2004).
In this study, we evaluated the importance and the effect of the B domain region on FVIII
expression and function by constructing factor VIII expression plasmids containing different
lengths of the B domain. Those plasmids were expressed in mammalian cells and expression
results were compared to the expression of a B-domain deleted factor VIII plasmid. For
transient expression, three mammalian cell lines were transfected with the different
constructs. For stable expression, we used CHO-DHFR[-] cell line. FVIII activity was

89
assessed in culture medium and FVIII antigen was assessed in culture medium and cellular
lysates. FVIII proteins were purified from the produced cell lines that stably express FVIII.
As the B domain comprises approximately 40% of the FVIII molecule and is located within
the FVIII gene (exon 14), a complex cloning strategy was adopted in constructing those
plasmids. The pMT2-FVIII vector containing the full length FVIII cDNA was used as a
starting material. This vector contains a strong mammalian expression cassette and a gene for
selection and amplification (DHFR). To construct the various expression plasmids, pMT2-
FVIII was digested with RE to remove a large fragment within the FVIII cDNA representing
part of the heavy chain, all the B domain and part of the light chain (from nt 1695 to nt 7302
in the vector which corresponds to aa 195 to 2064 in the protein). The end of the B domain
(aa 1634 to 1648) along with light chain part was then returned by a mutagenesis PCR to
create the intermediate vector pMT2-FVIII-SNA. Fragments starting from position 1695 (aa
195) and stopping at different serine positions in the B domain (aa 743, 844, 945, 1035 and
1137) were then amplified by a mutagenesis PCR using the pMT2-FVIII as template and
cloned into the intermediate vector pMT2-FVIII-SNA. With this cloning strategy we have
successfully constructed the expression plasmids: pMT2-F8-BDD, pMT2-F8-101, pMT2-F8-
202, pMT2-F8-292 and pMT2-F8-394 (see appendix). The correct cloning was then
confirmed by restriction enzyme analysis and DNA sequencing (Fig. 17 and 18).
To evaluate our tranfection method (Lipofection) and to select an optimal cell line to use for
the functional studies, we have transiently expressed the different plasmids in three
mammalian cell lines (HEK 293, COS-7 and CHO) and tested the level of FVIII expression in
two medium collections. Our data show that lipofection is an efficient method of transfection
as judged by the GFP expression of the pEGFP-C1 positive control plasmid that was
transfected along with the different B-domain deleted expression plasmids in the three cell
lines (Fig. 19). The CHO cell line, which has the shortest doubling time (24 hours) among the
tested cell lines (DSMZ), showed the lowest FVIII expression level (as controlled by clotting
assay FVIII: C). In both medium collections the average FVIII activity for the different
constructs ranged from 1.67 % to 4.27 % in the first medium collection and from 2.5 % to
7.27 % in the second medium collection. In contrast to the CHO cell line, HEK 293 and COS-
7 cell lines showed a higher expression level in the first medium collection compared to the
second collection, which meet the time required for their doubling (COS-7 doubles every 35-
48 hours and HEK 293 doubles every 24-30 hours; DSMZ). In the first medium collection,

90
the average activity of the different constructs ranged from 8.4 % to 46.73 % in HEK 293
cells and from 33.7 % to 56.33 % in COS-7 cells. In the second medium collection, the
average activity of the different constructs ranged from 4.47 % to 24.4 % in HEK 293 cells
and from 22.67 % to 44 % in COS-7 cells. Despite the fact that HEK 293 cells are of a human
origin, our data showed a lower FVIII expression level in this cell line compared to COS-7
cell line in both medium collections, which indicate that the FVIII B-domain variants
expressed more efficiently in COS-7 cells.
The COS-7 cell line, which showed the highest expression in terms of FVIII activity levels
among the three cell lines, was then used for the functional studies on those constructs. The
functionality was assessed by measuring the FVIII activity in culture medium using: (i) the
clotting and the chromogenic assays, (ii) measuring the antigen level in culture medium and
cellular lysates, (iii) calculating the specific activity and the total expressed protein of the
different constructs, and (iv) comparing generally the expression of the constructs containing
variable lengths of the B domain to the BDD construct. For this, COS-7 cells were transiently
transfected with the different B-domain deleted constructs and the culture medium and
cellular lysates was collected 48 hours after transfection.
FVIII: C was determined in standard FVIII one-stage clotting and two-stage chromogenic
assays, using a WHO FVIII standard as calibrator. The different constructs containing various
lengths of the B domain showed close values between the two assay methods (Fig. 21) with
the clotting assay showing slightly higher values, but there was no significant difference
between the two assays values for each construct. This can be seen from figure 37, presenting
the ratio between the FVIII: C values obtained in the one-stage clotting assay and the
chromogenic assay. In each case it was 1.0 approximately. In contrast to this, the BDD
construct showed higher FVIII activity value in the chromogenic assay in comparison to the
clotting assay (fig. 21 and fig. 37). The difference between both results was significant as
calculated by the student’s t-test (p < 0.05). This result confirms what was reported earlier in
literature regarding the BDD-rFVIII (Barrowcliffe et al., 2002; Mikaelsson et al., 2001).
From this data, we conclude that addition of even short parts of the B domain has a direct
effect on FVIII physiology as such additions eliminate the assay discrepancy. This knowledge
is important for the production of further recombinant FVIII concentrates, because until now,
the difference of one-stage and chromogenic assays in determining the FVIII: C within
patient’s plasma prevents a good, standardized clinical monitoring of hemophilia A patients

91
after substitution with BDD-FVIII.
Figure 37: Ratio of the clotting assay activity value and chromogenic assay activity value for each of the different constructs containing various lengths of the B domain. The different constructs containing various lengths of the B domain showed higher clotting
FVIII activity levels than the BDD construct (see fig. 21), ranging from slightly more than
one fold to 2.5 folds as Figure 38 shows. The different constructs also showed a higher total
expressed protein as measured by FVIII: Ag ELISA (see fig. 22) than the BDD construct,
ranging from more than one fold to more than 2.5 folds (Fig. 39). Evaluating the functionality
of the different constructs in terms of FVIII specific activity, our data show that the different
constructs containing various lengths of the B domain show a higher specific activity than the
BDD construct (Fig. 22). This high specific activity could also be seen within the medium of
cells transfected with the 292 construct that has the lowest expression. This data indicate that
the added lengths of the B domain improve the overall activity, protein synthesis and
functionality of FVIII in comparison to the BDD-rFVIII.
80
patient’s plasma prevents a good, standardized clinical monitoring of hemophilia A patients
after substitution with BDD-FVIII.
Figure 37: Ratio of the clotting assay activity value and chromogenic assay activity value for each of the
different constructs containing various lengths of the B domain.
The different constructs containing various lengths of the B domain showed higher clotting
FVIII activity levels than the BDD construct (see fig. 21), ranging from slightly more than
one fold to 2.5 folds as Figure 38 shows. The different constructs also showed a higher total
expressed protein as measured by FVIII: Ag ELISA (see fig. 22) than the BDD construct,
ranging from more than one fold to more than 2.5 folds (Fig. 39). Evaluating the functionality
of the different constructs in terms of FVIII specific activity, our data show that the different
constructs containing various lengths of the B domain show a higher specific activity than the
BDD construct (Fig. 22). This high specific activity could also be seen within the medium of
cells transfected with the 292 construct that has the lowest expression. This data indicate that
the added lengths of the B domain improve the overall activity, protein synthesis and
functionality of FVIII in comparison to the BDD-rFVIII.
0
0,2
0,4
0,6
0,8
1
1,2
BDD BONN 101 202 292 394
Clo
ttin
g / C
hrom
ogen
ic a
ctiv
ity
B-domain deleted constructs
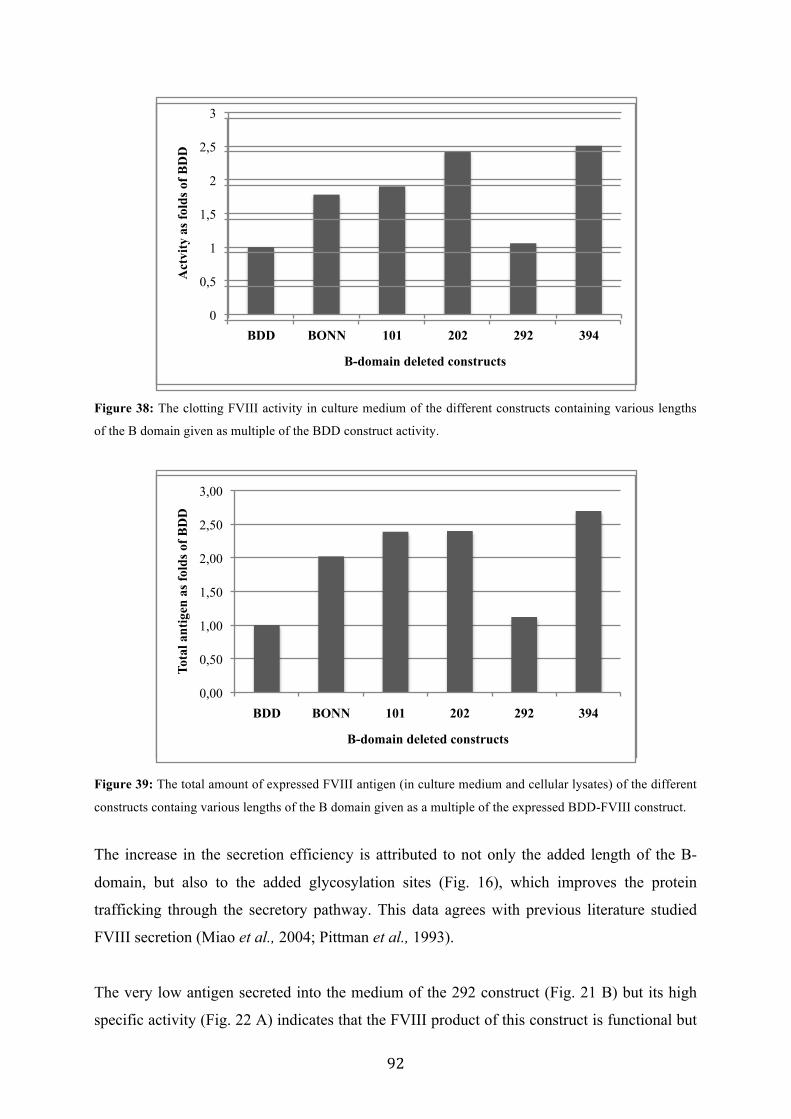
92
Figure 38: The clotting FVIII activity in culture medium of the different constructs containing various lengths
of the B domain given as multiple of the BDD construct activity.
Figure 39: The total amount of expressed FVIII antigen (in culture medium and cellular lysates) of the different
constructs containg various lengths of the B domain given as a multiple of the expressed BDD-FVIII construct.
The increase in the secretion efficiency is attributed to not only the added length of the B-
domain, but also to the added glycosylation sites (Fig. 16), which improves the protein
trafficking through the secretory pathway. This data agrees with previous literature studied
FVIII secretion (Miao et al., 2004; Pittman et al., 1993).
The very low antigen secreted into the medium of the 292 construct (Fig. 21 B) but its high
specific activity (Fig. 22 A) indicates that the FVIII product of this construct is functional but
81
Figure 38: The clotting FVIII activity in culture medium of the different constructs containing various lengths of
the B domain given as multiple of the BDD construct activity.
Figure 39: The total amount of expressed FVIII antigen (in culture medium and cellular lysates) of the different
constructs containg various lengths of the B domain given as a multiple of the expressed BDD-FVIII construct.
The increase in the secretion efficiency is attributed to not only the added length of the B-
domain, but also to the added glycosylation sites (Fig. 16), which improves the protein
trafficking through the secretory pathway. This data agrees with previous literature studied
FVIII secretion (Miao et al., 2004; Pittman et al., 1993).
The very low antigen secreted into the medium of the 292 construct (Fig. 21 B) but its high
specific activity (Fig. 22 A) indicates that the FVIII product of this construct is functional but
0
0,5
1
1,5
2
2,5
3
BDD BONN 101 202 292 394
Act
vity
as f
olds
of B
DD
B-domain deleted constructs
0,00
0,50
1,00
1,50
2,00
2,50
3,00
BDD BONN 101 202 292 394
Tota
l ant
igen
as f
olds
of B
DD
B-domain deleted constructs

93
poorly processed through the secretory pathway. This could be of a misfolded protein
structure that will lead to degradation in the endoplasmic reticulum, but it has no influence on
the functional activity of the small amount of secreted protein.
The approximately similar activity and antigen values of the Bonn (in which the B-domain
region is deleted between aa 852 and 1525, so this construct has ~113 aa of the amino
terminal of the B domain and ~124 aa of the carboxy terminal of the B domain) and the 101
construct (Fig. 21) indicates that the ~124 included amino acids from the B-domain end in the
Bonn construct has no added effect on FVIII expression. This was expected as this part is
naturally removed when FVIII undergoes intracellular proteolysis (Kaufman et al., 1988, van
de Ven WJM et al., 1990, Hutton 1990, Barr 1991). FVIII is cleaved after residues 1313 and
1648 within the B domain to generate a 200 kD heavy chain and an 80 kDa light chain (see
fig. 4), giving rise to the heterodimeric molecule that circulates in plasma (Kaufman 1992).
To have enough material for FVIII purification, the different recombinant FVIII constructs
were stably expressed in CHO-DHFR[-]. In the CHO/DHFR expression system, the
integrated gene of interest is expected to be coamplified with the DHFR gene by exposing
rCHO cells to MTX. However, despite the stepwise selection, the foreign protein expression
level of rCHO clones is not always increased with increasing concentrations of MTX (Kim et
al., 2001). Clonal variation in regard to foreign protein expression naturally occurs probably
because of different integration sites of the foreign gene as a result of unpredictable
chromosomal rearrangement during gene amplification (Davies and Reff 2001; Flintoff et al.,
1984). CHO-DHFR[-] were transfected with the different constructs and cloning by limiting
dilution method was performed twice, once after a round of selection of parental cell clones
and once after obtaining high producer clones. We have successfully generated a high FVIII
producing rCHO cell lines for the BDD (clone F2H1), the 202 (clone G3E6), the 394 (clone
F4F3) and the Full length (clone C6) construct (see table 9). The different rCHO cell lines
show different FVIII productivities and different growth rates that are slower than
nonproducing clones. This data agrees with previous studies on producing recombinant clones
in CHO cell line (Gu et al. 1994; Kim et al., 1998).
Culture medium collected from the high producing rCHO cell lines was used for FVIII
purification. FVIII was purified by a small-scale affinity purification method using FVIII-
Select beads. Purified materials were shown to be functional by the clotting FVIII: C assay

94
after diluting them in FVIII-deficient plasma (Table 10). After quantifying the purified
material by FVIII ELISA (Table 11), equal antigen concentrations were used for thrombin
cleavage. Comparing A2 cleavage patterns of BDD-rFVIII and 394-rFVIII, we could see that
the BDD- rFVIII is more susceptible for thrombin activation showing a faster A2 generation
pattern (Fig. 25). This result agrees with those of Eaton et al., 1986 where a B-domain deleted
molecule was shown to exhibit increases sensitivity to thrombin activation compared with
wild type and those of Meulin et al., 1988 where a B-domain deletion molecule was activated
to a greater extent than wild type FVIII. However, our result disagrees with those of Pittman
et al., 1993 in which no difference was detected in the rate of heavy chain cleavage of the
BDD molecule and wild type FVIII by thrombin. In view of our result, we suppose that the B
domain region has an important physiological role in FVIII activation.
In conclusion, our data show that the addition of short lengths (~100-400 amino acids) of the
B domain improved the overall expression of FVIII, eliminates the assay discrepancy and
stabilizes the molecule upon activation.
3.2 Construction of a new helper vector for the production of helper-dependent
adenovectors for the use in hemophilia gene therapy
Current treatment of hemophilia A consists of protein substitution therapies based on plasma-
derived or recombinant FVIII. Although FVIII substitution therapy has significantly improved
the quality of life of patients suffering from hemophilia A, it is not curative and a life-long
dependency on clotting factor treatment is required (Ragni, 2004). Furthermore, the patients
are still at risk of spontaneous bleeding episodes, which might cause significant morbidity and
sometimes even mortality. Hence, it would be ideal if a cure for hemophilia A could be
developed such that sustained therapeutic FVIII levels could be achieved. Hemophilia A is
therefore considered to be a particularly attractive target disease for gene therapy. The
molecular biology and pathology of this disease is relatively well understood and only a
relatively slight increase in FVIII levels (above 1% of physiologic levels) suffices to convert a
severe to a moderate hemophilic phenotype, which constitutes a major clinical improvement
(Chuah et al., 2004).
During the last few decades, a variety of different gene delivery technologies have been
developed, each with their own advantages and limitations. Vectors derived from human

95
adenoviruses exhibit a number of features that have made them extremely useful gene transfer
reagents. Most notably, these vectors can transduce a broad range of both dividing and post-
mitotic cells of different origin. The ultimate form of adenovirus vector modification is the
creation of fully deleted ‘helper-dependent’ adenovirus vectors (HD-AdVs). These are
adenovirus-based vectors that contain only the cis elements necessary for replication and
packaging, but lack all adenovirus genes. As they do not express any viral genes, they have a
significantly improved safety profile compared with early-generation adenoviral vectors. HD-
AdVs could give rise to prolonged transgene expression and were associated with
significantly reduced acute and chronic hepatotoxicity and reduced inflammatory responses
compared with first-generation adenoviral vectors, even in large animal models such as
primates or dogs, which are more susceptible to the toxic side effects of adenoviral vectors
than mice (Chuah et al., 2004). HD-AdVs created so far share a major disadvantage which is
the use of helper viruses or plasmid cotransfection to provide the necessary virus proteins in
trans. The use of helper viruses almost always results in some contamination of the vector by
the helper virus.
Recombinant baculoviruses are increasingly used as gene delivery vectors for mammalian
cells (Kost et al., 2005). This relatively new gene delivery approach offers a number of
advantages including the inability of the virus to replicate in mammalian cells, the absence or
virtual absence of cytotoxicity, technical simplicity and superior biosafety profile as
compared to mammalian cell-derived viral vectors (Kost et al., 2000). The demonstration that
a recombinant baculovirus containing a 38 kb insert can be generated and propagated in a
genetically stable manner in insect cells provides important direct evidence of the large
cloning capacity of the virus (Cheshenko et al., 2001).
In the present study, we have examined the potential utility of a novel helper system for the
production of a HD-AdV carrying a B-domain-deleted factor VIII-cDNA without any risk of
contamination. In this system, a packaging deficient, replication-competent adenovirus Helper
construct was delivered by a baculovirus. This baculovirus / adenovirus hybrid genome was
then delivered into HEK 293T cells along with the HD-AdV, where the adenoviral sequences
integrated into the hybrid genome should provide (in trans) all of the functions necessary for
the propagation of HD-AdVs.

96
In designing our novel helper (the baculovirus / adenovirus hybrid) genome, we included only
the Ad5 genes (nts 4000 to 35832) necessary for replication and packaging of HD-AdV. The
adenoviral 5'ITR (nts 1-190), packaging signal (nts 191-358) and 3'ITR (nts 35833-35935) as
well as E1/E3 region were deleted in this helper construct, thus rendering it replication
incompetent and packaging incompetent. The replication capacity of the helper construct was
then regained by fusing the Adeno-associated virus 2 (AAV2)-ITRs (5'ITR; 3'ITR) into it.
AAV2-ITRs serves as origins of replication for the helper construct provided that AAV2-
rep78/68 genes are provided in trans. (See also section 2.2.9 and 2.3.5) The helper construct
(AAV2[5'ITR] /Ad5/ AAV2[3'ITR]) was then integrated into the Baculovirus genome
generating the helper vector Bac-AAV2-Ad5.
The cloning of such a big helper construct required a tedious lab effort. The big insert size (~
32 kb) with respect to the vector size (the Bac-shuttle plasmid of around 6 kb in size) required
the screening of around 100 recombinant clones by size and restriction enzyme analysis.
Doing this, we were able to isolate a clone, however with a small deletion within the 3'ITR
region. This deletion was confirmed by Sma I restriction and DNA sequencing (Fig. 27 and
28). After consultation with Prof. W Poller research group (our gene therapy collaborating
group; Freie Universitaet Berlin), we continued work as this group assured that one ITR is
enough to serve as an origin of replication.
To guarantee the genetic stability of the helper construct in insect and mammalian cells and to
prevent its self-circularization, we have provided the Rep genes in trans. in a separate
baculoviral construct. The expression of the AAV2-Rep genes has been shown in SF9 and
HEK 293 cells by RT-PCR (Fig. 29). The EGFP gene was cloned in a separate baculoviral
construct and served as a positive control for HEK 293 cells infection (Fig. 35).
Recombinant bacmids (bBac-AAV2-Ad5, bBac-AAV2-Rep and bBac-EGFP) were generated
by site specific transposition with their corresponding shuttle plasmids and confirmed by Taq-
PCR using M13 forward and reverse primers and insert specific primers (Fig. 30 and 31).
For virus production, recombinant bacmids were used to rescue the recombinant Bac virus
(vBac-AAV2-Ad5, vBac-AAV2-Rep and vBac-EGFP) in Sf9 insect cells. Viral titers of 5 *
109 pfu/ml and 4 * 109 pfu/ml were achieved for vBac-AAV2-Ad5 and vBac-AAV2-Rep
respectively and selected plaques were amplified. Viral DNA was extracted from purified

97
amplified viral stocks and tested by Taq-PCR to have the Ad5-chimera and the Rep genes.
We have successfully isolated plaques (9 and 16) of vBac-AAV2-Ad5 and plaques (1 and 5)
of vBac-AAV2-Rep that showed a genetic stability over passaging and found to have the
correct inserts by Taq-PCR (Fig. 34). As the structure of the Ad5 insert in vBac-AAV2-Ad5
did not change during passaging, this indicates that the presence of adenoviral sequences in
the recombinant hybrid genome did not interfere with baculovirus growth.
For the main experiment, the purified amplified Bac-AAV2-Ad5 helper virus (at MOI of 500
and 2000) was used in combination with Bac-AAV2-Rep (at MOI of 200) to rescue the HD-
AdV in HEK293 cells. As a positive control of transfection, one well was infected with pBac-
EGFP. As a negative control of rescuing the HD-AdV, one well was infected with Bac-
AAV2-Rep (at MOI of 500) only (no helper adenoviral construct). Assuming that inside the
HEK 293 cells, the AAV2-ITR will function as an origin of replication and as a termination
signal supported by the expression of the Rep78/68 protein and that the Ad5 helper construct
in the hybrid genome will provide all Ad5 proteins necessary for replication and packaging of
HD-AdV, the HD-AdV should be produced. This viral production should lead to lysis of
HEK 293 as well as BDD-rFVIII should be expressed.
Our results were not as expected as we have not seen any cytopathic effects after four days
infection period. Nonetheless, to see whether the results were positive or no, medium was
collected and HEK 293 cells were lysed. Lysates were partially used for extrachromsomal
DNA extraction to control wether DNA of HD-AdV has been amplified in HEK 293 cells.
Digestion with DpnI indicated that our isolated extrachromosomal DNA was not produced in
vivo inside HEK 293 cells, but was of bacterial origin belonging to the transfected HD-AdV
(Fig. 36). Culture medium was used for FVIII: Ag testing which was not detectable. A second
portion of the lysates was used for a second round of infection (to amplify the helper
dependent viral particles in case they were produced in a very low quantity) using fresh
confluent HEK 293 cells in the presence of the same concentrations of the helper virus. Four
days later, cells were lysed and lysates were used for a third round of HEK 293 infection. No
signs of infection could be seen in the three rounds of infection. These results indicate that our
helper system could not support the production of the helper dependent adenovector.
Cheshenko et al., 2001 developed an alternative system for the propagation of HD-AdVs, in
which the adenoviral genes (flanked by adenoviral ITRs) essential for replication and

98
packaging of the helper vector are delivered into producer cells by a similar baculovirus-
adenovirus hybrid. This hybrid was constructed to carry a Cre recombinase-excisable copy of
a packaging-deficient adenovirus genome. Their experiments resulted in a vector that was
completely free of helper virus and was able to transduce cultured 293 cells. However,
scaling-up of HD-AdV production was prevented by the eventual emergence of replication-
competent adenovirus (RCA), apparently the product of homologous recombination between
adenovirus sequences contained in 293 cells and the adenoviral helper genome (Kost and
Condreay, 2002). The major difference between this system and the helper-dependent system
is that, instead of deleting the packaging signal from the helper genome during the vector
propagation, we have deleted it before it gets into cells. This modification precludes the
packaging of this genome into adenovirus virions. Flanking the adenoviral genome by AAV2-
ITRs instead of Ad5-ITRs will also prevent the appearance of RCA.
In the design of this system we took advantage of a unique feature of the baculovirus
AcMNPV to infect human cells efficiently while remaining virtually nontoxic and
transcriptonally and replicatively inactive. The genome of AcMNPV consists of 131 kb
double-stranded circular DNA molecule (Ayres et al., 1994). Although it was generally
reported that the extra packaging capacity of baculovirus is high (Cheshenko et al., 2001), we
could prove that the recombinant baculovirus Bac-AAV2-Ad5 created in this study was able
to accomodate an insert of ~35824 bp, which apparently did not affect the virus viability. Our
data suggest that, despite the presence of such a large insert, the genetic structure of Bac-
AAV2-Ad5 remained stable, allowing passaging and expansion of the virus. In addition, we
we were able to propagate those recombinant baculoviruses to relatively high titers (5 * 109
pfu/ml) and further concentrate them by centrifugation, which agrees with Hofmann et al.,
1995.
Since baculovirus genes are not expressed in mammalian cells, it is unlikely that the Bac/Ad5
hybrid genome will replicate in mammalian cells. However, replication of adenovirus
sequences in the helper hybrid genome is essential to generate the large number of templates
for the synthesis of the large amounts of viral proteins that are necessary to obtain high yields
of HD-AdV. Thus, in order to support the replication and packaging of the HD-AdV in an
efficient fashion, the adenovirus helper genome should be able to replicate. To permit
replication directed from the AAV2-ITRs flanking the Ad5 sequences, the AAV2-Rep genes
were provided in trans in a separate baculovirus that was produced into high titers and

99
coinfected with Bac-AAV2-Ad5 helper hybrid.
In conclusion, as the baculovirus was able to infect HEK 293 cells as shown by vBac-EGFP
infection and the Rep genes are expressed in those cells, we propose that the HD-AdV was
not produced because of inefficient or non occurring replication of the Ad5 genes in the
Bac/Ad5 hybrid. The presence of only one ITR may be a possible cause that replication did
not work (efficiently). Reconstructing such a helper hybrid to have both ITRs would validate
our novel system and show its ability to support the HD-AdVs.

100
5. Summary:
5.1 Functional studies on factor VIII protein variants containing different lengths of the
B-domain
To evaluate the role of the factor VIII (FVIII) B-domain on FVIII expression, (activity and
activation), we constructed several FVIII expression constructs with various lengths of the B-
domain and expressed them transiently as well as stably.
Practically, B-domain deleted recombinant FVIII (BDD-rFVIII) was generated from the full-
length FVIII-cDNA by ligating (on the protein level) Ser743 to Arg1634; the corresponding
FVIII-cDNA was then cloned into the pMT2 expression vector. Then, cDNA-fragments of
different length (on the protein level: 101, 202, 292, and 394 amino acid long fragments of the
B-domain starting from its amino terminal) were cloned between Ser743 and Arg1634.
Constructs were then transiently expressed in COS-7, HEK 293 and CHO cells and stably
expressed in CHO-DHFR(-) cells by methotrexate selection and amplification. FVIII proteins
were then assessed for activity in culture medium by the clotting assay and the chromogenic
assay and for antigen in cellular lysates by ELISA. FVIII proteins were purified from stable
cell lines media.
Our transient expression studies showed that FVIII expression was the highest in COS-7 cells
followed by HEK 293 cells. The CHO cells showed the lowest FVIII expression. Transient
expression in COS-7 cells (for forty-eight hours) revealed that the constructs containing
added lengths of the B-domain showed a higher FVIII: C (~1.1-2.5 folds) and a higher overall
expressed protein (total antigen in medium and cellular lysates; ~1.1-3 folds) compared the
BDD-rFVIII. The functionality of the expressed proteins in terms of FVIII specific activity
was higher in all constructs in comparison to the BDD construct. Comparing the clotting
FVIII activity by that of the chromogenic assay, we found that those constructs showed a
slightly higher FVIII value within the clotting assay than within the chromogenic assay. In
contrast, the BDD construct showed the opposite effect and also showed a significant
discrepancy between both assay methods. Activation of purified FVIII proteins by thrombin
revealed that the BDD-rFVIII showed a faster generation of the A2 domain than the
constructs containing added lengths of the B-domain.

101
In conclusion, our data showed that the inclusion of a 100 amino acids or more of the B-
domain sequence eliminates the assay discrepancy and increases the overall expression and
functionality of rFVIII protein.
5.2 Construction of a new helper vector for the production of helper-dependent
adenovectors for the use in hemophilia gene therapy
Fully deleted Helper-Dependent Adenovectors (HD-AdV) are so far the ultimate form of
Adenovirus vector modifications which lack all the adenovirus genes except the replication
and packaging elements. They can accommodate an insert of up to 36 kb. HD-AdVs are
produced in HEK 293 cells in the presence of a helper adenovirus that supplies the viral genes
in trans. Using this system very high titers of HD-AdV can be prepared now, with small but
still measurable helper adenovirus contamination.
Within this study we have tried to design a novel hybrid helper virus that can support the
production of a HD-AdV, carrying a B-domain-deleted factor VIII-cDNA, in high efficiency
without any contamination. In order to avoid contamination of HD-AdV production, the
adenoviral sequences in the novel hybrid helper virus was lacking the adenoviral ITRs and the
packaging signal, but was flanked by adeno-associated virus (AAV) ITRs. This adenoviral
helper sequences was then cloned into the baculovirus expression system.
The lack of the Adenovirus packaging signal renders the hybrid helper virus packaging
incompetent and thus eliminates the risk of contaminating the HD-AdV preparations. Since
the helper virus also lacks the adenoviral ITRs, it will not compete with the HD-AdV for the
Adenovirus 5 replication proteins. The lack of the capsid genes within the AAV-sequences
should also prevent the generation of AAV particles.
To drive the replication of the Ad5-genome in the hybrid helper virus theAAV2-Rep genes
were cloned in a separate baculoviral construct. A GFP baculoviral construct was prepared to
be used as positive control for transfecting insect cells and infecting HEK 293 cells.
We successfully constructed the hybrid helper vector pBac-AAV2-Ad5 with a deletion in the
3’ITR region. The recombinant baculovirus particles (vBac-AAV2-Ad5, vBac-AAV2-Rep
and vBac-EGFP) was then produced in insect cells, plaque purified and amplified to high
102
titers. Since the deletion within the 3’-ITR region should have no effect on helper virus
production, the produced baculoviruses were used to infect HEK 293 cells, together with the
HD-AdV carrying the B-domain-deleted factor VIII-cDNA. Depending on the presence of
AAV-ITRs, we expected that the genome of the helper-virus will be replicated, thus
improving its efficiency in providing helper function. To verify our strategy in synthesizing
the helper virus, we showed that the baculovirus is able to infect HEK 293 cells by eGFP
expression and that the Rep gene was expressed in both SF9 cells and HEK 293 cells.
After three rounds of infecting HEK293 cells with the helper hybrid virus, we couldn’t see
any signs of HD-AdV production. Unexpectedly, the analysis of extracted extra chromosomal
DNA showed that the material was the original transfected material and not synthesized
within the HEK 293 cells.
In conclusion, as the baculovirus was able to infect HEK 293 cells and the Rep genes were
also expressed in those cells, we propose that the HD-AdV was not produced because of
inefficient or non occurring replication of the Ad5 genes in the Bac/Ad5 hybrid. The presence
of only one ITR may be a possible cause. The reconstruction of an helper hybrid with both
ITRs would clarify the function of such an adenoviral helper virus system.

103
6. References: ANDERSSON, L. O., FORSMAN, N., HUANG, K., LARSEN, K., LUNDIN, A., PAVLU, B., SANDBERG, H., SEWERIN, K. & SMART, J. 1986. Isolation and characterization of human factor VIII: molecular forms in commercial factor VIII concentrate, cryoprecipitate, and plasma. Proc Natl Acad Sci U S A, 83, 2979-83. ANDREWS, J. L., KADAN, M. J., GORZIGLIA, M. I., KALEKO, M. & CONNELLY, S. 2001. Generation and characterization of E1/E2a/E3/E4-deficient adenoviral vectors encoding human factor VIII. Mol Ther, 3, 329-36. ANTONARAKIS, S. E., KAZAZIAN, H. H. & TUDDENHAM, E. G. 1995. Molecular etiology of factor VIII deficiency in hemophilia A. Hum Mutat, 5, 1-22. ARAD, U. 1998. Modified Hirt procedure for rapid purification of extrachromosomal DNA from mammalian cells. Biotechniques. 24(5), 760-2. ARMENTANO, D., SOOKDEO, C. C., HEHIR, K. M., GREGORY, R. J., ST GEORGE, J. A., PRINCE, G. A., WADSWORTH, S. C. & SMITH, A. E. 1995. Characterization of an adenovirus gene transfer vector containing an E4 deletion. Hum Gene Ther, 6, 1343-53. ARRUDA, V. R., FIELDS, P. A., MILNER, R., WAINWRIGHT, L., DE MIGUEL, M. P., DONOVAN, P. J., HERZOG, R. W., NICHOLS, T. C., BIEGEL, J. A., RAZAVI, M., DAKE, M., HUFF, D., FLAKE, A. W., COUTO, L., KAY, M. A. & HIGH, K. A. 2001. Lack of germline transmission of vector sequences following systemic administration of recombinant AAV-2 vector in males. Mol Ther, 4, 586-92. AYRES, M. D., HOWARD, S. C., KUZIO, J., LOPEZ-FERBER, M., POSSEE, R. D. 1994. The complete DNA sequence of Autographa californica nuclear polyhedrosis virus. Virology. 1994, 202(2):586-605. AZZI, A., DE SANTIS, R., MORFINI, M., ZAKRZEWSKA, K., MUSSO, R., SANTAGOSTINO, E. & CASTAMAN, G. 2001. TT virus contaminates first-generation recombinant factor VIII concentrates. Blood, 98, 2571-3. BAGNALL, R. D., WASEEM, N., GREEN, P. M. & GIANNELLI, F. 2002. Recurrent inversion breaking intron 1 of the factor VIII gene is a frequent cause of severe hemophilia A. Blood, 99, 168-74. BALAGUE, C., ZHOU, J., DAI, Y., ALEMANY, R., JOSEPHS, S. F., ANDREASON, G., HARIHARAN, M., SETHI, E., PROKOPENKO, E., JAN, H. Y., LOU, Y. C., HUBERT- LESLIE, D., RUIZ, L. & ZHANG, W. W. 2000. Sustained high-level expression of full- length human factor VIII and restoration of clotting activity in hemophilic mice using a minimal adenovirus vector. Blood, 95, 820-8.

104
BARROWCLIFFE, T. W., RAUT, S., SANDS, D. & HUBBARD, A. R. 2002. Coagulation and chromogenic assays of factor VIII activity: general aspects, standardization, and recommendations. Semin Thromb Hemost, 28, 247-56. BERKNER, K. L. 1988. Development of adenovirus vectors for the expression of heterologous genes. Biotechniques, 6, 616-29. BI, L., LAWLER, A. M., ANTONARAKIS, S. E., HIGH, K. A., GEARHART, J. D. & KAZAZIAN, H. H., JR. 1995. Targeted disruption of the mouse factor VIII gene produces a model of haemophilia A. Nat Genet, 10, 119-21. BOYCE, F. M. & BUCHER, N. L. 1996. Baculovirus-mediated gene transfer into mammalian cells. Proc Natl Acad Sci U S A, 93, 2348-52. BRACKMANN, H. H., OLDENBURG, J. & SCHWAAB, R. 1996. Immune tolerance for the treatment of factor VIII inhibitors--twenty years' 'bonn protocol'. Vox Sang, 70 Suppl 1, 30-5. BRETTLER, D. B., FORSBERG, A. D., LEVINE, P. H., PETILLO, J., LAMON, K. & SULLIVAN, J. L. 1989. Factor VIII:C concentrate purified from plasma using monoclonal antibodies: human studies. Blood, 73, 1859-63. BROZE, G. J., JR. 1992. The role of tissue factor pathway inhibitor in a revised coagulation cascade. Semin Hematol, 29, 159-69. CHAO, H., MAO, L., BRUCE, A. T. & WALSH, C. E. 2000. Sustained expression of human factor VIII in mice using a parvovirus-based vector. Blood, 95, 1594-9. CHESHENKO, N., KROUGLIAK, N., EISENSMITH, R. C. & KROUGLIAK, V. A. 2001. A novel system for the production of fully deleted adenovirus vectors that does not require helper adenovirus. Gene Ther, 8, 846-54. CHRISTIANSEN, M. L., BALLING, K. W., PERSSON, E., HILDEN, I., BAGGER- SORENSEN, A., SORENSEN, B. B., VIUFF, D., SEGEL, S., KLAUSEN, N. K., EZBAN, M., LETHAGEN, S., STEENSTRUP, T. D. & KJALKE, M. Functional characteristics of N8, a new recombinant FVIII. Haemophilia, 16, 878-87. CHRISTIANSEN, M. L., BALLING, K. W., PERSSON, E., HILDEN, I., BAGGER- SORENSEN, A., SORENSEN, B. B., VIUFF, D., SEGEL, S., KLAUSEN, N. K., EZBAN, M., LETHAGEN, S., STEENSTRUP, T. D. & KJALKE, M. 2010. Functional characteristics of N8, a new recombinant FVIII. Haemophilia, 16, 878-87. CHUAH, M. K., COLLEN, D. & VANDENDRIESSCHE, T. 2001. Gene therapy for hemophilia. J Gene Med, 3, 3-20.

105
CHUAH, M. K., COLLEN, D. & VANDENDRIESSCHE, T. 2004. Clinical gene transfer studies for hemophilia A. Semin Thromb Hemost, 30, 249-56. CHUAH, M. K., SCHIEDNER, G., THORREZ, L., BROWN, B., JOHNSTON, M., GILLIJNS, V., HERTEL, S., VAN ROOIJEN, N., LILLICRAP, D., COLLEN, D., VANDENDRIESSCHE, T. & KOCHANEK, S. 2003. Therapeutic factor VIII levels and negligible toxicity in mouse and dog models of hemophilia A following gene therapy with high-capacity adenoviral vectors. Blood, 101, 1734-43. CLEMENS, P. R., KOCHANEK, S., SUNADA, Y., CHAN, S., CHEN, H. H., CAMPBELL, K. P. & CASKEY, C. T. 1996. In vivo muscle gene transfer of full-length dystrophin with an adenoviral vector that lacks all viral genes. Gene Ther, 3, 965-72. COLMAN, R. W., MARDER, V. J., SALZMAN, W. W., HIRSH, J. 1994. Overview of hemostasis. In Colman, R. W., Hirsh, J., Marder, V. J., Salzman, E. W. (eds): Hemostasis and Thrombosis: Basic Principles and Clinical Practice, 3rd edn. JB Lippencott, Philadelphia, pp. 3-18. CONNELLY, S., ANDREWS, J. L., GALLO, A. M., KAYDA, D. B., QIAN, J., HOYER, L., KADAN, M. J., GORZIGLIA, M. I., TRAPNELL, B. C., MCCLELLAND, A. & KALEKO, M. 1998. Sustained phenotypic correction of murine hemophilia A by in vivo gene therapy. Blood, 91, 3273-81. CONNELLY, S., GARDNER, J. M., LYONS, R. M., MCCLELLAND, A. & KALEKO, M. 1996. Sustained expression of therapeutic levels of human factor VIII in mice. Blood, 87, 4671-7. CONNELLY, S., GARDNER, J. M., MCCLELLAND, A. & KALEKO, M. 1996. High-level tissue-specific expression of functional human factor VIII in mice. Hum Gene Ther, 7, 183- 95. CONNELLY, S., MOUNT, J., MAUSER, A., GARDNER, J. M., KALEKO, M., MCCLELLAND, A. & LOTHROP, C. D., JR. 1996. Complete short-term correction of canine hemophilia A by in vivo gene therapy. Blood, 88, 3846-53. CUNNINGHAM, M. A., PIPE, S.W., HAURI, H. P., KAUFMAN, R.J. 2001. The interaction of coagulation factor VIII with ERGIC-53 requires specific N-linked oligosaccharide structures within the B domain. Blood, 98, 705a (Abst.). DAVIE, E. W., FUJIKAWA, K. & KISIEL, W. 1991. The coagulation cascade: initiation, maintenance, and regulation. Biochemistry, 30, 10363-70. DAVIES, J. & REFF, M. 2001. Chromosome localization and gene-copy-number quantification of three random integrations in Chinese-hamster ovary cells and their amplified cell lines using fluorescence in situ hybridization. Biotechnol Appl Biochem, 33, 99-105.
106
DORNER, A. J., BOLE, D. G. & KAUFMAN, R. J. 1987. The relationship of N-linked glycosylation and heavy chain-binding protein association with the secretion of glycoproteins. J Cell Biol, 105, 2665-74. DORNER, A. J., WASLEY, L. C. & KAUFMAN, R. J. 1989. Increased synthesis of secreted proteins induces expression of glucose-regulated proteins in butyrate-treated Chinese hamster ovary cells. J Biol Chem, 264, 20602-7. EATON, D. L., HASS, P. E., RIDDLE, L., MATHER, J., WIEBE, M., GREGORY, T. & VEHAR, G. A. 1987. Characterization of recombinant human factor VIII. J Biol Chem, 262, 3285-90. EATON, D. L., WOOD, W. I., EATON, D., HASS, P. E., HOLLINGSHEAD, P., WION, K., MATHER, J., LAWN, R. M., VEHAR, G. A. & GORMAN, C. 1986. Construction and characterization of an active factor VIII variant lacking the central one-third of the molecule. Biochemistry, 25, 8343-7. ELDER, B., LAKICH, D. & GITSCHIER, J. 1993. Sequence of the murine factor VIII cDNA. Genomics, 16, 374-9. ESMON, C. T. 1989. The roles of protein C and thrombomodulin in the regulation of blood coagulation. J Biol Chem, 264, 4743-6. EVANS, J. P., BRINKHOUS, K. M., BRAYER, G. D., REISNER, H. M. & HIGH, K. A. 1989. Canine hemophilia B resulting from a point mutation with unusual consequences. Proc Natl Acad Sci U S A, 86, 10095-9. FAKHARZADEH, S. S., ZHANG, Y., SARKAR, R. & KAZAZIAN, H. H., JR. 2000. Correction of the coagulation defect in hemophilia A mice through factor VIII expression in skin. Blood, 95, 2799-805. FAY, P. J. 2004. Activation of factor VIII and mechanisms of cofactor action. Blood Rev, 18, 1-15. FAY, P. J. 2006. Factor VIII structure and function. Int J Hematol, 83, 103-8. FAY, P. J., COUMANS, J. V. & WALKER, F. J. 1991. von Willebrand factor mediates protection of factor VIII from activated protein C-catalyzed inactivation. J Biol Chem, 266, 2172-7. FAY, P. J., HAIDARIS, P. J. & HUGGINS, C. F. 1993. Role of the COOH-terminal acidic region of A1 subunit in A2 subunit retention in human factor VIIIa. J Biol Chem, 268, 17861- 6. FAY, P. J. & JENKINS, P. V. 2005. Mutating factor VIII: lessons from structure to function. Blood Rev, 19, 15-27.

107
FAY, P. J., MASTRI, M., KOSZELAK, M. E. & WAKABAYASHI, H. 2001. Cleavage of factor VIII heavy chain is required for the functional interaction of a2 subunit with factor IXA. J Biol Chem, 276, 12434-9. FAY, P. J., SMUDZIN, T. M. & WALKER, F. J. 1991. Activated protein C-catalyzed inactivation of human factor VIII and factor VIIIa. Identification of cleavage sites and correlation of proteolysis with cofactor activity. J Biol Chem, 266, 20139-45. FISHER, K. D., STALLWOOD, Y., GREEN, N. K., ULBRICH, K., MAUTNER, V. & SEYMOUR, L. W. 2001. Polymer-coated adenovirus permits efficient retargeting and evades neutralising antibodies. Gene Ther, 8, 341-8. FLINTOFF, W. F., LIVINGSTON, E., DUFF, C. & WORTON, R. G. 1984. Moderate-level gene amplification in methotrexate-resistant Chinese hamster ovary cells is accompanied by chromosomal translocations at or near the site of the amplified DHFR gene. Mol Cell Biol, 4, 69-76. FOSTER, P. A., FULCHER, C. A., HOUGHTEN, R. A. & ZIMMERMAN, T. S. 1988. An immunogenic region within residues Val1670-Glu1684 of the factor VIII light chain induces antibodies which inhibit binding of factor VIII to von Willebrand factor. J Biol Chem, 263, 5230-4. FRANCHINI, M. & LIPPI, G. Von Willebrand factor-containing factor VIII concentrates and inhibitors in haemophilia A. A critical literature review. Thromb Haemost, 104, 931-40. FRANCHINI, M. & LIPPI, G. Recombinant factor VIII concentrates. Semin Thromb Hemost, 36, 493-7. FREIJE, D. & SCHLESSINGER, D. 1992. A 1.6-Mb contig of yeast artificial chromosomes around the human factor VIII gene reveals three regions homologous to probes for the DXS115 locus and two for the DXYS64 locus. Am J Hum Genet, 51, 66-80. FRESHNEY, R. I. 2000. Culture of Animal Cells: A Manual of Basic Techniques, 4th edn. FURIE, B. & FURIE, B. C. 2005. Thrombus formation in vivo. J Clin. Invest., 115 (12), 3355-62. FURIE, B. & FURIE, B. C. 1992. Molecular and cellular biology of blood coagulation. N Engl J Med, 326, 800-6. FURIE, B., LIMENTANI, S. A. & ROSENFIELD, C. G. 1994. A practical guide to the evaluation and treatment of hemophilia. Blood, 84, 3-9.

108
GALLO-PENN, A. M., SHIRLEY, P. S., ANDREWS, J. L., TINLIN, S., WEBSTER, S., CAMERON, C., HOUGH, C., NOTLEY , C., LILLICRAP , D., KALEKO,M. & CONNELLY, S. 2001. Systemic delivery of an adenoviral vector encoding canine factor VIII results in short-term phenotypic correction, inhibitor development, and biphasic liver toxicity in hemophilia A dogs. Blood, 97, 107-13.
GAO, G. P., YANG, Y. & WILSON, J. M. 1996. Biology of adenovirus vectors with E1 and E4 deletions for liver-directed gene therapy. J Virol, 70, 8934-43.
GIRMA, J-P., FRESSINAUD, E., HOULLIER, A., LAURIAN, Y., AMIRAL, J. & MEYER, D. 1998. Assay of factor VIII antigen (VIII:CAg) in 294 haemophilia A patients by a new commercial ELISA using monoclonal antibodies. Haemophilia, 4, 98–103.
GNATENKO, D. V., SAENKO, E. L., JESTY, J., CAO, L. X., HEARING, P. & BAHOU, W. F. 1999. Human factor VIII can be packaged and functionally expressed in an adeno- associated virus background: applicability to haemophilia A gene therapy. Br J Haematol, 104, 27-36.
GORZIGLIA, M. I., KADAN, M. J., YEI, S., LIM, J., LEE, G. M., LUTHRA, R. & TRAPNELL, B. C. 1996. Elimination of both E1 and E2 from adenovirus vectors further improves prospects for in vivo human gene therapy. J Virol, 70, 4173-8.
GRANADOS, R. R. et al. 1994. A new cell line from Trichoplusia ni (BTI-Tn-5B1-4) susceptible to Trichoplusia ni single enveloped nuclear polyhedrosis virus. J. Invertebr. Pathol. 64, 260-266.
GRUPPO, R. A., BROWN, D., WILKES, M. M. & NAVICKIS, R. J. 2003. Comparative effectiveness of full-length and B-domain deleted factor VIII for prophylaxis--a meta- analysis. Haemophilia, 9, 251-60.
GRUPPO, R. A., BROWN, D., WILKES, M. M. & NAVICKIS, R. J. 2004. Meta-analytic evidence of increased breakthrough bleeding during prophylaxis with B-domain deleted factor VIII. Haemophilia, 10, 747-50.
GRUPPO, R. A., BROWN, D., WILKES, M. M. & NAVICKIS, R. J. 2004. Increased breakthrough bleeding during prophylaxis with B-domain deleted factor VIII--a robust meta- analytic finding. Haemophilia, 10, 449-51.
GU, M. B., TODD, P. & KOMPALA, D. S. 1994. Analysis of foreign protein over production in recombinant CHO cells. Effect of growth kinetics and cell cycle traverse. Ann N Y Acad Sci, 721, 194-207.
HE, T. C., ZHOU, S., DA COSTA, L. T., YU, J., KINZLER, K. W., VOGELSTEIN, B. 1998. A simplified system for generating recombinant adenoviruses. Proc Natl Acad Sci, USA, 95(5), 2509-14.

109
HIGH, K. A. 2003. Gene transfer as an approach to treating hemophilia. Semin Thromb Hemost, 29, 107-20.
HILL-EUBANKS, D. C., PARKER, C. G. & LOLLAR, P. 1989. Differential proteolytic activation of factor VIII-von Willebrand factor complex by thrombin. Proc Natl Acad Sci U S A, 86, 6508-12.
HOFMANN, C., SANDIG, V., JENNINGS, G., RUDOLPH, M., SCHLAG, P. & STRAUSS, M. 1995. Efficient gene transfer into human hepatocytes by baculovirus vectors. Proc Natl Acad Sci U S A, 92, 10099-103.
HORTELANO, G., AL-HENDY, A., OFOSU, F. A. & CHANG, P. L. 1996. Delivery of human factor IX in mice by encapsulated recombinant myoblasts: a novel approach towards allogeneic gene therapy of hemophilia B. Blood, 87, 5095-103.
HOUGH, C., KAMISUE, S., CAMERON, C., NOTLEY, C., TINLIN, S., GILES, A. & LILLICRAP, D. 2002. Aberrant splicing and premature termination of transcription of the FVIII gene as a cause of severe canine hemophilia A: similarities with the intron 22 inversion mutation in human hemophilia. Thromb Haemost, 87, 659-65.
HOYER, L. W. 1994. Hemophilia A. N Engl J Med, 330, 38-47.
HUTTON, D. A., PEARSON, J. P., ALLEN, A. & FOSTER, S. N. 1990. Mucolysis of the colonic mucus barrier by faecal proteinases: inhibition by interacting polyacrylate. Clin Sci (Lond), 78, 265-71.
INGRAM, G. I. 1976. The history of haemophilia. J Clin Pathol, 29, 469-79.
JONES, P. K. & RATNOFF, O. D. 1991. The changing prognosis of classic hemophilia (factor VIII "deficiency"). Ann Intern Med, 114, 641-8.
KANE, W. H. & DAVIE, E. W. 1988. Blood coagulation factors V and VIII: structural and functional similarities and their relationship to hemorrhagic and thrombotic disorders. Blood, 71, 539-55.
KAUFMAN, R. J. 1992. Expression and structure-function properties of recombinant factor VIII. Transfus Med Rev, 6, 235-46.
KAUFMAN, R. J. 1992. Biological regulation of factor VIII activity. Annu Rev Med, 43, 325- 39.
KAUFMAN, R. J. 1999. Advances toward gene therapy for hemophilia at the millennium. Hum Gene Ther, 10, 2091-107.
110
KAUFMAN, R. J., WASLEY, L. C., DAVIES, M. V., WISE, R. J., ISRAEL, D. I. & DORNER, A. J. 1989. Effect of von Willebrand factor coexpression on the synthesis and secretion of factor VIII in Chinese hamster ovary cells. Mol Cell Biol, 9, 1233-42.
KAUFMAN, R. J., WASLEY, L. C. & DORNER, A. J. 1988. Synthesis, processing, and secretion of recombinant human factor VIII expressed in mammalian cells. J Biol Chem, 263, 6352-62.
KAY, M. A., MANNO, C. S., RAGNI, M. V., LARSON, P. J., COUTO, L. B., MCCLELLAND, A., GLADER, B., CHEW, A. J., TAI, S. J., HERZOG, R. W., ARRUDA, V., JOHNSON, F., SCALLAN, C., SKARSGARD, E., FLAKE, A. W. & HIGH, K. A. 2000. Evidence for gene transfer and expression of factor IX in haemophilia B patients treated with an AAV vector. Nat Genet, 24, 257-61.
KEMBALL-COOK, G., TUDDENHAM, E. G. & WACEY, A. I. 1998. The factor VIII Structure and Mutation Resource Site: HAMSTeRS version 4. Nucleic Acids Res, 26, 216-9.
KEY, N. S. & NEGRIER, C. 2007. Coagulation factor concentrates: past, present, and future. Lancet, 370, 439-48.
KIM, N. S., BYUN, T. H. & LEE, G. M. 2001. Key determinants in the occurrence of clonal variation in humanized antibody expression of cho cells during dihydrofolate reductase mediated gene amplification. Biotechnol Prog, 17, 69-75.
KIM, S. J., KIM, N. S., RYU, C. J., HONG, H. J. & LEE, G. M. 1998. Characterization of chimeric antibody producing CHO cells in the course of dihydrofolate reductase-mediated gene amplification and their stability in the absence of selective pressure. Biotechnol Bioeng, 58, 73-84.
KHRENOV, A. V., ANANYEVA, N. M., SAENKO, E. L. 2006. Role of the B domain in proteolytic inactivation of activated coagulation factor VIII by activated protein C and activated factor X. Blood Coagul Fibrinolysis, 17(5): 379-88.
KOCHANEK, S. 1999. Development of high-capacity adenoviral vectors for gene therapy. Thromb Haemost, 82, 547-51.
KOCHANEK, S. 1999. High-capacity adenoviral vectors for gene transfer and somatic gene therapy. Hum Gene Ther, 10, 2451-9.
KOCHANEK, S., CLEMENS, P. R., MITANI, K., CHEN, H. H., CHAN, S. & CASKEY, C. T. 1996. A new adenoviral vector: Replacement of all viral coding sequences with 28 kb of DNA independently expressing both full-length dystrophin and beta-galactosidase. Proc Natl Acad Sci U S A, 93, 5731-6.
111
KOEDAM, J. A., HAMER, R. J., BEESER-VISSER, N. H., BOUMA, B. N. & SIXMA, J. J. 1990. The effect of von Willebrand factor on activation of factor VIII by factor Xa. Eur J Biochem, 189, 229-34.
KOST, T. A. et al. 2000. Biosafety and viral gene transfer vectors. In Biological Safety, Principles and practices (3rd edn) (Flemming, D. O. and Hunt, D. L., eds), pp. 579-597, ASM Press.
KOST, T. A. & CONDREAY, J. P. 2002. Recombinant baculoviruses as mammalian cell gene-delivery vectors. Trends Biotechnol, 20, 173-80.
KOST, T. A., CONDREAY, J. P. & JARVIS, D. L. 2005. Baculovirus as versatile vectors for protein expression in insect and mammalian cells. Nat Biotechnol, 23, 567-75.
KOZARSKY, K. F. & WILSON, J. M. 1993. Gene therapy: adenovirus vectors. Curr Opin Genet Dev, 3, 499-503.
KROUGLIAK, V. & GRAHAM, F. L. 1995. Development of cell lines capable of complementing E1, E4, and protein IX defective adenovirus type 5 mutants. Hum Gene Ther, 6, 1575-86.
LAPAN, K. A. & FAY, P. J. 1997. Localization of a factor X interactive site in the A1 subunit of factor VIIIa. J Biol Chem, 272, 2082-8.
LENTING, P. J., PEGON, J. N., CHRISTOPHE, O. D. & DENIS, C. V. 2010. Factor VIII and von Willebrand factor--too sweet for their own good. Haemophilia, 16 Suppl 5, 194-9.
LENTING, P. J., VAN MOURIK, J. A. & MERTENS, K. 1998. The life cycle of coagulation factor VIII in view of its structure and function. Blood, 92, 3983-96.
LEVINSON, B., KENWRICK, S., GAMEL, P., FISHER, K. & GITSCHIER, J. 1992. Evidence for a third transcript from the human factor VIII gene. Genomics, 14, 585-9.
LEVINSON, B., KENWRICK, S., LAKICH, D., HAMMONDS, G., JR. & GITSCHIER, J. 1990. A transcribed gene in an intron of the human factor VIII gene. Genomics, 7, 1-11.
LEYTE, A., VAN SCHIJNDEL, H. B., NIEHRS, C., HUTTNER, W. B., VERBEET, M. P., MERTENS, K. & VAN MOURIK, J. A. 1991. Sulfation of Tyr1680 of human blood coagulation factor VIII is essential for the interaction of factor VIII with von Willebrand factor. J Biol Chem, 266, 740-6.
LI, X. & GABRIEL, D. A. 1997. The physical exchange of factor VIII (FVIII) between von Willebrand factor and activated platelets and the effect of the FVIII B-domain on platelet binding. Biochemistry, 36, 10760-7.

112
LIN, P. H., LAIBELMAN, A. M. & SINHA, U. 1997. Reversible acylation of factor Xa as a potential therapy for hemophilia. Thromb Res, 88, 365-72.
LJUNG, R. C. 1999. Prophylactic infusion regimens in the management of hemophilia. Thromb Haemost. 82(2), 525-30.
LOLLAR, P. 2003. The factor VIII assay problem: neither rhyme nor reason. J Thromb Haemost, 1, 2275-9.
LOLLAR, P., FAY, P. J. & FASS, D. N. 1993. Factor VIII and factor VIIIa. Methods Enzymol, 222, 128-43.
LOZIER, J. N., METZGER, M. E., DONAHUE, R. E. & MORGAN, R. A. 1999. Adenovirus-mediated expression of human coagulation factor IX in the rhesus macaque is associated with dose-limiting toxicity. Blood, 94, 3968-75.
MANN, K. G. 1999. Biochemistry and physiology of blood coagulation. Thromb Haemost, 82, 165-74.
MANNO, C. S., CHEW, A. J., HUTCHISON, S., LARSON, P. J., HERZOG, R. W., ARRUDA, V. R., TAI, S. J., RAGNI, M. V., THOMPSON, A., OZELO, M., COUTO, L. B., LEONARD, D. G., JOHNSON, F. A., MCCLELLAND, A., SCALLAN, C., SKARSGARD, E., FLAKE, A. W., KAY, M. A., HIGH, K. A. & GLADER, B. 2003. AAV-mediated factor IX gene transfer to skeletal muscle in patients with severe hemophilia B. Blood, 101, 2963-72.
MARQUETTE, K. A., PITTMAN, D. D. & KAUFMAN, R. J. 1995. A 110-amino acid region within the A1-domain of coagulation factor VIII inhibits secretion from mammalian cells. J Biol Chem, 270, 10297-303.
MEULIEN, P., FAURE, T., MISCHLERF, HARRER, H., ULRICH, P., BOUDER- BALA, B., DOTT, K., SAINTEMARIE, M., MAZURIERC, CAZENAVE, J-P., COURTNEY, M., PAVIRANI, A. 1988. A new recombinant procoagulant protein derived from the cDNA encoding human factor VIII. Protein Eng, 2:301.
MIAO, H. Z., SIRACHAINAN, N., PALMER, L., KUCAB, P., CUNNINGHAM, M. A., KAUFMAN, R. J. & PIPE, S. W. 2004. Bioengineering of coagulation factor VIII for improved secretion. Blood, 103, 3412-9.
MIKAELSSON, M., OSWALDSSON, U. & JANKOWSKI, M. A. 2001. Measurement of factor VIII activity of B-domain deleted recombinant factor VIII. Semin Hematol, 38, 13-23.
MILLER, L. K., 1997. The Baculoviruses. Plenum Press, New York.

113
MITANI, K., GRAHAM, F. L., CASKEY, C. T. & KOCHANEK, S. 1995. Rescue, propagation, and partial purification of a helper virus-dependent adenovirus vector. Proc Natl Acad Sci U S A, 92, 3854-8.
MORRAL, N., O'NEAL, W., RICE, K., LELAND, M., KAPLAN, J., PIEDRA, P. A., ZHOU, H., PARKS, R. J., VELJI, R., AGUILAR-CORDOVA, E., WADSWORTH, S., GRAHAM, F. L., KOCHANEK, S., CAREY, K. D. & BEAUDET, A. L. 1999. Administration of helper- dependent adenoviral vectors and sequential delivery of different vector serotype for long- term liver-directed gene transfer in baboons. Proc Natl Acad Sci U S A, 96, 12816-21.
MORSY, M. A., GU, M., MOTZEL, S., ZHAO, J., LIN, J., SU, Q., ALLEN, H., FRANLIN, L., PARKS, R. J., GRAHAM, F. L., KOCHANEK, S., BETT, A. J. & CASKEY, C. T. 1998. An adenoviral vector deleted for all viral coding sequences results in enhanced safety and extended expression of a leptin transgene. Proc Natl Acad Sci U S A, 95, 7866-71.
MOUSSALLI, M., PIPE, S. W., HAURI, H. P., NICHOLS, W. C., GINSBURG, D. & KAUFMAN, R. J. 1999. Mannose-dependent endoplasmic reticulum (ER)-Golgi intermediate compartment-53-mediated ER to Golgi trafficking of coagulation factors V and VIII. J Biol Chem, 274, 32539-42.
MURPHY, S. L. & HIGH, K. A. 2008. Gene therapy for haemophilia. Br J Haematol, 140, 479-87.
NILSSON, I. M. 1992. The management of hemophilia patients with inhibitors. Transfus Med Rev, 6, 285-93.
NOGAMI, K., SHIMA, M., HOSOKAWA, K., NAGATA, M., KOIDE, T., SAENKO, E. L., TANAKA, I., SHIBATA, M. & YOSHIOKA, A. 2000. Factor VIII C2 domain contains the thrombin-binding site responsible for thrombin-catalyzed cleavage at Arg1689. J Biol Chem, 275, 25774-80.
NOGAMI, K., SHIMA, M., HOSOKAWA, K., SUZUKI, T., KOIDE, T., SAENKO, E. L., SCANDELLA, D., SHIBATA, M., KAMISUE, S., TANAKA, I. & YOSHIOKA, A. 1999. Role of factor VIII C2 domain in factor VIII binding to factor Xa. J Biol Chem, 274, 31000-7.
O'BRIEN, D. P., JOHNSON, D., BYFIELD, P. & TUDDENHAM, E. G. 1992. Inactivation of factor VIII by factor IXa. Biochemistry, 31, 2805-12.
O’REILLY, D. R., MILLER, L. K. and LUCKOW, V.A. 1992. Baculovirus Expression Vectors: A Laboratory Manual. W. H. Freeman, New York.
O’REILLY, D.R. et al., eds (1994). Baculovirus Expression Vectors, Oxford University Press.

114
PAGE, S. M. & BROWNLEE, G. G. 1997. An ex vivo keratinocyte model for gene therapy of hemophilia B. J Invest Dermatol, 109, 139-45.
PARKS, R. J. & GRAHAM, F. L. 1997. A helper-dependent system for adenovirus vector production helps define a lower limit for efficient DNA packaging. J Virol, 71, 3293-8.
PENNOCK, G. D., SHOEMAKER, C. & MILLER, L. K. 1984. Strong and regulated expression of Escherichia coli beta-galactosidase in insect cells with a baculovirus vector. Mol Cell Biol, 4, 399-406.
PIERONI, L. & LA MONICA, N. 2001. Towards the use of baculovirus as a gene therapy vector. Curr Opin Mol Ther, 3, 464-7.
PIETERS, J., LINDHOUT, T. & HEMKER, H. C. 1989. In situ-generated thrombin is the only enzyme that effectively activates factor VIII and factor V in thromboplastin-activated plasma. Blood, 74, 1021-4.
PIPE, S. W. 2009. Functional roles of the factor VIII B domain. Haemophilia, 15, 1187-96.
PIPE, S. W., MORRIS, J. A., SHAH, J. & KAUFMAN, R. J. 1998. Differential interaction of coagulation factor VIII and factor V with protein chaperones calnexin and calreticulin. J Biol Chem, 273, 8537-44.
PITTMAN, D. D., ALDERMAN, E. M., TOMKINSON, K. N., WANG, J. H., GILES, A. R. & KAUFMAN, R. J. 1993. Biochemical, immunological, and in vivo functional characterization of B-domain-deleted factor VIII. Blood, 81, 2925-35.
PITTMAN, D. D. & KAUFMAN, R. J. 1989. Structure-function relationships of factor VIII elucidated through recombinant DNA technology. Thromb Haemost, 61, 161-5.
PITTMAN, D. D., MILLENSON, M., MARQUETTE, K., BAUER, K. & KAUFMAN, R. J. 1992. A2 domain of human recombinant-derived factor VIII is required for procoagulant activity but not for thrombin cleavage. Blood, 79, 389-97.
POOLE, S., FIRTEL, R. A., LAMAR, E. & ROWEKAMP, W. 1981. Sequence and expression of the discoidin I gene family in Dictyostelium discoideum. J Mol Biol, 153, 273- 89.
POUSTKA, A., DIETRICH, A., LANGENSTEIN, G., TONIOLO, D., WARREN, S. T. & LEHRACH, H. 1991. Physical map of human Xq27-qter: localizing the region of the fragile X mutation. Proc Natl Acad Sci U S A, 88, 8302-6.

115
POWELL, J. S., RAGNI, M. V., WHITE, G. C., 2ND, LUSHER, J. M., HILLMAN- WISEMAN, C., MOON, T. E., COLE, V., RAMANATHAN-GIRISH, S., ROEHL, H., SAJJADI, N., JOLLY, D. J. & HURST, D. 2003. Phase 1 trial of FVIII gene transfer for severe hemophilia A using a retroviral construct administered by peripheral intravenous infusion. Blood, 102, 2038-45.
RAGNI, M. V. 2004. Hemophilia gene transfer: comparison with conventional protein replacement therapy. Semin Thromb Hemost, 30, 239-47.
RATNOFF O. D. (1991) Evolution of knowledge about hemostasis. In RATNOFF O. D., FORBES C. D. (eds): Disorders of hemostasis, 2nd edn. WB Saunders, Philadelphia, pp. 1-17.
RAY, M. J. & HAWSON, G. A. 1989. A comparison of two APTT reagents which use silica activators. Clin Lab Haematol, 11, 221-32.
REDDY, P. S., SAKHUJA, K., GANESH, S., YANG, L., KAYDA, D., BRANN, T., PATTISON, S., GOLIGHTLY, D., IDAMAKANTI, N., PINKSTAFF, A., KALOSS, M., BARJOT, C., CHAMBERLAIN, J. S., KALEKO, M. & CONNELLY, S. 2002. Sustained human factor VIII expression in hemophilia A mice following systemic delivery of a gutless adenoviral vector. Mol Ther, 5, 63-73.
REGAN, L. M., O'BRIEN, L. M., BEATTIE, T. L., SUDHAKAR, K., WALKER, F. J. & FAY, P. J. 1996. Activated protein C-catalyzed proteolysis of factor VIIIa alters its interactions within factor Xase. J Biol Chem, 271, 3982-7.
RICK, M. E., ESMON, N. L. & KRIZEK, D. M. 1990. Factor IXa and von Willebrand factor modify the inactivation of factor VIII by activated protein C. J Lab Clin Med, 115, 415-21.
ROGOFF, E. G., GUIRGUIS, H. S., LIPTON, R. A., SEREMETIS, S. V., DIMICHELE, D. M., AGNEW, G. M., KARPATKIN, M., BARISH, R. J., JONES, R. L., BIANCO, C., KNOTHE, B. D. & LEE, M. S. 2002. The upward spiral of drug costs: a time series analysis of drugs used in the treatment of hemophilia. Thromb Haemost, 88, 545-53.
ROSENBERG, J. B., GREENGARD, J. S. & MONTGOMERY, R. R. 2000. Genetic induction of a releasable pool of factor VIII in human endothelial cells. Arterioscler Thromb Vasc Biol, 20, 2689-95.
ROTH, D. A., TAWA, N. E., JR., O'BRIEN, J. M., TRECO, D. A., SELDEN, R. F. & FACTOR, V. T. T. S. G. 2001. Nonviral transfer of the gene encoding coagulation factor VIII in patients with severe hemophilia A. N Engl J Med, 344, 1735-42.
SAENKO, E. L., SHIMA, M. & SARAFANOV, A. G. 1999. Role of activation of the coagulation factor VIII in interaction with vWf, phospholipid, and functioning within the factor Xase complex. Trends Cardiovasc Med, 9, 185-92.

116
SAMBROOK, J. and RUSSELL, D. W. 2001. Molecular Cloning: A Laboratory Manual (3rd ed.). Cold Spring Harbor Laboratory Press.
SANCAR, G. B., SMITH, F. W. & SANCAR, A. 1983. Identification and amplification of the E. coli phr gene product. Nucleic Acids Res, 11, 6667-78.
SANDBERG, H., ALMSTEDT, A., BRANDT, J., GRAY, E., HOLMQUIST, L., OSWALDSSON, U., SEBRING, S. & MIKAELSSON, M. 2001. Structural and functional characteristics of the B-domain-deleted recombinant factor VIII protein, r-VIII SQ. Thromb Haemost, 85, 93-100.
SANDIG, V., HOFMANN, C., STEINERT, S., JENNINGS, G., SCHLAG, P. & STRAUSS, M. 1996. Gene transfer into hepatocytes and human liver tissue by baculovirus vectors. Hum Gene Ther, 7, 1937-45.
SARAFANOV, A. G., ANANYEVA, N. M., SHIMA, M. & SAENKO, E. L. 2001. Cell surface heparan sulfate proteoglycans participate in factor VIII catabolism mediated by low density lipoprotein receptor-related protein. J Biol Chem, 276, 11970-9.
SCHAFER, A. I. 1994 Coagulation Cascade: an Overview. In LOSCALZO J., SSCHAFER A. I. (eds): Thrombosis and Hemorrhage. Blackwell Scientific, Boston, pp. 3-12.
SCHAGEN, F. H., OSSEVOORT, M., TOES, R. E. & HOEBEN, R. C. 2004. Immune responses against adenoviral vectors and their transgene products: a review of strategies for evasion. Crit Rev Oncol Hematol, 50, 51-70.
SCHIEDNER, G., MORRAL, N., PARKS, R. J., WU, Y., KOOPMANS, S. C., LANGSTON, C., GRAHAM, F. L., BEAUDET, A. L. & KOCHANEK, S. 1998. Genomic DNA transfer with a high-capacity adenovirus vector results in improved in vivo gene expression and decreased toxicity. Nat Genet, 18, 180-3.
SCHNELL, M. A., ZHANG, Y., TAZELAAR, J., GAO, G. P., YU, Q. C., QIAN, R., CHEN, S. J., VARNAVSKI, A. N., LECLAIR, C., RAPER, S. E. & WILSON, J. M. 2001. Activation of innate immunity in nonhuman primates following intraportal administration of adenoviral vectors. Mol Ther, 3, 708-22.
SCHWARZ, H. P., LENTING, P. J., BINDER, B., MIHALY, J., DENIS, C., DORNER, F. & TURECEK, P. L. 2000. Involvement of low-density lipoprotein receptor-related protein (LRP) in the clearance of factor VIII in von Willebrand factor-deficient mice. Blood, 95, 1703-8.
SHOJI, I., AIZAKI, H., TANI, H., ISHII, K., CHIBA, T., SAITO, I., MIYAMURA, T. & MATSUURA, Y. 1997. Efficient gene transfer into various mammalian cells, including non- hepatic cells, by baculovirus vectors. J Gen Virol, 78 ( Pt 10), 2657-64.

117
SMITH, G. E., SUMMERS, M. D. & FRASER, M. J. 1983. Production of human beta interferon in insect cells infected with a baculovirus expression vector. Mol Cell Biol, 3, 2156-65.
SOLLERBRANT, K., ELMEN, J., WAHLESTEDT, C., ACKER, J., LEBLOIS-PREHAUD, H., LATTA-MAHIEU, M., YEH, P. & PERRICAUDET, M. 2001. A novel method using baculovirus-mediated gene transfer for production of recombinant adeno-associated virus vectors. J Gen Virol, 82, 2051-60.
SOUCIE, J. M., EVATT, B. & JACKSON, D. 1998. Occurrence of hemophilia in the United States. The Hemophilia Surveillance System Project Investigators. Am J Hematol, 59, 288-94.
SROUR, M. A., GRUPP, J., ABURUBAIHA, Z., ALBERT, T., BRONDKE, H., OLDENBURG, J. & SCHWAAB, R. 2008. Modified expression of coagulation factor VIII by addition of a glycosylation site at the N terminus of the protein. Ann Hematol, 87, 107-12.
STUBBS, J. D., LEKUTIS, C., SINGER, K. L., BUI, A., YUZUKI, D., SRINIVASAN, U. & PARRY, G. 1990. cDNA cloning of a mouse mammary epithelial cell surface protein reveals the existence of epidermal growth factor-like domains linked to factor VIII-like sequences. Proc Natl Acad Sci U S A, 87, 8417-21.
SWAROOP, M., MOUSSALLI, M., PIPE, S. W. & KAUFMAN, R. J. 1997. Mutagenesis of a potential immunoglobulin-binding protein-binding site enhances secretion of coagulation factor VIII. J Biol Chem, 272, 24121-4.
THOMPSON, A. R. 2003. Structure and function of the factor VIII gene and protein. Semin Thromb Hemost, 29, 11-22.
THORREZ, L., VANDENDRIESSCHE, T., COLLEN, D. & CHUAH, M. K. 2004. Preclinical gene therapy studies for hemophilia using adenoviral vectors. Semin Thromb Hemost, 30, 173-83.
TOOLE, J. J., KNOPF, J. L., WOZNEY, J. M., SULTZMAN, L. A., BUECKER, J. L., PITTMAN, D. D., KAUFMAN, R. J., BROWN, E., SHOEMAKER, C., ORR, E. C. & ET AL. 1984. Molecular cloning of a cDNA encoding human antihaemophilic factor. Nature, 312, 342-7.
TUDDENHAM, E. G. 2003. In search of the eighth factor: a personal reminiscence. J Thromb Haemost, 1, 403-9.
TUDDENHAM, E. G., SCHWAAB, R., SEEHAFER, J., MILLAR, D. S., GITSCHIER, J., HIGUCHI, M., BIDICHANDANI, S., CONNOR, J. M., HOYER, L. W., YOSHIOKA, A. & ET AL. 1994. Haemophilia A: database of nucleotide substitutions, deletions, insertions and rearrangements of the factor VIII gene, second edition. Nucleic Acids Res, 22, 3511-33.

118
TURI, D. C. & PEERSCHKE, E. I. 1986. Sensitivity of three activated partial thromboplastin time reagents to coagulation factor deficiencies. Am J Clin Pathol, 85, 43-9.
URNOV, F. D., MILLER, J. C., LEE, Y. L., BEAUSEJOUR, C. M., ROCK, J. M., AUGUSTUS, S., JAMIESON, A. C., PORTEUS, M. H., GREGORY, P. D. & HOLMES, M. C. 2005. Highly efficient endogenous human gene correction using designed zinc-finger nucleases. Nature, 435, 646-51.
VAN DE VEN, W. J., VOORBERG, J., FONTIJN, R., PANNEKOEK, H., VAN DEN OUWELAND, A. M., VAN DUIJNHOVEN, H. L., ROEBROEK, A. J. & SIEZEN, R. J. 1990. Furin is a subtilisin-like proprotein processing enzyme in higher eukaryotes. Mol Biol Rep, 14, 265-75.
VAN DEN BESSELAAR, A. M., NEUTEBOOM, J. & BERTINA, R. M. 1993. Effect of synthetic phospholipids on the response of the activated partial thromboplastin time to heparin. Blood Coagul Fibrinolysis, 4, 895-903.
VAN DIEIJEN, G., TANS, G., ROSING, J. & HEMKER, H. C. 1981. The role of phospholipid and factor VIIIa in the activation of bovine factor X. J Biol Chem, 256, 3433-42.
VANDENDRIESSCHE, T., VANSLEMBROUCK, V., GOOVAERTS, I., ZWINNEN, H., VANDERHAEGHEN, M. L., COLLEN, D. & CHUAH, M. K. 1999. Long-term expression of human coagulation factor VIII and correction of hemophilia A after in vivo retroviral gene transfer in factor VIII-deficient mice. Proc Natl Acad Sci U S A, 96, 10379-84.
VAUGHN, J. L., GOODWIN, R. H., TOMPKINS, G. J. & MCCAWLEY, P. 1977. The establishment of two cell lines from the insect Spodoptera frugiperda (Lepidoptera; Noctuidae). In Vitro, 13, 213-7.
VEHAR, G. A., KEYT, B., EATON, D., RODRIGUEZ, H., O'BRIEN, D. P., ROTBLAT, F., OPPERMANN, H., KECK, R., WOOD, W. I., HARKINS, R. N. & ET AL. 1984. Structure of human factor VIII. Nature, 312, 337-42.
VLOT, A. J., KOPPELMAN, S. J., VAN DEN BERG, M. H., BOUMA, B. N. & SIXMA, J. J. 1995. The affinity and stoichiometry of binding of human factor VIII to von Willebrand factor. Blood, 85, 3150-7.
VORBURGER, S. A. & HUNT, K. K. 2002. Adenoviral gene therapy. Oncologist, 7, 46-59. Williams Hematology, 5th edition, 1995.
WION, K. L., KELLY, D., SUMMERFIELD, J. A., TUDDENHAM, E. G. & LAWN, R. M. 1985. Distribution of factor VIII mRNA and antigen in human liver and other tissues. Nature, 317, 726-9.
119
WOOD, W. I., CAPON, D. J., SIMONSEN, C. C., EATON, D. L., GITSCHIER, J., KEYT, B., SEEBURG, P. H., SMITH, D. H., HOLLINGSHEAD, P., WION, K. L. & ET AL. 1984. Expression of active human factor VIII from recombinant DNA clones. Nature, 312, 330-7.
YAO, S. N., WILSON, J. M., NABEL, E. G., KURACHI, S., HACHIYA, H. L. & KURACHI, K. 1991. Expression of human factor IX in rat capillary endothelial cells: toward somatic gene therapy for hemophilia B. Proc Natl Acad Sci U S A, 88, 8101-5.
YEH, P., DEDIEU, J. F., ORSINI, C., VIGNE, E., DENEFLE, P. & PERRICAUDET, M. 1996. Efficient dual transcomplementation of adenovirus E1 and E4 regions from a 293- derived cell line expressing a minimal E4 functional unit. J Virol, 70, 559-65.
ZOU, L., ZHOU, H., PASTORE, L. & YANG, K. 2000. Prolonged transgene expression mediated by a helper-dependent adenoviral vector (hdAd) in the central nervous system. Mol Ther, 2, 105-13.

120
7. Appendix
Schematic representation of the newly constructed B-domain deleted expression vectors (pMT2-F8-BDD,
pMT2-F8-101, pMT2-F8-202, pMT2-F8-292, pMT2-F8-394).
109
7. Appendix
Schematic representation of the newly constructed B-domain deleted expression vectors (pMT2-F8-BDD,
pMT2-F8-101, pMT2-F8-202, pMT2-F8-292, pMT2-F8-394).