Full Year Results 2011 - AstraZeneca · Sl dM kti 7 • Externalisation - Sales and Marketing -...
57
Full Year Results 2011
Transcript of Full Year Results 2011 - AstraZeneca · Sl dM kti 7 • Externalisation - Sales and Marketing -...

Full Year Results2011

Cautionary statement regardingforward-looking statementsforward-looking statements
In order, among other things, to utilise the 'safe harbour' provisions of the US Private Securities Litigation Reform Act 1995, we are providing the
f ll i i Thi i i i f d l ki i h h i f dfollowing cautionary statement: This presentation contains certain forward-looking statements with respect to the operations, performance and
financial condition of the Group. Although we believe our expectations are based on reasonable assumptions, any forward-looking statements,
by their very nature, involve risks and uncertainties and may be influenced by factors that could cause actual outcomes and results to be
materially different from those predicted. The forward-looking statements reflect knowledge and information available at the date of preparation
of this presentation and AstraZeneca undertakes no obligation to update these forward-looking statements. We identify the forward-looking
statements by using the words 'anticipates', 'believes', 'expects', 'intends' and similar expressions in such statements. Important factors that
could cause actual results to differ materially from those contained in forward-looking statements, certain of which are beyond our control,
include, among other things: the loss or expiration of patents, marketing exclusivity or trade marks, or the risk of failure to obtain patent
protection; the risk of substantial adverse litigation/government investigation claims and insufficient insurance coverage; exchange rate
fluctuations; the risk that R&D will not yield new products that achieve commercial success; the risk that strategic alliances and acquisitions will
be unsuccessful; the impact of competition, price controls and price reductions; taxation risks; the risk of substantial product liability claims; the
impact of any failure by third parties to supply materials or services; the risk of failure to manage a crisis; the risk of delay to new product
launches; the difficulties of obtaining and maintaining regulatory approvals for products; the risk of failure to observe ongoing regulatory
oversight; the risk that new products do not perform as we expect; the risk of environmental liabilities; the risks associated with conducting
business in emerging markets; the risk of reputational damage; the risk of product counterfeiting; the risk of failure to successfully implement
planned cost reduction measures through productivity initiatives and restructuring programmes; the risk that regulatory approval processes for
2
p a ed cost educt o easu es t oug p oduct ty t at es a d est uctu g p og a es; t e s t at egu ato y app o a p ocesses o
biosimilars could have an adverse effect on future commercial prospects; and the impact of increasing implementation and enforcement of more
stringent anti-bribery and anti-corruption legislation. Nothing in this presentation should be construed as a profit forecast.

Full Year Results2011
David Brennan, CEO
30 00030,000CV deaths that could be prevented if Brilinta was used instead of current t d d f i th >3 illi l ACS ti t i th G8 t istandard of care in the >3 million annual ACS patients in the G8 countries
%
65 of AstraZeneca revenue growth that has come from Emerging Markets in the last 5 years
%
65 in the last 5 years
$3 AstraZeneca revenue in 2011 lost to generic competitionbillion
4
$3 AstraZeneca revenue in 2011 lost to generic competitionand government interventions on pricing
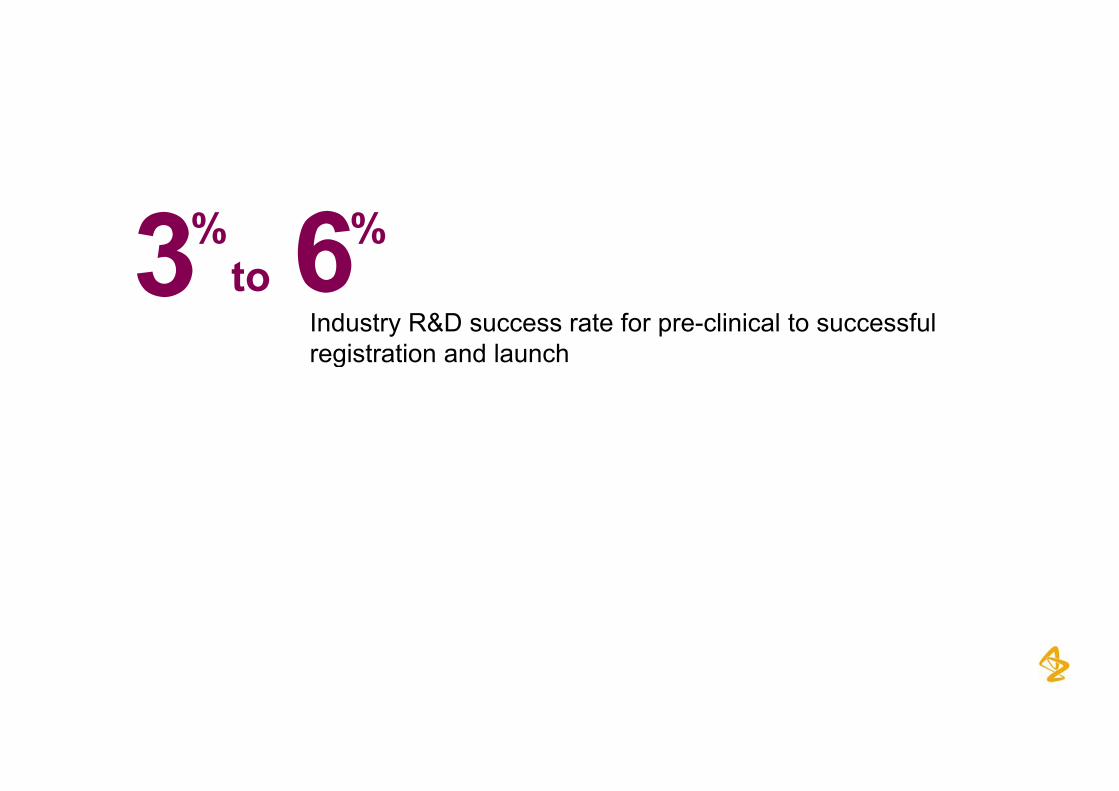
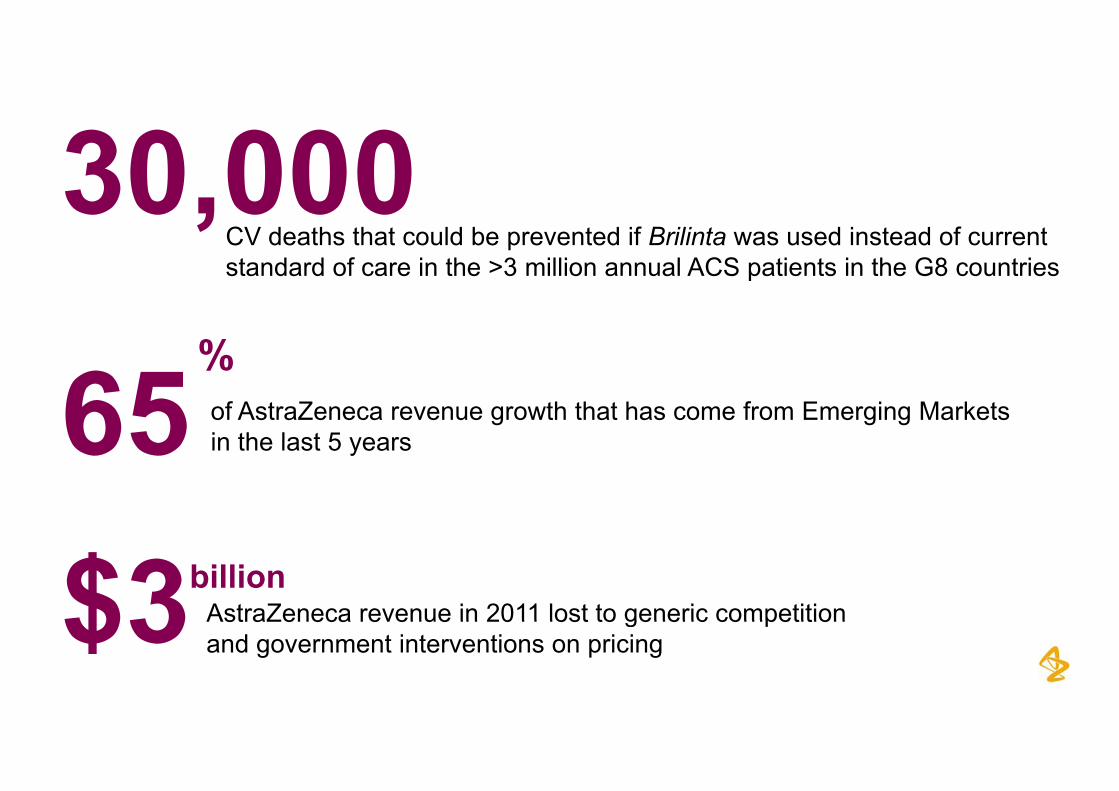
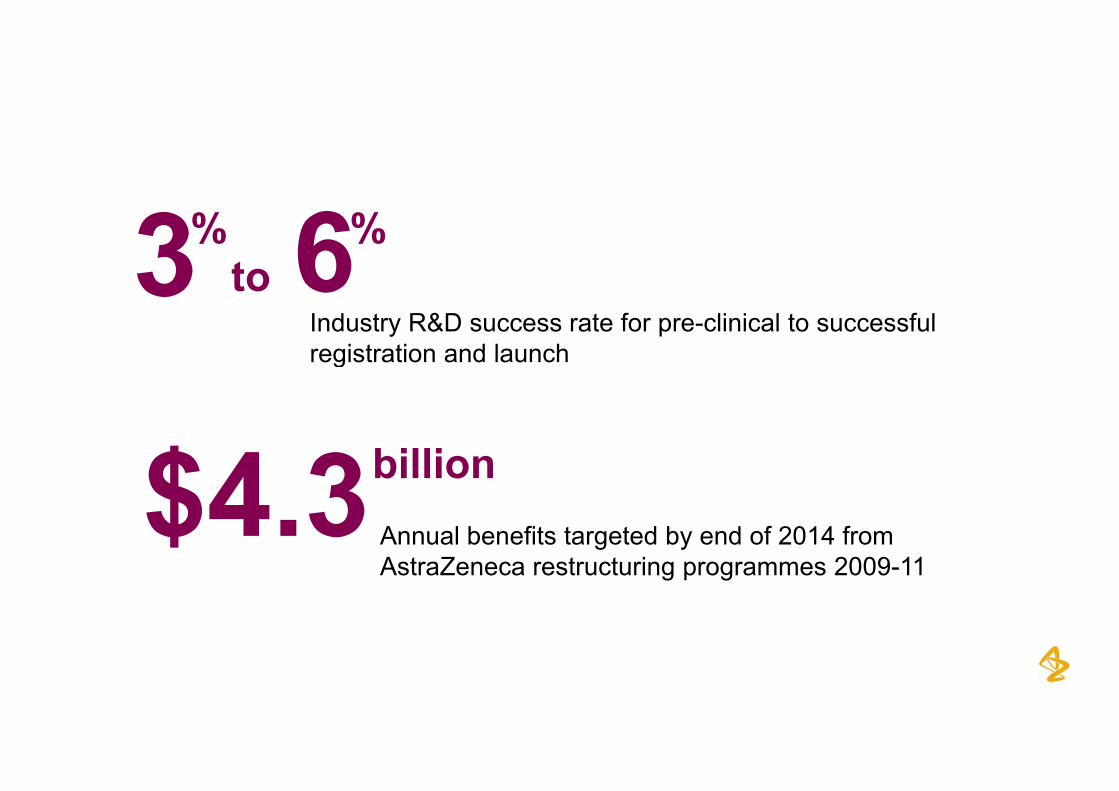
3 %6%3Industry R&D success rate for pre-clinical to successful registration and launch
6toregistration and launch
5
3 %6%3Industry R&D success rate for pre-clinical to successful registration and launch
6toregistration and launch
$4.3 A l b fit t t d b d f 2014 f
billion$4.3 Annual benefits targeted by end of 2014 from AstraZeneca restructuring programmes 2009-11
6
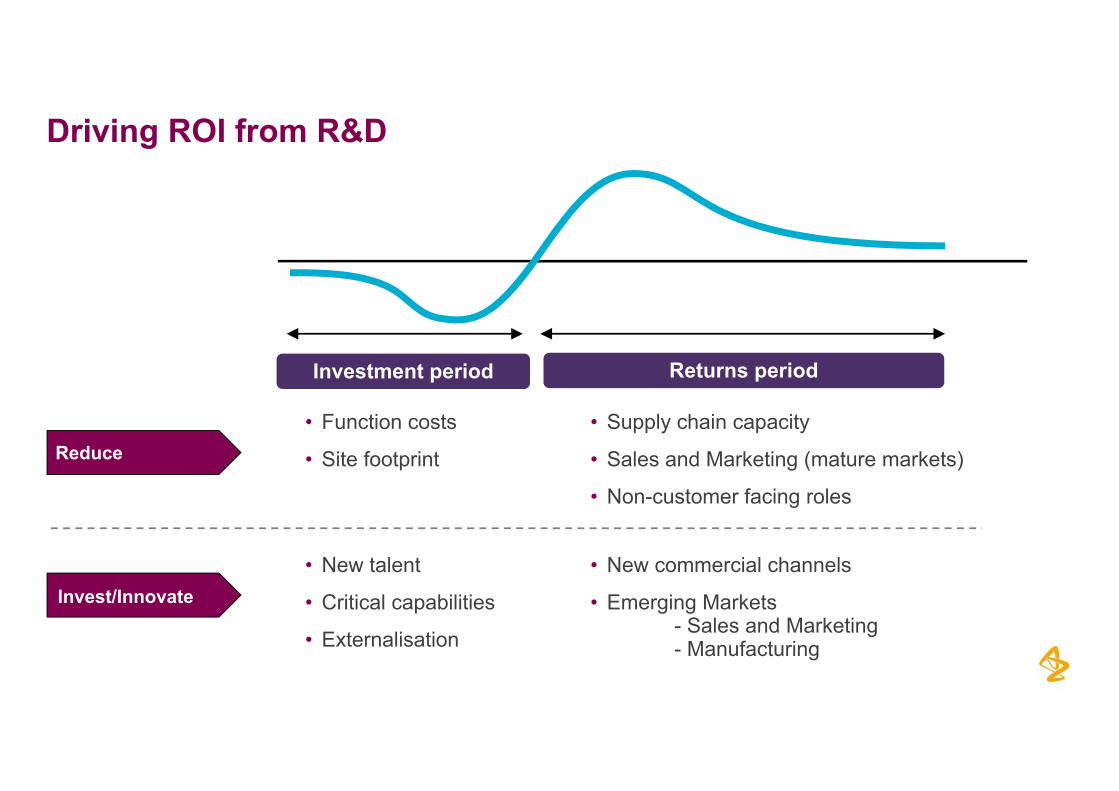
Driving ROI from R&D
Returns periodInvestment period
• Function costs • Supply chain capacity
• Site footprint • Sales and Marketing (mature markets)
• Non-customer facing roles
Reduce
Invest/Innovate• New talent
• Critical capabilities
• New commercial channels
• Emerging MarketsS l d M k ti
7
• Externalisation - Sales and Marketing- Manufacturing
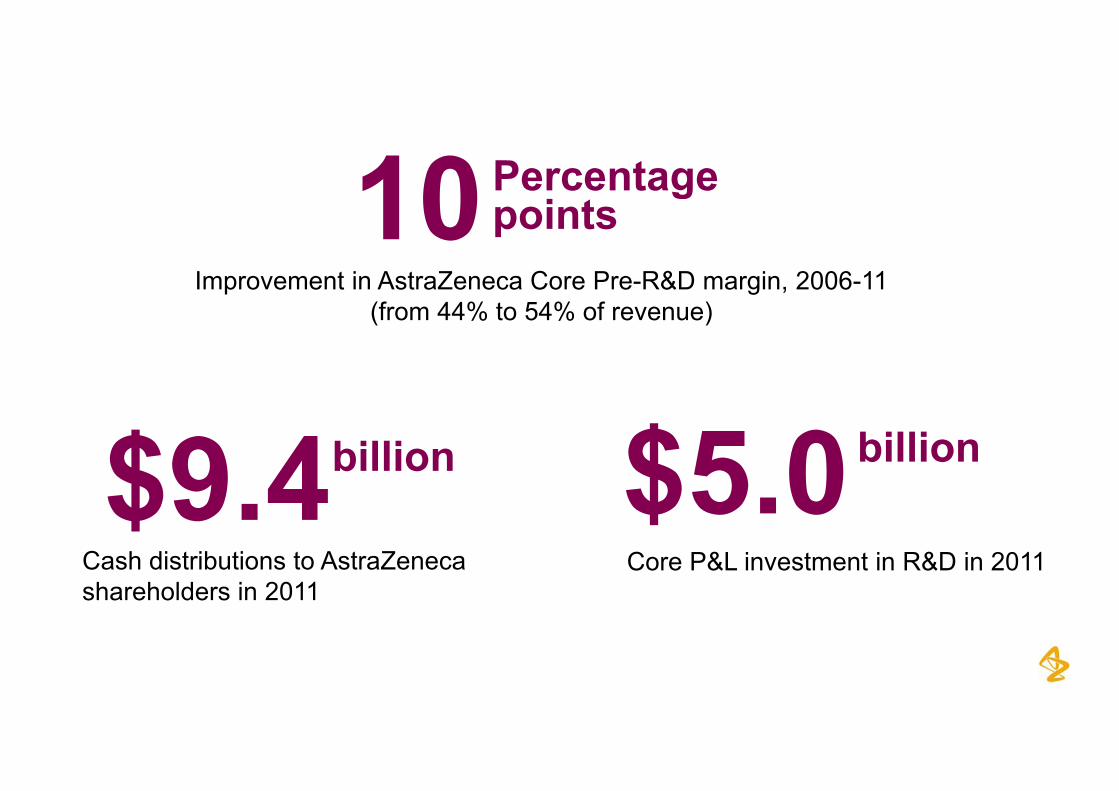
10Percentage10Percentagepoints
Improvement in AstraZeneca Core Pre-R&D margin, 2006-11 (from 44% to 54% of revenue)
$9 4 $5 0billion$9.4 $5.0billion billion$Cash distributions to AstraZeneca shareholders in 2011
Core P&L investment in R&D in 2011
8

Full Year Results2011
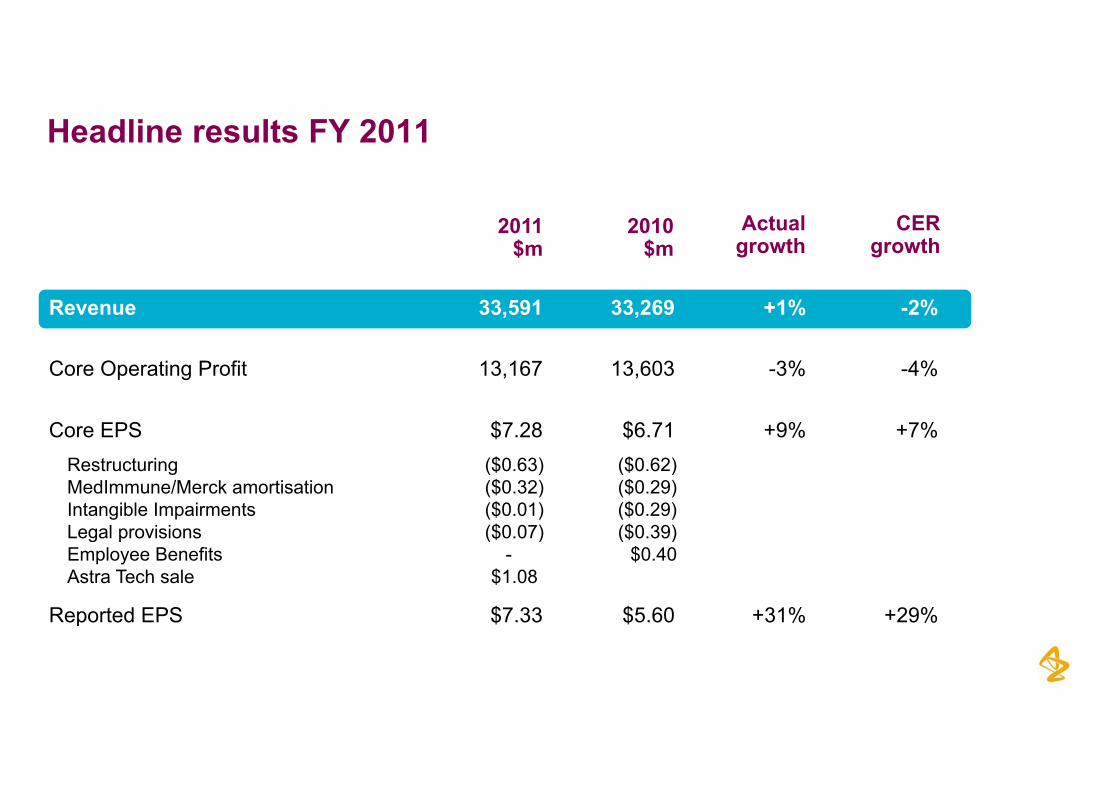
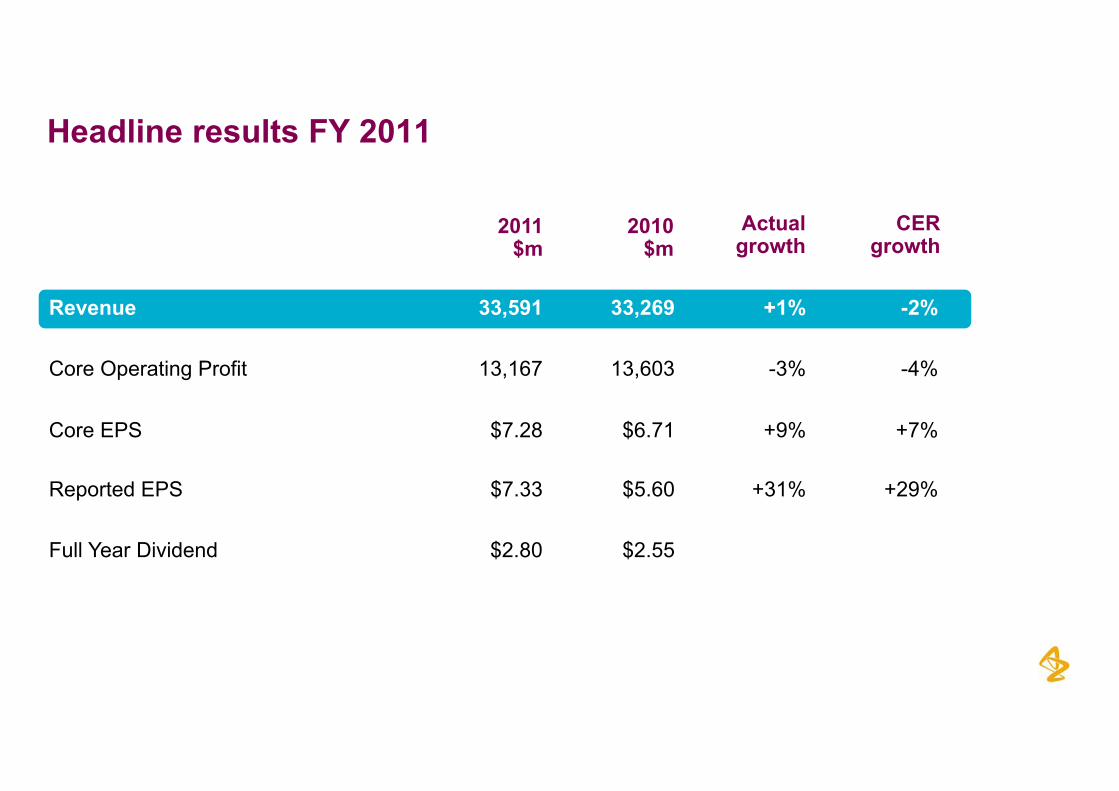
Headline results FY 2011
CERgrowth
2011$m
Actualgrowth
2010$m
Revenue 33,591 33,269 +1% -2%
Core Operating Profit 13,167 13,603 -3% -4%
Core EPS $7.28 $6.71 +9% +7%Restructuring ($0.63) ($0.62)MedImmune/Merck amortisation ($0.32) ($0.29) Intangible Impairments ($0.01) ($0.29)Legal provisions ($0 07) ($0 39)Legal provisions ($0.07) ($0.39) Employee Benefits - $0.40Astra Tech sale $1.08
Reported EPS $7.33 $5.60 +31% +29%
10
Reported EPS $7.33 $5.60 31% 29%
Headline results FY 2011
CERgrowth
2011$m
Actualgrowth
2010$m
Revenue 33,591 33,269 +1% -2%
Core Operating Profit 13,167 13,603 -3% -4%
Core EPS $7.28 $6.71 +9% +7%
Reported EPS $7.33 $5.60 +31% +29%
Full Year Dividend $2.80 $2.55
11

Full Year Results2011
Simon Lowth, Chief Financial Officer
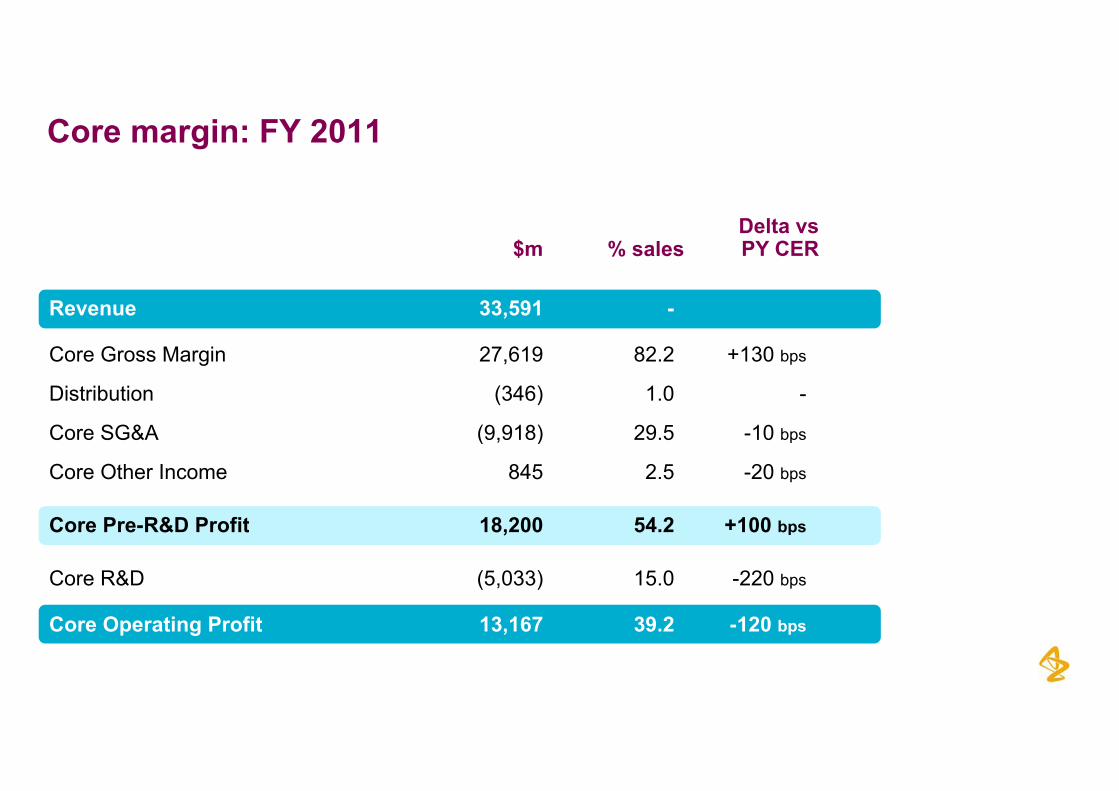
Core margin: FY 2011
Delta vsPY CER$m % sales
Revenue 33,591 -
Core Gross Margin 27 619 82 2 +130 bCore Gross Margin 27,619 82.2 +130 bps
Distribution (346) 1.0 -
Core SG&A (9,918) 29.5 -10 bps( , ) p
Core Other Income 845 2.5 -20 bps
Core Pre-R&D Profit 18,200 54.2 +100 bpsCore Pre R&D Profit 18,200 54.2 100 bps
Core R&D (5,033) 15.0 -220 bps
Core Operating Profit 13 167 39 2 120 b
13
Core Operating Profit 13,167 39.2 -120 bps
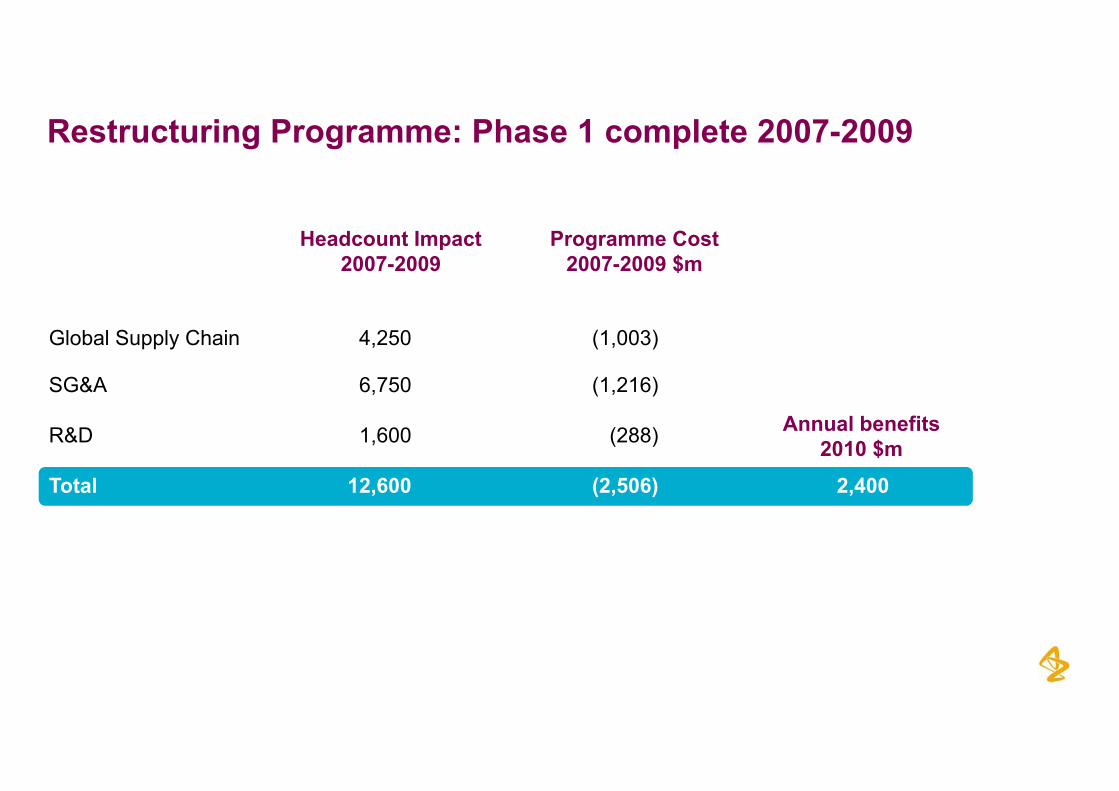
Restructuring Programme: Phase 1 complete 2007-2009
Programme Cost2007 2009 $m
Headcount Impact2007 2009
Global Supply Chain 4,250 (1,003)
2007-2009 $m2007-2009
SG&A 6,750 (1,216)
R&D 1,600 (288) Annual benefits$R&D 1,600 (288)
Total 12,600 (2,506) 2,400
2010 $m
14
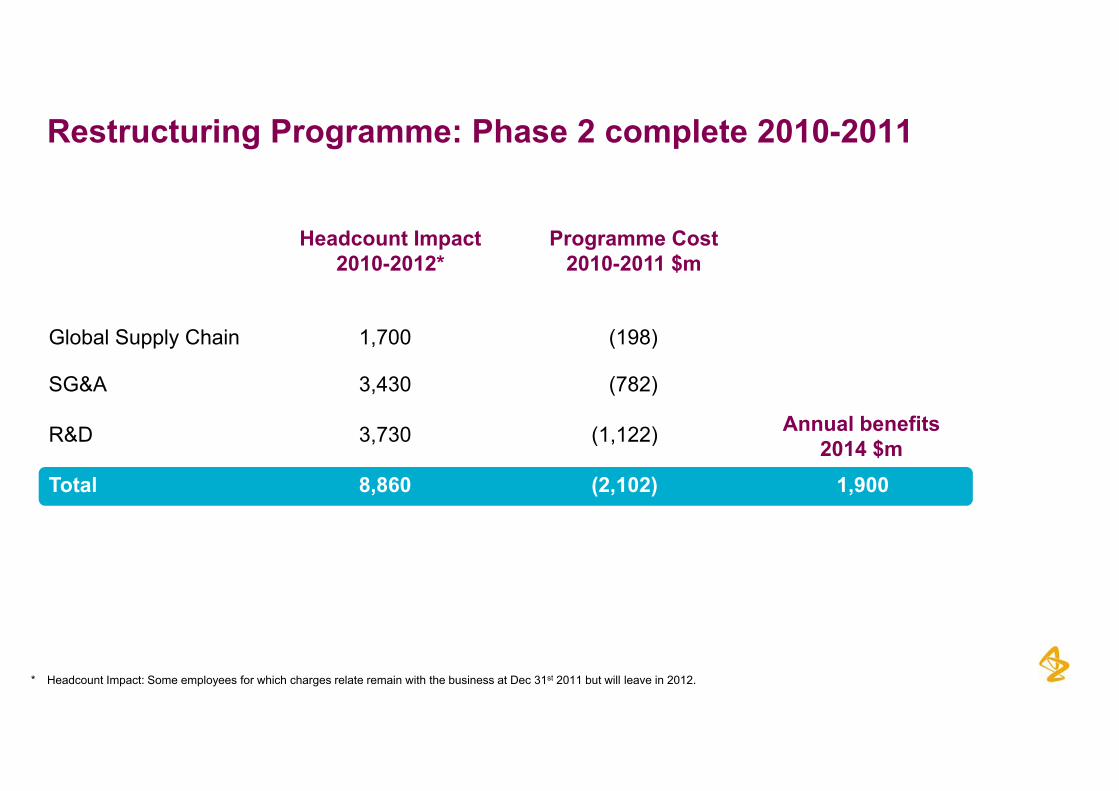
Restructuring Programme: Phase 2 complete 2010-2011
Headcount Impact2010 2012*
Programme Cost2010 2011 $m
Global Supply Chain 1,700 (198)
2010-2012* 2010-2011 $m
SG&A 3,430 (782)
R&D 3,730 (1,122) Annual benefits$R&D 3,730 (1,122)
Total 8,860 (2,102) 1,9002014 $m
15* Headcount Impact: Some employees for which charges relate remain with the business at Dec 31st 2011 but will leave in 2012.
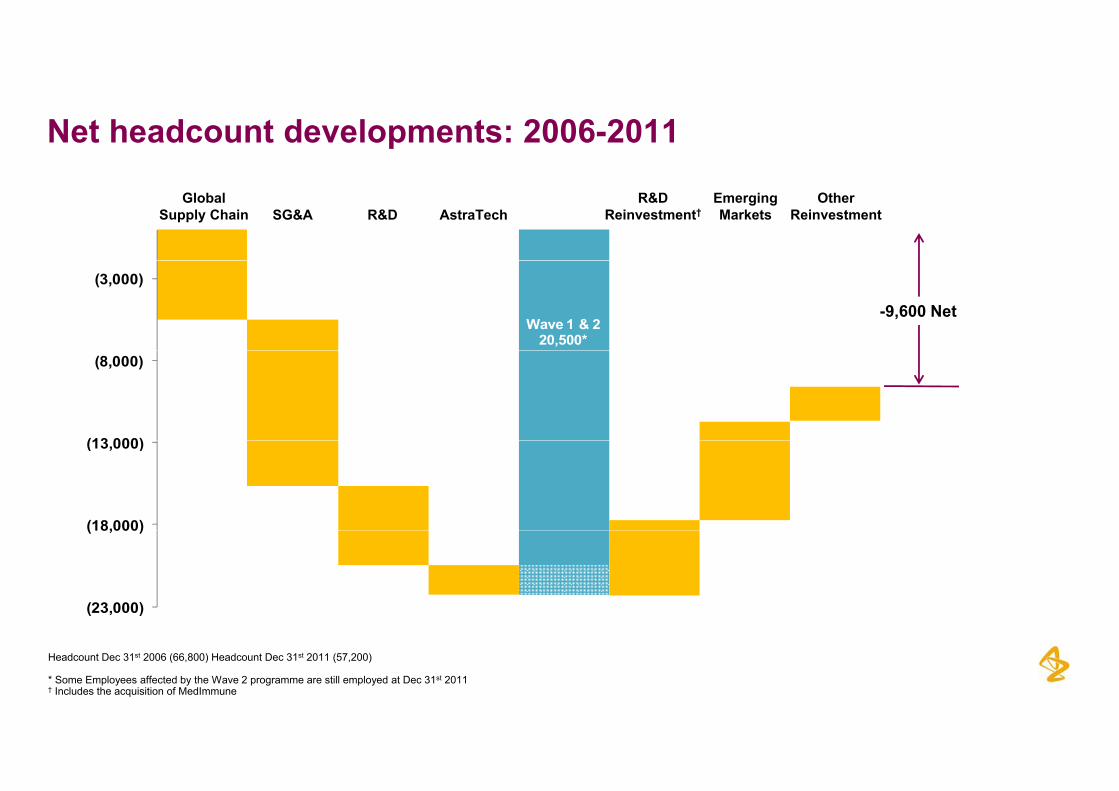
Net headcount developments: 2006-2011
GlobalSupply Chain SG&A R&D AstraTech
R&D Reinvestment†
Emerging Markets
Other Reinvestment
(3,000)
Wave 1 & 220,500*
-9,600 Net
(13 000)
(8,000)
(18,000)
(13,000)
(23,000)
(18,000)
16
Headcount Dec 31st 2006 (66,800) Headcount Dec 31st 2011 (57,200)
* Some Employees affected by the Wave 2 programme are still employed at Dec 31st 2011† Includes the acquisition of MedImmune
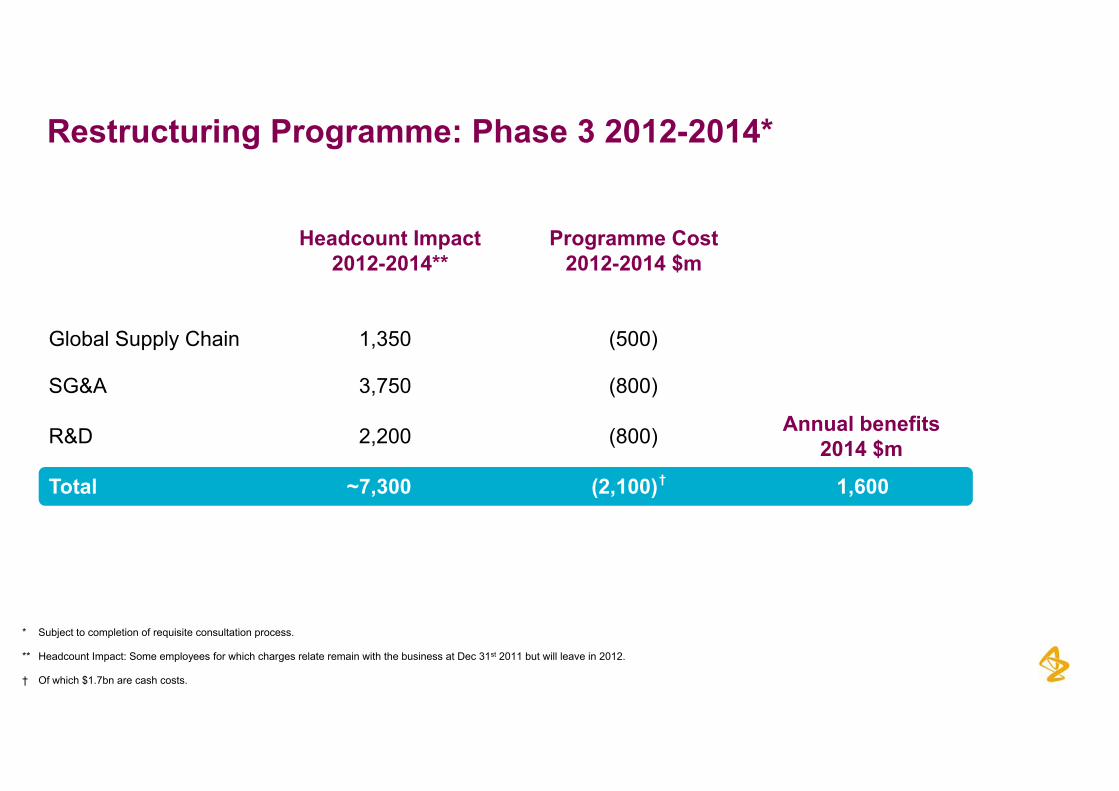
Restructuring Programme: Phase 3 2012-2014*
Headcount Impact2012 2014**
Programme Cost2012 2014 $m
Global Supply Chain 1,350 (500)
2012-2014** 2012-2014 $m
Annual benefits$
SG&A 3,750 (800)
R&D 2 200 (800) 2014 $mR&D 2,200 (800)
Total ~7,300 (2,100) 1,600†
17
* Subject to completion of requisite consultation process.
** Headcount Impact: Some employees for which charges relate remain with the business at Dec 31st 2011 but will leave in 2012.
† Of which $1.7bn are cash costs.

2011 Use of Cash
$bn, Act RoX
1 8
183.3
40% Reinvestment Rate $9.4bn Returnto Shareholders
1.8AstraTech
12
14
16
1.13.8
11.1
8
10
12
5.6
3.7
2
4
6
2.88.3
0
2
Opening Net Cash
Pre R&D R&D Capex Dividends Net SBB ClosingNet Cash
18
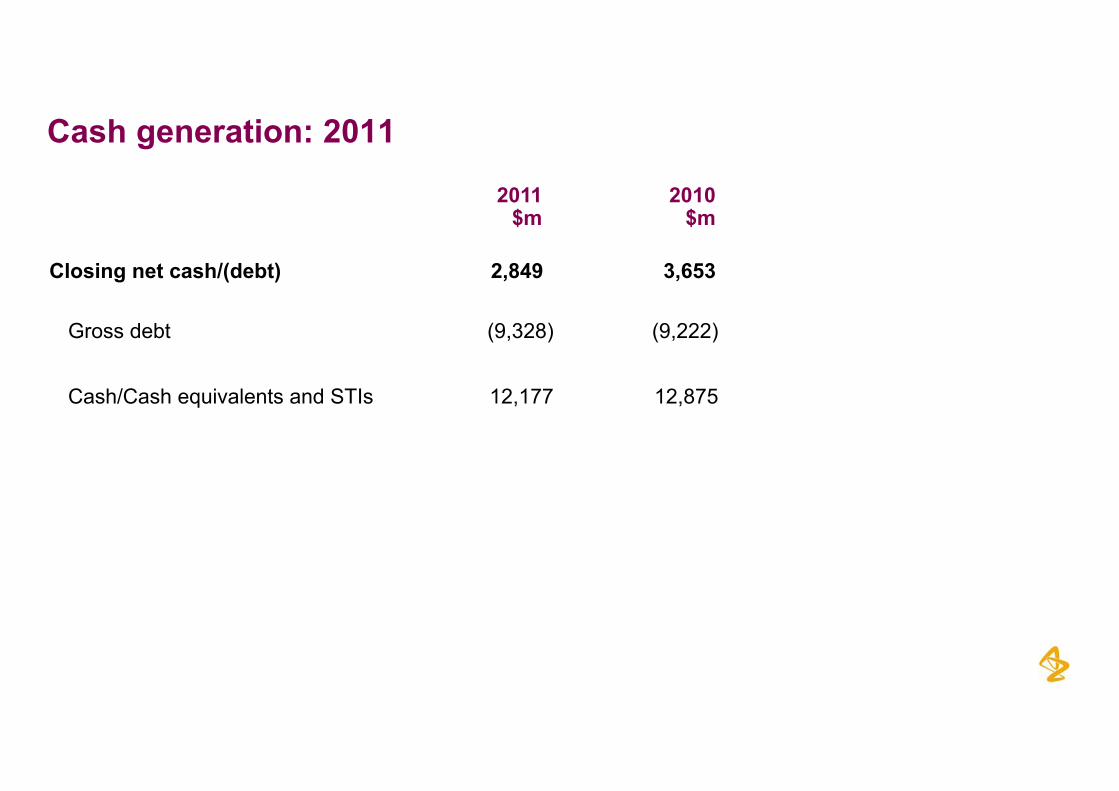
Cash generation: 2011
2010$m
2011$m
Gross debt (9,328) (9,222)
Closing net cash/(debt) 2,849 3,653
Cash/Cash equivalents and STIs 12,177 12,875
19

Cash priorities
• Invest in the business
• Debt service
• Progressive dividend
• Share repurchases
20
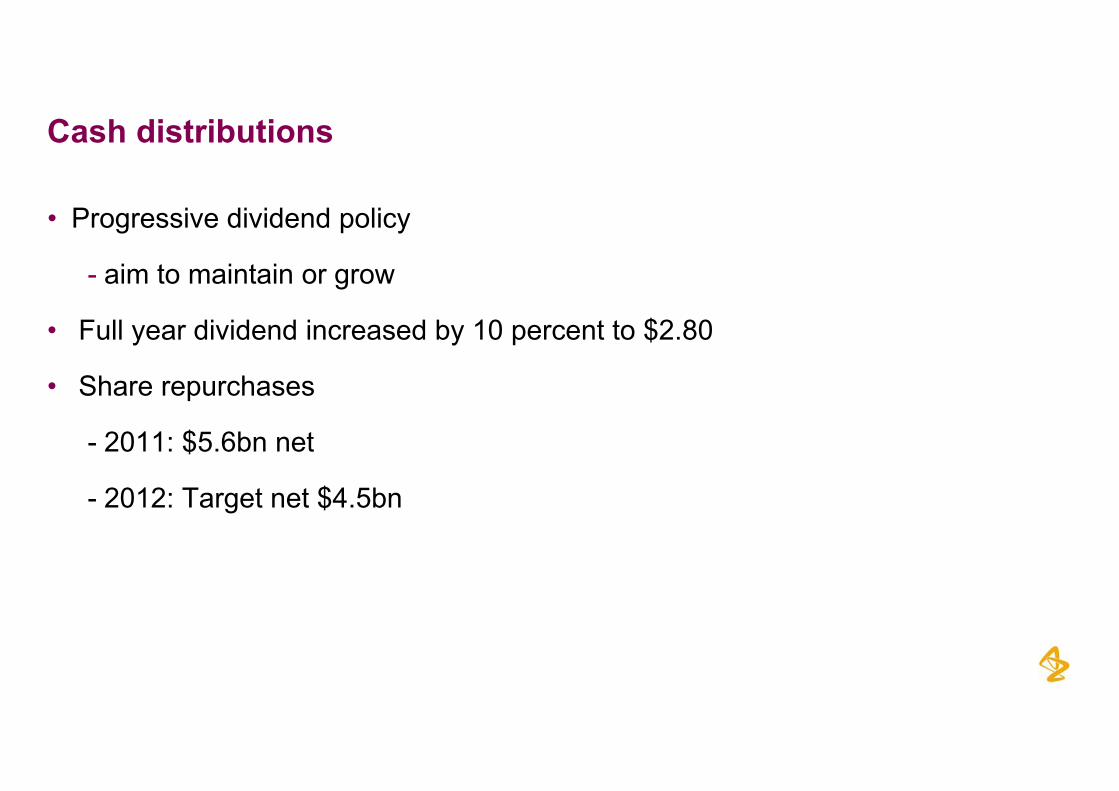
Cash distributions
• Progressive dividend policy
- aim to maintain or grow
• Full year dividend increased by 10 percent to $2.80
• Share repurchases
2011: $5 6bn net- 2011: $5.6bn net
- 2012: Target net $4.5bn
21
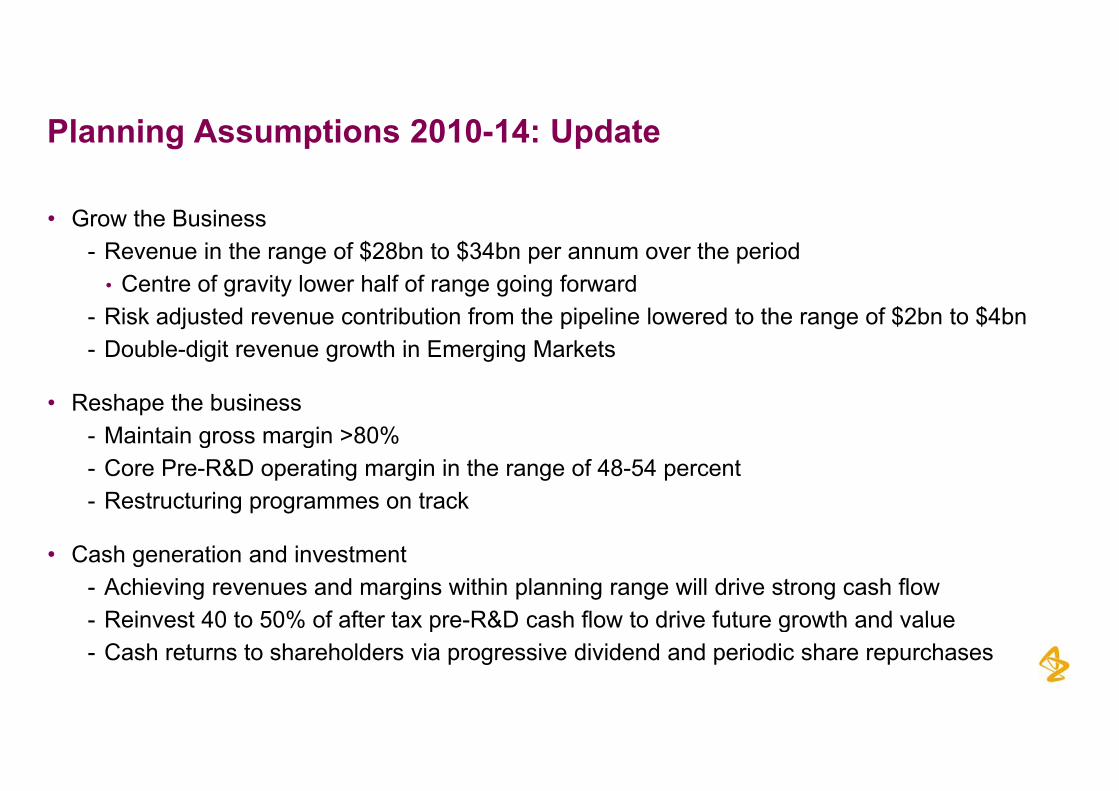
Planning Assumptions 2010-14: Update
• Grow the Business- Revenue in the range of $28bn to $34bn per annum over the periodg $ $ p p
• Centre of gravity lower half of range going forward- Risk adjusted revenue contribution from the pipeline lowered to the range of $2bn to $4bn- Double-digit revenue growth in Emerging Markets- Double-digit revenue growth in Emerging Markets
• Reshape the business- Maintain gross margin >80%Maintain gross margin >80%- Core Pre-R&D operating margin in the range of 48-54 percent- Restructuring programmes on track
• Cash generation and investment- Achieving revenues and margins within planning range will drive strong cash flow- Reinvest 40 to 50% of after tax pre-R&D cash flow to drive future growth and value
22
- Reinvest 40 to 50% of after tax pre-R&D cash flow to drive future growth and value- Cash returns to shareholders via progressive dividend and periodic share repurchases
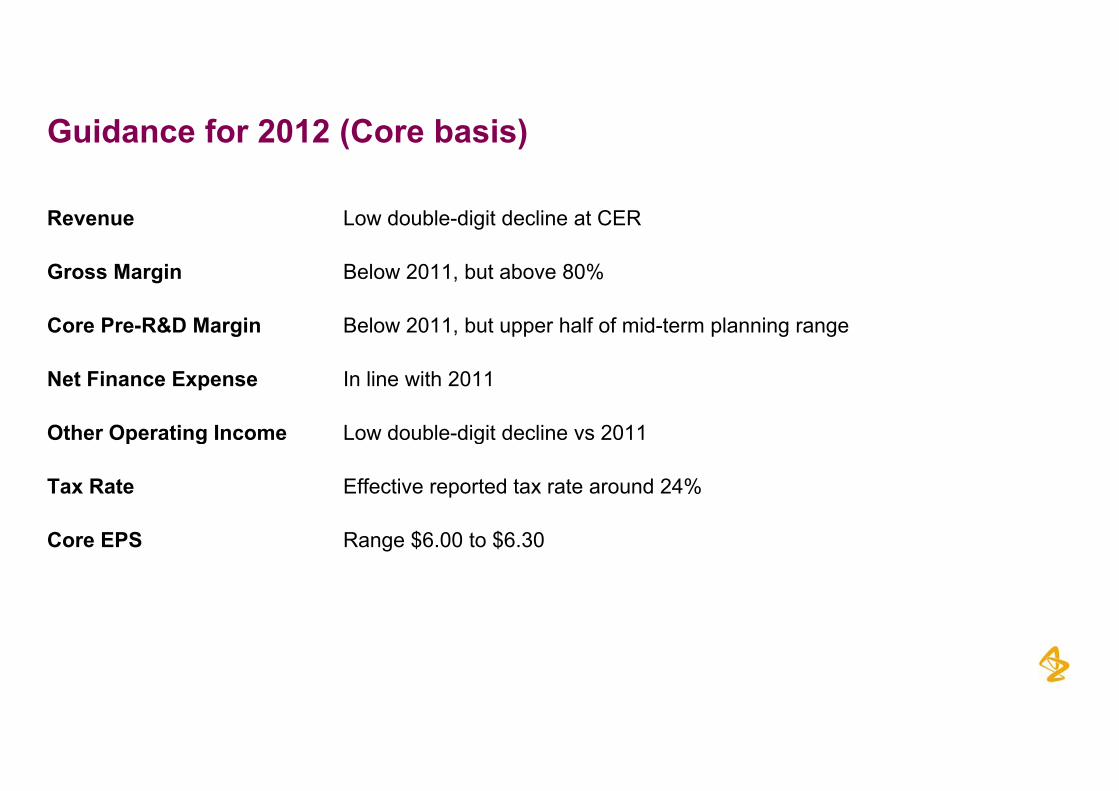
Guidance for 2012 (Core basis)
Revenue Low double-digit decline at CER
Gross Margin Below 2011, but above 80%
Core Pre-R&D Margin Below 2011, but upper half of mid-term planning range
Net Finance Expense In line with 2011
Other Operating Income Low double-digit decline vs 2011p g g
Tax Rate Effective reported tax rate around 24%
Core EPS Range $6.00 to $6.30
23
R&D Update
Martin Mackay, President Research & Development
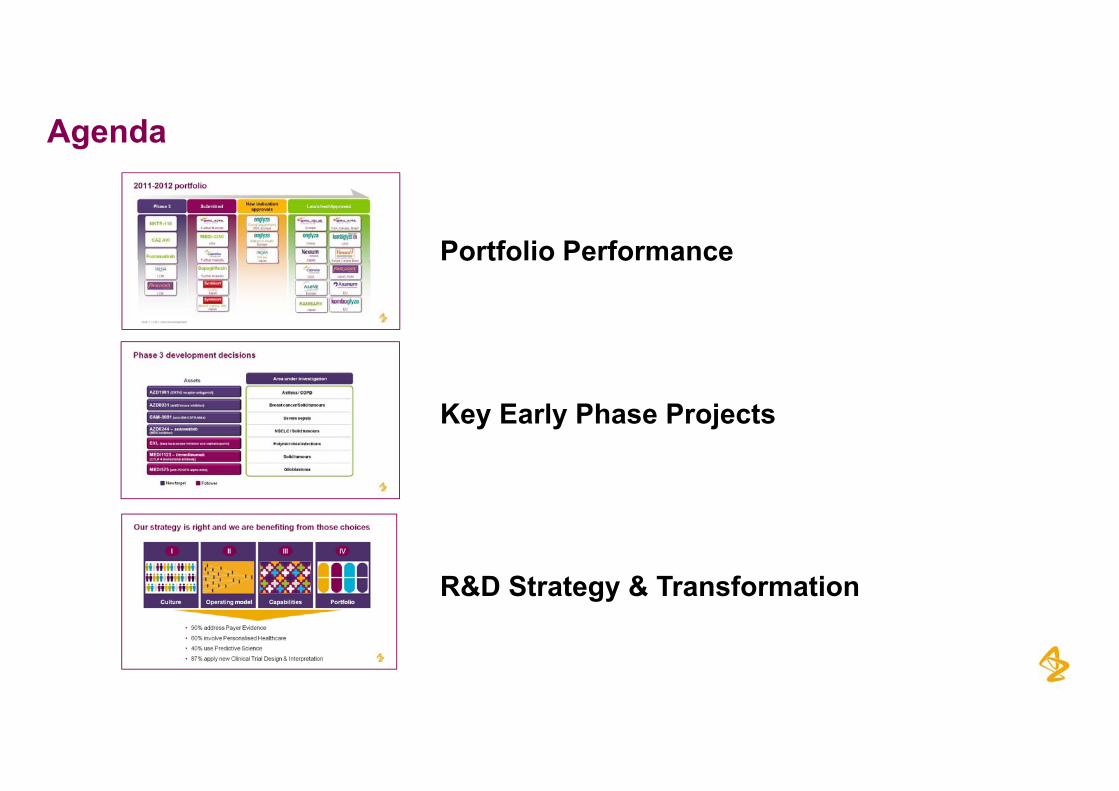
Agenda
Portfolio Performance o t o o e o a ce
Key Early Phase Projects
R&D Strategy & Transformation
25

Made significant progress and delivering on key capabilities
I IVIIIII
CapabilitiesOperating model PortfolioCulture CapabilitiesOperating model PortfolioCulture
• 90% address Payer Evidence
• 60% involve Personalised Healthcare
40% P di ti S i
26
• 40% use Predictive Science
• 87% apply new Clinical Trial Design & Interpretation
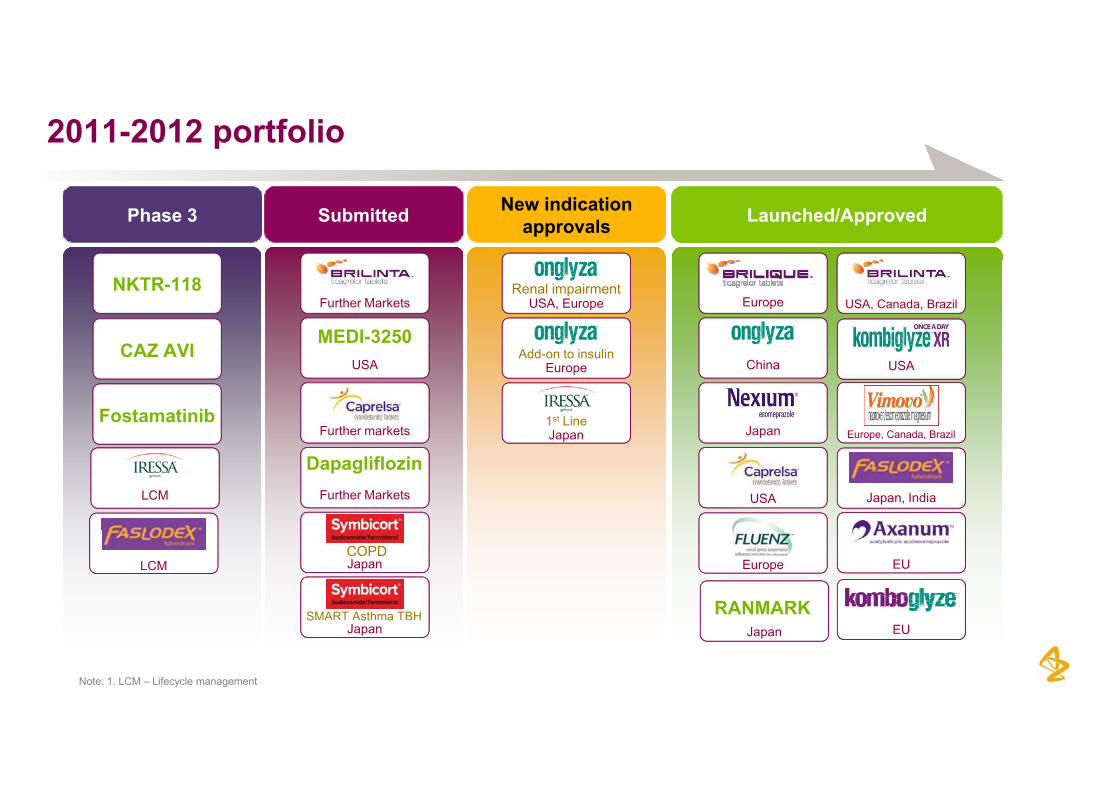
2011-2012 portfolio
Phase 3 New indication approvalsSubmitted Launched/Approved
NKTR-118
CAZ AVI
Renal impairmentUSA, Europe
Add t i li
Further Markets
MEDI-3250
Europe USA, Canada, Brazil
CAZ AVI Add-on to insulinEurope
1st Line Japan
USA
Further markets
China
Japan
USA
Europe, Canada, BrazilFostamatinib
LCM
p
DapagliflozinFurther Markets USA Japan, India
LCMCOPDJapan
SMART Asthma TBH
Europe EU
RANMARK
27
S st aJapan EU
Note: 1. LCM – Lifecycle management
Japan
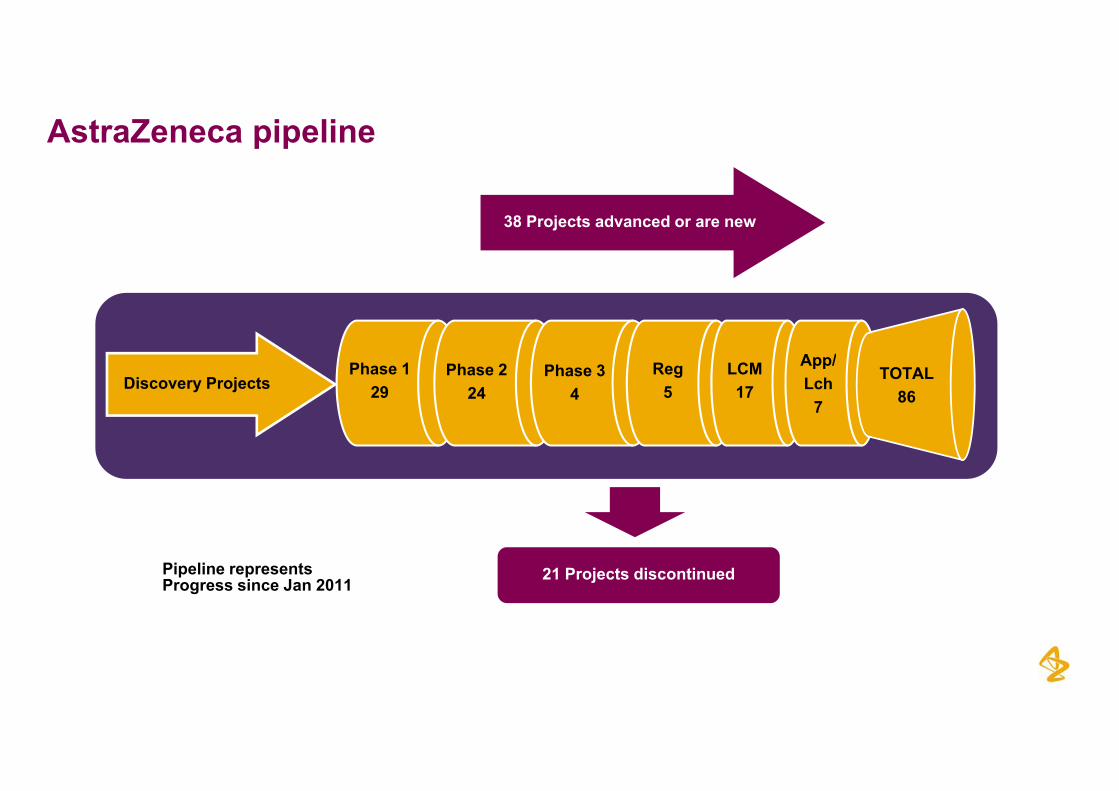
AstraZeneca pipeline
38 Projects advanced or are new
Discovery ProjectsPhase 1
29Phase 2
24Phase 3
4Reg
5LCM17
App/Lch
7
TOTAL86
21 Projects discontinuedPipeline representsProgress since Jan 2011
28
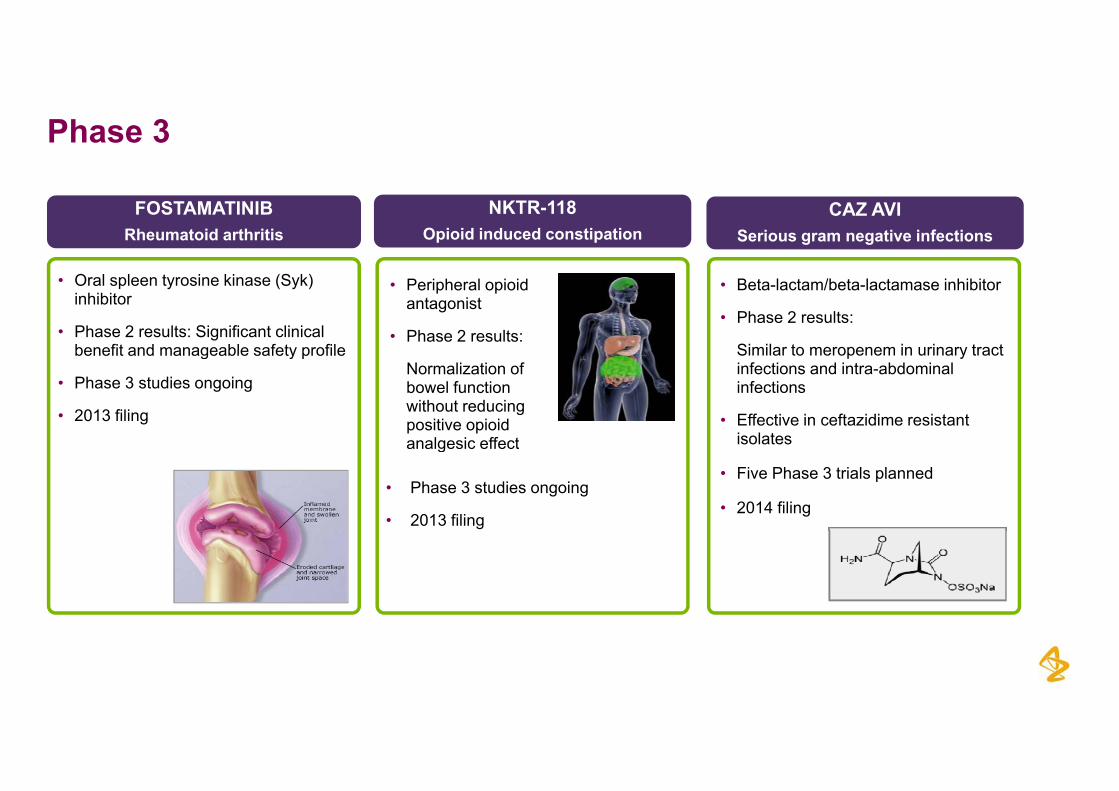
Phase 3
CAZ AVISerious gram negative infections
NKTR-118Opioid induced constipation
FOSTAMATINIBRheumatoid arthritis
• Beta-lactam/beta-lactamase inhibitor
• Phase 2 results:
Similar to meropenem in urinary tract
• Peripheral opioid antagonist
• Phase 2 results:
• Oral spleen tyrosine kinase (Syk) inhibitor
• Phase 2 results: Significant clinical benefit and manageable safety profile Similar to meropenem in urinary tract
infections and intra-abdominal infections
• Effective in ceftazidime resistant isolates
Normalization of bowel function without reducing positive opioid analgesic effect
benefit and manageable safety profile
• Phase 3 studies ongoing
• 2013 filingisolatesanalgesic effect
• Phase 3 studies ongoing
• 2013 filing
• Five Phase 3 trials planned
• 2014 filing
29
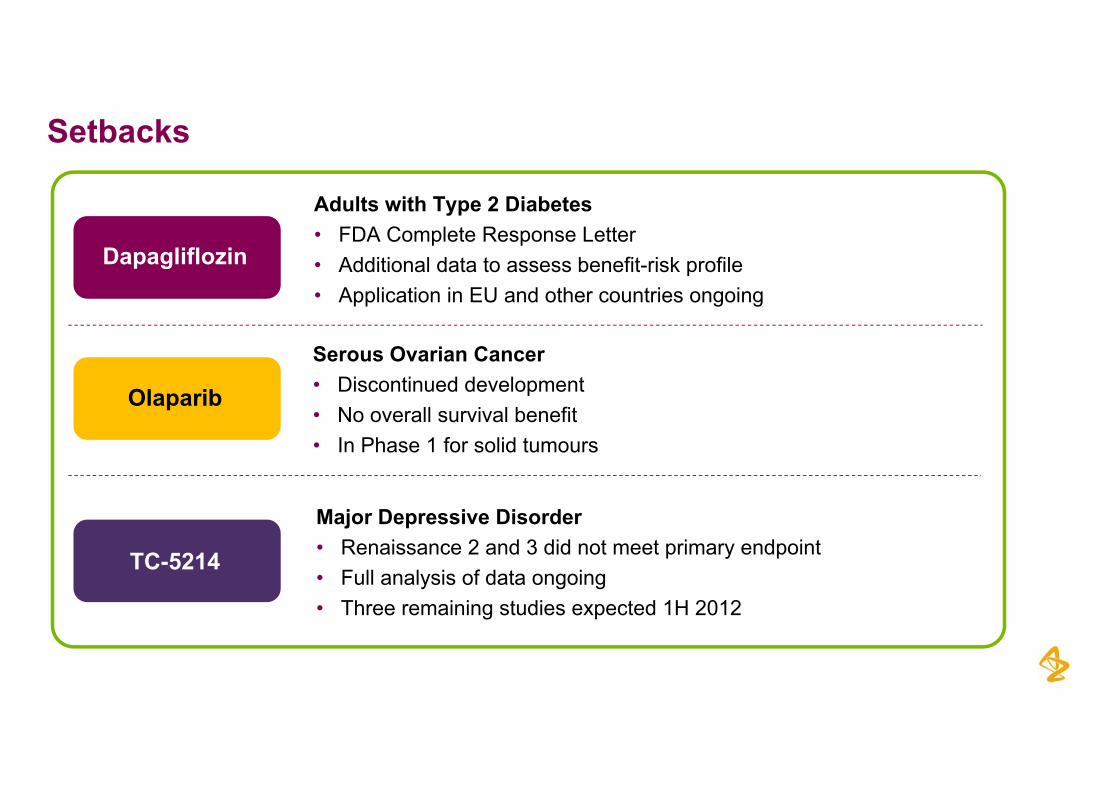
Setbacks
Adults with Type 2 Diabetes• FDA Complete Response Letter
Additi l d t t b fit i k filDapagliflozin • Additional data to assess benefit-risk profile• Application in EU and other countries ongoing
Serous Ovarian Cancer
Dapagliflozin
Serous Ovarian Cancer• Discontinued development• No overall survival benefit
I Ph 1 f lid t
Olaparib
Major Depressive Disorder
• In Phase 1 for solid tumours
• Renaissance 2 and 3 did not meet primary endpoint• Full analysis of data ongoing• Three remaining studies expected 1H 2012
TC-5214
30
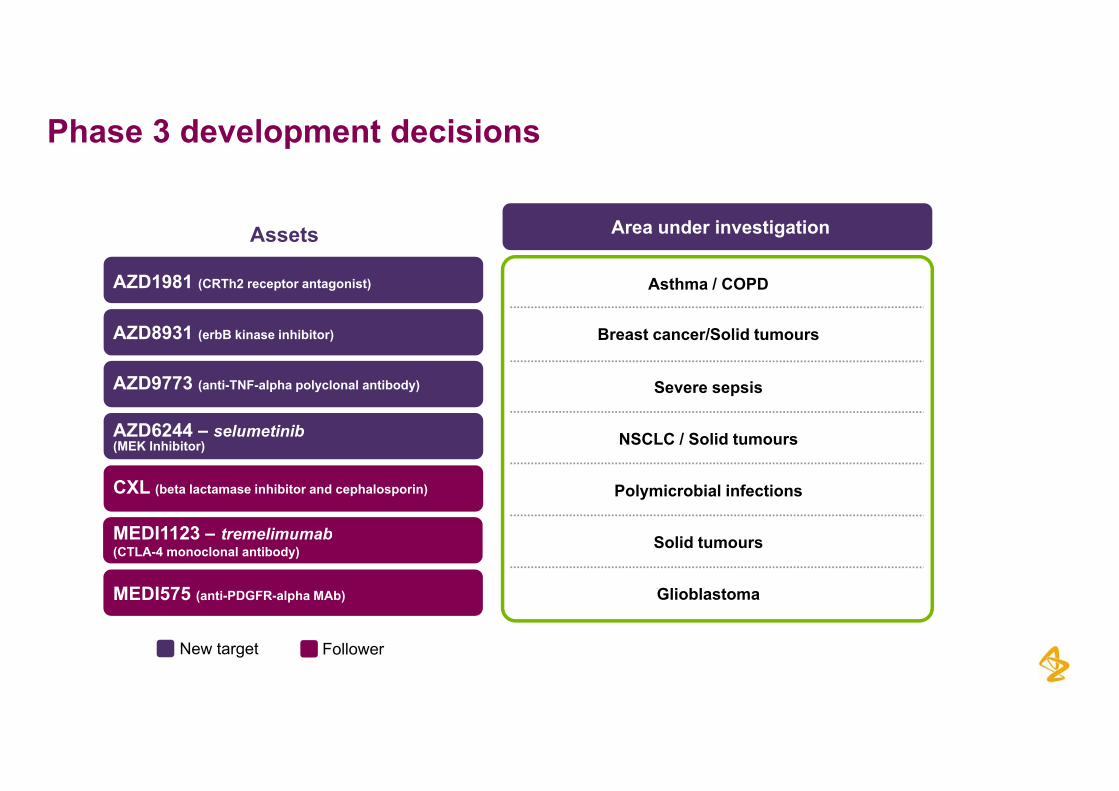
Phase 3 development decisions
Area under investigationAssets
Breast cancer/Solid tumours
Asthma / COPDAZD1981 (CRTh2 receptor antagonist)
AZD8931 (erbB kinase inhibitor)
NSCLC / Solid tumours
Severe sepsis
AZD6244 – selumetinib
AZD9773 (anti-TNF-alpha polyclonal antibody)
NSCLC / Solid tumours
Polymicrobial infections
(MEK Inhibitor)
CXL (beta lactamase inhibitor and cephalosporin)
MEDI1123 t li b Solid tumours
Glioblastoma
MEDI1123 – tremelimumab(CTLA-4 monoclonal antibody)
MEDI575 (anti-PDGFR-alpha MAb)
31
New target Follower
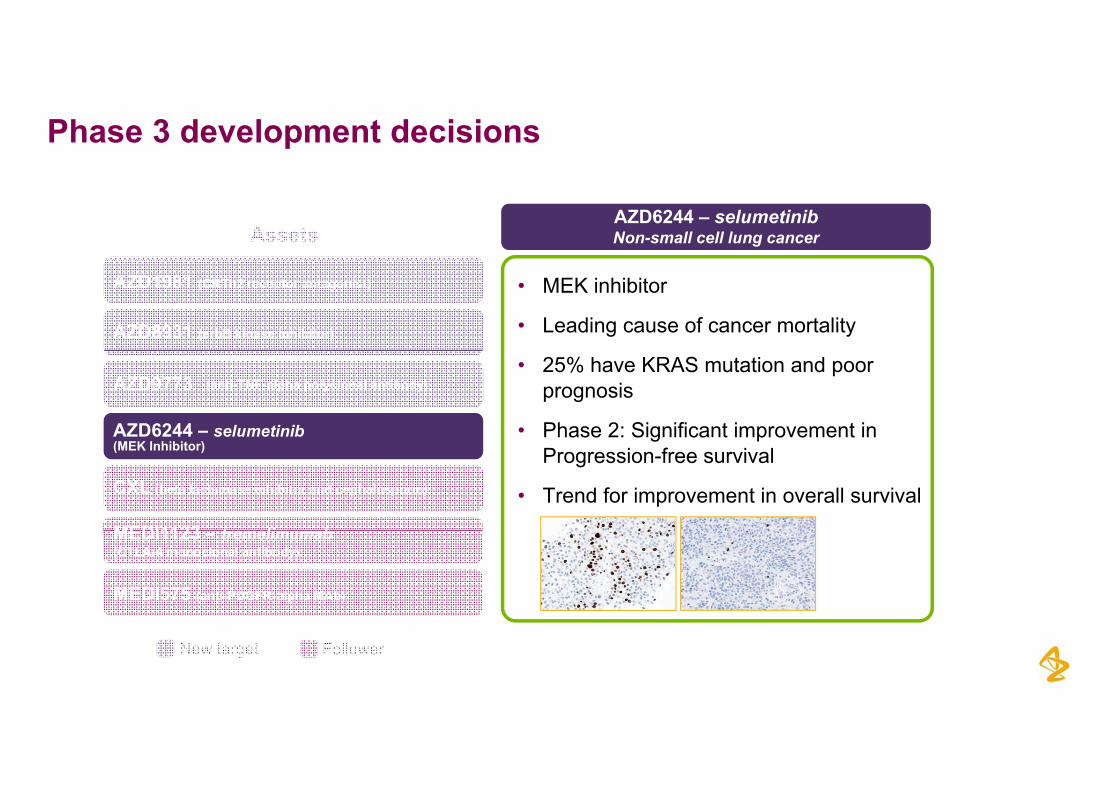
Phase 3 development decisions
AZD6244 – selumetinibNon-small cell lung cancerAssets
AZD1981 (CRTh2 receptor antagonist)
AZD8931 (erbB kinase inhibitor) Breast cancer
Asthma with allergic component• MEK inhibitor
• Leading cause of cancer mortality
AZD6244 – selumetinib KRAS mutation non-small cell lung
Severe sepsis• 25% have KRAS mutation and poor
prognosis
• Phase 2: Significant improvement in
AZD9773 (anti-TNF-alpha polyclonal antibody)
(MEK Inhibitor)
CXL (beta lactamase inhibitor and cephalosporin)
MEDI1123 t li b
KRAS mutation non-small cell lung
Polymicrobial infections
g pProgression-free survival
• Trend for improvement in overall survival
MEDI1123 – tremelimumab(CTLA-4 monoclonal antibody)
MEDI575 (anti-PDGFR-alpha MAb)
Renal cell cancer
Glioblastoma
32
New target Follower
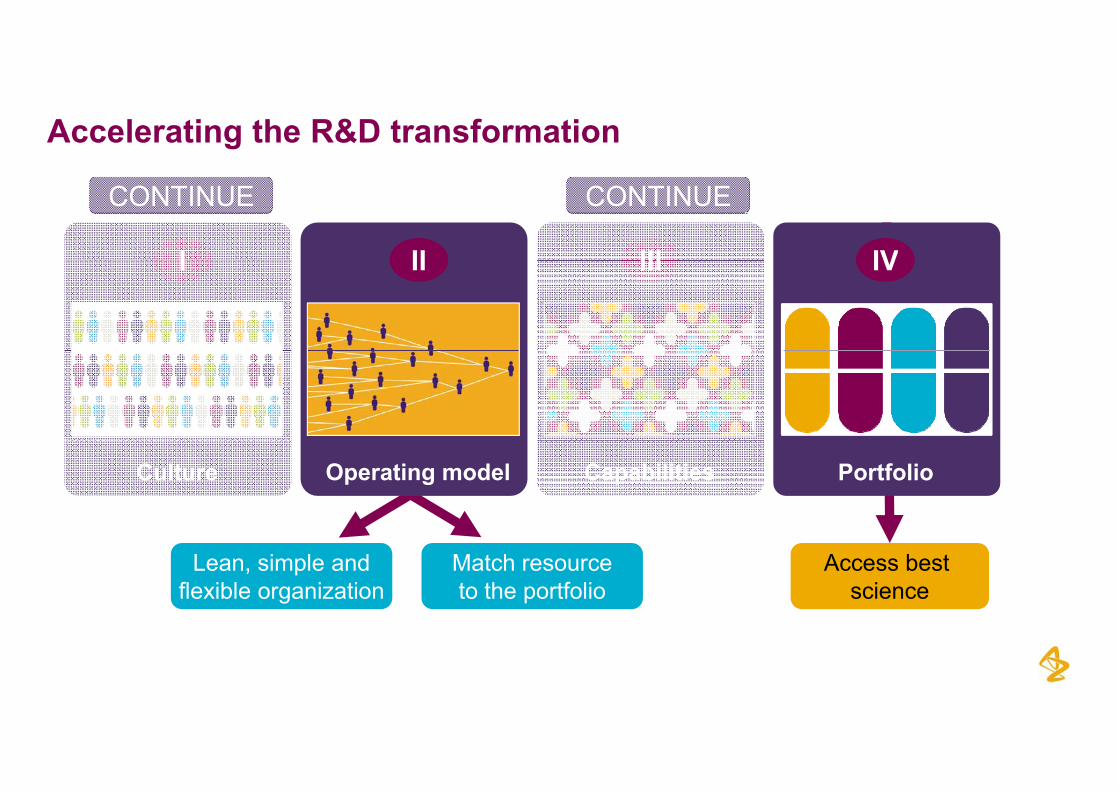
Accelerating the R&D transformation
CONTINUE CONTINUE
I IVIIIIII IVIIIII
CapabilitiesOperating model PortfolioCulture
Access best science
Match resourceto the portfolio
Lean, simple andflexible organization
33
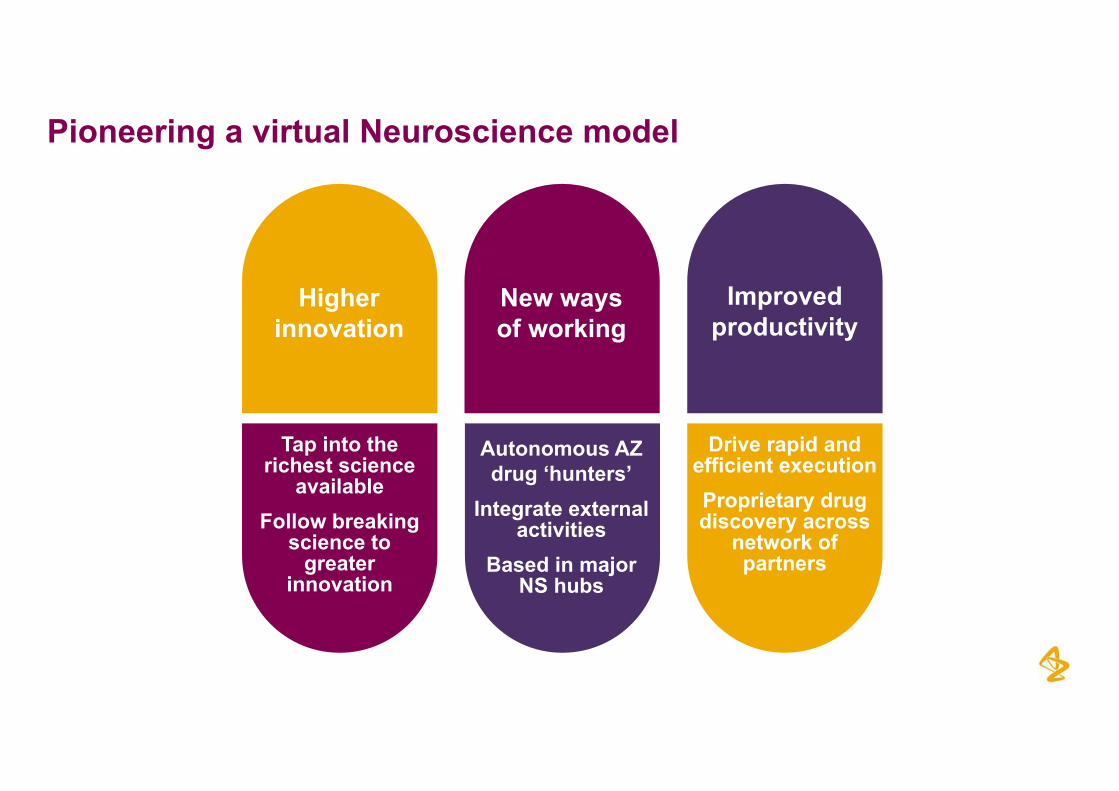
Pioneering a virtual Neuroscience model
Higherinnovation
New ways of working
Improvedproductivity
Tap into the Drive rapid andTap into the richest science
availableFollow breaking
Autonomous AZ drug ‘hunters’
Integrate external activities
Drive rapid and efficient executionProprietary drug discovery across g
science to greater
innovation
activitiesBased in major
NS hubs
ynetwork of partners
34
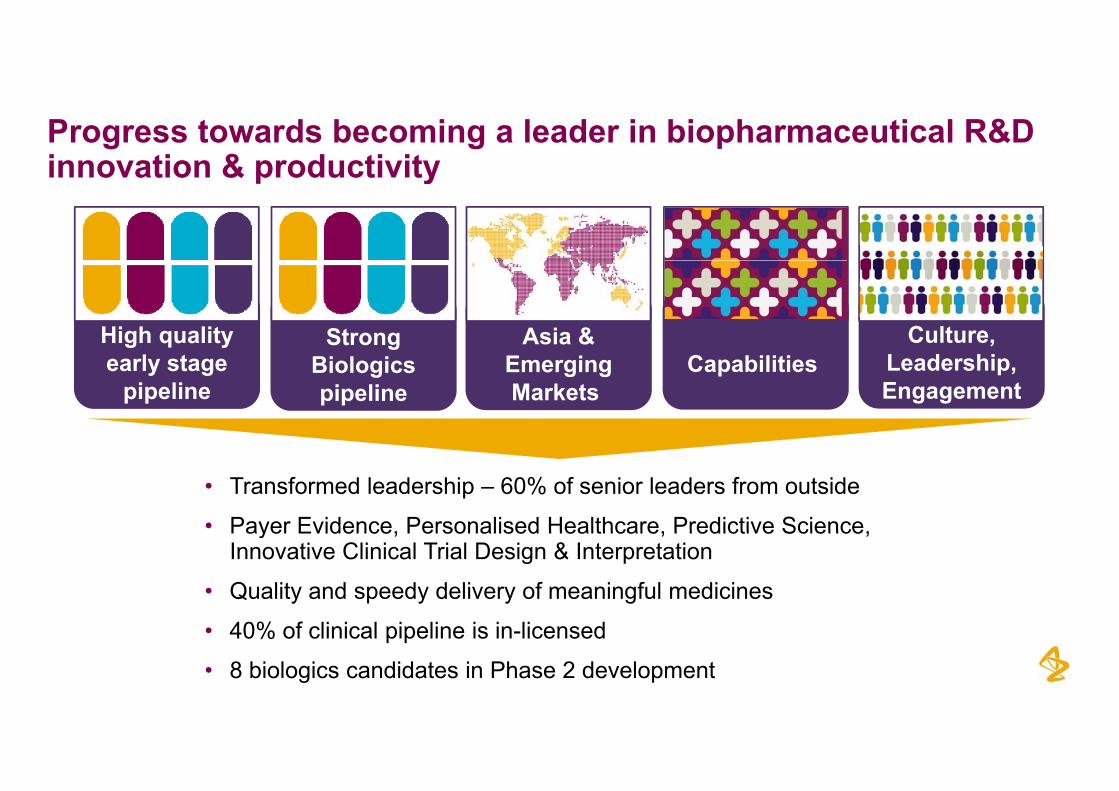
Progress towards becoming a leader in biopharmaceutical R&D innovation & productivityinnovation & productivity
High quality Strong Asia & Culture,early stage
pipelineBiologicspipeline
EmergingMarkets
Capabilities Leadership,Engagement
• Transformed leadership – 60% of senior leaders from outside
• Payer Evidence Personalised Healthcare Predictive SciencePayer Evidence, Personalised Healthcare, Predictive Science, Innovative Clinical Trial Design & Interpretation
• Quality and speedy delivery of meaningful medicines
35
• 40% of clinical pipeline is in-licensed
• 8 biologics candidates in Phase 2 development
Full Year Results2011
Tony Zook, Executive VP, Global Commercial Operations
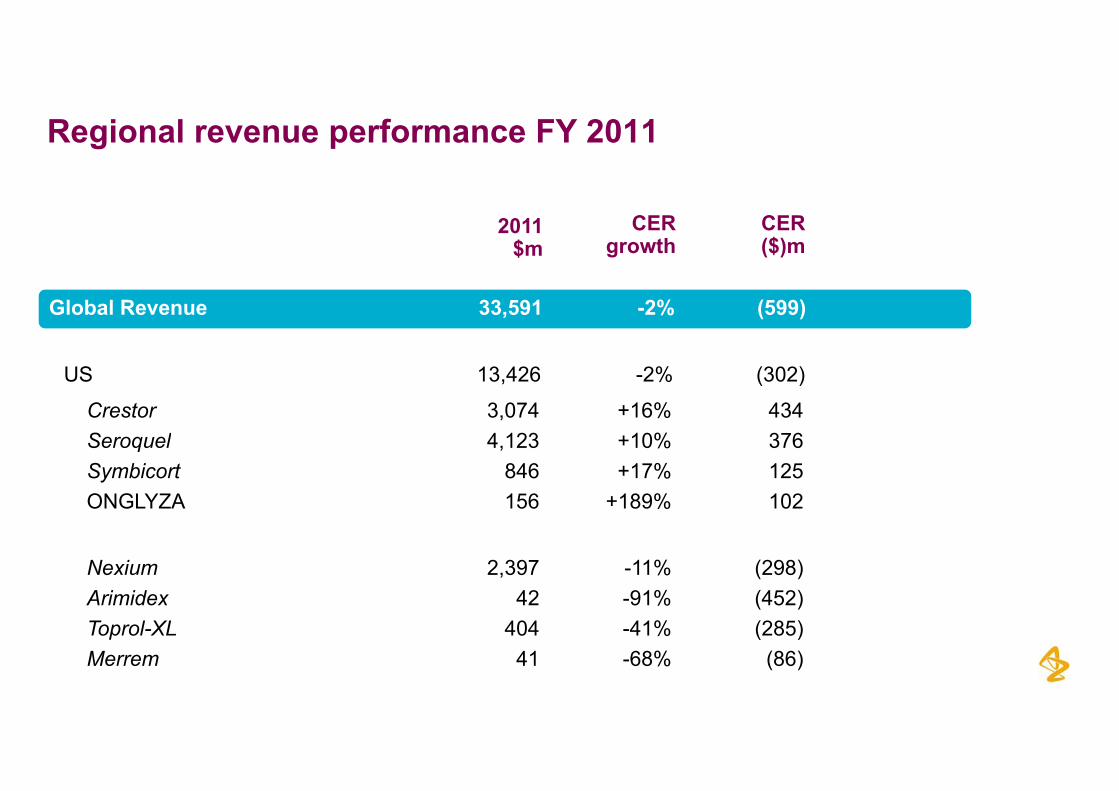
Regional revenue performance FY 2011
CERgrowth
2011$m
CER($)m
Global Revenue 33,591 -2% (599)
US 13,426 -2% (302)
Crestor 3,074 +16% 434Seroquel 4 123 +10% 376Seroquel 4,123 +10% 376Symbicort 846 +17% 125ONGLYZA 156 +189% 102
Nexium 2,397 -11% (298)Arimidex 42 -91% (452)
0 1% (28 )
37
Toprol-XL 404 -41% (285)Merrem 41 -68% (86)
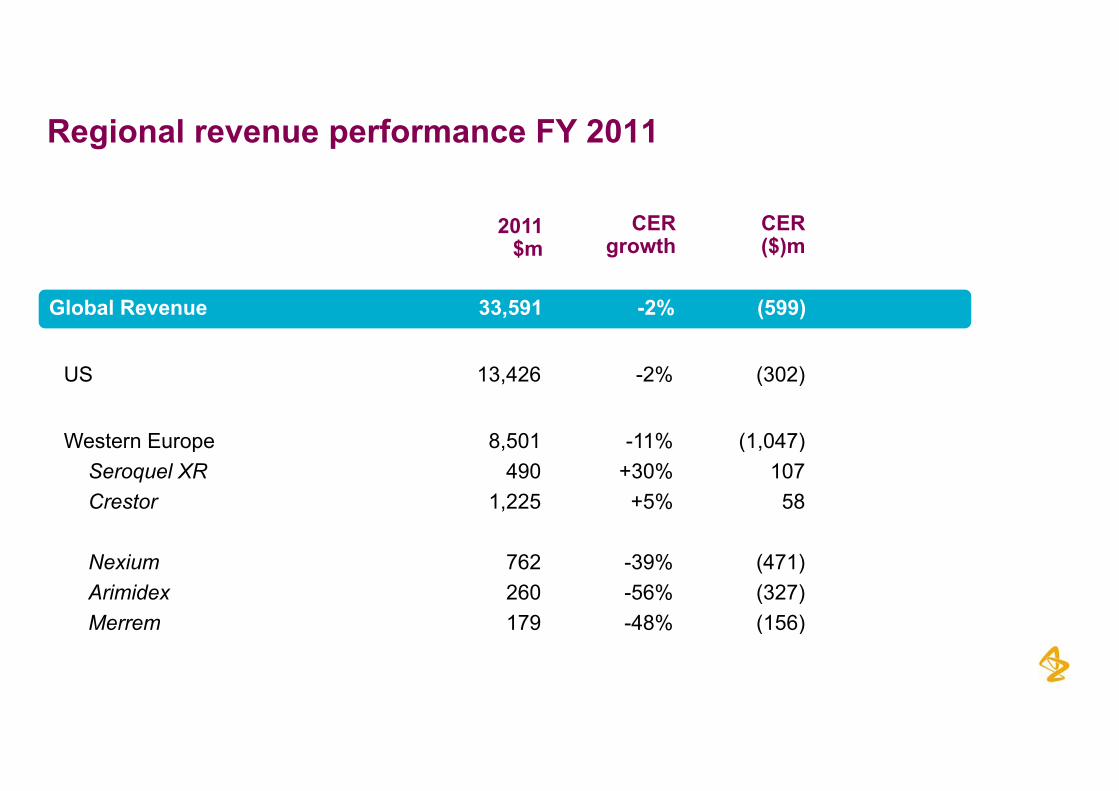
Regional revenue performance FY 2011
CERgrowth
2011$m
CER($)m
Global Revenue 33,591 -2% (599)
US 13,426 -2% (302)
Western Europe 8 501 11% (1 047)Western Europe 8,501 -11% (1,047)Seroquel XR 490 +30% 107Crestor 1,225 +5% 58
Nexium 762 -39% (471)Arimidex 260 -56% (327)Merrem 179 48% (156)
38
Merrem 179 -48% (156)
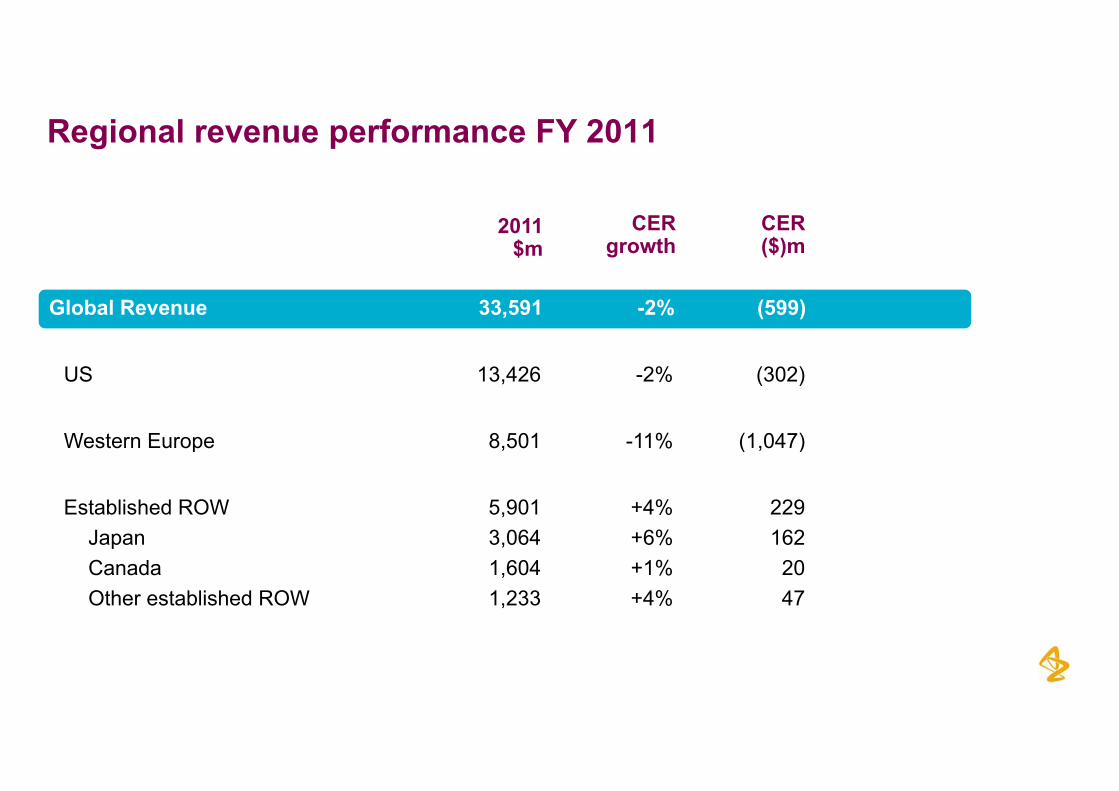
Regional revenue performance FY 2011
CERgrowth
2011$m
CER($)m
Global Revenue 33,591 -2% (599)
US 13,426 -2% (302)
Western Europe 8 501 11% (1 047)Western Europe 8,501 -11% (1,047)
Established ROW 5,901 +4% 229J 3 064 6% 162Japan 3,064 +6% 162Canada 1,604 +1% 20Other established ROW 1,233 +4% 47
39
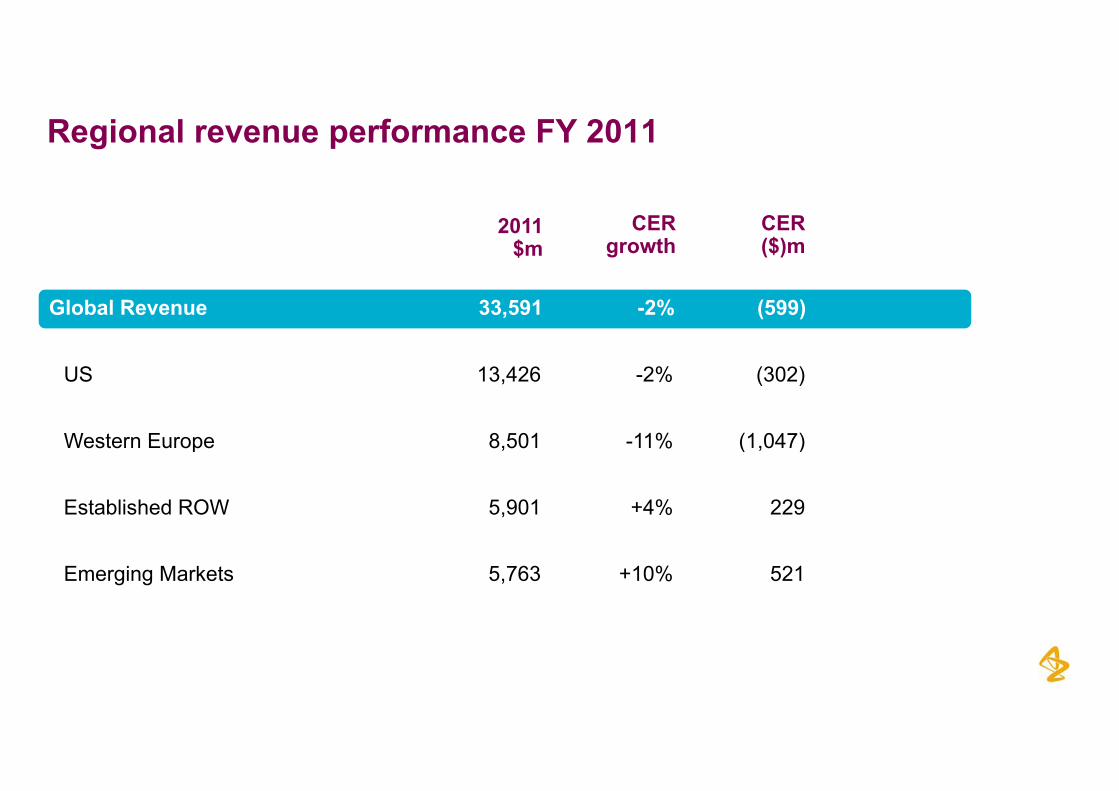
Regional revenue performance FY 2011
CERgrowth
2011$m
CER($)m
Global Revenue 33,591 -2% (599)
US 13,426 -2% (302)
Western Europe 8 501 11% (1 047)Western Europe 8,501 -11% (1,047)
Established ROW 5,901 +4% 229
Emerging Markets 5,763 +10% 521
40
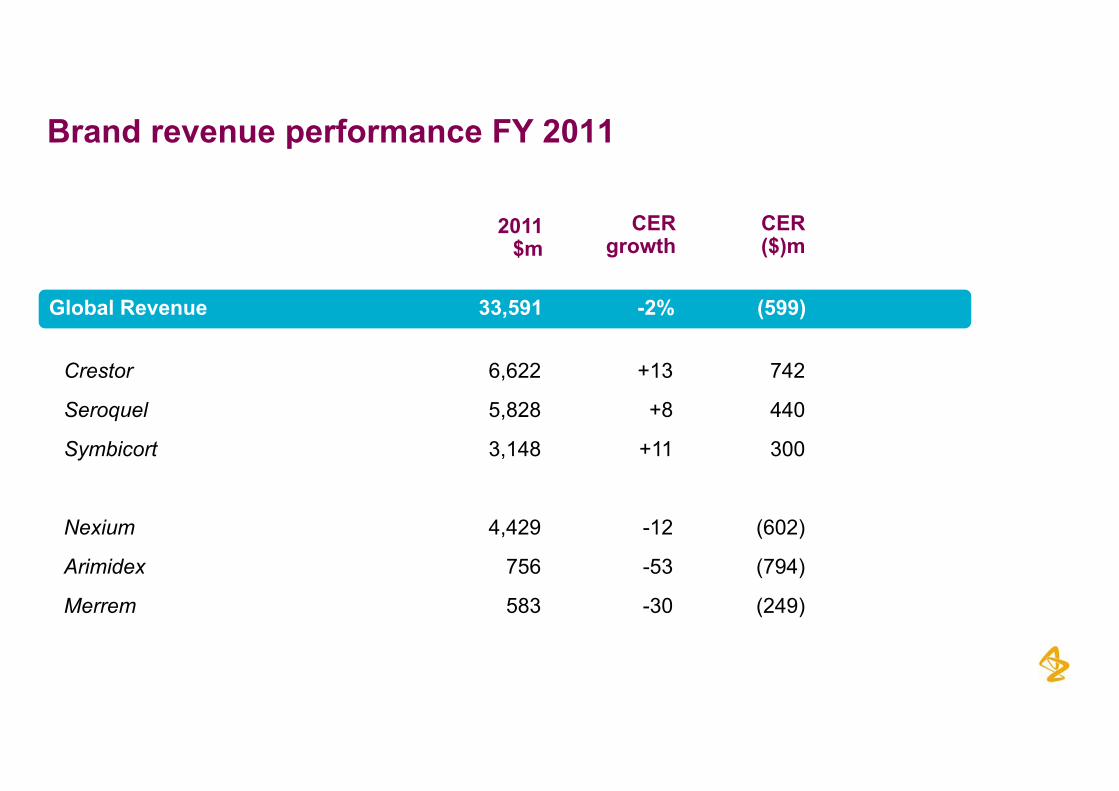
Brand revenue performance FY 2011
CERgrowth
2011$m
CER($)m
Global Revenue 33,591 -2% (599)
Crestor 6,622 +13 742
Seroquel 5,828 +8 440
Symbicort 3,148 +11 300
Nexium 4 429 -12 (602)Nexium 4,429 12 (602)
Arimidex 756 -53 (794)
Merrem 583 -30 (249)
41
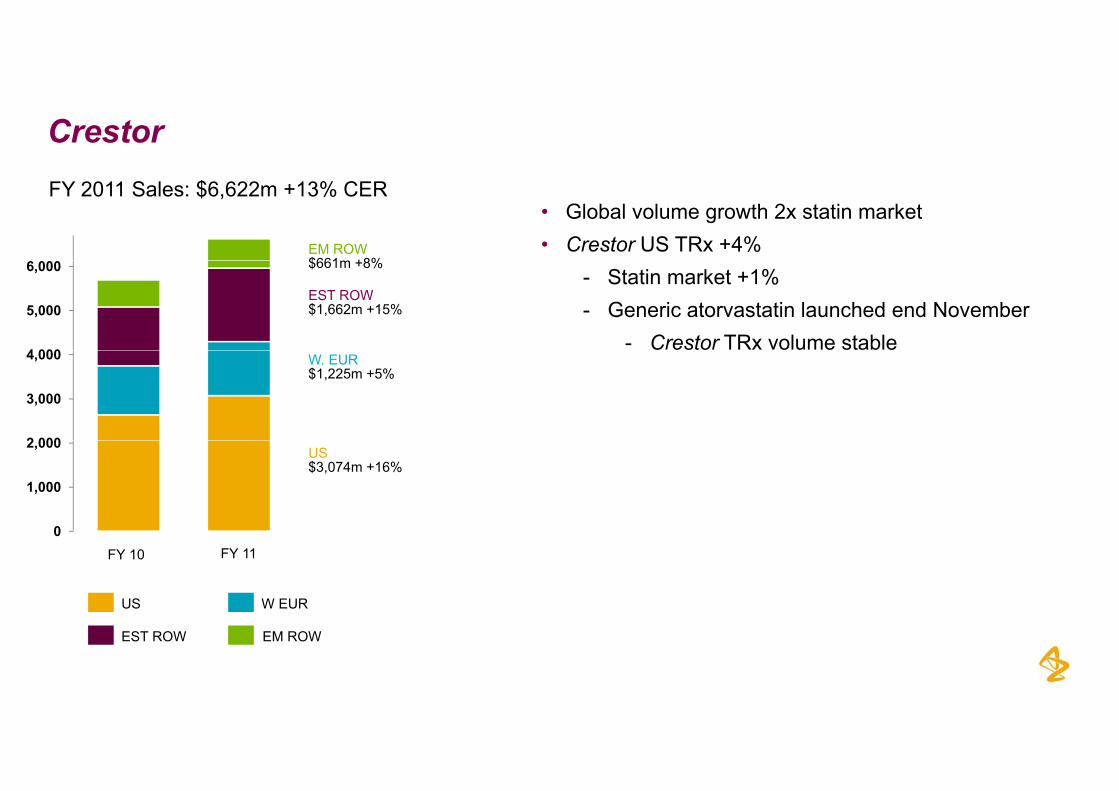
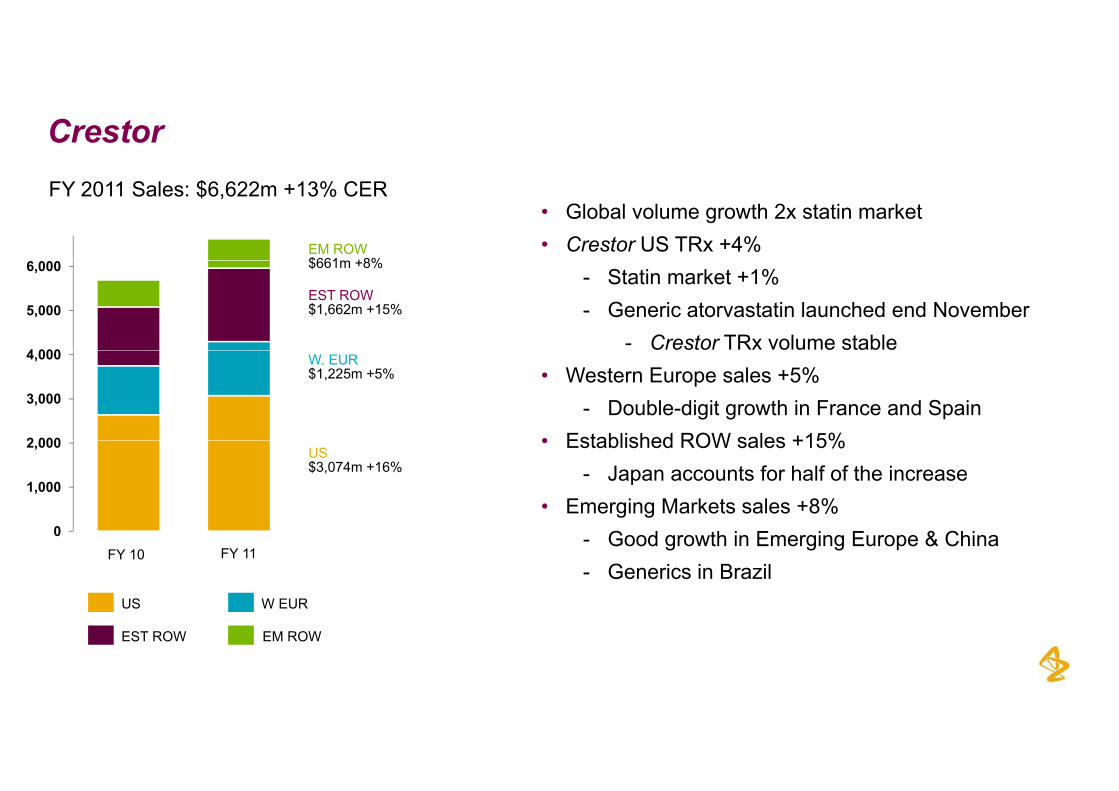
Crestor FY 2011 Sales: $6,622m +13% CER
EM ROW$661m +8%
• Global volume growth 2x statin market• Crestor US TRx +4%
4 000
5,000
6,000
EST ROW$1,662m +15%
$661m +8%- Statin market +1%- Generic atorvastatin launched end November
- Crestor TRx volume stable
2 000
3,000
4,000 W. EUR$1,225m +5%
0
1,000
2,000US$3,074m +16%
0FY 10 FY 11
US W EUR
42
EST ROW EM ROW
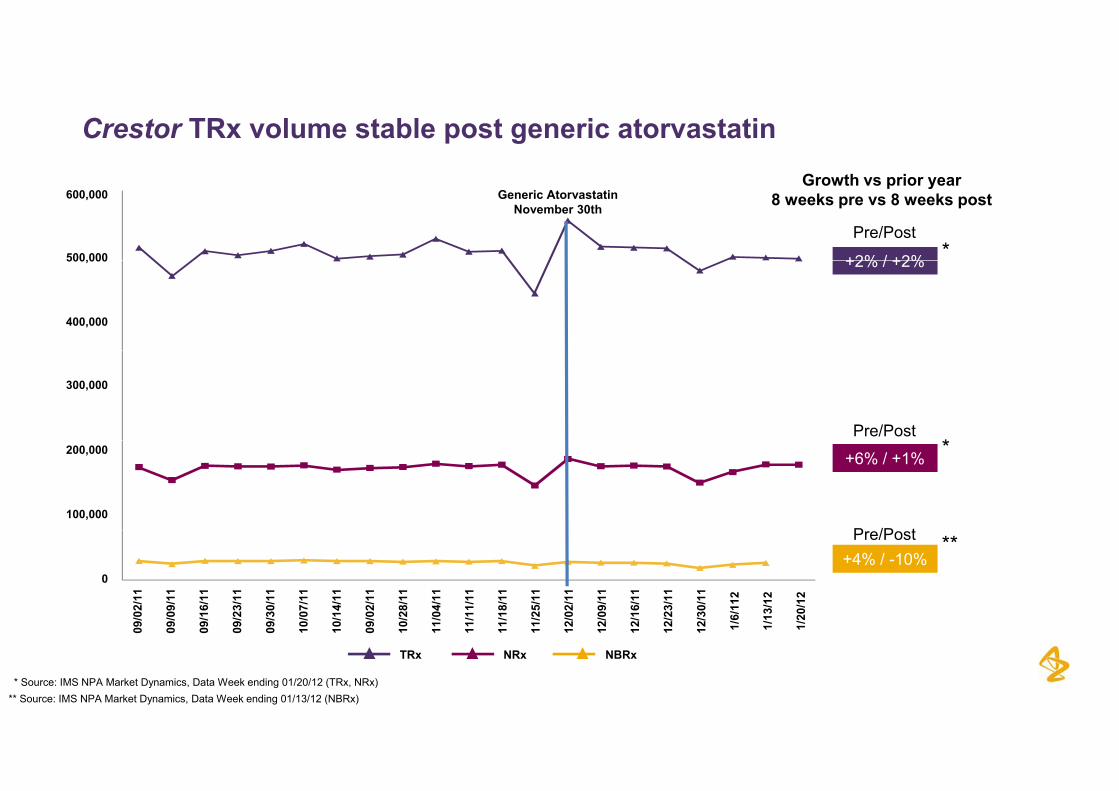
Crestor TRx volume stable post generic atorvastatin
Generic AtorvastatinNovember 30th
Growth vs prior year8 weeks pre vs 8 weeks post
+2% / +2% *Pre/Post
600,000
500,000 +2% / +2%500,000
400,000
*Pre/Post
300,000
+6% / +1% *
P /P t
200,000
100,000
+4% / -10%**Pre/Post
0
/02/
11
/09/
11
/16/
11
/23/
11
/30/
11
/07/
11
/14/
11
/02/
11
/28/
11
/04/
11
/11/
11
/18/
11
/25/
11
/02/
11
/09/
11
/16/
11
/23/
11
/30/
11
6/11
2
13/1
2
20/1
2
43* Source: IMS NPA Market Dynamics, Data Week ending 01/20/12 (TRx, NRx)** Source: IMS NPA Market Dynamics, Data Week ending 01/13/12 (NBRx)
09/
09/
09/
09/
09/
10/
10/
09/
10/
11/
11/
11/
11/
12/
12/
12/
12/
12/
TRx NRx NBRx
1/ 1/ 1/
Crestor FY 2011 Sales: $6,622m +13% CER
EM ROW$661m +8%
• Global volume growth 2x statin market• Crestor US TRx +4%
4 000
5,000
6,000
EST ROW$1,662m +15%
$661m +8%- Statin market +1%- Generic atorvastatin launched end November
- Crestor TRx volume stable
2 000
3,000
4,000 W. EUR$1,225m +5% • Western Europe sales +5%
- Double-digit growth in France and Spain• Established ROW sales +15%
0
1,000
2,000US$3,074m +16%
• Established ROW sales +15%- Japan accounts for half of the increase
• Emerging Markets sales +8%0
FY 10 FY 11
US W EUR
- Good growth in Emerging Europe & China- Generics in Brazil
44
EST ROW EM ROW

FormularyBrilinta/Brilique
Approval Launch ReimbursementFormulary& Protocol
64 37 20Markets Variesby market
~58% 45% 38% 12%Access tonew ACSpatients
• Price reflects valueproposition of reducedCV mortality
• Price negotiations under
45
way in Germany & France
Brilinta/Brilique
• Germany
- 1000 key target hospitals- 1000 key target hospitals
- On protocol in ~70%
• Where on protocol, Brilique accounting for 31% of new therapy initiations in ACS patients
− Second only to clopidogrel
• US
- Managed care access to ~60% of covered lives
- Top 400 target hospitals
O f l 46%• On formulary: ~46%
• On protocol: 14%
- Promotional materials available in mid-November
46
Promotional materials available in mid November
Strong record of commercial achievement>$1billion dollar brands>$1billion dollar brands
47
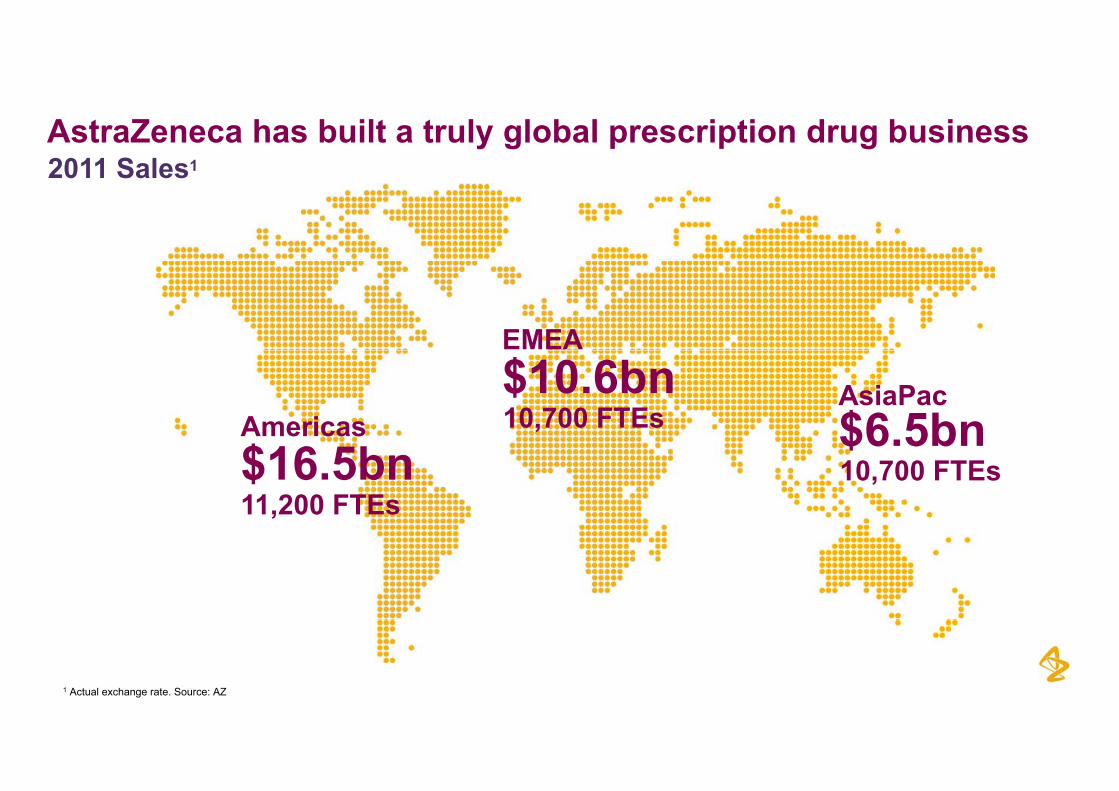
AstraZeneca has built a truly global prescription drug business2011 Sales12011 Sales1
EMEA
AsiaPacAmericas
$10.6bn$6.5bn10,700 FTEs
$16.5bn$6.5bn
11,200 FTEs10,700 FTEs
481 Actual exchange rate. Source: AZ
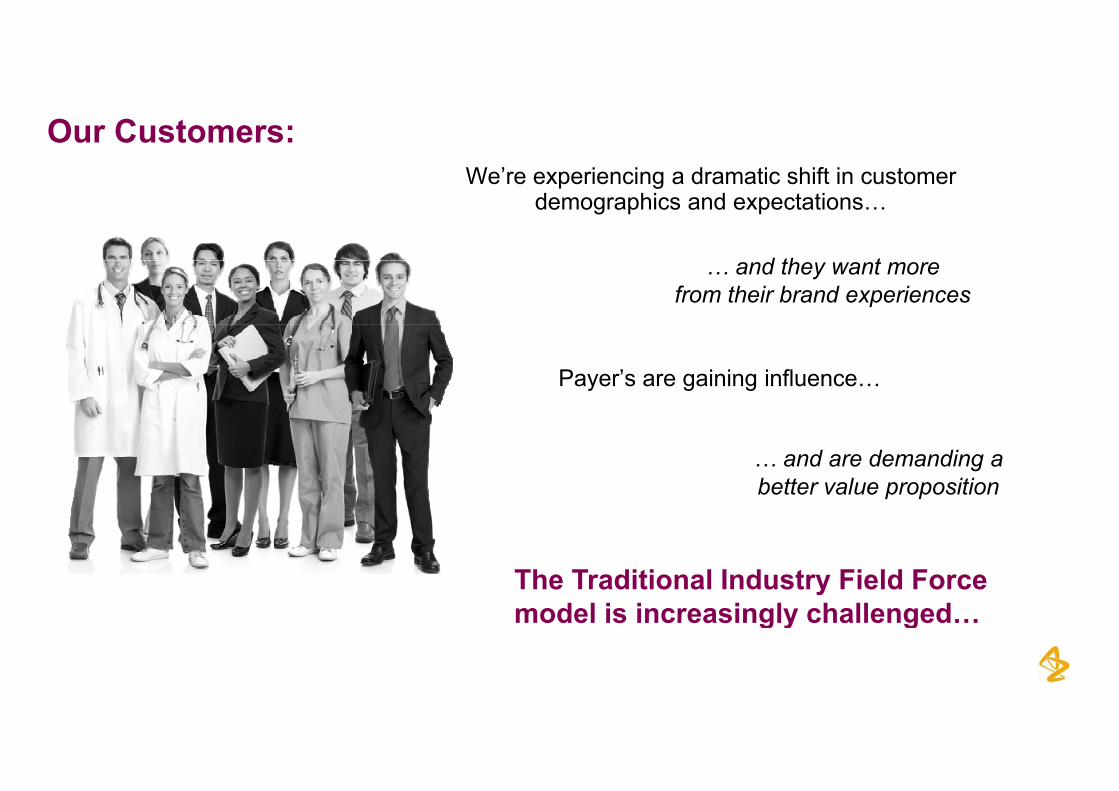
Our Customers:W ’ i i d ti hift i t
d th t
We’re experiencing a dramatic shift in customer demographics and expectations…
… and they want more from their brand experiences
Payer’s are gaining influence…
… and are demanding a better value proposition
The Traditional Industry Field Force model is increasingly challenged…
49
model is increasingly challenged…
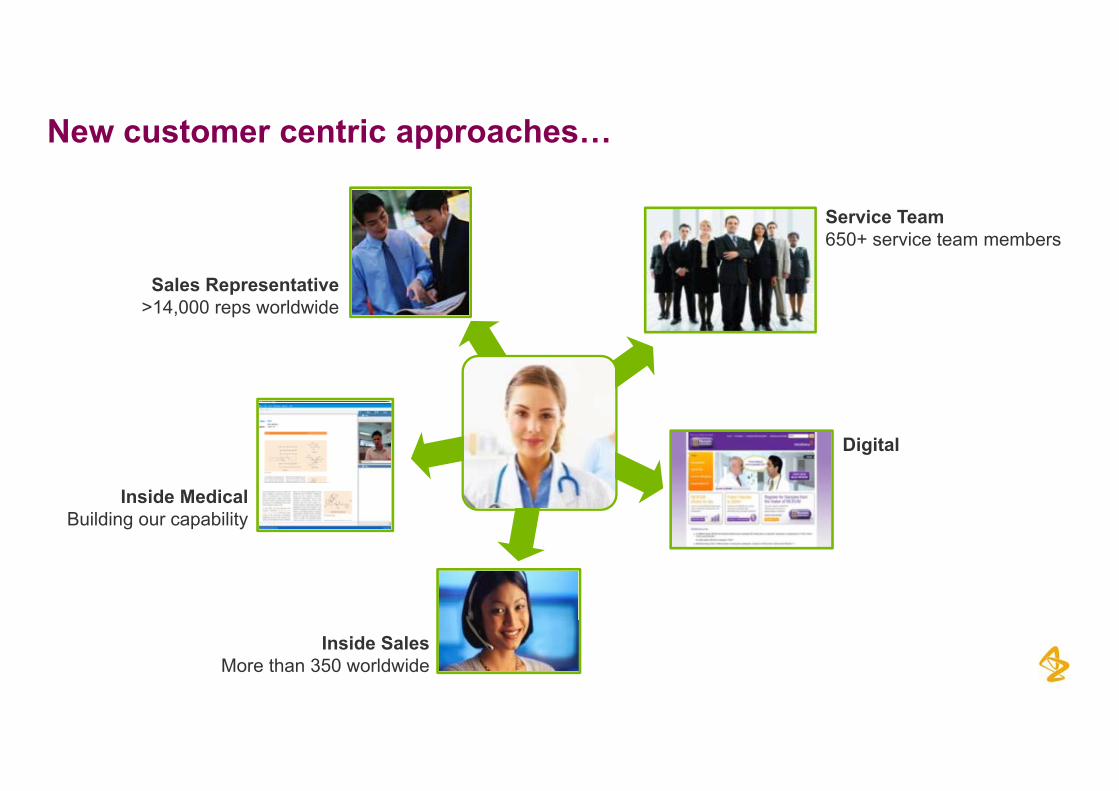
New customer centric approaches…
Service Team650+ service team members
Sales Representative>14,000 reps worldwide
Di it lDigital
Inside MedicalBuilding our capability
50
Inside SalesMore than 350 worldwide
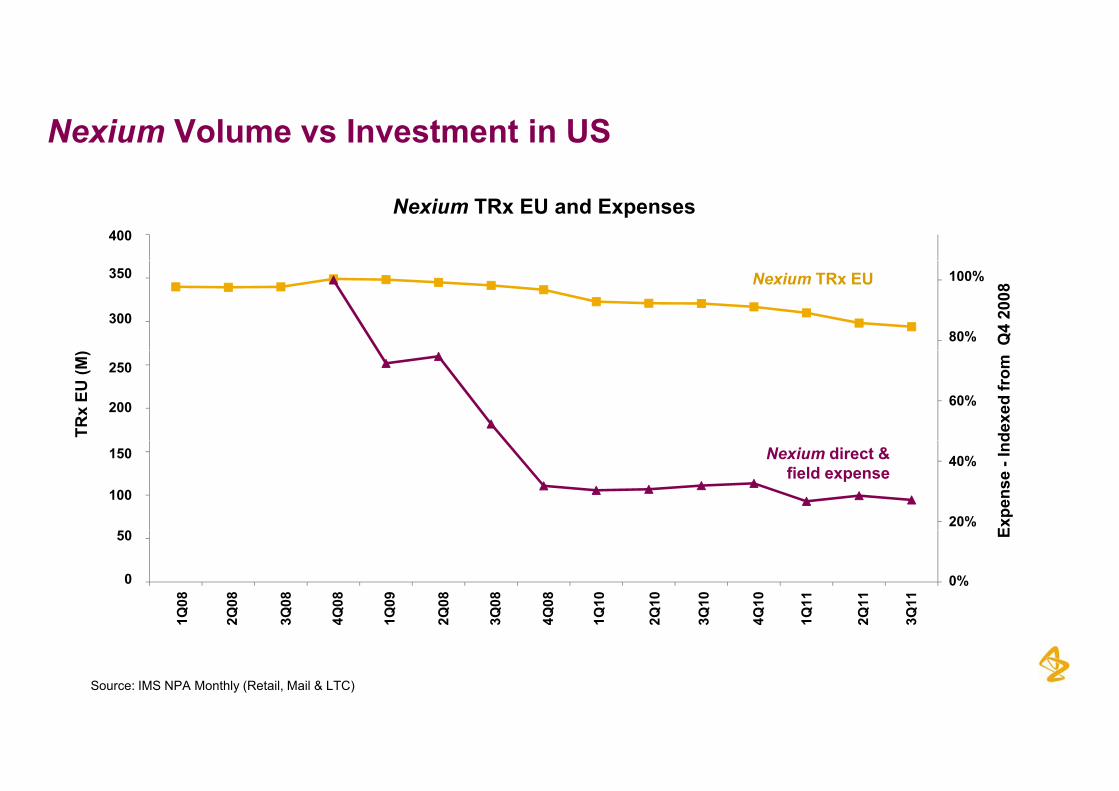
Nexium Volume vs Investment in US
Nexium TRx EU and Expenses400400
80%
100%
300
350 Nexium TRx EU
Q4
2008
350
300
100%
80%
60%200
250
TRx
EU (M
)
dexe
d fr
om
250
200 60%
20%
40%
100
150 Nexium direct & field expense
Expe
nse
-Ind150
100
50
40%
20%
0%0
50
1Q08
2Q08
3Q08
4Q08
1Q09
2Q09
3Q09
4Q09
1Q10
2Q10
3Q10
4Q10
1Q11
2Q11
3Q11
E50
0
1Q08
2Q08
3Q08
4Q08
1Q09
2Q08
3Q08
4Q08
1Q10
2Q10
3Q10
4Q10
1Q11
2Q11
3Q11
0%
51
2 3 4 2 3 4 2 3 4 2 3
Source: IMS NPA Monthly (Retail, Mail & LTC)
1 2 3 4 1 2 3 4 1 2 3 4 1 2 3
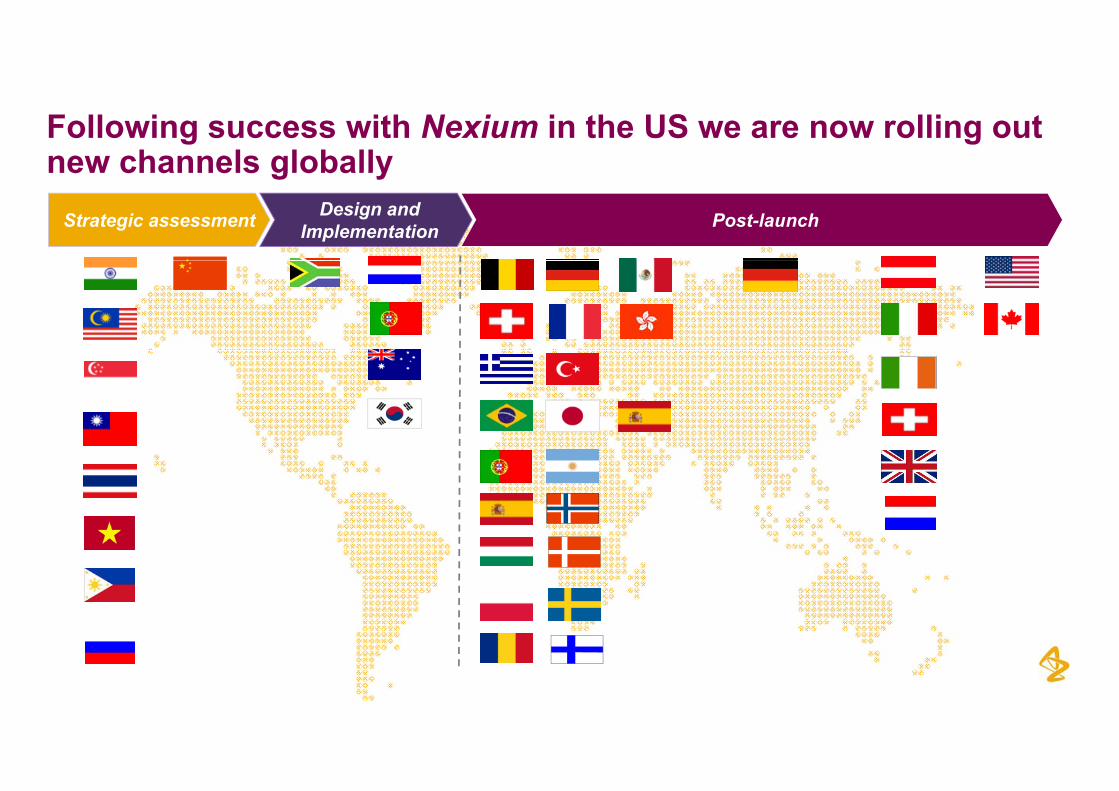
Following success with Nexium in the US we are now rolling out new channels globallynew channels globally
Strategic assessment Design and Implementation Post-launch
52
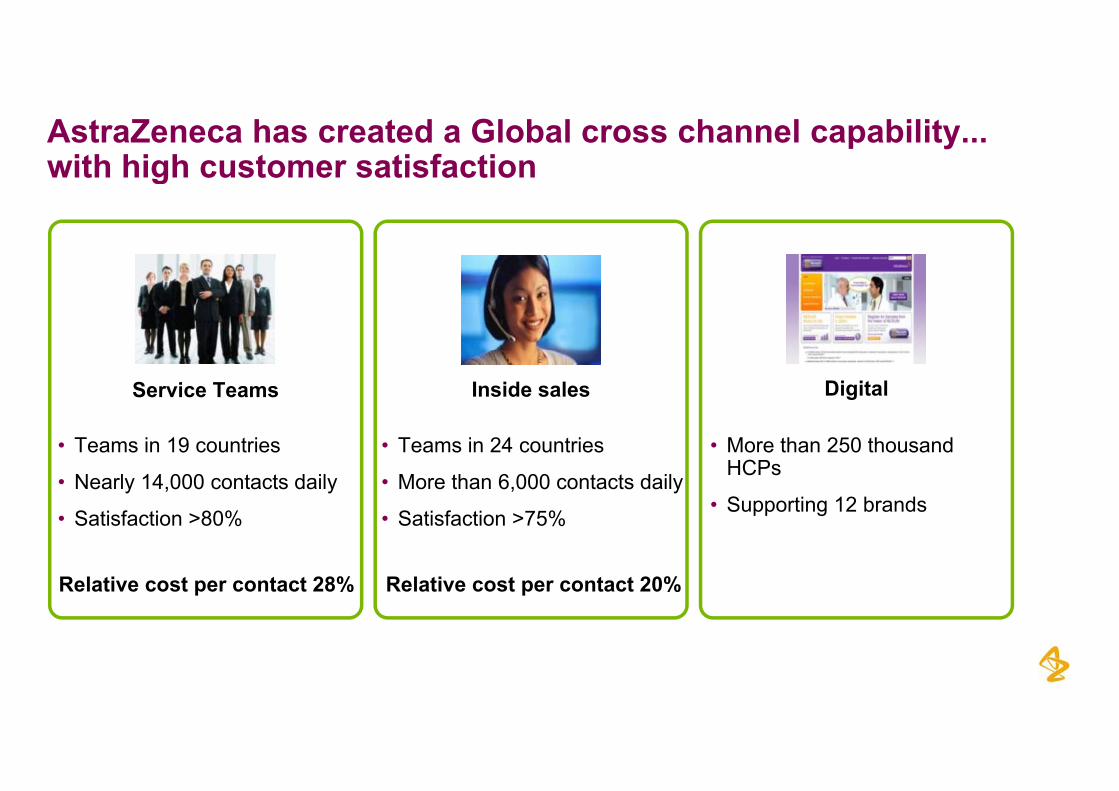
AstraZeneca has created a Global cross channel capability...with high customer satisfactionwith high customer satisfaction
Service Teams
T i 19 t i
Inside sales
T i 24 t i
Digital
M th 250 th d• Teams in 19 countries
• Nearly 14,000 contacts daily
• Satisfaction >80%
• Teams in 24 countries
• More than 6,000 contacts daily
• Satisfaction >75%
• More than 250 thousandHCPs
• Supporting 12 brands
Relative cost per contact 28% Relative cost per contact 20%
53
Commercial priorities
• Deliver the top line while reducing total commercial cost over a product life-cycle
Enhanced c stomer satisfaction• Enhanced customer satisfaction
• Restructuring
Global Marketing and Sales to be consolidated into 3 regions (from 5)- Global Marketing and Sales to be consolidated into 3 regions (from 5)
- Reduce non-customer facing positions
- Adjust field force to evolving portfolioj g p
• Leverage Pre-R&D operating margin
- Shareholder returnsShareholder returns
- Investment in the pipeline
54

Full Year Results2011
Q&A session
If you wish to take part in the Q&A session you can eitheremail a question or dial into the teleconference using oneof the numbers below:of the numbers below:
UK (freephone): 0800 694 2370( p )US (freephone): 1 866 977 7645 Swedish (freephone): 0200 883 079International: +44 (0)1452 557 749
C f ID 37157711Conference ID: 37157711
To avoid noise interference please remember to close the webcast
56
To avoid noise interference please remember to close the webcast.

Full Year Results2011