NEMA 4X Enclosure User Guide - Water Quality Testing and ...

Ultrasonic flowmetersSITRANS FUH1010 IP65 NEMA 4X
Instruction Manual - September 2008
SITRANS F


Field Manual CQO:1010DVNFM-3COctober 2007
For use with Operating SystemSoftware Version 3.02.00 or later
SITRANS FUH1010DVNNEMA CLAMP-ON
MULTI-FUNCTION FLOWMETER
This equipment contains components that aresusceptible to electrostatic discharge (ESD).Please observe ESD control measures duringthe handling and connection process.
Printed October 2007
Prepared By Date
Engineering Date
Copyright©2007 Siemens Energy & Automation, Inc. All Rights Reserved Made in the USA
IMPORTANT NOTICE
Controlotron is now part of:
Siemens Energy & Automation, Inc.Process Instrumentation Business Unit (PI BU)
CoC Ultrasonic Flow

Manual Changes
NOTE: For the latest updates and revisions to this field manual go to:http://support.automation.siemens.com/ and check the Product Manual listing.

MANUAL
ADDENDUM
Manual Addendum
September 2008
Copyright © 2008 Siemens Energy & Automation, Inc. All rights reserved Made in the USA
1010FMA-56
Operating System Software
Version Update


Manual Addendum 1010FMA-56
Operating System Software Version Update
INTRODUCTION
The following software operating system version update is for Version 3 flowmeters. Please refer tothis addendum when using this technical manual with Version 3 operating system software andflowmeters that have been updated to Version 5.
Operating System Software Changes
1. The [Meter Type Menu] includes a [Language] menu item that allows the selection of multiple flowmetermenu foreign languages.
2. Version 3 and Version 5 Operating System Differences
The following table lists the differences between Version 3 and Version 5 operating system menuitems and menu hint lines.
A-1
Version 3 Version 5
Select Pipe Class Pick Pipe Class
Pick/Install Xdcr Install Xdcr
Data/Span/Set/Ca Span/Set/Cal
Strip Chart Setup Display Setup
Dual Channel Flow 2 Channel Flow
Dual Beam Flow Dual Path Flow
Datalogger Setup Logger Setup
Temperature Range Temp Range
Pipe Configuration Pipe Config
Datalogger Setup Logger Setup
Datalogger Mode Logger Mode
Datalogger Data Logger Data
Log Time Interval Logger Interval
Display Datalogger Display Logger
Recall Site Setup Recall Site
Delete Site Setup Delete Site
Install Completed? Install Complete
Estimated Vs m/s Estimated Vs M/S
Channel /Path Setup Channel Setup
Reflexor Zero Fault/Set Zero Fault/SetMemory Delay (sec) Memory Delay s)
Flow Volume Units Flow Vol. Units
Flow Display Range Flow Disp. Range
Flow Display Scale Flow Disp. Scale
Total Volume Units Total Vol. Units
Batch/Sample Total Batch/Sample TotCalibrate Flowrate Calib. Flowrate
Analog Input Setup Analog Inp Setup
Flow Vel F/S Velocity F/S
Vs m/s Vs M/S
Valc % Valc
Vaer % Vaer
Vs Max m/s Vs Max M/S
(continued )

Manual Addendum 1010FMA-56
A-2
Vs Min m/s Vs Min M/S
Channel/Path Setup Chan/Path Setup
Vfmax GAL/MIN Vfmax
Date Site Created: Site Created:
Empty % Empty
Analog Output Trim Analog Out Trim
Pick flowtube size and type Select flowtube
and start operation
Empty Flowtube Set Empty Pipe Set
Version 3 Version 5
Gas Flowmeter Flow and VoS Unit Changes
1. Flowmeter Types
Flowmeter configurations included with this change include all SITRANS F Gas Flowmeters (7ME361*).
2. Flow Units
The table below describes the translation from the current gas flow units to the new gas flow units,where only Cubic Feet and Cubic Meter volume units are affected. Also note that M = thousands andMM = millions. Mass units and Velocity units remain unchanged.
Note: The flow legend changes depending upon the selection of Standard Volume enabled or
disabled.
FLOW UNITSFor STD VOLUME disabled For STD VOLUME enabled
Version 3 Version 5 Version 3 Version 5CU FT/SEC ACFS CU FT/SEC SCFSCU FT/MIN ACFM CU FT/MIN SCFMCU FT/HR ACFH CU FT/HR SCFHCU FT/DAY ACFD CU FT/DAY SCFDKCU FT/SEC MACFS KCU FT/SEC MSCFSKCU FT/MIN MACFM KCU FT/MIN MSCFMKCU FT/HR MACFH KCU FT/HR MSCFHKCU FT/DAY MACFD KCU FT/DAY MSCFDMCU FT/SEC MMACFS MCU FT/SEC MMSCFSMCU FT/MIN MMACFM MCU FT/MIN MMSCFMMCU FT/HR MMACFH MCU FT/HR MMSCFHMCU FT/DAY MMACFD MCU FT/DAY MMSCFD
CU M/SEC M3/sec M/SEC NM3/secCU M/MIN M3/min CU M/MIN NM3/minCU M/HR M3/hr CU M/HR NM3/hrCU M/DAY M3/day CU M/DAY NM3/dayKCU M/SEC E3 M3/sec KCU M/SEC E3 NM3/secKCU M/MIN E3 M3/min KCU M/MIN E3 NM3/minKCU M/HR E3 M3/hr KCU M/HR E3 NM3/hrKCU M/DAY E3 M3/day KCU M/DAY E3 NM3/dayMCU M/SEC E6 M3/sec MCU M/SEC E6 NM3/secMCU M/MIN E6 M3/min MCU M/MIN E6 NM3/minMCU M/HR E6 M3/hr MCU M/HR E6 NM3/hrMCU M/DAY E6 M3/day MCU M/DAY E6 NM3/day

Manual Addendum 1010FMA-56
4. Sound Velocity Units
Sound velocity will continue to be reported in units of meters/sec for metric units but will change toFeet/sec for English unit selection. The flowmeter will display M/S and F/S to represent these twovariations.
Note: The units for Sound Velocity will be based on the [Preferred Units] menu item found in
the [Meter Facilities] menu and can not be changed unless a new site is created.
5. Transducer Model Menu Name
The following table lists the operating system menu item differences between Version 3 Hi Precisionand Version 5 Hi Precision transducer model names that appear on the [Install Xdcr] menu. Note thatT1, T2 and T3 indicate the different temperature ranges of the transducer.
3. Total Units
Total units are similar to flow units.
TOTALIZE UNITS
For STD VOLUME disabled
Version 3 Version 5CU FT ACFKCU FT MACFMCU FT MMACFCUM M3KCU M E3 M3MCU M E6 M3
TOTALIZE UNITS
For STD VOLUME enabled
Version 3 Version 5CU FT SCFKCU FT MSCFMCU FT MMSCFCUM NM3KCU M E3 NM3MCU M E6 NM3
A-3
Version 3 Transducers Version 5 Transducers
Hi Precision Hi Precision1011HG Hi Prec. 1011HP-T1
1011HP-T21011HP-T3


MANUAL
ADDENDUM
Manual Addendum
September 2008
Copyright © 2008 Siemens Energy & Automation, Inc. All rights reserved Made in the USA
1010FMA-57
Digital P-Gen
Applications
Procedure Update

Manual Addendum 1010FMA-57
Digital P-Gen Applications Procedure Update
INTRODUCTION
The following Digital P-Gen applications procedure is to be added to the Data Span/Set/Cal Menusection of the SITRANS liquid and gas flowmeter manuals listed below:
Gas Flowmeter Manuals
FUG1010 IP 65 (NEMA 4X) Clamp-On Gas Flowmeter manual (CQO:1010GCNFM-3)FUG1010 IP 65 (NEMA 7) Compact Clamp-On Gas Flowmeter manual (CQO:1010GCXFM-3)FUG1010 IP 65 (NEMA 7) Compact Insert Gas Flowmeter manual (CQO:1010GXFM-3)
Liquid Flowmeter Manuals
FUH1010 IP 65 (NEMA 4X) Clamp-On Flowmeter manual (CQO:1010DVNFM-3)FUH1010 IP 65 (NEMA 4X) Clamp-On Flowmeter manual (CQO:1010PVNFM-3)FUH1010 IP 65 (NEMA 7) Compact Clamp-On Flowmeter manual (CQO:1010DVXFM-3)FUH1010 IP 65 (NEMA 7) Compact Clamp-On Flowmeter manual (CQO:1010PVXFM-3)
A-1
DIGITAL P-GEN APPLICATIONS PROCEDURE
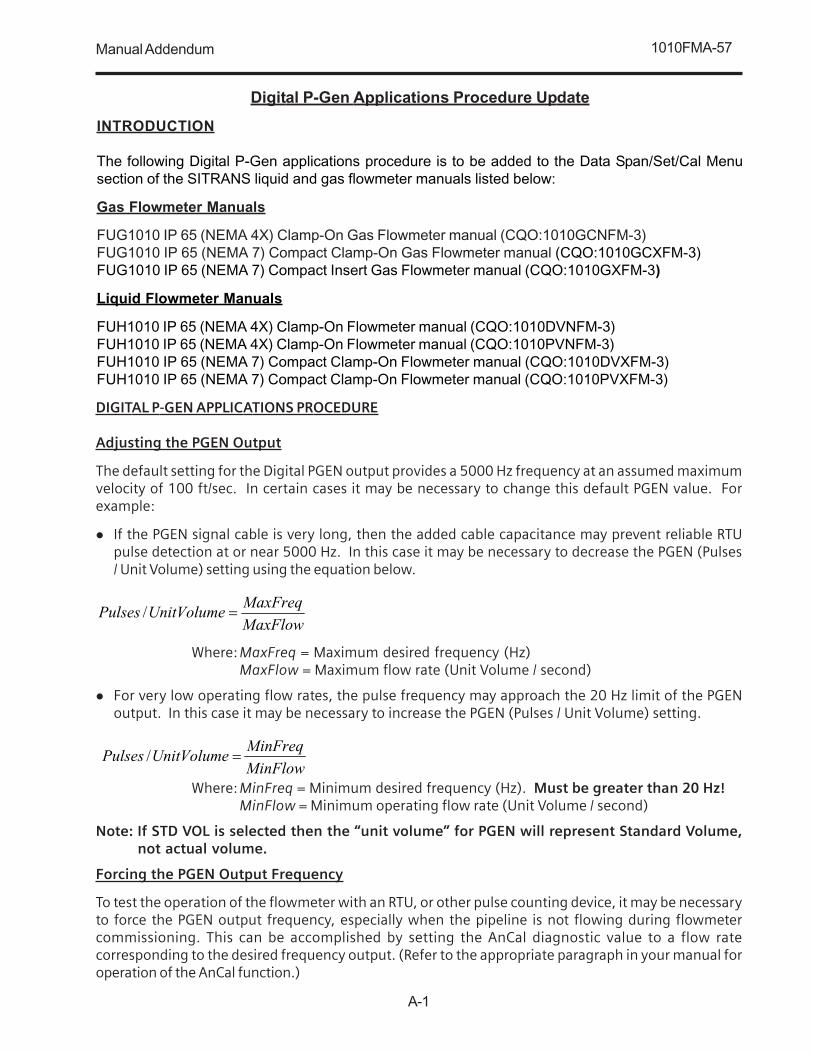
Adjusting the PGEN Output
The default setting for the Digital PGEN output provides a 5000 Hz frequency at an assumed maximumvelocity of 100 ft/sec. In certain cases it may be necessary to change this default PGEN value. Forexample:
� If the PGEN signal cable is very long, then the added cable capacitance may prevent reliable RTUpulse detection at or near 5000 Hz. In this case it may be necessary to decrease the PGEN (Pulses/ Unit Volume) setting using the equation below.
MaxFlow
MaxFreqUnitVolumePulses �/
Where: MaxFreq = Maximum desired frequency (Hz)MaxFlow = Maximum flow rate (Unit Volume / second)
� For very low operating flow rates, the pulse frequency may approach the 20 Hz limit of the PGENoutput. In this case it may be necessary to increase the PGEN (Pulses / Unit Volume) setting.
MinFlow
MinFreqUnitVolumePulses �/
Where: MinFreq = Minimum desired frequency (Hz). Must be greater than 20 Hz!MinFlow = Minimum operating flow rate (Unit Volume / second)
Note: If STD VOL is selected then the “unit volume” for PGEN will represent Standard Volume,not actual volume.
Forcing the PGEN Output Frequency
To test the operation of the flowmeter with an RTU, or other pulse counting device, it may be necessaryto force the PGEN output frequency, especially when the pipeline is not flowing during flowmetercommissioning. This can be accomplished by setting the AnCal diagnostic value to a flow ratecorresponding to the desired frequency output. (Refer to the appropriate paragraph in your manual foroperation of the AnCal function.)

Manual Addendum 1010FMA-57
A-2
The example below demostrates how to calculate the AnCal flow rate based on the desired pulse outputfrequency and the entered PGEN (Pulses / Unit volume) setting:
For PGEN setting = 53 Pulses /CU FT and a desired frequency = 1000 Hz
1. Temporarily change flow rate units to CU FT / SEC (Use same volume units as Totalizer.)
2. Set AnCal = 1000 / 53 = 18.868 CU FT / SEC
3. 1000 Hz frequency should now be observed on the PGEN output.

MANUAL
ADDENDUM
Manual Addendum
September 2008
Copyright © 2008 Siemens Energy & Automation, Inc. All rights reserved Made in the USA
1010FMA-58
Digital Damping
Procedure Update
For Gas & Liquid
Flowmeters


Manual Addendum 1010FMA-58
Digital Damping Procedure Update for Gas & Liquid Flowmeters
INTRODUCTION
The following Digital Damping procedure updates are for SITRANS F gas and liquid clamp-onflowmeters.Replace the Digital Damping Control: (Hot Key 1 and 2) procedure in the “Detection Modes”section (sub-paragraph: Command Modes) in the appropriate gas and liquid STIRANS F flowmetermanuals.
FUG1010 Gas Clamp-on Flowmeter Manuals
Digital Damping Control: (Hot Key 1 and 2)
The FUG1010 permits user modification of the digital averaging used by the signal processing routines.In general, the default damping values selected by the FUG1010 will provide optimal performance overa wide range of transit time applications. However, in extreme cases of unstable flow, pulsating flow,low signal levels or high electronic noise it may be necessary to override these default settings topermit uninterrupted and reliable flow measurement.
Test Facilities Graph Screen
The FUG1010 Graph Screen includes the capability to access a set of command codes, which enablea user to override a number of default meter settings. The most important parameter is the digitaldamping control, which can be accessed by pressing number <1> or <2> on the keypad while in theSignal Graph Screen mode.
[MinDamp] Command
Pressing the <1> key will cause [MinDamp #] to appear on the command line at the lower left-handcorner of the screen. The number listed to the right of the command code represents the exponent inthe FUG1010 exponential averaging routine, where the larger the number the greater the digital averaging.Pressing the <+> key will increase the damping value. Likewise, pressing the <-> key will decreasethe damping value. To exit this mode, press the <0> key on the keypad.
[MaxDamp] Command
Pressing the <2> key will bring up the [MaxDamp] command. The function of this parameter is similarto the [MinDamp] command described above; however, the two parameters interact in the followingmanner. The MinDamp value must not exceed the MaxDamp value, therefore increasing the MinDampvalue above the previous MaxDamp value will set both parameters to the same value. In most cases,it is preferred that both damping parameters be set to the same value, however, in cases where rapidresponse to changes in gas sound velocity for flow rate is required, the two values may be set differently.In this situation the meter will use the MaxDamp value when conditions are stable, but then switch toa faster damping value (limited by MinDamp) when a significant change in sound velocity or flow rateis perceived. To exit this mode, press the <0> key on the keypad.
A-1

Manual Addendum 1010FMA-58
A-2
Setting the Digital Damping Factor to a value HIGHER than the default value of 4 may be necessaryin cases where the signal to noise ratio (SN) is found to be unacceptably low (<15:1), but only if thenoise is determined to be asynchronous (i.e., not associated with the transmit or flowmeter timingcircuitry) as shown in the signal example above, where the baseline noise has a higher frequencythan the true gas signal.
The following application conditions may require a higher Digital Damping Factor:
� Close proximity to pressure control valves which may generate in-band acoustic noise� Very low acoustic signal levels (ALC < 40%)� High electronic noise from variable frequency drives or other external equipment.
To access the Digital Damping Control using the Test Facilities Graph Screen, proceed as follows:
1. To use the Test Facilities Graph Screen you must have a working site.
2. To activate the Test Facilities Graph Screen:
� In the main menu, scroll to the [Diagnostic Data] menu and select [Test Facilities].� Scroll down to [Graph], press the <Right Arrow> and highlight [Yes]. Press <ENT> to select.� The Test Facilities Graphic Screen will appear on the meter display as shown below.

Manual Addendum 1010FMA-58
To INCREASE the Digital Damping:
1. Press the <1> key while viewing the Test Facilities Graph Screen as shown above. The dampingcontrol [MinDamp #] should appear on the command line at the lower left-hand corner of thescreen.
Note: The number listed to the right of the command code on the screen represents the
exponent in the exponential averaging routine, where the larger the number represents
the greater the digital averaging. Setting this exponent higher than 7 is generally not
recommended.
2, Pressing the <+> key will increase the MinDamp Factor by one unit for each key press. To exit thismode, press the <0> key on the keypad.
Setting the Digital Damping factor to a value LOWER than the default value of 4 may be justified incases where pulsating flow is present (such as from a reciprocating compressor) or for the purposeof diagnosing transient signal behavior. A pulsating flow condition that generates more than +/- 45degrees of phase jitter will generally cause signal correlation problems when any digital averaging isused. In this case it may be necessary to completely eliminate the digital averaging by reducing theDigital Damping Factor to 0. In such a case it may also be necessary to install a narrow band tunedamplifier (Input Module) if too much asynchronous noise exists.
To DECREASE the Digital Damping:
1. Press the <2> key while viewing the Test Facilities Graph Screen. The damping control [MaxDamp#] should appear on the command line at the lower left-hand corner of the screen.
2. Pressing the <-> key will decrease the MaxDamp Factor by one unit for each key press. To exit thismode, press the <0> key on the keypad.
The above example shows that increasing the Digital Damping reduces asynchronous noise.
A-3

Manual Addendum 1010FMA-58
A-4
Digital Damping Control: (Hot Key 1 and 2)
The meter permits user modification of the digital averaging used by the signal processing routines. Ingeneral, the default damping values selected by the METER will provide optimal performance over awide range of transit time applications. However, in extreme cases of unstable flow, pulsating flow, lowsignal levels or high electronic noise it may be necessary to override these default settings to permituninterrupted and reliable flow measurement.
Test Facilities Graph Screen
The Graph Screen includes the capability to access a set of command codes, which enable a user tooverride a number of default meter settings. The most important parameter is the digital dampingcontrol, which can be accessed by pressing number <1> or <2> on the keypad while in the SignalGraph Screen mode.
[MinDamp] Command
Pressing the <1> key will cause [MinDamp #] to appear on the command line at the lower left-handcorner of the screen. The number listed to the right of the command code represents the exponent inthe meter exponential averaging routine, where the larger the number the greater the digital averaging.Pressing the <+> key will increase the damping value. Likewise, pressing the <-> key will decreasethe damping value. To exit this mode, press the <0> key on the keypad.
[MaxDamp] Command
Pressing the <2> key will bring up the [MaxDamp] command. The function of this parameter is similarto the [MinDamp] command described above; however, the two parameters interact in the followingmanner. The MinDamp value must not exceed the MaxDamp value, therefore increasing the MinDampvalue above the previous MaxDamp value will set both parameters to the same value. In most cases,it is preferred that both damping parameters be set to the same value, however, in cases where rapidresponse to changes in liquid sound velocity for flow rate is required, the two values may be setdifferently. In this situation the meter will use the MaxDamp value when conditions are stable, but thenswitch to a faster damping value (limited by MinDamp) when a significant change in sound velocity orflow rate is perceived. To exit this mode, press the <0> key on the keypad.
Liquid Clamp-on Flowmeter Manuals
Replace the Digital Damping Control: (Hot Key 1 and 2) procedure in the “Detection Modes” section(sub-paragraph: Command Modes) in the following flowmeter manuals:
FUS1010 IP 65 (NEMA 4X) Clamp-On Flowmeter manual (CQO:1010NFM-3)FUE1010 IP 65 (NEMA 4X) Clamp-On Flowmeter manual (CQO:1010ENFM-3)FUH1010 IP 65 (NEMA 4X) Clamp-On Flowmeter manual (CQO:1010DVNFM-3)FUH1010 IP 65 (NEMA 4X) Clamp-On Flowmeter manual (CQO:1010PVNFM-3)FUP1010 IP 40 (NEMA 1) Clamp-On Portable Flowmeter manual (CQO:1010PFM-3)FUE1010 IP 40 (NEMA 1) Clamp-On Portable Flowmeter manual (CQO:1010EPFM-3)

Manual Addendum 1010FMA-58
A-5
To access the Digital Damping Control using the Test Facilities Graph Screen, proceed as follows:
1. To use the Test Facilities Graph Screen you must have a working site.
2. To activate the Test Facilities Graph Screen:
� In the main menu, scroll to the [Diagnostic Data] menu and select [Test Facilities].� Scroll down to [Graph], press the <Right Arrow> and highlight [Yes]. Press <ENT> to select.� The Test Facilities Graphic Screen will appear on the meter display as shown below.
Setting the Digital Damping Factor to a value HIGHER than the default value of 4 may be necessary incases where the signal to noise ratio (SN) is found to be unacceptably low (<15:1), but only if the noiseis determined to be asynchronous (i.e., not associated with the transmit or flowmeter timing circuitry)as shown in the signal example above, where the baseline noise has a higher frequency than the trueliquid signal.
The following application conditions may require a higher Digital Damping Factor:
� Close proximity to pressure control valves which may generate in-band acoustic noise� High un-dissolved gas solids content in liquid.� High electronic noise from variable frequency drives or other external equipment.
1482.1

Manual Addendum 1010FMA-58
A-6
To INCREASE the Digital Damping:
1. Press the <1> key while viewing the Test Facilities Graph Screen as shown above. The dampingcontrol [MinDamp #] should appear on the command line at the lower left-hand corner of thescreen.
Note: The number listed to the right of the command code on the screen represents the
exponent in the exponential averaging routine, where the larger the number represents
the greater the digital averaging. Setting this exponent higher than 7 is generally not
recommended.
2. Pressing the <+> key will increase the MinDamp Factor by one unit for each key press. To exit thismode, press the <0> key on the keypad.
1482.1
The above example shows that increasing the Digital Damping reduces asynchronous noise.
Setting the Digital Damping factor to a value LOWER than the default value of 4 may be justified incases where pulsating flow is present (such as from a reciprocating pump) or for the purpose ofdiagnosing transient signal behavior. A pulsating flow condition that generates more than +/- 45 degreesof phase jitter will generally cause signal correlation problems when any digital averaging is used. Inthis case it may be necessary to completely eliminate the digital averaging by reducing the DigitalDamping Factor to 0.
To DECREASE the Digital Damping:
1. Press the <2> key while viewing the Test Facilities Graph Screen. The damping control [MaxDamp#] should appear on the command line at the lower left-hand corner of the screen.
2. Pressing the <-> key will decrease the MaxDamp Factor by one unit for each key press. To exit thismode, press the <0> key on the keypad.

MANUAL ADDENDUM
SETUP PROCEDURE FORWET-FLOW CALIBRATED
1010 SYSTEMS
System 1010 UniflowPortable & NEMA
Flowmeter SystemsManual Addendum
July 2002
1010FMA-4
Copyright©2008 Siemens Energy & Automation, Inc. All Rights Reserved Made in the USA


Manual Addendum 1010FMA-4
July 2002
SETUP PROCEDURE FOR “WET-FLOW CALIBRATED” 1010 SYSTEM
1. INTRODUCTION
When the system 1010 is wet-flow calibrated, the flow computer stores the installation param-eters in its storage memory. Each flow calibration is assigned a unique site name. Usually, thesite name corresponds to the pipe size. For example, a 3-inch carbon steel, schedule 40 pipewould be given the name “3CS40.”
The flow calibration report issued with each wet-flow calibration, includes a flow calibration“Diagnostic Data Sheet.” This data sheet lists the site name and other necessary information(such as transducer serial number and spacing information), for setting-up the flowmeter. Awet-flow calibration applies to a specific flowmeter and set of transducers; identified by serialnumbers on the diagnostic data sheet.
NOTE: In order for the flow calibration to be valid, the flow computer and transducers
being used must have the same serial numbers as those listed for the site on
the Calibration Diagnostic Data Sheet.
2. SETUP PROCEDURE
2.1 Transducer Installation
2.1.1 Refer to the diagnostic data sheet to find the mounting mode (Direct or Reflect) usedduring the wet-flow calibration. Review the transducer installation guidelines in your 1010field manual.
2.1.2 Refer to the diagnostic data sheet for the transducer spacing index utilized during theflow calibration. Using the mounting configuration employed during the flow calibration,install the transducers on the pipe at the above noted spacing positions in accordancewith the instructions provided on the transducer installation drawings.
2.1.3 Attach the transducer cables noting that the cable marked “UP” attaches to the trans-ducer closest to the source of flow.
NOTE: Before proceeding further, ensure that the pipe is full of liquid. It is not impor-
tant at this point that it be flowing.
1
Caution: DO NOT use the field manual installation procedure to startup a wet-flow
calibrated system. Doing so could void the calibration by corrupting es-
sential data. This addendum contains the only authorized instructions to
be used when commissioning a wet-flow calibrated 1010 system.

Manual Addendum 1010FMA-4
2.2 Flowmeter Setup
NOTE: The following instructions require the use of the keypad and the menu. The
installer should become familiar with their use before proceeding further.
2.2.1 Switch the flowmeter on. Press the <MENU> key.
2.2.2 On multi-channel flowmeters, use the arrow keys to select [Dual Channel Flow] or[Dual Beam Flow] depending on the mode utilized for the wet-flow calibration.
2.2.3 Use the arrow keys to select either [Clamp-on], [Flow Tube] or [Clamp-on Spool].
2.2.4 Select [Full Site Setup] and use the <Right Arrow> to select [Channel Setup]; thenselect [Recall Site Setup].
2.2.5 Use the <Down Arrow> to scroll to the site name indicated on the Calibration Diagnos-tic Data Sheet. Then press <ENT>.
2.2.6 The meter will perform a momentary “Makeup” routine that will take a few seconds andthen begin operation.
2.2.7 Refer to your 1010 field manual for instructions on setting zero flow.
NOTE: Setting zero flow must be performed each time the transducers are installed.
The zero adjustment has no effect on the wet-flow calibration data or the cali-
bration (Kc) factor.
2.2.8 Using the arrow keys, scroll to the Data Span/Set/Cal menu location. Verify that the [Kc](calibration) factor matches the value indicated on the diagnostic data sheet.
2.2.9 If you are measuring a liquid other than ambient water, select the [Liquid Class] menucell and <Down Arrow> from there to [Viscosity]. Enter the correct viscosity for theliquid you will be monitoring.
2.2.10 Setup is now complete. Press the <MENU> key twice to view the flow rate display. DONOT utilize the [Save Site] command when it appears.
2.2.11 When measurements are completed, simply turn off the meter. DO NOT save the site.This might contaminate the wet-flow calibration data already stored.
NOTE: Contact your Siemens representative if any flow calibration data is accidentally
removed or overwritten (www.siemens.com).
2 July 2002

Manual Addendum 1010FMA-4
3. TRANSFER INSTALL FUNCTION
All 1010 flowmeter operating systems (version 3.00.20 and greater) include the installation facil-ity called “Transfer Install.” This function permits the transducers to be repositioned while main-taining all calibration parameters and operation established during the water calibration. TheTransfer Install function allows the transducers to be optimally positioned for a different fluid,without the need for a new Initial Makeup procedure.
NOTE: Prior to performing Transfer Install make sure that the water calibration proce-
dure was performed and a saved active site exists.
3.1 Transfer Install Procedure
To initiate the Transfer Install function, proceed as follows:
3.1.1 In the Application Menu press the <Right Arrow> to select the [Liquid Class] menu cell.Scroll and highlight [Estimated Vs m/s] from the option list.
3.1.2 Use the numeric keys to change the Estimated Vs to the Estimated Vs value of thecustomer selected liquid.
3.1.3 To enter new Estimated Vs value press <ENT>.
3.1.4 Proceed to the Pick/Install Xdcr menu and select the same transducer, mounting modeand spacing offset that was selected for the water calibration.
3.1.5 Re-space the transducers to the index position indicated by the flowmeter.
3.1.6 Scroll to the [Install Completed?] menu cell and select [Transfer Install] from the optionlist.
NOTE: If [Transfer Install] does not appear in the option list then either the Estimated
Vs or the transducer size was improperly entered. In this case, recall the water
calibration site and start the procedure again at Step 3.1.1 above.
3.1.7 For MultiPath systems repeat Step 3.1.6 above for the remaining paths.
3.1.8 The flowmeter should now be operational at the new spacing location.
NOTE: Depending on the size of the pipeline, the change in the estimated sonic veloc-
ity (Vs) and the repositioning of transducers, the flowmeter may not operate out
of Fault even if the spool or pipe is filled with liquid. This can be expected when
performing a Transfer Install for liquified gases or for clamp-on natural gas flow-
meters.
3.2 Saving New Transfer Install Site
3.2.1 To save the Transfer Installed site, scroll to the Channel Setup menu and press the<Right Arrow>. Press the <Right Arrow> again to select the [Save/Rename] menu cell.
3.2.2 Use the numeric keys to rename the Transfer Installed site with the same site nameused in Step 3.1.2 above, but with a “T” appended to the end of the site name (e.g.,3CS40T).
3.2.3 Press <ENT> to store data.
July 20023


MANUAL
ADDENDUM
Manual Addendum
May 2002
1010FMA-14
SYSTEM 1010
EXPANDED I/O OPTION
(For Systems Equipped With 1010N-7 Modules)
Copyright©2008 Siemens Energy & Automation, Inc. All Rights Reserved Made in the USA


Manual Addendum 1010FMA-14
May 20021
EXPANDED I/O OPTION
(For Systems Equipped With 1010N-7 Modules)
INTRODUCTION
The 1010N-2 I/O Module and 1010N-7 Expanded I/O Module both provide current (Io1, Io2), voltage(V01 and Vo2) and pulse rate (Pgen 1 and Pgen 2) analog outputs. The Expanded I/O Module Optionallows users to drive as many as four additional 4-20 mA loop-powered instrumentation outputs. Thefollowing information is intended to be used with the I/O Data Control and Span Data sections andAnalog Output Trim Menu in the field manual.
The System 1010 flowmeter provides an Analog Output Setup menu (see below) that allows the userto assign data functions for these output signals (refer to Analog Output Setup in the appropriate 1010field manual). In addition, refer to Installation Drawings 1010N-2-7 and 1010N-7-7 in the field manualappendices for additional connection information and terminal block numerical designators.
NOTE: All meters in the System 1010N and DN product family can accept the Expanded I/O
Module Option except 4-Channel meters.
EXPANDED I/O MODULE OPTION
The Expanded I/O Module Option provides expanded Io analog outputs. It is implemented through theuse of a 1010N-7 Expanded I/O Module occupying the same position as the 1010N-2 I/O Module. Thisoption allows users to drive up to four additional 4-20mA loop-powered instrumentation outputs. Notethat the meter menu does not indicate that these supplementary outputs are present and available.The outputs, in addition to being loop-powered, are isolated from one another as well as the meter.
Expanded I/O Module Option Identification
To verify that your meter has the Expanded I/O Module Option installed check the following:
The designation A1 should be part of the flowmeter part number.
For example: 1010ENRE-T1A1KGS
Siemens Dual Path SITE1
Assign Data to Analog Outputs
I/O Data Control
Analog Out SetupRelay SetupAnalog Input Setup
Use this menu toassign data functions
to analog outputs.

Manual Addendum 1010FMA-14
2 May 2002
1010N-2 I/O Module
The conventional 1010N-2 I/O module provides the following:
� Two self-powered, isolated 4-20 mA current loops (signals Io1 and Io2) that are assignable andspannable by the user to many flowmeter variables such as flow, sonic velocity, signal strength,etc. These self-powered outputs also provide an industry-standard fault indication by droppingto 2 mA if assigned to flow rate and under fault conditions. Note that these outputs, thoughisolated from the system, are NOT isolated from each other.
� Two 0-10 Vdc outputs (signals Vo1 and Vo2) that are also assignable and spannable by theuser as above. These are also self-powered, but are not isolated from the system.
� Two 0-5000 Hz Pgen signals (Pgen1 and Pgen2) also assignable and spannable by the user.These are TTL level pulses.
The 1010N/DN class of meters has a total of six analog outputs as indicated above. In addition (refer toInstallation Drawings 1010N-2-7 and 1010N-7-7):
� Alarms/Status/Totalizer pulses are generally presented as relay closures as either MercuryWetted Form 1A or Dry Reed Form C relays.
� Analog inputs, when provided, are in the form of 4-20 mA non-isolated inputs.
� The meter also has four non-isolated totalizer command lines providing Totalizer Clear andTotalizer Hold (NoTot) functionality.
1010N-7 Expanded I/O Module Option
The Expanded I/O Module Option provides all of the above plus the following outputs:
� The four signals that drive the pulse generator outputs (Pgen 1 and Pgen2) and voltage outputs(Vo1 and Vo2) of the meter create four current outputs: Aux Io1, Aux Io2, Aux Io3 and Aux Io4(see diagram on next page).
� By spanning and assigning a system variable to 0-10 volt (Vo1 and Vo2) or 0-5000 Hz pulseoutput (Pgen1 and Pgen2) the module simultaneously outputs these signals to the ExpandedI/O Module Option Aux outputs. For a 2-Channel meter the programming assignments are asfollows:
CHANNEL SIGNAL AUX Io METER MENU DISPLAY
CH1 Pgen1 Io1 Vo1Vo1 Io3 Pgen1
CH2 Pgen2 Io2 Vo1Vo2 Io4 Pgen1
TYPICAL 2-CHANNEL METER EXPANDED I/O OPTION CONNECTIONS
� Note that the four Aux Io outputs are externally powered.

Manual Addendum 1010FMA-14
3 May 2002
NOTE: The method used to create auxiliary current loops makes it impractical to generate the
2 mA fault current produced by the primary 4-20 mA outputs of the meter.
NOTE: The 1010N-7 Expanded I/O Module auxiliary output signals (Aux Io1 - Aux Io4) geneated
from Pgen1, Pgen2, Vo1 and Vo2 are “mirrored” output currents. For example, if Vo1 is
a 5 Vdc signal then Aux Io3 will be 12 mA.
EXPANDED I/O MODULE OPTION PROGRAMMING
The diagram below illustrates the Expanded I/O Module Option programming for a Single Channelmeter with a 1010N-7 Expanded I/O Module.
FLOW COMPUTER
INTERNAL
CONNECTIONS
Io1
Io1
Pgen1
Pgen2
Vo1
Vo2
Aux Io1
Aux Io2
Aux Io3
Aux Io4
OUTPUT
TERMINAL STRIP
�
�
�
�
��
��
��


1010DVNFM-3C Table Of Contents
Section 11. Getting Started ............................................................................................... 1-11.1 Introduction .................................................................................................... 1-11.2 Important Safety Considerations ................................................................... 1-11.3 Flowmeter Installation Steps.......................................................................... 1-11.4 The Keypad Enable Switch ............................................................................. 1-2
Typical System Layout .............................................................................. 1-21.5 The FUH1010DVN Keypad .............................................................................. 1-3
Keypad Function Chart ............................................................................. 1-31.6 Introduction To The FUH1010DVN Menu Screens .......................................... 1-3
Explanation Of The Callouts ......................................................................1-41.7 How To Use The Installation Menu................................................................. 1-41.7.1 Accessing And Leaving The Menu ................................................................. 1-51.7.2 How To Enter Data .......................................................................................... 1-5
Selecting Items From An Option List ..........................................................1-6Multiple Select Option Lists ....................................................................... 1-7Entering Numeric Data ............................................................................. 1-7Entering Alphanumeric Strings .................................................................. 1-8
1.7.3 The Meter Type Menu..................................................................................... 1-8Dual Channel ...........................................................................................1-9Dual Path ................................................................................................ 1-9Channel 1+2 and Channel 1-2 ................................................................. 1-9
1.7.4 Essential Information For Users of Multi-Channel 1010’s .............................. 1-10Multi-Channel Meter Type ......................................................................... 1-10Arithmetic Operation ................................................................................ 1-10Multi-Path Operation................................................................................. 1-10Selecting a Meter Type ............................................................................. 1-11Creating a New Site Setup ........................................................................ 1-12Flowmeter Installation Flow Chart ............................................................. 1-14
1.8 Using FastStart Setup ..................................................................................... 1-151.8.1 Choosing the Pipe Classes ............................................................................. 1-151.8.2 Picking And Installing The Parameters ........................................................... 1-151.9 1010WX Clamp-On liquid Flowmeters ........................................................... 1-19
Section 22. The FUH 1010DVN Installation Menu ............................................................. 2-12.1 The Channel Setup Menu ............................................................................... 2-2
The Channel Setup Menu Structure ........................................................... 2-22.1.1 How To Recall A Site Setup ............................................................................. 2-22.1.2 How To Enable And Disable A Measurement Channel ..................................2-32.1.3 How To Create/Name A Site Setup ................................................................. 2-42.1.4 How To Enable/Disable Site Security .............................................................. 2-42.1.5 How To Delete A Site Setup ........................................................................... 2-52.1.6 How To Save/Rename A Site Setup ................................................................ 2-52.2 The Pipe Data Menu ....................................................................................... 2-6
The Pipe Data Menu Structure ...................................................................2-82.2.1 How To Select A Pipe Class............................................................................. 2-92.2.2 How To Select A Pipe Size .............................................................................. 2-10
Sect./Page
TABLE OF CONTENTS
i

1010DVNFM-3C Table Of Contents
2.2.3 How To Enter The Pipe OD (in. or mm)........................................................... 2-102.2.4 How To Select A Pipe Material ........................................................................ 2-102.2.5 How To Enter The Wall Thickness ................................................................... 2-112.2.6 Liner Material .................................................................................................. 2-112.2.7 Liner Thickness ............................................................................................... 2-112.2.8 ThermExp Coef ............................................................................................... 2-122.2.9 Mod of Elast PSI .............................................................................................. 2-122.3 The Application Data Menu ............................................................................ 2-12
The Application Data Menu Structure ......................................................... 2-132.3.1 How To Select A Liquid Class .......................................................................... 2-14
How to Edit the Estimated Vs (liquid sonic velocity).................................... 2-15How to Edit the Viscosity (cS) Setting ........................................................ 2-15How to Edit the Density (SG) Setting ......................................................... 2-15
2.3.2 Activating The Liquid Table ............................................................................ 2-16Setting The LiquIdent Slope ....................................................................... 2-16Setting The Pressure Slope ....................................................................... 2-17Setting The Reference Base Temperature .................................................. 2-18Entering K0 And K1 Parameters ................................................................ 2-18Setting The LiquIdent Index ....................................................................... 2-19
Index Value ........................................................................................ 2-20S.G. .................................................................................................... 2-20Viscosity ............................................................................................. 2-20Visc Slope .......................................................................................... 2-20Liquid Name ....................................................................................... 2-20K0 and K1 .......................................................................................... 2-20
2.3.3 How To Select A Pipe Temperature Range ..................................................... 2-202.3.4 Pipe Configuration ......................................................................................... 2-21
Pipe Configuration Menu Structure ............................................................ 2-22Pipe Configuration Option List Definitions ................................................... 2-22
2.4 The Pick/Install XDCR (Transducer) Menu ....................................................... 2-23Pick/Install Xdcr Menu Structure ................................................................ 2-24
2.4.1 How To Select A Transducer Model ................................................................ 2-242.4.2 How To Select A Transducer Size .................................................................... 2-252.4.3 How To Select A Transducer Mount Mode ...................................................... 2-252.4.4 How To Use The Spacing Offset ..................................................................... 2-252.4.5 The Number Index Menu Cell ........................................................................ 2-262.4.6 Reviewing The Spacing Method ..................................................................... 2-262.4.7 The Ltn Menu Cell ........................................................................................... 2-272.4.8 How To Use [Install Completed?] ................................................................... 2-27
Force Transmit Procedure ......................................................................... 2-282.4.9 The Empty Pipe Set Menu .............................................................................. 2-31
How to Use the Actual MTY Command...................................................... 2-31How to Use the MTYmatic Command ....................................................... 2-31How to Use the Set Empty Command ....................................................... 2-32
2.4.10 The Zero Flow Adjust Menu ........................................................................... 2-32AutoZero ................................................................................................. 2-32Actual Zero ............................................................................................. 2-32ReversaMatic ........................................................................................... 2-32ZeroMatic ................................................................................................ 2-33Using Actual Zero .................................................................................... 2-33
ii

1010DVNFM-3C Table Of Contents
iii
Using ReversaMatic ..................................................................................2-33ZeroMatic (optional function) ......................................................................... 2-34
2.5 The Operation Adjust Menu ........................................................................... 2-36Operation Adjust Menu Structure .............................................................. 2-36
2.5.1 Damping Control ............................................................................................ 2-372.5.2 Deadband Control .......................................................................................... 2-372.5.3 Memory/Fault Set ........................................................................................... 2-37
Memory Delay (sec) ................................................................................ 2-382.5.4 Sonilocator Operation..................................................................................... 2-38
Using the [Sonilocate] Menu Item.............................................................. 2-392.6 The Flow/Total Units Menu............................................................................. 2-41
Totalizer Controls ..................................................................................... 2-41Flow/Total Units Menu Structure ................................................................ 2-42
2.6.1 Flow Volume Units ......................................................................................... 2-432.6.2 STD Vol Corr. ................................................................................................... 2-432.6.3 Flow Time Units ............................................................................................. 2-432.6.4 Flow Display Range ........................................................................................ 2-442.6.5 Flow Display Scale .......................................................................................... 2-442.6.6 Total Volume Units ......................................................................................... 2-442.6.7 STD Vol Corr. ................................................................................................... 2-452.6.8 Totalizer Scale ................................................................................................. 2-452.6.9 Total Resolution .............................................................................................. 2-452.6.10 Totalizer Mode ................................................................................................ 2-462.6.11 Batch/Sample Total ......................................................................................... 2-462.7 The Data Span/Set/Cal Menu .......................................................................... 2-46
Data Span/Set/Cal Menu Structure ............................................................ 2-472.7.1 Span Data........................................................................................................ 2-48
Pgen ....................................................................................................... 2-49Pgen Wiring Diagram ............................................................................... 2-50Max Flow ................................................................................................ 2-52Min Flow ................................................................................................. 2-52Max LiquIdent .......................................................................................... 2-52Min LiquIdent ........................................................................................... 2-52Max ROC ................................................................................................. 2-52Min ROC .................................................................................................. 2-53Max Vs m/s ............................................................................................. 2-53Min Vs m/s ..............................................................................................2-53Max S.G. .................................................................................................. 2-53Min S.G. ................................................................................................... 2-53Max API ................................................................................................... 2-53Min API ....................................................................................................2-53Max Kg/m3 ..............................................................................................2-53Min Kg/m3 ............................................................................................... 2-53Max Base S.G. .......................................................................................... 2-53Min Base S.G. ...........................................................................................2-53Max Base API ...........................................................................................2-53Min Base API ............................................................................................ 2-53Max Base Kg/m3 ...................................................................................... 2-54Min Base Kg/m3 ....................................................................................... 2-54Max Viscosity cS ...................................................................................... 2-54

1010DVNFM-3C Table Of Contents
iv
Min Viscosity cS ....................................................................................... 2-54Max Temperature..................................................................................... 2-54Min Temperature ..................................................................................... 2-54
2.7.2 Set Alarm Levels ............................................................................................. 2-54High Flow ................................................................................................ 2-54Low Flow ................................................................................................ 2-55High S.G. .................................................................................................2-55Low S.G. .................................................................................................. 2-55High API .................................................................................................. 2-55Low API ................................................................................................... 2-55High Kg/m3 ..............................................................................................2-55Low Kg/m3 ..............................................................................................2-55High Base S.G. ......................................................................................... 2-55Low Base S.G. .......................................................................................... 2-55High Base API .......................................................................................... 2-55Low Base API ........................................................................................... 2-56High Base Kg/m3 ..................................................................................... 2-56Low Base Kg/m3 ...................................................................................... 2-56High Viscosity cS .....................................................................................2-56Low Viscosity cS ...................................................................................... 2-56High Temperature .................................................................................... 2-56Low Temperature..................................................................................... 2-56Interface Vs m/s ...................................................................................... 2-56Aeration % .............................................................................................. 2-56Makeup Latch .......................................................................................... 2-57
2.7.3 Interface Alarms ............................................................................................. 2-57ROC Alm Set m/s ..................................................................................... 2-57Interval Secs ............................................................................................ 2-57Relay Hold Time ....................................................................................... 2-57High LiquIdent ......................................................................................... 2-57Low LiquIdent .......................................................................................... 2-57
2.7.4 Calibrate Flowrate And Calibration Tables ..................................................... 2-58Intrinsic ................................................................................................... 2-58Kc Calibration .......................................................................................... 2-58Kc Factor ................................................................................................. 2-59Selecting The Kc Factor ............................................................................ 2-59Calibration Tables 1 Through 3.................................................................. 2-60
2.8 The StripChart Setup Menu............................................................................. 2-61The StripChart Menu Structure .................................................................. 2-61
2.8.1 Select Data ...................................................................................................... 2-622.8.2 Data Display .................................................................................................... 2-622.8.3 Time Base ....................................................................................................... 2-632.8.4 StripChart Clear ............................................................................................... 2-632.9 The Datalogger Setup Menu .......................................................................... 2-63
Datalogger Setup Menu Structure ............................................................. 2-642.9.1 Datalogger Mode ............................................................................................ 2-652.9.2 Datalogger Data .............................................................................................. 2-65
Alarm Letter Codes And Descriptions ........................................................ 2-652.9.3 Log Time Interval ............................................................................................ 2-652.9.4 Datalogger Events .......................................................................................... 2-65

1010DVNFM-3C Table Of Contents
v
2.9.5 Display Datalogger ......................................................................................... 2-672.10 The I/O Data Control Menu ............................................................................. 2-68
I/O Data Control Menu Structure ............................................................... 2-692.10.1 Analog Out Setup ........................................................................................... 2-70
FUH1010DVN Analog Outputs ................................................................. 2-70Analog Out Setup Data Categories ............................................................ 2-70Table to Determine Proper I/O Installation Drawings ................................... 2-71Assigning Io Output Functions .................................................................. 2-71Assigning Vo Output Functions ................................................................. 2-71Assigning Pgen Output Functions .............................................................. 2-72
Pulse Output (Pgen Wiring) ............................................................... 2-722.10.2 Relay Setup ..................................................................................................... 2-73
Assigning Relay 1, 2, 3 and 4 Functions ....................................................2-73Relay Option List ...................................................................................... 2-73
2.10.3 Analog Input Setup (optional function) ......................................................... 2-74Setting up the Analog Current Input ........................................................... 2-75
2.11 The Diagnostics Data Menu ............................................................................ 2-752.11.1 Main Diagnostics Data Screen ........................................................................ 2-75
Diagnostics Data Menu Structure .............................................................. 2-76Diagnostic Main Menu Description ............................................................ 2-77
2.11.2 Flow Data Menu .............................................................................................. 2-77Flow Data Menu Items ............................................................................. 2-77Vs m/s .................................................................................................... 2-78HiFlow and LoFlow .................................................................................. 2-78AnCal ...................................................................................................... 2-78
2.11.3 The Application Info Menu ............................................................................ 2-79Application Info Menu Items ...................................................................... 2-80
2.11.4 The Liquid Data Menu..................................................................................... 2-80Liquid Data Menu Items ............................................................................ 2-80
2.11.5 The Site Setup Data Menu .............................................................................. 2-81Site Setup Menu Items ............................................................................. 2-81Introduction to [HF] Menu Item ................................................................. 2-81Using the [HF] Menu Item......................................................................... 2-82“Manual” Adjustment Procedure ................................................................ 2-83“Automatic” Adjustment Procedure ............................................................ 2-83
2.11.6 The Test Facilities Menu ................................................................................. 2-85Test Facilities Commands ......................................................................... 2-85Makeup ................................................................................................... 2-85The Test Facilities Graph Screen ................................................................ 2-86Entering The Diagnostic Graph Screen ...................................................... 2-87Diagnostic Text Display............................................................................. 2-87Time Base Control .................................................................................... 2-87Correlated Plot ......................................................................................... 2-87Command Modes .................................................................................... 2-88Description of Graph Screen Text Display Parameters ................................ 2-90Hot Key Summary ................................................................................... 2-90
2.11.7 Troubleshooting Tips ...................................................................................... 2-91Flow Computer Messages ........................................................................ 2-91Using the “F4” Reset Sequence................................................................. 2-92
2.11.8 Troubleshooting With Transducer Test Blocks ................................................ 2-94

1010DVNFM-3C Table Of Contents
vi
2.11.9 Using The 1012TB-1 And -2 Test Blocks .......................................................... 2-942.11.10 Using The 996PSP Pipe Simulator .................................................................. 2-96
If a Pipe Simulator/Test - Block Test Fails .................................................... 2-972.12 Guide To A Smooth Installation ...................................................................... 2-982.12.1 Checklist For 1010 Start-up & Performance ................................................... 2-98
Programming .......................................................................................... 2-98Installation/Transducer Mount Guidelines ................................................... 2-98Start-Up................................................................................................... 2-99Diagnostic/Performance Verification .......................................................... 2-99
2.12.2 Optimization/Correction Of Problems ................................................... 2-99Incorrect “Measured Vs” ........................................................................... 2-99Low Valc ............................................................................................... 2-100Detection Fault/Low Signal ...................................................................... 2-100High Vaer .............................................................................................. 2-100Poor Signal ............................................................................................ 2-100“Official” Coupling Compounds ............................................................... 2-101“Alternative” Coupling Compounds .......................................................... 2-101Ideal Vsig Display................................................................................... 2-101
Section 33. Hardware Installation Guide ........................................................................... 3-13.1 Preparing To Mount The Transducers ............................................................. 3-13.1.1 How To Identify 1011 Transducers and Mounting Hardware .........................3-13.1.2 Selecting A Location For Clamp-On Transducers ............................................ 3-13.1.3 Clamp-On Transducer Mounting Modes ........................................................ 3-23.1.4 Preparing The Pipe ......................................................................................... 3-33.1.5 Reflect Mode With EZ Clamp And Spacer Bar Only ........................................ 3-43.1.6 Direct Mode With EZ Clamp And Spacer Bar Only .......................................... 3-53.1.7 Reflect Mode-Mounting Frames and Spacer Bar ............................................ 3-93.1.8 Reflect Mode With Spacer Bar Only ................................................................ 3-103.1.9 Direct Mode-Mounting Frames, Spacer Bar and Spacing Guides ...................3-123.1.10 Using 1012T Mounting Tracks......................................................................... 3-16
Installing a 1012T Mounting Track in Reflect Mode .....................................3-16Installing a 1012T Mounting Track in Direct Mode ...................................... 3-18
3.2 Mounting Temperature Sensors ..................................................................... 3-203.2.1 Wiring Temperature Sensor To The Analog Input Module ............................. 3-213.2.2 FUH1010DVN Supply And Return Connections ..............................................3-223.2.3 Notes On FUH1010DVN Analog Input Modules ............................................. 3-23
Single Channel Models ............................................................................. 3-23Dual-Path Models .....................................................................................3-23
3.2.4 Clamp-On RTD Installation Notes .................................................................... 3-23
Section 44. The Meter Facilities Menu And Graphic Display Screens ...............................4-14.1 Preferred Units ............................................................................................... 4-14.2 The Table Setups Menu .................................................................................. 4-24.2.1 Pipe Table ....................................................................................................... 4-2
Pipe Table Menu Structure ........................................................................ 4-24.2.2 Create/Edit Pipe .............................................................................................. 4-34.2.3 Delete Pipe ..................................................................................................... 4-4

1010DVNFM-3C Table Of Contents
vii
4.3 Transducer Type Menu ................................................................................... 4-4Transducer Type Menu Structure ............................................................... 4-5
4.4 The Datalogger Control Menu ........................................................................ 4-6Datalogger Control Menu Structure ........................................................... 4-6
4.4.1 Display Datalogger ......................................................................................... 4-64.4.2 Output Datalogger .......................................................................................... 4-74.4.3 Circular Memory ............................................................................................. 4-74.4.4 Est Log Time Left ............................................................................................ 4-84.4.5 Clear Datalogger ............................................................................................. 4-84.5 The Memory Control Menu............................................................................. 4-8
Memory Control Menu Structure ............................................................... 4-84.5.1 The Analog Output Trim Menu ....................................................................... 4-9
Analog Output Trim Menu Structure........................................................... 4-94.5.2 Current Output Trim (Io1 & Io2) ...................................................................... 4-94.5.3 Voltage Output Trim (Vo1 & Vo2) ................................................................... 4-94.5.4 Pgen Output Trim (Pgen 1 & Pgen 2) .............................................................. 4-104.6 The RTD Calibrate Menu (optional) ................................................................. 4-10
RTD Calibrate Menu Structure ................................................................... 4-114.6.1 The RTD Calibrate by Data Entry ..................................................................... 4-114.6.2 Ice Bath RTD Calibration ................................................................................. 4-114.7 The Clock Menu .............................................................................................. 4-12
Clock Set Menu Structure.......................................................................... 4-124.7.1 Date ............................................................................................................... 4-124.7.2 Time ............................................................................................................... 4-124.8 RS-232 Setup ................................................................................................... 4-134.8.1 Baud Rate........................................................................................................ 4-134.8.2 Parity ............................................................................................................... 4-144.8.3 Data Bits .......................................................................................................... 4-144.8.4 Line Feed ........................................................................................................ 4-144.8.5 Network ID ...................................................................................................... 4-154.8.6 RTS Key Time .................................................................................................. 4-154.9 Backlight ......................................................................................................... 4-154.10 System Info .................................................................................................... 4-16
System Info Menu Structure ...................................................................... 4-164.11 The FUH1010DVN Graphic Display Screens ................................................... 4-16
Section 55. FUH 1010DVN Application Notes ................................................................... 5-15.1 To Obtain Technical Assistance ...................................................................... 5-15.2 Considerations For Critical Applications ......................................................... 5-15.3 Pipe Considerations For Clamp-On Transducers............................................ 5-25.3.1 Pipe Dimensions ............................................................................................ 5-25.3.2 Picking The Appropriate Transducer .............................................................. 5-25.3.3 Flow Velocity Range ....................................................................................... 5-25.3.4 Overview Of System Performance................................................................. 5-25.3.5 Accuracy ......................................................................................................... 5-35.3.6 Repeatability ................................................................................................... 5-35.3.7 Data Stability ................................................................................................... 5-3
Data Scatter ............................................................................................ 5-3Data Drift ................................................................................................ 5-3

1010DVNFM-3C Table Of Contents
5.4 Flow Conditions .............................................................................................. 5-35.4.1 Low Flow Rates ............................................................................................... 5-45.4.2 Flow Data Scatter and Damping ..................................................................... 5-4
FUH1010DVN Damping and Slewing Controls .......................................... 5-4Time Average .......................................................................................... 5-4SmartSlew............................................................................................... 5-4
5.4.3 Notes On Liquid Conditions ............................................................................ 5-45.4.4 Erroneous Liquid Parameter Specification ..................................................... 5-55.4.5 Liquid Compatibility ....................................................................................... 5-55.4.6 Aeration .......................................................................................................... 5-55.4.7 Slurries ............................................................................................................ 5-55.4.8 Two-Phase Liquids .......................................................................................... 5-55.4.9 Viscous Liquids ............................................................................................... 5-65.4.10 Temperature and Pressure Ratings ................................................................ 5-65.5 Overview Of System FUH1010DVN Memory Resources ................................ 5-65.6 Reference Tables ............................................................................................ 5-7
Sonic Velocity (m/s) For Common Liquids @ 68º F.................................... 5-7Sonic Velocity For Pure Water @ Various Temp. (m/s) ................................ 5-7Vps Values (in/secs) For Some Common Metals ....................................... 5-8FUH1010DVN Reynolds Compensation Factor .......................................... 5-9DV Liquid Tables ...................................................................................... 5-9Recommended Sonic Coupling Compounds ..............................................5-10Terminology Chart .................................................................................... 5-11
5.7 The Nema Dual-Channel Menu Chart ............................................................. 5-13The Meter Type Menu ...............................................................................5-13The Meter Facilities Menu .........................................................................5-13The Clamp-On Menu ................................................................................ 5-14
APPENDICES
Appendix A Couplant Installation Instructions
Appendix B Site Setup Considerations for Sitrans F 1010/FUS1020 Blind Systems
Appendix C Engineering Drawings
INDEX
Pipe Table
viii

1-1
1010DVNFM-3CSection 1
1. GETTING STARTED
1.1 INTRODUCTION
Congratulations on your purchase of the Siemens FUH1010DVN Permanent Flowmeter. Intended fordedicated applications, this versatile transit-time flowmeter is easy to set up and operate. The FUH1010DVN flowmeter represents the state-of-the-art in computerized instrumentation. We are confidentthat in a very short time, you will appreciate its unrivaled performance and features; especially theground breaking enhanced transit-time Digitally Coded MultiPulse technology and the on-line automaticand interactive site setup help facility. This manual covers System 1010 Single Channel, Dual Channel/Dual Path and 4-Channel/4-Path flowmeter types in NEMA-4 or NEMA-7 enclosures.
This section shows how to install the FUH1010DVN Permanent flowmeter with a minimum of effort. Itwill show how to use the Installation Menu to set up the system for transit-time and Clamp-on operation.It also shows the basic connections to and from the flowmeter. For additional information on connec-tions, see the drawings at the end of manual.
1.2 IMPORTANT SAFETY CONSIDERATIONS
The FUH1010DVN Permanent flowmeter operates from either an external AC or DC power source.Please observe all the electrical safety codes, etc., that apply to your application. We recommend thatonly experienced personnel with knowledge of local electrical codes and safety operating proceduresperform the installation and wiring. It is solely the user’s responsibility to operate this equipment safely.Controlotron cannot accept responsibility for any damage that may occur due to failure to observe anylocal safety rules.
If this equipment is used for a hazardous application (high line pressure, hostile liquid characteristics,perilous atmosphere, etc.), the end-user must ensure that only properly trained personnel are involvedin its installation and operation.
Please do not let the size of the Installation Menu intimidate you. Almost all menu cells already containdefault parameters. To begin operation, you only need to access the menu cells that control a requiredparameter, such as the pipe outer diameter. You will see that by accepting most defaults, you can set upthe meter in about five minutes.
1.3 FLOWMETER INSTALLATION STEPS
Typical steps to complete the installation procedure.
• Collect the site data (pipe and liquid data, part numbers, etc.)• Choose a mounting location for the flow computer and transducers.• Mount the flow computer at the selected location.• Prepare pipe for transducer mounting.• Access the Installation Menu and create a site (see paragraph 1.7.3).• Enter pipe parameters (see paragraph 2.2).• Invoke transducer install procedure (see paragraph 2.4).• Mount transducers on pipe and connect to flow computer (see Section 3).• Complete transducer install menu operation (see paragraph 2.4).

1-2
1010DVNFM-3CSection 1
TY
PIC
AL
FU
H 1
01
0D
VN
PER
MA
NEN
T C
LAM
P-O
N S
YST
EM F
low
Mea
sure
men
t Su
b-
Syst
em
1.4 THE KEYPAD ENABLE SWITCH
All FUH1010DVN models provide a keypad enable/disable switch to prevent unauthorized access to theInstallation Menu. In addition, a password entry option is available (see Channel Setup). The keypadenable/disable switch is located inside the lockable enclosure just above the I/O wiring terminal. Pleaseswitch to the enable position before proceeding further. If necessary, see Drawings 1010N-7 and 1010DN-7 for location details.
CH
AN
NE
L 1
TR
AN
SD
UC
ER
S A
ND
FR
AM
ES
CH
AN
NE
L 2
TR
AN
SD
UC
ER
S A
ND
FR
AM
ES
PO
WE
R I
N
DA
TA/C
ON
TR
OL
CA
BLE
S

1-3
1010DVNFM-3CSection 1
1.5 THE FUH1010DVN KEYPAD
The FUH1010DVN integral keypad provides 32 numeric and function keys (see table below). Use thesekeys to enter, review or edit the site data. Certain keys control the graphics display, Datalogger andTotalizer. “Blind Models,” having no keypad or display, must be set up by using their serial data port (seeAppendix B).
NOTE: The keypad does not have alphabetic keys. Scrolling lists provide alpha-numeric charac-ters as needed.
1.6 INTRODUCTION TO THE FUH1010DVN MENU SCREENS
The figure below shows a typical FUH1010DVN menu screen (in this case, the Pipe Data Menu).
TYPICAL INSTALLATION MENU SCREEN
Siemens 2 Channel [1]
Select Pipe Class from Pipe Table
Select Pipe Size 1” type K
Pipe OD <in> 0.500
Pipe Material Steel
Wall Thickness 0.100
Liner Material None
Liner Thickness 0.000
Select Pipe Class CopperTube Table
Pipe Data
Current SelectedMeasurement Channel
Current SelectedMeter Type
Menu Prompt Line(Reverse Video)
Current SelectedMeter Type
Menu Cell(left-hand column)
CurrentSelected Menu
Highlighted Data
Menu Cell Data(right-hand column)
KEYPAD FUNCTION CHART
MENU Press to activate the Installation Menu.ENT Press <ENT> to store numeric data, select from option lists, etc.LEFT, RIGHT ARROWS Menu navigation keys move cursor in respective directions.UP, DOWN ARROWS Same as <Left> and <Right>. Also scrolls option list and graphic display
screen.CLR Clear Key for erasing data, or selecting list options.NUMBERS 0-9 Use to type numeric data.DECIMAL POINT Use for decimal points in numeric data.MATH OPERATORS Allows 4-function math operations in numeric entry cells.“F” KEYS 1-3 Totalizer control and special function keys.“F4” KEY CAUTION: SYSTEM RESET KEY (during power up)CTL & ALT Used as shift keys for alternate key functions.DATALOG Triggers immediate Datalogger report.PLUS/MINUS [+/-] Changes the sign of numeric data.
KEY USAGE

1-4
1010DVNFM-3CSection 1
1.7 HOW TO USE THE INSTALLATION MENU
This section introduces the FUH1010DVN Installation Menu. It explains how to access and leave theInstallation Menu and how to enter site data. The Installation Menu consists of sub-menus, each providingindividual menu locations (menu cells) that store site data. For convenience, this manual refers to sub-menus simply as menus (e.g., the Pipe Data Menu). Shown below is the Clamp-on, Full Site Setup screenfor Channel 1 of a dual-channel meter. Single and four channel systems are identical.
Siemens 2 Channel [1]
Create-Name-Recall-Enable & Delete Site
Pipe Data
Application Data
Pick/Install Xdcr
Operation Adjust
Flow/Total Units
Data Span/Set/Cal
Stripchart Setup
Datalogger Setup
I/O Data Control
Diagnostic Data
Channel Setup
Clamp-on
EXPLANATION OF THE CALL-OUTSMenu Prompt Line When you select a menu cell, a highlighted text prompt appears on the top of the screen to
explain the function of the cell.Current Selected [2 Channel] indicates Dual Channel meter operating mode selected.Meter TypeSelected Channel The [1] indicates that measurement Channel 1 is currently selected.Highlighted Menu Cell The menu cursor (highlight bar) shows where you are currently working byreversing the
display colors for that cell (white type on black).Highlighted Data The right-hand column shows the current value highlighted. Pressing the<Right Arrow>
provides access to an option list or numeric field where you can change the current valueas required.
Menu Cell A menu cell is an individual location within a menu (e.g., Pipe Data) that stores a param-eter (either a numeric entry or an option list selection.
Menu Cell Data The right-hand column shows the current value stored by left-hand column menu cell. ThePipe Data menu includes option list items and numeric entries.
Current Selected Menu The highlighted bar at the bottom of the screen shows the name of the menu that you areaccessing (e.g., Pipe Data).

1-5
1010DVNFM-3CSection 1
1.7.1 ACCESSING AND LEAVING THE MENU
Upon first turning the flowmeter on you see a Siemens start-up graphic. This means that there is noactive site setup currently stored in memory. Note that this screen identifies the software version of theflowmeter on the upper right-hand corner of the display.
Make sure the keypad enable switch is in the correct position then press the <MENU> key to select themenu. The first time you access the Installation Menu, you can leave it only by saving a site or by turningthe meter off. After installing and activating a site, use the <MENU> key to toggle between a graphicdisplay screen and the last accessed menu location.
When you press the <MENU> key, the cursor arrives at the first level of the installation menu. Refer to thesample screens above. The left screen is from a dual-channel model. The right screen is from a singlechannel model. Note that two columns, one on the left-hand side and the other on right-hand side, dividethe screen. The first left-hand item, [Meter Type], is highlighted (white type on black). [Meter Type] allowsyou to choose a meter configuration from the highlighted right-hand column list. With single channelmodels, the only option is [Single Channel]. The next left-hand selection is [Meter Facilities]. Use the[Meter Facilities] menu to set global meter options and controls.
1.7.2 HOW TO ENTER DATA
The left-hand column shows the menu cells (described previously). Another way to think about left-handcolumn items is to consider them menu questions. Then you can see that the right-hand column an-swers these questions. Right-hand column answers can be:
� Another series of menu cells (may become left column items when selected).� An item from a scrollable option list (e.g., a class of liquids).� A numeric entry (e.g., a pipe outer diameter).� An alphanumeric string (e.g., a site name).
Siemens Site [1]Siemens 2 Channel [1] Channel 1
Select Meter Type
Meter Facilities Dual Path Flow
Using the Menu Ch 1 + 2 Flow
Ch 1 - 2 Flow
Meter Type >Dual Channel Flow
Select Meter Type
Meter Facilities
Meter Type Single Channel
Liquid Class
ver. 3.00.00
SoftwareVersionx.xx.xx
Top menu screen for dual-channel system Top menu screen for single-channel system

1-6
1010DVNFM-3CSection 1
Selecting Items from an Option List
Examine the screen below. It shows how to use an option list to select a liquid for your application. Howto access this menu will be explained later. Note that the menu name [Application Data] appears high-lighted on lower left of the screen. Note also that the menu cell [Liquid Class] is highlighted - the right-hand column shows the answer [Water 20C/68F].
Pressing the <Right Arrow> changes the left-hand column to [Select Liquid]. Pressing the <Right Arrow>again accesses the option list. This expands the highlighted area to show the list contents. Note that acursor (arrow) points to the top item on the list.
The <Up and Down Arrows> scroll the option lists. Every press moves the cursor to the next item insequence. Due to the size of display screen, some option lists include more items than the display canshow. For example, on the screen above the last option shown is [Acetic Acid]. However, this option listhas more listings. Continue to press the <Down Arrow> to see more liquid selections. When you arrive atthe last item on a list, the next <Down Arrow> press brings you back to the top of the list. This is becausethe option lists are of the “wrap-around” type.
To select an option list item, move the cursor to the item and then press the <ENT> key. This places yourselection at the top of the list and moves you out of the option list to the next menu cell. Examine thescreen on next page. The option list item: [Diesel Fuel] has been selected. Note that this appears on theright-hand column and that the highlighted area moves to the next menu cell in sequence: [Estimated Vsm/s].
Liquid Class
Siemens 2 Channel [1] Channel 1
Access Liquid Option List
Estimated Vs m/s Water 50C/122F
Viscosity cS Water 75C/167F
Density S.G. ens Water 100C/212F
Water 125C/257F
Water 150C/302F
Water 175C/347F
Water 200C/392F
Water 225C/437F
Water 250C/482F
Acetic Acid
Select Liquid >Water 20C/68F
Siemens 2 Channel [1] Channel 1
Select Liquid Class from Liquid Table
Liquid Table
Temperature Range -40F to 250F
Pipe Configuration Fully Developed
Anomaly Diams 10
Liquid Class Water 20C/68F
Application Data

1-7
1010DVNFM-3CSection 1
Multiple Select Option Lists
Certain option lists allow you to make more than one selection. For instance, the [Datalogger Data]option list in the Datalogger Setup menu allows you to select any or all of the available data items for yourreports. You can use the <Up and Down Arrows> to move the cursor through the list. If you press <ENT>to select an item, a plus sign (+) appears next to that item. The cursor remains so that you can makeother selections. To deselect a previously selected item, move cursor next to that item and press <CLR>.Use <Left Arrow> to leave a multiple select option list.
Entering Numeric Data
When a menu cell requires a numeric answer, press the <Right Arrow> to access a number entry field;an equal sign (=) appears before current entry. You can now use the number keys and the decimal pointkey to type a new value. If applicable, you can use <+/-> keys to change the mathematical sign of thenumber. Press <ENT> to store the numeric data.
NOTE: All Numeric Data cells provide a four-function calculator via the keypad’s arithmetic func-tion keys.
Siemens 2 Channel [1] Channel 1
Datalogger Mode +Site Id
Datalogger Data +Date
Log Time Interval +Time
Datalogger Events Flow
Display Datalogger +Average Flow
Raw Flow
Total
Select Datalogger Data
Datalogger Setup
Siemens 2 Channel [1] Channel 1
Select Pipe Class Manual Entry
Select Pipe Size N/A
Pipe OD (in) =0.500
Pipe Material Steel
Wall Thickness 0.100
Liner Material None
Liner Thickness 0.000
ThermExp Coef 0.000
Mod of Elast PSI 0.000
Enter pipe Outer Diameter manually
Pipe Data
Siemens 2 Channel [1] Channel 1
Select Liquid Diesel Fuel
Estimated Vs m/s 1600
Viscosity cS 2.00
Density S.G. 1.030
Access Liquid Option List
Liquid Class

1-8
1010DVNFM-3CSection 1
Entering Alphanumeric Strings
An alphanumeric string is a series of numbers and letters; and also the Quotation Mark and the PoundSign symbol. You can also use a space. The meter uses these to identify a specific site setup or user-modified table. The 1010DVN keypad does not provide letter keys. However, when you access a menucell that requires an alphanumeric string answer, the menu cell right-hand column provides an eight-character entry field. Press the <Right Arrow> to access the field. This selects the first character position.Note that the prompt changes to a question mark (?). With the cursor at the first character position, usethe <Up or Down Arrow> to scroll through a single-character list. For example, as shown below, an <UpArrow> at the first character position produces the letter: upper-case [A]. Pressing the <Right Arrow>moves the cursor to the second position.
Use the <Right and Left Arrows> to move through the character positions. If you wish to use numbers inyour string, you can type them directly from the keypad. After you finish selecting your string, press<ENT> to register it.
1.7.3 THE METER TYPE MENU
This is the first list presented upon entering the Installation Menu. Select the type of meter required foryour application. The meter automatically conditions Installation Menu choices to suit the selected metertype. The following paragraphs introduce the available meter types for dual channel systems.
NOTE: On Single Channel systems, you do not get a choice of meter types, since this requirestwo independent measurement channels. However, you can operate the single channelwith any optionally supplied measurement technology. Some four channel models pro-vide four-path and channel summing operation.
Siemens 2 Channel [1] Channel 1
Recall Site Setup No Sites
Channel Enable No
Create/Name Site ?A�����Site Security Off
Delete Site Setup No Sites
Save/Rename Site
Right Arrow & Enter Creates a new Site
Channel Setup

1-9
1010DVNFM-3CSection 1
Dual Path
Dual Path uses two measurement channels to achieve a single output via a “virtual” third channel. Theresultant data is the average of the two channels. Only clamp-on or in-line transit-time operation al-lowed. Benefits include highest available precision and enhanced immunity to distorted flow profile con-ditions.
Channel 1+2 and Channel 1-2
Arithmetic operation produces data output via a virtual Channel 3, proportional to sum or difference ofthe liquid and energy flow of two independent pipes. This requires setting the two channels to operateindependently. Only clamp-on or in-line transit-time operation is supported.
Channel 1-2 produces a data output via a virtual Channel 3, proportional to the difference of the liquidand energy flow of two independent pipes. You have to set-up the two channels independently. Onlyclamp-on or in-line transit-time operation is supported.
Dual Channel
Dual Channel provides two independent measurement channels that operate simultaneously. Depend-ing on the specific model, Dual Channel supports: Clamp-on Transit-time, In-line transit-time.
�����������
�������� ���
��������
��������
�����������������
�����������������
�������� ���
���������������� �����!���� "
����
���������� � �� ����� ����������
��������
��������
��������
��������
���������#�$���%�
���������#�$���%�
�������������

1-10
1010DVNFM-3CSection 1
1.7.4 ESSENTIAL INFORMATION FOR USERS OF MULTI-CHANNEL 1010’s
Multi-Channel Meter Type
If your 1010 is a multi-channel model, and offers 2 independent measurement channels. The meter’sresources are divided among these channels equally. This means that analog Input/Output, relays anddigital command lines will be fewer than for single channel machines. We’ll show you later how to “getaround” this limitation for times when you need all your multi-path meter’s resources for a single mea-surement channel.
If one, two or three channels are running when you are trying to setup the last channel, it could take avery long time for the setup; some 10 to 15 minutes should be expected. A great time saver would be toturn each channel off after setup (setup one channel at a time) and reactivate all after everything issetup; then the setup time goes very quickly.
Your datalogger and site storage memory, being bulky resources, are not divided up at all, and re-main available for each channel’s use. You will be able to save and recall sites to and from the variouschannels as long as they share an identical measurement technology (e.g., clamp-on). Be aware, how-ever, that moving a site from one channel to another like this, will likely require a new initial installation toachieve its best potential. This is especially true if the new target installation is not on the same pipe oruses another pair of transducers whose nominal characteristics are identical. Note that datalogger re-ports will be interleaved in memory and their frequency is controlled by the interval that was selected foreach channel. Providing each site with a unique name will enable you to sort these out when analyzingthe data later.
Arithmetic Operation
The dual channel instruments provide a modality of operation which permits the user to arithmeticallycombine (through addition or subtraction) the results of the two independent measurement channels.Installation of each channel is done via the dual channel menu. Site Saving and Recalling automaticallyrecall the contributing sites. While the displays for each physical channel provide you all the data (flowrate, totals, etc.) that are provided via independent channel operation, user Input/Output is largely ori-ented toward the virtual channel - Channel 3.
Multi-Path Operation
In many cases, the performance of an ultrasonic transit time meter can be improved by allowing it tointerrogate the flow field with more than one beam. Imperfect flow profile conditions such as non-axial,cross-flow or an off-center higher-rate flow core, which can cause a single path machine to mis-reportthe flow rate, are often remedied in this way. The multi-path installation is similar to arithmetic opera-tion; except for the fact that the virtual, or output channel has pipe dimension attributes (which in thearithmetic meter channel it does not). This means that when you install a multi-path meter, pipe datamust be installed in Path 1 and Path 2. Your 1010 meter facilitates this by copying pipe data that youinstalled as Path 1 and Path 2 data to the other paths. It is seldom, if ever, necessary to “trim” the pipedata for the individual path channels - although you may install different size or type transducers for eachpath. Once you define the pipe, move the menu to the individual paths using Select Path for the physicalinstallation of each channel. This is accomplished in the same way that individual channels are installed.
Save and Restore Operations for multi-path sites execute on all the component channels simulta-neously; the individual paths of multi-path sites do not have any existence or autonomy as single channelsites. You will also find that individual path channels possess a reduced set of user-accessible menufunctions. For example, although you may zero each individual path, the meter provides Kc control

1-11
1010DVNFM-3CSection 1
Siemens 2 Channel [1] Channel 1
Select Meter Type
Pipe Data
Meter Type >Dual Channel Flow
Meter Facilities Dual Path Flow
Ch 1 + 2 Flow
Ch 1 - 2 Flow
(slope correction) for the virtual channel (system channel) only. You will find that the features and func-tions provided for each physical channel to focus mainly on the physical measurement task. User outputdata, however, is mostly reserved for the virtual or system channel. This includes the totalizer functions.Analog data is largely reserved for the virtual or system channel as well as the totalizer functions, analogoutputs and datalogger. In some instances, access is also provided to the path channel’s data in order tofacilitate the gathering of diagnostic information; thus minimizing menu clutter, but preserving as muchfunctionality as practicable. Totalizer control via lead-in function key is provided by F3 (dual-path meter)and, since there is no F5, F1 (four-path version). The Diagnostic Menu area has been similarly setup toprovide data (Path 1, Path 2 and Path 1 and 2) generated by the physical measurement channels whenselected, but, to suppress elements only provided by the virtual channel. As mentioned above, use apartially installed multipath site in order to direct all meter input/output to a single measurement path.Simply install the single available physical path and you’ll produce data based on only this physical inputand obtain the same functionality as provided to the single channel user.
Selecting A Meter Type
The following example explains how to select a dual-channel clamp-on meter and initiate site program-ming for the measurement channel. Your [Meter Type] selection, as well as other menu selections, are“remembered” through power cycles.
NOTE: If you have a single-channel system, all you have to do is select a measurement technol-ogy and then go directly to Channel Setup. The site setup procedure for a single-channelsystem is identical to setting up a measurement channel on a dual-channel system.
As shown in the steps below, selecting this mode only requires <Right Arrow> presses. This is be-cause dual-channel clamp-on is the default configuration for this instrument. To select a differentconfiguration, move the cursor to the desired Meter Type and then press <ENT> to select it.
Make sure that the keypad enable switch is in the [Enable-Up] position. Turn on power and press<MENU> to access the [Meter Type] screen. Refer to the figure below.
Note that on the left-hand column, [Meter Type] is highlighted as is all the available meter types onthe right-hand column. Press the <Right Arrow>. This places a cursor next to [Dual-Channel Flow].

1-12
1010DVNFM-3CSection 1
To select [Clamp-On] press the <Right Arrow>. This selects the Clamp-on installation menu for Mea-surement Channel 1. Note that the first menu, [Channel Setup], is highlighted.
Creating a New Site Setup (See paragraph 2.1.1)
The Channel Setup section of this manual provides detailed instructions on how to use all the ChannelSetup menu commands. This section provides an example of how to use the [Create/Rename Site]command to create a new site setup. Always begin a new installation by issuing the [Create/NameSite] command. Although you do not need to enter a site name to create a new site setup, you have toprovide one to save the site setup or to identify the source of logged data. In this example, we will use[SITE1] for the site name.
To access the [Channel Setup] menu, press the <Right Arrow> then move the highlight down to[Create/Name Site].
Press the <Right Arrow>. Note that the cursor changes to a block, which appears after a questionmark (?). This indicates that you have accessed the first character position of an eight-character(max.) alphanumeric entry field.
Press the <Right Arrow> twice. This selects [Dual-Channel Flow] and then places the cursor next to[Clamp-on] for Channel 1. Note that some models do not support all flow sensor types.
Channel 1 >Clamp-on
Channel 2 Clamp-on
Siemens 2 Channel [1] Channel 1
Choose Channel 1 Flowmeter Type
Dual Channel Flow
Siemens 2 Channel [1] Channel 1
Recall Site Setup No Sites
Channel Enable No
Create/Name Site
Site Security Off
Delete Site Setup No Sites
Save/Rename Site
Right Arrow & Enter Creates a new Site
Channel Setup

1-13
1010DVNFM-3CSection 1
Press and hold the <Up Arrow>. Note that the character position begins to scroll upward through thealphabet of capital letters. Continue to scroll until block cursor shows [S]. Press the <Right Arrow>.
NOTE: The character [S] remains at the first character position and the block cursor moves to thesecond character position.
Press and hold the <Down Arrow>. Note that the capitalized alphabet list begins to scroll downwardthrough the alphabet from [S]. Stop scrolling at letter [I]. Press the <Right Arrow> to move the blockcursor to the third character position.
Scroll back up to letter [T]. Move the cursor to the fourth character position. Scroll down to letter [E].Move the cursor to the fifth character position. Type [1] on the numeric keypad to complete the sitename.
Press <ENT> to create the site setup named [SITE1]. Note that the name now appears in the [Save/Rename Site] menu cell and on the upper right corner of the graphic screen.
Siemens 2 Channel [1] Channel 1
Recall Site Setup No Sites
Channel Enable No
Create/Name Site ?�����Site Security Off
Delete Site Setup No Sites
Save/Rename Site
Right Arrow & Enter Creates a new Site
Channel Setup
This block cursor iscurrently placed atthe first characterposition.
Siemens 2 Channel [1] Channel 1
Recall Site Setup No Sites
Channel Enable No
Create/Name Site ?S�����Site Security Off
Delete Site Setup No Sites
Save/Rename Site
Right Arrow & Enter Creates a new Site
Channel Setup
Siemens 2 Channel [1] Channel 1
Recall Site Setup No Sites
Channel Enable No
Create/Name Site SITE1�����Site Security Off
Delete Site Setup No Sites
Save/Rename Site
Right Arrow & Enter Creates a new Site
Channel Setup

1-14
1010DVNFM-3CSection 1
Flowmeter Installation Flowchart
Flowmeter Installation
Collect SiteData
Choose MountingLocation For
Flowmeter andTransducers
Prepare PipeSurface
AccessInstallation
Menu
Create a Site
Enter PipeParameters
InvokeTransducer
InstallProcedure
Mount Transducerson Pipe and
connect Flowmeter
CompleteTransducer
Installation MenuOperations
Siemens 2 Channel [1] SITE1
Recall Site Setup No Sites
Channel Enable No
Create/Name Site SITE1
Site Security Off
Delete Site Setup No Sites
Save/Rename Site SITE1
Use with Care -- Turn Security On or Off
Channel Setup
After creating a SiteSetup, the assignedname appears inthese places.

1-15
1010DVNFM-3CSection 1
1.8 USING FASTSTART SETUP
The dual-channel clamp-on mode offers a choice of using FastStart Setup or Full Site Setup to createyour site setup. As its name implies, FastStart Setup is a quick way to start up the meter. FastStart insertsdefault settings into all applicable menu cells. However, these can be edited later via the Full Site Setupmenu. In order to use FastStart Setup:
� Your pipe must be included on the meter’s pre-set pipe table.
� Your liquid is water, or has similar sonic characteristics.
FastStart setup is actually a shortcut to these two menu locations (where data entry is mandatory for asuccessful start-up):
� Pipe Data: The Pipe Data Menu is limited to the selection of pipe pre-sets only. There are noprovisions for manual pipe editing.
� Pick Install Xdcr: This is the same menu as Full Menu Setup (see paragraph 1.7).
Press to access the Pipe Class option list. Note that although [Manual Entry] exists on this list,it is inactive for FastStart Setup (see paragraph 2.2.1).
1.8.1 CHOOSING THE PIPE CLASS/SIZE
Press to access [FastStart Setup]. This selects [Choose Pipe Class]. There are over sixty English andmetric pipe sizes for eight different classes of pipes. Picking a pipe class and size automatically sets allthe required pipe parameters using industry standard dimensional data.
In this example, we will pick the pipe class: [ASA Carbon Steel] by moving the cursor to the selectionand then pressing .ENT
Siemens
Siemens

1-16
1010DVNFM-3CSection 1
Next, we will pick the pipe size: [1CS80] by moving the cursor to the selection and then pressing . This is all there is to setting up the pipe parameters.
Now, we will select and install the transducers.
ENT
1.8.2 PICKING AND INSTALLING THE TRANSDUCERS
Press to access the Pick/Install Xdcr menu, then select the appropriate Transducer Model. Theflowmeter then analyzes your pipe data and registered transducer list before calculating the recom-mended transducer size(s). The top-line prompt shows a series of transducer recommendations, thatare listed in order of priority from left to right. Select the appropriate transducer size with considerationgiven to the computed transducer recommendations. In the example below we will install the “B3” trans-ducer size.
After you make your transducer selection, the meter automatically computes the preferred mountingmode and transducer spacing index.
Note the Number Index value.
This value corresponds to the index marked on the spacer bar or mounting track. The value of Ltn rep-resents the actual distance in inches or mm, between the front surfaces of the upstream and down-stream transducers.
NOTE: The meter only indicates the part number of the 1011 Universal Transducer mountingtrack or spacer bar. It does not indicate this information for other transducer types.
Siemens
Siemens

1-17
1010DVNFM-3CSection 1
NOTE: You are allowed to override the transducer type and size mounting mode and spacingoffset. See paragraph 1.7.
Now you have to mount the transducers in accordance with the data recommended on the screen. Referto the Section 3 for detailed instructions. The pipe must be completely filled with a liquid for the initialinstallation of the meter. Make sure that you do not install your transducers backwards or reverse theUpstream and Downstream cables.
Use the [Install Completed?] menu cell to inform the meter that you have finished mounting thehardware. Press . Move the cursor to [Install]. Press .
The meter performs an Initial Makeup which conditions its operation to the selected transducer, pipe andliquid and then sets the empty pipe and the zero flow levels automatically. Be patient! The Initial Makeupperforms a number of operations including a frequency sweep of the pipe wall resonance, which couldtake several minutes.
ENT
Siemens
Siemens
Siemens

1-18
1010DVNFM-3CSection 1
The meter is now ready to report flow. Press . The flowmeter will then ask you to save the Site.Saving the Site is optional and will therefore be covered in paragraph 1.7.
To abort this item, press . This brings up a Flow Display Screen.
Once your site has successfully installed, you can press to scroll between the avail-abledisplay screens.
The meter is now operational and the display will show flow by pressing the <MENU> key.
Now that you are familiar with the FUH 1010DVN setup, take the time to read the information about theInstallation Menu in Section 2. Becoming acquainted with the various flowmeter setups in the Main Menuwill help further your understanding of the FUH 1010DVN.
Upon completion, the meter reports the measured liquid sonic velocity. Press . The flowmeter willthen automatically perform an AutoZero operation, where the meter measures any zero flow offset,which is used to correct the flow reading. This operation occurs only when the transducers are mountedin the reflect configuration and is independent of whether or not the liquid is flowing.
After the AutoZero operation is complete, the meter may ask you to register the transducer used in thisinstallation. It is advisable that you register your transducers, since the registration list is used to condi-tion the transducer recommendation.
Press and select [YES], or [NO], if you do not want to register this transducer.
Then press .ENT
0.20Siemens 2 Channel [1] Channel 1
FLOW GAL/MIN
TOTAL KGAL Vs
89.68
G/M
0.000.12Vfo
1474
MENU
Siemens

2-1
1010DVNFM-3CSection 2
2. THE FUH1010DVN INSTALLATION MENUProgramming the FUH1010DVN requires no special experience or training. This field manual contains allthe necessary information. If you intend to connect this instrument to an external device, then pleasehave the instruction manual for the device available for reference. The following paragraphs present ageneric menu reference that applies to all configurations of 1010 NEMA flowmeters.
This section contains a general description of how to enter site setup data via the FUH 1010DVN Instal-lation Menu. It assumes that you have already selected a meter type as described in the Getting Startedsection. For convenience, it presents the Installation Menu in the same sequence as it appears on themenu screen. Please note, however, that it is not necessary to program the meter sequentially.
The conventions used with these instructions are:
�� When the text refers to a keypad key, it will be enclosed in “less than” (<) and “greater than” (>)symbols: e.g., <MENU>, <ENT>, <Up Arrow>, etc. Where a visual of the key is shown; this meanspress this key.
��When the text refers to a menu or menu cell name, it will be enclosed with square brackets: e.g., [PipeData], [Channel Enable], etc.
��Each menu includes an image of its main screen and a diagram of its structure. The rightmost columnof the structure diagram lists the option list choices of the menu cell, if applicable.
General Installation Menu Notes:
��If a power failure occurs while you are entering or editing data, the entered data may not be retainedin Active Memory.
��Although you can operate the meter immediately after completion of the site setup, we recommendthat you preserve your settings by saving them under a site name. Site data can be saved at any timebefore invoking either the [Recall Site Setup] or the [Create/Rename Site] commands. When issued,these commands overwrite all data present in Active Memory.
��We do not recommend that you attempt to operate the flowmeter at a new site by recalling and thenediting an existing site setup. Each site must have its own set of transducer install parameters, evenif the data from the recalled site setup is identical. Always issue the [Create/Rename Site] to begin anew site setup. This will fill all the menu cells with defaults to eliminate the possibility of retainingunwanted parameters.
��The meter allows you to create your own personal site setup defaults. After creating a site setup andediting default parameters as desired, save the site using the name [FASTSTRT]. The next time youissue the Create/Name Site command, your custom parameters will become the system’s defaults.

2-2
1010DVNFM-3CSection 2
2.1 THE CHANNEL SETUP MENU
Available after picking a meter type and a measurement technology. Use this menu to manage sitesetups. You can create, recall, delete and save entire site setups. You can apply Site Security, whichpermits read-only access to the Installation Menu unless you enter a password. The Channel Enableswitch allows you to disable and enable a measurement channel. Be aware that site name option listsonly show sites that are consistent with the currently selected meter type.
2.1.1 HOW TO RECALL A SITE SETUP
The [Recall Site] command allows you to reinstall the system at a former site. For an original installation,see [Create/Name Site] for instructions on how to create a new Site Setup. This menu cell provides a listof saved site names. Scrolling to a site name and pressing <ENT> moves all the parameters associatedwith that name into Active Memory.
If there are no site setups present in site storage memory, the menu cell reports [No Sites] in the right-hand column. Saving a site setup with a site name adds the name to this option list.
Siemens 2 Channel [1] XYZ
Recall Site Setup XYZ
Channel Enable Yes
Create/Name Site 1
Site Security Off Flow
Delete Site Setup 1
Save/Rename Site 1
Scroll saved Site Setup list and Enter
Channel Setup
Use this menu cell to free up site storagememory by deleting obsolete site setups.Note that the cell retains the name of themost recently created site setup [XYZ].This option list expands as you save moresites.
Use this menu cell at any timeto manually save the site data.
Note that attempting to leavethe menu after entering/editing
any site data triggers a SaveSite pop-up window
automatically.
This cell shows thatsite setup [XYZ] isstored in memory,and can be recalled.This option listexpands as you savemore sites.
Use this menu cell toenable or disable SiteSecurity. Provide apassword to enable.Re-enter thepassword to disable.
This shows thatthe site setup[XYZ] is the activesite.
Use this menu cell to create andname a site setup. Note that the
cell retains the name of themost recently created site setup
[XYZ].
This shows thatthe Meter Type isDual Channel,operating withChannel 1 active.
Channel Setup Recall Site Setup *Site Name List
Channel Enable Yes
No
Create/Name Site *Site Name Entry/Edit
Site Security Off
On
Delete Site Setup Site Name List
Save/Rename Site *Site Name Entry/Edit
�
�
�
��
��
�
�
�
�
�
�
�
CHANNEL SETUP MENU STRUCTURE
�

2-3
1010DVNFM-3CSection 2
The first selection on the list is the currently active Site Setup. The system will be ready for operation afteryou install the transducers and make the required hardware connections. Note that the installed trans-ducers must comply with the recalled site parameters.
To recall a Saved Site Setup: (Where a visual of the keys is shown; this means press this key)
To access the list of saved site names press
To move the cursor to the Site Name press
Pressing triggers a pop-up window that asks if you intend to use the original transducerposition (recommended). This means that you have to remount the transducers exactly as theywere in the previous install.
If you cannot recreate the original transducer installation, then press to change the pop-up list from[Original] to [New].
Pressing disables the measurement channel until you repeat the Pick/Install Transducer routine.
2.1.2 HOW TO ENABLE AND DISABLE A MEASUREMENT CHANNEL
The flow computer disables a measurement channel until the completion of the required Site Setupentries and the transducer installation procedure. The meter enables the measurement channel auto-matically after it receives all required site data and completes the transducer install routine. (The SiteEnable menu cell allows you to disable or enable a measurement channel after there has been a suc-cessful transducer install).
The system does not require your presence for routine operation. If a fault condition (e.g., an emptypipe) disrupts operation, the system will recover automatically after the fault clears. Use Channel Enable[No] to turn off a channel that is currently unused but active; for example, if the transducers have beenremoved for servicing.
To disable a channel that is operating:
To access the [Channel Enable] option list press
Move the cursor to [No] by pressing
To disable the measurement channel press
To enable a channel:
To access the [Channel Enable] option list press
Move the cursor to [Yes] by pressing
To enable the measurement channel press
ENT
ENT
ENT
ENT

2-4
1010DVNFM-3CSection 2
2.1.3 HOW TO CREATE/NAME A SITE SETUP
Use this command to create a new Site Setup. This is the first action required for an original installation.Create/Name Site inserts system defaults in all the appropriate menu cells. You can edit these defaultsas necessary to suit your needs.
You do not have to provide a site name in order to create a new Site Setup. You can create a site simplyby pressing the <Right Arrow> to access the menu cell entry field and then pressing <ENT>. This createsa “nameless” Site Setup. However, if you intend to use the meter’s multi-site storage facility, you mustenter a unique site name for each site setup you want to retain in site storage memory.
To Create and Name a new Site Setup:
To access the first character position press
To select a character press then to highlight to next character position.
To select the second character press
Repeat this process to select all the characters (8 max.) you want to use to identify the new SiteSetup.
To create the new Site Setup press
NOTE: If you decide to use numbers or a decimal point in the site name, you can type thesecharacters directly from the keypad.
2.1.4 HOW TO ENABLE/DISABLE SITE SECURITY
With Site Security enabled, the meter will require a password before it allows any activity that couldinterrupt or affect system operation. You can still access the Installation Menu. However, Site Securitylimits access to the viewing of parameters only. In other words, you will still be able to review site data,but you will not be able to make any changes. The flowmeter will allow a <F4> Reset Sequence whenSecurity is active, however, it also contains a Menu Enable switch that allows you to inhibit this function(see drawing 1010N-7).
Activate Site Security with care. Once activated, the only way to deactivate it is via the Site Security [Off]command. However, the cursor will not move to the Site Security option list until you enter the correctpassword. Therefore, it is essential that you never forget or misplace the password. The only way todeactivate Site Security without knowing the password is to return the unit to Controlotron. However, theprocess the factory uses to remove Site Security will eliminate any existing Site Data as well. Remember,your meter contains a menu enable switch which also provides this function.
To activate Site Security:
To access the [Site Security] option list press
ENT
CAUTION: MAKE CERTAIN THAT YOU RETAIN A COPY OF THE PASSWORD IN A SECURELOCATION.

2-5
1010DVNFM-3CSection 2
To scroll the option list to [On] press then . [Enter Code?] appears at the top ofthe display screen.
To select the first character, use the numeric keys or press . To move the cursor to thefirst character position .
To move the cursor to the second character position press .
Repeat the selection process for the second character. Continue this process until all the requiredcharacters (8 max.) appear in the field.
To store code press . [Confirm Code ?] appears at top of the display screen. Re-type codeexactly as described above.
Pressing moves the cursor to the Site Security option list.
To scroll the option list to [Site Security: On] by pressing . Once you turn on SiteSecurity, you must enter the correct code to turn it off.
To activate Site Security press .
2.1.5 HOW TO DELETE A SITE SETUP
If you attempt to save a Site Setup when memory is full, the screen will show [Memory Full]. If you getthis message after issuing a Save/Rename Site command, you’ll have to delete an unneeded Site Setupto clear memory space. The Datalogger and Site Storage share a common memory pool, so a largeamount of logged data could also trigger the [Memory Full] message. For how to clear Dataloggermemory, see [Meter Facilities/Datalogger Control]. The Defragment Command may also secure morememory (see Meter Facilities/Memory Control Menu).
To delete a stored Site Setup:
To highlight [Delete Site] press .
To access the [Delete Site] option list press .
Move the cursor to the site name of the site setup you want to delete.
To delete the obsolete site setup press .
2.1.6 HOW TO SAVE/RENAME A SITE SETUP
The Save/Rename Site command copies data from Active Memory to the Site Storage Memory. SavedSite Setups can be recalled for future use. This menu cell allows you to save a Site Setup at any timeduring the programming process. However, you must recall and complete the Site Setup in order toachieve operation.
When you access the Save/Rename Site menu cell, the name of the most recently created Site Setup(see Create/Name Site) appears automatically. If this name is acceptable, you can press <ENT> to savethe Site Setup. You can change the listed site name by following the procedure below. You may select upto eight characters. If you decide to use numbers or a decimal point in the site name, you can type thesecharacters directly from the keypad.
ENT
ENT
ENT
ENT
ENT

2-6
1010DVNFM-3CSection 2
To Save or Rename a Site Setup:
To access the first character position press
To select a character press then to highlight to next character position.
To select the second character press . Repeat this process to select all the charac-ters (8 max.). To save the site data present in Active Memory press .
2.2 THE PIPE DATA MENU
This menu becomes available after picking a Meter Type, Measurement Channel and MeasurementTechnology. We recommend that you edit the Pipe Data immediately after creating a new Site Setup.
The Pipe Data menu allows you to define the application’s pipe parameters. Select a pipe from one of themeter’s stored pipe tables (see menu structure below); or input the pipe size and description manually.Manual entries include Pipe Material, Outer Diameter (OD) and pipe Wall Thickness. Liner Material andLiner Thickness entries are included to support pipes with liners. The meter requires the pipe outerdiameter (OD) and wall thickness to operate. You must define these parameters to complete the instal-lation.
The pipe table includes descriptions for over sixty standard pipes plus any user-entered pipes (see MeterFacilities). To use these presets, first pick a Pipe Class (e.g., ASA Stainless Steel), then pick a pipe sizewithin that class (e.g., 4SS10). When you select a particular pipe class/size, the relevant pipe param-eters appear in the Pipe Data menu cells. If a given pipe class/size does not match your applicationexactly you can still edit each individual parameter to fine-tune your selection. In addition, the MeterFacilities section of the Installation Menu provides a pipe table editor that allows you to customize any orall of the stored pipe tables.
NOTE: If you edit the pipe parameters after the system is operating, you will have to repeatthe transducer install procedure.
This 1010 operating system includes routines that will compensate the measured raw flow rate fordynamic changes in the pipe dimensions, caused by variations in line temperature and pressure sup-plied to the flow meter. To account for variations in pipe material, two data entry items (Thermal Expan-sion Coefficient and Modulus of Elasticity) are provided in the 1010 Pipe Data menu screen (see samplemenu screen on next page).
The equation used to automatically compute the change in pipe inside diameter is:
ENT
d1 = d0(1 + �(T1 � T0)) � ��
�1 d0
(P1 � P0)E w
Where:d
0 = inside diameter of pipe at STP
d1 = inside diameter of pipe after temperature and pressure change
w = pipe wall thicknessT
0 and P
0 = Standard temperature and Pressure
T1 and P
1 = Operating temperature and Pressure
α = Coefficient of Thermal Expansion of Pipe materialE = Modulus of Elasticity of pipe material

2-7
1010DVNFM-3CSection 2
The default value for each of these new parameters is 0.0. A value of zero effectively disables the pres-sure and temperature pipe volume compensation routine. When entering a value for the thermal expan-sion coefficient and modulus of elasticity, keep in mind that the numeric entry already includes an expo-nent multiplier. For the Thermal Expansion Coefficient the multiplier is 10-6 and for the Modulus of Elastic-ity the multiplier is 106.
Typical values for each parameter are shown below:
Siemens Quad Path ABC
Select Pipe Class from Pipe Table
Select Path All
Select Pipe Class Manual Entry
Select Pipe Size No Pipes
Pipe OD <in> 0.500
Pipe Material Steel
Wall Thickness 0.100
Liner Material None
Liner Thickness 0.000
ThermExp Coef 1/F 0.00
Mod of Elast PSI 0.000
Pipe Data
Use this menucell to edit thewall thickness.
Use this menucell to edit thepipe material.
Use this menucell to edit the
pipe outerdiameter.
Use this menu cell to editthe pipe liner thickness.
Use this menu cell toselect a pipe linermaterial.
After picking a pipe class,use this menu cell toselect a pipe from withinthat class.
Use this menu cell to select a PipeClass from one of the meter's presets.The [Manual Entry] selection (default)means that you enter pipe datamanually.
Use this menu cell to editthe Thermal ExpansionCoefficient of the pipewall (x10-6).
Use this menu tochange the Modulus
of Elasticity of thePipe Wall.
Pipe Material Thermal Expansion Coef Modulus of Elasticity
Mild Carbon Steel 6.20 x 10⁻⁶ F-1 30 x106 psi(11.16 x 10⁻⁶ C-1) 2.07 x 10⁶ bar
304 Stainless 9.60 x 10⁻⁶ F-1 28 x106 psi(17.28 x 10⁻⁶ C-1) 1.93 x 10⁶ bar
316 Stainless 8.83 x 10⁻⁶ F-1 28 x106 psi(15.89 x 10⁻⁶ C-1) 1.93 x 10⁶ bar
NOTE: Do not enter exponents of above values.
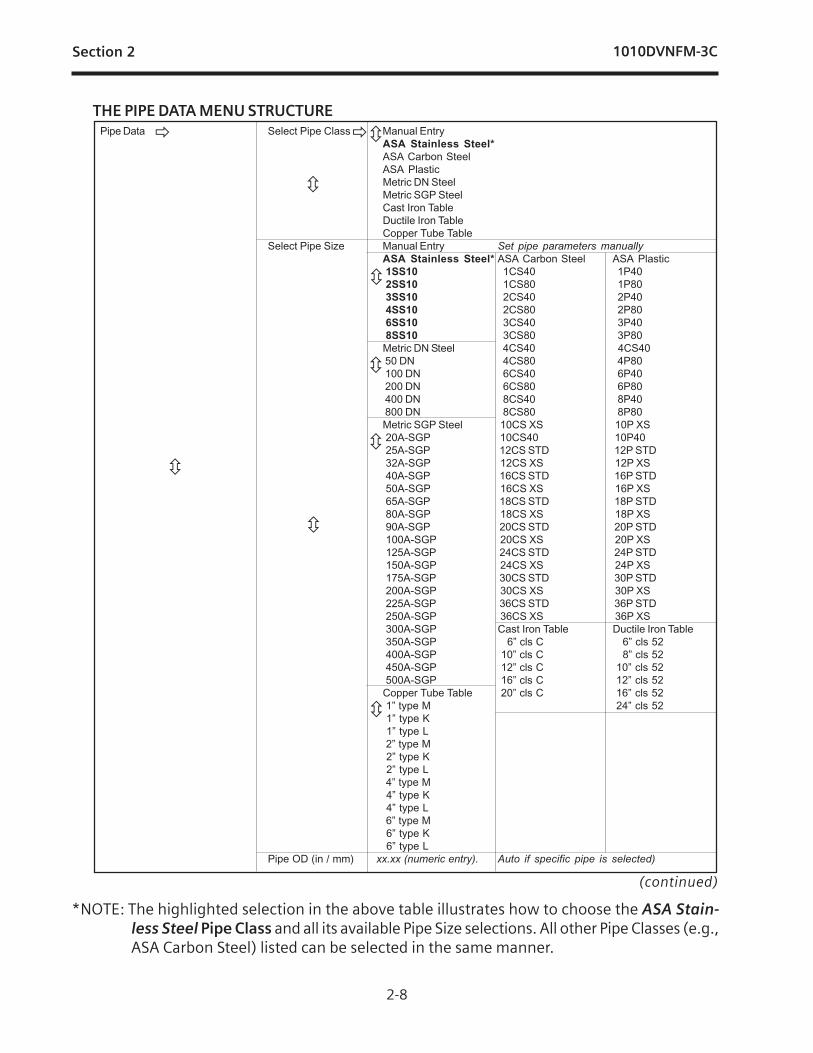
2-8
1010DVNFM-3CSection 2
*NOTE: The highlighted selection in the above table illustrates how to choose the ASA Stain-less Steel Pipe Class and all its available Pipe Size selections. All other Pipe Classes (e.g.,ASA Carbon Steel) listed can be selected in the same manner.
Pipe Data Select Pipe Class Manual EntryASA Stainless Steel*
ASA Carbon SteelASA PlasticMetric DN SteelMetric SGP SteelCast Iron TableDuctile Iron TableCopper Tube Table
Select Pipe Size Manual Entry Set pipe parameters manuallyASA Stainless Steel* ASA Carbon Steel ASA Plastic 1SS10 1CS40 1P40 2SS10 1CS80 1P80 3SS10 2CS40 2P40 4SS10 2CS80 2P80 6SS10 3CS40 3P40 8SS10 3CS80 3P80Metric DN Steel 4CS40 Steel 4CS40 50 DN 4CS80 4P80 100 DN 6CS40 6P40 200 DN 6CS80 6P80 400 DN 8CS40 8P40 800 DN 8CS80 8P80Metric SGP Steel 10CS XSteel 10P XS 20A-SGP 10CS40 10P40 25A-SGP 12CS STD 12P STD 32A-SGP 12CS XS 12P XS 40A-SGP 16CS STD 16P STD 50A-SGP 16CS XS 16P XS 65A-SGP 18CS STD 18P STD 80A-SGP 18CS XS 18P XS 90A-SGP 20CS STD 20P STD 100A-SGP 20CS XS 20P XS 125A-SGP 24CS STD 24P STD 150A-SGP 24CS XS 24P XS 175A-SGP 30CS STD 30P STD 200A-SGP 30CS XS 30P XS 225A-SGP 36CS STD 36P STD 250A-SGP 36CS XS 36P XS 300A-SGP Cast Iron Table Ductile Iron Table 350A-SGP 6” cls C 6” cls 52 400A-SGP 10” cls C 8” cls 52 450A-SGP 12” cls C 10” cls 52 500A-SGP 16” cls C 12” cls 52Copper Tube Table 20” cls C 16” cls 52 1” type M 24” cls 52 1” type K 1” type L 2” type M 2” type K 2” type L 4” type M 4” type K 4” type L 6” type M 6” type K 6” type L
Pipe OD (in / mm) xx.xx (numeric entry). Auto if specific pipe is selected)
THE PIPE DATA MENU STRUCTURE
� �
�
�
�
�
�
�
�
(continued)
�

2-9
1010DVNFM-3CSection 2
2.2.1 HOW TO SELECT A PIPE CLASS
The 1010DVN pipe tables are arranged by classes of common type and material. The default selectionis [Manual Entry]. As its name infers, you would use this selection to manually enter individual pipeparameters.
To select a Pipe Class:
To access the [Pipe Class] option list press
To scroll through the available classes press
To select the class that fits your application press
When you pick a Pipe Class, the Select Pipe Size menu cell (see below) presents the pipe size option listassociated with the selected class. By using the pipe class and pipe size option lists, you automaticallyload all the required pipe information. You can also select a pipe class/size, then edit any of the associ-ated defaults to fine-tune the pipe data.
NOTE: Create custom pipe data via the Pipe Table editor in the Meter Facilities menu.
ENT
THE PIPE DATA MENU STRUCTURE (continued)Pipe Material Steel
ABS
AluminumBlack IronBrassCast IronCuNi (70/30)CuNi (90/10)CopperDuctile IronFRPGlassHastelloyInconelKynar (PVDF)monelNickelPolyethylenePVC (Plastic)TeflonTitanium
Wall Thickness x.xxx (numeric entry)
Liner Material None
Cement
Coal TarEnamelGlassPlasticHDPETeflonRubber
Liner Thickness x.xxx (numeric entry)ThermExpCoef 0.000Mod Elast PSI 0.000
� �
Pipe Data (cont.)
�
� �
�
� �� �
�
�
��
��

2-10
1010DVNFM-3CSection 2
2.2.2 HOW TO SELECT A PIPE SIZE
Selecting a Pipe Size installs the selected pipe parameters into the balance of the Pipe Data menu cellsand prepares the 1010 for Transducer selection and Installation. This option is not applicable if the PipeClass is [Manual Entry].
After selecting a pipe class:
To access the [Pipe Size] option list press
To scroll to the required pipe press
To register selection press
2.2.3 HOW TO ENTER THE PIPE OD (in. or mm)
Use this menu cell to edit the pipe outer diameter. Be aware that you will not be able to complete thetransducer installation successfully unless this information is accurate. In addition, if you change thisparameter on a previously installed site, you will have to repeat the transducer installation. Note: Useactual pipe dimensions, not ASA code or any other standard. The English/Metric selection in theMeter Facilities menu determines whether these dimensions are in inches or millimeters.
To enter the Pipe OD:
To enable numeric entry press
Use the keypad’s numeric keys to type the exact outer diameter of the pipe in inches or millime-ters.
To register the Pipe OD press
2.2.4 HOW TO SELECT A PIPE MATERIAL
The pipe material selection affects flow calibration to a small degree. It also influences the meter-gener-ated transducer size and spacing recommendations. Select a substitute material if you do not find thematerial of your pipe in the pipe table. You can edit each pipe parameter to achieve a closer match. If youchange any pipe parameters, after running the Transducer Install procedure, you may have to re-spacethe transducers. The [Pipe Material] option list provides a selection of common pipe materials. The de-fault pipe material is [Steel]. Press the <Down Arrow> to accept the default setting for this menu cell.
To select a Pipe Material:
To access the [Pipe Material] option list press
To scroll to the required pipe material press
To register selection press
ENT
ENT
ENT

2-11
1010DVNFM-3CSection 2
2.2.5 HOW TO ENTER THE WALL THICKNESS
The wall thickness of the pipe is one of the required parameters. The flow computer needs this datato generate accurate transducer size and spacing data recommendations. Selecting a pipe class/sizeinserts a wall thickness value. If this data is inaccurate, then use this menu cell to set the pipe’s wallthickness (in English or Metric data units).
NOTE: Do not use ASA schedule code to specify the wall thickness. You must enter actualdimensions.
To enter the Pipe Wall Thickness:
To enable numeric entry press
Use the keypad’s numeric keys to type exact wall thickness (use in/mm).
To register the pipe wall thickness press
2.2.6 LINER MATERIAL
For lined pipes, select a pipe liner from the material option list. If the pipe liner material does not appearon the list then select the closest type available. If necessary, call Siemens Customer Service for addi-tional help. The system default Liner Material is [None]. If the pipe does not have a liner, press the <DownArrow> twice to bypass to the next two menu cells. The [Liner Material] option list offers a selection ofcommon liner materials.
To select a Liner Material:
To access the [Liner Material] option list press
To scroll to the required Liner material press
To register selection press
2.2.7 LINER THICKNESS
If you specified a pipe liner in the [Liner Material] menu cell, then use this menu cell to set its exact thick-ness in appropriate units (English or Metric).
To enter a Liner Thickness:
To enable numeric entry press
Use the number keys to type the exact line thickness value.
To register the data press
ENT
ENT
ENT

2-12
1010DVNFM-3CSection 2
2.2.8 ThermExp Coef
Use this menu cell to set the Thermal Expansion Coefficient.
To enter the Thermal Expansion Coefficient value:
To enable numeric entry press
Use the number keys to type the Thermal Coeffiecient value.
To register the data press
2.2.9 Mod of Elast PSI
Use this menu cell to set the Modular Elasticity in PSI.
To enter the value of Modulus of Elasticity:
To enable numeric entry press
Use the number keys to type the Modular Elasticity PSI value.
To register the data press
2.3 THE APPLICATION DATA MENU
Use of the Application Data menu is optional.
CAUTION: An erroneous Viscosity entry could affect the meter’s intrinsic calibration. Do notalter the default viscosity value of your liquid unless you are sure of your data.
Use the [Application Data] menu to edit default settings to match your application. Whenyou specify a Liquid Class, the meter will adjust its operation to accommodate the liquid’s estimatedsonic velocity, viscosity and specific gravity. If necessary, you can edit each liquid class parameter indi-vidually to obtain a closer match with the liquid. The default liquid is Water at 68°F (20°C).
The [Temperature Range] menu cell allows you to specify the expected temperature range at the trans-ducer mounting location. The default setting: [-40°F to 250°F], matches the standard 991 and 1011series of transducers but not the 1011H. For higher pipe temperatures, selecting the proper tempera-ture range allows the flow computer to recommend the appropriate transducers.
ENT
ENT

2-13
1010DVNFM-3CSection 2
Liquid Class Water 20C/68FLiquid TableTemperature Range -40F to 250FPipe Configuration Fully DevelopedAnomaly Diams 10
Siemens 2 Channel [1] SITE 1
Select Liquid Class from Liquid
Application Data
Use this menu cell toselect an upstreampipe compensation
correction table.
Use this menu to selecta class of liquids and
optionally edit thefollowing liquid
parameters:� Estimated Vs� Viscosity� Density
(Specific Gravity)
Use this menu cell to specify the temperature range of the liquid.
Use this menu cell to enter the number of pipe diameters between the upstream configuration and the transducer installation.
Use this menu cell to select the pipe configuration that most accurately represents the upstream pipe conditions.
Application Data Liquid Class Select Liquid Water 13C/55FWater 20C/68F Water 50C/122FWater 75C/167FWater 100C/212FWater 125C/257FWater 150C/302FWater 175C/347FWater 200C/392FWater 225C/437FWater 250C/482FAcetic Acid AlcoholBromineCarbon TetChlorineDiesel FuelGasolineGlycerineKeroseneMEKOil (SAE 20)Sea WaterTolueneTrichloroethylOther
Estimated Vs m/s xxxx (numeric entry)Viscosity cS x.xx (numeric entry)Density S.G. x.xxx (numeric entry)
Liquid Table Table Active NoYes
LiquIdent Slope x.xxx (numeric entry)Pressure Slope x.xxx (numeric entry)Base Temperature x.xxx (numeric entry)K0 x.xxx (numeric entry)K1 x.xxx (numeric entry)LiquIdent Index Add Index Index Value x.xxxx
1100 S.G. @ 400 x.xxxx1200 Viscosity @ 400 x.xxxx1330 Visc Slope @ 400 x.xxxx1350 Liquid Name ?1380 Kill Index @ 400 No1410 Yes
(continued)
�
�� ��
�
APPLICATION DATA MENU STRUCTURE
�
�
�
��
���
��
� �
� ��
�
�
�

2-14
1010DVNFM-3CSection 2
2.3.1 HOW TO SELECT A LIQUID CLASS
The liquids listed in the Liquid Class option list are representative samples of the class of liquids to whichthey belong. Selecting a named liquid fills in the Estimated Vs (m/s), Viscosity (cS), and Density (SG)parameters automatically. However, you have the option of editing these parameters individually to finetune the liquid settings. If you do not find a liquid that matches your application, then you can select[Other]. This selection will not provide a liquid name or automatic parameter entry.
Liquid Class
Siemens 2 Channel [1] Channel 1
Access Liquid Option List
Estimated Vs m/s 1482
Viscosity cS 1.00
Density SG 1.000
Select Liquid Water 20C/68F
Use this menu cell to edit theEstimated Vs ONLY if you aresure of a more accurate value.This will reduce the chances ofa re-spacing request for clamp-on flow transducers during theinstall procedure.
Use this menu cell to editthe liquid viscosity ONLYif you are certain that thedata you enter isaccurate. An erroneousentry could affect metercalibration.
Use this menu cell toedit the specific
gravity of the liquid.
Application Data Liquid Table LiquIdent Index Add Index142014901579
Temperature Range -40F to 250F-40F to 375F -40F to 450F
Pipe Configuration Fully Developed*(Change to Upstream 1 ElbowPiping) Dbl Elbow +
Dbl Elbow -ValveExpanderReducerNorm EntryHeader InletIntrusions
Anomaly Diams xxxx (numeric entry)
APPLICATION DATA MENU STRUCTURE (continued)
� �
��
�
�
�
�
�
*Default
��
��
�
�
�

2-15
1010DVNFM-3CSection 2
To select a Liquid Class:
To access the option list press
Scroll through the list to find the closest match to the application’s liquid.
To register selection press
How to Edit the Estimated Vs (liquid sonic velocity)
During transducer installation, the flow computer bases its initial transducer spacing recommendationon the value stored in this menu cell. Estimated Vs m/s allows you to review and modify (if necessary)the Vs value for the liquid class you selected.
After you install the transducers, the computer will measure Vs directly. If the displayed (or edited) Vsstored in this menu cell is accurate, the transducers will be spaced correctly. This will eliminate the needto re-space the transducers after their initial installation. However, if the estimated Vs is substantiallydifferent from the measured value, the computer will request you to re-space the transducers during thetransducer install procedure.
NOTE: During the Xdcr install procedure (see paragraph 2.4), you can ignore a respacing re-quest by pressing the <Down Arrow> instead of <ENT>. If this triggers a Spacing Alarm,check [Diagnostic Data/Site Setup Data] to make sure the measured Vs value does notexceed the Vs max or Vs min items.
To edit the Estimated Vs m/s:
To activate numeric entry press
Type the sonic velocity value using meters-per-second.
To register the data press
How to Edit the Viscosity (cS) Setting
The [Viscosity cS] menu cell shows the kinematic viscosity of the selected liquid (in centi-stokes). Theviscosity value is particularly important for high viscosity liquids. The meter requires an accurate liquidviscosity to compute the flow profile compensation. If the displayed viscosity is correct, bypass this menucell by pressing the <Down Arrow>.
To edit the Viscosity setting:
To activate numeric entry press
Use the numeric keys to type the Viscosity value, which must be in centistokes.
To register the data press
How to Edit the Density (SG) Setting
Use the Density (SG) menu cell to edit the nominal specific gravity of the selected liquid. This mode suitsapplications where the density is not only known, but also fixed, due to well-controlled liquid temperatureand chemistry.
The default specific gravity setting is 1.000. The 1010DVN uses the liquid’s specific gravity to form amultiplier for the conversion to API. API appears (in selected units) on the display screen. Density (SG)(as it applies to this system) is defined as the ratio of the mass of this liquid to the mass of an equalvolume of water at 20°C or 68°F.
ENT
ENT
ENT

2-16
1010DVNFM-3CSection 2
To edit the Density SG setting:
To activate numeric entry press
Use the numeric keys to type the Density SG value.
To register the data press
2.3.2 ACTIVATING THE LIQUID TABLE
The liquid table is used to associate the measured LiquIdent variable (temperature compensated sonicvelocity) with user supplied S.G. and Viscosity. By selecting the Liquid Table you can set the LiquIdentSlope, Pressure Slope, fixed reference Base Temperature, K0 and K1 thermal expansion parameters,and the LiquIdent Index.
ENT
To activate the Liquid Table menu:
Press to move the cursor to the [Liquid Table] menu cell.
Use to select [No] or [Yes].
To register the selection press .
Setting The LiquIdent Slope
The 1010DVN measures and reports the flowing liquid’s sonic velocity (Vs) and its temperature (T).These components create the liquid’s “Vs/T” signature. This signature is a fundamental component of theLiquIdent routine that identifies positively any liquid monitored by the 1010DVN system. Since a tem-perature change will affect the sonic velocity of the liquid, a method to balance the measured sonicvelocity to a fixed reference temperature (60ºF/15.6ºC) is provided. The LiquIdent Slope Factor must beconfigured to represent the linear change in the liquid’s sonic velocity per degree Fahrenheit. The LiquIdentroutine uses this slope factor to maintain an accurate liquid identification as the liquid temperature var-ies.
ENT
Siemens Dual Path SITE 1
Liquid Table
Table Active No
LiquIdent Slope 2.300
Pressure Slope 0.030
Base Temperature 60.000
K0 341.0957
K1 0.0000
LiquIdent Index 1400
Use this menu cell toactivate the Liquid
Table.
Use this menu cell to setthe Pressure Slope.
Use this menu cell toset the K0 and K1thermal expansioncoefficients for the
Liquid Class.Use this menu cell toenter the LiquIdentIndex.
Use this menu cell to set theLiquIdent Slope. The defaultvalue is 2.300.
Use this menu cell to setand edit the referenceBase Temperature. Achange in the referencetemperature will affect thesonic velocity of the liquid.

2-17
1010DVNFM-3CSection 2
NOTE: The LiquIdent Slope Factor for all liquids within a liquid class should be essentially iden-tical, even though their individual sonic velocities may be very different.
This menu cell allows the LiquIdent Slope Factor to be edited for optimal operation. The LiquIdent SlopeFactor default is 2.300. This default factor applies to hydrocarbon liquids at the reference temperature of60ºF/15.6ºC (default).
To calculate a liquid’s LiquIdent Slope Factor:
��Establish the maximum (Tmax) and minimum (Tmin) operating temperatures for all liquids within theLiquid Class. For each liquid, note the measured sonic velocity (located in the Diagnostic Menu) atTmax and the sonic velocity at Tmin (in-meters-per-second).
��Use the following formula to calculate the LiquIdent Slope Factors with the Liquid Class:
LiquIdent Slope Factor = (Vs @Tmin) - (Vs @Tmax) (Tmin - Tmax)
NOTE: If the Centigrade scale is used for Tmax and Tmin, multiply the result by 0.56 to obtainthe liquid’s LiquIdent Slope Factor.
��Calculate the average of all the LiquIdent Slope Factors with the Liquid Class.
To enter the LiquIdent Slope Factor:
From the [Liquid Table] menu cell, press to scroll down to LiquIdent Slope.
Press to enable numeric entry.
Use the keypad numeric keys to enter desired LiquIdent Slope Factor.
To enter the LiquIdent Slope Factor press .
Setting The Pressure Slope
The 1010DVN measures and reports the flowing liquid’s sonic velocity (Vs) and its related pressure (P).Since a pressure change will affect the sonic velocity of the liquid, a method to balance the measuredsonic velocity to a fixed reference temperature (60ºF/15.6ºC default) is provided. The Pressure SlopeFactor default is 0.030 (m/s per PSI). This pressure slope factor helps maintain an accurate liquid identi-fication as the LiquIdent factor and liquid temperature vary.
The 1010DVN has the ability to accept a 4-20 mA input for pressure. If used, the 1010DVN will processpressure data based on the analog input. This is recommended for pipelines that have wide pressurevariances.
To calculate a liquid’s Pressure Slope Factor:
��Establish the maximum (Pmax) and minimum (Pmin) pressures for all liquids within the Liquid Class.For each liquid, note the measured sonic velocity at Pmax and the sonic velocity at Pmin (in-meters-per-second).
��Use the following formula to calculate the Pressure Slope Factors with the Liquid Class:
Pressure Slope Factor = (Vs @Pmin) - (Vs @Pmax) (Pmin - Pmax)
��Calculate the average of all the Pressure Slope Factors within the Liquid Class.
ENT

2-18
1010DVNFM-3CSection 2
To enter the Pressure Slope Factor:
From the [Liquid Table] menu cell, press to scroll down to Pressure Slope.
Press to enable numeric entry.
Use the keypad numeric keys to enter the desired Pressure Slope Factor.
To enter the Pressure Slope Factor press .
This moves the highlight down to [Base Temperature].
Setting the Reference Base Temperature
The 1010DVN uses a reference Base Temperature of 60ºF (15.6ºC) for the LiquIdent Slope, PressureSlope, and other settings. Any temperature can be entered and used as the reference Base Temperature(e.g., 68ºF/20ºC).
To enter the Base Temperature:
From the [Liquid Table] menu cell, press to scroll down to [Base Temperature].
Press to enable numeric entry.
Use the keypad numeric keys to enter the desired Base Temperature.
To enter the Base Temperature press .
Altering the Base Temperature will result in all “Base” outputs and settable items to be referenced to theselected temperature.
Entering K0 and K1 Parameters (API thermal expansion coefficients)
The K0 and K1 parameters represent the thermal expansion coefficients for the Liquid Class. The Inter-face Detector requires these parameters to apply the proper volume correction. These coefficients canbe found in the ASTM designation: D1250 or the API standard: 2540. The default K0 and K1 values are341.0957 and 0.0, respectively. These correspond to Crude Oils. If these values suit the application,these menu cells can be bypassed by pressing the <Down Arrow> twice. The following table lists K0 andK1 values of some common classes of liquids.
ENT
ENT
Liquid K0 K1
Crude Oils 341.0957 0.0
Gasoline and Naphthenes 192.4571 0.2438
Jet fuels and Kerosenes 330.3010 0.0
Diesels, Heating Oils and Fuel Oil 144.0427 0.1896

2-19
1010DVNFM-3CSection 2
To enter the K0 and K1 thermal expansion coefficients:
From the [Liquid Table] menu cell, press to scroll down to [K0].
Press to enable numeric entry.
Use the keypad numeric keys to enter the desired K0 factor.
To enter the K0 factor press .
This moves the highlight down to [K1].
Repeat the procedure for [K1].
Setting the LiquIdent Index
A Liquid Class must have an associated LiquIdent Index Scale. The 1010DVN uses this scale to compen-sate its outputs for variations in liquid type, specific gravity, and viscosity. The LiquIdent Index Scaleenables positive liquid identification.
A LiquIdent Index is the sonic velocity for the liquid at the Base Temperature, generally 60ºF (15ºC).When a LiquIdent Index is entered for a particular liquid within the Liquid Class, the liquid’s specific gravityand its viscosity must also be entered at the LiquIdent Index.
To create a LiquIdent Index Scale for the Liquid Class, a minimum of two LiquIdent Indices are required tobe entered. If desired, up to thirty-two LiquIdent indices can be entered. However, the computer onlyneeds two to establish a scale of all the possible LiquIdent indices for the Liquid Class.
After the computer interpolates the LiquIdent Index Scale, its projections can be checked by entering ameaningful LiquIdent Index and examining the reported specific gravity and viscosity values. The scalecan be fine-tuned by manually adjusting the factors at up to thirty-two separate points.
To enter the LiquIdent Index:
From the [Liquid Table] menu cell, press to scroll down to [LiquIdent Index].
Press to enable numeric entry.
Use the keypad numeric keys to enter the desired LiquIdent Index.
To enter the LiquIdent Index press .
ENT
ENT
Siemens Dual Path Site 1
LiquIdent Index
Index Value 1440
S.G. @ 400 1.0000
Visc (cS) @ 400 1.00
Visc Slope @ 400 -0.0287
Liquid Name Crude
K0 341.0957
K1 1.0000
Kill Index @ 400 No
Temperature Corrected Vs Index

2-20
1010DVNFM-3CSection 2
Each of the data points of a Site Liquid Table (maximum of 32) may be filled in by the user as indicatedin the menu screen shown above.
Index Value - The temperature-corrected sonic velocity (LiquIdent) which points to the output variablesforming the balance of the table entry. Below this you may enter the values associated with that LiquIdentvalue.
S.G. - The specific gravity of the liquid at system Base Temperature, usually 60ºF. By specific gravity wemean the ratio of equal volumes of this liquid and water at this base temperature.
Viscosity - The kinematic viscosity of the liquid at system Base Temperature (units: centi-stokes).
Visc Slope - The exponent of the logarithmic expression used to project the liquid viscosity at measuredtemperature. The default value (-0.0287) has been found to be adequate for many hydrocarbons.
γγγγγn = ewhere:
γn = Kinematic viscosity at current measured temperature (cS)
e = Base of natural logarithms
VSLP = Viscosity Slope (i.e., -0.0287)
�t = Current Measured Temperature minus Base Temperture (degrees F)
γb= Visc @ Base Temperature (cS)
( )VSLP x �����t + ln(γγγγγb)
Liquid Name - You may install a name here if you wish to identify the liquid in the meter's dataloggerreport. To prevent flicker of two names when the LiquIdent is at transition points, you may wish to createranges of LiquIdent and additional entries in between with no name installed.
K0 and K1 - These variables, also found in the global table area as defaults for each table point, are usedby the ASTM D1250 or API 2540 routine to project liquid S.G. at the measured temperature (refer toEntering K0 and K1 Parameters above). If you are measuring only one class of liquids, for example oils,accept the default for each data point. For a pipeline carrying many different hydrocarbon classes, youmay be able to create a table that will automatically move from one set of factors to another, based onLiquIdent. Just as with liquid names, you should create ranges of LiquIdents where the appropriate K0/K1variables are installed for their corresponding liquids.
2.3.3 HOW TO SELECT A PIPE TEMPERATURE RANGE
This menu cell informs the flow computer about the expected temperatures that the transducers will besubjected to during operation. The default setting, -40°F to 250°F corresponds with the rated tempera-ture range of our standard 991 or 1011 series transducers. The other selections provide higher upperlimits of 375°F and 450°F respectively.

2-21
1010DVNFM-3CSection 2
If you know that the pipe temperature will exceed 2500F at the transducer mounting location, please usethis menu cell to select the appropriate range. This will allow the flow computer to restrict its transducerrecommendations to the appropriate environmentally rated types.
To select a Temperature Range:
To access the [Temperature Range] option list press
To highlight the desired range press
To register your selection press
2.3.4 PIPE CONFIGURATION
The [Pipe Configuration] menu cell in the Application Data menu presents a list of descriptions of pipingconfigurations that could affect the flow profile characteristics (such as “Single Elbow”). Examine theoption list. Selecting a piping configuration that closely approximates conditions at or near your mountinglocation allows the flow computer to compensate for the effect of upstream piping on flow profile. Thenumber of diameters between the upstream configurations and the transducer installation can be nu-merically entered via the [Anomaly Diams] menu cell.
To select a Piping Configuration:
To access the option list press
To highlight the desired piping configuration press
To register selection press
The default pipe configuration (Fully Developed) wll cause the flowmeter to use the conventional ReynoldsCompensation Table when compensating for liquid flow profile behavior.
ENT
ENT
Siemens Dual Path [1] Path 1
Disignate Pipe Shape Near Transducers
Liquid Class Water 20C/68F
UniMass Table Create/Edit Table
Temperature Range -40F to 250F
Pipe Configuration Fully Developed
Anomaly Diams 1 Elbow
Dbl Elbow +
Dbl Elbow -
Valve
Expander
Reducer
Norm Entry
Header Inlet
Intrusions
Application Data
Use this menu cell to enter the number of pipe diameters
between the upstream configuration and the
transducer installation.
Use this menu cell to select the pipe configuration that most accurately represents the upstream pipe condition.

2-22
1010DVNFM-3CSection 2
Application Data Pipe Configuration Fully Developed*(Change to Upstream 1 ElbowPiping) Dbl Elbow +
Dbl Elbow -ValveExpanderReducerNorm EntryHeader InletIntrusions
Anomaly Diams xxxx (numeric entry)
� ��Pipe Configuration Menu Structure
* Default
� �
�
PIPE CONFIGURATION OPTION LIST DEFINITIONS
Fully Developed Fully Developed flow, as would be expected for very long straight pipe runsor installation downstream of a flow condition.
1 Elbow Single 90 degree Elbow upstream of transducer installation.
Dbl Elbow + Double out-of-plane Elbows upstream of transducer installation.
Dble Elbow - Double in-plane Elbows upstream of transducer installation.
Valve To Be Determined.
Expander Pipe expansion upstream of transducer installation.
Reducer Pipe reduction upstream of transducer installation.
Norm Entry To Be Determined.
Header Inlet Header or pipe manifold upstream of transducer installation.
Intrusions To Be Determined.
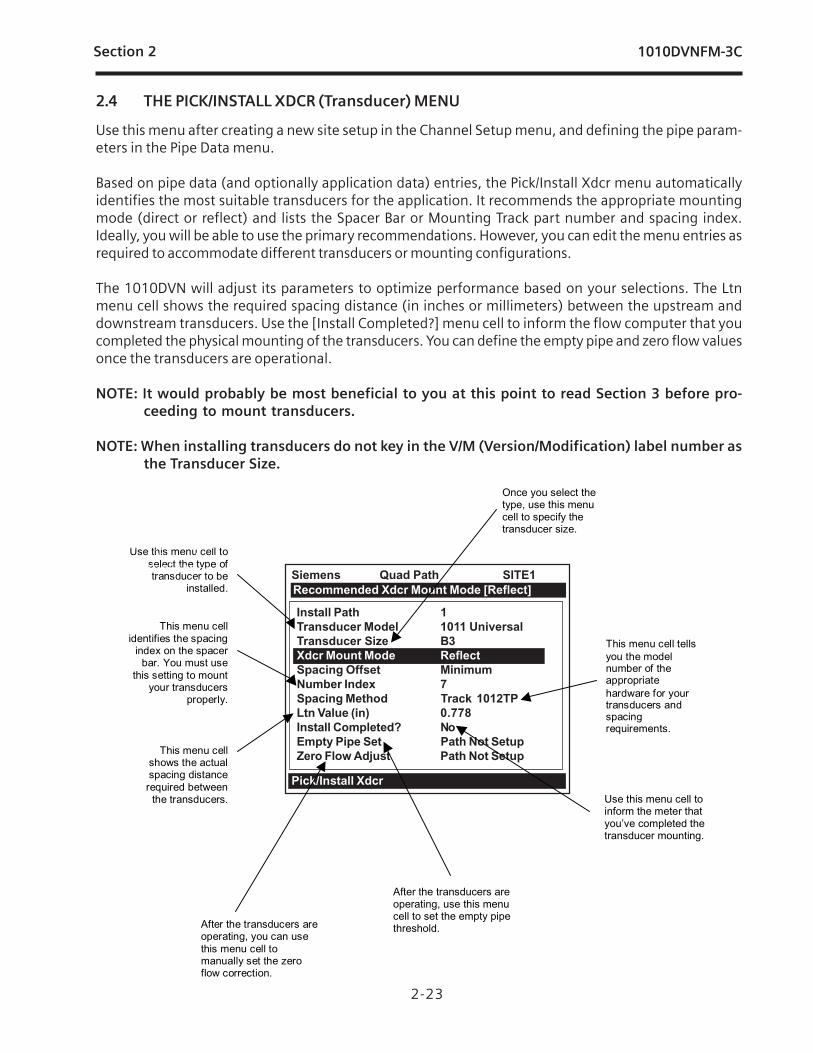
2-23
1010DVNFM-3CSection 2
2.4 THE PICK/INSTALL XDCR (Transducer) MENU
Use this menu after creating a new site setup in the Channel Setup menu, and defining the pipe param-eters in the Pipe Data menu.
Based on pipe data (and optionally application data) entries, the Pick/Install Xdcr menu automaticallyidentifies the most suitable transducers for the application. It recommends the appropriate mountingmode (direct or reflect) and lists the Spacer Bar or Mounting Track part number and spacing index.Ideally, you will be able to use the primary recommendations. However, you can edit the menu entries asrequired to accommodate different transducers or mounting configurations.
The 1010DVN will adjust its parameters to optimize performance based on your selections. The Ltnmenu cell shows the required spacing distance (in inches or millimeters) between the upstream anddownstream transducers. Use the [Install Completed?] menu cell to inform the flow computer that youcompleted the physical mounting of the transducers. You can define the empty pipe and zero flow valuesonce the transducers are operational.
NOTE: It would probably be most beneficial to you at this point to read Section 3 before pro-ceeding to mount transducers.
NOTE: When installing transducers do not key in the V/M (Version/Modification) label number asthe Transducer Size.
Siemens Quad Path SITE1
Install Path 1
Transducer Model 1011 Universal
Transducer Size B3
Xdcr Mount Mode Reflect
Spacing Offset Minimum Flow
Number Index 7
Spacing Method Track 1012TP
Ltn Value (in) 0.778
Install Completed? No
Empty Pipe Set Path Not Setup
Zero Flow Adjust Path Not Setup
Recommended Xdcr Mount Mode [Reflect]
Pick/Install Xdcr
This menu cell tellsyou the modelnumber of theappropriatehardware for yourtransducers andspacingrequirements.
This menu cellshows the actualspacing distancerequired between
the transducers.
This menu cellidentifies the spacing
index on the spacerbar. You must use
this setting to mountyour transducers
properly.
Use this menu cell toselect the type oftransducer to be
installed.
This menu cellallows you to selecta mounting mode.*Use Reflect Modewhenever possible.
After the transducers areoperating, you can usethis menu cell tomanually set the zeroflow correction.
Once you select thetype, use this menucell to specify thetransducer size.
Use this menu cell toinform the meter thatyou’ve completed thetransducer mounting.
After the transducers areoperating, use this menucell to set the empty pipethreshold.

2-24
1010DVNFM-3CSection 2
NOTE: Menu cell [Install Path] appears when the Dual Path Flowmeter is selected from the[Select Meter Type] menu. The Path [1] or Path [2] menu cell can be selected by pressingthe <Right Arrow>. Virtual Channel 3 [Ch 1+2 Flow] and Ch 1-2 Flow] menu cells do notallow selection of a transducer type.
2.4.1 HOW TO SELECT A TRANSDUCER MODEL
Use the [Transducer Model] menu cell to define the type of transducer for use with your application. Thisallows the flow computer to adjust its transmit/receive functions accordingly. You can choose from eitherthe [1011 Universal] or [1011H High Precision] transducer lists, or from a list of [991 Universal] mod-els. You should consider using high precision transducers for extremely critical applications. We usuallyrecommend these transducers for custody transfer, leak detection or nuclear power applications. Thesystem default is [1011 Universal]. If this suits the application, bypass this menu cell by pressing the<Down Arrow>.
Pick/Install Xdcr Install Path 1 2
Transducer Model 991 Universal 1011 Universal 1011 Hi Precision
Transducer Size A1A1 0A0A A1HA1H A2 0 A2H B1 1 A3H B2 2A B1H B3 2 B2H C1 3A B3H C2 3 C1H C3 4A C2H D1 4 D1H D2 5A D2H D3 5 D3H E1 D4H E2 E3
Xdcr Mount Mode Direct Reflect
Spacing Offset Minimum Nominal Maximum
Number Index 4 (generated)Spacing Method Spacer Bar [P/N] *auto P/N generationLtn Value 2.00 (generated)Install Completed No [Yes] *[Yes] indicates successful install
InstallEmpty Pipe Set MTYmatic
Set Empty Actual MTY
Zero Flow Adjust AutoZero *Reflect mount only ZeroClr Reversamatic Actual Zero ZeroMatic
1011 Universal 991 Universal 1011H High Precision
�
�
�
��
�
�
�
�
� � �
�
�
�
����
�
�
�
�
�
�
�
�
PICK/INSTALL XDCR MENU STRUCTURE
�
�

2-25
1010DVNFM-3CSection 2
To select a Transducer Model:
To access the [Transducer Model] option list press
To move the cursor to the required transducer model press
To store your selection press
2.4.2 HOW TO SELECT A TRANSDUCER SIZE
When you move the cursor to [Transducer Size], the highlighted prompt at the top of the display screenshows a list of recommended transducer sizes. For example [Recommended Xdcrs: D3, D2, D1, C1,C3]. The flow computer generates this list automatically based on your pipe and your application dataentries. The left-most transducer size (e.g., D3) is the primary (most appropriate) choice. The right-mosttransducer (e.g., C3) is still acceptable (but the least desirable) choice. Since these are simply recom-mendations not requirements, you can override the flow computer and use any size, as long as themounting method accommodates the pipe’s diameter. The flow computer shows that your selection isacceptable if it is able to calculate transducer spacing (Ltn).
To select a Transducer Size:
To access the [Transducer Size] option list press
To move the cursor to the desired transducer size press
To select the transducer press
2.4.3 HOW TO SELECT A TRANSDUCER MOUNT MODE
The flow computer recommends the transducer mounting mode [Direct or Reflect]. In almost all cases itwill be Reflect, since this is the most desirable configuration. Reflect mode allows you to mount thetransducers on pipes that do not permit back or side access. Reflect mode provides inherent compensa-tion for flow profile distortion (crossflow) that could be the result of unfavorable application conditionssuch as an insufficient upstream straight run. In addition, Reflect mode supports the AutoZero function,which sets the zero flow velocity automatically.
Direct mounting may produce a stronger transducer signal and requires less mounting length thanReflect mounting. This can be important if the liquid or pipe material exhibits high sonic attenuation,thereby preventing operation in the Reflect configuration.
NOTE: We recommend using Direct Mount with Plastic pipes.
To select a Xdcr Mounting Mode:
To access the [Xdcr Mount Mode] option list press
To move the cursor to the required mounting type press
To store selection press
2.4.4 HOW TO USE THE SPACING OFFSET
After you select the mounting method, the flow computer checks your entries for pipe size, transducertype etc. and then recommends a spacing offset. This is the first step in establishing the correct distancebetween the transducers. Spacer bars and mounting tracks utilize number indices (labels) to simplify
ENT
ENT
ENT

2-26
1010DVNFM-3CSection 2
transducer placement. One transducer is located at the Reference position, while the other one is lo-cated at the Number Index position. The Number Index cannot be directly edited. However, the SpacingOffset can be changed via its option list. Changing the Spacing Offset will alter the reported NumberIndex. Maximum spacing offset provides moderately greater signal levels but, in some cases, slightlydecreased zero flow stability. (NOTE: This mounting method is different for the System 991 Flowmeter.)
If the flowmeter reports “Use Ltn,” you have to measure the distance between the upstream and down-stream transducers. The flow computer issues the actual distance between the transducers in inches ormillimeters (see Ltn paragraph 2.4.7). Please consult Section 3 for details on how to use the Ltn mea-surement. Note that, even though using Ltn does not call for the physical use of the Number Index, youcan still change the Spacing Offset to influence the strength of the transmit signal.
The 1010DVN uses a pair of precisely matched transducers. Therefore, you can select either one for theReference position. You must connect the Up transducer cable to the transducer mounted on the up-stream side of the mounting track. This lets the meter display the flow direction correctly.
It is important that you note each transducer’s serial number and its Index position during the originalinstallation because to reinstall the flowmeter successfully, you must re-mount each transducer in itsoriginal position. Transducer pairs have matching serial numbers except for the appended letters “A” and“B.” This helps you to identify each transducer.
To select a different Spacing Offset
To access to [Spacing Offset] option list press
To move the cursor to the desired offset press
To store selection press
2.4.5 THE NUMBER INDEX MENU CELL
Selecting the Spacing Offset allows the flow computer to calculate the Number Index. The Number Indexestablishes the spacing between a pair of transducers. You cannot override this recommendation. Tocomplete the transducer installation, you must accept the Number Index by mounting the transducer atthat point on your spacer bar or mounting track. Initially, the flow computer bases its Number Indexselection on the pipe diameter and estimated liquid sonic velocity (Vs) you entered in the ApplcationData menu. When you invoke the [Install Completed?] routine, the flow computer actually measures theliquid sonic velocity (Vs). In some cases, it may prompt you to re-space the transducers to anothernumber index.
2.4.6 REVIEWING THE SPACING METHOD
The flow computer analyzes your transducer selection, mounting mode and pipe size to determine thebest way to install your transducers. It will recommend the use of either a mounting track, a spacer bar,or independent mounting. The flow computer will list the part number of a mounting track or spacer bar.If it decides upon independent mounting, it will report the distance required between the two transduc-ers. In this case, you have to make sure that when you mount the transducers, the space between themequals the length specified in the Ltn menu cell. See Section 3 for details on how to accomplish this.
ENT

2-27
1010DVNFM-3CSection 2
Install transducers as required (refer to appropriate 1010 Field Manual for procedures).
After transducers are properly mounted, the flow computer completes its Initial Makeup command andthe [Install Completed?] menu cell appears.
To access the [Install Completed?] option list, press the <Right Arrow>.
Press <Down Arrow> and scroll to the [Install] menu cell and then press <ENT> (unless other-wise directed to do so by Siemens Technical Service Department).
NOTES
� Mount the transducers using the selected mode (direct or reflect). Please refer to thetransducer mounting procedures detailed in Section 3.
� When using a mounting track or a spacer bar in reflect mode, locate the first trans-ducer at the Reference Index and the second transducer at the recommended NumberIndex.
� If you are mounting the transducers independently, you must use the recommendeddistance; Ltn to space the transducers.
� You must use the proper sonic coupling compound. See “Recommended Sonic CouplingCompounds” in Section 5 for appropriate type and part number.
� The pipe must be completely filled with a liquid, which can be either flowing or at zeroflow.
2.4.7 THE Ltn VALUE MENU CELL
This view only menu cell shows the distance in inches or millimeters between the front faces of thetransducers along the axis of the pipe. If you are mounting the transducers without a track or spacer bar,you have to space them according to this value (see Section 3 for details). Note that Ltn may be anegative number for direct mount on very small pipes where the transducer spacing overlaps.
2.4.8 HOW TO USE [INSTALL COMPLETED?]
Use the [Install Completed?] menu cell to inform the flow computer that you have mounted the transduc-ers according to the selected mode and spacing requirements and are ready to start operation.
To start the [Install Completed?] routine for an original installation:
Select any transit-time mode (e.g., Clamp-On ) and press the <Right Arrow>.
Press <Down Arrow>. Scroll to the [Pick/Install Xdcr] menu cell. Press <Right Arrow>.

2-28
1010DVNFM-3CSection 2
Transducer Model 1011 Universal
Transducer Size B3
Xdcr Mount Mode Direct
Spacing Offset Minimum
Number Index 4
Spacing Method Track 1012TP
Ltn Value (in) 0.217
Install Completed? Yes
Empty Pipe Set Channel Not Setup
Zero Flow Adjust Channel Not Setup
Siemens 2 Channel [1] SITE1
Key [Install] after mounting transducers
Pick/Install Xdcr
Press <ENT>. The [Install Completed?] menu cell will indicate [Yes] after the 1010DVN is suc-cessfully installed.
Transducer Model 1011 Universal
Transducer Size B3
Xdcr Mount Mode Direct
Spacing Offset Minimum
Number Index 4
Spacing Method Track 1012TP
Ltn Value (in) 0.217
Install Completed? Install
Empty Pipe Set Channel Not Setup
Zero Flow Adjust Channel Not Setup
Siemens 2 Channel [1] SITE1
Drive 0
Pick/Install Xdcr
1. After [Installed Completed?] is selected press <ENT>. While the meter is going through the drives(see menu screen below), press the <ALT> and <MENU> keys simultaneously.
Force Transmit Procedure
This diagnostic software routine allows the user to “force” a transmitting condition that can be use tosearch for an amplitude level (ALC) when Detection Fault or Low Signal alarms are present. The routineforces the flowmeter to generate constant transmit bursts while reporting current receive signal strengthfor the user. To initiate the Force Transmit function, refer to the Short Burst detection mode exampleshown below.
Transducer Model 1011 Universal
Transducer Size B3
Xdcr Mount Mode Direct
Spacing Offset Minimum
Number Index 4
Spacing Method Track 1012TP
Ltn Value (in) 0.217
Install Completed? No
Empty Pipe Set Channel Not Setup
Zero Flow Adjust Channel Not Setup
Siemens 2 Channel [1] SITE1
Key [Install] after mounting transducers
Pick/Install Xdcr
To complete the Install process disregard the following paragraphs explaining the ForceTransmit and Force Frequency diagnostic software routines. Proceed to the Install pro-cess completion steps immediately following the Force Transmit procedures.
NOTE: If the transducers have been installed successfully but the Estimated Vs (sonic velocity)has been changed, the Pick/Install Xdcr menu cell [Install Completed?] option list willalso display the [Transfer Install] function selection. The Transfer Install function allowsthe transducers to be optimally positioned for a different fluid, without the need for anew Initial Makeup procedure (see the Water Calibration addendum in this manual fordetails).
Transducer Model 1011 Universal
Transducer Size B3
Xdcr Mount Mode Direct
Spacing Offset Minimum
Number Index 4
Spacing Method Track 1012TP
Ltn Value (in) 0.217
Install Completed? No
Empty Pipe Set Channel Not Setup
Zero Flow Adjust Channel Not Setup
Siemens 2 Channel [1] SITE1
Key [Install] after mounting transducers
Pick/Install Xdcr

2-29
1010DVNFM-3CSection 2
3. To exit Force Transmit, press the <Left Arrow> and a Detection Fault prompt will appear (see above).
4. Press the <Left Arrow> again and the meter will return to the Pick/Install Xdcr menu and highlight the[Empty Pipe Set] menu cell.
5. To force a frequency, repeat steps 1 and 2 above, but press <Right Arrow>. The following typicaldisplay line will appear:
Using numeric keys enter the frequency and press <ENT>.
To complete the Install process after mounting the transducers press <ENT>.
6. If the Force Transmit diagnostic procedure is not used, the normal [Install Completed?] functionoccurs as follows:
Immediately after you press <ENT>, the computer starts an internal process called an Initial Makeup. Thecurrent Initial Makeup activity, for example: appears at the top of the display
NOTE: The <ALT> and <MENU> keys must be pressed before the flowmeter scans through allthe drives, or the Force Transmit function must be initiated again.
2. A typical menu screen will appear as shown below and indicate the current ALC (e.g., 50). This ALCnumber indicates the current receive signal strength and can be used for further diagnostic pur-poses.
Drive
=0
Transducer Model 1011 Universal
Transducer Size B3
Xdcr Mount Mode Direct
Spacing Offset Minimum
Number Index 4
Spacing Method Track 1012TP
Ltn Value (in) 0.217
Install Completed? Install
Empty Pipe Set Channel Not Setup
Zero Flow Adjust Channel Not Setup
Siemens 2 Channel [1] SITE1
Pick/Install Xdcr
Detection Fault
Press [ENT]
Transducer Model 1011 Universal
Transducer Size B3
Xdcr Mount Mode Direct
Spacing Offset Minimum
Number Index 4
Spacing Method Track 1012TP
Ltn Value (in) 0.217
Install Completed? Install
Empty Pipe Set Channel Not Setup
Zero Flow Adjust Channel Not Setup
Siemens 2 Channel [1] SITE1
ForceN fx=8 m=7 ALC=50
Pick/Install Xdcr
Drive 14 m 10 [——]

2-30
1010DVNFM-3CSection 2
This means that the flow computer was able to complete the Initial Makeup and is now actively measur-ing flow. This pop-up window allows you to “fine-tune” the Measured Vs by pressing the <Right Arrow> toactivate numeric entry. You can then use the numeric keys to type a different value. However, only editthe Measured Vs when you are certain of your liquids actual sonic velocity. If, however, there is a largediscrepancy between the “measured” Vs and the “actual” Vs, then consider that an accurate Vs mea-surement depends on certain parameters that the flow computer cannot sense directly (e.g., pipe di-mensions or transducer placement). In other words, entering incorrect pipe parameters or not using therecommended spacing could result in an erroneous Vs measurement.
The meter is now ready to report flow. Press the <Menu> key to display flow.
In cases where the actual Vs differs noticeably from the estimated Vs, the computer may issue a re-space command. This requires that you re-space the Number Index transducer at the new NumberIndex, then press <ENT> again. Repeat the initial makeup process. You can override a re-space com-mand by simply keying the <Down Arrow>. However, after the meter completes begins operating, youmust confirm that the sonic velocity (Vs) of the liquid falls between the [Vs max] and [Vs min] items in[Diagnostic Data/Site Setup Data].
Therefore, only consider editing the measured Vs after you remove all the primary causes for an inaccu-racy. Check your pipe dimensions and pipe material entries. Re-check the transducer spacing and partnumbers. Large Vs discrepancies are almost always due to erroneous pipe data or incorrect transducerplacement.
To accept the Measured Vs:
Pressing or moves the cursor to the [Empty Pipe Set] menu cell.
If you decide to edit the Measured Vs:
To activate numeric entry press
Use the numeric keys to type the new Vs value (in meters-per-second).
To store the corrected Vs press
The flow computer may recommend a new Number Index and prompt you to pressRemount the transducer at the new Number Index.
To repeat the Initial Makeup process press
ENT
Measured Vs m/s 1470
ENT
ENT
screen. During the Initial Makeup, the flowmeter verifies the site data, verifies your site data, records thesonic characteristics of the pipe and liquid and then ad-justs internal parameters to optimize flow mea-surement. Please remain patient. This process can take several seconds or several minutes to complete.There is no relationship between the length of an Initial Makeup and the meter’s subsequent perfor-mance. An Initial Makeup for larger pipes (and more demanding application conditions) simply takes alittle longer. Upon successful completion of the initial makeup, the 1010 will show you a pop-up windowwith the measured Vs as shown below.

2-31
1010DVNFM-3CSection 2
If you want to redo the Initial Makeup, move cursor to [New Makeup], then press <ENT>.This resets the option list. You can now repeat the install routine described previously.
2.4.9 THE EMPTY PIPE SET MENU
The flowmeter performs the MTYmatic routine automatically during its Initial Make-up to establish astandard setting for the Empty Pipe alarm. The [Empty Pipe Set] option list allows you to re-invoke MTYmatic,use an Actual MTY routine (if application conditions allow you to empty and refill the pipe) or use the SetEmpty routine to set the empty pipe threshold by direct numeric entry.
How to Use the Actual MTY Command
If application conditions allow you to empty and refill the pipe, then you should perform the Actual Emptyprocedure. This is the recommended way to define the empty pipe threshold.
NOTE: NEVER perform this procedure when the pipe is full.
To perform the Actual MTY Procedure:
To access the [Empty Pipe Set] option list press
To move the cursor to [Actual MTY] press then
Empty the pipe completely, then press . appears on themenu prompt line.
Refill the pipe completely, then press
How to Use the MTYmatic Command
You can repeat MTYmatic (performed during the Initial Makeup) to correct an inaccurate Actual MTYsetting if conditions do not allow you to repeat the Actual Empty procedure.
NOTE: Only use the MTYmatic procedure when the pipe is full.
To start MTYmatic:
To access the [Empty Pipe Set] option list press
Move the cursor next to [MTYmatic] by pressing
To invoke MTYmatic press
After the flow computer completes its Initial Makeup command, the [Install Completed?] option list changesto:
appears on the menu prompt line.
ENT
ENT
ENT
ENT
Install Completed? Yes New Makeup
[Empty Pipe Press Enter]
[Fill Pipe Press Enter]

2-32
1010DVNFM-3CSection 2
How to Use the Set Empty Command
Use [Set Empty] to enter a number that represents the signal strength level consistent with an emptypipe. Set Empty uses non-linear scaling. There is no direct correlation between the number you enter andany standard amplitude unit. If you set the number too low, the meter may not detect a true empty pipe.If you set it too high, it could trigger the empty pipe alarm, suspending flow measurement, even thoughthe liquid is flowing.
To enter an Empty Pipe Alarm Threshold:
To access the [Empty Pipe Set] option list press
To move the cursor to [Set Empty] press
Press . The current empty threshold number appears in a pop-up window.
Use the numeric keys to type a new Set Empty number.
To store the Set Empty number press
2.4.10 ZERO FLOW ADJUST MENU
Unlike turbine meters ultrasonic transit-time meters provide active flow measurement right down to zeroflow, however, the measurement of the transit-time delta is dependent on the similarity or “match” of theelectronics, cables and ultrasonic transducers. Consequently some flow offset (or zero offset) may bepresent in any installation. To eliminate this residual zero offset Controlotron has developed severaldifferent methods to insure proper zero flow compensation. The following paragraphs describe eachmethod and when they should be used.
AutoZero
When the 1011 transducers are mounted in the Reflect Mode configuration (see paragraph 3.1.5) theAutoZero routine is automatically invoked at the end of the Initial Makeup. Flow does not have to bestopped to perform AutoZero since only the pipe wall signal is used in determining the zero offset andnot the liquid component. The AutoZero routine performs a one-time analysis of the pipe wall compo-nent of the ultrasound signal to quantify any residual mismatch in the hardware. Once the AutoZeroroutine is complete, the system memorizes this measured zero offset and subtracts this value from theflow reading.
Actual Zero
The “Actual Zero” function simply averages the indicated “zero flow” readings (over a user defined timeperiod) then stores this average value in memory. Under normal operation the indicated flow reading iszero compensated by simply subtracting this memorized value from the uncompensated flow reading.Actual Zero is the most positive method for zeroing the system, however, flow must be stopped withthe line blocked (if possible) before invoking this function. If stopping flow is not possible then analternate zeroing method should be selected.
ReversaMatic
This routine involves swapping the Up and Down transducers on the pipe (while keeping the cablesattached) such that the difference in the transit-time change represents the zero offset. The fixed zerooffset value is stored in memory in the same manner as described in Actual Zero. This routine wouldgenerally be used whenever flow cannot be stopped and the transducers cannot be mounted in theReflect Mode configuration. Flow must be stable during the entire process.
ENT
ENT

2-33
1010DVNFM-3CSection 2
ZeroMatic (not present in MultiPulse operation)
When ZeroMatic is invoked the flowmeter first performs the same analysis as described above in theAutoZero routine. However, after this analysis is complete the flowmeter continues to interrogate thepipe wall signal and update the zero offset value under normal operation, such that the flowmeterdynamically compensates for changing conditions which would normally result in zero drift. ZeroMaticwill only operate with the transducers mounted in the Reflect Mode configuration and is recommendedfor applications which experience large temperature extremes.
NOTE: Invoking ZeroMatic will clear any existing “fixed” or memorized zero offset. If any zerooffset remains after flow is stopped, an Actual Zero can be performed without inter-rupting ZeroMatic operation. To disable ZeroMatic, invoke it again, but then press <LeftArrow> to abort the installation.
NOTE: The ZeroClr command only resets the memorized zero offset registers not those setwhen the AutoZero routine is invoked.
Using Actual Zero
NOTE: Flow must be stopped with the line blocked (if possible) before invoking this function.To invoke Actual Zero:
Access the [Zero Flow Adjust] option list by pressing
Press . A pop-up window prompts you to set the current flow rate (in selectedrate units) to equal zero (0.000).
NOTE: If a flow offset is desired (i.e., to test analog outputs) then press <Right Arrow> to enablenumeric entry.
Press to start the Actual Zero process.
When you send the command, the flow computer analyzes the current flow rate for up to sixty seconds,integrating (averaging) the data for the best zero correlation. During this time, the menu prompt at thetop of the display screen shows a timer that counts from zero to sixty. You can allow zero averaging forthe entire period, or cancel the process at any time by pressing the <ENT> key. This controls the amountof data the meter averages to obtain a zero level.
Using ReversaMatic
If site conditions do not permit stopping the flow rate at the mounting location, and you do not know thecurrent flow rate, then you can use the ReversaMatic routine to establish the zero flow level. You shouldperform the ReversaMatic procedure as quickly as possible to ensure that the flow rate remains constantthroughout the procedure.
To invoke ReversaMatic:
� To access the [Zero Flow Adjust] option list press
� Move the cursor to [ReversaMatic]. Press to invoke the routine.
ENT
ENT
ENT

2-34
1010DVNFM-3CSection 2
� The flowmeter begins to measure the positive flow rate. “Positive” flow refers to flow moving fromupstream transducer location to the downstream transducer location. Note top prompt line shows:
� Upon completion, the flowmeter beeps and the display screen shows:
� Now remove then remount the upstream and downstream transducers in their reversed positions.Mount the Up transducer (without removing its cable) in the Down transducer/cable location. MountDown transducer with its cable in the Up transducer/cable location. When remounting the transduc-ers, couple them to the pipe properly. Press <ENT> (after re-installing the transducers).
� The flowmeter measures the negative flow rate briefly, then beeps and repeats the prompt:
��Now remount the transducers for normal operation (in their original orientation). When remountingtransducers, couple them to the pipe properly. Press <ENT> (after re-installing the transducers).
This completes the ReversaMatic procedure. The system’s zero accuracy will be very close to that obtain-able using the Actual Zero method, providing flow remained constant during this procedure.
Important Note: A caution on the use of upper and lower flow limits (used to prevent flow mis-registration) prior to using the Reversal Zero technique (ReversaMatic): If the negative flow ratethat the flowmeter reads in the step during which the transducers are reversed is more negativethan the lower flow limit, the meter will re-register positive and the Reversal Zero cycle will thusbe corrupted.
Therefore, postpone the installation of upper and lower flow limits until the reversal zero proce-dure is executed successfully. For pipes that combine large diameters with very high flow veloci-ties, it may be necessary to move the upper and lower flow limits out of the way until the reversalzero is completed. Moreover, pipes of this size frequently have excellent intrinsic zero perfor-mance and may not even need zeroing.
ZeroMatic (optional function) REYNOLDS TABLE
NOTE: ZeroMatic is used in the Reflect Mode only. Invoking ZeroMatic clears any existing fixedzero offset.
Use this menu cell to select the ZeroMatic option. If conditions permit the use of the Auto Zero functionthen the ZeroMatic option can be used as well.
To select and enable the ZeroMatic option:
In the Pick/Install Xdcr menu, press to scroll to the [Zero Flow Adjust] menu cell.
To access the [Zero Flow Adjust] option list press
NOTE: If ZeroMatic is not running, the [Actual Zero] menu item will be displayed next to the[Zero Flow Adjust] menu cell.
Reversamatic Action
Reverse Xdcrs / Press ENT
Reverse Xdcrs / Press ENT

2-35
1010DVNFM-3CSection 2
Siemens Dual Path SITE1
Transducer Model 1011 Universal
Transducer Size B3
Xdcr Mount Mode Reflect
Spacing Offset Minimum Flow
Number Index 7
Spacing Method Track 1012TP
Ltn Value (in) ReversaMatic
Install Completed? ZeroMatic
Empty Pipe Set Auto Zero
Zero Flow Adjust Actual Zero
ZeroClr
Conformans Indicated flow to Actual Zero
Pick/Install Xdcr
Select the [ZeroMatic] menu cell by pressing or then press ENT
When the inital makeup of ZeroMatic is complete the screen will return to the Pick/Install Xdcr menu andautomatically highlight [Operation Adjust], which is the next menu cell.
Channel/Path Setup
Pipe Data
Application Data
Pick/Install Xdcr
Operation Adjust
Flow/Total Units
Data Span/Set/Cal
Stripchart Setup
Datalogger Setup
I/O Data Control
Diagnostic Data
Siemens Dual Path SITE 1
Dual Path Flow
Conforms operation to user Preferences
Siemens Dual Path SITE1
Transducer Model 1011 Universal
Transducer Size B3
Xdcr Mount Mode Reflect
Spacing Offset Minimum Flow
Number Index 7
Spacing Method Track 1012TP
Ltn Value 0.778
Install Completed? Yes
Empty Pipe Set Channel Not Setup
Zero Flow Adjust ZeroMatic
ZeroMatic Active [6:.................:0]
Pick/Install Xdcr

2-36
1010DVNFM-3CSection 2
To disable the ZeroMatic function:
Select the [Pick/Install Xdcr] menu cell from the Dual Path Flow menu.
Scroll down to the [Zero Flow Adjust] menu cell by pressing
NOTE: The highlighted [ZeroMatic] menu item is the only indication that ZeroMatic is function-ing.
Invoke the ZeroMatic initial makeup procedure as previously described above.
While ZeroMatic initial makeup is running, press to abort the process thereby disabling thefunction.
The screen will return to the Dual Path Flow menu and highlight the [Operation Adjust] menu cell.
2.5 THE OPERATION ADJUST MENU
This menu becomes available after picking a meter type and measurement channel. We recommendthat you use it after the transducers are installed and operating to “fine-tune” the meter’s output charac-teristics.
Each application presents different data display and output requirements due to unique pipe and liquidconditions. Use the [Operation Adjust] menu to match meter operation to the site. You can set dampingcontrols for the primary flow rate output. You can define a Deadband, (usually a very low flow rate),below which the flow output will be forced to zero. You can also select the meter response to a continu-ous Fault condition.
Operation Adjust Damping Control Smart Slew x (numeric selection)Time Average xx.x (numeric entry)
Deadband Control x.xx (numeric entry)Memory/Fault Set Memory
FaultMemory Delay (sec) xxx (numeric entry) (hidden in Fault Mode)SL Rate 20 mS
50 mS100 mS250 mS
� �
�
�
��
�
�
Operation Adjust Menu Structure
� ��
�
�
Siemens 2 Channel [1] BCD
Determine Fault Memory Delay
Operation Adjust
Damping Control Smart SlewDeadband Control 0.000Memory/Fault Set MemoryMemory Delay <sec> 120SL Rate 20 mS
Use this menu cell toselect meter responseto a fault condition.Fault drops outputs tozero. Memory retainslast valid reading forduration of MemoryDelay.
Use this menu cell to enterthe duration (in sec.) that youwant the meter to maintain itslast reading for during a faultcondition. The hidden cell onlyappears if you select MemoryMode.
Use this menu cell toenter a flow rate
deadband threshold.Flow rates below thislevel will be reported
as zero flow.
Use this menu cell toselect either
SmartSlew™ or TimeAverage output
damping.
Use this menu cell to enterSonilocator Slew Rate
resolution in milliseconds.

2-37
1010DVNFM-3CSection 2
2.5.1 DAMPING CONTROL
System 1010 provides two different data output filter types, Time Average and SmartSlew. Time Aver-age (recommended) integrates the instantaneous flow rate over a selectable time period. Use the TimeAverage function when stability in flow reading is essential. A value entered (in seconds) sets the time ittakes the meter to respond to a rate change. The default is 10 seconds. Enter any amount of time up to60 seconds maximum.
SmartSlew performs data scatter damping during steady flow periods while maintaining the ability torespond to changing flow rates. SmartSlew values range from [1 to 9]. Pick a higher number to slowflowmeter response to a rate change.
To select Time Average (default):
To access the [Damping Control] option list press
To move the cursor down to [Time Average] press
To enable Time Average entry press
Use the numeric keys to type the new Time Average setting.
To register the new value press
To edit the SmartSlew setting:
To access the [SmartSlew] option list press three times.
Scroll the numeric list to the desired choice by pressing
To register the new value press
2.5.2 DEADBAND CONTROL
Use Deadband Control to instruct the meter to report zero flow if the flow rate falls below a specified level(usually a very low rate). It will prevent the possibility of data scatter (a natural result of digital computa-tion) from causing false totalizer accumulation during long non-flowing periods. Inspect the actual datascatter during zero flow conditions to find the proper deadband setting for your application.
To edit the default setting (0.000):
To enable numeric entry press
Use the numeric keys to type in the desired rate (using selected flow rate units).
To register the new value press
2.5.3 MEMORY/FAULT SET
Certain situations (e.g., an empty pipe or excessive aeration) will interrupt data production. Use Memory/Fault Set to select the meter response to such an interruption. The Fault setting (default) will zero the flowrate output and declare an alarm on a flow display screen, Datalogger report and an assigned relayoutput.
ENT
ENT
ENT
ENT

2-38
1010DVNFM-3CSection 2
For some applications, occasional temporary Fault conditions may be a normal part of the process andwould not require an alarm response. The system offers a Memory operating mode to support such anapplication. Memory Mode suspends the system’s Fault response by preventing the flow outputs fromdropping to zero for the interval specified in the Memory Delay menu cell. During the Memory duration,the meter will maintain the last valid flow reading measured before the onset of the fault condition. Thedefault Memory Delay is 60 seconds. You may select any duration from 3 to 604,800 seconds (oneweek).
To select Memory Mode:
To access the [Memory/Fault Set] option list press
Move the cursor down to [Memory] by pressing
To make selection press
This moves the highlight to [Memory Delay (sec)].
Memory Delay (sec)
Selecting [Memory] activates the suppressed [Memory Delay] menu cell. It allows you to specify thenumber of seconds that the meter maintains its last valid flow reading. When the memory delay expires,it triggers the fault alarm response described previously.
To specify the Memory delay:
To enable numeric entry press
Use the number keys to type the delay in seconds.
To register the new value press
2.5.4 SONILOCATOR OPERATION
In the event of a pipeline leak, a sudden drop in pressure occurs radiating a pressure wave both upstreamand downstream from that point at the speed of sound in the liquid. This drop in pressure decreases thedensity of the liquid, which results in a sudden drop in the current value of the liquid’s sonic propagationvelocity (Vs). Vs is measured at each of the upstream and downstream Site Stations (metering points)an average of ten times per second. The decrease in Vs is detected and time stamped with the arrival ofthe pressure wave’s leading edge. Since both Site Stations have synchronized time clocks, the relativearrival times of the pressure waves at each Site Station is easily determined. The accuracy of the locationfunction is dependent on the resolution of time stamping and the sonic propagation velocity of 1500meters per second. The leak will be located within +/- 150 meters, providing that:
a. The pressure wave table is able to travel the entire pipeline segment.
b. The magnitude of the pressure transient must be greater that the pressure fluctuations duringnormal pipeline operation.
ENT
ENT

2-39
1010DVNFM-3CSection 2
Using the [Sonilocate] Menu Item
NOTE: The Sonilocator function is only operational with a Siemens Master Station and FUS1010flowmeter.
To access the Sonilocator function proceed as follows:
� At the [Meter Type] Menu, press the <Right Arrow> key and then <ENT> to select the desiredPath (e.g., Dual Path Flow).
� In the [Dual Path Flow] Menu, press the <Down Arrow> key. Scroll to the [Operation Adjust]menu cell. Press the <Right Arrow> to select it.
Siemens Dual Path BCD
Conforms Operation to user Preferences
Channel /Path Setup
Pipe Data
Gas Parameters
Pick/Install Xdcr
Operation Adjust
Flow/Total Units
Data Span/Set/Cal
Stripchart Setup
Datalogger Setup
I/O Data Control
Diagnostic Data
Dual Path Flow
� Press the <Down Arrow> key and scroll to the [SL Rate] menu cell.
� Press the <Right Arrow> key and then the <Up/Down> key to scroll to the desired Slew Rateresolution. Press the <ENT> key to select it.
� Verify [SL Rate] resolution is selected (> symbol will appear to left of menu item).
� Continually press the <Left Arrow> key to return to main menu.
Siemens Dual Path BCD
Damping Control Smart Slew
Deadband Control 0.000
Memory/Fault Set Memory
Memory Delay <sec> 120
SL Rate >50 mS
Operation Adjust

2-40
1010DVNFM-3CSection 2
IMPORTANT
The Sonilocator function will not operate unless the [Sonilocate] menu item is selected in theDatalogger Setup menu.
To select the [Sonilocate] menu item, proceed as follows:
� At the [Meter Type] Menu, press the <Right Arrow> key and then the <ENT> key to select thedesired Path (e.g., Dual Path Flow).
� In the [Dual Path Flow] Menu, press the <Down Arrow> key and scroll to the [Datalogger Setup]menu cell. Press the <Right Arrow> to select it.
Siemens Dual Path BCD
Conforms Operation to user Preferences
Channel /Path Setup
Pipe Data
Gas Parameters
Pick/Install Xdcr
Operation Adjust
Flow/Total Units
Data Span/Set/Cal
Stripchart Setup
Datalogger Setup
I/O Data Control
Diagnostic Data
Dual Path Flow
� Press the <Up/Down Arrow> key and scroll to the [Datalogger Data] menu cell.
� Press the <Right Arrow> key to highlight Datalogger Data option list items.
� Press the <Up/Down Arrow> key and scroll to the [Sonilocate] menu item. Press the <ENT> keyto select it. (A + sign will appear to the left of the menu item.) If desired, press <CLR> key todeselect menu item.
� Continually press the <Left Arrow> key to return to the main menu.
Siemens Dual Path BCD
Datalogger Mode Off
Datalogger Data On
Log Time Interval 1 Min.
Datalogger Events None
Display Datalogger Off
Datalogger Setup
Siemens Dual Path BCD
Datalogger Mode +Sonilocate
Datalogger Data +Site Id
Log Time Interval +Date
Datalogger Events +Time
Display Datalogger Flow
+Average Flow
Raw Flow
Total
Vs
Valc
Aeration
Datalogger Setup
Select Datalogger Data

2-41
1010DVNFM-3CSection 2
2.6 THE FLOW/TOTAL UNITS MENU
The Flow/Total Units menu is available after selecting a meter type and measurement channel. Use theFlow/Total Units menu to select energy and volumetric flow units and an associated time base for theenergy and flow rate and total outputs. After making your selections, a view-only menu cell shows theresultant scaling. Another menu cell lets you adjust the output resolution by selecting a display range.
This system provides three totalizer display modes:
POSFLOW Positive (forward) energy/flow total onlyNEGFLOW Negative (reverse) energy/flow total onlyNETFLOW The net of the Positive and Negative energy/flow (default)
Clears the Batch Sample totalizer register. SeeBatch/Sample Total paragraph 2.6.11.
Clears the Makeup Latch. See paragraph 2.7 TheData Span/Set/Cal Menu and subparagraph 2.7.1Span Data.
*Use the <F1> key as the “Lead-in command” for 4-Path Totalizer operations.
TOTALIZER CONTROLS (the “n” in <Fn> = channel number)*
CLEAR(Makeup Latch)
LAPTOT(Totalizer snapshot)
NOTOT(Totalizer Freeze)
Resetting the Totalizer registers clears all total data accu-mulated during operation.
Note: In Dual Path mode, the Totalizer operates only onthe virtual system channel (Ch 3). Therefore in this case,the CLEAR trigger would be <F3> <1>.
CLEAR(also clears overflow)
F1
F2
F3
F4
6
F1
F2
F3
F4
4
F1
F2
F3
F4
3
F1
F2
F3
F4
2
F1
F2
F3
F4
1
Invoking the NOTOT command disables the Totalizer. Total-ization will not resume until you repeat the Fn and Numeric2 key sequence. When you activate NOTOT, an N precedesthe TOTAL symbol (i.e., [NTOTAL]) on the LCD Screen.
The LAPTOT command freezes the Totalizer screendisplay. However, the flow computer will continue toupdate its internal registers. The flow computer will showthe current total when you repeat the F1-Numeric 3 keysequence. When you activate LAPTOT, an L precedes theTOTAL symbol (i.e., [LTOTAL]) on the LCD Screen.
CLEAR(Batch/Tot Register)

2-42
1010DVNFM-3CSection 2
Flow/Total Units Flow Volume Units Gallons (US)LitersCubic FeetCubic MetersCubic InchesCubic CmOunces (U.S.)Imperial Gal31.0 GAL BBL31.5 GAL BBL42.0 GAL BBL55 GAL DrumAcre-feetPoundsKilogramsTonsMetric TonsFt/Sec (Vel)m/Sec (Vel)
Std Vol Corr NoYes
Flow Time Units MINHRDAYSEC
Flow Display Range AutorangeHigh
Flow Display Scale mGAL/MINGAL/MINKGAL/MIN
Total Volume Units Same list asFlow Volume Units
Std Vol Corr NoYes
Totalizer Scale GALKGALmGAL
Total Resolution 0000000X00000X00000000X0
Totalizer Mode NEGFLOWNETFLOWPOSFLOW
Batch/Sample Total x.xxx (numeric entry)
THE FLOW/TOTAL UNITS MENU STRUCTURE
��
��
��
��
���
� �
�
�
����
�
�
�
�
�
�
�
���
�
�
��
��
�

2-43
1010DVNFM-3CSection 2
2.6.1 FLOW VOLUME UNITS
The [Flow Volume Units] option list allows you to select the rate units the meter uses to report volumetricor mass flow. If you select mass units, the meter uses the specific gravity parameter (see ApplicationClass section) to convert volumetric flow to mass flow. The default English Units is [Gallons].
To select a Volumetric or Mass Unit:
To access the [Flow Volume Unit] option list press
To move the cursor to the required units press
To store selection press
2.6.2 STD VOL CORR.
The [Std Vol Corr.] menu cell (Standard Volume Correction) allows you to enable the 1010 to computecompensated flow rate. This requires a dynamic temperature input (via RTD or analog input) and pres-sure input if pressure varies significantly.
To enable or disable the Std Vol Corr.:
Press to access the [Std Vol Corr.] option list.
Use to move the cursor to the required selection (NO or YES).
Press to store selection.
2.6.3 FLOW TIME UNITS
The [Flow Time Units] option list allows you to select a flow display time base. The system default is[Minutes]. If this suits the application, press to bypass this menu cell.
ENT
ENT
Flow Volume Units Gallons <US>
Std Vol Corr. NoFlow Time Units MINFlow Disp Range AutorangeFlow Disp Scale GAL/MINTotal Vol Units Gallons <US>
Std Vol Corr. NoTotalizer Scale KGALTotal Resolution 00000x00Totalizer Mode NETFLOWBatch/Sample Total 0.000
Siemens 2 Channel [1] FLOW1
Choose desired Flow rate volume units
Flow/Total Units
Use this menu cell to enter avolume accumulation for thebatching or sampling totalizerrelay trigger.
Use these menu cellsto set the scaling for theflow rate and flow totaloutputs.
Use this menu cell toselect how the totalizeraccumulates flow.
Use this menu cell to set theresolution of the totalizer.
Use this menu cell to selecteither volumetric or mass flow
total units.
Use this menu cell to select arange for the flow rate display
screen.
Use this menu cell to select atime base for the flow rate
units.
Use this menu cell to selecteither volumetric or mass flow
rate units.

2-44
1010DVNFM-3CSection 2
To select a Flow Time Unit:
To access the [Flow Time Units] option list press
To move the cursor to the required time units press
To store the time units press
2.6.4 FLOW DISPLAY RANGE
The [Display Range] option list offers a choice of [Autorange] (default), or [High] range. The Autorangeselection increases resolution automatically at low flow rates and reduces resolution at high flow ratesas required to prevent data overflow. If you select [High] range, the meter controls its screen resolutionto prevent data overflow at the highest possible flow.
To edit the Display Range:
To access the [Display Range] option list press
To move the cursor to the required display range press
To store selection press
2.6.5 FLOW DISPLAY SCALE
After you select rate units, the meter automatically computes a prefix to provide the best combination ofcapacity and resolution (e.g., KGAL/MIN). The [Flow Display Scale] menu cell shows the results. If thedisplayed scaling is not suitable, you can edit it by accessing the option list. Note that this scaling appliesto all flow rate data displayed on the flow display screen, even if the units do not appear next to the data(because there may not be room on the screen). Therefore, always keep this prefix in mind when youenter flow related data.
To select a different Flow Display Scale:
To access the [Flow Display Scale] option list press
Move the cursor to the desired display scale by pressing
To register selection press
2.6.6 TOTAL VOLUME UNITS
This menu cell allows you to select which units the meter uses for the flow total output. If you select massunits, the meter uses the specific gravity parameter (see paragraph 2.4) to convert volumetric flow tomass flow. The default English Flow Total Units is [Gallons] US]. If this suits the application, press the<Down Arrow> to bypass this menu cell.
To change the default setting:
To access the [Total Volume Units] option list press
To move the cursor to the desired Total volume units press
To store selection press ENT
ENT
ENT
ENT

2-45
1010DVNFM-3CSection 2
2.6.7 STD VOL CORR.
The [Std Vol Corr.] menu cell (Standard Volume Correction) allows you to enable the 1010 to computecompensated flow rate. This requires a dynamic temperature input (via RTD or analog input) and pres-sure input if pressure varies significantly.
To enable or disable the Std Vol Corr.:
Press to access the [Std Vol Corr.] option list.
Use to move the cursor to the required selection (NO or YES).
Press to store selection.
2.6.8 TOTALIZER SCALE
After you select [Totalizer Volume Units], the meter automatically computes a prefix to provide the bestcombination of capacity and resolution (e.g., MGAL/MIN). The [Totalizer Scale] menu cell shows theresults. If the displayed scaling is not suitable, you can edit it by accessing the option list. Note that thisscaling applies to all flow total data displayed on the flow display screen, even if the units do not appearnext to the data (because there may not be room on the screen). Always keep this prefix in mind whenyou enter totalizer-related data.
To select a different Totalizer Scale:
To access the [Totalizer Scale] option list press
Move the cursor to the desired display scale by pressing
To register selection press
2.6.9 TOTAL RESOLUTION
The flowmeter assigns multiplier prefixes for the flow total units you selected (e.g., MGPM). It providesthree resolution (or capacity) levels. Therefore, actual Totalizer display units depend on the selectedmultiplier. Check the total units by accessing the Totalizer Scale menu cell.
If you use the totalizer (TOTCNT) relay output, take into account:
a) The TOTCNT relay output pulses at a maximum rate of 0.5 pulses per sec. (0.5 Hz).
b) The meter sends a totalizer output pulse for every advance of the rightmost visible totalizer digit.
It is possible for a high flow rate to persist long enough to exceed the relay output’s 0.5 Hz rate. If thisoccurs, the meter will store excess pulses in an overflow buffer, and route them back to the relay whenthe flow rate drops enough to allow the TOTCNT output to catch-up. Exceeding the 0.5 Hz rate for longperiods could cause an excessive accumulation of buffered pulses and continue to trip the relay after theflow rate lessens, or even stops. If this occurs, the meter will be unable to indicate the current flow total.Therefore, select a resolution to ensure that, even at the maximum expected flow rate, the TOTCNTpulse will not be activated more than 0.5 times per second for any appreciable length of time. Note thatresetting the Totalizer also clears the overflow buffer.
ENT
ENT

2-46
1010DVNFM-3CSection 2
NOTE: NETFLOW (default) is best for applications where there may be zero flow for long peri-ods. It minimizes false Totalizer register increments due to data scatter. Press the <DownArrow> to accept the default setting.
To select a Totalizer Mode:
To access the [Totalizer Mode] option list press
Move the cursor to the required Totalizer mode by pressing
To store selection press
2.6.11 BATCH/SAMPLE TOTAL
The flowmeter maintains a separate totalizer register for Batching or Sampling applications. Unlike theFlow Total registers, you cannot access this register directly. It is used for relay control only. If you assignthe system relay to this function, a momentary (200 mS) relay pulse occurs whenever the BATCHTOTregister accumulates a specified liquid quantity. You enter the total flow volume required to activate therelay, in the Batch/Sample Total menu cell. The numeric entry must reflect the selected flow total units.The Totalizer Display Scaling menu cell shows the applicable flow total units. The sign of the Batch/Sample Total determines positive or negative accumulation.
NOTE: The Batch/Sample total relay requires the same consideration for exceeding the maxi-mum pulse rate as the TOTCNT relay (see Total Resolution).
To enter a Batch/Sample Volume:
To activate numeric entry press
Use the numeric keys to type the desired Batch/Sample TOT accumulation.
To store data press
2.7 THE DATA SPAN/SET/CAL MENU
This menu becomes available after picking a Meter Type and Measurement Channel. However, somefunctions will only be active after the transducers are installed and operating properly. Use the [DataSpan/Set/Cal] menu to set the range for analog outputs and setpoints for Alarm relay outputs. Addition-ally, the [Calibrate Flowrate] menu allows you to apply external adjustments to the meter’s intrinsicprimary outputs.
To change the default resolution:
To access the [Total Resolution] option list press
Move the cursor to the required resolution press
To store selection press
2.6.10 TOTALIZER MODE
The Totalizer function operates in any of the modes listed below:
ENT
ENT
ENT
MODE FLOW DIRECTION NOTESPOSFLOW positive flow Accumulates flow in positive direction only
NEGFLOW negative flow Accumulates flow in reverse direction onlyNETFLOW positive or negative Adds to positive total; subtracts from reverse total

2-47
1010DVNFM-3CSection 2
Data Span/Set/Cal Span Data *PGEN P/(Units) xxxx.xxx (numeric entry)Max Flow x.xxx (numeric entry)Min Flow x.xxx (numeric entry)Max Liquident x.xxx (numeric entry)Min Liquident x.xxx (numeric entry)Max ROC. x.xxx (numeric entry)Min ROC. x.xxx (numeric entry)Max Vs m/s x.xxx (numeric entry)Min Vs m/s x.xxx (numeric entry)Max S.G. x.xxx (numeric entry)Min S.G. x.xxx (numeric entry)Max API x.xxx (numeric entry)Min API x.xxx (numeric entry)Max Kg/m3 x.xxx (numeric entry)Min Kg/m3 x.xxx (numeric entry)Max Base S.G. x.xxx (numeric entry)Min Base S.G. x.xxx (numeric entry)Max Base API x.xxx (numeric entry)Min Base API x.xxx (numeric entry)Max Base Kg/m3 x.xxx (numeric entry)Min Base Kg/m3 x.xxx (numeric entry)Max Viscosity cS x.xxx (numeric entry)Min Viscosity cS x.xxx (numeric entry)Max Temperature x.xxx (numeric entry)Min Temperature x.xxx (numeric entry)
Set Alarm Levels High Flow (Units) x.xxx (numeric entry)Low Flow (Units) x.xxx (numeric entry)High S.G. x.xxx (numeric entry)Low S.G. x.xxx (numeric entry)High API x.xxx (numeric entry)Low API x.xxx (numeric entry)High Kg/m3 x.xxx (numeric entry)Low Kg/m3 x.xxx (numeric entry)High Base S.G. x.xxx (numeric entry)Low Base S.G. x.xxx (numeric entry)High Base API x.xxx (numeric entry)Low Base API x.xxx (numeric entry)High Base Kg/m3 x.xxx (numeric entry)Low Base Kg/m3 x.xxx (numeric entry)High Viscosity cS x.xxx (numeric entry)Low Viscosity cS x.xxx (numeric entry)High Temperature x.xxx (numeric entry)Low Temperature x.xxx (numeric entry)Interface Vs m/s x.xxx (numeric entry)Aeration % x.xxx (numeric entry)Makeup Latch OFF
ONInterface Alarms ROC Alm Set m/s
Interval SecsRelay Hold timeHigh LiquIdentLow LiquIdent
Calibrate Flowrate IntrinsicKc x.xxx (numeric entry)
�
�
�THE DATA SPAN/SET/CAL MENU STRUCTURE
(continued)
�
�
�
�
�
�
�
�
�
��
�
�
*Available in Custody Transfer meters only.

2-48
1010DVNFM-3CSection 2
Siemens Quad Path SITE1
Define data Alarm thresholds
Data Span/Set/Cal
Span DataSet Alarm LevelsInterface AlarmsCalibrate Flowrate IntrinsicCalib. Table 1Calib. Table 2Calib. Table 3
Use this menu to definesetpoints for the alarmrelay outputs.
Use this menu to set thelow and high range for
analog outputs.
Use this menu cell toenter a calibration
slope factor forvolumetric flow (Vfo).
Use these menu cells toenter Index Variables and
their Set Points, activateand clear tables.
THE DATA SPAN/SET/CAL MENU STRUCTURE (continued)Data Span/Set/Cal Calib. Table 1 Index Variable 1 Flow
VsLiqidentViscosity (cS)Viscosity(cP)APIS.G.ValcVaerTemp1Reynolds #PressureAux
Calib. Table 1 New Point Cal. Index Value x.xxxPosFlow Corr x.xxxNegFlow Corr x.xxxAccept/Clear Accept Pt.
Clear Pt.Table Active 1 NoClear Table 1 No
YesCalib. Table 2 Index Variable 2 Same List as
Index Variable 1Calib. Table 2 New Point Cal. Index Value x.xxx
PosFlow Corr x.xxxNegFlow Corr x.xxxAccept/Clear Accept Pt.
Clear Pt.Table Active 2 NoClear Table 2 No
YesCalib. Table 3 Index Variable 3 Same List as
Index Variable 1Calib. Table 3 New Point Cal. Index Value x.xxx
PosFlow Corr x.xxxNegFlow Corr x.xxxAccept/Clear Accept Pt.
Clear Pt.Table Active 3 NoClear Table 3 No
Yes
�
�
�
�
�
�
�
� ��
��
�
�
��
�
�
��
�
�
�
�
�
�
�
�
�
�
�
���
�

2-49
1010DVNFM-3CSection 2
Vfab is the absolute magnitude of the volumetric flow rate (Vfo). Thereare no menu cells provided to span this output. Vfab shares the Vfo spanentries. The Vfab minimum span is always zero. The maximum span forVfab is the largest absolute value of either the min. or the max. flow rate(Vfo) entries. For example, a span between +10 GPM and -30 GPM, spansthe Vfab output from 0 GPM to 30 GPM.
VfabSpanned AbsoluteVolumetric FlowRate:
Vs is the sonic velocity in meters-per-second (m/s) of the flowing liquid.The min. and max. Vs entries establish the Vs span. Max Vs (m/s) de-fines 100% of span. The Min Vs (m/s) defines 0% of span.
VsSpanned LiquidSonic Velocity:
The minimum and maximum flow rate entries establish the Vfo span. TheMax Flow menu cell sets 100% of span. The Min Flow menu cell sets 0%of span. Use signed numbers for bi-directional spanning. Note that nega-tive (reverse) flow always is lower than positive flow, whatever its abso-lute magnitude. For example, for a flow measurement range of -30 GPMto +10 GPM, the 4 mA span will be -30 GPM, and the 20 mA span will be+10 GPM.
VfoSpanned Volumetric
Maximum span values represent: Minimum span values represent:100% of span 0% of spanCurrent output of 20 mA Current output of 4 mAVoltage output of 10 Vdc Voltage output of 0 VdcPulse output of 5000 Hz Pulse output of 0 Hz
2.7.1 SPAN DATA
The Span Data menu allows you to set 0% and 100% output limits for volumetric flow (Vfo), absoluteflow (Vfab) and sonic velocity (Vs). Each menu cell shows appropriate rate units and time base. If youchange flow rate units after spanning the system, the computer automatically updates the output datasetup to reflect the change. Span limits apply to both the analog outputs and the on-screen stripchart.The flow outputs operate as follows:
PGEN
The [PGEN P/Unit Volume] menu cell entry controls a digital output pulse function and is available inCustody Transfer units only (designated by a “C” in their part number). It allows the assigning of PGENdigital signal pulses per unit of volume. For example, 1000 output pulses per unit of liquid.
The default PGEN value is configured to provide a 5000 Hz output frequency at a flow velocity of 100 ft/sec (30 meters/sec).
NOTE: The unit of volume is determined by the Volume Units initially selected from the [TotalVolume Units] menu cell option list.

2-50
1010DVNFM-3CSection 2
1010DVCDN(Expanded 1010N-7 I/O Module)
Installation Drawing 1010N-7-7 (Sheet 3 of 3)(Ultra Performance Flowmeters)
PIN# SIGNAL FUNCTION NOTES 9 PG1 PRIMARY FREQUENCY OUTPUT / OPEN COLLECTOR Digitally Synthesized10 PG2 PRIMARY FREQUENCY OUTPUT / TTL Pulse Waveform11 PG3 QUADRATURE FREQUENCY OUTPUT / OPEN COLLECTOR12 PG4 QUADRATURE FREQUENCY OUTPUT / TTL
TB2
PGEN Wiring Diagram
The unit must be wired as shown below before assigning PGEN output pulses.
1. TB2-9 & TB2-11 are Open Collector Outputs thatrequire external pull up resistors for operation.See table on next page for External Supply Voltageand suggested resistor value and ratings.
Maximum current into the transistor is 100mA. Maximum Voltage is +36Vdc.
CAUTION: Negative voltages with respect ground willpermanently damage the transistors.
2: TB2-10 & TB2-12 are TTL/CMOS compatible outputs.No pullup resistor is required.
CAUTION: Application of any external voltage, even viaa resistor, could permanently damage thiscircuit.
+5V
+5V
PG1
PG3
PG4
1
32
1
32
PG2
DPGEN_1-Ø1
DPGEN_1-Ø2
DPGEN_2-Ø2
OC PGEN SIGNAL
GROUND
OC PGEN SIGNAL
TTL PGEN SIGNAL
TB2-2 GND[VO1-]
DPGEN_2-Ø1 2
3
4
5
TTL/CMOS
TB2-2 GND[VO1-]
TB2-4 GND[VO2-]
2
3
4
5
TTL/CMOS
SEE TABLE
TTL PGEN SIGNAL
TO END USEREQUIPMENT
GROUNDTO END USEREQUIPMENT
SEE TABLE
TO END USEREQUIPMENT
TB2-4 GND[VO2-]
GROUNDTO END USEREQUIPMENT
GROUND
TB2-09 DPGEN_1-Ø1OPEN COLLECTORREFERENCE PHASE
5-36VDC, 15-20mANOMINAL CURRENTCONSUMPTION
TB2-10 DPGEN_2-Ø1TTL LOGICREFERENCE PHASE
TB2-11 DPGEN_1-Ø2OPEN COLLECTORQUADRATURE PHASE
TB2-12 DPGEN_2-Ø2TTL LOGICQUADRATURE PHASE
5-36VDC, 15-20mANOMINAL CURRENTCONSUMPTION
1010N-1MAIN BOARD
1010N-7K, -7K2 OR -7K3I/O CONNECTION BOARD

2-51
1010DVNFM-3CSection 2
1010N-7K, -7K2 or 7K3 I/O MODULES WITH ULTRA PRECISION FLOWMETERSOPEN COLLECTOR USER RESISTOR RECOMMENDATIONS
USER SUPPLYVOLTAGE
[Vdc]59
1218242836
EXTERNALRESISTOR[Ohms]
270510680
1000150018002400
EXPECTEDCURRENT DRAW [mA]
18.517.617.61816
15.515
RECOMMENDEDRESISTOR WATTAGE
[WATTS]1/21/21/23/41
1-1/41-1/4
REFERENCE
REFERENCE
QUADRATURE LEADS FOR NEGATIVE FLOW
QUADRATURE LAGS FOR POSITIVE FLOW
FOR POSITIVE FLOW
PG3 and PG4 LAGS PG1 and PG2 by 90º
FOR NEGATIVE FLOW
PG3 and PG4 LEADS PG1 and PG2 by 90º

2-52
1010DVNFM-3CSection 2
To change the default PGEN settings:
From the [Span Data] menu press
From the [PGEN P/Unit Volume] menu cell, press to activate the numeric entry.
Use the numeric keys to enter the desired number of PGEN pulses per unit volume.
NOTE: Ensure that the number entered will provide sufficient resolution while remaining withinthe 20 Hz to 5000 Hz pulse frequency range. Note that the PGEN output will stop send-ing pulses at flow rates corresponding to frequencies less than 20 Hz. In this case thePGEN value must be increased.
To store the data press
Max Flow
The [Max Flow] menu cell stores the maximum range for the flow rate output (Vfo). It can be a positiveor negative value. Enter the data using the flow rate units you selected. This entry also spans the un-signed flow variable (Vfab).
To enter the Max. Flow Range Setting:
To activate numeric entry press
Use the numeric keys to type the maximum flow rate (100% of range).
To store the data press
Min Flow
The [Min Flow] menu cell stores the minimum range for the flow rate output (Vfo). It can be a positive ornegative value (to reflect bi-directional flow). However, the minimum span for the unsigned flow (Vfab)is always zero. Enter the data using the flow rate units you selected.
To set the Min. Flow Range:
To activate numeric entry press
Use the numeric keys to type the minimum flow rate (0% of range).
To store data press
The following Span Data items are set in the same way as the two previously shown examples by en-tering numeric values and storing the data.
Max LiquIdent
The [Max LiquIdent] menu cell stores the maximum range value for the LiquIdent function.
Min LiquIdent
The [Min Liquident] menu cell stores the minimum range value for the LiquIdent function.
Max ROC
The [Max ROC] menu cell stores the maximum rate of change range value for the LiquIdent function.
ENT
ENT
ENT

2-53
1010DVNFM-3CSection 2
Min ROC
The [Min ROC] menu cell stores the minimum rate of change range value for the LiquIdent function.
Max Vs m/s
The [Max Vs m/s] menu cell stores the maximum range value (in m/s) for the LiquIdent function.
Min Vs m/s
The [Min Vs m/s] menu cell stores the minimum range value (in m/s) for the LiquIdent function.
Max S.G.
The [Max S. G.] menu cell stores the maximum range value for the specific gravity of a liquid. The specificgravity (S.G.) will be displayed as the maximum on the Stripchart.
Min S.G.
The [Min S.G.] menu cell stores the minimum range value for the specific gravity of a liquid. The specificgravity will be displayed as the minimum on the Stripchart.
Max API
The [Max API] menu cell stores the maximum range for the API number analog span.
Min API
The [Min API] menu cell stores the minimum range for the API number analog span.
Max Kg/m3
The [Max Kg/m3] menu cell stores the maximum range of kilograms per cubic meter analog span.
Min Kg/m3
The [Min Kg/m3] menu cell stores the minimum range of kilograms per cubic meter analog span.
Max Base S.G.
The [Max Base S.G.] menu cell stores the maximum range value for the Specific Gravity of a liquid atbase temperature. The specific gravity (S.G.) will be displayed as the maximum on the Stripchart.
Min Base S.G.
The [Min Base S.G.] menu cell stores the minimum range value for the Specific Gravity of a liquid at basetemperature. The specific gravity will be displayed as the minimum on the Stripchart.
Max Base API
The [Max Base API] menu cell stores the maximum range for the API number analog span at basetemperature.
Min Base API
The [Min Base API] menu cell stores the minimum range for the API number analog span at basetemperature.

2-54
1010DVNFM-3CSection 2
Max Base Kg/m3
The [Max Base Kg/m3] menu cell stores the maximum range of Base kilograms per cubic meter analogspan.
Min Base Kg/m3
The [Min Base Kg/m3] menu cell stores the minimum range of Base kilograms per cubic meter analogspan.
Max Viscosity cS
The [Max Viscosity cS] menu cell stores the maximum range for the analog span. The viscosity units arecentistokes with no alternatives offered.
Min Viscosity cS
The [Min Viscosity cS] menu cell stores the minimum range for the analog span. The viscosity units arecentistokes with no alternatives offered.
Max Temperature
The [Max Temperature] menu cell stores the maximum temperature range for the analog span. If metricpreferences are selected prior to site creation the temperature units will be in Centigrade. If Englishpreferences are selected prior to site creation the temperature units will be in Fahrenheit.
Min Temperature
The [Min Temperature] menu cell stores the minimum temperature range for the analog span. If metricpreferences are selected prior to site creation the temperature units will be in Centigrade. If Englishpreferences are selected prior to site creation the temperature units will be in Fahrenheit.
2.7.2 SET ALARM LEVELS
The Set Alarm Levels menu allows you to select system alarm functions. Alarms appear locally on theLCD digital display. In addition, you can use the Relay Setup menu to assign those functions to thesystem’s relays. You may select from high or low energy or flow rate, liquid interface (Vs) and liquidaeration alarm functions. Entry of all alarm setpoints is accomplished using the selected rate units. Youcan enable or disable a Makeup Alarm Latch to keep the makeup alarm active until you reset it manuallyby an <Fn>6 simultaneous key press.
To access the Alarm Setpoints menu press
High Flow
The [High Flow] menu cell stores the maximum range for the analog span.
To set the High Flow alarm value:
To activate numeric entry press
Use the numeric keys to type the High Flow value.
To store the data press ENT

2-55
1010DVNFM-3CSection 2
Low Flow
The [Low Flow] menu cell stores the minimum range for the analog span.
To set the Low Flow alarm value:
To activate numeric entry press
Use the numeric keys to type the Low Flow value.
To store the data press
The following Alarm Relay Setpoints are set in the same way as the two previously shown examples byentering numeric values and storing the data.
High S.G.
This selection sets the High S.G. alarm function for the specific gravity of a selected liquid.
Low S.G.
This selection sets the Low S.G. alarm function for the specific gravity of a selected liquid.
High API
The [High API] menu cell sets the high API alarm relay setpoint for the API number analog span.
Low API
The [Low API] menu cell sets the low API alarm relay setpoint for the API number analog span.
High Kg/m3
The [High Kg/m3] menu cell sets the high alarm relay setpoint for the kilograms per cubic meter analogspan.
Low Kg/m3
The [Low Kg/m3] menu cell sets the low alarm relay setpoint for the kilograms per cubic meter analogspan.
High Base S.G.
The [High Base S.G.] menu cell sets the high alarm relay setpoint for the Specific Gravity of a liquid atbase temperature.
Low Base S.G.
The [Low Base S.G.] menu cell sets the low alarm relay setpoint for the Specific Gravity of a liquid at basetemperature.
High Base API
The [High Base API] menu cell sets the high API alarm function setpoint for the API number analog spanat base temperature.
ENT

2-56
1010DVNFM-3CSection 2
Low Base API
The [Low Base API] menu cell sets the low API alarm relay setpoint for the API number analog span atbase temperature.
High Base Kg/m3
The [High Base Kg/m3] menu cell sets the high alarm relay setpoint for kilograms per cubic meter atbase temperature.
Low Base Kg/m3
The [Low Base Kg/m3] menu cell sets the low alarm relay setpoint for kilograms per cubic meter at basetemperature.
High Viscosity cS
The [High Viscosity cS] menu cell sets the high liquid viscosity alarm relay setpoint. The viscosity units arecentistokes with no alternatives offered.
Low Viscosity cS
The [Low Viscosity cS] menu cell sets the low liquid viscosity alarm relay setpoint. The viscosity units arecentistokes with no alternatives offered.
High Temperature
The [High Temperature] menu cell sets the high temperature alarm relay setpoint. If metric preferencesare selected prior to site creation the temperature units will be in Centigrade. If English preferences areselected prior to site creation the temperature units will be in Fahrenheit.
Low Temperature
The [Low Temperature] menu cell sets the low temperature alarm relay setpoint If metric preferencesare selected prior to site creation the temperature units will be in Centigrade. If English preferences areselected prior to site creation the temperature units will be in Fahrenheit.
Interface Vs m/s
The [Interface Vs m/s] menu cell sets the Interface Vs alarm relay setpoint. Relay changes state whenvariable exceeds users setpoint.
Aeration %
The 1010DVN surpasses all other transit-time systems in its ability to operate with substantial aeration(caused by entrained gases, mixing condition or cavitation). Some applications may require an alarmindication if aeration exceeds a particular level. The meter detects this aeration level and provides thisdata as an output. The aeration percentage triggers the alarm relay whenever it meets or exceeds thethreshold you set in this menu cell. The aeration percentage (Vaer %) appears in the [Liquid Data] menucell of the Diagnostic Data Menu. The digital display screen also shows the current aeration percentage.
NOTE: Severely aerated conditions may induce meter fault. The 50% default usually allowsenough leeway for continued operation. For intermittent faults, see memory interval inthe Output Control menu.

2-57
1010DVNFM-3CSection 2
To set the Aeration % Alarm:
To move the cursor to activate numeric entry press
Use the numeric keys to type the Aeration percentage setpoint.
To store data press
Makeup Latch
A fault condition (caused by an empty pipe or a transient loss of power, etc.) could temporarily interruptoperation. After recovery from the fault, the meter executes an in-process makeup to restore operatingparameters. During the makeup, the meter sets a Makeup Alarm flag, which clears upon completion.Therefore, unless you were monitoring the unit continuously, you could miss the fact that an In-processMakeup occurred. The Makeup Alarm Latch alerts you that the system implemented a Makeup by hold-ing the Makeup Alarm active until you reset it manually by the simultaneous keystrokes: <Fn>6 (where“n” represents the measurement channel). In addition, if the Datalogger is active with Status Alarmsselected, generating a Datalogger report will reset the Makeup Alarm Latch. This ensures that the Alarmdoes not appear on succeeding Datalogger reports. A Makeup Alarm appearing on a subsequent reportindicates that an In-Process Makeup must have occurred since the last Datalogger report.
To enable or disable the Makeup Latch:
To access the [Makeup Latch] option list press
Move the cursor to select either [On or Off] by pressing
To turn Makeup Latch [On] or [Off] press
2.7.3 INTERFACE ALARMS
The [Interface Alarms] menu cell is selected to monitor the sonic velocity (Vs). It is a constant rate ofchange alarm function that monitors the LiquIdent setting. The alarms appear locally on the LCD digitaldisplay.
ROC Alm Set m/s
Use the [Roc Alm Set m/s] menu item to set the desired numerical alarm relay setpoint in meters persecond. For example, if the alarm relay setpoint value is set to 50 m/s, when the Vs varies by 50 m/sfrom the current LiquIdent setting for the assigned time interval (e.g., 10 seconds), the alarm relay willtrip.
Interval Secs
Select the [Interval] menu item to set the time interval in seconds. This time interval value affects howlong the variation in [Rate Value m/s] will last before the alarm relay is tripped.
Relay Hold Time
The [Relay Hold Time] menu item allows the setting of the time in seconds that the alarm relay will stayclosed.
High LiquIdent
Use the [High LiquIdent] menu item to set the numerical high limit span of the LiquIdent function.
Low LiquIdent
Use the [Low LiquIdent] menu item to set the numerical low limit of the LiquIdent function.
ENT
ENT

2-58
1010DVNFM-3CSection 2
2.7.4 CALIBRATE FLOWRATE AND CALIBRATION TABLES
System 1010DV equipment provides three ways to condition the calibration performance of its flowrateoutput: Intrinsic (factory set), Kc, and Calibration Tables 1 through 3. Access to these calibration optionsis found in the [Calibrate Flowrate] menu cell and the three [Calib. Table] menu cells of the Data Span/Set/Cal menu (refer to Data Span/Set/Cal menu on next page).
The 1010’s intrinsic calibration is excellent as confirmed by numerous laboratory and field trialsunder diverse application conditions. Controlotron can confidently say that in any given appli-cation, the majority of conventional flowmeters can not match the system’s measurementrange or its linearity.
Intrinsic
When selected, the meter uses no slope adjustment at all. Output data is still zeroed and corrected forReynolds number, but no slope adjustment is imposed on the meter’s flow register.
Some applications may require an output adjustment to match an official external reference. The [Cali-brate Flowrate] menu allows you to select a calibration mode. The right-hand column shows the activecalibration mode. You can select Intrinsic (factory) and Kc (Slope Correction) Calibration. Selecting eitherof the external calibration modes will not eliminate the Intrinsic (factory) calibration. You can use thismenu cell to switch between Intrinsic and Kc at any time.
Kc Calibration
For most applications, the measured flow range produces a linear meter response. Therefore, the Kc(slope correction) calibration is the preferred method since it only requires a single correction factor forall the flow rates encountered.
NOTE: Changing the calibration can cause profound changes in a flowmeter’s operating charac-teristics. Use only the most respected flow standard to obtain a correction factor. Thepercentage you enter must provide an accurate and consistent shift across the entireflow range anticipated for the application.
Siemens 2 Channel [1] Channel 1
Interface Alarms
ROC Alm Set m/s 50.0Interval Secs 10Relay Hold Time 30High Liquident 2000Low Liquident 1000

2-59
1010DVNFM-3CSection 2
Kc Factor
To obtain the Kc factor, compare flow total data taken simultaneously from the 1010 and a referencemeter whose accuracy meets the required standard. Allow both meters to accumulate flow total datalong enough to average out any differences due to flow fluctuation between the two meter locations.Compare outputs of the two totalizers to determine percentage increase (+) or decrease (-) that isnecessary to produce the best average correlation between System 1010 and the reference standard.
Selecting the Kc Factor
When the [Kc] menu cell is selected, the meter imposes this % slope adjustment of its rate output.Output data is zeroed and corrected for the Reynolds number (flow profile compensated), however, inaddition, a percent change in the rate output is imposed based on the data entered in this cell. Thenumber entered by the user is evaluated into a slope correction factor by dividing it by 100 and algebra-ically adding it to 1. The resulting factor is used as a multiplier on the rate register of the instrument. Thusan entry of -3% will multiply the rate register by 0.97, for example.
To calculate Kc:
Data Span/Set/Cal Calibrate Flowrate IntrinsicKc x.xxx
Calib. Table 1 Index Variable FlowVsLiqidentViscosity (cS)Viscosity(cP)APIS.G.ValcVaerTemp1Reynolds #PressureAux
Calib. Table 1 New Point Cal. Index Value x.xxxPosFlow Corr x.xxxNegFlow Corr x.xxxAccept/Clear Accept Pt.
Clear Pt.Table Active 1 NoClear Table 1 No
Yes
Data Span/Set/Cal Menu (Calibration Section)
�
� �
�
�
��
�
�
�
��
�
�
��
�
�
Kc = x 100Actual Rate
Indicated Rate -1Kc = x 100
To enter the Kc Factor:
To enable numeric entry press .
Use the numeric keys to type the required Kc (as calculated above). Note that the Kc value canbe negative or positive. Enter the - or + sign first, then type in the calibrated value.
To store the data press . Note that Kc now appears in the right-hand column of the [CalibrateFlow Rate] menu cell with its new value. Also note that this Kc value can be viewed on the siteprintout.
ENT

2-60
1010DVNFM-3CSection 2
Calibration Tables 1 through 3
System 1010DV instruments offer a unique methodology by which a particular flow response of aninstrument may be linearized or optimized by tabulating the results of a series of calibration exercises orcollected batch data points. In essence, the meter allows the user to select any of a wide variety ofsystem variables (flowrate, pressure, viscosity, etc.) as a pointer into a table of calibration factors (up to32). As the system variable is updated, the value of the table’s output factors (or positive and negativeflow) is re-evaluated and used as a modifier for the current rate register. Note that the flow register is stillzeroed and Reynolds number compensated normally and these slope corrections are in addition tothese fundamentals.
NOTE: Kc is still active when this facility is being used.
To install a Calibration Table, proceed as follows:.
1. The user selects a system variable that appears to correlate strongly with calibration shifts observed.
2. A table of values is formed comprised of the values that this index could assume over the range ofsystem operation. Remember, the tables created do not extrapolate beyond their end points, they”clip.”
3. A calibration factor, a number usually close to 1.00, is entered as a positive and a negative flowratecorrection factor (termed PosFlow Corr and NegFlow Corr) for each of the desired index points.
The table may contain up to 32 pairs of these slope correction factors. Note that the Kc factor, unlikethese slope correction factors, is entered as a signed percent change in rate, while these factors aresimply rate multipliers. As points are entered, the point editor will provide list access to the alreadyentered points plus access to the [New Point] menu cell, used to add a new point. The table may becreated in its entirety and then activated by selecting [Yes] in the [Table Active] menu cell. The entiretable may be cleared by selecting [Yes] in the [Clear Table] menu cell.
Note that the meter allows you to use [Aux] as an [Index Variable] input. Effectively you may slopemodulate the meter’s output based on the value of a 4 - 20 mA input signal. Also notable, the interactionbetween the Liquid Table, described elsewhere in this manual, and the calibration table(s) is extremelypowerful. Since the table of slope correction coefficients resides between the meter’s internal flowregister(s) and the flow register, which actually provides reports to the user, poorly formed or defectiveCalibration Tables may severely impact the performance of the instrument. Take precautions beforeenabling these calibration tables. Although we recognize that it is unlikely that all three tables would everbe employed in a real installation, three tables are offered for maximum user flexibility. Since the tablescan be disabled without being destroyed, 2 or 3 optimization strategies may be tested by this means inorder to determine which approach is most effective.

2-61
1010DVNFM-3CSection 2
Siemens 2 Channel [1] Channel 1
Select Data Units or Percent Display
Stripchart Setup
Select Data LiquIdentData Display Data Rate UnitsTime Base 1 secondStripchart Clear Yes
Use this menu cellto select an updateinterval for thestripchart.Use this menu cell
to clear the currentstripchart.
Use this menu cellto select a data
item to display onthe stripchart.
Use this menu cellto select whether
the stripchartshows data as
either a rate or apercentage of
span.
2.8 THE STRIPCHART SETUP MENU
This menu becomes available after picking a Meter Type and Measurement Channel. Use the [StripchartSetup] menu cell to select a data category, the type of scaling and the update interval for the on-screenstripchart display. You can also clear the stripchart screen.
THE STRIPCHART SETUP MENU STRUCTURE Stripchart Setup Select Data LiquIdent
APIKGM3BAPIBKGMViscTempVsValcVaerVsgVfoVfabBSGROC
Data Display Data Rate UnitsPercent of Span
Time Base 1 Second3 seconds6 seconds12 seconds24 seconds1 minute3 minutes6 minutes12 minutes24 minutes1.2 hours
Stripchart Clear NoYes
��
�
�
� �
��
�
�
�
�
�
�
�
�
�

2-62
1010DVNFM-3CSection 2
To select a data item for the stripchart:
To access the [Select Data] option list press
Move the cursor to the desired item by pressing
To store your selection press
2.8.2 DATA DISPLAY
The [Data Display] option list allows you to select a format for the stripchart plot. It offers the choice ofdisplaying data either in the current data rate units or as a percent of span defined in the [Data Span/Set/Cal menu]. [Data Rate Units] menu cell is the default selection.
To select a format for the data display:
To access the [Data Display] option list press
To move the cursor to the required scale unit press
To store your selection press
2.8.1 SELECT DATA
The [Select Data] option list allows you to select a data function for the on-screen stripchart display. Thestripchart provides a data plot using the selected data units and time base. All data items except Valc andVaer use the span settings from the [Data Span/Set/Cal] menu. The following data items are available forthe Stripchart Display:
• LiquIdent ................. LiquIdent variable-temperature compensation sonic velocity.
• API .......................... Current API number.
• BAPI ........................ Current API number referenced to base temperature.
• BKGM ....................... Current kilograms per cubic meter referenced to base temperature.
• Visc ......................... (viscosity)
• Temp ....................... (temperature)
• Vs ........................... (sonic velocity)
• Valc ........................ (signal amplitude)
• Vaer ........................ (aeration/cavitation)
• Vsg ......................... (spanned flow) *default
• Vfo .......................... (spanned flow) *default
• Vfab ........................ (spanned unsigned flow magnitude)
• BSG ......................... Current Specific Gravity referenced to base temperature.
• ROC ........................ Rate Of Change. Current numerical alarm relay setpoint in meters persecond.
ENT
ENT

2-63
1010DVNFM-3CSection 2
2.8.3 TIME BASE
The [Time Base] option list defines the stripchart x-axis display interval. The stripchart plots an average ofreadings obtained during the elapsed time between reports. Stripchart resolution is 1 data point perpixel, of which there are approximately 100 on the short stripchart plot and approximately 200 on thefull screen stripchart plot. Five pixel reports occur between major stripchart divisions.
NOTE: The stripchart display identifies the “real time” when the computer records the mostrecent graduation. You can time-stamp any graduation by counting back in graduationintervals. The default interval setting is 1 second.
To select a Time Base:
To access the [Time Interval] option list press
Move the cursor to the desired interval by pressing
To store your selection press
2.8.4 STRIPCHART CLEAR
Use this menu cell to clear the stripchart. Selecting [Yes] erases all current stripchart data.
To erase the Stripchart plot:
To access the [Stripchart Clear] option list press
Move the cursor to [Yes] by pressing
To clear the current Stripchart plot press
2.9 THE DATALOGGER SETUP MENU
This menu becomes available after picking Meter Type and Measurement Channel.
The integral Datalogger records data for eventual display on Graphics Screen, or for connection to an RS-232 compatible external device (printer, computer, network, etc.). Use Datalogger Setup to select dataitems and real-time events for datalogger reports. You can also set the logging interval, operating modeand screen format. The Datalogger Setup menu allows you to choose time interval-based data catego-ries or event-based status alarms, and to specify the interval between data reports.
View Datalogger reports on the display screen or transmit them via the RS-232 Serial Port to externalprinters and computers. Note that a single-channel meter uses a compression algorithm to maximizedata storage. This disables back scrolling of datalogger reports.
ENT
Datalogger Mode OffDatalogger Data NoneLog Time Interval 1 Min.Data Logger Events NoneDisplay Datalogger Off
Controlotron 2 Channel [1] Path 1
Select datalogger destination
Datalogger Setup
Use this menu cellto select a logginginterval.
Use this menu cell tosend Datalogger reportsto selected a destinationand pick a line wrapmode.
Use this menu cell topick a destination for
Datalogger reports.
Use this menu cell toselect real-time
Datalogger triggers.
Use this menu cell toselect items for
Datalogger reports.
ENT

2-64
1010DVNFM-3CSection 2
*NOTE: For Dual Path Flow, Ch 1+2Flow and Ch1-2 flowmetertypes only.
THE DATALOGGER SETUP MENU STRUCTUREDatalogger Setup Datalogger Mode Off
MemoryRS-232 Output
Datalogger Data NoneSite IdDateTime*Path FlowFlowAverage FlowRaw FlowTotal*Path VsVs*Path ValcValcAerationLiquid NameLiquIdentS.G.APIKg/m3
Base S.G.Base APIBase Kg/m3
*Path AlarmsAlarmsTemperaturePath Delta TAnalog InputsSonilocate
Log Time Interval 5 Sec.10 Sec.15 Sec.30 Sec.1 Min.5 Min.15 Min.30 Min.1 Hr.2 Hr.4 Hr.6 Hr.12 Hr.24 Hr.Demand
Datalogger Events NoneFault AlarmMemoryRelay 4, 3, 2, 1MakeupSpacingEmptyAerationROCFlow Alarm
Display Datalogger OffLine WrapNo Line Wrap
��
�
�
�
�
�
�
�
�
�
� �
�
�
�
�

2-65
1010DVNFM-3CSection 2
2.9.1 DATALOGGER MODE
The [Datalogger Mode] option list allows you to disable Datalogger, transmit reports to an external targetvia RS-232 port, or store selected data for later display. The default setting is [Off]. After enabling theDatalogger, select a data format before generating a report.
To select a Datalogger Mode:
To access the [Datalogger Mode] option list press
Move the cursor to the desired mode by pressing
To store the selection press
2.9.2 DATALOGGER DATA
Set the Datalogger to record any or all of the data offered on the [Datalogger Data] option list shown onnext page. However, recording unneeded data wastes valuable system RAM. We recommend that youalways select [Site ID] (name) and [Time] to identify each line of data.
ENT
If you select Alarms, the Datalogger logs the state of each alarm function upon generating a report. Adash [-] represents an inactive alarm. A letter code represents an active alarm (see next page).
None Default – Datalogging is disabled.
Site ID You entered this site name when you created the site.
Date The report date according to the meter’s real time clock. (Format: MM.DD.YYYY)Time The report time according to the meter’s real time clock. (Format: HH.MM)*
Path Flow The instantaneous flow measured at the time of the report (for Dual Path Flow meters).
Flow The instantaneous flow measured at the time of the report.Average Flow The average flow rate measured since the last report.
Raw Flow The uncompensated flow rate in in/sec2 (only zeroed - no Reynolds number curve applied).Total The total flow accumulation measured at the time of the report.
Path Vs The average liquid sonic velocity since the last report.Vs The average liquid sonic velocity since the last report.
Path Valc The signal strength measured at the time of the report (for Dual Path Flow meters).
Valc The signal strength measured at the time of the report.Aeration The aeration percentage recorded at the time of the report.
Liquid Name Enter name of liquid.
LiquIdent Select LiquIdent function.S.G. Specific Gravity at current operating temperature.
API API number at current operating temperature.
Kg/m3 Kilograms per cubic meter at current operating temperature.Base S.G. Specific Gravity referenced to user selected temperature.
Base API API number referenced to user selected temperature.
Base Kg/m3 Kilograms per cubic meter referenced to user selected temperature.Path Alarms The letter codes of any Path Alarms active at the time of the report (see next page).
Alarms The letter codes of any alarms active at the time of the report (see next page).
Temperature The instantaneous supply and return temperatures at the time for the report.Path Delta T The Up to Down transit-time difference measured at the time of the report (in u/s).
Analog Inputs Any data appearing on an auxiliary input at the time of the report.
Sonilocate Sonilocator Slew Rate in m/s.
*The Time field expands to HH.MM.SS when a logging interval of more than once per minute is selected.

2-66
1010DVNFM-3CSection 2
Alarm Letter Codes and Descriptions
S ....... Spacing ......... Transducer spacing may need re-adjustmentE ....... Empty............ Pipe is emptyR ....... Rate .............. Flow above High setting or below Low settingF ....... Fault .............. Three continuous seconds without new data updateA ....... Aeration......... Current aeration percentage exceeds the alarm setpointM....... Memory......... Last valid reading for a selected interval during Fault conditionK ....... Makeup ......... In-Process Makeup occurredI ........ Interface ........ Liquid Vs exceeds interface alarm setpointP........ Pig ................. Pig passage detected (optional)Z ....... ZeroMatic ...... ZeroMatic signal fault
NOTE: The time interval-based Datalogger records the state of all the alarms at the selectedreport time only. Therefore, if an alarm condition resets before the report time, it wouldnot appear on the report. Use Datalogger Events to log transient alarms. This mode gen-erates a report upon the detection of an alarm event.
To select Datalogger Data items:
To access the [Datalogger Data] option list press . Move cursor to a desired data item bypressing then to select it. Note that a plus sign (+) appears before the item.
To de-select Datalogger Data:
Move the cursor to the data item then press . Note that this removes the plus sign (+) fromthe item.
After selecting/deselecting all desired items press to leave the Datalogger Data option list.
2.9.3 LOG TIME INTERVAL
The Datalogger records a “snapshot” of conditions at each log time interval. Datalogging uses a consid-erable amount of RAM, so only select short log intervals if it is fully justified.
NOTE: The flowmeter maps the first Datalogger report time to an even division of its clock.Subsequent reports will conform to the selected interval.
To set the Log Time Interval:
To access the [Log Time Interval] option list press
Move the cursor to desired interval press
To store your selection press
2.9.4 DATALOGGER EVENTS
The 1010DVN offers “event-based” data logging that operates concurrently with “time interval” baseddata logging. The event-based function generates a Datalogger report upon the triggering of any of thealarms. This is useful for recording transient alarms (e.g., a liquid interface, or a short aeration alert).
ENT
CLR
ENT

2-67
1010DVNFM-3CSection 2
NOTE: An Alarm Event report will be generated immediately after the transition from a non-alarm to an alarm event. The reverse situation (alarm state to non-alarm state) does nottrigger the event-based Datalogger.
Event-based Datalogger messages conserve memory. However, if you use this feature to monitor alevel such as Flow Alarm, set the alarm threshold high enough to avoid repetitive triggering. You mustselect Site ID (Name) and Time to “time-stamp” the alarm events. Note that on the Datalogger report, a[-] represents a reserved letter code space (inactive alarm) and a letter code represents an active alarm.
To select Datalogger Event items:
To access the [Datalogger Events] option list press . Move cursor to desired item bypressing then to select it. Note that a plus sign (+) appears before the item.
To de-select Datalogger Events:
Move the cursor to the item by pressing then . Note that this removes the plussign (+) from the item.
After selecting all desired items press to leave the [Datalogger Events] option list.
2.9.5 DISPLAY DATALOGGER
Use this menu cell to enable and format the on-screen datalogger. You can allow the report to scroll onthe screen with or without line wrapping. Selecting line wrap, forces a line feed after approximately 40characters. This command is effective only after you select data items and the Datalogger has accumu-lated some data.
To enable the on-screen datalogger display:
To access the [Display Datalogger] option list press
Move the cursor to the desired function.
To invoke the function press
To scroll the on-screen datalogger display:
To display one line at a time press
Use key to scroll down one screen (10 lines) at a time.
Use key to jump to 15 lines of the last screen.
In No-Line Wrap Mode:
Use or to scroll one column to the left or right. Use + or +
to scroll 8 columns to the right or the left. To get out of the display, press
CLR
ENT
ENT
ALT
=
ALT
+
MENU

2-68
1010DVNFM-3CSection 2
NOTE: In single channel 1010DVN meters the Datalogger uses a compression scheme that pre-cludes backward scrolling.
Important point about Datalogger resources and dual-channel systems.
When logging data on both measurement channels simultaneously, the Datalogger stores re-ports in a single common file. It is important that you select Site ID to appear on each line ofdata so that you can always identify which channel generated report.
2.10 THE I/O DATA CONTROL MENU
This menu becomes available after picking a Meter Type and Channel/Path.
Use this menu to assign functions for the meter’s analog outputs and optional inputs. The [Analog OutSetup] menu cell assigns functions to the meter’s current, voltage and pulse rate outputs. Each menucell presents an option list of the available data items. In addition, you can set up the alarm relays, enableand span the analog input ports.
Siemens 2 Channel [1] Channel 1
Assign Data to Analog Outputs
I/O Data Control
Analog Out SetupRelay SetupAnalog Input Setup
Use this menu to enableand span optionalanalog inputs.
Use this menu toassign data functions
to analog outputs.
Use this menu toassign alarm
functions to relayoutputs.
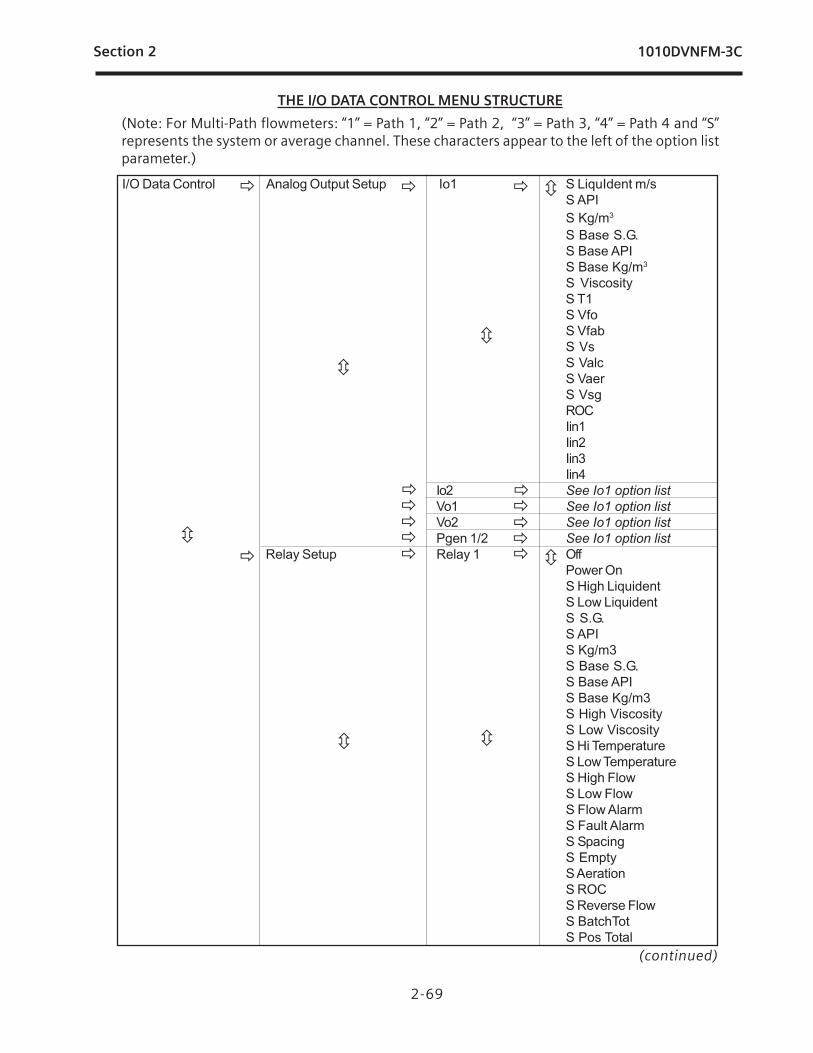
2-69
1010DVNFM-3CSection 2
THE I/O DATA CONTROL MENU STRUCTURE
(Note: For Multi-Path flowmeters: “1” = Path 1, “2” = Path 2, “3” = Path 3, “4” = Path 4 and “S”represents the system or average channel. These characters appear to the left of the option listparameter.)
I/O Data Control Analog Output Setup Io1 S LiquIdent m/sS APIS Kg/m3
S Base S.G.S Base APIS Base Kg/m3
S ViscosityS T1S VfoS VfabS VsS ValcS VaerS VsgROCIin1Iin2Iin3Iin4
Io2 See Io1 option listVo1 See Io1 option listVo2 See Io1 option listPgen 1/2 See Io1 option list
Relay Setup Relay 1 OffPower OnS High LiquidentS Low LiquidentS S.G.S APIS Kg/m3S Base S.G.S Base APIS Base Kg/m3S High ViscosityS Low ViscosityS Hi TemperatureS Low TemperatureS High FlowS Low FlowS Flow AlarmS Fault AlarmS SpacingS EmptyS AerationS ROCS Reverse FlowS BatchTotS Pos Total
�
�
�
�
�
�
��
�
��
�
�
(continued)
� �� �
� �
��

2-70
1010DVNFM-3CSection 2
2.10.1 ANALOG OUTPUT SETUP
The FUH1010DVN provides current, voltage and pulse-rate analog outputs. Analog Output Setup allowsyou to assign data functions for these signals. The flow computer’s terminal strip contains the analogoutput terminals.
THE I/O DATA CONTROL MENU STRUCTURE (continued)
I/O Data Control Relay Setup Relay 1 Neg TotalS FltwarnS Soft FaultS Pig Detect
Relay 2 See Relay 1 listRelay 3 See Relay 1 listRelay 4 See Relay 1 list
Analog Input Setup Iin1 Input OffAuxS.G.APIKg/m3cScPPSIABARAT1 Deg FT1 Deg CT2 Deg FT2 Deg C
4 mA numeric entry20 mA numeric entry
Iin2 See Iin1 above See Iin1 aboveIin3 See Iin1 above See Iin1 aboveIin4 See Iin1 above See Iin1 above
�
� �� �
��
� �
�� ��
S LiquIdent m/s System sonic velocity compensated for temperature.S. Vsg Current liquid specific gravity.S API Current liquid API number.S Kg/m3 Current kilograms per cubic meter.S Base S.G. Current liquid specific gravity at reference temperature.S Base API Current system API at reference temperature.S Base Kg/m3 Current kilograms per cubic meter at reference temperature.S Viscosity System liquid viscosity.S T1 Current liquid temperature.S Vfo System spanned volumetric flow (unsigned)S Vfab System spanned and signed absolute flow.S ROC System alarm relay setpoint numerical rate of change in m/s.S Valc System signal amplitude.
Analog Out Setup Data Categories
(continued)
Io (Isolated current) 4 to 20 mA varies in proportion to an assigned data function. Vo (DC voltage) 0 to 10 Vdc varies in proportion to an assigned data function. Pgen (TTL logic) 0 to 5000 Hz varies in proportion to an assigned data function.
FUH1010DVN Analog Outputs

2-71
1010DVNFM-3CSection 2
Assigning Io Output Functions
The Io analog output is a self-powered, isolated 4-20mA DC signal that varies linearly in relation to a se-lected data function.
CAUTION: Do not connect to a powered loop.
To assign a function for the current output:
From Analog Out Setup, press twice to access the [Io] option list.
Move the cursor to the desired data function by pressing
To store selection press
Assigning Vo Output Functions
The Vo analog output is a 0-10 VDC signal that varies linearly in relation to a selected function.
To assign a function to the voltage output:
To access the [Vo] option list press
Move the cursor to the desired data function by pressing
To store selection press
ENT
NOTE: For Multi-Path flowmeters: “1” = Path 1, “2” = Path 2, “3” = Path 3, “4” = Path4 and “S” represents the system or average channel. These characters appear tothe left of the option list parameter.
S Vaer System aeration number.Iin1, Iin2, Iin3, Iin4 Represents a re-transmit of the analog input signals (e.g.,
Pressure and Temp inputs can be transmitted on the 4/20 mAoutput).
Analog Out Setup Data Categories (continued)
NOTE: For Multi-Channel meters, refer to drawing 1010MN-7 for details. For Expanded I/O mod-ules, refer to drawing 1010N-7-7 and Addendum 1010FMA-14 for details
ENT
Model Number and I/O Module Installation Drawing and Page NumberFUH1010DVN 1010N-2 -7 (Sheet 2 of 2)FUH1010DVN with 1010N-7 Expanded I/O Module 1010N-7-7 (Sheet 2 of 3)FUH1010DVDN 1010N-2-7 (Sheet 2 of 2)FUH1010DVDN with 1010N-7 Expanded I/O Module 1010N-7-7 (Sheet 2 of 3)FUH1010DVCDN Custody Transfer Flowmeter 1010N-7-7 (Sheet 3 of 3)FUH1010DVCDWX Custody Transfer Flowmeter 1010N-7-7 (Sheet 3 of 3)
Table To Determine Proper I/O Installation Drawings

2-72
1010DVNFM-3CSection 2
ENT
Assigning Pgen Output Functions
The Pgen analog output is a buffered TTL-compliant pulse rate signal, similar to the pulse outputs of flow-meters such as turbines. It varies linearly from 0-5000 Hz in relation to a selected data function.
NOTE: The analog Pgen function is not available in Custody Transfer flowmeters. See paragraph2.7.1 for details.
To assign a function to the Pgen output:
To access the [Pgen] option list press
Move the cursor to the desired data function by pressing
To store selection press
PULSE OUTPUT (Pgen Wiring)
FUH1010DVN & FUH1010DVDN with 1010N-2 ModulesInstallation Drawing 1010N-2-7 (Sheet 2 of 2)
PIN# SIGNAL FUNCTION NOTES11 PGEN 1+ FREQUENCY OUTPUT 1 0 - 5000 Hz, 5 Volt Logic, Square Waveform12 PGEN 1- REF. GROUND13 PGEN 2+ FREQUENCY OUTPUT 214 PGEN 2- REF. GROUND
TB2
FUH1010DVN & FUH1010DVDN with Expanded 1010N-7 I/O ModulesInstallation Drawing 1010N-7-7 (Sheet 2 of 3)
(Standard, High Performance and Enhanced Performance Flowmeters)
PIN# SIGNAL FUNCTION NOTES 9 PG1 FREQUENCY OUTPUT 1 0 - 5000 Hz, 5 Volt Logic, Square Waveform10 PG2 REF. GROUND11 PG3 FREQUENCY OUTPUT 212 PG4 REF. GROUND
TB2

2-73
1010DVNFM-3CSection 2
2.10.2 RELAY SETUP
Use this menu to assign a function to channel relays. The FUH1010DVN supports 2 types of relayoutputs, Alarm Relay and Pulse Relay. Alarm Relay outputs operate in “fail-safe” mode. The relay(s) areenergized under normal conditions - an alarm condition causes the relay(s) to de-energize until alarmclears. The Pulse Relay output supports totalizer and batch relay functions. Output is a pulse width ap-proximately 200 ms; maximum activation rate is 2.5 pulses per sec. If totalizer pulses exceed this rate,excess pulses are stored in an overflow register. This allows the relay to “catch up” when flow decreasesenough.
NOTE: Using the key (Totalizer clear command) also clears all channel totalizers plus theoverflow register described in the last paragraph.
Assigning Relay 1, 2, 3 and 4 Functions
The FUH1010DVN, depending on the model, provides four alarm relays. Please refer to the HardwareInstallation Drawing for wiring details. Relays respond to any of the alarm conditions or data functionsincluded on the Relay Option List.
F1
Not Used Not Active
Power Off Power Off alarm occurs when power fails
S High LiquIdent High LiquIdent value relay trip-point.
S Low LiquIdent Low LiquIdent value relay trip-point.
S S.G. Specific Gravity value relay tAPI number relay trip-point.
S Kg/m3 Relay trip-point foor kilograms per cubic meter.
S Base S.G. S.G. value relay trip-point at reference temperature.
S Base API API number relay trip-point at reference temperature.
S Base Kg/m3 Kg/m3 value relay trip-point at reference temperature.
S High Viscosity High liquid Viscosity value relay trip-point.
S Low Viscosity Low liquid Viscosity value relay trip-point.
S High Temperature High temperature value relay trip-point.
S Low Temperature Low temperature value relay trip-point.
S High Flow System flow rate exceeds high flow setpoint.
S Low Flow System flow rate falls below low flow setpoint.
S Flow Alarm System flow rate exceeds or falls below flow setpoints.
S Fault Alarm System loses receive signal (all paths in fault).
S Spacing System transducer spacing needs adjusting.
S Empty Empty pipe alarm.
S BatchTot Batch/Sample total advances.
S Aeration Aeration percentage exceeds alarm setpoint.
S ROC Alarm relay setpoint numerical rate of change in m/s.
S Reverse Flow Flow is in negative direction.
S BatchTot Batch/Sample total advances.
S Pos Total Positive total volume advances 1 digit.
Relay Option List
(continued)

2-74
1010DVNFM-3CSection 2
NOTE: For Multi-Path flowmeters: “1” = Path 1, “2” = Path 2, “3” = Path 3, “4” = Path 4 and “S”represents the system or average channel. These characters appear to the left of theoption list parameter.
To assign functions to Relay 1:
To access the [Relay] option list press
Move the cursor to the desired Relay assignment by pressing
To store selection press . Repeat procedure for all other relays.
2.10.3 ANALOG INPUT SETUP (optional function)
The Analog Input Setup function assigns an active analog input to a measurement channel/path. Themeter provides four DC current input ports for single channel and Dual Path units. The DC current inputranges from a zero level of 4 mA to a full scale of 20 mA. The [Analog Input Setup] menu cell allows youto enable this port and then span it to any desired scaling.
For example, when using the analog input viscosity function the numeric variables might be spanned asfollows: 4mA=1 (water) and 20mA=100 (more viscous liquid). This spanning configuration allows themeter to use this constant numerical change to improve calibration in real time.
The various flowmeter models allow you to associate the analog input to active system variables such asspecific gravity, viscosity and others (see table below).
NOTE: Refer to the Installation Drawings or I/O Module markings for the locations of these in-puts and wiring procedures.
ENT
I/O Data Control Analog Inp Setup Iin1 Input OffAuxcSPSIABARAT1 Deg FT1 Deg CT2 Deg FT2 Deg C
4 mA numeric entry20 mA numeric entry
Iin2/Iin3/Iin4 See Iin1 option list
�
��
�
�
�
�
�
S Neg Total Negative total volume advances 1 digit.
S Fltwarn System fault warning occurs when 1 or more paths are in fault.
S Soft Fault Fault condition - memory mode active.
S Pig Detect Pig detection value relay trip-point exceeded.
Relay Option List (continued)

2-75
1010DVNFM-3CSection 2
Note that the flowmeter recognizes the first analog input variable that is assigned to any given param-eter and ignores any subsequent input with the same assignment. For example, if Iin1 and Iin2 are bothassigned to represent pressure (PSIA), the meter will only use the pressure input from Iin1.
Setting up the Analog Current Input
The first step is to enable the DC current input port.
From the [Analog Input Setup] menu cell:
To access the [Iin] option list press the <Right Arrow> twice.
Move the cursor down to [Aux (n)] press the <Down Arrow> and then <ENT>. This enables theport to receive an input current. The cursor moves to [4 mA].
To enable numeric entry press the <Right Arrow>. Type a numeric value corresponding to a 4mA input signal.
To store the data press <ENT>. This moves the cursor to [20 mA].
To enable numeric entry press the <Right Arrow>. Type the numeric value corresponding to a 20mA input signal. To store the data, press <ENT>.
2.11 THE DIAGNOSTICS DATA MENU
Some Diagnostic Data items require a successful transducer installation and meter initialization to be-come available. These will report [Chan Not Setup] until you complete the installation procedure.
The Diagnostics Data menu provides real-time application and setup data, plus test routines for theselected channel. To receive the best technical support, please be prepared to report any diagnostic dataitem upon request. Note also that these menus contain information that may only be meaningful to ourtechnical support staff.
The available diagnostic data depends on the meter type and channel configuration. All diagnostics areavailable when you select channel 1 or 2 in [Dual Channel Flow], [Ch 1+2 Flow] or [Ch 1-2 Flow]modes. In [Dual Path Flow] mode, all diagnostic items are available for [Path 1] or [Path 2]. Some itemsare not available (N/A) when you select virtual channel [1 and 2]. In addition, selecting virtual Channel 3,in either the [1+2 Flow] or [1-2 Flow] modes will limit the list to flow data only.
2.11.1 MAIN DIAGNOSTICS DATA SCREEN
The Main Diagnostics Data screen provides menus that show Flow Data, Application Data, Liquid Dataand Site Setup information. The [Test Facilities] menu provides test/control functions to optimize opera-tion, analyze application conditions and to recover system operation.
Path Select 1 and 2Path Enable N/AFlow DataApplication DataLiquid DataSite Setup DataTest FacilitiesPrint Site Setup NoDate Site Created 04.18.01 13.24.01
Siemens Dual Path SITE#1
Real-time flow-related data
Diagnostic Data

2-76
1010DVNFM-3CSection 2
NOTE: Diagnostic Data menus on [Dual Path Flow] meter setups include [Path Select] and [Path Enable]. Ch 1+2 Flow and Ch 1-2Flow virtual Channel 3 menus only include [Flow Data], [Print Setup] and [Data Site Created].
Diagnostic Data Path Select 121 and 2
Path Enable NoFlow Data Flow (Units)
Flow Vel F/STotal (Units)Vs m/sSignal mVValc %Vaer %Alarm StatusAncal (Units)HiFlow (Units)LoFlow (Units)
Application Info TN uSecTL uSecDeltaT nSecBurst/Sec% AcceptedLast MakeupMakeup Status
Liquid Data Temp 1Temp 2Reynolds #Liquid NameLiquIdentROCSpecific GravityAPIKg/m3
Base S.G.Base APIBase Kg/m3
Viscosity cPPressureViscosity cS
Site Setup Data fx (drive)N (burst lengthLtn inVfmax (Units)Vs max m/sVs min m/sEmpty %Samples/CycleMax DampingMin DampingHF
Test Facilities MakeupGraphTx UpTx DnFixed ALCTx Up Fixed ALCTx Dn Fixed ALCGraph AutoZero
Print Site Setup NoYes
Date Site Created xx.xx.xx xx.xx.xx
DIAGNOSTIC DATA MENU STRUCTURE
�
�
�
�
�
�
�
�
�
�
�
�
�
�
�
�
�
�
�
�
�
��
�

2-77
1010DVNFM-3CSection 2
2.11.2 FLOW DATA MENU
This sample menu provides a “live” display of all flow-related output data.
Flow Data This menu shows flow rate, total and alarm data; adjustable flow limits.Application Info This menu shows current meter operating status.Liquid Data This menu shows current Reynolds # and RTD temperature readings (if this
system includes optional RTD Temperature measurement capability).Site Setup Data This menu shows current transducer setup data and signal status.Test Facilities This menu provides system test and recovery routines.Print Site Setup This Menu cell allows you to send an ASCII dump of the current Site Data to a RS-
232 port device (e.g. a printer or laptop computer).Date Site Created This menu cell shows date and time when the current site was created.
DIAGNOSTIC MAIN MENU DESCRIPTION
(continued)
Flow This is a real-time (updated) flow rate display in current rate units(e.g., GAL/MIN).
Flow Vel F/S Linear fluid flow velocity in f/s or m/s depending on preferred units.Total This is a real-time (updated) flow total display in current total units (e.g.,
KGAL).Vs m/s Current liquid sonic velocity (Vs) in m/s. The Vs value depends on the liquid
and its temperature. This menu cell allows “fine-tuning” when highlighted. Pressthe [+] key (coarse adjustment) or the [1] key (fine adjustment) to increasethe reading, or the [-] key (coarse adjustment) or the [2] key (fine adjustment)to decrease the reading.CAUTION: Incorrect usage will result in reduced accuracy.
Signal (mV) Xdcr signal strength (in mV). This is the amplitude of the transit-time receivesignals. Improper coupling, attenuative liquid or pipe could cause a low value.
Valc % Input Amplifier gain indication. Larger % indicates a stronger liquid signal.Vaer % This shows the current percent of aeration detected by the meter.Alarm Status This letter code field shows the status of the meter’s built-in alarms. A dash
indicates an inactive alarm. Letter codes reflect the following alarm conditions:
S = Transducer Spacing WarningE = Empty Alarm
FLOW DATA MENU ITEMS
Flow GAL/MIN -2.26
Flow Vel F/S -0.218Total KGAL 0.0000Vs m/s 1273.21Signal mV 44Valc % 57Vaer % 0Alarm Status ---R-----AnCal GAL/MIN 0.0000HiFlow GAL/MIN 1576.8LoFlow GAL/MIN -1576.8
Siemens Dual Path SITE1
Current Flow Rate and Units
Flow Data
NOTE: Menu shows English units (i.e., gallons).

2-78
1010DVNFM-3CSection 2
Vs m/s
This menu cell shows the current sonic velocity in m/s. If you move the cursor to this menu cell you willnote that it switches from the usual arrow (à) to a question mark (?). This indicates that you can increasethe reading by pressing the [+] key for coarse adjustment or the [1] key for fine adjustment; or reducethe reading by pressing the [-] key for coarse adjustment or the [2] key for fine adjustment. Sonic velocity(Vs) adjustment is a diagnostic tool intended for our technicians or experienced users only. Improper usewill affect the meter accuracy.
HiFlow and LoFlow
The HiFlow and LoFlow menu cells allow you to enter maximum and minimum expected flow ratesbased on current operating conditions. Under normal circumstances, you should never need to changethese settings. It is possible however, that a Controlotron customer service engineer may ask you to editthese settings during a support session. In such a case, a <Right Arrow> at the menu cell enablesnumeric entry.
Important Note: A caution on the use of upper and lower flow limits (used to prevent flow mis-registration) prior to using the Reversal Zero technique (ReversaMatic): If the negative flow ratethat the meter reads in the step during which the transducers are reversed is more negative thanthe lower flow limit, the meter will re-register positive and the Reversal Zero cycle will be cor-rupted.
Therefore, postpone the installation of upper and lower flow limits until the Reversal Zero proce-dure is executed successfully. For pipes that combine large diameters with very high flow veloci-ties, it may be necessary to move the upper and lower flow limits out of the way until the reversalzero is completed. Moreover, pipes of this size frequently have excellent intrinsic zero perfor-mance and may not even need zeroing.
AnCal
This menu cell allows you to enter an artificial flow rate in current rate units that will drive the flow meter’sanalog outputs, totalizer output and the screen shown below. You can use AnCal to check the analogoutputs or as a reference source for calibrating external devices such as remote display screens or chart
Alarm Status R = Flow Rate Alarm (High or Low rate threshold exceeded)F = Fault AlarmA = Aeration AlarmM = Memory Activated (Fault Suppressed)K = Makeup Flag (May be Latched)I = Interface AlarmP = Pig Alarm (option)
AnCal Flow Rate Simulator for calibrating external devices, etc. Highlight this itemthen press the <Right Arrow> to enable numeric entry. Type desired simulatedflow rate. Be aware of the units prefix (K, M, etc.).NOTE: AnCal remains active only while you remain in this menu cell.
HiFlow Most positive expected flow rate for application (adjustable). GAL/MINLoFlow Most negative expected flow rate for application (adjustable).
GAL/MIN
FLOW DATA MENU ITEMS (continued)

2-79
1010DVNFM-3CSection 2
To activate AnCal:
Move the cursor to the [AnCal] menu cell by pressing . Press to enable numeric entry.Note that an equal sign (=) appears before the number.
Type the desired flow rate using current rate units (e.g., 120.00 GPM). Note that the [Flow] menu cellnow reflects the artificial rate.
Move the cursor away from the menu cell by pressing to turn AnCal off.
2.11.3 THE APPLICATION INFO MENU
This menu provides a live display of the basic timing data used by meter during operation.
TN uSec 75.193TL uSec 44.009DeltaT uSec 126Burst/Sec 256% Accepted 100Last Makeup (Re)StartMakeup Status Measurement
Siemens Dual Path SITE1
Time between transit and receive
Application Info
Flow GAL/MIN 120.00
Flow Vel F/STotal GAL 5645.820Vs m/s 1274.33Signal mV 44Valc % 57Vaer % 13Alarm Status ------M--AnCal GAL/MIN > 120.000HiFlow GAL/MIN 1577.9LoFlow GAL/MIN -1577.9
Siemens 2 Channel [1] Channel 1
Flow Rate Simulation Control
Flow Data
The M status isasserted due to the
method used tosimulate flow data.
Note that the [Flow]menu cell immediatelyreflects the AnCal entry.Over time, the Totaldisplay will alsoincrease.
recorders and RTU’s. To test the Totalizer function, leave AnCal active for enough time for an accumula-tion to appear on the screen below. Moving the cursor from the menu cell cancels the AnCal function.

2-80
1010DVNFM-3CSection 2
2.11.4 THE LIQUID DATA MENU
This menu shows the current Liquid Data parameters.
Temp1 78.5
Temp 2 40.1
Reynolds # N/A
Liquid Name
LiquIdent 1292.80 m/s
ROC 1.05 m/s
Specific Gravity 1.000 S.G.
API 10.000 API
Kg/m3 999.012 Kg/m3
Base SG 1.000 Base S.G.
Base API 10.000 API
Base Kg/m3 999.012 kg/m3
Siemens 2 Channel [1] SITE 1
RTD 1 temperature sensor reading
Liquid Data
Temp1 Current liquid temperature.Temp 2 Current liquid temperature.Reynolds # Current Reynolds number.Liquid name The current name of selected liquid.LiquIdent The LiquIdent™ Index is the sonic velocity of the liquid at 60ºF(15.6ºC).ROC Liquid interface rate of change variable.Specific Gravity Current specific gravity.API Current API number.Kg/m3 Current kilograms per meter cubed.Base SG Specific gravity of liquid relative to base temperature and pressure.Base API API number relative to base temperature of liquid.Base Kg/m3 Kilograms per metered cubed relative to base temperature of liquid.Viscosity cS Kinematic viscosity of a liquid measured in centistokes.Pressure Merasured pressure.Viscosity cP The absolute viscosity of a liquid dynamically measured in centipoise.
LIQUID DATA MENU ITEMS
APPLICATION INFO MENU ITEMS
TN uSec The total elapsed time between the transmission and reception of a sonicpulse.
TL uSec The total time a sonic pulse takes to travel through the liquid.DeltaT nSec This is the instantaneous result of subtracting the down from the up transit
times. NOTE: This will appear to be more active than dampened flowreadings.
Burst/Sec Number of transmissions per second under current operating conditions. Thefollowing factors influence this parameter: aeration, pressure transients, signalstrength variation.
% Accepted The percentage of accepted up/down transmit burst sets.Last Makeup Reason for last Makeup (signal reacquisition).Makeup Status Current stage of Makeup routine. [Measurement = normal operation]

2-81
1010DVNFM-3CSection 2
2.11.5 THE SITE SETUP DATA MENU
This menu provides data pertaining to transducer characteristics and operation. Some menu items arefor technical support interpretation only.
Viscosity expresses the readiness with which a fluild flows when it is acted upon by an external force.Absolute viscosity of a fluid is a measure of its resistence to internal deformation or shear.
Introduction to [HF] Menu Item
All FUH1010DVN flowmeters with version 3.01.02 and later operating systems include a new DiagnosticsMenu item that permits the entry of a flow registration correction parameter labeled [HF]. This “HF”parameter is the input for a proprietary algorithm which automatically compensates for signal beamblowing in pipes utilizing either 1011 clamp-on or insert transducers, thereby extending the upper flowlimit of all FUH1010DVN flowmeters. This algorithm provides the most benefit for clamp-on gas flowmeterswhere high flow velocities and low sound velocities create the most challenging conditions for digitalsignal processing routines.
viscosity (centistokes) = viscosity (centipoise) density(grams per cubic cm)
fx (drive) 30N (burst length) 5Ltn in -1.154Vfmax GAL/MIN 1577.42Vs max m/s 2165.41Vs min m/s 936.62Empty % 30Samples/Cycle 16Max DampingMin DampingHF 0.120
Siemens 2 Channel [1] Channel 1
Current transit drive code
Site Setup Data
fx (drive) Current Transmit drive code selected during Initial Makeup. The drive codecontrols the sonic transmit signal.
N (burst length) Transmit burst duration selected during Initial Makeup. To change N count press<Right Arrow>. At equal sign enter numeric value (1 to 9 only).
Ltn (in/mm) Spacing distance between the transducers. It will be in inches or millimeters,depending on default units.
Vfmax The flow velocity (in selected units) corresponding to one whole cycle offsetbetween upstream and downstream receive signals.
Vs max m/s Maximum correctly calibrated Vs for current transducer spacing. Vs min m/s Minimum correctly calibrated Vs for current transducer spacing. Empty % Value of Empty Alarm Setting. The meter will declare an empty status if signal
strength drops below this value.Samples/Cycle Digital sampling rate.Max Damping Maximum signal damping. Use to average digital data when an unstable
condition occurs.Min Damping Minimum signal damping. Use to average digital data when an unstable condi-
tion occurs.HF Flow registration correction parameter.
SITE SETUP MENU ITEMS

2-82
1010DVNFM-3CSection 2
Using the [HF] Menu Item
Two methods for adjusting this parameter are provided via the [HF] menu cell, located within the “Diag-nostics / Site Setup” submenu. The “Manual” method provides direct entry of this parameter and isprimarily intended for the advanced user, whereas the “Automatic” method allows the FUH1010DVNflowmeter to automatically measure the required correction and install the parameter.
Guidelines for using the [HF] menu item are described below:
� This menu is only accessible for the transducer channels, not the virtual (average flow) channelof the flowmeter (i.e., Diagnostics Path 1 or Path 2, but not Path 1 & 2).
� The 1010 flowmeter will inhibit the “Automatic” installation of the [HF] parameter if the flow rateis insufficient (too low) to accurately measure the required correction. If the maximum flow ratefor the application is relatively low then this correction should not be required.
� If the flow rate is very high and the flowmeter is reporting erroneous or unstable flow, then theflowmeter may already be having trouble resolving the upstream and downstream signals. Inthis event, it may be necessary to first lower the flow rate to a moderate level before performingthe “Automatic” HF adjustment. Once this is done the flowmeter should be able to properlymeasure the highest flow rates without problems.
� The limits of the “HF” parameter are +/- 0.7 and any attempt to manually install a larger valuewill cause the flowmeter to abort the installation of the parameter.
NOTE: Pressing the <Left Arrow> at any stage prior to accepting the measured value will abortthe installation and return to the previous setting.
To access this [HF] menu item proceed as follows:
� At the [Meter Type] Menu, press the <Right Arrow> and then <ENT> to select the desired Path(e.g., Dual Path Flow).
� In the [Dual Path Flow] Menu, press the <Down Arrow> and scroll to the [Diagnostic Data] menucell. Press the <Right Arrow> to select it.
Siemens Dual Path 4SS10G
Access Path/Channel Diagnostic Data
Channel /Path Setup
Pipe Data
Application Data
Pick/Install Xdcr
Operation Adjust
Flow/Total Units
Data Span/Set/Cal
Stripchart Setup
Datalogger Setup
I/O Data Control
Diagnostic Data
Dual Path Flow
Siemens Dual Path 4SS10G
Transducer Setup Data
Path Select 1
Path Enable Yes
Flow Rate
Application Info
Liquid Data
Site Seup Data
Test Facilities
Print Site Setup No
Date Site Created: 04.09.0314.52.23
Diagnostic Data

2-83
1010DVNFM-3CSection 2
fx (drive) 29
N (burst length) 5
Ltn in 5.316
Vf max CU Adjustment
Vs max m/s >Manual
Vs min m/s 1355.00
Samples/Cycle 29
Max Damping
Min Damping
HF >-0.000
Siemens Dual Path 4SS10G
Site Setup Data
fx (drive) 29
N (burst length) 5
Ltn in 5.316
Vf max CU >Manual
Vs max m/s = -0.120
Vs min m/s 1355.00
Samples/Cycle 29
Max Damping
Min Damping
HF >-0.000
Siemens Dual Path 4SS10G
Site Setup Data
� In the [Diagnostic Data] Menu, highlight [Path Select] and select the desired transducer path.Press <ENT> to select path.
� Press the <Down Arrow> and scroll to the [Site Setup Data] menu cell. Press the <Right Arrow>to select it.
“Manual” Adjustment Procedure
� In the [Site Setup Data] Menu, press the <Down Arrow> and scroll to the [HF] menu cell. Pressthe <Right Arrow> and a pop-up [Manual] prompt will appear as shown below. Note: Press the<Up/Down Arrow> to select [Automatic], if desired.
� Use the numerical keys to input the desired correction value. Press <ENT> to input value.
fx (drive) 29
N (burst length) 5
Ltn in 5.316
Vf max CU
Vs max m/s
Vs min m/s 1355.00
Samples/Cycle 29
Max Damping
Min Damping
HF >-0.120
Siemens Dual Path 4SS10G
Site Setup Data
� The new correction value will appear next to the [HF] menu cell as shown below.
“Automatic” Adjustment Procedure
� In the [Site Setup Data] Menu, press the <Down Arrow> and scroll to the [HF] menu cell. Pressthe <Right Arrow> and a pop-up [Manual] prompt will appear.
� Press the <Up or Down Arrow> to select [Automatic] then press <ENT>.

2-84
1010DVNFM-3CSection 2
� The current measured correction value is displayed (see below).
� Press <ENT> again to install this correction value which will now appear next to the [HF] menucell.
NOTE: The value shown in the [Automatic] pop-up prompt can not be changed and is for userinformation only.
fx (drive) 29
N (burst length) 5
Ltn in 5.316
Vf max CU Adjustment
Vs max m/s >Automatic
Vs min m/s 1355.00
Samples/Cycle 29
Max Damping
Min Damping
HF >-0.000
Siemens Dual Path 4SS10G
Site Setup Data
fx (drive) 29
N (burst length) 5
Ltn in 5.316
Vf max CU >Automatic
Vs max m/s = 0.026
Vs min m/s 1355.00
Samples/Cycle 29
Max Damping
Min Damping
HF >-0.026
Siemens Dual Path 4SS10G
Site Setup Data
� If you decide not to use the [Automatic] selection, press any key other than <ENT> to abort theoperation.

2-85
1010DVNFM-3CSection 2
To start a Test Routine:
To scroll the cursor to the test routine you want to use press
To access the test option list press . Press to move the asterisk to [Yes].
To start the routine press
To end the routine press
ENT
Makeup
The Test Facility Makeup routine allows you to command the meter to re-acquire the operating param-eters established during the Initial Makeup routine invoked by the [Install Completed?] command (seeparagraph 2.4 Pick/Install Xdcr Menu).
To invoke the Makeup routine:
Press to scroll the cursor to [Makeup].
Press to access the test option list. Press to move the cursor to [Yes].
Press to start the makeup routine.ENT
Makeup NoGraph NoTx Up NoTx Dn NoFixed ALC NoTx Up Fixed ALC NoTx Dn Fixed ALC NoGraph AutoZero No
Siemens 2 Channel [1] Channel 1
Right arrow invokes an InProcess Makeup
Test Facilities
2.11.6 THE TEST FACILITIES MENU
The Test Facilities menu provides commands for system analysis and recovery. The most useful for theend-user are Makeup and Graph. Using these routines under the supervision of our technical supportstaff will help us to provide technical analysis and solutions.
Makeup Commands the meter to re-acquire the receive signal.Graph Enables an on-screen marker display. - Cor Q should be greater
than 1.5. Larger number is better. Above 3 is desirable. SIG Qshould be less than 10. A value of 8 or less is desirable.
Tx Up Forces upstream transmission only.*Tx Dn Forces downstream transmission only.*Fixed ALC Select ‘Yes’ to command amplifier to hold a constant gain.*TX Up Fixed ALC Fixed ALC while transmitting up only.*TX Dn. Fixed ALC Fixed ALC while transmitting down only.*Graph AutoZero Use to establish a standard zero flow setting.
* For technical service diagnostics.
TEST FACILITIES COMMANDS

2-86
1010DVNFM-3CSection 2
The Test Facilities Graph Screen
NOTE: The following is intended for 1010 VFMT systems with Graphic Displays only. For VFMTcapable 1010X systems (with or without digital displays) or 1010DVN blind systems, thedigital receive signal can only be viewed as a text dump over the RS-232 output (i.e., bypressing the [F1] key and then the period key [.] ). Access to the digital damping param-eters can be found in the [Site Setup] menu cell of the Diagnostic Data menu. Refer tothe appropriate System 1010 field manual for details.
When operating in the transit time mode the Test Facilities Graph Screen is an exceptional diagnostic toolfor troubleshooting problem applications or simply determining receive signal quality. The primary func-tion of this screen is the display of the digitized receive signal waveform with similar appearance andfunction of a digital oscilloscope. This screen also allows the user to override some of the 1010 defaultsettings by permitting adjustment to the measured transit time, the digital averaging and the zero cross-over used in the measurement of the up/down transit time difference. The figure shown on the next pageis a representation of the 1010 diagnostic graph.
NOTE: The Test Facilities Graphic Screen requires significant CPU overhead. The 1010 metershould not be left in this mode during normal operation, where the Datalogger is theprimary output, or during calibration work.
F 0.73VS 1469.73[ ] 1691:1929 476D 4:4 4Tn 55.06 55.06d T 3.11S 72 1SN 124:1CQ 17:1
Digitized Receive Signal
TN markerCrossover Marker
Command Line appears here
913

2-87
1010DVNFM-3CSection 2
Entering the Diagnostic Graph Screen
Before you can view the Diagnostic Graph Screen the 1010 flow channel must first be properly installedand operating in a non-empty condition (refer to the appropriate 1010 Field manual). If a previouslyinstalled channel is in a “Fault” condition, but not reporting “Empty”, you can still access the Graph Screento aid in troubleshooting the cause of the failure to measure flow.
To view the Graph Screen first enter the [Test Facilities] menu, which is a submenu of the main [Diagnos-tic Data] menu.
� Pressing the <Up/Down Arrows>, scroll to the [Graph] menu item.
� Press the <Right Arrow> to enter the [Graph] menu and scroll to highlight the [Yes] item in the optionlist.
� Now press the <ENTER> key to access the Graph Screen.
� To exit the Graph Screen and return to the main menu, press the <MENU> key once.
Diagnostic Text Display
The text to the upper left-hand corner of the screen represents diagnostic items which can be individuallyturned on or off to reduce unnecessary clutter on the screen. This text display can be modified bypressing the <ENTER> key and scrolling up or down through the various parameters that appear in theGraph Display menu. Pressing the <ENTER> key will select the highlighted parameter (a “+” sign ap-pears next to selected items) and pressing <CLR> will deselect the item. Pressing the <Left Arrow> willreturn you to the graph screen with the selected parameters appearing at the top left corner of thescreen. (The figure above is shown with all diagnostics items selected).
Time Base Control
The digitized receive signal can be moved either to the left or right on the screen by pressing the <Left>or <Right> keypad arrows. The direction of the arrow actually represents the direction in which thereceive “window” will move, thereby causing the receive signal to shift in the opposite direction on thescreen (e.g., Pressing the <Left Arrow> moves the signal to the right).
The digitized receive signal can be expanded or contracted in the time domain by pressing the <+> or <-> keys on the keypad. This allows you to see the entire contents of the receive window, or zoom in to seegreater detail. Pressing the <CLR> key once will automatically center the receive signal on the screen.When zooming in on the receive signal small vertical “tick” marks may appear. These marks representthe time at which the receive signal is digitally sampled.
Correlated Plot
During conditions of flow, the actual transit time delta (difference) can be observed in the displayedreceive signal waveform when the [Correlated Plot] menu parameter is not selected. To observe thistime difference simply depress the <+> key (to see greater signal detail) until the individual up and downreceive signals are clearly discernible. To verify that the 1010 signal processing algorithms are properlycorrelating the up and down stream receive signals, select the [Correlated Plot] option from the displaymenu list.

2-88
1010DVNFM-3CSection 2
Return to the graph screen and observe the relative position of the up and down waveforms. In a prop-erly correlated receive signal the two images should be nearly superimposed on top of each other, evenduring high flow conditions. In the unlikely situation where the two images appear to be offset by one ormore receive cycles then the flow readings should be considered questionable.
Command Modes
Although the 1010 signal processing algorithms are capable of accommodating a very wide range ofsignal conditions, it may be desirable to override these default settings under extremely difficult operat-ing conditions. The following functions are available for this purpose:
Digital Damping Control: (Hot Key 1 and 2)
The 1010 permits user modification of the digital averaging used by the signal processing routines. Ingeneral, the default damping values selected by System 1010 will provide optimal performance over awide range of transit time applications. However, in extreme cases of unstable flow profile, low signallevels or high aeration it may be necessary to override these default settings to permit uninterrupted andreliable flow measurement.
The 1010 Graph Screen includes the capability to access a set of command codes, which enable a userto override a number of default setup parameters. The most important parameter is the digital damp-ing control, which can be accessed by pressing number <1> or <2> on the keypad while in the graphscreen mode.
Pressing the <1> key will cause [MinDamp #] to appear on the command line at the lower left-handcorner of the screen. The number listed to the right of the command code represents the exponent in theSystem 1010 exponential averaging routine, where the larger the number the greater the digital averag-ing. Pressing the <+> key will increase the damping value. Likewise, pressing the <-> key will decreasethe damping value. To exit this mode, press the <0> key on the keypad.
Pressing the <2> key will bring up the [MaxDamp] command. The function of this parameter is similar tothe [MinDamp] command described above, however, the two parameters interact in the following man-ner. The MinDamp value must not exceed the MaxDamp value, therefore increasing the MinDamp valueabove the previous MaxDamp value will set both parameters to the same value. In most cases, it ispreferred that both damping parameters be set to the same value, however, in cases where rapidresponse to changes in liquid sound velocity is required, the two values may be set differently. In thissituation the meter will use the MaxDamp value when sound velocity is stable, but then switch to a fasterdamping value (limited by MinDamp) when a significant change in sound velocity is perceived. To exitthis mode, press the <0> key on the keypad.
Transit Time Adjustment: (Hot Key 3)
Observe the short vertical marker at the beginning of the receive signal in the Graph Screen above. Thisline represents the position in time (Tn) where the 1010 flowmeter perceives the arrival of the ultrasonicsignal. There are actually two Tn markers, one for the upstream arrival time and one for the downstreamarrival time. For proper liquid sound velocity measurement these Tn markers should be positioned nearthe beginning edge of the receive waveform envelope (as shown), however, in cases of poor signalconditions it is possible for this measurement to be off by several receive waveform cycles. To adjust theTn mark position press the <3> key on the keypad to bring up the [TnSet] command.
Pressing the <+> or <-> keys will cause the Tn marker to move later or earlier, respectively. As you adjustthe Tn marker, both Tn and Vs (liquid sound velocity) will change accordingly. To exit this mode, press the<0> key on the keypad.

2-89
1010DVNFM-3CSection 2
Zero Crossover Adjustment: (Hot Key 4)
Observe the small “X” mark located on the zero crossing line near the middle of the receive signal in theGraph Screen above. This “X” indicates the central crossover which the 1010 is using to measure thetransit-time delta. This crossover will generally be close to the peak of the receive signal with at least onewell formed (non-aberrated) receive cycle on each side of the crossover. If it appears that the placementof this crossover is unsatisfactory then it can be adjusted by pressing the <4> key on the keypad, whichwill invoke the [ZCOSet] command. The crossover point can then be moved in either direction on thewaveform using the plus <+> or minus <-> keys. The change from the default value (in receive cycles)will appear in the number to the right of the command. To exit this mode, press the <0> key.
Envelope Threshold Adjustment: (Hot Key 5 & 6)
Pressing the <=> key causes the graph to toggle between the default signal waveform screen and thesignal envelope screen (see example below). This envelope screen can aid in the diagnosis of Tn errorscaused by unusual receive waveform distortion. Signal distortion is sometimes caused by poor trans-ducer selection or poor pipe wall conditions, which may result in an incorrectly measured fluid soundvelocity. To improve the automatic measurement of Tn, the envelope threshold limit can be adjusted toexclude portions of the envelope, which may be causing the Tn detection problem.
If it appears that the default placement of the Tn marker is incorrect or unstable, it can be adjusted bypressing the <5> key on the keypad to invoke the [EnvSet] command (while viewing the envelopescreen). A horizontal line representing the envelope threshold level will appear along with a numberindicating the percentage level. The High and Low thresholds can then be moved either up or down onthe envelope using the <+> or <-> keys. While viewing the Tn marker position, adjust the thresholds sothat they are well above the baseline “noise” level but below the first major peak. To exit this mode, pressthe <0> key.
Signal Masking Function: (Hot Key 7)
Under conditions of extremely low signal amplitude, a noise spike associated with 1010’s receive signalwindow may be present on the extreme left side of the graph display. If this spike is large enough it mayinterfere with the signal detection routines. To eliminate this noise from the signal processing routines,press the <7> key to invoke the [MaskSet] command, then press the <+> key until the noise is no longerpresent in the receive waveform. Press <0> to exit this command.
F 0.73VS 1469.73[ ] 1691:1929 476D 4:4 4Tn 55.06 55.06dT 3.11S 72 1SN 124:1CQ 17:1
Envelope Signal
TN markerCrossover Marker
Command Line appears here
Envelope Threshold913
HiSet
HiSet
Lo Set

2-90
1010DVNFM-3CSection 2
Screen Text
Parameters Menu List item Description
F Flow Measured flow rate in selected flow units.
VS Vs (m/s) Sound Velocity in meters per second.
[ ] Display Metrics Represents the digital sample position of the receive window.
Correlated Plot Displays the receive waveform in its proper superposition or registra-tion. The true delta time will be displayed by NOT selecting “Corre-lated Plot”.
Centroid Mark Indicates with a large vertical marker the peak energy of the receivewaveform.
D Damping Displays the minimum and maximum digital damping exponent alongwith the active damping exponent.
Tn Tn (usec) Receive signal transit time in microseconds.
dT Delta T (nsec) Transit time delta (difference) in nanoseconds.
S Signal Strength Displays %Valc (amplitude), %Vaer (aeration factor) and numeric ALC.
SN Signal to Noise Ratio Indicates the signal to noise ratio of the receive signal. Increaseddamping will increase the S/N ratio as the asynchronous noise re-duces.
Envelope Signature Percentage change of the signal from Initial Makeup conditions.
DESCRIPTION OF GRAPH SCREEN TEXT DISPLAY PARAMETERS
Key Command Line Description
<+> Expands (magnifies) waveform to view more detail. <-> Contracts waveform to view more or the waveform. <Left Arrow> Shifts receive window to the left (waveform to the right).<Right Arrow> Shifts receive window to the right (waveform to the left). <CLR> Brings waveform to the center of the screen. <ENTER> Calls up Text Display menu items. <Left Arrow> to return to graph. <MENU> Exits the Graph Screen and returns to the main menu. <1> MinDamp Minimum damping exponent control (+ or - to increase or decrease). <2> MaxDamp Maximum damping exponent control (+ or - to increase or decrease). <3> TnSet Transit time adjustment (use + or - to move Tn marker). <4> ZCOSet Zero Crossover adjustment (use + or - to move crossover marker). <5> HiSet Signal envelope threshold level (use + or - to move threshold). <6> LoSet Signal envelope threshold level (use + or - to move threshold). <7> MaskSet Leading edge masking functions (use + or - to alter number of samples
masked). <8> Hold Set Set this number higher if intermittant mis-registration occurs. <0> Exits the command line. <=> Toggle graph between receive waveform and envelope waveform. <F1> and <.> Dumps the digitized waveform data over the RS232 port. You must first
leave the Graph Screen mode before invoking this command.
HOT KEY SUMMARY

2-91
1010DVNFM-3CSection 2
2.11.7 TROUBLESHOOTING TIPS
The FUH1010DVN has highly reliable circuitry and will provide trouble-free operation within specifiedenvironments. Even a well-crafted precision instrument can fail if exposed to extreme temperature orvibration conditions during service, storage or transportation. The Diagnostic menu shows how the sys-tem interprets a problem. The test functions and alarm indicators identify “hidden” problems automati-cally. If a problem seems unsolvable, call our Technical Service Department or your local Siemens Rep-resentative for expert help.
Flow Computer Messages
Certain actions or conditions invoke messages that may appear as a pop-up window, in the right-handcolumn of a given menu cell, or the highlighted prompt line at the top of the display screen. The followingis a list of messages that you may encounter along with explanations, and in some cases, a recom-mended action.
MESSAGE DESCRIPTIONMemory Full! Response to an attempt to save site data, when data memory is full. Delete
an obsolete site or clear Datalogger memory to make room for the new data.Memory Corrupted! Memory read error occurred while accessing the active site data.Chan Not Setup Response to an attempt to invoke an operation that requires a channel to
be enabled. Enable the channel [Channel Setup Channel Enable Yes].Note that a channel cannot be enabled until its transducers are operating.
Clr All Data? Response to pressing the F4 key. Use the F4 function to restore operation if asevere event (e.g., a violent power surge) disrupts system operation.
Clr Dynamic Memory? Response to pressing the F4 key, then selecting [No] for Clr All Data?<EOT> Response to a request to output datalogger data to the printer or the
Graphics screen when no datalogger data exists. Set up the Datalogger.Empty Pipe - Press Prompt to empty the pipe during the Actual MTY procedure. After [ENT] emp-
tying pipe, press <ENT>.Fill Pipe - Press [ENT] Prompt to fill the pipe during the Actual MTY procedure. After filling the pipe,
press [ENT] (see paragraph 3.1.3). No Sites Response while trying to recall/delete a site setup when no Sites are stored.
Not Installed Response to an attempt to access a menu function that is not included.Re-space Index Upon measuring the liquid sonic velocity (Vs), the meter recommends re-
spacing the transducers to improve performance.Invalid Setup During the Initial Makeup, the system detects invalid transducer spacing, er-
roneous liquid/pipe parameters, or some other factor that prevents it fromcompleting the Initial Makeup. This may be due to one of the following:
• An out-of-range data entry.• An invalid condition; (e.g., overlapping transducers in Reflect Mode). Ifselecting Direct Mode does not resolve, review all site setup and transducerinstallation choices; particularly data entered for the pipe and liquid.• In Reflect Mode, the flow computer detects that the pipe wall signal mayinfringe upon the liquid signal. Use Direct Mode instead.
Press <ENT>, <UP Arrow>, <DOWN Arrow>, or <LEFT Arrow> to abort installroutine. Continue programming other site data in anticipation of resolving thedifficulty later. Call technical support for help if necessary.
(use Direct Mount)
�����
(continued)

2-92
1010DVNFM-3CSection 2
NOTE: If you receive a Detection Fault message, it is strongly recommended that you contactTechnical Service for further orientation.
Using the “F4” Reset Sequence
You may encounter an operating problem that blocks access to the Diagnostics Menu, or the flowme-ter may operate erratically after exposure to a power transient or some other traumatic event. Thesecases may require use of the F4-reset sequence to restore operation.
The F4-reset sequence operates on two levels. The first F4-reset deletes all the data currently in ActiveMemory, but leaves Datalogger data and all stored Site Setups intact. This is the most desirable methodsince all you have to do to restore operation is reload a saved Site Setup. If this fails then you have toresort to the second level of the F4 sequence, which allows you to clear ALL Dynamic Memory. Be awarethat this erases all saved Site Setups (including flow calibrated sites), Datalogger Data and user-defined pipe and transducer tables. This will require you to completely re-install the system and repeat alldesired default settings, custom pipe tables, etc. The chart below shows the sequence of the [F4] rou-tine:
Low Signal-Press [ENT] During the Initial Makeup, the meter decides that the level of the receivesignal is insufficient for proper operation. Some reasons forlow signal are:• Invoking [Install Completed?] on an empty pipe.• Coupling compound insufficient, not applied, or evaporated.• A disconnected or broken transducer cable.• You need to condition the pipe at the mounting location.• Flush out large air bubbles.• The Xdcr cables are defective or not connected to the correct channel.• The Set Empty routine performed when pipe was NOT actually empty.
Detection Fault If you locate and correct the improper condition immediately, press <ENT> toresume the installation procedure. Otherwise, press the <LEFT Arrow> to abortthe installation and conduct a thorough investigation.
Appears if the flowmeter cannot complete an Initial Makeup. It means that thepipe and/or liquid conditions do not permit a receive signal that meets the flowdetection standards. The system will not be able to operate. Attempt to improveoperating conditions by reinstalling the transducers at a different spacing offset,or even at a different location on the pipe. In addition, switching from Reflect toDirect Mount may solve the problem. However, operation may not be possibleif there is poor liquid or pipe wall sonic conductivity or extreme liquid aeration.
MESSAGE DESCRIPTION
[Power On/Off + F4] [Clr Active Memory?] NoYes
[Clr Saved Data?] NoYes

2-93
1010DVNFM-3CSection 2
Procedure to clear Active Memory only:
Turn off power (if it is currently on). Press <F4> and keep it pressed while you turn on power. Theprompt: [Clr Active Memory? No] appears at the top of the screen.
Press <Right Arrow> to access F4 Reset option list. Press <Down Arrow> to switch the option listto [Clr Active Memory? Yes]. Press <ENT> to clear all Active Site Data (but not saved SiteSetups).
To restore operation, press <MENU> to access the installation menu. Create a new site setup orrecall a stored site setup.
Re-select any Meter Facilities items (e.g., RS-232 setup parameters).
Procedure to clear ALL Dynamic Memory:
Turn off power (if it is currently on).
Press <F4> and keep it pressed while you turn on power. The prompt: [Clr Active Memory?No] appears at the top of the screen. Press the <Down Arrow>. Note that the prompt switches to[Clr Saved Data? No].
To access the F4 Reset option list press the <Right Arrow>. Press the <Down Arrow> to switchthe option list to [Clr Saved Data? Yes].
CAUTION: Before proceeding further it is essential to understand that this function elimi-nates ALL data stored in RAM. This means that all saved site setups includingthe site data of a flow-calibrated site will be erased! In addition, the entireDatalogger file plus any custom factory or user-created pipe or transducertables will be eliminated. The impact of this is such that we strongly recom-mend that you consult Technical Service before continuing with this proce-dure. Be aware that you will have to create a new Site Setup, re-enter all sitespecific parameters including pipe or transducer tables, plus all desired MeterFacilities entries.
To clear all Dynamic Memory press <ENT>.
Create a Site Setup before attempting to access other menu items.
To restore operation, press <MENU> to access the installation menu. Create a new site setup andcomplete the installation procedure.
Re-select desired Meter Facilities items (e.g., RS-232 setup parameters).

2-94
1010DVNFM-3CSection 2
2.11.8 TROUBLESHOOTING WITH TRANSDUCER TEST BLOCKS
To resolve an apparent system malfunction, you have to determine whether the problem is due toequipment failure or an application condition. Our 1012 and 996 Transducer Test Blocks allow you tobench test the flow computer, transducers and their cables. If the system operates properly using thetest block, then focus on application conditions as the source of the problem. Series A and B 1011transducers use the 1012TB-1 Test Block and series C and D use the 1012TB-2 Test Block. At thepresent time, neither one support the 1011 High Precision transducers.
The 996PSP-pipe simulator allows you test a 1010 series flow computer and 991 transducers from size0 to size 3. Note that although the 1010 flow computer operates with our 991 size 4 and 5 transducers,testing of these sizes with a 1010 flow computer is not currently supported.
2.11.9 USING THE 1012TB-1 AND 2 TEST BLOCKS
The 1012TB-1 and 1012TB-2 test blocks provide two test surfaces. Each surface supports a specifictransducer size. For example, one surface of the 1010TB-1 supports Size “A” transducers and the othersupports Size “B” transducers. The 1012 pipe simulators include two labels, one on each side-plate. Thelabels identify the transducer size, data to be entered, and the surface to be used with the specifictransducer size. See drawing below.
MOUNTING TRANSDUCERS ON A 1012 TRANSDUCER TEST BLOCK
1. Identify the side of the simulator that applies to the transducers under test. Rotate the clampingbracket as required to mount transducers on the test surface.
2. Using a coupling compound (preferably CC-102), mount the transducers on the pipe simulator asshown above. Slide each transducer until it presses against the pin-stop. Use the clamping screws tohold the transducers in place.
3. Connect transducer cables between each transducer and the meter connectors for the channelunder test. The Up and Down orientation is not important.
Transducer clampingscrew
Transducer testingsurface for an A
size transducer
Slide transducers firmly againstTransducer Pinstops
Transducerunder test
Transducerunder test
TransducerClampingBracket
Example shows testing forsize B. Rotate brackets 180 tomount SizeA transducers
This label shows thedata entry parametersfor size B. Size Aparameters appear ona label on the otherside plate
This arrow points tothe surface associated with thexdcr size identified on the label

2-95
1010DVNFM-3CSection 2
4. Access the Installation Menu. Select [Meter Type] [Single, Dual or Quad Channel] depending onmeter type. Select the meter channel (1,2,3, or 4) depending on which measurement channel youintend to test. Select [Clamp-On] and then [Channel Setup].
5. Access the [Channel/Path Setup] menu. Move the highlight to [Create/Name Site]. Create a new SiteSetup (e.g., TEST1). You can now enter data without altering an existing Site Setup.
6. Select the [Pipe Data] Menu. Referencing either the English or metric pipe simulator chart below,enter the pipe data corresponding to the transducer size under test.
7. Access the [Pick/Install Xdcr] menu. Check the [Transducer Size] menu cell. If necessary, enter theXdcr Size option list and pick the transducer under test.
8. Check the [Xdcr Mount Mode] menu cell. Adjust to match the simulator chart above.
9. Move the highlight down to [Install Completed?] by pressing . Access the option list. Move thecursor to [Install] by pressing . Press to start the transducer install routine.
NOTE: Since Sizes A and C transducers are installed in Reflect Mode, you will see a pop-up win-dow that prompts you to: [Use Actual Zero]. You can ignore this by pressing the <DownArrow>.
Upon the completion of the [Install] procedure, the flow computer should report a sonic velocity withinthe range of approximately 1350m/s to 1700 m/s (depending on the transducer size under test). Next,check [Diagnostic Data] menu. The [Valc %] item must be >35 for dependable operation. In addition,note the reading, then compare it to the [Vf max] item in the [Diagnostic Data/Site Setup Data] menu.The value of the reading should be less than 2% of the published Vf max. Confirming these valuescertifies that the entire system (computer, transducers, cables) is operating correctly. The investigationshould proceed to a review of all site conditions to locate the operating problem.
ENT
Part Xdcr Pipe OD Pipe Wall Mount Spacing Number
Number Size (in.) Mat’l Thk (in.) Mode Offset Index
1012TB-1 A 0.650 Steel* 0.100* Reflect Nominal 71012TB-1 B 1.150 Steel* 0.100* Direct Minimum 41012TB-2 C 2.000 Steel* 0.100* Reflect Nominal 111012TB-2 D 3.500 Steel* 0.100* Direct Minimum Use Ltn
*System Defaults
1012TB-1 & 2 Universal Transducer Test Block Chart (English)
*System Defaults
Part Xdcr Pipe OD Pipe Wall Mount Spacing Number
Number Size (mm) Mat’l Thk (mm) Mode Offset Index
1012TB1 A 16.5 Steel* 2.54* Reflect Nominal 71012TB1 B 29.2 Steel* 2.54* Direct Minimum 41012TB2 C 50.8 Steel* 2.54* Reflect Nominal 111012TB2 D 88.9 Steel* 2.54* Direct Minimum Use Ltn
1012TB-1 & 2 Universal Transducer Test Block Chart (Metric)

2-96
1010DVNFM-3CSection 2
2.11.10 USING THE 996PSP PIPE SIMULATOR
To mount transducers on a 996PSP Pipe Simulator
1. Using the proper coupling compound, mount the transducers on the pipe simulator as shown below.Slide each transducer until it presses against a pin-stop. Use the clamps to hold the transducer inplace.
2. Connect cables between each transducer and the computer connectors for the channel under test.The Up and Down orientation is not important.
3. Press <MENU> to access the Installation Menu. Select [Meter Type] [Single, Dual, or Quad Channel]depending on meter type. Select the meter channel (1,2,3, or 4) depending on the measurementchannel you intend to test. Select [Clamp-on] and then [Channel Setup].
4. Access [Channel/Path Setup] menu. Move highlight to [Create/Name Site]. Create a new Site Setup(e.g., TEST1). You can now enter data without altering an existing Site Setup.
5. Select the [Pipe Data] Menu. Referencing either the English or metric pipe simulator chart below,enter the pipe parameters corresponding to the transducer size under test.
Part Xdcr Pipe Pipe Wall Mount Letter Number
Number Size OD (in) Mat’l Thk (in) Mode Index Index*
996PSP-0 0 2.420 PVC 0.076 Direct A 6996PSP-1 1 2.481 PVC 0.077 Direct A 9996PSP-2 2 2.743 PVC 0.136 Direct A 6996PSP-3 3 3.758 PVC 0.344 Direct A 1996PSP-4 4 6.500 PVC 1.000 Direct** A 0
996PSP PIPE SIMULATOR CHART (English)
* The flow computer generates the Number Index.** See note below.
Clamping Screw
XdcrClampingBracket
991 TransducersUnder test
Pipe Simulator TransducerPinstops
XdrClampingBracket
Clamping Screw991 TransducersUnder Test
TransducerPinstops

2-97
1010DVNFM-3CSection 2
NOTE: When using a 996PS-4 Simulator, you must access the [Application Data] menu, select[Liquid Type] - [Other], then program the [Estimated Vs] for a value of 2100 m/s.
6. Access the [Pick/Install Xdcr] menu. Access the [Transducer Model] menu cell. Enter the TransducerModel option list. Select [991 Universal].
7. Check the [Transducer Size] menu cell. If necessary, enter the Transducer Size option list and pickthe actual transducer under test.
8. Check the [Xdcr Mount Mode] menu cell. Adjust as necessary to match the simulator chart above.
9. Move the highlight down to [Install Completed?]. Access the option list. Move the cursor to [Install].Press <ENT> to start the transducer install routine.
10. Check to make sure that the flow computer returns the Number Index listed in the chart above. Next,review and verify the Diagnostics data items as described previously. If the computer, cables andtransducers are operating properly, then review all site conditions to locate the operating problem.
If a Pipe Simulator/Test- Block Test Fails:
1. Replace the transducer cables. If this allows you to complete the test as described above, then thecables were defective.
2. If the cables are proven to be good, replace the transducers on the pipe simulator with a “knowngood” set. If the system functions properly, then the original transducers under test are defective.Please return any defective transducers to Controlotron for repair.
3. If you replace the transducers and cables, and the system still fails to function correctly, then it islikely that the computer has a malfunctioning circuit module. If you have spare modules you may trymodule substitution to identify the defective module. Otherwise, please call Siemens Technical Ser-vice Department for further instructions.
* The flow computer generates the Number Index.** See note below.
Part Xdcr Pipe Pipe Wall Mount Letter Number
Number Size OD (mm) Mat’l Thk (mm) Mode Index Index*
996PSP-0 0 61.47 PVC 1.93 Direct A 6996PSP-1 1 63.02 PVC 1.96 Direct A 9996PSP-2 2 69.67 PVC 3.45 Direct A 6996PSP-3 3 95.45 PVC 8.74 Direct A 1996PSP-4 4 165.1 PVC 25.4 Direct** A 0
996PSP PIPE SIMULATOR CHART (Metric)

2-98
1010DVNFM-3CSection 2
INSTALLATION/TRANSDUCER MOUNT GUIDELINES
Install Transducers (Reflect/Direct) as recommended by meter; Use assigned spacing positions!
Use Reflect Mount whenever possible (Not permitted on plastic pipes).
Avoid placing transducers downstream of flow obstructions, pressure drops, elbows.
Mount upstream of Orifice Plates, Turbines, Valves, “T’s”
Allow a minimum of 10 diameters of straight pipe upstream of Transducers; More following multi
elbows.
If <10 diameters is available, mount Reflect within 2 diameters, in Plane-of-Elbow (on outside of
bend).
DO NOT mount Transducers on top and/or bottom of horizontal pipe!
Ensure pipe is clean and smooth; remove external scale, loose or flaking paint.
Use appropriate Coupling Compound for application (see charts below).
Avoid mounting on pipe seams.
Connect “UP” Cable to “Upstream Transducer” (closest to source of flow) and vice versa.
PROGRAMMING
Select appropriate meter type: Clamp-On, Reflexor, Dual Beam, Flow Tube, etc.
Select proper channel (Dual or Multi-Channel Systems Only).
Use “Full Site Setup”
Create Site (or Recall Site).
Program accurate Pipe Diameter, Material & Wall Thickness (or choose from tables).
Program accurate Liner Material and Thickness (if applicable); Ensure Liner is well bonded.
Program correct Liquid Type (Estimated Vs), Consult Vs Database for liquids not on meter menu.
Select Recommended Transducer, HP for Steel Only; Use first choice for Universals, if possible.
Ensure Transducer Type & Size match programming.
Ensure transducer serial numbers match each other.
2.12 GUIDE TO A SMOOTH INSTALLATION
NOTE: The following should be used in conjunction with the FUH1010DVN Field Manual Diag-nostic and Troubleshooting procedures.
2.12.1 CHECKLIST FOR 1010 STARTUP & PERFORMANCE

2-99
1010DVNFM-3CSection 2
START-UP
Ensure pipe is FULL (flowing or not).
Select “Install Complete?”…..INSTALL to Invoke “Initial Makeup” routine.
Verify “Measured Vs” is accurate for liquid type & temperature (Consult Vs Database)
Set Zero appropriately (AutoZero or ZeroMatic for Reflect, Actual Zero or ReversaMatic for Direct).
After completion of Zeroing, access Flow Display by pressing <MENU> key.
Use <UP/Down Arrows> to scroll through available displays.
Verify Vs is correct for Liquid and Temperature.
Verify Valc is Greater Than 30.
Verify Vaer is Less Than 10 when flowing.
Check Signal Graph to be acceptable. See reference graphs below.
For 100 Universal Transducers verify “VfMax” is significantly higher than maximum Flow Rate of
application.
Set “Hi Flow” at 90% VfMax; Ensure it is higher than Max Application Flow Rate.
Set “Lo Flow” at –10% VfMax. (For unidirectional flow applications only!)
Set “Lo Flow” at 10% Greater Than Maximum Negative Flow (Bi-Directional Applications).
DIAGNOSTIC/PERFORMANCE VERIFICATION
2.12.2 OPTIMIZATION/CORRECTION OF PROBLEMS
Incorrect “Measured Vs”
Verify actual pipe (outside) diameter matches meter programming.
Verify actual Wall Thickness matches meter programming.
Verify transducer Type and Size matches meter programming.
Verify transducer mount method, and spacing positions (indices) match meter programming.
Check actual transducer spacing matches “Ltn” dimension.
Verify Graph is acceptable (see below).
Use recommeded High Precision or first recommended Universal Transducer.
Verify Liquid Vs in database (take into account actual temperature & pressure).
Verify Liquid chemistry is as expected. (Ask about additives, Pressure, Temp.)

2-100
1010DVNFM-3CSection 2
Poor Signal
Check that actual pipe dimensions and material match programmed data.
Consult X-Select; Choose first recommended transducer.
Relocate transducers.
Detection Fault/Low Signal
Perform all checks for “Low Valc.”
Ensure pipe is full.
Ensure cables are terminated at both ends; Check continuity with Ohmmeter.
Check operation on Pipe Simulator.
Switch off any radiating electrical equipment in area (Transmitters, Variable Freq. Drives, etc.).
High Vaer
Avoid transducer mounting near flow obstructions.
Check for possible pressure drop sources (Pipe Expansion, Orifice, Check Valve, etc.).
Check liquid “Flash Point” against application conditions.
Pinch downstream valve (of Transducer) to raise pressure.
Mount on suction side of pump.
Raise tank levels; adjust Float switches.
Switch off any radiating electrical equipment in area (Transmitters, Variable Freq. Drives, etc.).
Low Valc
Clean and condition pipe surface.
Use recommeded High Precision or first recommended Universal Transducer.
Use Direct Mount (be sure of transducer 180º alignment!).
Use larger size transducer (Universal Only!).
Use wider spacing (Maximum or Letter D).
Stop flow to check for Aeration/Cavitation.
Try another location.
Perform an Initial Makeup after ANY of the above changes!!
Try “1-Cycle” Vs Correction in Diagnostics if error remains for a liquid with well defined Vs data.

2-101
1010DVNFM-3CSection 2
Digitized Receive Signal
TN markerCrossover Marker
Command Line appears here
F 0.73 VS 1469.73 [ ] 1691:1929 476 D 4:4 4 Tn 55.06dT 3.11 S 72 1SN 124:1 CQ 17:1
Ideal Vsig Display
913
Trade Name Application Max Temp. Remarks
Motor Oil, Gear Oil, STP Portable, Short Term 250°F, 121°C MessyAuto Wheel Bearing Grease Moderate to Long Term 250°F, 121°C Good Gen’l CompoundSilicone Rubber (RTV) Permanent As Rated Cure at Ambient2-Part Epoxy Permanent As Rated Cure at AmbientGasket Cement Permanent 375°F, 190°C Cure at Ambient
“Alternative” COUPLING COMPOUNDS
Part# Name Application Max Temp. Remarks
CC-102 Ultragel Portable, Short Term (< 24 Hours) 110°F, 43°C Water SolubleCC-110 RTV-734 Permanent (Plastic Xducers Only) 150°F, 65°C Avoid HumidityCC-114 Magnalube Long Term Teflon Grease 300°F, 159°C Temp. affects lifeCC-117 Dow-340 Temperature Sensors Only 400°F, 205°C Heat Sync Comp.CC-120 Denso Submersible Applications 150°F, 65°C Good Noise DampCC-122 KryTox Long Term High Temperature 450°F, 232°C Use for all HTCC-124 Barco Bond Permanent Epoxy for Metal Xdcrs 150°F, 65°C Cure at AmbientCC-128 SuperLube Long Term Grease 375°F, 190°C Avail. In Stores
“Official” COUPLING COMPOUNDS


3-1
1010DVNFM-3CSection 3
3. HARDWARE INSTALLATION GUIDE
3.1 PREPARING TO MOUNT THE TRANSDUCERS
Installing the transducers is fairly straightforward. However, careful planning will avoid any snags thatmay delay the installation. Previously, based on the input you fed into the meter’s computer, it hadrecommended the transducers size, mounting option and spacing. With the transducers at hand, we arenow ready to mount them. But first, some very important preliminary work must be done which consistsof:
• Selecting a mounting option for your application
• Selecting a location on the pipe
• Preparing the pipe to accept the transducers
NOTE: When installing transducers, do not key in the V/M (Version/Modification) label num-ber as the Transducer Size.
3.1.1 HOW TO IDENTIFY 1011 TRANSDUCERS AND MOUNTING HARDWARE
1011 series of universal transducers and mounting frames have the following color-codes for easyidentification:
GOLD ....................... SIZE ‘A’ GREEN…………………SIZE ‘D’BLUE ........................ SIZE ‘B’ BLACK…………………SIZE ‘E’RED .......................... SIZE ‘C’
The transducer part number located on the front face provides a more detailed identification. For ex-ample, the Part Number: 1011PPS-C2 means:
3.1.2 SELECTING A LOCATION FOR CLAMP-ON TRANSDUCERS
• Locate the transducers downstream from the center of the longest available straight run. A location tenpipe diameters or greater downstream from the nearest bend will provide the best flow profile condi-tions.
• Do not (if possible) install the transducers downstream from a throttling valve, a mixing tank, the dis-charge of a positive displacement pump or any other equipment that could possibly aerate the liquid.The best location will be as free as possible from flow disturbances, vibration, sources of heat, noise,or radiated energy.
PORTABLE
MODEL
PLASTIC
STD. TEMP.
SIZE
1 0 1 1 P P S . C 2

3-2
1010DVNFM-3CSection 3
• Avoid mounting the transducers on a section of pipe with any external scale. Remove all scale, rust,loose paint, etc., from the location.
• Do not mount the transducers on a surface aberration (pipe seam, etc.)
• Do not mount transducers from different ultrasonic flowmeters on the same pipe. Also, do not run thetransducer cables in common bundles with cables from communication equipment, other Siemenssystems, or any type of ultrasonic equipment. You can run these cables through a common conduitONLY if they originate at the same flowmeter.
• Never mount transducers under water, unless you order submersible units and you install them in ac-cordance with factory instructions.
• Never mount transducers on the top or bottom of a horizontal pipe. The best placement on a horizon-tal pipe is either the nine o’clock or three o’clock position for Reflect Mode, or one transducer at nineo’clock and one transducer at three o’clock for Direct Mode. Mounting on a vertical pipe is recom-mended only if flow is in the upward direction. When mounting on a vertical pipe flowing in adownward direction make sure there is sufficient back pressure in the system to maintain a fullpipe.
3.1.3 CLAMP-ON TRANSDUCER MOUNTING MODES
Siemens clamp-on transducers support Direct or Reflect mounting modes. The flow computer recom-mends a mounting mode after analyzing your pipe and liquid data entries. However, you can installclamp-on transducers in the way that best suits your application and the transducer type you purchased.
END VIEW(Horizontal Plane)
Transducer locatedat 9 o’clock
Transducer locatedat 3 o'clock
REFLECT MOUNT(Pipe shown in top view for ease in visualizing sonic path)
UpstreamTransducer
Sonic Path
Pipe
DownstreamTransducer

3-3
1010DVNFM-3CSection 3
We recommend Reflect mount whenever possible. This is the simplest way to mount the transducers.Also, Reflect mount resists abnormal flow profile conditions such as cross-flow within the flow stream.Reflect mode supports the AutoZero function, which zeroes the meter automatically without user-partici-pation. In addition, Reflect mount may be the only possibility if conditions do not allow access to theopposite side of the pipe.
Direct mount provides a shorter sonic beam path. This usually improves performance with sonicallyattenuative liquids or pipe materials. We recommend using Direct mount for plastic pipes. Compared toDirect mounting, Reflect mount requires almost double the amount of a straight pipe run. Therefore,Direct mount may be the only option if the availability of mounting space is limited.
3.1.4 PREPARING THE PIPE
1. Pick a mounting location with the longest straight run. You must have easy access to at least one sideof your pipe. The mounting location must remain full, even at zero flow.
2. Decide on your mounting mode (Direct or Reflect). Always use Reflect Mode whenever possible. Youmay only need to use Direct Mode if your pipe is plastic.
3. After receiving the spacing dimensions from the Installation Menu, prepare the pipe surface. De-grease the surface, if necessary, and remove any grit, corrosion, rust, loose paint, etc. Use abrasivematerial provided to provide a clean contact surface for the transducers.
4. Refer to the next sections for illustrated instructions on how to locate each area to be cleaned and howto use each mounting option.
Please note that the instructions show vertical mounting for clarity purposes only. Donot install transducers on the top of a pipe.
1234567890123456789012345678901234567890
1234567890123456789012345678901234567890
Cleaned areas. Clean an area 1/2” on either side oftransducer and additional 1/2” along the length ofthe transducer.
Pipe
PREPARING THE PIPE SURFACE
UpstreamTransducer
Sonic Path
Pipe
DownstreamTransducer
UpstreamTransducer
Sonic Path
Pipe
DownstreamTransducer
DIRECT MOUNT
(Pipe shown in Top View for ease in visualizing sonic path)

3-4
1010DVNFM-3CSection 3
3.1.5 REFLECT MODE WITH EZ CLAMP AND SPACER BAR ONLY
The EZ Clamp is a quick and easy way to securely mount transducers on any pipe. The spacer bar elim-inates manual spacing measurements and provides rigidity for mounting the transducers while main-taining axial alignment.
Customer's Pipe
Spacer Bar
Customer's Pipe
Index ScrewTransducer
Transducer IndexScrews-StorageLocation
1011PPS SeriesTransducer
Transducer1011HPS Series
Spring Clip
Spacer Bar
Cable Connection
INSTALLATION - REFLECT MOUNT WITH EZ CLAMP AND SPACING BAR
1. Perform all required menu steps until the flow computer issues the number index and prompts you topress [ENT] to finish the transducer install routine. Stop at this point. Note the number index valuedisplayed in the Pick/Install menu. You will use this number to properly space the transducers. Checkto ensure that you have a matched set of transducers. They both should have the same S/N numberbut marked with either an “A” or “B” (e.g., 100A and 100B).
2. Assemble the transducers to the spacer bar, with the cable connectors facing away from each otheras shown above. The spacer bar is attached to a transducer using a transducer index screw. Onetransducer is attached using the “REF” hole on the spacer bar. The second transducer is attached tothe spacer at the index hole specified in Step 1. Note that in some cases, the transducers may havetwo sets of holes for securing the transducers. When using the EZ Clamp assembly, use the lower setof holes when attaching the spacer bar.
3. Temporarily position the assembly (in the 9 o’clock position) at the location where you have deter-mined it would be mounted. Ensure that this is a smooth area without any raised spots (seams, etc.).Mark a generous area around the transducers (with a pencil or chalk) where they contact the pipe.Remove the assembly.
4. Prepare the two areas you marked by de-greasing the surface, if needed, and removing any grit,corrosion, rust, loose paint or surface irregularities with the abrasive pipe conditioning material pro-vided.
5. Remove the transducer from the spacer bar that was attached through the REF hole. Attach the EZclamp to the transducer under the spring clip. The adjusting nut knob should be pointing up and on theside opposite of the spacer bar. Unscrew the knob until it’s at the stop.

3-5
1010DVNFM-3CSection 3
and 'S' HookMate Bit Snap
Chain Extension Sections
Adjusting Nut
6. Apply a 1/8-inch continuous bead of couplant compound along the center (the long way) of thecontact surface of the transducer. Place transducer on the pipe center in the middle of one of theareas you have cleaned with the cable connector facing away from where the other transducer will beplaced.
7. While holding this transducer in-place, bring the chain around the pipe and attach the closest cross-link onto the hook of the EZ clamp. Tighten the adjusting nut until the chain is just snug around thepipe. Ensure that the chain is straight around the pipe and the transducer contacts the pipe at thewhite dot just under the front label. Ensure that there is equal space between the edges of the trans-ducer and pipe.
8. Repeat Steps 5 and 6 with the second transducer leaving it still attached to the spacer bar. Apply a 1/8-inch bead of couplant compound to the transducer. At the same time that you place it in the middle ofthe second area prepared, secure the spacing bar to the already mounted transducer by inserting thetransducer index screw through the REF hole on the Bar and into lowest hole on transducer (for thosetransducers that have two holes). Sight along spacer bar to ensure axial alignment to the pipe. Adjustif necessary. Tighten both chains. Do not overtighten. Ensure that transducers did not move whiletightening.
9. Connect the transducer cable, ensuring that you have observed the upstream/downstream orienta-tion in respect to the cable and the input jack on the flow computer. If this is a dual-channel unit, makesure you are connecting the cables to the correct channel’s input jacks. Repeat this procedure for thenumber index transducer.
3.1.6 DIRECT MODE WITH EZ CLAMP AND SPACER BAR ONLY
This section will present an easy, uncomplicated method of mounting transducers in Direct Mode andensuring that they will line up exactly 180o from each other (9 o’clock - 3 o’clock positions) and spacedthe proper distance apart.
EZ CLAMPING TRANSDUCER TO PIPE

3-6
1010DVNFM-3CSection 3
Chain Tension
Transducers
Chain
PIPE
VIEW FROM
TOP OF PIPE
INSTALLATION - DIRECT MOUNT WITH EZ CLAMP AND SPACER BAR
1. Perform all required menu steps until the flow computer issues the number index and prompts you topress [ENT] to finish the transducer install routine. Stop at this point. Note the number index valuedisplayed in the Pick/Install menu. You will use this number to properly space the transducers. Checkto ensure that you have a matched set of transducers. They both should have the same S/N numberbut marked with either an “A” or “B” (e.g., 100A and 100B).
2. Temporarily position one transducer (in the 9 o’clock position) at the location where you have deter-mined it would be mounted. Ensure that this is a smooth area without any raised spots (seams, etc.).Mark a generous area around the transducer where it contacts the pipe (with a pencil or chalk).Remove the transducer.
3. Prepare the area you marked by de-greasing the surface if needed and removing any grit, corrosion,rust, loose paint or surface irregularities with the abrasive pipe conditioning material provided.
4. Attach the EZ clamp to the transducer under the spring clip. The adjusting nut knob should be pointingup and on the side opposite of the spacer bar. Unscrew the knob until it’s at the stop.
EZ CLAMPING TRANSDUCER TO PIPEand 'S' HookMate Bit Snap
Chain Extension Sections
Adjusting Nut

3-7
1010DVNFM-3CSection 3
5. Apply a 1/8-inch continuous bead of couplant compound along the center (the long way) of the contactsurface of the transducer. Position this transducer on the center of the pipe in the middle of area youhave cleaned; the cable connector facing away from where the other transducer will go.
6. While holding the transducer in-place, bring the chain around the pipe and attach the closest cross-linkonto the hook of the EZ clamp. Tighten the adjusting nut until the chain is just snug around the pipe.Check to ensure that the chain is straight around the pipe and that the transducer is contacting thepipe at the white dot just under the front label. Ensure also that there is equal space on either side ofthe dot between the edges of the transducer and the pipe. Adjust if necessary. Tighten the chain but donot overtighten. Ensure the transducer did not move while tightening.
7. Attach the second transducer to the spacer bar at the index hole specified in paragraph #1. Note thatin some cases, the transducers may have two sets of holes for securing the spacer bar. When usingthe EZ clamp assembly, use the lower set of holes when attaching the spacer bar.
8. Unlike the first transducer, do not apply any couplant at this point. Attach the spacer bar (with thesecond transducer attached to it) to the mounted transducer by inserting an index screw through theREF hole in the bar and into the lowest hole on the transducer. Tighten. Visually ensure that the spacerbar is axially aligned with the pipe. While holding in this position, pencil a line (or a fine line with chalk)along the back edge of the transducer and a dot below where the white dot is below the front label(see “A” below). Disassemble the spacer bar and second transducer from the mounted transducerand remove the transducer from the bar. Use the bar as a straight edge and, with one edge againstthe mounted transducer’s white dot and the other crossing the dot you drew, draw a line crossing thedot (see “B” below). Set the bar aside.
TransducerPipe
Spacer Bar
MylarSpacingGuide
Transducer
Spacer Bar
Dot
Dot
Line
A
B
C
Transducer
Spacer Bar
Spacer Bar
Dot
Line
Transducer
MylarSpacingGuide
TransducerEdge Line
TransducerDotPipe

3-8
1010DVNFM-3CSection 3
9. Wrap the mylar spacing guide around the pipe so that the left edge is against the transducer edgemark (see “C” on previous page). Arrange so that one end overlaps the other by at least three inches.Trim to fit if necessary, but be sure not to trim at the overlapping end in order to keep itsquare.
10. Realign the left edge of the guide with the transducer edge mark. Line up both vertical edges of theguide and ensuring that it is snug around the pipe; mark along the overlapping edge.
11. Remove the Mylar spacing guide and lay it out on a flat surface. Either, measure the exact distancehalfway between the overlap edge and the mark at the overlap or fold the guide from the overlapedge to the overlap mark and draw a line at the fold or half way point.
12. Reinstall the spacing guide; its left edge abutting the transducers edge mark on the pipe and theoverlapping edge in line with the dot (now a line) on the pipe (see “C” on previous page). Tape it inthis position on the pipe. Take the second transducer and place it against the edge of the guide withits white dot centered on the center mark on the guide. Temporarily position the transducer (in the 3o’clock position opposite the mounted transducer) where it will be mounted. Ensure that this is asmooth area without any raised spots (seams, etc.). While holding, mark a generous area aroundthe transducer (with a pencil or chalk) where it contacts the pipe. Remove the transducer and themylar guide.
13. Prepare the area you marked by de-greasing the surface, if needed, and removing any grit, corro-sion, rust, loose paint or surface irregularities with the abrasive pipe conditioning material provided.
14. Replace the mylar guide back in the same position it was in and retape it to the pipe. Attach the EZclamp to the transducer under the spring clip. Unscrew the knob until it’s at the stop.
15. Apply a 1/8-inch continuous bead of couplant compound along the center (the long way) of thecontact surface of the transducer. Position this transducer on the center of the pipe and aligned withthe edge and center marks on the guide; with the cable connector facing away from the othertransducer.
16. While holding this transducer in-place, bring the chain around the pipe and attach the closest cross-link onto the hook of the EZ clamp. Tighten the adjusting nut until the chain is just snug around thepipe. Check to ensure that the chain is straight around the pipe and that the transducer is contactingthe pipe at the white dot which is just under the front label. Ensure that there is equal space on eitherside of the dot between the edges of the transducer and the pipe. Adjust if necessary. Tighten thechain but do not overtighten. Ensure that the transducer did not move while tightening.
17. Connect the transducer cable, ensuring that you have observed the upstream/downstream orienta-tion in respect to the cable and the input jack on the flow computer. If this is a dual-channel unit,make sure you are connecting the cables to the correct channel’s input jacks. Repeat this procedurefor the number index transducer.

3-9
1010DVNFM-3CSection 3
3.1.7 REFLECT MODE - MOUNTING FRAMES AND SPACER BAR
The combination of a spacer bar with mounting frames is the easiest way to mount in Reflect Mode. Theresult is a rigid structure that eliminates spacing measurements, and maintains the transducer-to-trans-ducer geometry. In addition, reflect mounting allows you to move the entire assembly while maintainingthe original transducer spacing.
1. Perform all required menu steps until the flow computer issues the number index and prompts you topress <ENT> to finish the transducer install routine. Stop at this point.
Note the number index value displayed in the Pick/Install menu. You will use this number to properlyspace the transducers. Check to ensure that you have a matched set of transducers. They both shouldhave the same S/N number but marked with either an “A” or “B” (e.g., 100A and 100B).
INSTALLATION - REFLECT MOUNT WITH FRAMES AND SPACER BARNOTE: Minimum Ltn 0.75 in. (18 mm)
Mounting Strappositioned aroundMounting Frame
Mounting StrapAdjusting Screw
Optional on larger pipes,you can link straps together
to surround pipeSpacer Bar(Front view)
Spacer Bar Platform &Clamping Screw
Mounting Strappositioned aroundMounting Frame
Optional on larger pipes,you can link straps together
to surround pipe.
Space Bar Platform &Clamping Screw
Space Bar(Front View)
Mounting StrapAdjusting screw
Mounting Strap
Transducer ClampingScrew
Note optional 2ndMounting Strapshown.Larger pipes mayneed an additionalstrap for a moresecure mount
Spacer Bar
Spring Clip(Not present on some
models)
1012 SeriesMounting Frame
Spacer BarPlatform andclamping screw
Spring Clip(Not present on
somemodels)
Transducer ClampingScrew
Spacer Bar
Spacer BarPlatform andclamping screw
Mounting Strap
Note operational2nd Mounting Strapshown.Larger pipes mayneed an additionalstrap for a moresecure mount.
1012 SeriesMounting Frame

3-10
1010DVNFM-3CSection 3
3.1.8 REFLECT MODE WITH SPACER BAR ONLY
The spacer bar eliminates manual spacing measurements and provides rigidity for mounting the trans-ducers while maintaining axial alignment.
2. On a flat surface, attach the spacer bar to a mounting frame so that the reference hole on thespacer bar fits over the post on the platform of the frame; tighten the securing screw. Slide thesecond mounting frame onto the other end of the spacer bar, align the number index hole with thepost on the platform; then tighten the securing screw. Ensure that the angled sides of both framesface away from each other. At the mounting location, place the mounting frame/spacer bar assem-bly on the pipe so that it rests on the top of the pipe. Wrap a mounting strap around the pipe. Engagethe end of the mounting strap with the mounting strap adjusting screw. Slide it under the spring clip(if so equipped) of one of the mounting frames. Make sure to position it for easy access to themounting strap adjusting screw. Do the same to the other mounting frame.
3. Tighten the mounting strap screw enough to take up all of the slack, but not enough to preventrotation of the assembly. Rotate the assembly on the pipe to the 9 o’clock position ensuring that it isa smooth area without any raised spots or seams. Mark a generous area around the mountingframes (1/2” on either side and half again the length front and back) with a pencil or chalk. Move orrevolve the assembly away from the area marked (loosen straps if necessary to do this).
4. Prepare the two areas you marked by de-greasing the surface, if needed, and removing any grit,corrosion, rust, loose paint or surface irregularities with the abrasive pipe conditioning material pro-vided. Clean the pipe of all debris and abrasive particles.
5. Reposition the assembly over the center of the prepared surfaces. Tighten the mounting straps toseat the assembly firmly on the pipe. Do not overtighten.
Apply a continuous 1/8-inch bead of coupling compound to the center of the face of a transducer,then slide it into the mounting frame but holding it away from making contact with the pipe until itbutts up against the stop (to keep from smearing couplant where it’s not needed); then push downonto the pipe. Tighten the transducer clamping screw to hold the transducer firmly in place. Repeatfor the other transducer.
6. Observing the upstream to downstream orientation, attach the UP and DN cables to the transducers.Attach the other ends to the flowmeter’s UP and DN terminals. See Engineering Drawing 1010N-7,Single Channel or 1010DN-7 Dual-Channel.
7. You can now press <ENT> to finish the transducer install routine. The available Mounting Strap kitsare listed below. Each kit comes with up to two band sizes to cover its designated pipe diameterrange and a spacing guide for Direct Mount.
Strap Mounting Kit P/N Pipe Diameter Band Sizes (Qty.)
1012MS-1A 2" (50.8mm) to 7" #88 (2) #128 (2)(177.8mm)
1012MS-1 2" (50.8mm) to 13" #88 (2) #152 (2)(330.2mm)
1012MS-2 13" (330.2mm) to 24" #188 (2) #280 (2)(609.6mm)
1012MS-3 24" (609.6mm) to 48" #152 (2) (1219.2mm)

3-11
1010DVNFM-3CSection 3
1. Perform all required menu steps until the flow computer issues the number index and prompts you topress <ENT> to finish the transducer install routine. Stop at this point.
Note the number index value displayed in the Pick/Install menu. You will use this index to properlyspace the transducers. Check to ensure that you have a matched set of transducers. They both shouldhave the same S/N number but marked with either an “A” or “B” (e.g., 100A and 100B).
2. Assemble the transducers to the spacer bar, with the cable connectors facing away from each otheras shown above. The spacer bar is attached to a transducer using a transducer index screw. Onetransducer is attached using the “REF” hole on the spacer bar. The second transducer is attached tothe spacer at the index hole specified in Step 1.
3. Temporarily position the assembly (in the 9 o’clock position) at the location where you have deter-mined it would be mounted. Ensure that it is a smooth area without any raised spots or seams. Marka generous area around the transducers (1/2” on either side and half again the length front and back)with a pencil or chalk. Remove the assembly.
4. Prepare the two areas you marked by de-greasing the surface, if needed, and removing any grit,corrosion, rust, loose paint or surface irregularities with the abrasive pipe conditioning material pro-vided. Clean the pipe of all debris and abrasive particles.
5. Remove transducer from the spacer bar that was attached through the REF hole. Put a mounting straparound the pipe and engage an end into the adjusting screw (adjusting screw should be pointing up).Apply a 1/8-inch continuous bead of couplant compound down the center (the long way) of the con-tact surface of one of the transducers (see Recommended Sonic Coupling Compounds Section 5).Place the transducer on the pipe center in the middle of one of the areas you have cleaned with itscable connector pointing away from the other cleaned area. Holding the transducer in place, slide themounting strap over it (and under the clip if there is one) and tighten with a screwdriver. While tight-ening, check to ensure that the white dot under the front label is centered on the pipe and that thereis equal space on both edges. Also, Make sure to position strap for easy access to the mounting strapadjusting screw.
6. Repeat Step 5 with the second transducer leaving it still attached to the spacer bar. Apply a 1/8-inchbead of couplant to the transducer. At the same time you place it in the middle of the second areaprepared, secure the spacing bar to the already mounted transducer by inserting the transducer
INSTALLATION - REFLECT MOUNT WITH TRANSDUCERS AND SPACING BAR
1011 SeriesTransducer
Spacer BarSpring Clip
Spacer Bar ReferenceIndex Securing Screw
MountingStrap
Spacer BarNumber IndexSecuring Screw

3-12
1010DVNFM-3CSection 3
index screw through the REF hole on the Bar. Put mounting strap around transducer and tighten as inStep 5. Sight along spacer bar to ensure axial alignment to the pipe. Adjust if necessary and do notovertighten. Ensure that the transducers do not move while tightening.
7. Connect the transducer cable, ensuring that you have observed the upstream/downstream orienta-tion in respect to the cable and the input jack on the flow computer. If this is a dual-channel unit, makesure you are connecting the cables to the correct channel’s input jacks. Repeat this procedure for thenumber index transducer.
8. Return to the menu, and press <ENT> to finish the transducer install routine.
3.1.9 DIRECT MODE - MOUNTING FRAMES, SPACER BAR AND SPACING GUIDES
The combination of mounting frames, spacer bar and spacing guides is the recommended way to mountDirect Mode transducers. The mounting frame establishes the axial alignment of the transducers, andallows you to remove and replace either transducer while preserving their exact mounting location.
For Direct Mode mounting, you will use a spacer bar to establish the distance between transducers anda spacing guide to easily locate the transducers at the nine o’clock and three o’clock positions. Shouldthe distance between transducers be beyond the span of a spacer bar, a measuring tape can be used.The Mylar spacing guide comes in various lengths and widths to accommodate most pipe sizes (see listbelow).
Spacing Guide P/N Size
1012-145-1A 2" x 26" (50.8 x 660.4 mm)1012-145-1 2" x 45" (50.8 x 1143.0 mm)1012-145-2 4" x 81" (101.6 x 2057.4 mm)1012-145-3 4" x 155" (101.6 x 3937.0 mm)
INSTALLATION - DIRECT MODE WITH TRANSDUCERS, MOUNTING FRAMESSPACER BAR (Not Shown) AND SPACING GUIDE
Ltn
Transducer
ClampingScrew
Mounting
Frame
MountingStrap
Ltn
ReferenceNotch
Mounting StrapAdjusting Screw

3-13
1010DVNFM-3CSection 3
1. Perform all the required menu steps up until the point where the flow computer issues the numberindex and prompts you to press <ENT> to finish the transducer install routine.
Make a note of the number index displayed in the Pick/Install menu. Check to ensure that you have amatched set of transducers. They both should have the same S/N number but marked with either an“A” or “B” (e.g., 100A and 100B).
2. Temporarily position one of the frames on the pipe where you will be mounting it. Ensure that this isa smooth area without any raised areas (seams, etc.) With a pencil or chalk, mark a generous areaaround the frame (1/2” on either side and half again the length front and back). Remove the assem-bly.
3. Prepare the area you marked by de-greasing surface, if needed, and removing any grit, corrosion,rust, loose paint or surface irregularities with the abrasive material provided.
4. Put a mounting strap around the pipe and engage an end into adjusting screw (screw should bepointing up). Position frame in the middle of area you have cleaned and centered on the pipe with itsangled end facing away from where the other frame will sit.
5. Slide the mounting strap over it (and under the clip if there is one) and tighten with a screwdriver.While tightening, check to ensure that the center of the tapered roller is centered on the pipe.
6. Attach the second frame to the spacer bar with an index spacer screw into the index hole specifiedin Step 1. The angle on the frame should be facing away from the direction the length of the bar isgoing. Now attach the free end of the spacer bar by inserting an index spacer screw through the REFhole on the spacer bar and then into the hole on the mounted frame. Tighten. Sight to ensure thatthis frame is lined up in center of pipe and while holding alignment, place a dot (with pencil or chalk)in the center of the tapered roller at the bottom of the frame (see A below). While holding, also markalong the front edge of the frame with pencil or fine chalk line (see B below).
MYLAR SPACING GUIDE
WRAPPING STRAP UNDER PIPE AND ATTACHING TO ADJUSTING SCREW
Mounting StrapAdjusting Screw
Transducer ClampingScrew
Mounting Strap
Spring ClipTransducer Clamping
Screw
Mounting Strap
Spring Clip
Mounting StrapAdjusting Screw
Mounting Strap

3-14
1010DVNFM-3CSection 3
7. Disassemble the spacer bar and the unmounted frame. Use the bar as a straight edge and, with oneedge against the mounted frames tapered roller center and the other crossing the dot you drew,draw a line crossing the dot (see “B” above). Set the bar aside.
8. Wrap the mylar spacing guide around the pipe so that the left edge is against the transducer edgemark (see “C” above). Arrange so that one end overlaps the other by at least three inches. Trim to fitif necessary, but be sure not to trim at the overlapping end in order to keep it square.
9. Realign left edge of the guide with the transducer edge mark. Line up both vertical edges of the guideand ensuring that it is snug around the pipe, mark along the overlapping edge.
10. Remove Mylar spacing guide and lay it out on a flat surface. Either measure the exact distance half-way between the overlap edge and the mark at the overlap, or fold the guide from the overlap edgeto overlap mark and draw a line at the fold or halfway point (see next page).
TransducerPipe
Spacer Bar
MylarSpacingGuide
Transducer
Spacer Bar
Dot
Dot
Line
A
B
C
Transducer
Spacer Bar
Spacer Bar
Dot
Line
Transducer
MylarSpacingGuide
TransducerEdge Line
TransducerDotPipe
WRAPPING THE MYLAR SPACING GUIDE AROUND THE PIPE
END VIEW
3" OverlappingEdge
MylarSpacing GuideTrim material from
inner edge ifnecessary
Trim material frominner edge if
necessary
3” OverlappingEdge
MylarSpacing Guide
End View

3-15
1010DVNFM-3CSection 3
11. Reinstall the spacing guide; its left edge abutting the transducers edge mark on the pipe and theoverlapping edge in line with the dot (now a line) on the pipe (see “C” on previous page). Tape it inthis position on the pipe. Take the second frame and place it against the edge of the guide with itstapered roller centered on the center mark on the guide. Temporarily position the frame (in the 3o’clock position opposite the mounted frame - see below) where it will be mounted. Ensure that thisis a smooth area without any raised spots (seams, etc.). Mark a generous area around the mountingframes (1/2-inch on either side and half again the length front and back) with a pencil or chalk.Remove the frame and the mylar guide.
12. Prepare the area you marked by de-greasing the surface, if needed, and removing any grit, corro-sion, rust, loose paint or surface irregularities with the abrasive pipe conditioning material provided.Clean the pipe of any debris and abrasive particles.
13. Replace the mylar guide back in the same position it was in and retape it to the pipe.
14. Put a mounting strap around the pipe and engage an end into adjusting screw (screw should bepointing up). Position frame in the middle of area you have cleaned and centered on the pipe with itsangled end facing away from where the other frame will sit; and aligned with the edge and centermarks on the guide. Slide the mounting strap over it (and under the clip if there is one) and tightenwith a screwdriver. While tightening, check to ensure that the center of the tapered roller is centeredon the pipe.
15. Apply a 1/8-inch continuous bead of couplant compound down the center (the long way) of thecontact surface of one of the transducers. Place the transducer into one of the frames so that thecouplant compound does not smear until it contacts the pipe. Slide it in until it butts against the stopand, while holding in-place, tighten the transducer clamping screw tight enough to hold firmly in-place. Do the same with the other transducer.
16. Connect the transducer cable, ensuring that you have observed the upstream/downstream orienta-tion in respect to the cable and the input jack on the flow computer. If this is a dual-channel unit,make sure you are connecting the cables to the correct channel’s input jacks. Repeat this procedurefor the number index transducer.
17. Return to the menu, and press <to finish the transducer install routine.
FINDING THE HALFWAY DISTANCE
Overlap EdgeMark (or fold) exactlyat half-way point
SPACING GUIDE
CIRCUMFERENCE
ALIGNING THE TRANSDUCERS FOR DIRECT MODE OPERATION
3 o’clockTransducer
9 o’clock Transducer
9 o’clockTransducer
3 o’clockTransducer

3-16
1010DVNFM-3CSection 3
3.1.10 USING 1012T MOUNTING TRACKS
The 1012TP and 1012THP Mounting Tracks provide a rigid mounting platform for Series 1011 universalor high precision size A or B transducers. The mounting tracks service pipe sizes up to a maximum of5.00” (140 mm) outer diameter. Operating temperatures are supported up to 250°F (121°C). The as-sembly consists of lightweight aluminum track rails with integral transducer clamping screws. Attachedindex pins enable positive locating of the transducers at fixed spacing locations. Roller-chains and ten-sion screws secure the assembly to the pipe. The following instructions refer to 1011 universal transduc-ers. Please refer to Engineering Drawing 1012THP-7A for reflect mounting of high precision transducersand 1012THP-7B for direct mounting of high precision transducers.
The 1012T mounting tracks support both Direct and Reflect mounting modes. The flow computer recom-mends the appropriate transducers, mounting track and mounting mode, based on the pipe data en-tries. Refer to the instructions in paragraph 2.4 for details on the Transducer Installation procedure. Ifnecessary, review paragraphs 3.1.2 through 3.1.4 for details on how to select and prepare a mountinglocation on your pipe.
Installing a 1012T Mounting Track in Reflect Mode
Paragraph 2.4 describes the Transducer Installation procedures that lead up to the automatic selection oftransducers, mounting mode and spacing method. Examine the figure below, which shows a typicalPick/Install Xdcr menu screen. Note the automatic assignment of model numbers for the transducer andmounting track, plus the designation of the number index.
This example requires a Model 1012T Mounting Track to accommodate size B3 universal transducers.Note the reported number index. You will be inserting an index pin into this hole on the track rail toposition one of the transducers (see diagram on next page).
1. Perform all required menu steps up until the point where you respond to the [Install Completed?]prompt. Note the reported number index. You will be inserting index pins into this hole and thereference hole on the track rail (see diagram on next page). Check to ensure that you have a matchedset of transducers. They both should have the same S/N number but marked with either an “A” or “B”(e.g., 100A and 100B).
Note selection oftype, size andmounting mode.
Note selection ofmounting track partnumber and numberindex.
Siemens 2 Channel [1] SITE1
Key [Install] after mounting transducers
Pick/Install Xdcr
Transducer Model 1011 Universal
Transducer Size B3
Xdcr Mount Mode Reflect
Spacing Offset Minimum
Number Index 6
Spacing Method Track 1012TP
Ltn Value (in) 0.581
Install Completed? No
Empty Pipe Set Channel Not Setup
Zero Flow Adjust Channel Not Setup

3-17
1010DVNFM-3CSection 3
2. Place the track rail assembly on the top surface of the pipe at the location where you have determinedit would be mounted. Ensure that it is a smooth area without any raised spots or seams. Holding theassembly in place, loop one of the roller chains under the pipe, pull it around and maintain tensionwhile slipping a link over the tension screw hook. Tighten the tension screw enough to hold theassembly on the pipe, but still allow rotation. Repeat for the other roller chain. Rotate the track railassembly to the intended nine o’clock mounting position on the pipe, then tighten both tension screwsjust enough to prevent rotation. Do not overtighten.
3. Mark a generous area around the transducers (1/2-inch on either side and half again the length frontand back) with a pencil or chalk. Loosen and move the assembly away from marked area. Preparethe two areas you marked by de-greasing the surface, if needed, and removing any grit, corrosion,rust, loose paint or surface irregularities with the abrasive pipe conditioning material provided. Cleanthe pipe of all debris and abrasive particles.
4. Insert the index pin into the reference hole. Select a transducer, apply a thin band of couplant com-pound to the transducer’s contact surface. Place the transducer between the track rails, slightly be-hind the pin and under the clamping screw assembly. Slide it forward until it butts up firmly against thereference pin.
Flow�
Reference PinShown Inserted
Chain TensionScrew
UpstreamTransducer
TransducerClamping Screw
Downstream Xdcr
RollerChainNumber Index pin
Shown inserted
Track RailAssembly
Chain TensionScrew
UpstreamTransducer
TransducerClamping Screw Downstream
Transducer
RollerChain
Number Index PinShown Inserted
Track RailAssembly
Reference PinShown Inserted
Flow �
INSTALLATION - REFLECT MOUNT WITH MOUNTING TRACK
FRONT VIEW
ChainTension
Screw
Loop Chain overtension screw hook
Chain TensionScrew
Loop Chainover tensionscrew hook
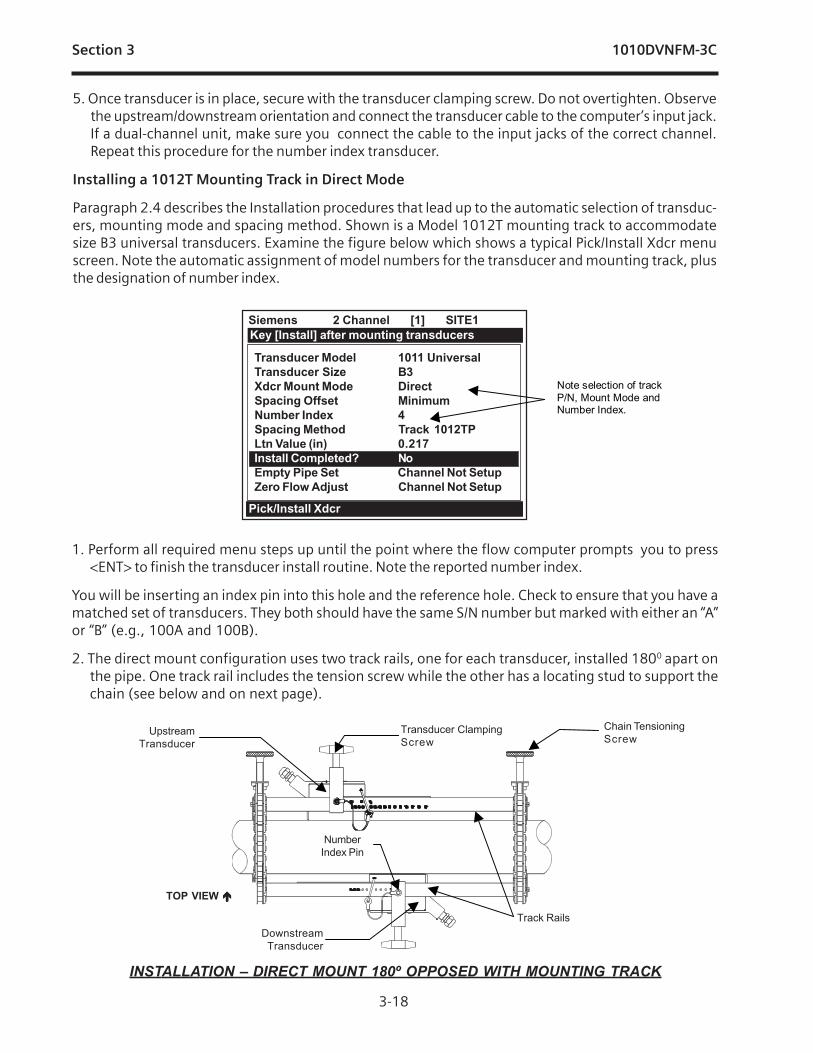
3-18
1010DVNFM-3CSection 3
5. Once transducer is in place, secure with the transducer clamping screw. Do not overtighten. Observethe upstream/downstream orientation and connect the transducer cable to the computer’s input jack.If a dual-channel unit, make sure you connect the cable to the input jacks of the correct channel.Repeat this procedure for the number index transducer.
Installing a 1012T Mounting Track in Direct Mode
Paragraph 2.4 describes the Installation procedures that lead up to the automatic selection of transduc-ers, mounting mode and spacing method. Shown is a Model 1012T mounting track to accommodatesize B3 universal transducers. Examine the figure below which shows a typical Pick/Install Xdcr menuscreen. Note the automatic assignment of model numbers for the transducer and mounting track, plusthe designation of number index.
1. Perform all required menu steps up until the point where the flow computer prompts you to press<ENT> to finish the transducer install routine. Note the reported number index.
You will be inserting an index pin into this hole and the reference hole. Check to ensure that you have amatched set of transducers. They both should have the same S/N number but marked with either an “A”or “B” (e.g., 100A and 100B).
2. The direct mount configuration uses two track rails, one for each transducer, installed 1800 apart onthe pipe. One track rail includes the tension screw while the other has a locating stud to support thechain (see below and on next page).
Transducer Model 1011 Universal
Transducer Size B3
Xdcr Mount Mode Direct
Spacing Offset Minimum
Number Index 4
Spacing Method Track 1012TP
Ltn Value (in) 0.217
Install Completed? No
Empty Pipe Set Channel Not Setup
Zero Flow Adjust Channel Not Setup
Siemens 2 Channel [1] SITE1
Key [Install] after mounting transducers
Pick/Install Xdcr
Note selection of trackP/N, Mount Mode andNumber Index.
INSTALLATION – DIRECT MOUNT 180º OPPOSED WITH MOUNTING TRACK
UpstreamTransducer
ChainTensioningScrew
Transducer ClampingScrew
DownstreamTransducer
NumberIndex Pin
TOP VIEW
Track Rails
UpstreamTransducer
Transducer ClampingScrew
Chain TensioningScrew
Track RailsDownstreamTransducer
NumberIndex Pin
TOP VIEW �����

3-19
1010DVNFM-3CSection 3
3. If this is a horizontal pipe, place the track with the chain tension screws on top of the pipe (screws up,the chains hanging down and the numbered scale facing you) where you have determined it wouldbe best to mount it.
4. Place the other track (with the centering stud on the bottom and the lettering on the scale toward thesame side as the top track) directly underneath it (1800). Hold in place while you wrap the chainaround the pipe; first onto the centering stud on the bottom track and then onto the hook under theTensioning Screw. With the chain in-place, count the number of links between the beginning of thechain and the centering stud; and then between the centering stud and the hook. They both shouldhave the same number of links. Arrange so they do and then loosely tighten. Do the same with theother chain. For a vertical pipe installation, it will probably be much easier to tie, tape or bungee cordthe two tracks in place while chaining.
5. Wrap a length of the mylar spacing guide around the pipe and against the end of the track assembly.Ensure that the edges on both sides align and tape to the pipe. Loosen the chains enough to allowyou to rotate the track assembly 900 until one track is in a 9 o’clock position and the other in a 3o’clock position on the pipe (horizontal pipe). Tighten both chains but not too tight.
6. Insert an index pin into the REF hole of the track with the tensioning screws. Take one of the transduc-ers and insert it between the track rails and to the left of the index pin with the cable connectorpointing away from the pin. Move the transducer right until the pin stops it. Hold it in this position andmove the transducer clamping screw over the transducer and tighten. Insert the other index pin intothe index hole (see step #1) on the other track marked “Direct Mode Spacing.” Insert the secondtransducer (with its cable connector pointing away from the pin) between the track rails on the rightside of the pin and move the transducer left until it’s stopped by the pin and then follow the sameprocedure as with the first transducer.
7. Mark a generous area around the transducers where they contact the pipe with a pencil or chalk.Make a mark showing the center between the tracks on the mylar guide. Release the tension on thetransducers and remove them. Loosen the chains and rotate the track assembly on the pipe so youcan gain access to the areas marked.
8. Prepare the area you marked by degreasing the surface, if needed, and removing any grit, corro-sion, rust, loose paint or surface irregularities with the abrasive pipe conditioning material provided.
9. Revolve the tracks on the pipe into the position they were originally in by using the edge of the mylarguide as a stop for both the upper and lower tracks and the mark on the guide to center that track.This time, before installing each transducer, apply a 1/8-inch continuous bead of couplant compoundalong the center (the long way) of the contact surface of the transducer. Also, keep the transducerslifted slightly from the pipe when installing until the transducer is against the pin; then push downagainst the pipe. Remember to install the transducers with the cable connectors facing away fromeach other.
Tension ScrewHook Center of this link is over the
locating stud. An equal number oflinks on either side of this studensures 180� opposed installation.
ChainTension
Screw
XdcrClampingScrewChain Tension
Screw
Tension ScrewHook
Center of this link is over thelocating stud. an equal number oflinks on either side of this studensures 180 degrees opposedinstallation.
TransducerClamping Screw

3-20
1010DVNFM-3CSection 3
THERMAL COUPLANT
CUSTOMER’S PIPE
1012EC SERIES CABLE
992EMTN MOUNTINGASSEMBLY
991T CLAMP-ON TEMPERATURE SENSOR(MATCHED PAIR REQUIRED)
1012EC SERIES CABLE
THREADED PIPE FITTING
THERMOWELL
THERMAL COUPLANT
PIPE WALL
991TW TEMPERATURE SENSORCONNECTOR HEAD ASSEMBLY
SPRING LOADEDSENSING ELEMENT
Once the transducer is in place, Secure it with its clamping screw. Do not overtighten.
NOTE: Some transducers require a right-angle adapter. This adapter should be installed beforeplacing the transducer in the tracks.
10. Connect the transducer cable, ensuring that you have observed the Upstream/Downstream ori-entation in respect to the cable and the input jack on the flow computer. If this is a dual-channelunit, make sure you are connecting the cables to the correct channel input jacks.
3.2 MOUNTING TEMPERATURE SENSORS
In order to accurately measure temperature differential in energy flow loops, Siemens Flowmeters aredesigned to work with a pair of matched temperature sensors. These are available in clamp-on style991T, or in insert (thermowell) style 991TW. Both styles incorporate 1000 ohm platinum RTD’s for highprecision.
Clamp-on style sensors are mounted on the surface of the monitored pipe using 992EMT series mount-ing assemblies. Apply a generous quantity of the thermal couplant provided to the tip of the sensor andattach it securely to the cleaned pipe surface with the proper mounting assembly. Temperature mea-surement anomalies resulting from variations in the ambient conditions can be minimized by insulatingthe pipe and sensor after installation.

3-21
1010DVNFM-3CSection 3
The 991TW insert sensors are designed to be used in pipes equipped with Thermowells. These arespring-loaded, 1/4” diameter sensors with 1/2” NPT integral connection heads, available in several lengthsto accommodate a range of pipe sizes. Thermowells for new installations are available from Alloy Engi-neering Company in Bridgeport, Connecticut.
3.2.1 WIRING TEMPERATURE SENSOR TO THE ANALOG INPUT MODULE
WARNING: Set flowmeter and instrumentation power to OFF when inserting or removing theAnalog Input Module, or when making connections to TB1, TB2, TB3, and TB4.
� Open the FUH1010DVN flowmeter top cover by releasing the cover latch.� Place the power switch to the OFF position.� Loosen the captive thumbscrew securing the Access Cover and remove Access Cover.� Using a flat-blade screwdriver, remove four captive screws securing the I/O board.� Carefully remove the I/O board and set it aside.
Access CoverScrew
FUH1010DVN
Power Switich
Latch
FUH1010DVN Single Channel Temperature Sensor Inputs
TOP VIEW
SHORT TERMINALS 1 AND 4SINCE T2 IS NOT BEING USED -see note below.
TO SENSOR
NOTE: If this meter is using only one RTD tem-perature sensor, short terminals 1 and4 of TB2 with a jumper wire to completethe dual RTD current loop.
Refer to paragraph 3.2.1 step3 on next page.

3-22
1010DVNFM-3CSection 3
��Tighten all TB1 and TB2 terminal block screws.
��Replace I/O Board and secure with four captive screws.
��Replace Access Cover and finger tighten captive thumbscrew.
��Using a flat-blade screwdriver, loosen Terminal Block TB1 and TB2 screws.
��Connect the wires of the 1012EC Series cable as follows:
3.2.2 FUH1010DVN SUPPLY AND RETURN CONNECTIONS
Terminals for the supply and return sensor connections are located on the Analog Input Module as previ-ously shown. For other terminal locations on System 1010N Single Channel and Dual Channel units, seedrawings 1010N-5-7 or 1010N-5D-7, respectively. For terminal locations on Multi-Channel units, seedrawing 1010N-8M-7.
WARNING: Set meter and instrumentation power to OFF when inserting or removing the mod-ule, or when making connections to TB1, TB2, TB3, and TB4.
1. Connect the RTD liquid temperature cable (1012EC) as shown in the table below:
2. Complete the temperature sensor current loop by shorting together terminals 1 and 4 of theunused TB2 temperature sensor terminal block.
3. Ground the voltage sensing leads (terminals 2 and 3 of TB2) by connecting them both toterminal 5.
1012EC Series
CableTERMINAL TB1
WIRE #1 (Black) to TB1-1
WIRE #2 (White to TB1-2
WIRE #3 (Green) to TB1-3
WIRE #4 (Red) to TB1-4
WIRE #5 GND/SHLD (Blue) to TB1-5

3-23
1010DVNFM-3CSection 3
FUH1010DVN Dual Channel Temperature Sensor Inputs
3.2.3 NOTES ON FUH1010DVN ANALOG INPUT MODULES
Single Channel Models
� System FUH1010DVN NEMA flowmeters report input module temperature sensor connectionsT1 and T2 as system variables.
Dual Path Models
� The Dual Path instrument uses T1 to report liquid temperature. Note that T2 is used to reportambient temperature in some Leak Detector systems.
� The Analog Input of temperature takes priority over the built-in RTD (Resistive Thermal Device)measurement of temperature.
3.2.4 CLAMP-ON RESISTIVE TEMPERATURE DEVICE (RTD) INSTALLATION NOTES
The Clamp-On RTD sensor, with which your FUH1010DVN is supplied, is extremely sensitive and pre-cise. Its contribution to the performance of your meter can be as important as that of the liquid flowsensors. Please consult the installation drawings for details on physical installation and wiring of the RTD.In order to produce the best possible tracking of the true liquid temperature, try to make your installationconform to the notes on the installation drawing and these following tips:
� Prepare the pipe surface by removing paint to expose bare metal and by smoothing out any remain-ing rough spots.
� Use the thermal couplant compound (CC#117) between the face of the RTD element and the pipesurface to improve the conductivity of the metal-to-metal contact.

3-24
1010DVNFM-3CSection 3
� Keep the RTD out of direct sunlight or other non-pipe sources of heat or cold that may affect theirtemperature sensing. The foam insulator supplied helps in this regard, but consider using additionalpipe insulation for all installations exposed to extreme ambient conditions. Consider mounting the RTDunder the pipe in order to keep it out of direct sunlight.
��In installations where RTD elements are exposed to harsh conditions such as condensation, salt spray,etc., use CC#110 couplant compound to coat the connection between the cable and the RTD sensor.Consult Installation Drawing 991TN-7 for details.
��Be sure to install the supply RTD Sensors (see diagram on previous page) in the appropriate locations.
� Be sure to correctly indicate where the flow is being measured in the “Location” item of the 1010menu; either supply or return.

4-1
1010DVNFM-3CSection 4
4. THE METER FACILITIES MENU AND GRAPHIC DISPLAY SCREENS
Meter Facilities functions are available immediately after pressing <MENU>. The Meter Facilities menuprovides global control that enables you to identify and activate the following functions and features ofthe hardware supported by this model.
� Select data entry and meter output in either English (default) or metric units.� Customize the default pipe and transducer tables to suit your requirements.� Output, display, erase and select a memory management method for the Datalogger.� Determine the amount of memory available.� Verify/Adjust the analog output voltage and current using a multimeter.� Verify/Adjust the analog pulse output using a frequency counter.� Calibrate the RTD temperature sensors.� Set the system clock/calendar.� Obtain detailed software/hardware identification.
4.1 PREFERRED UNITS
The selection you make in this menu cell becomes the default units for all menu items and data outputs.You can choose either English or metric units. The factory setting is English.
To specify metric default units for all meter functions:
To access the [Preferred Units] option list press
Move the cursor to [Metric] by pressing
To register your selection press ENT
This menu allows youto specify default
measurement units.
This menu allows youto create or edit pipe
and transducer tables.
This menu allows youto work with and
select a Dataloggerstorage method.
This menu allows you tocalibrate the RTD
Temperature Sensors.
This menu shows detailed informationabout this model's hardware and software.
This menu allowsyou to view thenumber of datamemory bytes.
This menu allowsyou to fine-tune theanalog outputs.
This menu allows youto set the systemclock/calendar.
This menu allows youto select RS-232 portparameters.
Siemens Dual Path SITE 1
Table Setups
Datalogger Control
Memory Control
Analog Output Trim
RTD Calibrate
Clock Set 09.02.99 09.30.06
RS-232 Setup 9600 Odd 7
Backlight On
System Info
Preferred Units English
Meter Facilities
Select Default Units for all Menus

4-2
1010DVNFM-3CSection 4
4.2 THE TABLE SETUPS MENU
The [Table Setups] menu allows you to pre-condition your pipe table and transducer types.The edits made in [Table Setups] become the default settings for creating a new site. Transducers “marked”in the [Transducer Types] menu will be preferentially selected when the meter recommends transducersduring the automatic Pick/Install Transducer routine.
To access the Table Setups menu press
4.2.1 PIPE TABLE
The factory-programmed pipe table describes over sixty standard English and metric pipes. The tablecan save you programming steps by loading all required data at once from option list selection. The PipeTable configuration is [PIPE CLASS � PIPE NAME]. Pipe Class presents a list of standard metric andEnglish Pipe classifications. Selecting a class (e.g., ASA Carbon Steel) conditions the Pipe Name optionlist to all the stored pipes within that class (see Menu Chart above). Selecting a pipe by its name (e.g.,2SS10) loads a description of that pipe in the remaining menu cells. Note that liner data is not provided.If your pipe is lined, then you will be required to enter the liner material and its thickness manually.
To access the Pipe Table menu press
*NOTE: The highlighted selection in the above table illustrates how to choose the ASA Stain-less Steel Pipe Class and all its available Pipe Name selections. All other Pipe Classes(e.g., ASA Carbon Steel) listed can be selected in the same manner.
(continued)
Create/Edit Pipe Choose Pipe Class ASA Stainless Steel*
ASA Carbon Steel
ASA PlasticMetric DN SteelMetric SGP SteelCast Iron TableDuctile Iron TableCopper Tube Table
Choose Pipe Name ASA Stainless Steel* ASA Carbon Steel ASA Plastic
1SS10 1CS40 1P40
2SS10 1CS80 1P803SS10 2CS40 2P404SS10 2CS80 2P806SS10 3CS40 3P408SS10 3CS80 3P80Metric DN Steel 4CS40 4P40
50DN 4CS80 4P80
�
�
�
�
�
�
� � �
�
�
PIPE TABLE MENU STRUCTURE
��Table Setups Pipe Table
Transducer Type

4-3
1010DVNFM-3CSection 4
4.2.2 CREATE/EDIT PIPE
The Pipe Table provides the primary data that the system uses to operate with different classes of pipes.This menu allows you to edit the pipe table by modifying any existing pipe or add an entirely new pipe.
An example of how to use the Create/Edit Function:
To access the Create/Edit menu press
To access the Pipe Class option list press
100 DN 6CS40 6P40 200 DN 6CS80 6P80 400 DN 8CS40 8P40 800 DN 8CS80 8P80
Metric SGP Steel 10CS XS 10P XS
20A-SGP 10CS40 10P40
25A-SGP 12CS STD 12P STD 32A-SGP 12CS XS 12P XS 40A-SGP 16CS STD 16P STD 50A-SGP 16CS XS 16P XS 65A-SGP 18CS STD 18P STD 80A-SGP 18CS XS 18P XS 90A-SGP 20CS STD 20P STD 100A-SGP 20CS XS 20P XS 125A-SGP 24CS STD 24P STD 150A-SGP 24CS XS 24P XS 175A-SGP 30CS STD 30P STD 200A-SGP 30CS XS 30P XS 225A-SGP 36CS STD 36P STD 250A-SGP 36CS XS 36P XS
300A-SGP Cast Iron Table Copper Tube Table
350A-SGP 6” cls C 1” type M
400A-SGP 10” cls C 1” type K 450A-SGP 12” cls C 1” type L 500A-SGP 16” cls C 2” type M
20” cls C 2” type K Ductile Iron Table 2” type L
6” cls 52 4” type M
8” cls 52 4” type K10” cls 52 4” type L12” cls 56” 6” type M16” cls 52 6” type K24” cls 52 6” type L
Outer Diameter (in) x.xxx (numeric entry)
Wall Thickness (in) x.xxx (numeric entry)
Liner Material None
Cement Coal Tar Enamel Glass Plastic HDPE Teflon Rubber
Liner Thickness x.xxx (numeric entry)
Delete Pipe Choose Pipe Class *See Create/Edit Pipe
Pick Pipe Name *See Create/Edit Pipe
Choose Pipe Name
�
�
�
�
�
� �
� �
�
�
� �
��
�
�
�
�
�
�
PIPE TABLE MENU STRUCTURE (continued)Create/Edit Pipe �
�
�
�

4-4
1010DVNFM-3CSection 4
Scroll the option list to a class that provides the closest match to your pipe press
To select the Pipe Class press . This moves the highlight to Choose Pipe Name.
To access the Pipe Name option list press .
Scroll the option list press to a pipe name and press to select it.
This loads Outer Diameter and Wall thickness for the Selected Pipe.
The highlight moves to Outer Diameter. Press to enable numeric entry. Type the actualpipe OD using the appropriate English or metric units. Press to store the OD. The high-light moves to Wall Thickness.
Press to enable numeric entry. Type the actual wall thickness using the appropriateEnglish or metric units. Press to store the wall thickness.
Select a Liner Material and enter its thickness (if required).
Press to leave the Create/Edit Pipe menu. This triggers the Save Pipe pop-up Window.Note that the second line lists the name of the selected pipe. Press and then pressto use this name.
To use a new name, press and then use the appropriate arrow keys to rename the pipe(8 chars. Max.). Press . This adds the new pipe to the pipe class.
4.2.3 DELETE PIPE
This menu allows you to remove any of the pre-loaded pipes within a class from a pipe table. Werecommend that you use this function only to delete pipes that you have added so as to preserve thefactory presets.
To delete a Pipe from the Pipe Table
To access the Delete Pipe menu press . To access the Pipe Class option list press
Scroll the option list press to the class that contains the pipe to be deleted.
To select the Pipe Class press . This moves the highlight to Choose Pipe Name.
To access the Pipe Name option list press .
Scroll the option list to the pipe to be deleted by pressing .
To remove it from the pipe table press .
4.3 TRANSDUCER TYPE MENU
During the Transducer Install procedure, FUH1010DVN analyzes the entered pipe and liquid data, thenautomatically generates a list of the transducer sizes most suited for the application.
ENT
ENT
ENT
ENT
ENT
ENT
ENT
ENT

4-5
1010DVNFM-3CSection 4
The Transducer Type menu allows you to place “marks” next to any transducers that you may want themeter to consider preferentially during its recommendation routine. These transducers will be includedon the recommended list, which appears from on the reverse-video prompt line at the top of the displayscreen. The left-most transducer on the list is the most applicable while the right-most transducer on thelist is the least applicable.
To mark Transducers:
To access the [Transducer Type] menu press .
Scroll the highlight by pressing to a transducer type (e.g., 1011H High Precision)then press to access the size option list.
Scroll through the option list by pressing and use to “mark” desired transduc-ers. Note that a plus sign (+) appears before each “marked” transducer.
If you want to clear a “marked” transducer, move the highlight to the transducer then press the key. Note that this removes the plus sign.
To leave an option list press .
ENT
CLR
Transducer Type 1011 Universal A1A2B1B2B3C1C2C3D1D2D3E1E2E3
1011H Hi Precision A1HA2HA3HB1HB2HB3HC1HC2HD1HD2HD3HD4H
991 Universal 0A0122A33A44A55A
� �
�
�
�
�
�
�
�
�
�
TRANSDUCER TYPE MENU STRUCTURE

4-6
1010DVNFM-3CSection 4
4.4 THE DATALOGGER CONTROL MENU
The Datalogger Setup menu in the Channel Setup menu provides the Datalogger controls for the meter’smeasurement channels. It allows you to enable usage, select data items/alarm events, a logging intervaland a destination for your Datalogger reports. While the Datalogger Setup menu is measurement chan-nel specific, this Datalogger Control menu provides global control functions. This means that the settingsmade here apply to all measurement channels, meter types, operating modes, etc. This is possiblebecause the meter stores logged data in a single file. This is significant for dual channel systems, sincethe logged data from both channels are combined. Therefore, select the Site ID item for each channel tobe logged.
Datalogger Control allows you to select a [Circular Memory] mode that will over-write the oldest Datalog-ger data automatically when the Datalogger memory becomes full due to the data compression schemeemployed. Note that this is only available for dual-channel systems. The [Est Log Time Left] menu view-only menu cell shows an estimate of the hours and minutes of logging time remaining. This only appliesto non-circular datalogging. Selecting Circular memory blanks this field. For convenience sake, the Dis-play Datalogger command is essentially a duplicate of the menu cell in Datalogger Setup. It sends Data-logger data to the graphic screen with or without line wrapping. For dual-channel systems with loggingenabled on both channels, a screen dump from menu will show data from both channels. The OutputDatalogger command sends data to an external device via the RS-232 serial port. Data transmitted fromthis menu will be from both channels of a dual-channel system. The Clear Datalogger command erasesthe entire Datalogger file. For dual channel systems, you are cautioned not to use this command if yourintention is to clear the logged data of only one channel.
To access the Datalogger Control Menu press
4.4.1 DISPLAY DATALOGGER
This menu cell allows you to send the Datalogger contents to the display screen. This command iseffective only after a successful install. You can set the report to scroll on the screen with or without line-wrap. Selecting line wrap, forces a line feed after approximately 40 characters. In addition, you have toenable datalogging and then select items in the Datalogger Setup menu. Note that this command trans-mits the data from both channels.
To send Datalogger contents to the display screen:
To access the Display Datalogger option list press
Scroll cursor to either [Line Wrap] or [No Line Wrap] by pressing
Datalogger Control Display Datalogger OffLine WrapNo Line Wrap
Output Datalogger NoYes
Circular Memory NoYes
Est. Log Time Left —:—Clear Datalogger No
Yes
��
�
�
�
�
�
�
���
DATALOGGER CONTROL MENU STRUCTURE

4-7
1010DVNFM-3CSection 4
To view Datalogger contents press
To return to Datalogger Control press
4.4.2 OUTPUT DATALOGGER
This menu cell allows you to send the Datalogger contents to an external device (usually a computer orprinter) via the meter’s RS-232 Serial I/O port. This command is effective only after a successful install. Inaddition, you have to enable datalogging and select data items in the Datalogger Setup menu. Note: Thiscommand sends the data collected by both channels of a dual-channel system. Therefore, you shouldinclude [Site ID] (current site setup name), [Date] and [Time] in your report so that you can identify thesource of each report.
The flowmeter interfaces with most serial printers or personal computers. Controlotron offers the model996P portable serial printer. You must use the proper cabling between the flow computer and the exter-nal device. In addition, you must configure the RS-232 Setup correctly. You should turn off the Dataloggerfunction before you transmit an extensive printout. This will avoid contaminating the printout with newDatalogger data. Datalogger reports are sequential ASCII text files.
To send Datalogger contents to the RS-232 Serial Port:
Check the flow computer-to-external device connections and your RS-232 Setupparameters (see RS-232 Setup).
To access the [Output Datalogger] option list press
Scroll the cursor to [Yes] by pressing
To transmit Datalogger contents to external device via the serial port press
To stop printout press
4.4.3 CIRCULAR MEMORY
In its default mode, the Datalogger collects data until its memory becomes full. At that time the flowme-ter suspends data logging and cannot resume until the datalogger memory is cleared (see Clear Data-logger command). Multi-Channel systems include Circular Memory and Single Channel systems do not.Circular Memory allows the Datalogger to ”‘write over” its oldest records when memory reaches fullcapacity. If you enable Circular Memory, you are assured of always collecting the most recent data. But,also remember that you will lose the oldest Datalogger reports. Note further that invoking Circular Memorydeletes the current contents of the Datalogger.
NOTE: To avoid potential data loss, the flowmeter prevents you from altering the Circular Memorysetting when a channel is active.
To setup and enable Circular Memory:
The Datalogger Mode menu must have the [Memory] menu cell selected.
Datalogger items must be selected (e.g., Site ID, Date, Time, etc.).
All active channels in the Channel Setup menu must be disabled. To disable active channels,select the [Channel Enable] menu cell and then [No].
ENT
ENT
MENU

4-8
1010DVNFM-3CSection 4
In the Datalogger Control menu, select [Circular Memory].
Press to access the [Circular Memory] option list.
Move the cursor to [Yes] by pressing
To store selection press
Lastly, re-enable the channels that you disabled earlier to begin logging.
4.4.4 EST LOG TIME LEFT
Est Log Time Left is a “view-only” menu cell that shows an estimate of the amount of Datalogger timeremaining in hours and minutes. This menu cell becomes active after you enable datalogging. SelectingCircular Memory and/or event-based datalogging (see Datalogger Setup), blanks the field [Est Log TimeLeft] and is based on the log interval and data selections made in the Datalogger Setup. For SingleChannel flowmeters, this time is an estimated minimum since data compression is employed for im-proved storage efficiency.
4.4.5 CLEAR DATALOGGER
If you use the Datalogger in its default mode, eventually you will use all the memory available for Data-logger storage. When this occurs, you will not be able to log more data until you free up the memory. TheClear Datalogger command erases ALL stored Datalogger data. Therefore, you should evaluate thecurrently stored data, and print any valuable information before using this command. Note: Saved Sitesalso consume Datalogger RAM.
To clear Datalogger Data Memory:
To access the [Clear Datalogger] option list press
Move the cursor to [Yes] by pressing
To clear the memory press
4.5 THE MEMORY CONTROL MENU
Memory Control is a reference menu that shows the amount of bytes of data memory left. The datamemory capacity depends on the number and complexity of the site setups stored in memory and thesize of the current datalogger file. Capacity is also affected by the RAM option with which your 1010DVNis equipped with - either 900K expanded or 170K standard RAM.
Memory Map: Selecting YES for this item enables a snapshot display of current memory usage. In thisdisplay, the asterisk indicates a used block, a space indicates a free block, while a dash character indi-cates unused filler.
Defragment: Selecting YES for this item consolidates memory data blocks into contiguous storage;collapsing the filler regions. You may be able to use an additional block for site or datalogger storage asa result. Use this command if you seem to be out of memory even though the Data Memory Left itemindicates free capacity.
Data Memory Left: This view only menu cellshows the minimum remaining number of char-acters available for Datalogger and site storage.When the Datalogger is enabled for circular mode,the meter alocates all of memory except for twoconventional empty sites worth for datalogger use.
ENT
ENT
MEMORY CONTROL MENU
Defragment No
Yes
Data Memory Left XXXXX
Memory Map No
Yes�
�
��
�

4-9
1010DVNFM-3CSection 4
To view the amount of data memory bytes available press
4.5.1 THE ANALOG OUTPUT TRIM MENU
Analog Output Trim allows you to fine-tune the meter’s analog voltage and current outputs using a multi-meter connected to the output under test. In addition, you can use a frequency counter to fine-tune themeter’s pulse rate output.
NOTE: The current, voltage, and Pgen trimming will be limited by the 12-bit resolution of theflowmeter’s D/A Convertor (DAC).
To access the Analog Output Trim menu press
4.5.2 CURRENT OUTPUT TRIM (Io1 & Io2)(Note: Can be trimmed to within .005 mA of nominal.)
To calibrate a current output (Io1 or Io2):
Set up the multimeter to read Amps, then connect it to the supply and return terminals of thecurrent output under test.
Move the highlight to the port to be tested, press , then press to move the cursor to[Trim @ 4mA].
Press . This triggers a 4.00 mA pop-up window. The multimeter should now be reading 4.00mA.
If the multimeter reading does not match, use the numeric keys to type in the multimeter read-ing.
Press to register setting. This adjusts the meter’s DAC (digital-to-analog converter) so thata 4mA output corresponds with 4mA on the multimeter.
Re-check the multimeter to make sure that it is now reading 4mA.
4.5.3 VOLTAGE OUTPUT TRIM (Vo1 & Vo2)(Note: Can be trimmed to within .0025 V of nominal.)
To calibrate a voltage output (Vo1 or Vo2):
Set up the multimeter to read volts, then connect it to the supply and return terminals of thevoltage output under test.
Move the highlight to the port to be tested , press , then press to movethe cursor to [Trim @ 2V].
Press . This triggers a 2.00 Volts pop-up window. The multimeter should now be reading2.00 Volts.
ENT
ENT
ENT
Analog Output Trim Io1/Io2 OperateTrim @ 4mA Indicated mA = x.xx
Vo1/Vo2 OperateTrim @ 2V Indicated V = x.xx
Pgen1/Pgen2 OperateTrim @ 1kHz Indicated Hz = xxxx
�
�
� �
�
�
�
�
�
�
ANALOG OUTPUT TRIM MENU STRUCTURE�
�
�

4-10
1010DVNFM-3CSection 4
If the multimeter reading does not match, use the numeric keys to type in the multimeter read-ing.
Press to register setting. This adjusts the meter’s DAC (digital-to-analog converter) sothat a 2.00 Volts output corresponds with 2.00 Volts on the multimeter.
Re-check the multimeter to make sure that it is now reading 2.00 Volts.
4.5.4 PGEN OUTPUT TRIM (Pgen 1 & Pgen 2)
NOTE: Not available in Custody Transfer flowmeters.
(Note: Can be trimmed to within 1.25 Hz of nominal.)
To calibrate a pulse rate output (Pgen1 or Pgen2):
Connect a frequency counter to the supply and return terminals of the pulse rate output undertest.
Move the highlight to the port to be tested by pressing , press , then press to move the cursor to Trim @ 1kHz.
Press . This triggers a 1 kHz pop-up window. The frequency counter should now be reading1 kHz.
If the frequency counter reading does not match, use the numeric keys to type in the frequencycounter reading.
Press to register setting. This adjusts the meter’s DAC (digital-to-analog converter) so thata 1 kHz output corresponds with 1 kHz on the frequency counter.
Re-check the frequency counter to make sure that it is now reading 1 kHz.
4.6 THE RTD CALIBRATE MENU (optional)
The RTD Calibrate Menu appears on all 1010N models. Use this menu to calibrate the 991T or 1011TNRTD Temperature Sensors to an external standard. It is important to note that Controlotron RTD tempera-ture sensors are factory-calibrated for high accuracy. We recommend that before deciding to performthe calibration, check the current RTD reading in [Diagnostics/Liquid Data]. You may find that you do noteven need to calibrate the sensor. In any case, make sure that the temperature reading stabilizes beforeproceeding further. The RTD Calibrate menu allows you to perform an external calibration, which can beaccomplished either by data entry of the current RTD temperature or by a 320F (00C) Ice-Bath proce-dure. You can switch between the intrinsic and external calibration modes at any time.
NOTE: If you perform an external temperature calibration, you should mark and record thelocation of each connector and sensor-cable. Once you have re-calibrated the tempera-ture sensors, changing the sensor/connector orientation established during the proce-dure may void the calibration.
To access the RTD Calibrate menu press
ENT
ENT
ENT

4-11
1010DVNFM-3CSection 4
4.6.1 RTD CALIBRATION BY DATA ENTRY
The RTD Calibrate menu allows you to adjust the intrinsic RTD reading to match an external referencethermometer by directly entering its reading. Only perform this procedure while the RTD under test is in-stalled and currently measuring temperature.
To enter the current RTD temperature
Move the highlight to the RTD you want to calibrate (RTD1 or RTD2).
To access the RTD option list press .
Move the highlight to [User Cal] or [Factory] Cal then press .This triggers the pop-up window:
ENT
To enable numeric entry , then type in the reading of the reference thermometer(e.g., 72.0).
ENTTo recalibrate the RTD sensor . To verify the calibrated reading, go to [Diagnostics/LiquidData] to check the current RTD output. Make sure that it coincides with the reading of the refer-ence thermometer. Repeat for the other RTD if necessary.
Calib @ deg F
=72.0
Calib @ deg F
=32.0
To perform a 32ºF (0ºC) RTD Calibration:
Immerse RTD sensor in deionized water and ice mixture. Stir the mixture constantly.
Move the highlight by pressing to the RTD you want to calibrate (RTD1 or RTD2).
To access the RTD option list press . Move the highlight to [User Cal] then press .This triggers the pop-up window.
ENT
4.6.2 ICE BATH RTD CALIBRATION
Use distilled, deionized water and ice mixture at 0ºC (32ºF) equilibrium for an ice bath. Ensure tempera-ture with a reference thermometer. Controlotron can not assume responsibility for the incorrect design,construction or operation of an Ice Bath.
NOTE: Factory Calibration provides an additional prompt after a new temperature is entered:[Are you Sure? No Yes]. It is recommended that you use [User Cal] to avoid alterationof preset factory calibration.
CAUTION: DO NOT ALLOW AN RTD SENSOR TO MAKE DIRECT CONTACT WITH ICE DUR-ING AN ICE BATH CALIBRATION.
RTD Calibrate RTD 1 Factory User Cal
RTD 2 Factory User Cal
� �
�
�
�
RTD CALIBRATE MENU STRUCTURE (Single Channel FUH1010DVN)

4-12
1010DVNFM-3CSection 4
When you are sure that the RTD Sensor is at 32ºF (0ºC), press to recalibrate the RTD sensor.
To verify the calibrated reading, go to [Diagnostics/Liquid Data] to check the current RTD output. Makesure that it coincides with the reading of the reference thermometer. Repeat for the other RTD if neces-sary.
ENT
4.7 THE CLOCK SET MENU
The Clock Set menu allows you to set the time and date. The meter uses its internal clock/calendar torecord the real-time when certain data and diagnostic events occur. In addition, the clock/calendar pro-vides the Datalogger and Stripchart date and time stamps.
Notice:All flowmeters include a real-time clock to provide a convenient date/time stamp for display screens and dataloggerreports. The operating system does not rely on the date and time-of-day for any flowmeter operation. Therefore, the“Turn Of The Century” will have no effect on the proper functioning of any of our systems. Although we limit the year to2 digits in all our displays, FUH1010DVN’s datalogger reports are Y2K complaint using an industry standard algorithm toform a 4 digit year field.
4.7.1 DATE
The Date command sets the month, day and year for the meter’s internal clock/calendar. Enter the dateusing the [MM.DD.YY] format. Replace MM with two digits to indicate the month. Replace DD with twodigits to indicate the day. Replace YY with two digits to indicate the year. Type the period (.) separatorbetween each set of digits. For example, you would enter December 7, 1997 by typing 12.07.97. Youcan use the <Right Arrow> to move the cursor back to a number if you need to re-type it. Press the<CLR> key to remove the current setting.
To set the Date:
To enable numeric entry press
Use the numeric keys to type the date (MM.DD.YY).
To store the date press . This moves the cursor to [Time].
4.7.2 TIME
The Time command sets the hours and minutes for the meter’s internal clock/calendar. Enter the timeusing the [HH.MM.SS] format. Replace HH with 2 digits to indicate the hour (use 24-hr. clock format).Replace MM with 2 digits to indicate the minutes. Replace SS to indicate the seconds. You also have totype the period (.) separator between each set of digits. For example, you would enter ten minutes aftertwo o’clock in the afternoon by typing: 14.10.00 You can use the <Right Arrow> to move the cursor backto a number if you need to re-type it. Press the <CLR> key to remove the current setting.
ENT
Clock Set Date xx.xx.xx (date entry)
CLOCK SET MENU STRUCTURE
Time xx.xx (time entry)
Calib @ deg F
=32.0

4-13
1010DVNFM-3CSection 4
To set the clock:
To enable numeric entry press
Use the numeric keys to type the time (HH.MM).
To store the time press . This moves the cursor to RS-232 Setup.
4.8 RS-232 SETUP
Use the RS-232 Setup menu to set the operating parameters of the serial I/O port. Settings include baudrate, parity, data bits, line feed, network ID number and waiting period before a RTS time-out. Onlyactivate the RS-232 output if you intend to transmit serial data. This will avoid burdening the system withunnecessary data transferals while it is performing flow computations.
NOTE: The RS-232 stop bit implementation is fixed. If you are using a communication program,such as Windows 3.xx Terminal or Windows 95/98/NT/2000/XP HyperTerminal, that in-cludes a field for stop bits, select 1 stop bit.
ENT
4.8.1 BAUD RATE
The Baud Rate menu cell sets the asynchronous serial transmission data transfer rate of the RS-232 port.It provides a selection of standard baud rates up to 38,400 baud. The selected baud rate must match thebaud rate setting of the receiving external device. The factory-set baud rate is 9600.
To change the Baud Rate:
To access the [Baud Rate] option list press
Move the cursor to the required baud rate by pressing
To store selection press . This moves the cursor to [Parity].
RS-232 Setup Baud Rate 300120024004800960038400
Parity NoneOddSpaceEvenMark
Data Bits 78
Line Feed NoYes
Network ID xx (numeric entry)RTS Key Time 0.0 Secs
0.2 Secs0.4 Secs0.6 Secs0.8 Secs1.0 Secs2.0 Secs3.0 Secs4.0 Secs
�
�
�
�
��
�
�
� �
��
�
��
�
�
�
�
��
��
RS-232 SETUP MENU STRUCTURE
ENT

4-14
1010DVNFM-3CSection 4
4.8.2 PARITY
Parity is a simple method to check the accuracy of an asynchronous serial data transfer. The paritysetting tells the meter how to format the data words it sends to an external device. Parity is usually anadditional bit added to each data word. For example, if you select [EVEN], the total sum of all the bits ina single data word (including the parity bit) will always be an even number.
The [Parity] option list includes all the standard parity settings for asynchronous serial transmission. Theselected parity must match the parity setting of the receiving external device. Some devices ignore parityentirely; therefore, the option list includes [None]. The factory setting is [None].
To edit the Parity Setting:
To access the [Parity] option list press
Move the cursor to the required parity setting by pressing
To store the data press . This moves the cursor to [Data Bits].
4.8.3 DATA BITS
You can specify how many data bits the meter uses to format data words for serial transmissions. Thedefault setting is [7]. Note that the 996P portable printer requires a word length of [8].
To set the Data word length:
To access the [Data Bits] option list press
To move the asterisk to the required bit setting press
Press to store data. This moves the cursor to [Line Feed].
4.8.4 LINE FEED
Some serial devices (printers, terminals, etc.) insert a line feed automatically after they receive a car-riage return character. When communicating with these device types, you should set the Line Feed to[OFF]. This instructs the flow computer to send a carriage return character without adding a line feed toavoid creating an additional blank line after each carriage return. Setting the Line Feed to [ON] tells theflow computer to insert a line feed character after each carriage return that it transmits. This may benecessary to avoid the constant “wrapping” of transmitted data onto a single line. The factory setting is[NO] (line feed disabled). Note that the 996P portable printer requires [NO].
To enable (or disable) Line Feed:
To access the [Line Feed] option list press
Use to move the asterisk to [Yes] Line feed enabled, or [No] Line feed disabled.
To store the data press . This moves the cursor to [Network ID].
ENT
ENT
ENT

4-15
1010DVNFM-3CSection 4
4.8.5 NETWORK ID
The [Network ID] menu cell stores an identification number to facilitate host computer polling when youuse this system in a network environment. The Network ID number can be any value other than 0 (zero).The default setting, zero, disables the network function. Note that entering a non-zero Network ID num-ber suspends all routine Datalogger activity regardless of any selected options.
NOTE: If you are using the flowmeter for a “stand-alone” application, you must keep the zeroNetwork ID number.
To assign a Network ID number
To enable numeric entry press .
Use the numeric keys to type the Network ID number.
To store Network ID press . This moves the cursor to RTS Key Time.
4.8.6 RTS KEY TIME
During a serial transmission session, you can select how long the flow computer holds its request-to-send line high while checking for a clear-to-send signal. If RTS key time expires, the 1010DVN willreturn its RTS line low and abort the transmission attempt. Data entry units are seconds. The default RTSkey time is 0.2 seconds.
NOTE: The RTS Key Time function is only provided when the meter’s network ID number is non-zero.
To set the RTS Key Time:
To access the RTS Key Time option list press
To move the asterisk to the required RTS time press
To store the data press
4.9 BACKLIGHT
This menu cell allows you to specify how long you want to maintain the backlighting for the LCDGraphic Display. Select [On] for continuous illumination.
Press to access the option list and then scroll to desired time delay (before turn-off).
Press to store your setting.
ENT
ENT
ENT
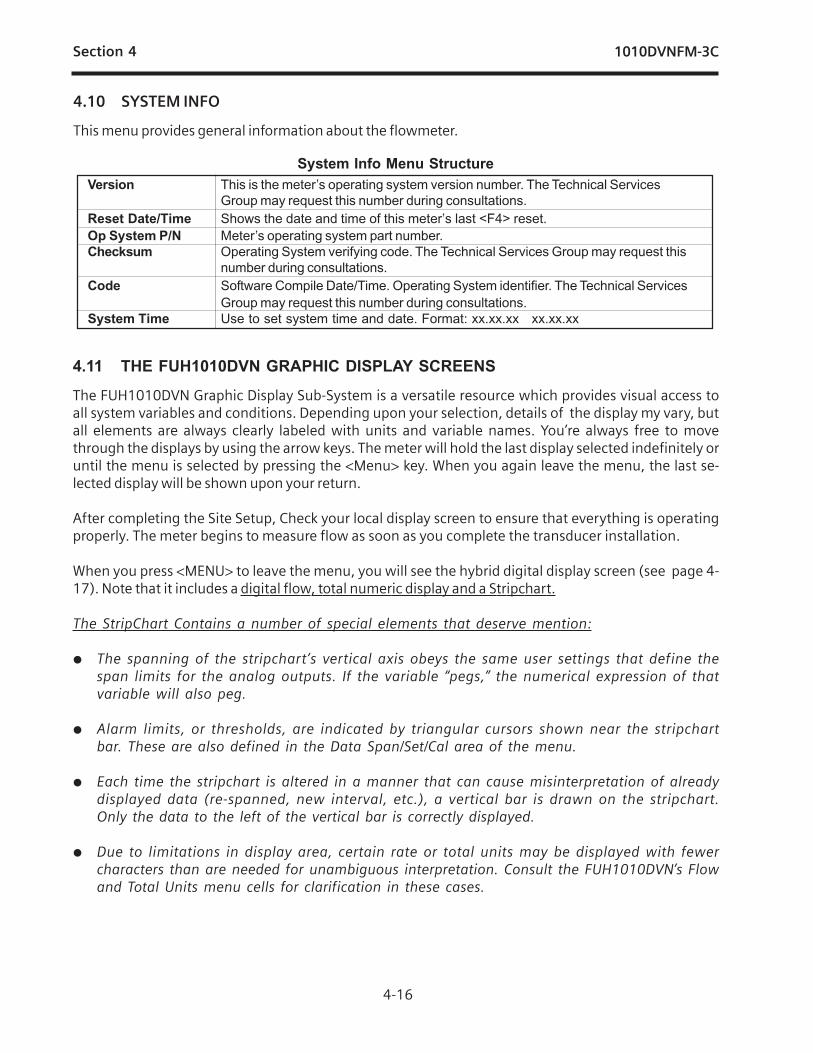
4-16
1010DVNFM-3CSection 4
4.10 SYSTEM INFO
This menu provides general information about the flowmeter.
Version This is the meter’s operating system version number. The Technical ServicesGroup may request this number during consultations.
Reset Date/Time Shows the date and time of this meter’s last <F4> reset.Op System P/N Meter’s operating system part number.Checksum Operating System verifying code. The Technical Services Group may request this
number during consultations.Code Software Compile Date/Time. Operating System identifier. The Technical Services
Group may request this number during consultations.System Time Use to set system time and date. Format: xx.xx.xx xx.xx.xx
System Info Menu Structure
4.11 THE FUH1010DVN GRAPHIC DISPLAY SCREENS
The FUH1010DVN Graphic Display Sub-System is a versatile resource which provides visual access toall system variables and conditions. Depending upon your selection, details of the display my vary, butall elements are always clearly labeled with units and variable names. You’re always free to movethrough the displays by using the arrow keys. The meter will hold the last display selected indefinitely oruntil the menu is selected by pressing the <Menu> key. When you again leave the menu, the last se-lected display will be shown upon your return.
After completing the Site Setup, Check your local display screen to ensure that everything is operatingproperly. The meter begins to measure flow as soon as you complete the transducer installation.
When you press <MENU> to leave the menu, you will see the hybrid digital display screen (see page 4-17). Note that it includes a digital flow, total numeric display and a Stripchart.
The StripChart Contains a number of special elements that deserve mention:
� The spanning of the stripchart’s vertical axis obeys the same user settings that define thespan limits for the analog outputs. If the variable “pegs,” the numerical expression of thatvariable will also peg.
� Alarm limits, or thresholds, are indicated by triangular cursors shown near the stripchartbar. These are also defined in the Data Span/Set/Cal area of the menu.
� Each time the stripchart is altered in a manner that can cause misinterpretation of alreadydisplayed data (re-spanned, new interval, etc.), a vertical bar is drawn on the stripchart.Only the data to the left of the vertical bar is correctly displayed.
� Due to limitations in display area, certain rate or total units may be displayed with fewercharacters than are needed for unambiguous interpretation. Consult the FUH1010DVN’s Flowand Total Units menu cells for clarification in these cases.

4-17
1010DVNFM-3CSection 4
To switch the screen to the “big digits” display press
You can press to scroll between the available display screens.
14.35Siemens 2 Channel [1] Unit#1
FLOW GAL/MIN
TOTAL GAL Vs
100.0
0.031.74354.6597
Vf
1427
Site Setup Name
Percent of Span Bar Graph Display
Instantaneous Volumetric Flow Rate (%)
Selected Meter Type(Dual Channel Flow)
Selected Measurement Channel
Flow Total
Measured Sonic Velocity
Vfo (Volumetric Average Flow Output)
Stripchart (Flow History)
Stripchart Alarm Cursors
Siemens 2 Channel [1] Unit #1
FLOW: GAL/MIN Vs ALC AER
1286 63 2
NTOTAL: GAL
112.3868.10HI/LO
30.0
-30.0
Vs
11.40 9/26 12:45
Date & Time
Digital Flow Total
Percent of Aeration Detected
Site Name
Signal Strength
InstantaneousFlow Rate
Active Alarm
Digital AverageVolumetric Flow
Select Meter Type(Dual Channel Flow)
SelectedMeasurement
ChannelMeasured Sonic Velocity (in m/s)
G/M
Totalizer Mode (NTOTAL)
Strip ChartData (Vfo) VolumetricFlow Rate

4-18
1010DVNFM-3CSection 4
The flow display uses the first (prompt) line display for the purpose of identifying the type ofmeter currently enabled (Dual Channel, Dual Path) and the channel from which the currentdisplay is derived (1 or 2 for the physical channels and 3 for the computed or average channel ina dual-path flowmeter). The Site Name is displayed in the upper right-hand corner of the digitaldisplay.
0.20Controlotron 2 Channel [1] Channel 1
FLOW GAL/MIN
TOTAL KGAL Vs
89.68
G/M
0.000.12Vfo
1474
9.73
UNIT #1 0.65
FLOW GAL/MIN
TOTAL GAL
75.30- - - - - - - - - 17.12 09/28
11.01FLOW GAL/MIN
TOTAL GAL
97.04
Dual Display Screen

5-1
1010DVNFM-3CSection 5
5. FUH1010DVN APPLICATION NOTES
The FUH1010DVN is an extremely versatile transit-time flowmeter that operates with either non-intru-sive clamp-on or in-line (non-wetted) flow transducers. Please review the following application guide-lines to obtain the best service from this equipment.
FUH1010DVN provides a simple menu-driven interface for site programming. During the installationprocedure, you tell the system what you need it to do. It will then verify the pipe and liquid conditions, andbased on your selections, optimize its operation automatically. However, the system cannot protect itselffrom critical data entry errors that you input. Its performance depends on the accuracy of the informationthat you provide it.
For normal operation, the flow computer only needs a receive signal of sufficient amplitude to activate itsautomatic gain controlled detection circuits. Severely adverse application conditions may reduce systemperformance, or cause apparent operational failures. Finding the culprit that caused this can usually alsoreveal an appropriate remedy. Should this still present a problem, call us for technical assistance.
5.1 TO OBTAIN TECHNICAL ASSISTANCE
The meter’s computer provides comprehensive diagnostics data. Using this data, our engineers cananalyze the system in relation to the application. Proper analysis will provide solutions to virtually anyapplication problem. For technical assistance, please contact your local Siemens representative for ex-pert help (www.siemens.com).
5.2 CONSIDERATIONS FOR CRITICAL APPLICATIONS
All flowmeters depend on site flow conditions and proper installation to achieve precise, critical flowmeasurements. Unfavorable factors such as liquid non-homogeneity or stratification and aeration/cavi-tation increase the possibility of reduced accuracy. This applies to all flowmeters, regardless of theirdesign, sophistication, expense and published intrinsic accuracy. These factors become critical whenapplications involve custody transfer, tenant billing, and nuclear or other safety-related flows.
FUH1010DVN flowmeters automatically compensates for adverse flow conditions to achieve extremelyhigh accuracy. This requires following the instructions for proper equipment selection, use of the correctclamp-on transducer or flow tube configuration, and paying close attention to installation instructions.Such judicious use implies expert equipment knowledge and experience, plus a thorough understandingof flow conditions.
If your application requires critical measurement accuracy, it is not realistic to simply install the flowmeterand expect optimum performance. Carefully review your piping configuration, select the best mountinglocation and install the transducers or flow tube in strict accordance with the published instructions. Evenwhen the system is calibrated for enhanced precision at a flow laboratory, this does not relieve you of theresponsibility of adhering to the programming instructions and installation requirements. We recom-mend that all potential installers for critical applications participate in our training programs. Anotheralternative is to commission our trained professionals to start-up the system for you.

5-2
1010DVNFM-3CSection 5
5.3 PIPE CONSIDERATIONS FOR CLAMP-ON TRANSDUCER
Clamp-on flow transducers operate on any round pipe that conducts sound. Suitable pipe materialsinclude most metals, plastics, glass and mandrel wound FRP. Pipes with a fine grain structure (e.g.,carbon and stainless steel) conduct sound more freely than cast iron, ductile iron or copper pipes.Nevertheless, all are usually acceptable. Unsuitable pipes include concrete or other non-homogeneousmaterials. Pipe liners are acceptable if they are sonically conductive and bonded solidly to the inner wallof the pipe. The system operates successfully on pipes with cement liners that are “spun” onto the pipeinterior to exclude any air bubbles. Pipes with smoothly applied bituminous and epoxy coatings are alsoacceptable. Plastic liners are universally acceptable, if they are in intimate contact with the inner wall andnot merely slipped within the pipe.
5.3.1 PIPE DIMENSIONS
Siemens manufactures transducer assemblies to service pipes from 0.25" to 360" in outer diameter.During the transducer install procedure, the flow computer will recommend transducer sizes based onthe site data that you enter. Pipes with OD-to-Wall thickness (OD/W) ratios greater than 10 to 1 are idealapplications. Operation on pipes with OD/W ratios of 7 to 1 (or less) are acceptable, but may exhibitreduced stability and linearity. Generally, higher OD/W ratios provide better stability. If a pipe has a lowOD/W ratio, you should use the smaller of the recommended transducer sizes (if the flow computerrecommends two transducer sizes).
5.3.2 PICKING THE APPROPRIATE TRANSDUCER
To ensure that you select the appropriate transducers for your application, consider the pipe outer diam-eter, temperature range and degree of precision required. Decide whether you need two independentflow channels or if you have to operate the system in dual-path configuration for greater accuracy andflow profile aberration immunity.
Initial transducer size recommendations are based on your pipe outer diameter, wall thickness and pipematerial entries. However, you can override the meter recommendations to accommodate specific situ-ations. For example, you may own a set of transducers whose size does not appear on the meter list.You may be able to use transducers on a pipe size outside of their nominal pipe OD range. Duringtransducer install, the flow computer recommends Spacing Indices (for spacer bars and mounting tracks)or Ltn, (actual distance required between transducers). Once you mount transducers and invoke theinstall routine, you can determine the suitability of your transducers by checking the signal strength andcomparing the reported sonic velocity with the actual sonic velocity of the liquid to be measured.
NOTE: Transducer pairs must have matching serial numbers.
5.3.3 FLOW VELOCITY RANGE
The flow velocity range of the FUH1010DVN with clamp-on transducers is at least ±40 ft/sec regardlessof the diameter of the pipe. Depending on application conditions, this range can extend to over 100 ft/sec. This measurement range is greater than needed for virtually any application.
5.3.4 OVERVIEW OF SYSTEM PERFORMANCE
Our system performance specifications are based on acceptable liquid sonic conductivity and otherpertinent application conditions. The diversity that characterizes liquid flow, makes it impossible for us tocover all possible application conditions that have the potential to reduce performance. Performancewithin specifications depends primarily on the receive signal’s signal-to-noise ratio and amplitude. Theinformation below may point to application conditions that could reduce system performance below itsnormally high level.

5-3
1010DVNFM-3CSection 5
5.3.5 ACCURACY
Although system accuracy is exceptional over a wide turndown ratio, at extremely low flow rates, a smallzero offset becomes a high percentage of actual flow. Obviously, the ultimate accuracy will be obtainedby performing an on-site flow calibration. A flow calibration can increase system accuracy to between0.3% to 0.5%, depending on application conditions.
Two common data-entry mistakes may reduce performance. If you enter an incorrect liquid viscosityvalue, you could compromise the intrinsic flow profile compensation curve. Incorrectly identifying thetransducers will reduce accuracy. Measured sonic velocity (Vs) errors will usually reveal this problemand by simply returning to the appropriate menu cells, entering the correct values, and then repeatingthe transducer installation it will resolve it.
5.3.6 REPEATABILITY
Some applications require repeatability rather than absolute accuracy. FUH1010DVN features excellentrepeatability specifications since its digital “no moving parts” design avoids the adverse effects of hyster-esis and other wear mechanisms typical of mechanical devices.
5.3.7 DATA STABILITY
Two main factors influence the system’s data stability: Data Scatter and Drift.
Data Scatter
Data scatter is a rapid variation in flow readings (within a span of about 0.1 to 5 seconds). Minimal datascatter (approximately 0.01 to 0.03 ft/sec) is a natural by-product of digital computation that extracts theextremely small difference in the up vs. down sonic transit time. Minimal data scatter will not influencethe integrated flow total over periods as short as several minutes. Naturally, it will be a greater percent-age of the reading when the meter measures extremely low flow rates. Poor liquid sonic conductivitymay attenuate sonic signal to a level that increases data scatter. You should check the signal level (Valc%) item on the Diagnostic Menu. Usually, this is indicated by a low Valc % value (less than 30).
FUH1010DVN does not exhibit inertia since it has no moving parts. In addition, it takes readings tentimes per second. Therefore, it can detect and track very brief flow fluctuations that are beyond theresponse capability of some conventional meters. This performance level is required for detecting veryfast and short flow transients or for a fast-response servo control loop application. However, you can usethe damping and slewing controls to smooth the output response if you want the system to ignore rapidflow fluctuations or data scatter.
Data Drift
Drift is a defined as a long-term cyclical flow deviation resulting from the variation of liquid temperatureor liquid sonic velocity. Drift may be more noticeable when combined with a poor signal-to-noise ratio.FUH1010DVN is carefully designed to minimize the effects of drift. There are no drift-prone analogphase-locked loop devices in the primary detection circuits. In addition, we use only the most stableplastics or steel to construct our transducers.
5.4 FLOW CONDITIONS
Very rarely are real-world flow conditions uniform and predictable. Therefore, the FUH1010DVN operat-ing system provides a considerable degree of control over the stability/agility of the flow rate output.FUH1010DVN is significantly more agile in tracking pressure wave induced Vs transients, and will re-cover from mistracking more quickly and smoothly than any other competing transit-time flowmeter.

5-4
1010DVNFM-3CSection 5
5.4.1 LOW FLOW RATES
The FUH1010DVN provide a flow resolution and measurement range that surpasses any other type offlowmeter. Therefore, it operates superbly for low or high flow rate applications. However, with our clamp-on systems, using the highest resolution when measuring a low flow rate may cause natural data scatterto become a high percentage of the reading. Since it is data scatter, it will not contribute any error to atotalizer reading accumulating for at least several minutes. However, if the flow rate is extremely low(e.g., under 0.25 ft/sec) the minute zero drift retained by the system may cause an observable perfor-mance decline. Therefore, if your application involves extremely low flow velocities, and your line size is2" or under, our 992DFT or 1011FT Flow Tubes might serve you best.
5.4.2 FLOW DATA SCATTER AND DAMPING
The transit-time flowmeter’s ability to respond to the extremely fast flow fluctuations that characterize“real” flow may surprise you. Most conventional flowmeters cannot detect these rapid flow fluctuationssince they are subject to unavoidable mechanical inertia. THe FUH1010DVN response speed is ideal fortracking fast flow transients. However, if this performance is unnecessary, you can smooth theFUH1010DVN response time to suit any application.
FUH1010DVN Damping and Slewing Controls
FUH1010DVN can detect and display minute flow fluctuations that are always present, though not usu-ally detectable by typical flowmeters. This rapid response accommodates applications that require thetracking of fast flow transients.
Time Average is our recommended filter that controls the output damping (the number of samplesaveraged together to produce the instrument’s primary rate output). It integrates the instantaneous flowrate over a selectable time period. Time Average function is very useful when stability in flow readingsare essential.
It allows the user to enter a value in seconds that the flow computer uses to integrate its response to flowchanges. Do not confuse this with the update speed of analog outputs. This occurs every 0.2 seconds,regardless of the time average that you select. One practical application is to set the time averagedamping so that the meter maintains a smooth output when it is installed downstream from devices(e.g., a positive displacement pump) that may cause regular surges in the liquid flow.
SmartSlew is a digital signal processing method that generates a variable time constant based on thereal-time assessment of collected data. When the flow data exhibits a steady trend, SmartSlew extendsthe time constant and the resulting output is smooth data.
5.4.3 NOTES ON LIQUID CONDITIONS
Successful transit-time flow measurement depends on sonic transmit signals traveling through liquidand arriving at the receive transducer without excessive attenuation. Receive signals can be scattered byliquids carrying dispersed particulate matter, either of a solid, non-homogeneous or gaseous nature.This is especially true if the dispersed material is of different sonic impedance than the base liquid.Liquids that contain an excess of gas bubbles or mineral solids may prove to be unsatisfactory transit-time applications. However, these liquids are perfectly suitable for Reflexor flowmetering. Liquids con-taining dissolved gasses or dissolved organic solids will not cause any problems for transit-time opera-tion.

5-5
1010DVNFM-3CSection 5
Most liquids are excellent sonic conductors, regardless of their electrical or optical properties. Althoughhighly viscous liquids exhibit a greater degree of sonic attenuation, FUH1010DVN operates perfectlywith the vast majority of these liquids. The Valc % (signal strength) item on the Diagnostic Menu is agood indicator of this condition. A low value (under 30) indicates a possible low liquid sonic conductivity,or improper transducer installation.
5.4.4 ERRONEOUS LIQUID PARAMETER SPECIFICATION
The viscosity of the liquid is an important factor. It governs the degree of Reynolds Number compensationthat the flow computer applies to the final rate output. Therefore, flow data errors could result if you enteran inaccurate viscosity value. Siemens Technical Service Department can provide reliable viscosity datafor most liquids.
5.4.5 LIQUID COMPATIBILITY
Since our clamp-on transducer systems never contact liquid, the issue of liquid compatibility only appliesto entrained gases or mineral solid content that might impair sonic signals Since FUH1010DVN isdesigned to measure flow using both transit-time and Reflexor techniques, we can safely say that it willoperate most successfully on virtually all liquids.
5.4.6 AERATION
Undissolved gases, having very low sonic impedance, may cause sonic beam scattering. In large quan-tities, they can reduce the sonic signal strength. Small bubbles, caused by cavitation, usually provokemore signal loss than an equal quantity of large gas bubbles. Usually, the problem can be alleviated byeliminating the cause. Aeration may be caused by a mixing tank, throttling valve cavitation, or airsuction upstream of the transducer location.
FUH1010DVN can operate successfully with a larger amount of aeration than any other transit-time flowmeter. It measures and reports the aeration level as the analog output, Vaer %. This repre-sents the relative degree of aeration detected within the flow stream. Its computer reports the Vaer leveluntil it impedes operation and forces a Fault Alarm. The Vaer output accommodates applications requir-ing an aeration indicator. The Vaer % also appears on the display screen. The aeration percentage canbe used as an alarm relay set-point. You can set the aeration alarm setpoint such that it trips beforeaeration reaches a level that impairs flow measurement.
NOTE: Before performing the installation routine, allow enough time for the liquid to flush outall air trapped in the pipe.
5.4.7 SLURRIES
High-density undissolved solids (e.g., sand slurry) may cause application problems if present in suffi-cient quantity to scatter the sonic beam significantly. Low-density solids, such as organic materials, coalslurries and unaerated sewage sludge, are usually adequate sonic conductors and their sonic imped-ance is very close to most liquids. Excessive mineral solids though could trigger the aeration alarm.
5.4.8 TWO-PHASE LIQUIDS
Two-phase liquids (e.g., oil and water) cause some sonic beam scattering. However, these usually con-duct sonic beams sufficiently for proper operation (unless heavy aeration is present also). Two-phaseliquids with large quantities of different components, such as sand or free gas, could prove to be tooattenuative for transit-time operation. However, switching to Reflexor™ mode will keep the meter opera-tional under these circumstances.

5-6
1010DVNFM-3CSection 5
5.4.9 VISCOUS LIQUIDS
Highly viscous liquids tend to “absorb” some of the energy of the sonic beam. This causes a reduction ofsignal amplitude when compared to low viscosity liquids. However, most high viscosity liquids are suffi-ciently conductive for acceptable operation. A low Valc % value usually indicates low sonic conductivity.
5.4.10 TEMPERATURE AND PRESSURE RATINGS
We rate our standard (universal) transducers for operation up to 250°F. We offer High (H) temperatureflow transducers rated for operation up to 375°F. We also manufacture Very High (VH) temperaturetransducers for applications where the temperature exceeds 375°F, but is less than 450°F. Please referto Section 6 for flow tube pressure and temperature ratings.
5.5 OVERVIEW OF SYSTEM FUH 1010DVN MEMORY RESOURCES
FUH1010DVN’s memory resources include both Read-Only-Memory (ROM) and battery-backed Ran-dom Access Memory (RAM). The ROM memory contains the system operating instructions, on-line helptext, default data, and the pipe, transducer and liquid tables.
The flowmeter uses 1 Mega byte of RAM (standard) to provide three discrete storage functions:
Active Memory - Site Storage Memory - Datalogger Memory.
Upon creating a site, the meter copies all ROM-based defaults into the meter’s operational database, theActive Memory. This provides two advantages. First, RAM-based operation increases performance. Sec-ond, this creates an immediate Site Setup, based on the meter’s defaults. To make the meter opera-tional, you just have to enter required data (e.g., pipe and transducer data) and edit other defaultsettings to suit your application. When you program the meter, all your entries are retained in the ActiveMemory. This enables you to use the meter immediately after finishing a Site Setup. You’re not limited toone set of site parameters. You can copy site data from Active Memory to Site Storage Memory.
Site Storage Memory provides permanent storage area for several inactive Site Setups. The multi-sitestorage feature allows rapid reinstallation at many locations. All you have to do to reactivate an inactiveSite Setup is to recall it back into to Active Memory. However, be aware that this action over-writes ALLthe data residing in the Active Memory area.
The Datalogger logs data collected at preset intervals during operation. It uses the system RAM re-sources independently of Active Memory and Site Storage Memory. Therefore, data movement be-tween Active Memory and Site Storage memory will not affect it directly. However, all stored data sharesa common RAM pool. The meter allocates the actual amount of bytes available for each storage functiondependent on the demands of each facility. Therefore, an unusually large Datalogger file may reduce theamount of site storage memory available. Storing several inactive site setups may reduce the availablelogging capacity.
If you receive a [Memory Full!] message when you try to save a Site Setup, then you will have to deletean obsolete Site Setup or clear the Datalogger Memory to make room. Another Datalogger memoryconsideration applies to dual-channel systems, when both measurement channels are actively loggingdata. Dual-channel meters store logged data from BOTH channels in a common file so you must includeSite ID for each line to identify the applicable measurement channel.
The FUH1010DVN also offers a Memory Map and Defragmenting command in the Meter Facilities areaof the menu as an aid in visualizing and maximizing the efficient utilization of your flowmeter’s memoryresources.

5-7
1010DVNFM-3CSection 5
5.6 REFERENCE TABLES
The following tables provide reference data that may be required during the Site Setup.
Liquids/Oils Vs(m/s) Liquids/Oils Vs(m/s)
Acetate, Butyl (n) 1270 Ethanol 1180Acetate, Ethyl 1180 Ethylene Glycol 1620Acetate, Methyl 1150 Gasoline 1250Acetate. Propyl 1180 Glycerine 1920Alcohol 1440 Linalool 1400Alcohol, Butyl (n) 1270 Linseed Oil 1770Alcohol, Ethyl 1180 Methylethyl Ketone 1210Alcohol, Methyl 1120 Motor Oil (SAE 20/30) 1487Alcohol, Propyl (i) 1170 Paraffin Oil 1420Alcohol, Propyl (n) 1220 Pentane 1010Benzene 1330 Petroleum 1290Benzol, Ethyl 1340 Trichlorethylene 1050Butyrate, Ethyl 1170 Transformer Oil 1390Carbon Tetrachloride 938 Turpentine 1280Diethyl Ketone 1310
SONIC VELOCITY (in meters/sec) FOR COMMON LIQUIDS @ 68°F
Water 0 32 1402 Water 120 248 1519 10 50 1447 130 266 1503 20 68 1482 140 284 1485 30 86 1509 150 302 1466 40 104 1529 160 320 1440 50 122 1543 170 338 1412 60 140 1551 180 356 1390 70 158 1555 190 374 1360 80 176 1554 200 392 1333 90 194 1550 220 428 1268100 212 1543 240 464 1192110 230 1532 260 500 1110
Liquid Deg. C Deg. F Vs (m/s) Liquid Deg. C Deg. F Vs (m/s)
SONIC VELOCITY FOR PURE WATER @ VARIOUS TEMP. (meters/sec)

5-8
1010DVNFM-3CSection 5
Vps VALUES (in inches/second) FOR SOME COMMON METALS
Metal Vps (in/sec) Metal Vps (in/sec)
Aluminum 120,000 Magnesium O-1 120,000AL 1100 (2S) 121,000 Magnesium ZK-60A-TS 120,000AL 1100-0 (2S0) 122,000 Monel 107,000AL 2014 (14S) 121,000 Molybdenum 132,000AL 2024-T4 (24ST) 124,000 Nickel 118,000AL 2117-T4 (17ST) 123,000 Steel, 302 Cres. 123,000Brass 89,400 Steel, 347 Cres. 122,000Brass, Alpha 79,500 Steel, 1020 128,000Brass, Half Hard 80,700 Steel, 1095 126,000Brass, Naval 83,500 Steel, 4150, Rc14 110,000Bronze, Phosphor 87,800 Steel, 4150, Rc18 125,000Cadmium 59,100 Steel, 4150, Rc43 126,000Carpenter 20 Steel 117,900 Steel, 4340 126,000Columbium 82,700 Tantalum 114,000Columbium (10W, 10TN) 74,800 Tin 65,700Constantan 104,000 Titanium 122,000Copper 89,400 Titanium, T1 150A 124,000Iconel 119,000 Titanium Carbide 203,000Iron 127,000 Tungsten 113,000Iron, Cast 110,000 Vanadium 109,000Magnesium AM-35 122,000 Zinc 94,900Magnesium PS-1 119,000 Zirconium 88,600Magnesium J-1 118,000
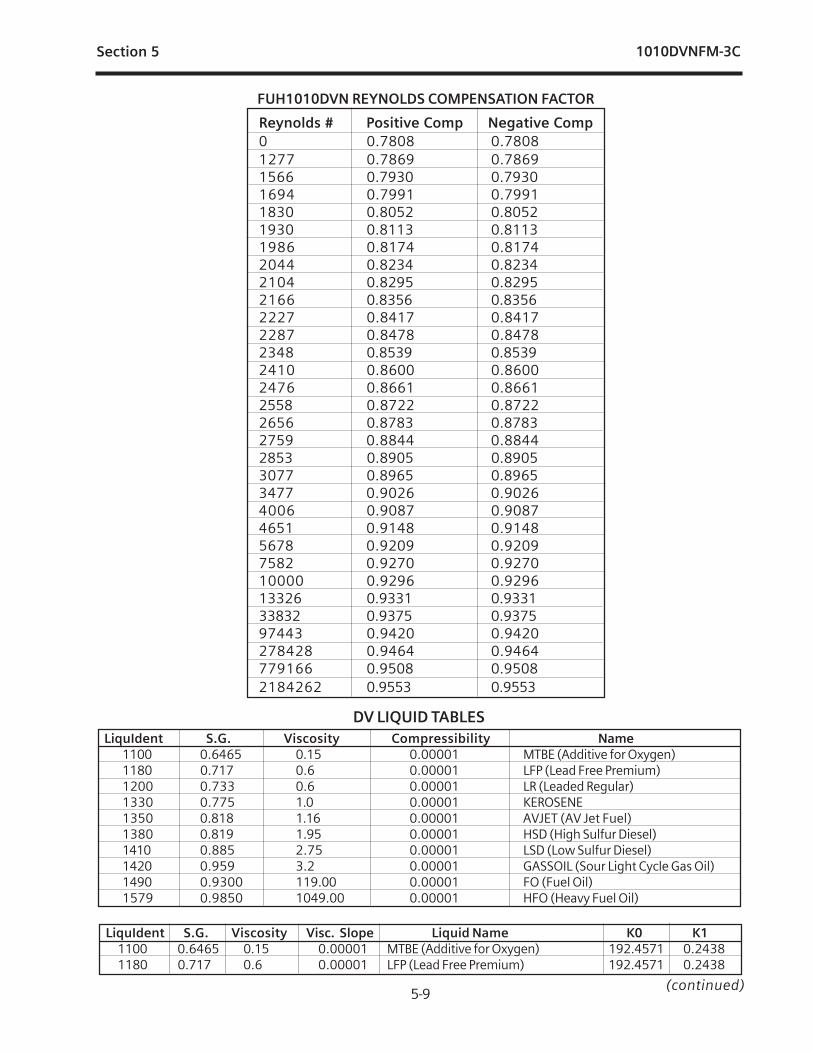
5-9
1010DVNFM-3CSection 5
LiquIdent S.G. Viscosity Compressibility Name1100 0.6465 0.15 0.00001 MTBE (Additive for Oxygen)1180 0.717 0.6 0.00001 LFP (Lead Free Premium)1200 0.733 0.6 0.00001 LR (Leaded Regular)1330 0.775 1.0 0.00001 KEROSENE1350 0.818 1.16 0.00001 AVJET (AV Jet Fuel)1380 0.819 1.95 0.00001 HSD (High Sulfur Diesel)1410 0.885 2.75 0.00001 LSD (Low Sulfur Diesel)1420 0.959 3.2 0.00001 GASSOIL (Sour Light Cycle Gas Oil)1490 0.9300 119.00 0.00001 FO (Fuel Oil)1579 0.9850 1049.00 0.00001 HFO (Heavy Fuel Oil)
DV LIQUID TABLES
LiquIdent S.G. Viscosity Visc. Slope Liquid Name K0 K11100 0.6465 0.15 0.00001 MTBE (Additive for Oxygen) 192.4571 0.24381180 0.717 0.6 0.00001 LFP (Lead Free Premium) 192.4571 0.2438
(continued)
Reynolds # Positive Comp Negative Comp0 0.7808 0.78081277 0.7869 0.78691566 0.7930 0.79301694 0.7991 0.79911830 0.8052 0.80521930 0.8113 0.81131986 0.8174 0.81742044 0.8234 0.82342104 0.8295 0.82952166 0.8356 0.83562227 0.8417 0.84172287 0.8478 0.84782348 0.8539 0.85392410 0.8600 0.86002476 0.8661 0.86612558 0.8722 0.87222656 0.8783 0.87832759 0.8844 0.88442853 0.8905 0.89053077 0.8965 0.89653477 0.9026 0.90264006 0.9087 0.90874651 0.9148 0.91485678 0.9209 0.92097582 0.9270 0.927010000 0.9296 0.929613326 0.9331 0.933133832 0.9375 0.937597443 0.9420 0.9420278428 0.9464 0.9464779166 0.9508 0.95082184262 0.9553 0.9553
FUH1010DVN REYNOLDS COMPENSATION FACTOR

5-10
1010DVNFM-3CSection 5
LiquIdent S.G. Viscosity Visc. Slope Liquid Name K0 K11200 0.733 0.6 0.00001 LR (Leaded Regular) 192.4571 0.24381330 0.775 1.0 0.00001 KEROSENE 330.301 0.01350 0.818 1.16 0.00001 AVJET (AV Jet Fuel) 330.301 0.01380 0.819 1.95 0.00001 HSD (High Sulfur Diesel) 103.872 0.27011410 0.885 2.75 0.00001 LSD (Low Sulfur Diesel) 103.872 0.27011420 0.959 3.2 0.00001 GASSOIL (Sour Light Cycle Gas Oil) 103.872 0.27011490 0.9300 119.00 0.00001 FO (Fuel Oil) 103.872 0.27011579 0.9850 1049.00 0.00001 HFO (Heavy Fuel Oil) 103.872 0.2701
Notice: Siemens holds US Patent Number 4,929,368 on the CC#122 Coupling Compound and all compounds ofthis type. Its use is restricted to Siemens products only, unless a special license has been obtained.Licenses for use with other products are available through the Siemens Sales Department.
ITEM CC# USE CHARACTERISTICS
1 101 Temporary and portable use on Clamp-on Low in halogens andflow transducers. Temp. range: -40°F to 100°F. sulfur content.
2 102 Temporary and portable use for all Clamp-on flow Low in halogens and sulfurtransducers. Well suited for survey use. content. Water soluble.Temp. range: -30°F to 100°F.
3 109 Temporary and portable use for all Clamp-on Low viscosity Petroleumflow transducers. Temp. range: -40°F to 300°F. product.
4 110 High temp. temporary couplant to be used when Resists breakdown andsetting up high temp. plastic flow transducers. thinning out at high temper-Temp. range: 255°F to 450°F. atures.
5 111 Permanent high temp. couplant for plastic flow Room temperature vulcanizingtransducers. Temp. range: 255°F to 450°F. silicone rubber.
6 112 Permanent ambient temperature couplant for Room temperature vulcanizingplastic flow transducers. Temp. range: -40°F silicone rubber.to 250°F.
7 113 Protective spray for providing corrosion resistance Spray on liquid. Excellentto exposed transducer and track parts. resistance to salt water
atmosphere.8 114 Temporary and long term couplant for all flow Teflon filled grease.
transducer types. Temp. range: -40°F to 255°F. Water resistant.9 117 Long term and permanent couplant for Clamp-On Silicone grease loaded with
transducers. Temp. range: -40°F to 450°F. metal oxides. Resists Break-down and thinning at hightemperatures.
10 120 Submersible couplant. To be used on all submer- Extremely water resistant.ged transducer applications. Consult Controlotron before
using.11 122 Long term and permanent couplant for Clamp- Long chain polymer grease.
on transducers. Temp. range: -40°F to 450°F. Resists breakdown and thin-ning at high temperatures.
12 124 Long term and permanent couplant for Clamp-On Two part room temperaturetransducers. Temp. range: -40°F to 250°F. cure adhesive.
13 128 Temporary and long term couplant for all flow High viscosity siliconetransducer types. Temp. range: -40°F to 375°F. grease. Water resistant.
14 129 Adhesive backed Dry/Damping couplant for all flow Viscoelastic polymer sheet. 129A transducer types. Water resistant.
RECOMMENDED SONIC COUPLING COMPOUNDS

5-11
1010DVNFM-3CSection 5
TERMINOLOGY CHART
This chart provides explanations for uncommon terms used in this manual.
TERM EXPLANATIONActive Memory Section of RAM allocated for active site parameters (all current values).
The flow computer receives site-specific operating instructions fromActive Memory.
Alphanumeric Field An 8-character data entry field that allows you to specify a Site Name ora Security code.
Arrow Keys Use the <Up, Down, Left and Right> Arrows to navigate through theInstallation Menu in their respective directions. The <Up or Down>Arrows allow you also to scroll through option list items.
Asterisk Refers to the marker used in the Installation menu to indicate a currentoption list selection. When you access an option list, you can move theasterisk with the <Up or Down> Arrows to a new selection, then press<Enter> to select the item.
CLR (Clear) Key Use the <CLR> key to erase a numeric value or clear a selection from amultiple select option list.
Cursor This refers to the highlighted text and the arrow cursor that you move viathe arrow direction when navigating through menus or menu cells.
Data Entry Refers to data entered into a menu cell (either numeric or option listselection).
Datalogger Memory Memory segment that stores data items logged during operation. Youcan view the Datalogger contents either on-screen or transmit it to anexternal device via the RS-232 serial port. The amount of Dataloggermemory depends on how many sites reside in Site Storage memory.
ENT (Enter) Key Use the <ENT> key to store a current numeric value or option list item.Flow Computer Refers to the flowmeter itself (system refers to the meter and transduc-
ers combined).Flow Tube Refers to our in-line (non-wetted) transducer assemblies suited for small
(under 2” lines) and extremely low-flow applications.Graphic Screen Refers to the integral display screen.Initial Makeup An internal process performed during installation, where the flow meter
acquires its receive signal and enhances other parameters for optimaloperation at a site.
In-process Makeup An internal process where the flowmeter recovers its Initial Makeupparameters, after a fault condition interrupts operation.
Installation Menu The flowmeter’s overall menu structure. Allows you to define all aspectsof the flowmeter’s operation.
Interface m/s Refers to an alarm function that declares the passage of a liquid inter-face by a comparison of the relative sonic velocities of the two liquids.
LAPTOT Refers to a system function that freezes the Totalizer display,while the Totalizer continues to update its registers.
(continued)

5-12
1010DVNFM-3CSection 5
Local Display Refers to the FUH1010DVN’s integral display screen.Menu Sub-sections of the Installation Menu that you to define specific operational
functions (e.g., RS-232 Setup).Menu Cell A location within a Menu where you define either a single numeric value or
option list selection that supports the Sub-Menu’s function. Certain view-onlymenu cells show reference data appropriate to the current application.
NEGFLOW Totalizer mode for negative flow total only.NETFLOW Totalizer mode that combines positive and negative flow totals.NOTOT System function that disables the internal Totalizer.Number Index Computed transducer spacing index based on the estimated sonic velocity
measurement. This Index cannot be overridden by installer.Numeric Data Refers to a value entered into a menu cell. An example would be the pipe
outer diameter.Numeric Entry Refers to a number you type into menu cell that stores numeric data.Numeric Keys Use the Numeric keys to type a numeric value where appropriate.OpSys ROM The read only memory that stores its basic operating instructions and per-
manent defaults.Option List Lists of options presented at menu cells that allow you to select either a
single item or multiple items (depending on the function that the menu cellcontrols).
Parameter Refers to value (either numeric or list selection) stored in a menu cell.POSFLOW Totalizer mode for positive flow total only.Register Refers to a memory location used by the flowmeter to store data such as the
flow total, etc.RTD Temperature sensors used with energy flow of mass flow systems.Site Name A user-entered name that flowmeter associates with a stored Site Setup. You
retreive a particular Site by selecting its name from a site name list.Site Setup A collection of parameters used by the flowmeter to service a specific site (or
location). The meter allows you to store several independent Site Setups.Site Storage Memory Section of RAM allocated for permanent data storage. This memory seg-
ment stores inactive site setups (including a backup of active site). The meter’sSite Setup storage capacity depends on the dynamic memory allocation asdictated by each application. In addition, the meter uses Site Storage Memoryto store configurable operating parameters such as pipe and liquid tables.
Spacing Index Refers to the Number Index, used by the flowmeter to determine the spacebetween the upstream and down stream transducers on clamp-on systems.
Spacing Offset Fixed transducer offset assigned by the flowmeter. This can be overridden bythe installer.
TOTCNT A totalizer pulse count function used for Batching or Sampling.Transducer Clamp-on flow sensors that the flowmeter uses to measure the flow rate.Vaer The flowmeter’s aeration percent output.Vps The sonic propagation velocity of a pipe.Vs The sonic velocity of a liquid.
TERM EXPLANATION

5-13
1010DVNFM-3CSection 5
5.7 THE NEMA DUAL-CHANNEL MENU CHART
This section shows the FUH1010DVN Permanent Dual Channel Menu Chart. The Dual Path Flow, Ch1+2 Flow, Ch 1-2 Flow Channel Setup menus are virtually identical.
NOTE: The Installation menu for single channel systems does not provide the Meter Typechoices shown below.
THE METER TYPE MENUMeter Type Dual Channel Flow Channel 1 Clamp-On Channel Setup
Clamp-On Channel SetupChannel 2 same as Ch. 1
Dual Path Flow Channel/Path SetupCh 1+2 Flow Channel 1 Clamp-on Channel Setup
Channel 2 Clamp-On Channel SetupChannel 3 Ch 1+2 Flow Channel 3 Setup
Ch 1-2 Flow Channel 1 Clamp-On Channel SetupChannel 2 Clamp-On Channel SetupChannel 3 Ch 1-3 Flow Channel 3 Setup
�
� � �
���
�
������
��
�
�
Datalogger Control Display DataloggerOutput DataloggerCircular MemoryEst Log Time LeftClear Datalogger
Memory Control Data Memory LeftMemory MapDefragment
Analog Output Trim Trim Io 1 OperateTrim @ 4mA
Trim Io 2 OperateTrim @ 4mA
Trim Vo 1 OperateTrim @ 2V
Trim Vo 2 OperateTrim @ 2V
Trim Pgen 1 OperateTrim @ 1Khz
Trim Pgen 2 OperateTrim @ 1Khz
RTD Calibrate RTD-1 User Cal. FactoryRTD-2 User Cal. Factory
Clock Set DateTime
Meter Facilities Preferred Units EnglishMetric
THE METER FACILITIES MENU
Table Setups Pipe Table Create/Edit Pipe Choose PipeChoose Pipe NameOuter Diameter (in)Wall Thickness (in)Liner MaterialLiner Thickness
Delete Pipe Choose Pipe ClassPick Pipe Name
Transducer Table 1011 Universal1011H High Precision 991 Universal
(continued)
�
�
�
�
�
� �
�
�
�
�
�
�
� �
� �
�
� �
���
�
�
�
�
�
�
�
�
�
�
�
�
�
�
�
�
��
�
��
�� ��
�

5-14
1010DVNFM-3CSection 5
Meter Facilities RS-232 Setup Baud RateParityData BitsLine FeedNetwork IDRTS Key Time
Backlight ON, 30 sec, 1 min, 2 min, 3 min, 5 min, 10 minSystem Info Version
Reset Date/TimeOp System P/NChecksumCode
METER FACILITIES MENU (continued)
��
���
���
�
�
�
�
(continued)
THE CLAMP-ON MENU Clamp-On Chan/Path Setup Recall Site Setup
Channel EnableCreate/Name SiteSite SecurityDelete Site SetupSave/Rename Site
Pipe Data Select Pipe ClassSelect Pipe SizePipe OD (in / mm)Pipe MaterialWall ThicknessLiner MaterialLiner ThicknessThermExp Coef 1/FMod of Elast PSI
Application Data Liquid Class Select LiquidEstimated Vs m/sViscosity cSDensity S.G.
Liquid Table Table ActiveLiquIdent SlopePressure SlopeBase TemperatureK0K1LiquIdent Index
Temperature Range (select temp. range)Pipe Configuration Fully Developed
1 ElbowDbl Elbow +Dbl Elbow -ValveExpanderReducerNorm EntryHeader InletIntrusions
Anomaly Diams xxxx (numeric entry)Pick/Install Xdcr Transducer Model
Transducer SizeXdcr Mount ModeSpacing OffsetNumber Index
�
�
�
�
�
�
�
�
�
�
�
�
��
��
�
�
�
�
�
�
��
�
�
�
�
�

5-15
1010DVNFM-3CSection 5
THE CLAMP-ON MENU (continued)Clamp-On Pick/Install Xdcr Spacing Method
Ltn ValueInstall Completed?Empty Pipe SetZero Flow Adjust
Operation Adjust Damping Control Time AverageSmartSlew
Deadband Control 0.000 (numeric entry)Memory/Fault Set FaultMemory Delay (sec) N/ASL Rate 250 mS
100 mS50 mS20mS
Flow/Total Units Flow Volume UnitsStd Vol CorrFlow Time UnitsFlow Display RangeFlow Display ScaleTotal Volume UnitsStd Vol CorrTotalizer ScaleTotal ResolutionTotalizer ModeBatch/Sample Total
Data Span/Set/Cal Span Data *Pgen (Units)Max Flow (Units)Min Flow (Units)Max LiquIdentMin LiquIdentMax ROC.Max ROC.Max Vs m/sMin Vs m/sMax S.G.Min S.G.Max APIMin APIMax Kg/m3Min Kg/m3Max Base S.G.Min Base S.G.Max Base APIMin Base APIMax Base Kg/m3Min Base Kg/m3Max Viscosity cSMin Viscosity cSMax TemperatureMin Temperature
Set Alarm Levels HIgh FLowLow FlowHigh S.G.Low S.G.High APILow APIHigh Kg/m3Low Kg/m3High Base S.G.
�
�
��
�
�
�
�
� �
�
�
�
� �
�
�
�
�
�
�
(continued)
���
*Only available in Custody Transfer flowmeters.
�
�
��
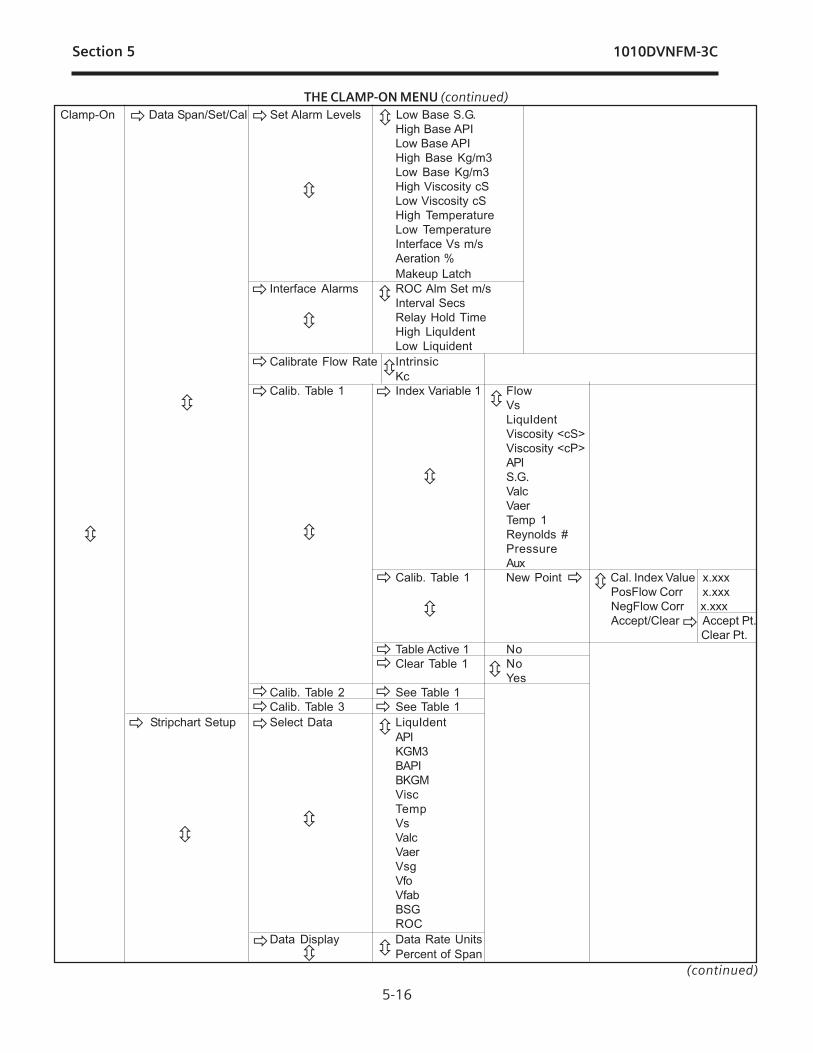
5-16
1010DVNFM-3CSection 5
Clamp-On Data Span/Set/Cal Set Alarm Levels Low Base S.G.High Base APILow Base APIHigh Base Kg/m3Low Base Kg/m3High Viscosity cSLow Viscosity cSHigh TemperatureLow TemperatureInterface Vs m/sAeration %Makeup Latch
Interface Alarms ROC Alm Set m/sInterval SecsRelay Hold TimeHigh LiquIdentLow Liquident
Calibrate Flow Rate IntrinsicKc
Calib. Table 1 Index Variable 1 FlowVsLiquIdentViscosity <cS>Viscosity <cP>APIS.G.ValcVaerTemp 1Reynolds #PressureAux
Calib. Table 1 New Point Cal. Index Value x.xxxPosFlow Corr x.xxxNegFlow Corr x.xxxAccept/Clear Accept Pt.
Clear Pt.Table Active 1 NoClear Table 1 No
YesCalib. Table 2 See Table 1Calib. Table 3 See Table 1
Stripchart Setup Select Data LiquIdentAPIKGM3BAPIBKGMViscTempVsValcVaerVsgVfoVfabBSGROC
Data Display Data Rate UnitsPercent of Span
�
� ��
�
�
�
�
�
�
�
�
�
�
��
�
�
��
�
�
�
��
�
�
�
THE CLAMP-ON MENU (continued)
�
�
�
�
�
�
�
�
(continued)

5-17
1010DVNFM-3CSection 5
(continued)*For Dual Path Flow, CH 1+2 Flow and CH 1-2 flowmeter types only.
Clamp-On Datalogger Setup Time Base 1 second3 seconds6 seconds12 seconds24 seconds1 minute3 minutes6 minutes12 minutes24 minutes1.2 hours
Stripchart Clear YesNo
Datalogger Mode OffMemoryRS-232 Output
Datalogger Data NoneSite IdDateTimePath Flow*FlowAverage FlowRaw FlowTotalPath Vs*VsPath Valc*ValcAerationLiquid NameLiquIdentS.G.APIKg/m3Base S.G.Base APIBase Kg/m3Path Alarms*AlarmsTemperaturePath Delta T*Analog InputsSonilocate
Log Time Interval 5 sec.10 sec.15 sec.30 sec.1 Min.5 Min.15 Min.30 Min.1 Hr.2 Hr.4 Hr.6 Hr.12 Hr.24 Hr.Demand
THE CLAMP-ON MENU (continued)
�
�
�
�
�
�
�
��
��
��
�
�
�
�
��
���
�

5-18
1010DVNFM-3CSection 5
Clamp-On Datalogger Setup Datalogger Events NoneFault AlarmMemoryRelay 4Relay 3Relay 2Relay 1MakeupSpacingEmptyAerationROCFlow Alarm
Display Datalogger OffLine WarapNo Line Wrap
I/O Data Control Analog Out Setup Io1 VsValcVaerLiquIdent m/sVsgAPIKg/m3Base S.G.Base APIBase Kg/m3ViscosityT1VfoVfabROCIin1Iin2Iin3Iin4
Io2 See Io1 list above.Vo1/2 See Io1 list above.Pgen1/2 See Io1 list above.
Relay Setup Relay 1 OffPower OnHigh LiquIdentLow LiquIdentS.G.APIKg/m3Base S.G.Base APIS Base Kg/m3High TemperatureLow TemperatureHigh FlowLow FlowFlow AlarmFault AlarmSpacingEmptyAerationROCReverse FlowBatchTotPos Total
THE CLAMP-ON MENU (continued)
�
�
�
�
��
��
��
(continued)
��
�
�
�
�
�
�
�
����� ��
�
�

5-19
1010DVNFM-3CSection 5
Clamp-On I/O Data Control Relay Setup Relay 1 Neg TotalFltwarnSoft FaultPig Detect
Relays 2/3/4 See Relay 1 list aboveAnalog Input Setup Iin1 Input Off
AuxS.G.APIKg/m3cScPPSIABARAT1 Deg FT1 Deg CT2 Deg FT2 Deg C
4 mA x.xxx (numeric entry)20 mA x.xxx (numeric entry)
Iin2/3/4 See Iin1 aboveDiagnostic Data Path Select 1
21 and 2
Path Enable NoFlow Data Flow (Units)
Flow Vel F/STotal (Units)Vs m/sSignal mVValc %Vaer %Alarm StatusAnCal (Units)HiFlow (Units)LoFlow (Units)
Application Info TN uSecTL uSecDeltaT nSecBurst/Sec% AcceptedLast MakeupMakeup Status
Liquid Data Temp 1Temp 2Reynolds #Liquid NameLiquIdentROCSpecific GravityAPIKg/m3Base S.G.Base APIBase Kg/m3Viscosity cPPressureViscosity cS
THE CLAMP-ON MENU (continued)
�
�
�
�
� � �
��
�
�
��
�
� � �
�
� ��
��
� � ��
�
�
�
��
� �
�
(continued)
�
�
�
�� ��

5-20
1010DVNFM-3CSection 5
Clamp-On Diagnostic Data Site Setup Data fx (drive)N (burst length)Ltn inVfmax (Units)Vs max m/sVs min m/sEmpty %Samples/CycleMax DampingMin DampingHF
Test Facilities Makeup No/YesGraph No/YesTx UP No/YesTx Dn No/YesFixed ALC No/YesTx Up Fixed ALC No/YesTx Dn Fixed ALC No/yesGraph AutoZero No/Yes
Print Site Setup NoYes
Date Site Created: xx.xx.xx xx.xx.xx
THE CLAMP-ON MENU (continued)
�
�
��
�
��
���
�
��
��
��� �
�

APPENDIX A
CouplantInstallationInstructions
Copyright©2008 Siemens Energy & Automation, Inc. All Rights Reserved Made in the USA


CC129A Dry FilmCouplant/Damping
MaterialInstallation Instructions
Installation InstructionsCC129A-7 Revision D
CN4973 February 2005
CC129A-7
Copyright©2008 Siemens Energy & Automation, Inc. All Rights Reserved Made in the USA


Installation Instructions CC129A-7
CN4973 February 20051
1. SELECTING A LOCATION FOR TRANSDUCER MOUNTING
��Locate the transducers downstream from the center of the longest available straight run. Alocation 20 pipe diameters or greater downstream from the nearest bend or reducer will pro-vide the best flow profile conditions.
� Avoid installing the transducers downstream of control valves, compressors or any other equip-ment that could possibly interfere with the acoustic signal. The best location will be as free aspossible from flow disturbances, vibration, sources of heat, noise, or radiated energy.
��Avoid mounting the transducers on a section of pipe with any external scale. Remove all scale,rust, loose paint etc., from the location.
��Do not mount the transducers on a surface aberration (e.g., pipe seam, etc.).
��Do not mount transducers from different ultrasonic flowmeters on the same pipe. Also, do notrun the transducer cables in common bundles with cables from communication equipment,other Siemens systems or any type of ultrasonic equipment. You can run these cables througha common conduit ONLY if they originate at the same flowmeter.
��Never mount transducers under water, unless you order submersible units and you install themin accordance with factory instructions.
��Never mount transducers on the top or bottom of a horizontal pipe. The best placement on ahorizontal pipe is either the nine o’clock or three o’clock position for Reflect Mode, or one trans-ducer at nine o’clock and one transducer at three o’clock for Direct Mode. For liquid flow mea-surement mounting on a vertical pipe is recommended only if flow is in the upward direction.When mounting on a vertical pipe flowing in a downward direction make sure there issufficient back pressure in the system to maintain a full pipe.
CC129A DRY FILMCOUPLANT/DAMPING MATERIAL
Installation Instructions
Siemens CC129A dry film couplant/damping material is an adhesive backed viscoelastic polymersheet that provides excellent acoustic coupling without concern for couplant washout. For Clamp-On gas applications this material effectively absorbs unwanted pipe noise to lower the minimumpressure required for flow measurement.
NOTE: In the following paragraphs, references to the 9 o’clock position indicate the sec-tion of horizontal pipe that is closest to you.
Recommended transducerplacement for Dual Beamreflect mount.
Transducer locatedat 3 o’clock
Transducer locatedat 9 o’clock
END VIEW
(Horizontal Plane)

Installation Instructions CC129A-7
2
2. PREPARING THE PIPE SURFACE
� Pick a mounting location with the longest straight run. You must have easy access to at leastone side of your pipe. For uninterrupted operation the mounting location must remain fully pres-surized, even at zero flow.
� Decide on your mounting mode (direct or reflect). Always use Reflect Mode whenever possibleor as recommended by the flowmeter installation menu. You may only need to use Direct Modeif your pipe is plastic.
� After receiving the spacing dimensions from the Installation Menu, prepare the pipe surface.Degrease the entire pipe surface where the CC129-1A damping material is to be applied andremove any grit, corrosion, rust, loose paint, etc.
NOTE: The effectiveness of the damping material is dependent on how well the CC129adhesive bonds to the pipe surface.
� If necessary, use the abrasive material provided to create a smooth contact surface for thetransducers (see diagram below).
Smoothed Areas. If necessary, smooth an area largeenough to accommodate transducers and also sev-eral inches around the locations where the trans-ducers are to be mounted. Clean pipe again to re-move any sanding residue.
PIPE
12341234
1234512345
PREPARING THE PIPE SURFACE
CC129-1A
��Make sure that you have a matched pair of transducers. They both should have the same S/Nnumber but marked with either an “A” or “B” (e.g., 100A and 100B).
3. CC129A DRY FILM COUPLANT/DAMPING MATERIAL
Each CC129-1A kit contains one or more 9” x 36” (229 mm x 914 mm) sheet(s) of CC129-1Afilm to be cut and applied to the surface of the pipe whose flow is to be measured.
Depending on the transducer size code multiple layers of CC129-1A may be required for optimaldamping. Refer to Table 1 below for the correct CC129-1A kit P/N and final CC129 coating thicknessspecified for each transducer size.
NOTE: Each CC129-1A kit contains the correct number of damping sheets (packaged in amailing tube) for the associated transducer size code.
CN4973 February 2005

Installation Instructions CC129A-7
3.1 CUTTING AND INSTALLING CC129A COUPLANT SHEETS
Orientation of the CC129-1A is not critical. Cut the sheet to achieve the best coverage and use ofmaterial. The full size (9” x 36”) sheet may be difficult to apply. Cutting the sheet to manageablepieces will not affect efficiency. DO NOT INSTALL TRANSDUCERS ON SEAMS.
3.1.1 SIZING SHEETS FOR PIPES 6-INCHES AND UNDER
��Cut the 36-inch sheet length in half. The 18-inch length will be applied along the axis of the pipe.
� Leave the sheet at the full 9-inch width for pipes over 3 inches in diameter. Cut width as neededto avoid significant overlap on pipes under 3 inches in diameter.
� Cut any additional sheets as required (see Table 1 for proper number of CC129-1A layers).
3.1.2 SIZING SHEETS FOR PIPES OVER 6 INCHES
� Use the full CC129-1A sheet dimensions. The 36-inch length will be applied along the pipe axis.
� Depending on the transducer size code multiple layers may be required. Refer to Table 1 forthe correct number of CC129-1A layers to apply.
3.1.3 APPLYING CC129A COUPLANT SHEET TO PIPE
� Verify that the ambient and pipe temperature fall within the temperature limits specified belowTable 1. Note that operating and installation temperatures are not the same.
��Determine the proper location of the transducers (refer to paragraph 1 above).
� Thoroughly clean and degrease the selected pipe area with a suitable solvent (see Cautions inpara. 3.1.5).
TransducerSizeB1HB2HB3H
C1HC2H
D1HD2HD3HD4H
RequiredLayers
111
11
2324
Final Thickness(in)
0.0270.0270.027
0.0270.027
0.0540.0810.0540.108
Final Thickness(mm)0.690.690.69
0.690.69
1.372.061.372.74
Table 1. CC129 Damping Material Thickness for 1010 Clamp-On Gas Systems
Operating Temperature Range Installation TemperatureRange -10 to 250ºF (-23 to 93ºC) 32 to 120ºF (0 to 50ºC)
CC129-1AKit P/N
CC129-1A-1CC129-1A-1CC129-1A-1
CC129-1A-1CC129-1A-1
CC129-1A-2CC129-1A-3CC129-1A-2CC129-1A-4
3 CN4973 February 2005

Installation Instructions CC129A-7
4
� After determining the best sheet cutting pattern from suggestions above, mark the pipe for thestarting edge of the dry couplant sheet position.
� Partially peel the sheet backing 1 to 2 inches from the starting edge, then carefully locate andpress against the pipe surface.
��While pressing firmly and sliding your hand against the sheet (along the pipe surface), slowlypeel away the backing such that it prevents the trapping of air.
� Apply the film slowly and carefully so that the sheet does not wrinkle, stretch or overlap,especially under the transducer contacting surfaces.
� Use the wooden hand roller supplied to smooth the film and assure adhesion to the pipe surface.
��Apply additional layers (if required) while avoiding any seams under the transducers.
��Use the wooden hand roller on each layer applied.
� Record final thickness of CC129-1A (from Table 1) for later entry into the 1010GC flowmeter.
CN4973 February 2005
ROLL IN LINE WITH PIPE AXIS
CC129-1A
WOODENROLLER

Installation Instructions CC129A-7
3.1.4 MOUNTING TRANSDUCERS
Install the mounting assemblies and transducers directly on top of the CC129-1A material. Useliquid couplant (CC128) for all clamp-on gas installations or if signal amplitude is low or marginal.
Follow the instructions in the manual for installing the transducers into the mounting assembliesand securing.
� Connect transducer cables.
� Return to the flowmeter and select menu cell [Install Complete] [Yes], then press <ENT>.
��Allow the system to successfully complete its initial makeup.
3.1.5 CAUTIONS ON THE USE OF CC129A DRY FILM COUPLANT
� Don’t clean the transducers or pipe surface with MEK, acetone, trichloroethane, trichloroethyl-ene, toluene, freon (and its vapors), chloroform, and xylene.
� Don’t use on oily or greasy pipe surfaces. It will interfere with adhesion.
AT LEAST 4"BOTH SIDES
AT LEAST 2"BOTH ENDS
IF FILM IS APPLIED IN PIECES, SEAM MAYBE BETWEEN, TRANSDUCERSBUT NOT UNDER
CC129-1A FILM
CUSTOMER'S PIPE
MOUNTING ASSEMBLIES AND STRAPS AREINSTALLED AFTER THE CC129-1A FILM
CN4973 February 2005 5

Installation Instructions CC129A-7
6 CN4973 February 2005
NOTE: Contact Siemens (www.siemens.com) for additional recommendations on use of CC129ADry Film Couplant/Damping Compound.
4-BEAM2-BEAM
MIN 8” WIDECC129A FILM
SMALL PIPES
WRAP CC129AALL AROUND PIPE
3.1.6 MULTI-BEAM INSTALLATIONS

Installation Instructions CC129A-7
7
3.2 GRACE ICE AND WATER SHIELD DAMPING MATERIAL
An alternate (lower cost) pipe damping material referred to as "Grace Ice and Water Shield" canbe considered for use with 1010 Clamp-On Gas systems. This opaque material has a black tarlike appearance with a very tenacious adhesive backing. Its lower operating temperature rangeand difficult removal from the pipe must be considered before installing this alternate material.Refer to the web site (www.graceconstruction.com) for a local distributors of this roofing underlaymentmaterial.
The installation and sizing of the Grace material is identical to that of CC129-1A. Refer to Table 2below for the recommended number in layers for each transducer size. (Operating / Installationtemperature ranges can be found just below Table 2.)
Table 2. Grace Ice and Water Shield Damping Material Thickness for1010 Clamp-On Gas Systems
Operating Temperature Range Installation TemperatureRange -10 to 150ºF (-23 to 65ºC) 32 to 120ºF (0 to 50ºC)
TransducerSizeB1HB2HB3H
C1HC2H
D1HD2HD3HD4H
RequiredLayers of Grace
111
11
1213
Thickness(in)
0.0380.0380.038
0.0380.038
0.0380.0760.0380.114
Final Thickness(mm)0.970.970.97
0.970.97
0.971.930.972.90
CN4973 February 2005


B-1
1010DVNFM-3CAppendix
SITE SETUP CONSIDERATIONS FOR SITRANS F 1010/1020N BLIND SYSTEMS
Siemens offers an economical “blind” 1010/1020 NEMA system (without a local keypad and graphicdisplay screen). This supplement describes the hardware and software requirements for programmingthese models. Site setup for a blind unit requires a PC connected to the RS-232 serial port. These modelsinclude a serial interface cable for this purpose. The serial interface cable includes 9-pin and 25-pinconnectors to accommodate both types of IBM-compatible serial ports. A PC communication programsuch as Terminal (Windows 3.x) or HyperTerminal (Windows 95/98/NT/2000/XP) serves as the dataentry interface. These programs reproduce the menu screens that would appear on the system’s graphicscreen. In fact, the example screens in this manual are actual HyperTerminal screen captures. Once theserial interface is established, the site setup procedure for blind and graphic display systems are identi-cal. You could choose to program a graphic display system using a PC and a communications program.However, note that for models with a local display screen, the serial interface cable is an option.
NOTE: You can use a DOS-based communications program also. Make sure that your PC is load-ing the ANSI.SYS driver via your Config.sys file. Set the program’s RS-232 parameters tomatch those of the flowmeter (see HyperTerminal example screen on the followingpages).
NOTE: Many newer Laptop PC’s are not equipped with serial ports, having USB ports only. ThesePC’s will require a USB RS-232 adaptor that can be purchased commercially. Not all ofthese adaptors are suitable. Siemens has found the best performance is achievedwith the adaptor from Radio Shack, (Part# 26-183).
THE RS-232 INTERFACE CABLE
The physical connection between the flow computer and your PC is accomplished using a serial interfacecable, part number: 1015CPC-N. The schematic below shows the configuration of the cable. The wireends for the flow computer termination are tinned for easy insertion into TB1 on the flow computer. Eachwire is labeled to identify the correct terminal pin on TB1. In addition, both connectors have their CTS pinshorted to the RTS pin (pins 4 - 5 on 25-pin connector and pins 7 - 8 on 9-pin connector). This eliminatesthe need for hardware “handshaking.”
APPENDIX B
1015CPC-N SERIAL INTERFACE CABLE
6GND
4 RX
1 TX
TB1
*Solder side shown*Solder side shown
2 3 5
7 8
2 3 4 5 7

B-2
1010DVNFM-3CAppendix
Due to the different SITRANS F 1010/1020 flowmeter configurations, there are 3 types of RS-232 com-munication cables employed. You can determine which cable is required for the your model flowmeterfrom the table below. Be sure you have the appropriate cable available for use.
For those who would prefer to make the cables themselves, the required parts (except for the RS-232 connector for the FUS1010WP flowmeter types) should be available at most computer orelectronics stores. You will find drawings of the terminations for these cables with the referencetable below. It provides the signal names, PC termination and SITRANS F 1010/1020 flowmetertermination for each type of flowmeter.
Also, in most computer stores or online, you will be able to find or you may already have a serial“LapLink” cable or “Null Modem” cable. These cables can be used to communicate with the FUP1010P/DP and FUS1020N systems.
If you purchased a FUS1010W model, you may have received the special connector used for theRS-232 terminal in a packet included with your 1010W. This will enable you to construct the ap-propriate cable for this meter type.
If you prefer to construct your own cable, the following conventions apply in the table:
PC: Refers to an IBM compatible, DB-9 serial Com port.
1010N: Includes all models (N, DN, MN, E, EXCEPT those with “A1” option). Termination is made tothe 1010N-2 I/O Data Module. Flowmeter end of cable is unterminated wire.
1010N With “A1” Option: Flowmeters that carry ”A1” option have 1010N-7 module installed thathouses a DB-9 connector for RS-232 communication.
1010P/1020N: Includes all models (P/DP). Termination is made to the RS-232 port DB-9 connector.A DB-9 Female connector is needed to mate with the meter connector.
1010WP: Includes all models (WP, WDP except energy meters). Termination is made to the RS-232port on the connector panel. A special cable terminal is required and can be obtained fromControlotron (Part #1015XWP).
1010X: Includes all models (X, DX). Termination is made to the 1010X-8 I/O module Terminal TB2.Flowmeter end of cable is unterminated wire.
Meter Type Cable Type Siemens Part Number NotesWeatherproof Portable DB-9F – Amphenol 1015CPC-WP Except Energy1010P/1020N DB-9F – DB-9F 1015CPC-P Use for Energy WPAll NEMA4X DB-9F – 3 Wire 1015CPC-NNEMA 4X with Expanded DB-9F - DB-9F 1015CPC-P For 1010N with “A1”I/O Module option (1010N-7 module)
All 1010X DB-9F – 3 Wire 1015CPC-N

B-3
1010DVNFM-3CAppendix
Signal PC DB-9 1010P/1020N 1010WP 1010N 1010XName Terminal Terminal Terminal Terminal TerminalGround Pin 5 Pin 5 Pin E TB1- pin 6 TB2-pin 16 Tx Pin 2 Pin 3 Pin C TB1- pin 1 TB2-pin 11 Rx Pin 3 Pin 2 Pin B TB1- pin 4 TB2-pin 14
HOW TO USE THE Windows HyperTerminal PROGRAM
Windows provides a communication program called HyperTerminal, which is ideal for interfacing yourcomputer with the flowmeter. The following typical example explains how to set up HyperTerminal. NOTE:Depending upon the Windows applications being used this setup procedure may vary.
1. From the Windows desktop, left-click on the [START] button.
2. Holding down the left mouse button, move the highlight up to [Programs], then across to [Accesso-ries]. Slide the highlight down to [HyperTerminal], then release the left mouse button.
3. Within the HyperTerminal window, move the mouse pointer down to [Hyperterm.exe] and then double-click the left mouse button.
4. This selects the [Connection Description] dialog box. Enter a name for your connection (e.g., 1010N).You can optionally select an icon for this connection by clicking on one of the icons displayed in thescrolling frame at the bottom of the window. Click [OK].
5. This selects the [Phone Number] dialog box. Move the cursor to the arrow at the right of the [ConnectUsing] field. Left click on the arrow to expand the field and then move the highlight down to [Direct toCom 1 (or 2)] depending on the port connected to the interface cable. Click [OK] to select the [Com1 (or 2) Properties] Dialog box. Set up your RS-232 parameters as shown in the example below. Left-click on the [OK] button.
COMMUNICATING WITH SYSTEM 1010/1020 VIA THE RS-232 INTERFACE
The following sections assume that you are familiar with the basics of using a Windows 3.x or Windows95/98/NT/2000/XP based communications program. All PC computers provide at least one serial portusing either a 9-pin or 25-pin D-type connector. The port designation can be either COM 1 or COM 2.Usually, when a computer includes two serial ports, COM 1 will be the 9-pin connector and COM 2 will bethe 25-pin connector. However, port designations can vary from manufacturer to manufacturer, so youwill have to positively identify the COM port you wish to use for the flowmeter interface. Connect the cablebetween the flowmeter and your PC using either the 25-pin, 9-pin or USB to RS-232 adapter connector,depending upon the port’s architecture.
1 5
6 9
PC DB-9 Connector1010P/1020N/990P Connector
(Wiring Side View)
H A B
G K J C
F E D
1010WP/WDP Connector(Wiring Side View)

B-4
1010DVNFM-3CAppendix
6. You will now see a blank terminal screen. Next left-click [File] on the top menu bar. Drag the highlightdown to [Properties] and then left-click.
7. Left-click the [Settings] tab. Expand the [Emulation] box by left-clicking the <Down Arrow> on theright-hand side. Drag the highlight down to [VT-100] and then left-click to select it (as shown below).
8. Next, left-click on the [ASCII Setup] button (see screen above). In the [ASCII Sending] dialog box,make sure that both [send line ends with line feeds] and [Echo Typed characters locally] areUNCHECKED. In the [ASCII Receiving] dialog box, left-click to place a check mark before the [Appendline feeds to incoming line ends] dialog. When your screen looks like the example below, left-clickthe [OK] button.
None
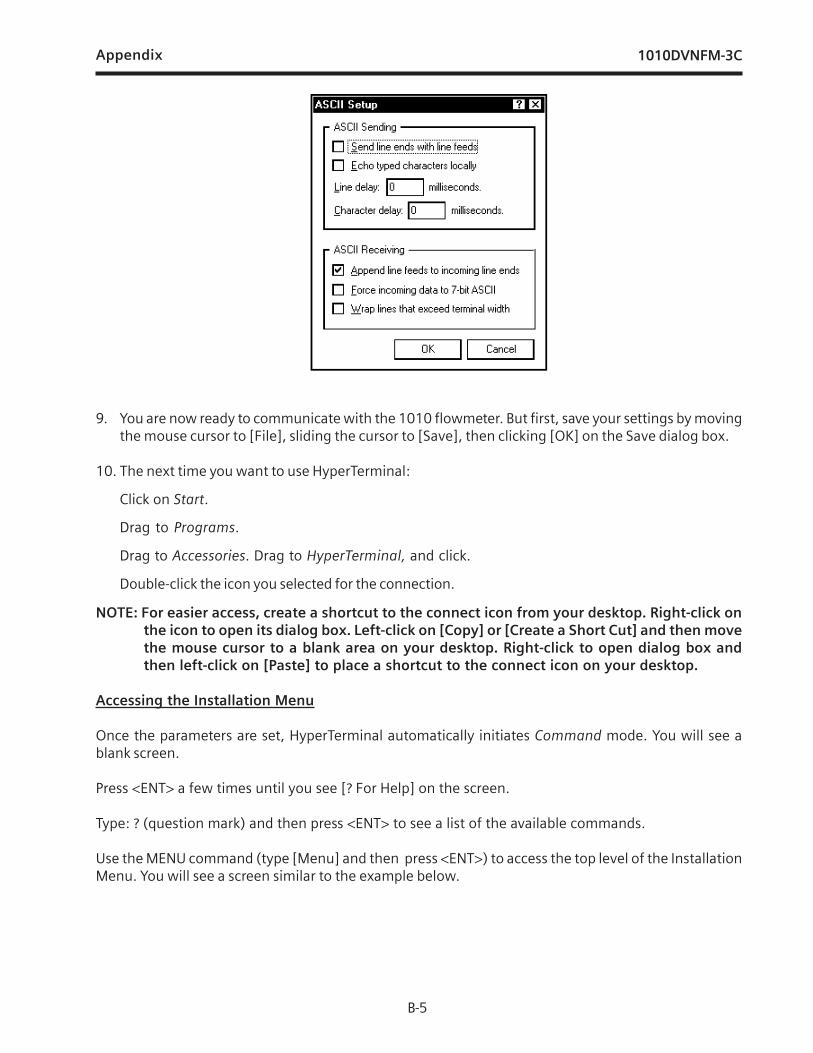
B-5
1010DVNFM-3CAppendix
9. You are now ready to communicate with the 1010 flowmeter. But first, save your settings by movingthe mouse cursor to [File], sliding the cursor to [Save], then clicking [OK] on the Save dialog box.
10. The next time you want to use HyperTerminal:
Click on Start.
Drag to Programs.
Drag to Accessories. Drag to HyperTerminal, and click.
Double-click the icon you selected for the connection.
NOTE: For easier access, create a shortcut to the connect icon from your desktop. Right-click onthe icon to open its dialog box. Left-click on [Copy] or [Create a Short Cut] and then movethe mouse cursor to a blank area on your desktop. Right-click to open dialog box andthen left-click on [Paste] to place a shortcut to the connect icon on your desktop.
Accessing the Installation Menu
Once the parameters are set, HyperTerminal automatically initiates Command mode. You will see ablank screen.
Press <ENT> a few times until you see [? For Help] on the screen.
Type: ? (question mark) and then press <ENT> to see a list of the available commands.
Use the MENU command (type [Menu] and then press <ENT>) to access the top level of the InstallationMenu. You will see a screen similar to the example below.

B-6
1010DVNFM-3CAppendix
Data Display Mode
After you complete the installation, you can toggle between Installation Menu mode to Data Displaymode. This is the same as using the <MENU> key on the 1010 keypad (see manual). The PC keyboardequivalent to the <MENU> key is <CNTRL> + <L>. Note that the 1010 RS-232 interface does not supportgraphics. Therefore, when you use HyperTerminal to view the data display screens, you will see thesame data in alphanumeric form only (as shown below). You can still use the <Up Arrow> and <DownArrow> to switch between available display screens.
NOTE: To facilitate connecting through modems, the [Menu] command times out after threeminutes of inactivity. To maintain a longer connection type: Menu 1000 and press <ENT>.The optional number is the amount in minutes that the connection will be maintained.Typing [Menu 1000] essentially keeps the interface alive until you cancel it.
Siemens Site [1]
Select Meter Type
Meter Facilities
Meter Type Single Channel
This is the current flowreading and flow units.(This would be a largegraphic characters on
the1010 screen.
This is the current measured liquidsonic velocity (Vs).This is the flow
total display.
This is the name of the current activesite setup. The [1] indicates thatmeasurement channel is currentlyactive.
This is the current flowreading and flow units.(This would be a large
graphic character onthe 1010 screen
This is the flowTotal display
This is the current measured liquidsonic velocity (Vs).
This is the name of the current activesite setup. The [1] indicates that themeasurement channel is currentlyactive.

B-7
1010DVNFM-3CAppendix
Navigating Through the Installation Menu
After accessing the Installation Menu, you can begin to setup your flowmeter according to the instruc-tions in this manual. The chart below shows the PC keyboard equivalents to the 1010 keypad keys whileyou are in the menu.
Terminal Mode Menu Commands
In addition to Menu, the following commands (followed by the <ENT> key) can be used to control theflowmeter while in Terminal Mode.
Note that “n” refers to the flowmeter Channel number. For a dual channel Arithmetic site (Ch1 + Ch2 orCh1 – Ch2) the virtual Channel is number 3.
Logger – Invokes the download of all data stored in the datalogger. Note that the datalogger data is noterased from the flowmeter memory when it is downloaded. It is recommended to capture this informationinto a file with a “csv” extension, which can be easily imported into MS EXCEL.
SITE – Invokes a full site download for a single channel or multi-path 1010 flowmeter.
SITE “n” – Invokes a site download for channel “n”, where “n” = the Channel # (1, 2, 3, 4, etc.).
DP “n” – Commands the flowmeter to download the digitized receive signal data for Channel or Path“n”.
CLRTOT – Clears the Totalizer for a single channel or multi-path 1010 flowmeter.
CLRTOT “n” – Clears the Totalizer for Channel “n” of a multi-channel flowmeter.
Lf on – Turns on the Line Feed at the end of any text string sent by the flowmeter.
Lf off – Turns off the Line Feed at the end of any text string sent by the flowmeter.
? – Provides a list of available Terminal Mode meter commands.
1010 Keyboard PC Keyboard Description<Up Arrow> <Up Arrow> Move up 1 menu cell (or Flow Display screen)<Down Arrow> <Down Arrow> Move down 1 menu cell (or Flow Display screen)<Right Arrow> <Right Arrow> Move right 1 menu cell (or Flow Display screen)<Left Arrow> <Left Arrow> Move left 1 menu cell (or Flow Display screen)<Menu> ^L (Cntrl L) Toggle between Menu and Flow Display<Datalog> ^D (Cntrl D) Generate Datalogger report<CLR> <Backspace> or <DEL> Deselect list selection<ALT+Up Arrow> ^U (Cntrl U) Logger Display Page Advance<+/-> (chg sign) | (bar, shift + backslash) Change numeric sign. Can also type (-) key.<ENT> <Carriage Return> Enter KeyDigits Digits Numerals zero through 9/ / Divide byX * (upper case 8) Multiply by+ + Plus- - Minus= = Equals. . Decimal Point

B-8
1010DVNFM-3CAppendix
Transfer of Information from a SITRANS F 1010/1020 Flowmeter to the PC
With HyperTerminal active:
1. Point to Transfers, and click.
2. Select Capture Text.
3. Select desired drive path or directory, enter a file name, and click the Start button.
4. Use the following conventions for data file names:
For site data or Waveshape data: filename.txtFor Datalogger data: filename.csv
5. On PC type the proper command for the data desired (Logger, Site, or DP) and then [Enter].
6. The data should begin streaming on the HyperTerminal screen.
7. Wait for EOT (End OF Transmission) to be displayed.
8. Close the file by pointing to Transfer, drag to Capture Text and click Stop button.
Close the Terminal or HyperTerminal Program.
You may now close the Terminal program. The file(s) you have downloaded are now saved in thelocation you selected. You may now import the file you have saved into the appropriate program (i.e., MSword for site data, or MS Excel for Datalogger or Waveshape data for graphing or analysis).
The datalogger contains data that has its fields separated by commas. By using the file extension “.csv”(comma separated values) suggested earlier, the data will import directly into MS Excel without anyfurther modification. For the waveshape data, the fields are separated by spaces, therefore, it is best tosave those files as .txt, then use the MS Excel Import Wizard to select “Space Delimiters” for importationof the data.
Site data is downloaded in plain text and can be imported directly into MS Word.

B-9
1010DVNFM-3CAppendix
To Clear All Dynamic Memory Using the RS-232 Interface:
CAUTION: Before proceeding further , it is essential to understand that this function eliminatesall data stored in RAM. This means that all saved site setups, including the site data ofa flow-calibrated site will be erased! Also, the entire Datalogger file plus any customfactory or user-created pipe or transducer tables will be eliminated. The impact ofthis is such that we strongly recommend that you consult our technical service de-partment before continuing with this procedure. If you choose to continue, be awarethat you will have to create a new site setup, re-enter all site specific parametersincluding pipe or transducer tables, plus all desired Meter Facilities entries.
1. Turn off power (if it is currently on).
2. Turn the power on. As soon as you apply power, type the @ character three times.
The prompt: [Clr Active Memory?] appears at the top of the screen. Press the <Down Arrow>.
Note that the prompt switches to [Clr Saved Data? No] .
3. Press the <Right Arrow> and then the <Down Arrow> to switch the option list to:[Clr Saved Data? Yes].
4. Press <ENT> to clear all Saved Site Data, Datalogger Data, user created Pipe Data and TransducerData.
5. To restore operation, press <MENU> to access the Installation Menu. Create a new site setup or recalla stored site setup. Reselect any Meter Facilities items (e.g., RS-232 setup parameters).
RESET PROCEDURE FOR BLIND SYSTEMS
SITRANS F 1010 Blind systems allow you to perform a system reset via the RS-232 interface. The follow-ing instructions require the flowmeter to be connected serially to a PC.
NOTE: Custom RS-232 settings for baud rate, parity and data bits may not be preserved. There-fore, be prepared to set your communications program back to the default (9600, Odd,7) settings.
To Clear Active Memory Using the RS-232 Interface
1. Turn off power (if it is currently on). Turn power on. As soon as you apply power, immediately typethe @ character three times. The prompt: [Clr Active Memory? No] appears at the top of thescreen.
2. Press the <Right Arrow> and then the <Down Arrow> to switch the option list to: [Clr Active Memory? Yes] Press <ENT> to clear all Active Site Data (but not saved site setups).
3. To restore operation, press <MENU> to access the Installation Menu. Create a new site setup or recalla stored site setup. Re-select any Meter Facilities items (e.g., RS-232 setup parameters).


Appendix 1010DVNFM-3C
C-1
Flow Computer Drawings
1010N-7 Installation Drawing, 1010 Series Single Channel Flow Computer1010N-8 Outline Dimensions, 1010 Series Single Channel Flow Computer1010DN-7 Installation Drawing, 1010 Series Dual Channel Flow Computer1010DN-8 Outline Dimensions, 1010 Series Dual Channel Flow Computer1010NS2-7 Installation Drawing, 1010 Series Flow Computer, FM Approved1010NS2-8 Outline Dimensions, 1010 Series Flow Computer, FM Approved1010WX-7 Installation Drawing, 1010 Series Single/Dual Channel Flow Computer1010WX-8 Outline Dimensions, 1010 Series Flow Computer1010WXC5-8 Outline Dimensions, 1010 Series Flow Computer1010N-7-7 Installation Drawing, Expanded I/O Module1010N-5-7 Installation Drawing, Analog Input Module1010N-2-7 Installation Drawing, I/O Module
4-Channel Drawings
1010MN-7 Installation Drawing, 1010 Series Multi-Channel Flow Computer1010MN-8 Outline Dimensions, 1010 Series Multi-Channel Flow Computer1010MWX-7 Installation Drawing, 1010 Series Multi-Channel Flow Computer1010N-8M-7 Installation Drawing, Multi-Channel I/O Module
Transducer and Accessory Drawings
1011HNFS-7 Installation, 1011HNFS Series Dedicated Plastic Body Transducer1011HNFS-8 Outline Dimension, 1011HNFS Series Dedicated Plastic Body Transducer1011NFPS-7 Installation 1011NFPS Series Dedicated Plastic Body Transducer1011NFPS-8 Outline Dimensions, 1011NFPS Series Dedicated Plastic Body Transducer1012BN-8 Outline Dimensions, 1010 Series Spacer Bar1012FN-8 Outline Dimensions, 1011 Series Dedicated Transducer Mounting Frames1012FNH-8 Outline Dimensions, 1011HN Series Dedicated Transducer Mounting Frames1012MS-8 Installation/Outline, Adjustable Mounting Strap1012TB-8 Installation/Outline, 1011 Series Test Block1012TN-7 Installation Drawing, 1010 Series Transducer & Mounting Tracks1012TN-8 Outline Dimensions, 1012 Series Mounting Tracks1012TNH-7 Installation Drawing, 1010 Series Transducer & Mounting Tracks1012TNH-8 Outline Dimensions, 1012 Series Mounting Tracks1012F-DB-7 Installation Drawing, Dual Path Transducer Set w/Mounting Frames990TDMVH-7A Installation Drawing, 990 Series Transducer & Tracks, Very High Temp., Direct
Mode990TDMVH-7B Installation Drawing, 990 Series Transducer & Tracks, Very High Temp., Direct
Mode990TRMVH-7A Installation Drawing, 990 Series Transducers & Tracks, Very High Temp., Reflect
Mode990TRMVH-7B Installation Drawing, 990 Series Transducers & Tracks, Very High Temp., Reflect
Mode191N1S-7 Installation Drawing, 191N1S Transducer, NEMA 4191N1S-8 Outline Dimensions, 191N1S Transducer, NEMA 4
APPENDIX CENGINEERING DRAWINGS

Appendix 1010DVNFM-3C
C-2
191N1H-7 Installation Drawing, 191N1H Transducer, Hi Temp., NEMA-4191N1H-8 Outline Dimensions, 191N1H Transducer, Hi Temp., NEMA-4991TN-7 Installation Drawing, Temperature Sensor, NEMA-4991TN-8 Outline Dimensions, Temperature Sensor, NEMA-4991TN-7A Installation Drawing, 990 Series, Temperature Sensor, NEMA-4991TN-8A Outline Dimensions, 990 Series, Temperature Sensor, NEMA-4991TW-8 Installation/Outline Dimensions, Insert Temperature Sensor, 990E System

���������21614C
50-60 HzSINGLE PHASE
AC POWER SUPPLY
90-230 VOLTS
1010N-9S

���������
����� ���� ���� ��
� � �� � �� �
� �������� ����������
21614C
��������������������
������ ���
���� ��������� ��������

����������21614C
50-60 HzSINGLE PHASE
90-230 VOLTS
AC POWER SUPPLY1010N-9S

����������
� � �� � �� �
21614C
� �������� ����������
���� ��������� ��������
��������������������
������ ���


�����������
� � �� � �� �
� �������� ����������
21614C
� ����������
������������������������
�������
��������


�������������
�������� ������ �������� ��������
21614C

���������
�������� ��� � ����� !�����
21614C

���� ����"��#�� � ��������� ��
��� !�����
���������C 21614
�������� ������ ��

����������21614C

����������21614C
��
��
��
��
� �������� ����������


����������21614C
��� !�����

1010N-8M-7
INSTALLATION DRAWING I/O MODULE
21614C
������� ��$"$
������� ��$�$
�"%��������!� � ���� ����
�"���������������
�"���� ��%���&������
�"����������!�����������

������'���21614C

������'���C 21614

������'���
�����!�������"����#�$ �����!�������"����#�!
C 21614
�����!�������"����#�!
�����!�������"����#�!
�����!�������"����#�$
�����!�������"����#�$


21614C �����'������

�����'������C 21614

�����'������C 21614

21614C �����'������

�����'����21614C

����"���
�� ���� ���� ���������� ����������"��
21614C
18REF1012BN-1 98 1110 12 1413 15 1716 2319 20 21 22 24 25 26 27 28 29 30

����'���
����� ���� ���� ������������ ������ �����
� �������� ��'��������
������������ ��
21614C

����'����
!������� !� ��%������ !�
��������!� ������
� �������%�������������$��
� �� �&'(
21614C


�����"����
� �������� �!�� ���������� ��������"��#
21614C

��������
� �������� ������ ����������� �������������������������� �������#�
21614C

��������
� �������� ������ ���������� ��������������������� �������#�
21614C

����������
����� ���� ���� ��
��%������ !�
!������� !�
���������� ���
21614C
��� �������#

���������
� �������� ������ ����������� �������������������������� �������#�
21614C

���������
� �������� ������ ���������� ��������������������� �������#�
21614C

�����������
����� ���� ���� ��
��%������ !�
!������� !�
����������� ���
21614C
��� �������#

����'��"��21614C


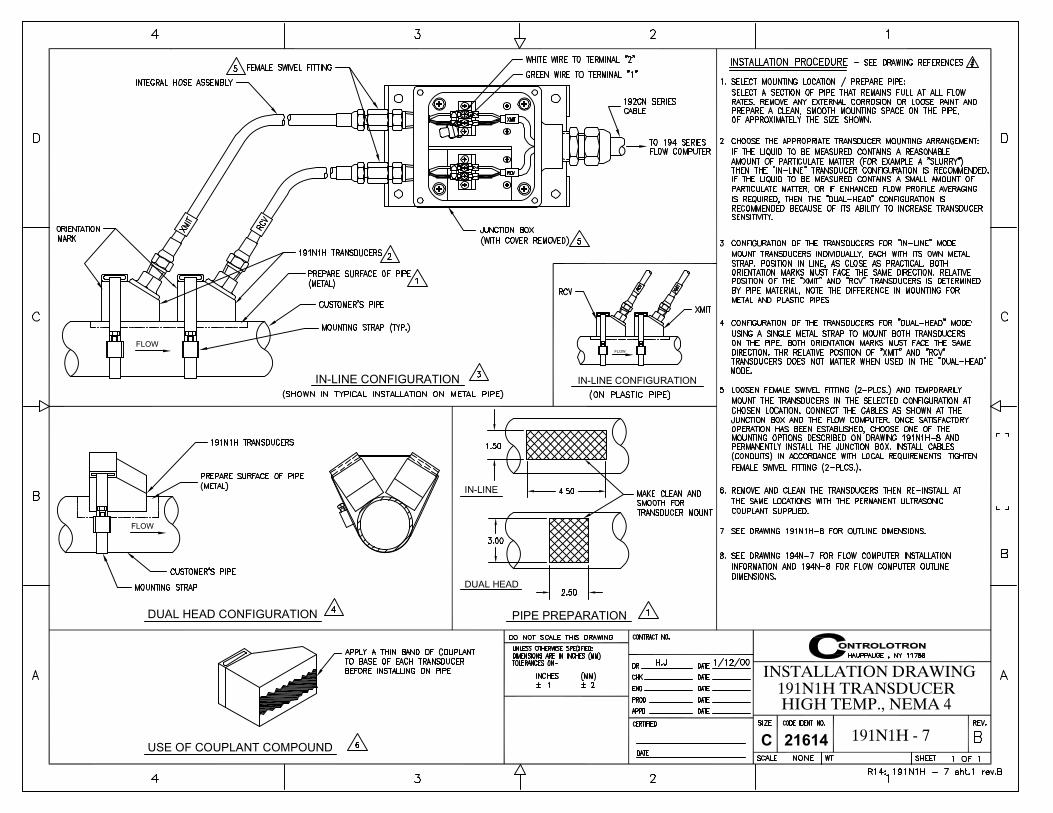
PIPE PREPARATION
DUAL HEAD
DUAL HEAD CONFIGURATION
USE OF COUPLANT COMPOUND
FLOW
IN-LINE
FLOW
IN-LINE CONFIGURATION
�������� ������ ������������������� �������()������%
21614C ����������
IN-LINE CONFIGURATION
FLOW

21614C
IN-LINE CONFIGURATION
DUAL HEAD CONFIGURATION
191N1 TRANSDUCER SET
�� ���� ���� ������������������� �������()������%
����������
FLOW
FLOW

21614C
STEP - 4
BAND LENGTH TABLE
PERMANENT INSTALLATION / SERVICE NOTE
STEP - 2
STEP - 3
���� �����)������%����������������� �������� ������ ��
���������
STEP - 1

21614C
������������������� �����)������%
�� ���� ���� ��
���������
54
32
1


L
�������� �!�� ���
TEMPERATURE BELOW 225°F ONLYSUITABLE FOR AMBIENT TEMPERATUREGLAND SUPPLIED WITH CABLE IS
21614C
PART No.L
���������


1010DVNFM-3CIndex
Index
Symbols
1011 Series Transducers 3-11011 Universal Transducer 2-241011H High Precision Transducer 2-24991 Universal Transducer 2-24
A
Absolute Flow 2-49Vfab, Vfo, Vs 2-49
Accuracy 5-3Active Memory 2-1, 5-7Actual Zero 2-32Aeration 5-5, 2-56Alarm Letter Codes And Descriptions 2-65Alarm Levels, setting 2-54Alphanumeric Strings 1-5, 1-8Analog Input Setup (optional function) 2-74
Module, Analog Input; wiring 3-21Setting Current Input 2-75
Analog Out Setup 2-70Outputs, Setup Data Categories 2-70Assigning Functions
Io, Vo 2-71Pgen 2-72
Analog Output Trim 5-13Analog Output Trim Menu 4-9Analog Output Span 2-70API 2-53, 2-55Application Data 1-6Application Data Menu 2-12Application Data Menu Structure 2-13Application Info Menu 2-79Application Notes, System 1010 5-1Arithmetic Operation 1-10AutoZero 2-32Axial Alignment 3-10
B
Backlight 4-15Selecting 4-16
Batch/Sample Total 2-46Batch/Sample Volume 2-46
Entering 2-46
C
Calibration Tables 1 through 3 2-60Calibrating Flow Rate and Calibration Tables 2-58
Intrinsic 2-58
Index-1

1010DVNFM-3CIndex
Kc Calibration 2-58Channel 1+2 1-9Channel 1-2 1-9[Channel Setup] 1-12Channel Setup Menu 2-2Channel Setup Menu Structure 2-2Character Entry Field 1-8Choosing Pipe Class 4-2Choosing Pipe Name 4-2Circular Memory 4-7Circular Memory Mode 4-6Clamp-on Menu 5-14Clamp-on Operation 1-1Clamp-on Transducer Mounting Modes 3-2
Direct, Reflect 3-2Selecting Location 3-1Vertical Mounting 3-2
Clamp-on Transit-time 1-9Clearing Active Memory Only 2-93Clearing All Dynamic Memory 2-93Clearing Datalogger 4-8Clock Set Menu 4-12
Setting Date, Setting Time 4-12Command Modes 2-88
Digital Damping Control 2-88Transit-Time Adjustment 2-88
Conventions, field manual 2-1Correlated Plot 2-87Couplant (see Sonic Couplant)Create/Edit Pipe Function 4-3Create/Name a Site Setup 1-13
New Site Setup 2-4Create/Name Site Command 1-12Cross-flow 1-10Current Output Trim (Io1 & Io2) 4-9
Calibration 4-9Custody Transfer 2-24, 2-49Custom Pipe Data 2-9
D
Damping Control 2-37Data Output Filter Types 2-37SmartSlew 2-37Time Average 2-37
Datalogger 1-3Control 5-13Data 2-65Data Option 1-7Events 2-66Memory 5-7Mode 2-65Setup 5-16
Datalogger Control Menu 4-6Datalogger Setup Menu 2-63
Menu Structure 2-64
Index-2

1010DVNFM-3CIndex
Data, Application 2-11Data, Pipe Entry 2-9Data Bits 4-14
Setting The Data Word Length 4-14Data Scatter 2-37, 5-3Data Span/Set/Cal 5-15Data Span/Set/Cal Menu 2-46
Menu Structure 2-47Data Stability 5-3
Data Drift 5-3Data Scatter 5-3
Deadband Control 2-37Defragment Command 2-5, 5-7Defragmenting Memory 4-8Deleting Pipe(s) From Pipe Table 4-4Density (SG) 2-15Diagnostic Data 5-18Diagnostics Data Menu 2-75
Correlated Plot 2-87Graph Screen 2-87
Description 2-87Main Screen 2-75Text Display 2-87Time Base Control 2-87
Diagnostic Main Menu Description 2-77Diagnostic Menu 1-11, 2-76Direct Mode-Mounting Frames, Spacer Bar and Spacing Guide 3-12
Aligning The Transducers 3-15Finding The Halfway Distance 3-15
Displaying Datalogger 4-6Display Datalogger 2-67
Enable, No-line Wrap Mode, Scroll 2-67Display Screen, typical 1-3DV Liquid Table 5-9Dual-Channel 1-1, 1-9Dual-Channel Clamp-on 1-11Dual-Channel Flow 1-11Dual-Channel Menu Chart 5-13Dual Path 1-9
E
Editing Default Parameters, typical 2-6Editing The Default SmartSlew 2-37Editing The Density (SG) Setting 2-15
Nominal Specific Gravity 2-15Default Specific Gravity 2-15
Editing The Estimated Vs (liquid sonic velocity) 2-15Editing The Viscosity (cS) Setting 2-15Empty Pipe Set Menu 2-31Entering Alphanumeric Strings 1-8Entering Numeric Data 1-7Envelope Threshold Adjustment 2-89Establishing The Correct Distance Between The Tracks 2-27 (see Section 3)Estimated Vs (m/s) 2-15Estimating Log Time Left 4-8
Index-3

1010DVNFM-3CIndex
F
F4 Reset Sequence 2-92FastStart Setup 1-15Fault Messages 2-69, 2-91Flow Calibration 2-58
Effects Of Pipe Material Selection 2-10Flow Computer Messages 2-91Flow Conditions 5-3
Flow Rates 5-4Data Damping, Flow Data Scatter, Low Flow Rates 5-4
Flow Data Menu Items 2-77Alarm Status, Flow, Flow Vel F/S, Signal (mV), Total, Vaer %, Valc % 2-77AnCal, HiFlow, LoFlow, Vs m/s 2-78
Flow Display 4-18Flow Display Range 2-44
Autorange (Default), High Range 2-44Flow Display Scale 2-44Flow Time Units 2-43
Selecting Time Units 2-44Flow/Total Units Menu Structure 2-42Flow Velocity Range 5-2Flow Volume Units 2-43
Selecting Volumetric or Mass 2-43Flow/Total Units 5-15Flow/Total Units Menu 2-41Flowmeter Installation Steps 1-1
Flowchart 1-14Full Site Setup 1-4Four-function Calculator 1-7Force Transmit Procedure 2-28Function Keys 1-3
G
Getting Started 2-1Graphic Display Screens 2-86, 4-1, 4-16
H
HF Menu Item 2-81Automatic Adjustment Procedure 2-83Manual Adjustment Procedure 2-83
Hardware Installation Guide 3-1Hazardous Applications 1-1High API 2-55High Base API 2-55High Base Kg/m3 2-55High Base S.G. 2-55High Flow 2-54High LiquIdent 2-57High Kg/m3 2-55High S.G. 2-55High Temperature 2-56High Viscosity cS 2-56How To Recall A Site Setup 2-2Hot Key Summary 2-90
Index-4

1010DVNFM-3CIndex
Index-5
I
I/O Data Control 5-15I/O Data Control Menu 2-68Inaccurate Viscosity Values 5-5Index Pin 3-12Index Value 2-20Index Variable 2-59Initial Makeup 2-29In-line Transit-Time 1-9[Install Completed?] Command 2-27Installation Menu 1-1, 1-4Installing a 1012T Mounting Track In Direct Mode 3-18
180 Degrees Opposed With Mounting Track 3-18Installing a 1012T Mounting Track In Reflect Mode 3-16Installing The Transducers 3-1
Finding The Halfway Distance 3-15Picking The Appropriate Transducer 5-2Preparing The Pipe 3-3
Interface Alarms 2-57High LiquIdent 2-57Interval Secs 2-57Low LiquIdent 2-58Relay Hold Time 2-57ROC Alm Set m/s 2-57
Interface Vs m/s 2-56Intrinsic 2-56
K
K0 and K1, entering 2-18, 2-20Kc Calibration 2-58Kc Control 1-11Kc Factor 2-59
Entering 2-60Keypad 2-1
Enable/Disable Switch 1-2
L
Leak Detection 2-24Line Feed 4-14
RS-232 4-13Liner Material 2-11
Default Material 2-11Material Option List 2-11
Liner Thickness 2-11Liquid Class, selecting 2-14Liquid Conditions 5-5Liquid Data Menu 2-77Liquid Name 2-20LiquIdent 2-16
SettingsIndex 2-19Pressure Slope 2-17Reference Base Temperature 2-18Slope 2-16

1010DVNFM-3CIndex
Index-6
Log Time Interval 2-66Low Flow 2-55Low LiquIdent 2-57Low Signal Message 2-92Ltn Menu Cell 2-27
M
Makeup Latch 2-57Disable, Enable 2-57
Managing Site Setups 2-2Marking Transducers 4-5Matching Serial Numbers 2-27, 3-1, 5-2Max API 2-53Max Base API 2-53Max Base Kg/m3 2-54Max Base S.G. 2-53Max Flow 2-52
Range Setting 2-52Max Kg/m3 2-53Max LiquIdent 2-52Max ROC 2-52Max S.G. 2-53Max Temperature 2-54Max Viscosity cS 2-54Max Vs m/s 2-53Measured Vs 2-30
To Accept, To Edit 2-30Measurement Channel 2-3
Enable, Disable 2-3Memory Control 5-13Memory Control Menu 4-8Memory Delay (Sec) 2-38
Specify 2-38[Memory Full!] Message 5-7Memory Map 4-8Memory Resources 5-6
ROM, RAM 5-6Memory/Fault Set 2-37Menu Screen, typical 1-3Meter Facilities 1-5
Default Units 4-1Meter Facilities Functions 4-1Meter Facilities Menu 4-1, 5-13Meter Resources 1-10Meter Type 1-5Meter Type Menu 1-8Min API 2-53Min Base API 2-53Min Base Kg/m3 2-54Min Base S.G. 2-53Min Flow 2-52
Range Setting 2-52Min Kg/m3 2-53Min LiquIdent 2-52Min ROC 2-53

1010DVNFM-3CIndex
Index-7
Min S.G. 2-53Min Temperature 2-54Min Viscosity cS 2-54Min Vs m/s 2-53Mod of Elast PSI 2-12Mounting Transducers 3-1
Identifying 1011 Transducers and Mounting Hardware 3-1Underwater Mounting 3-1
Mounting Track 2-27 (see Section 3)Part Number, Spacing Index 2-27
MTY Command, Actual 2-31MTYmatic Command 2-31Multi-Channel Meter Type 1-10Multi-Path Installation 1-10Multi-Path Operation 1-10Multi-Path Sites 1-10Multiple Select Option Lists 1-7Mylar Spacing Guide 3-8
Wrapping Guide Around Pipe 3-14
N
NEGFLOW 2-41, 2-46NETFLOW 2-41, 2-46Network ID 4-15
Assigning ID Number 4-15New Point 2-48Non-axial 1-10New Site Setup, Creating 1-12Nuclear Power Applications 2-24Number Index Menu Cell 2-26Number Index 3-4Numeric Entry 1-5
O
Operation Adjust Menu 2-36Operation Adjust Menu Structure 2-36Operation Adjust 5-15Outputting Datalogger 4-7
P
Parity 4-14Password Entry Option 1-2, 2-4Pgen, Digital (Custody Transfer Flowmeters only) 2-49Pgen Output Trim (Pgen 1 & Pgen 2) 4-10
Calibration 4-10Physical Measurement 1-11Pick/Install XDCR Menu 2-23Pick/Install XDCR Menu Structure 2-24Pipe Class 2-6
Selecting 2-9Pipe Configuration 2-21
Option List Definitions 2-22Menu Structure 2-22Selecting 2-21

1010DVNFM-3CIndex
Index-8
Pipe Considerations For Clamp-on Transducer 5-2Pipe Data Menu 2-6
Outer Diameter, Wall Thickness, 2-6Pipe Data Menu Structure 2-8Pipe Dimensions 5-2Pipe Material 2-10
Selecting 2-10Pipe Outer Diameter 2-10, 4-3
Selecting 2-10, 4-3Pipe Outer Dimension 2-10Pipe Parameters 1-1, 2-6Pipe Size 2-10
Selecting 2-10Pipe Table 4-2
Accessing Menu 4-2Factory Settings 4-2
Pipe Temperature Range 2-20Selecting 2-21
Pipe Wall Thickness 4-3POSFLOW 2-41, 2-46Power Failure 2-1Preparing The Pipe Surface 3-3Print Site Setup 5-19
R
Recall Site Command 2-2Recall Site Setup 2-1Reference Hole 3-13Reflect Mode
Mounting Frames and Spacer Bar 3-9With Spacer Bar Only 3-10
Reflect Mount 3-17Installation With Mounting Track 3-17
Relay Hold Time 2-57Relay Option List 2-73Relay Setup 2-73, 5-17
Assigning Relay Functions 2-73Resultant Data 1-9ReversaMaticTM 2-32Reynolds Number 2-21
Compensation Factors, table 5-9ROC Alm Set m/s 2-57, 2-61RS-232 Setup Menu 4-13
Baud Rate 4-13Parity 4-14
RTD 4-10Calibrate Menu 4-10Calibration By Data Entry 4-11Entering Current RTD Temperature 4-11Ice Bath Calibration 4-11
RTS Key Time 4-15Setting RTS Key Time 4-15

1010DVNFM-3CIndex
Index-9
S
Safety Considerations 1-1Save and Recall Data Sites 1-10Save and Restore Operations 1-10Save/Rename Site Command 2-5Scrollable Option List 1-5Selecting
Channel 1-4, 1-9, 1-11, 2-3Data Options, StripChart 2-62Datalogger Data Items 2-65Datalogger Event Items 2-66
Deselecting/Selecting 2-67Liquid Class 2-14Meter Type 1-11Memory Mode 2-38Path 1-10Time Average 2-37Transducer Model 2-24Transducer Mount Mode 2-25
Direct, Reflect 2-25Transducer Size 2-25Transducer Type 2-24Zero Flow Adjust 2-32
Sensors, Temperature 3-20Serial Data Port 1-3 (see also RS-232)Set Empty Command 2-31
Empty Pipe Alarm Threshold 2-32Setting Analog Output Span 2-71Setting Clock 4-13Setting The Log Time Interval 2-66Single Channel 1-1Site Programming 1-11Site Setup 1-1
Full Site Setup 2-1Recall Site Setup 2-2
Site Setup Reference Tables 5-7Site Storage Memory 1-10Slope Correction 1-10Slurries 5-6SmartSlew 2-37, 5-5Software Version 1-5Sonic Coupling Compounds 5-9 (also see Appendix A)
CC#122 5-9Alternative Coupling Compounds 2-101Official Coupling Compounds 2-101Recommended Sonic Coupling Compounds 5-10
Sonic Velocities for Common Liquids 5-7Sonic Velocity For Pure Water @ Various Temperature (Meters/sec) 5-8Sonilocator 2-38Spacing Guide Part Numbers 3-7Spacing Indices 5-2 Ltn 5-2Spacing Method, Transducers (see Section 3)Span, Analog Output 2-70, 4-9

1010DVNFM-3CIndex
Index-10
STD Vol Corr. 2-43, 2-45Strap Mounting Kit Numbers 3-5StripChart Elements 4-16StripChart Setup 5-16System Information 4-16
Checksum, Code, Op System P/N, Reset Date/Time, Version, System Time 4-16System Performance 5-2
Accuracy, Repeatability 5-3
T
Table Setups Menu 4-2Temperature and Pressure Ratings 5-6Temperature Sensor 3-20
Mounting 3-20Wiring to Analog Input Module 3-21
Terminology Chart For 1010 Series 5-11Test Facilities 5-19Test Facilities Commands 2-85
Graph Screen 2-86Makeup 2-85
Test Facilities Menu 2-85ThermExp Coef 2-12Time Average 5-4Time Base Control 2-87Total Resolution 2-45Total Volume Units 2-44
To Change Default 2-44Totalizer 1-3Totalizer Controls 2-41Totalizer Display Modes 2-41
NEGFLOW, NETFLOW, POSFLOW 2-41Totalizer Mode 2-46
Selecting 2-46Totalizer Scale
Selecting A Different Scale 2-45TOTCNT 2-45Technical Assistance 5-1Transducer Pairs 2-27
Matching Serial Numbers 2-27Transducer Installation 2-23, 3-1Transducer Pick/Install 2-23Transducer Selection 2-24Transducer Type Menu 4-4[Transfer Install] function 2-28Transit-Time 1-9Transmit/Receive Functions 2-24Troubleshooting Tips 2-91
Flow Computer Messages 2-91Mounting Transducers On A 1012 Test Block 2-94Troubleshooting With Transducer Test Blocks 2-94Using 1012TB-1 and -2 Test Blocks 2-94Using F4 Reset Sequence 2-92
Two-Phase Liquids 5-6Overflow Buffer 2-45

1010DVNFM-3CIndex
Index-11
U
Ultrasonic Transit-Time 1-10Units, Flow/Total 5-15Units, Flow Volume 2-41, 5-15Using FastStart Setup 1-15Using 1012T Mounting Tracks 3-16
Installing In Reflect Mode 3-16Using ReversaMatic 2-33Using The 996PSP Pipe Simulator 2-96
Mounting 2-96Using The Spacing Offset 2-25
V
Vaer % 5-5, 5-17Valc % Value 5-3Virtual Channel 1-9Visc Slope 2-20Viscosity 2-14Viscosity cS 2-14, 2-15, 2-54Viscous Liquids 5-6Voltage Output Trim (Vo1 & Vo2) 4-9
Calibration 4-9Volumetric Flow Rate 2-49
Vfab, Vfo, Vs 2-49Vps Values (in inches/sec) For Some Common Metals 5-8Vs (Sonic Velocity) 5-7, 5-8
W
Wall Thickness 2-11ASA Schedule 2-11Entering 2-11Thickness Gauge 2- 11
Z
ZeroClr 2-32Zero Flow Adjust 2-32ZeroMatic 2-32, 2-34Zero Crossover Adjustment 2-89

TradeMarks of Siemens Energy & Automation Inc.
AutoZeroMultiPulseReflexorReversaMaticSmartSlewUniMassWidebeamZeroMatic
Windows 95/98/NT/2000/XP, Windows 3.x.x Terminal, MS Word, MS Excel and HyperTerminalare a trademarks of MicroSoft Corporation.
Flaretek® is a registered trademark of Fluroware Inc., Chaska, MN.
Swagelok® is a registered trademark of Swagelok Inc., Solon, OH.
TRADEMARKS

CLASS 50Nominal
Diameter
3468101214161820243036424854
N/A N/AN/A N/A0.25 6.400.27 8.510.29 10.520.31 12.580.33 14.640.34 16.720.35 18.800.36 20.880.38 25.040.39 31.220.43 37.440.47 43.560.51 49.780.57 56.42
Wall I.D.
DUCTILE IRON PIPE
Actual
O.D.
3.964.806.909.0511.1013.2015.3017.4019.5021.6025.8032.0038.3044.5050.8057.56
CLASS 51
0.25 3.460.26 4.280.28 6.340.30 8.450.32 10.460.34 12.520.36 14.580.37 16.660.38 18.740.39 20.820.41 24.980.43 31.140.48 37.340.53 43.440.58 49.640.65 56.26
Wall I.D.
CLASS 52
0.28 3.400.29 4.220.31 6.280.33 8.390.35 10.400.37 12.460.39 14.520.40 16.600.41 18.680.42 20.760.44 24.920.47 31.060.53 37.240.59 43.320.65 49.500.73 56.10
Wall I.D.
CLASS 53
0.31 3.340.32 4.160.34 6.220.36 8.330.38 10.340.40 12.400.42 14.460.43 16.540.44 18.620.45 20.700.47 24.860.51 30.990.58 37.140.65 43.200.72 49.360.81 55.94
Wall I.D.
CLASS 54
0.34 3.280.35 4.100.37 6.160.39 8.270.41 10.280.43 12.340.45 14.400.46 16.480.47 18.560.48 20.640.50 24.800.55 30.900.63 37.040.71 43.080.79 49.220.89 55.78
Wall I.D.
CLASS 55
0.37 3.220.38 4.040.40 6.100.42 8.210.44 10.220.46 12.280.48 14.340.49 16.420.50 18.500.51 20.580.53 24.740.59 30.820.68 36.940.77 42.960.86 49.080.97 55.62
Wall I.D.
0.40 3.160.41 3.980.43 6.040.45 8.150.47 10.160.49 12.220.51 14.280.52 16.360.53 18.440.54 20.520.56 24.680.63 30.740.73 36.840.83 42.840.93 48.941.05 55.46
Wall I.D.
CLASS 56
0.125 0.2500.125 0.2500.125 0.2500.125 0.2500.125 0.2500.125 0.2500.1875 0.3750.1875 0.3750.1875 0.3750.1875 0.3750.1875 0.3750.250 0.5000.250 0.5000.250 0.5000.250 0.5000.250 0.500
Single Double
Liner (Cement)
Siemens Flow Instruments155 Plant Avenue, Hauppauge, New York 11788-3801
Tel. +1 (631) 231-3600 Fax. +1 (631) 231-3334Web: www.siemens.com
CLASS APipe
Size
3468101214161820243036424854607284
3.80 0.39 3.024.80 0.42 3.966.90 0.44 6.029.05 0.46 8.1311.10 0.50 10.1013.20 0.54 12.1215.30 0.57 14.1617.40 0.60 16.2019.50 0.64 18.2221.60 0.67 20.2625.80 0.76 24.2831.74 0.88 29.9837.96 0.99 35.9844.20 1.10 42.0050.50 1.26 47.9856.66 1.35 53.9662.80 1.39 60.0275.34 1.62 72.1087.54 1.72 84.10
O.D Wall I.D.
CLASS B
3.96 0.42 3.125.00 0.45 4.107.10 0.48 6.149.05 0.51 8.0311.10 0.57 9.9613.20 0.62 11.9615.30 0.66 13.9617.40 0.70 16.0019.50 0.75 18.0021.60 0.80 20.0025.80 0.89 24.0232.00 1.03 29.9438.30 1.15 36.0044.50 1.28 41.9450.80 1.42 47.9657.10 1.55 54.0064.40 1.67 60.0676.00 1.95 72.1088.54 2.22 84.10
O.D Wall I.D.
CLASS C
3.96 0.45 3.065.00 0.48 4.047.10 0.51 6.089.30 0.56 8.1811.40 0.62 10.1613.50 0.68 12.1415.65 0.74 14.1717.80 0.80 16.2019.92 0.87 18.1822.06 0.92 20.2226.32 1.04 24.2232.40 1.20 30.0038.70 1.36 39.9845.10 1.54 42.0251.40 1.71 47.9857.80 1.90 54.0064.20 2.00 60.2076.88 2.39 72.10
O.D Wall I.D.
CLASS D
3.96 0.48 3.005.00 0.52 3.967.10 0.55 6.009.30 0.60 8.1011.40 0.68 10.0413.50 0.75 12.0015.65 0.82 14.0117.80 0.89 16.0219.92 0.96 18.0022.06 1.03 20.0026.32 1.16 24.0032.74 1.37 30.0039.16 1.58 36.0045.58 1.78 42.0251.98 1.96 48.0658.40 2.23 53.9464.82 2.38 60.06
O.D Wall I.D.
CLASS E
7.22 0.58 6.069.42 0.66 8.1011.60 0.74 10.1213.78 0.82 12.1415.98 0.90 14.1818.16 0.98 16.2020.34 1.07 18.2022.54 1.15 20.2426.90 1.31 24.2833.10 1.55 30.0039.60 1.80 36.00
O.D Wall I.D.
CLASS F
7.22 0.61 6.009.42 0.71 8.0011.60 0.80 10.0013.78 0.89 12.0015.98 0.99 14.0018.16 1.08 16.0020.34 1.17 18.0022.54 1.27 20.0026.90 1.45 24.0033.46 1.73 30.0040.04 2.02 36.00
O.D Wall I.D.
CLASS G
7.38 0.65 6.089.60 0.75 8.1011.84 0.86 10.1214.08 0.97 12.1416.32 1.07 14.1818.54 1.18 16.1820.78 1.28 18.2223.02 1.39 20.2427.76 1.75 24.26
O.D Wall I.D.
CLASS H
7.38 0.69 6.009.60 0.80 8.0011.84 0.92 10.0014.08 1.04 12.0016.32 1.16 14.0018.54 1.27 16.0020.78 1.39 18.0023.02 1.51 20.0027.76 1.88 24.00
O.D Wall I.D.
CAST IRON PIPE - AWWA STANDARD

PIPE WEIGHT FORMULA FOR STEEL PIPE (lbs per foot)
10.68 (D-t) t, where D=Outside Diameter and t=Wall Thickness
����� These materials are generally available in Schedules 40 and 80 only.� Wall Thickness of Schedule 5S & 10S does not permit threading inaccordance with the American Standard for Pipe Threads (ASA No. B2.1)
����� Wall thickness identical with thickness of “Standard Weight” pipe.
^ Wall Thickness identical with thickness of “Extra-Heavy” pipe.
* These do not conform to American Standard B36. 10.
24.00023.5630.21823.5000.250
Sched.
0.840 1.0500.710 0.9200.065 0.0650.674 0.8840.083 0.0830.622 0.8240.109����� 0.113�����
0.546 0.742^.147 ^.154
1/2 3/4
STAINLESS STEEL, HASTELLOY “C” & TITANIUM����� PIPE
Size
O.D.I.D.WallI.D.Wall
5S�10S�40S
80S
I.D.WallI.D.Wall
1.315 1.6601.185 1.5300.065 0.0651.097 1.4420.109 0.1091.049 1.3800.133����� 0.140�����
0.957 1.278^.179 ^.191
1 1 1/4
1.900 2.3751.770 2.2450.065 0.0651.682 2.1570.109 0.1091.610 2.0670.145����� 0.154�����
1.500 1.939^.200 ^.218
1 1/2 2
2.875 3.5002.709 3.3340.083 0.0832.635 3.2600.120 0.1202.469 3.0680.203����� 0.216�����
2.323 2.900^.276 ^.300
2 1/2 3
4.000 4.5003.834 4.3340.083 0.0833.760 4.2600.120 0.1203.548 4.0260.226����� 0.237�����
3.364 3.826^.318 ^.337
3 1/2 4
5.563 6.6255.345 6.4070.109 0.1095.295 6.3570.134 0.1345.047 6.0650.258����� 0.280�����
4.813 5.761^.375 ^.432
5 6
8.625 10.7508.407 10.4820.109 0.1348.329 10.4200.148 0.1657.981 10.0200.322����� 0.365�����
7.625 9.750^.500 ^.500
8 10
12.750 14.00012.438 13.6880.156 0.15612.390 13.6240.180 0.18812.000* .37511.750* .500
12 14
16.000 18.00015.670 17.6700.165 0.16515.624 17.6240.188 0.188
16 18
20.000 22.00019.634 21.6240.188 0.18819.564 21.5640.218 0.218
20 22 24
7.001 8.750 10.500 11.500 13.124 14.876 16.500 18.250 19.876
3.624 4.563 5.501 7.189 9.064 10.750 11.814 13.564 15.250 17.000 18.750 20.376
7.439 9.314 11.064 12.126 13.938 15.688 17.438 19.250 20.938
7.813 9.750 11.626 12.814 14.688 16.500 18.376 20.250 22.064
O.D.I.D.Wall
Pipe 1/2
CARBON STEEL and PVC����� PIPE
Size
I.D
I.D.Wall
1 1 1/2 2 1/2 4 6
Stand-ard
I.D.ExtraStrong(XS)
^.147 ^.154 ^.179 ^.191 ^.200 ^.218 ^.276 ^.300 ^.318 ^.337 ^.375 ^.432 ^.500 0.593 0.687 0.750 0.843 0.937 1.031 1.125 1.218
DoubleExtra
Strong(XXS)Sched.
10
Wall
Wall
I.D.Wall
Sched.20
I.D.Wall
Sched.30
I.D.Wall
Sched.40
I.D.Wall
Sched.60
I.D.Wall
Sched.80
I.D.Wall
Sched.100
I.D.Wall
Sched.120
I.D.Wall
Sched.140
I.D.Wall
Sched.160
3/4
0.840 1.050 1.315 1.660 1.900 2.375 2.875 3.500 4.000 4.500 5.563 6.625 8.625 10.750 12.750 14.000 16.000 18.000 20.000 22.000 24.000 26.000 28.000 30.000 32.000 34.000 36.000 42.000
0.109����� 0.113����� 0.133����� 0.140����� 0.145����� 0.154����� 0.203����� 0.216����� 0.226����� 0.237����� 0.258����� 0.280����� 0.322����� 0.365����� 0.406 0.438 ^.500 0.562 0.593 0.687
0.250 0.250 0.250 0.312 0.312 0.312 0.375����� 0.375����� 0.375����� ^.500 ^.500 ^.500 ^.500 ^.500 ^.500 ^.500
1 1/4 2 3 3 1/2 5 8 10 12 14 16 18 24 2826 30 32 34 36 4220 22
0.622 0.824 1.049 1.380 1.610 2.067 2.469 3.068 3.548 4.026 5.047 6.065 7.981 10.020 12.000 13.250 15.250 17.250 19.250 21.250 23.250 25.250 27.250 29.250 31.250 33.250 35.250 41.2500.109 0.113 0.133 0.140 0.145 0.154 0.203 0.216 0.226 0.237 0.258 0.280 0.322 0.365 0.375 0.375 0.375 0.375 0.375 0.375 0.375 0.375 0.375 0.375 0.375 0.375 0.375 * .3750.546 0.742 0.957 1.278 1.500 1.939 2.323 2.900 3.364 3.826 4.813 5.761 7.625 9.750 11.750 13.000 15.000 17.000 19.000 21.000 23.000 25.000 27.000 29.000 31.000 33.000 35.000 41.000
0.147 0.154 0.179 0.191 0.200 0.218 0.276 0.300 0.318 0.337 0.375 0.432 0.500 0.500 0.500 0.500 0.500 0.500 0.500 0.500 0.500 0.500 0.500 0.500 0.500 0.500 0.500 * .500
0.252 0.434 0.599 0.896 1.100 1.503 1.771 2.300 2.728 3.152 4.063 4.897 6.875 8.750 10.750
0.294 0.308 0.358 0.382 0.400 0.436 0.552 0.600 0.636 0.674 0.750 0.864 0.875 1.000 1.000
13.500 15.500 17.500 19.500 21.500 23.500 25.376 27.376 29.376 31.376 33.376 35.376 0.250 0.250 0.250 0.250 0.250 0.250 0.312 0.312 0.312 0.312 0.312 0.312
8.125 10.250 12.250 13.376 15.376 17.376 19.250 21.250 23.250 25.000 27.000 29.000 31.000 33.000 35.000 41.000
8.071 10.136 12.090 13.250 15.250 17.124 19.000 21.000 22.876 26.750 28.750 30.750 32.750 34.750 40.7500.277 0.307 0.330 0.375����� 0.375����� 0.438 ^.500 ^.500 0.562 0.625 0.625 0.625 0.625 0.625 * .625
0.622 0.824 1.049 1.380 1.610 2.067 2.469 3.068 3.548 4.026 5.047 6.065 7.981 10.020 11.938 13.124 15.000 16.876 18.184 22.626
0.406 ^.500 0.562 0.593 0.656 0.750 0.812 0.875 0.9680.546 0.742 0.957 1.278 1.500 1.939 2.323 2.900 3.364 3.826 4.813 5.761 7.625 9.564 11.376 12.500 14.314 16.126 17.938 19.750 21.564
0.593 0.718 0.843 0.937 1.031 1.156 1.281 1.375 1.531
0.438 0.500 0.562 0.718 0.843 1.000 1.093 1.218 1.375 1.500 1.625 1.812
0.812 1.000 1.125 1.250 1.438 1.562 1.750 1.875 2.0620.466 0.614 0.815 1.160 1.338 1.689 2.125 2.624 3.438 4.313 5.189 6.813 8.500 10.126 11.188 12.814 14.438 16.064 17.750 19.3140.187 0.218 0.250 0.250 0.281 0.343 0.375 0.438 0.531 0.625 0.718 0.906 1.125 1.312 1.406 1.593 1.781 1.968 2.125 2.343
Size 10 20 24 24
O.D. 10.750 20.000 24.000 24.000
I.D. 10.192 19.375 23.375 22.126
Wall 0.279 0.312 0.312 0.937
The above sizes are produced by pipe mills butdimensions do not conform to any regular stan-dard or schedule.
NON-STANDARD CARBON
Siemens Flow Instruments155 Plant Avenue, Hauppauge, New York 11788-3801
Tel. +1 (631) 231-3600 Fax. +1 (631) 231-3334Web: www.siemens.com


We have reviewed the contents of this publication to ensure consistency with the hardware and software described. Since variance cannot be precluded entirely, we cannot guarantee full consistency. However, the information in this publication is reviewed regularly and any necessary correctrions are included in subsequent editions. Responsibility for suitability and intended use of this instrument rests solely with the user.
Get more information
www.siemens.com/flow
www.siemens.com/processautomation
Subject to change without prior noticeOrder No.: CQO:1010DVNFM-3 Rev CPrinted in the USA© Siemens AG 2008
Siemens Energy & Automation, Inc.PI BU - CoC Ultrasonic Flow155 Plant AvenueHauppauge, NY 11788USA