FTIR Monitoring of: NOx SO - National Energy … to Monitor SO3/H2SO4 in Ducts An FTIR system was...
50
FTIR Monitoring of: NO x , SO x , SO 3 , & H 2 SO 4 Environmental Controls Conference Pittsburgh, PA May 16-18, 2006
Transcript of FTIR Monitoring of: NOx SO - National Energy … to Monitor SO3/H2SO4 in Ducts An FTIR system was...

FTIR Monitoring of: NOx, SOx, SO3, & H2SO4
Environmental Controls Conference Pittsburgh, PA
May 16-18, 2006

Attempts to Monitor SO3/H2SO4 in Ducts
An FTIR system was used to monitor NO, NOAn FTIR system was used to monitor NO, NO22, , SOSO22, SO, SO33, H, H22SOSO44, H, H22O, CO, COO, CO, CO22, and , and HClHCl in SCR in SCR outputsoutputsThe FTIR either extracted a sample from the duct The FTIR either extracted a sample from the duct at high temperature (>200C) or performed at high temperature (>200C) or performed measurements inmeasurements in--situsituBoth approaches proved successful but the Both approaches proved successful but the extractive measurements had many problems extractive measurements had many problems getting the sample to the analyzergetting the sample to the analyzer

Attempts to Monitor SO3/H2SO4 in Ducts
Initial attempts used an extractive approach with Initial attempts used an extractive approach with high temperature (200C) lines and cellhigh temperature (200C) lines and cellLab tests showed both Lab tests showed both SO3 and H2SO4 could be monitored using Teflon lines at this temperatureLine effects were severe and limited length of line Line effects were severe and limited length of line that could be usedthat could be usedWith sufficient lineWith sufficient line passivationpassivation this approach was this approach was ultimately successfulultimately successful

Extractive MonitoringExtractive MonitoringLab TestsLab Tests

Imacc FTIR Base Unit with 10 meter cell Accessory

Imacc FTIR Base Unit with 10 meter cell Accessory

Imacc 10 meter cell Accessory

FTIR
Exhaust
Input from stack or ambient air
Detector
Pump
Typical Extractive FTIR System
Control andReductionComputer
Heated or ambientextraction line
Multi-passWhite Cell60cm-200mpath

Spectra of H2SO4 and SO3

H2SO4 Lab Test Setup
X
X
ConstantTemperature H2SO4 Bath
Pump
FTIR CellAmbient Air
Input
Heat Trace Line
Rotometer
Exhaust
Heated Teflon Line

Flow & Temperature Effects: H2SO4 Bath, 80 ft. Line
0
5
10
15
20
25
30
8:00 9:00 10:00 11:00 12:00 13:00
Time
H2S
O4
(ppm
)
15 scfh
30 scfh
15 scfh
7.5 scfh
96% H2SO4 76% H2SO4
T = 90 C
120 C,
25 scfhT = 90 C
Zero Flow

Flow & Temperature Effects: SO3 Bath, 80 ft. Line
0
0.5
1
1.5
2
2.5
3
3.5
4
4.5
8:00 9:00 10:00 11:00 12:00 13:00
Time
SO3
(ppm
)
96% H2SO4 76% H2SO4
T = 90 C
25 scfh
120 C, Predicted < 1 ppm
15 scfh
30 scfh
15 scfh
7.5 scfh

Comparison of H2SO4 Reference & Data SpectraFri Sep 27 10:44:43 2002
0.10
0.15
0.20
0.25
0.30
0.35
0.40
Abs
817ppm H2SO4 22.1m/650/185C
0.1
0.2
0.3
0.4
0.5
0.6
0.7
0.8
Abs
1080110011201140116011801200122012401260Wavenumbers (cm-1)

Comparison of H2SO4 Reference & Data SpectraFri Sep 27 10:44:43 2002
0.05
0.10
0.15
0.20
0.25
0.30
Abs
817ppm H2SO4 22.1m/650/185C
0.1
0.2
0.3
0.4
0.5
0.6
0.7
Abs
800820840860880900920 940 Wavenumbers (cm-1)

Comparison of SO2 & SO3 Reference & Data Spectra
Fri Sep 27 10:44:43 2002
0.046
0.048
0.050
0.052
Abs
SO3 7897.3 ppm 0.2m/760T/25C
-0.00
0.01
0.02
0.03
Abs
SO2 800 ppm 5.2m/650t/185C Synthetic
-0.00
0.01
0.02
0.03
Abs
242024402460248025002520Wavenumbers (cm-1)

Extractive MonitoringExtractive Monitoringin SCR Outputsin SCR Outputs

H2SO4 & SO3 Line Equilibration With Overnight Run
0
2
4
6
8
10
12
14
16
22:00 23:00 0:00 1:00 2:00 3:00 4:00 5:00Time
H2S
O4
- S
O3
(ppm
)
H2SO4
SO3

Observed Concentrations in SCR Output
Compound Concentration (ppm)
Water 60,000 Carbon Dioxide 114,000 Carbon Monoxide 2.1 to 2.4 Nitric Oxide 330 to 350 Nitrogen Dioxide 1.7 to 1.9 Sulfur Dioxide 2330 to 2370 Sulfuric Acid 36.3 to 37.5 Hydrochloric Acid 31.1 to 32.2

0
10000
20000
30000
40000
50000
60000
70000
80000
18:00 18:15 18:30 18:45 19:00 19:15 19:30 19:45 20:00 20:15 20:30Time
H2O
(ppm
)
3 Sigma Error
Observed H2O Concentrations in SCR Output

Observed CO2 Concentrations in SCR Output
0
20000
40000
60000
80000
100000
120000
140000
18:00 18:15 18:30 18:45 19:00 19:15 19:30 19:45 20:00 20:15 20:30
Time
CO
2 (p
pm)
3 Sigma Error

0
1
2
3
4
5
6
7
18:00 18:15 18:30 18:45 19:00 19:15 19:30 19:45 20:00 20:15 20:30
Time
CO (p
pm)
3 Sigma Error
Observed CO Concentrations in SCR Output

0
50
100
150
200
250
300
350
400
450
500
18:00 18:15 18:30 18:45 19:00 19:15 19:30 19:45 20:00 20:15 20:30
Time
NO
(ppm
)
3 Sigma Error
Observed NO Concentrations in SCR Output

0
0.5
1
1.5
2
2.5
3
3.5
4
4.5
18:00 18:15 18:30 18:45 19:00 19:15 19:30 19:45 20:00 20:15 20:30
Time
NO
2 (p
pm)
3 Sigma Error
Observed Concentrations in SCR Output

0
500
1000
1500
2000
2500
3000
18:00 18:15 18:30 18:45 19:00 19:15 19:30 19:45 20:00 20:15 20:30
Time
SO
2 (p
pm)
3 Sigma Error
Observed SO2 Concentrations in SCR Output

0
5
10
15
20
25
30
35
40
18:00 18:15 18:30 18:45 19:00 19:15 19:30 19:45 20:00 20:15 20:30
Time
HCl (
ppm
)
3 Sigma Error
Observed HCl Concentrations in SCR Output

0
10
20
30
40
50
60
70
18:00 18:15 18:30 18:45 19:00 19:15 19:30 19:45 20:00 20:15 20:30
Time
H2SO
4 (p
p
3 Sigma Error
Observed H2SO4 Concentrations in SCR Output

EPRI ProgramEPRI ProgramInIn--situ situ MonitoringMonitoring

EPRI In-situ Measurement Program
InIn--situ situ measurements are preferred for SOmeasurements are preferred for SO33/H/H22SOSO44because no contact with the sample is requiredbecause no contact with the sample is requiredHowever, particulate loading in ducts is very high However, particulate loading in ducts is very high limiting optical paths possible to a few incheslimiting optical paths possible to a few inchesEPRI contracted with Univ. of California at EPRI contracted with Univ. of California at Riverside to develop an inRiverside to develop an in--situ situ probe which would probe which would discriminate against particulatesdiscriminate against particulatesTests to date indicate the probe can reduce Tests to date indicate the probe can reduce particulate loading by 80% or moreparticulate loading by 80% or moreThis allowed for measurements over 30 to 60 ft. in This allowed for measurements over 30 to 60 ft. in ducts ducts -- path lengths that are normally impossiblepath lengths that are normally impossible

EPRI In-situ Measurement Configuration
ConfigurationConfigurationImacc CrossImacc Cross--stack unit coupled to instack unit coupled to in--situ situ probeprobeFTIR spectra analyzed for:FTIR spectra analyzed for:SOSO33, H, H22SOSO44, SO, SO22,, HClHCl, NH, NH33, CO, CO, CO, CO22, , NO, NONO, NO22, and H, and H22OOSystem initially set up for System initially set up for monostatic monostatic transmission measurements doubling the transmission measurements doubling the available pathavailable path

Imacc Monostatic Cross-Stack Unit
Laser Control
FTIR Modulator
Collimating TelescopeMirror
On-Board Computer
To Duct &Corner Cube
Array
PowerSupply
Imacc FTIR Base Unit
BeamSplitter
Mercury Cadmium Telluride Detector
Off-Axis ParabolicDetector Mirror
Spherical focusing mirrorImacc Custom Accessory

2.5” Corner Cube Mirror < 5 arc second accuracy

FTIR, Periscope, and Probe

Periscope, and Probe

Cross-stack Probe Installation

Curvature of Probe

Source Used for Bistatic Configuration

Spectra of Transmitted Infrared Source (Blue) Compared to The Background Radiance from The Probe Wall (Red)
Transmission Data
Probe RadianceStrong at Long WavelengthOr Small Wavenumber

EPRI Program - Measured FTIR Data and References

EPRI Program - Measured FTIR Data and References

EPRI Program - Measured FTIR Data and References
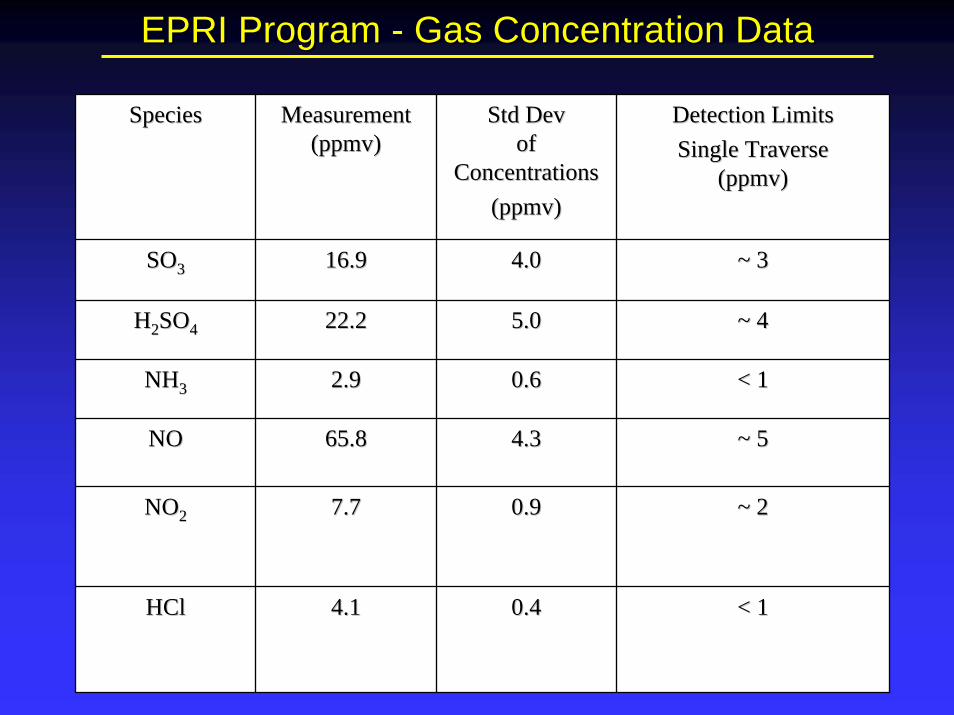
EPRI Program EPRI Program -- Gas Concentration DataGas Concentration Data
SpeciesSpecies MeasurementMeasurement((ppmvppmv))
Std DevStd Devof of
ConcentrationsConcentrations((ppmvppmv))
Detection LimitsDetection LimitsSingle TraverseSingle Traverse
((ppmvppmv))
SOSO33 16.916.9 4.04.0 ~ 3~ 3
HH22SOSO44 22.222.2 5.05.0 ~ 4~ 4
NHNH33 2.92.9 0.60.6 < 1< 1
NONO22 7.77.7 0.90.9 ~ 2~ 2
NONO 65.865.8 4.34.3 ~ 5~ 5
HClHCl 4.14.1 0.40.4 < 1< 1
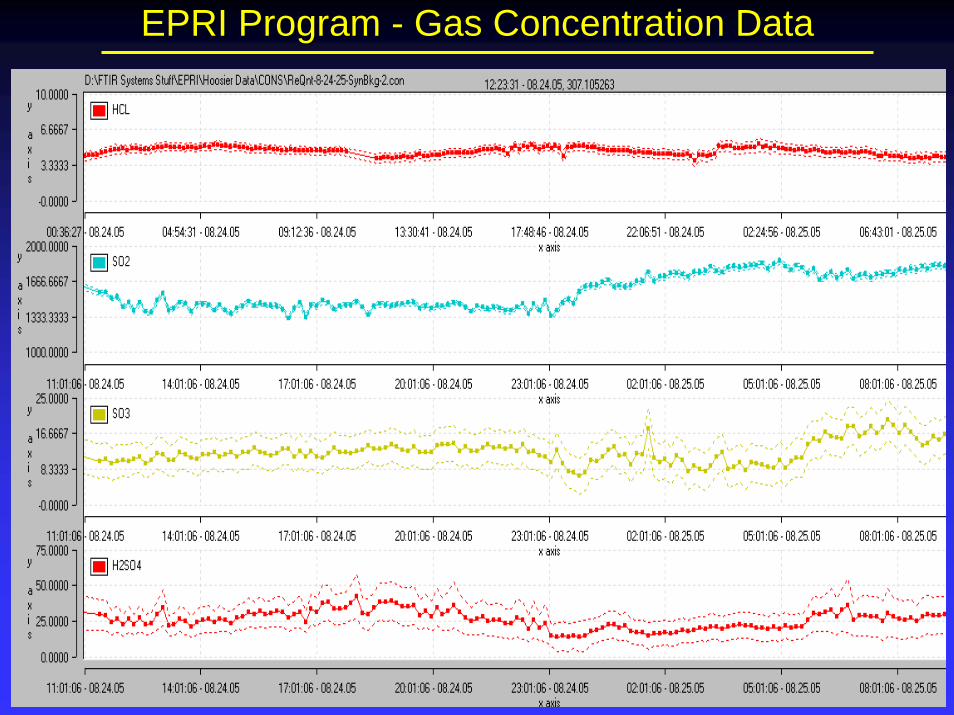
EPRI Program EPRI Program -- Gas Concentration DataGas Concentration Data

EPRI Program - Gas Concentration Data

Controlled CondensateControlled CondensateDataData

EPRI Program - Intercomparison Data
Controlled Condensate H2SO4 SO3 Total10/25/05
Concentration 33.61 25.98 11.35 37.33St. Dev. 3.15 5.7 2.3 6.2
10/26/05Concentration 32.00 24.30 13.36 37.66St. Dev. 3.4 5.4 3.5 6.4
FTIR

EPRI Phase IIEPRI Phase IIProgramProgram

EPRI Program EPRI Program –– Phase IIPhase II
Next phase to be conducted at Next phase to be conducted at AmerenAmeren’’ss Sioux Sioux StationStation near St. Louisnear St. LouisProbe now supported in slip fittings allowing for Probe now supported in slip fittings allowing for free expansion but no horizontal movementfree expansion but no horizontal movementDuct width 32 ft. should provide an optical path of Duct width 32 ft. should provide an optical path of 64 ft (19.5 m).64 ft (19.5 m).Primary objective: long term unmanned operation Primary objective: long term unmanned operation
for assessment of maintenance issuesfor assessment of maintenance issuesTest to be 1 month long with option for a second Test to be 1 month long with option for a second monthmonth

EPRI Program EPRI Program –– Phase IIPhase II