
Fresnellens solarconcentrator derivati · PDF fileFresnellens solarconcentrator...
15
Fresnel lens solar concentrator derivations and simulations Arthur Davis Reflexite Energy Solutions, 500 Lee Rd., Rochester, NY, USA 14606 ABSTRACT Fresnel lens solar concentrators continue to fulfill a market requirement as a system component in high volume cost effective Concentrating Photovoltaic (CPV) electricity generation. Design and optimization may be performed using comprehensive system simulation tools, but before investing in the effort to build a complete virtual model framework, much insight can be gathered beforehand by generating a parameterized simulation cache and referencing those results. To investigate the performance space of the Fresnel lens, a fast simulation method which is a hybrid between raytracing and analytical computation is employed to generate a cache of simulation data. This data is post- processed to yield results that are not readily achieved via derivation. Example plots that can be used for look-up purposes will be included. Lens parameters that will be interrogated include focal length, index of refraction, prism fidelity, aperture, transmission and concentration ratio. In order to compactly represent a large variety of lens configurations, some variables that define the Fresnel lens will be parameterized. Analysis will be limited to Fresnel lens prisms oriented toward the photovoltaic (PV) cell and the plano surface directed toward the sun. The reverse of this configuration is rarely encountered in solar concentration applications and is omitted. Keywords: fresnel lens, polymer optics, micro-optics, parameterized lens design, illumination, transmission efficiency, lens transmittance, prism fidelity 1. INTRODUCTION A wealth of background information on Fresnel lenses is available in the literature. See for instance Aniˇ cin et al 1 for a historical overview and Leutz and Suzuki 2 for a text specific to Fresnel lenses for solar concentration. This investigation will be primarily concerned with flat Fresnel lenses in a form factor suitable for PV solar concentrators. The sample data presented is limited to Acrylic (PMMA) based lenses. With the proper material character- istic information, a similar analysis can be carried out for Silicone-on-Glass (SOG) based technology and this is likely a high value study to be completed in the future. Typically, solar concentrator environmental durability requirements mandate that the prismatic surface of the Fresnel lens be oriented away from the sun and toward the internal PV cell (herein referred to as Grooves- Facing-Short-Conjugate or GFSC configuration – see Fig. 1). In order to apply the results of this investigation to a wide range of possible lens geometries, plot data is reported in terms of the ratio of the lens focal length to the aperture size. This ratio is commonly referred to as the f-number or focal ratio (also written as f/#) and is defined as f/#= f/CA where f is the effective- focal-length of the lens, and CA is the lens optical clear aperture diameter. In the solar concentrator GFSC arrangement the effective-focal-length and back-focal-length are essentially equivalent. The definition of the clear aperture (CA) is unambiguous for a circular lens (as shown in Fig. 1: “Circular Fresnel Lens Aperture”), but for a square lens, clear aperture may be defined by the diameter that circumscribes the square, inscribes the square or somewhere in between. This investigation will adopt the convention of defining the lens clear aperture used to compute the f/# of a square lens as the circumscribed diameter (that is the clear Author E-mail: Art.Davis@Reflexite.com, Website: www.reflexite-es.com Novel Optical Systems Design and Optimization XIV, edited by R. John Koshel, G. Groot Gregory, Proc. of SPIE Vol. 8129, 81290J · c 2011 SPIE CCC code: 0277-786X/11/$18 · DOI: 10.1117/12.892818 Proc. of SPIE Vol. 8129 81290J-1
Transcript of Fresnellens solarconcentrator derivati · PDF fileFresnellens solarconcentrator...

Fresnel lens solar concentrator derivations and simulations
Arthur Davis
Reflexite Energy Solutions, 500 Lee Rd., Rochester, NY, USA 14606
ABSTRACT
Fresnel lens solar concentrators continue to fulfill a market requirement as a system component in high volume costeffective Concentrating Photovoltaic (CPV) electricity generation. Design and optimization may be performedusing comprehensive system simulation tools, but before investing in the effort to build a complete virtualmodel framework, much insight can be gathered beforehand by generating a parameterized simulation cache andreferencing those results.
To investigate the performance space of the Fresnel lens, a fast simulation method which is a hybrid betweenraytracing and analytical computation is employed to generate a cache of simulation data. This data is post-processed to yield results that are not readily achieved via derivation. Example plots that can be used for look-uppurposes will be included.
Lens parameters that will be interrogated include focal length, index of refraction, prism fidelity, aperture,transmission and concentration ratio. In order to compactly represent a large variety of lens configurations, somevariables that define the Fresnel lens will be parameterized.
Analysis will be limited to Fresnel lens prisms oriented toward the photovoltaic (PV) cell and the planosurface directed toward the sun. The reverse of this configuration is rarely encountered in solar concentrationapplications and is omitted.
Keywords: fresnel lens, polymer optics, micro-optics, parameterized lens design, illumination, transmissionefficiency, lens transmittance, prism fidelity
1. INTRODUCTION
A wealth of background information on Fresnel lenses is available in the literature. See for instance Anicin etal1 for a historical overview and Leutz and Suzuki2 for a text specific to Fresnel lenses for solar concentration.This investigation will be primarily concerned with flat Fresnel lenses in a form factor suitable for PV solarconcentrators.
The sample data presented is limited to Acrylic (PMMA) based lenses. With the proper material character-istic information, a similar analysis can be carried out for Silicone-on-Glass (SOG) based technology and this islikely a high value study to be completed in the future.
Typically, solar concentrator environmental durability requirements mandate that the prismatic surface ofthe Fresnel lens be oriented away from the sun and toward the internal PV cell (herein referred to as Grooves-Facing-Short-Conjugate or GFSC configuration – see Fig. 1).
In order to apply the results of this investigation to a wide range of possible lens geometries, plot data isreported in terms of the ratio of the lens focal length to the aperture size. This ratio is commonly referred toas the f-number or focal ratio (also written as f/#) and is defined as f/# = f/CA where f is the effective-
focal-length of the lens, and CA is the lens optical clear aperture diameter. In the solar concentrator GFSCarrangement the effective-focal-length and back-focal-length are essentially equivalent.
The definition of the clear aperture (CA) is unambiguous for a circular lens (as shown in Fig. 1: “CircularFresnel Lens Aperture”), but for a square lens, clear aperture may be defined by the diameter that circumscribesthe square, inscribes the square or somewhere in between. This investigation will adopt the convention of definingthe lens clear aperture used to compute the f/# of a square lens as the circumscribed diameter (that is the clear
Author E-mail: [email protected], Website: www.reflexite-es.com
Novel Optical Systems Design and Optimization XIV, edited by R. John Koshel,G. Groot Gregory, Proc. of SPIE Vol. 8129, 81290J · c©2011 SPIE
CCC code: 0277-786X/11/$18 · DOI: 10.1117/12.892818
Proc. of SPIE Vol. 8129 81290J-1

f
CA
f
CA
Circular Fresnel
Lens Aperture
Square Fresnel
Lens Aperture
Fig. 1. Typical Grooves-Facing-Short-Conjugate Fresnel lens solar concentrator embodiment illustrating bothcircular and square aperture shapes.
aperture diameter is defined as the diagonal distance between two lens corners – see Fig. 1: “Square FresnelLens Aperture”). The caveat of this being that when comparing results between circular and square lenses, acircular lens with the same f/# as a square lens defined per the circumscribed f/# has a factor of π/2 moreactive area.
The prism pitch refers to the projected width of individual concentric prism rings. Varied schemes can beenlisted to define the pitch values over the Fresnel lens face (for instance constant pitch vs. constant depth).For the most part though, the idealized lens throughput is independent of the pitch scheme and can be adjustedto maximize manufacturing quality of the lens. Consequently, the analysis will not be dependent on the Fresnellens prism pitch. Further, prism pitch can be used to parameterize out pitch dependent loss factors such as draftand prism tip peak rounding. With reference to Fig. 2, the rounding ratio (R) is defined as the quotient of thepeak radius (r) and the prism pitch (d):
R =r
d(1)
similarly, the draft fraction (D) is the projected draf t (b) over the prism pitch (d):
D =b
d(2)
2. METHODOLOGY
When considering an analytical approach to performance analysis of the optical properties of a Fresnel lens solarconcentrator it is most straightforward to take advantage of the circular symmetry found in the multitude ofconcentric rings that constitute the refractive power of the lens. As more detailed optical characteristics areconsidered, (such as prism peak tip radius defects), a direct analytical model becomes more burdensome anda hybrid raytracing approach may be implemented as in Davis.3 However this approach still exploits circularsymmetry and is only correct for circular aperture Fresnel lenses. In order to properly simulate square basedFresnel lenses (which are much more commonly applied in solar concentrators) a new approach is developed. Inaddition, accuracy is improved by including wavelength dependence, the AM1.5 spectral irradiance distribution,material absorbance and a variable prism tip radii model generated from manufacturing experiments as discussedin Davis et al.4
For any point on the surface of the Fresnel lens, the following parameters may be computed:
Tsurf The transmittance accounting for surface reflections at the plano input and prism slope surfaces.
Proc. of SPIE Vol. 8129 81290J-2

Fig. 2. Geometric model for Fresnel lens prism peak rounding.
Tgeom The transmittance accounting for the prism draft surface loss and the loss due to the prism peak tiprounding.
Tmatl The transmittance accounting for the material absorbance as light is transmitted through the lens media.Note that it is assumed there is no aperture dependence (any additional loss due to propagation throughprism facets is negligible).
Then, the spectrally weighted transmission efficiency or transmittance of a Fresnel lens can be reasonably definedas:
Teff =
∫
λ
Tmatl
∫
A
Tsurf · Tgeom · dAdλ∫
λ
∫
A
dAdλ(3)
where A represents lens surface area and λ is wavelength.
It is a feasible task to solve Eq. 3 for a Fresnel lens with circular grooves centered within a circular apertureby integrating the differential area (dA) in polar coordinates. Since there are terms in the integrand that are notreadily expressed analytically, in application, the integrals become summations and the sample size is selectedsufficiently small so that the summations approximate the integrals. Throughout this report, equations will bepresented in integral form, but they are practically implemented as summations on finite increments.
For the circular case, the terms in the area integrand are polar symmetric, so integrating over a circularaperture in polar coordinates is natural. For a square aperture however, the differential area needs to besummed over rectangular coordinates. This requires application of a proper change of variables for the analyticand discrete terms in the integrand. The complexity of this approach is eschewed in favor of the following:
A set of variables which define a specific Fresnel lens geometry is selected (aperture shape, aperture size,focal length, material optical properties and material thickness). An array of spatial coordinates (x, y) aregenerated to be uniformly distributed over the aperture at some selected sample resolution (see Fig. 3). Eachspatial coordinate approximates a square differential area bin on the lens. Within any bin, all of the componenttransmittance terms in Eq. 3 can be calculated. At a sufficiently small sample bin size, summation of theseterms yields a good approximation to the lens transmittance. The lens aperture size is then incremented, thelens area is resampled and the computation is repeated. In this way, a cache of data is generated over a largecombination of aperture sizes with a fixed focal length. The data is easily parameterized to f/# by ratioing theaperture size to the focal length.
Computation can be done quickly in data language software (for instance NumPy5 as used in this study) andit is still much leaner than a conventional raytrace allowing for exploration over a large geometrical space andrelatively fine grain increments over the solar spectral wavelength regime.
Proc. of SPIE Vol. 8129 81290J-3

(x,y) Bin
Coordinate
Fig. 3. Coordinate bin sampling schematic for circular aperture Fresnel lens.
This analysis assumes a Fresnel lens design type which forms a point focus at a select design wavelength.However the Fresnel lens primary of a concentrator system may be a nonimaging type of optic designed withoutregard for point focus characteristics. The results produced herein should be considered of utility for Fresnellens primaries where the optical path deviates only modestly from a point focus imaging type Fresnel lens. It ispostulated that this will be valid for a wide variety of designs and has utility even for nonimaging Fresnel lenses.
In addition, a method for approximating the maximum beam size at the focal plane is implemented. This isuseful for computing the concentration ratio.
2.1 Material Index of Refraction
For an accurate simulation, real index of refraction data vs. wavelength is desirable. This was acquired exper-imentally by molding a plano-plano witness sample of the same acrylic polymer material used in Fresnel lenssolar concentrator fabrication. The index of refraction was characterized using a Metricon prism coupler. Datais plotted in Fig. 4.
2.2 Coordinate Radialization
In order to properly compute ray vector transmission through 3D geometric entities, 2D simplified refractioncalculations in a single plane will not suffice. However, due to the natural circular symmetry of the Fresnel lens,the normal vectors can be reduced to 2D by changing the coordinate reference plane to a radial section. Thisis useful for simplifying calculations that have inherent polar symmetry (e.g. draft and radius loss). At any
coordinate location on the lens surface (x, y), the prism normal can be expressed as ~N = (Nx, Ny, Nz). In polar
coordinates, (x, y) can be expressed as a radial distance: ρ =√
x2 + y2. Then for any ρ coordinate, the normal
vector is ~Nr = (Nr, Nz) where Nr =√
N2x +N2
y will be called the radial normal.
The radial normal defines the radial slope (Nr):
Nr =Nr
Nz(4)
At any Fresnel lens coordinate (x, y) the Cartesian coordinate normal vector ~N can be expressed as:
(Nx, Ny, Nz) =
(
Nrx√
(1 +N 2r )(x
2 + y2),
Nry√
(1 +N 2r )(x
2 + y2),
1√
(1 +N 2r )
)
(5)
Radial ray vectors can be expressed as ~Ur = (ur, uz) before entering the lens, ~U ′r = (u′
r, u′z) inside the lens
and ~U ′′r = (u′′
r , u′′z) after exiting the prisms.
Proc. of SPIE Vol. 8129 81290J-4

Index o
f R
efr
acti
on
Molded Acrylic Spectral Index of Refraction Measurement
Wavelength (nm)
1.470
1.475
1.480
1.485
1.490
1.495
1.500
1.505
1.510
1.515
1.520
1.525
1.530
200 400 600 800 1000 1200 1400 1600 1800 2000 2200 2400 2600
Fig. 4. Measured Acrylic index of refraction. The triangle data points represent prism coupler sample wave-lengths.
2.3 Transmittance adjusted for surface reflection (Tsurf)
The following equation from Davis:3
NGFSC =u′′y
√
1− u′′2y − n
(6)
can be rewritten as:
Nr =1
f/ρ− n
√
1 + (f/ρ)2
(7)
where at the design wavelength, the material index of refraction is n and the lens back-focal-length is f . Thenthe radial slope NGFSC = Nr/Nz is found for the ρ value at each coordinate bin (it is also useful to recognizethe radial slope angle from the plane of the optic is: θr = tan−1 Nr
Once the normal vector is known for any coordinate location, the Fresnel surface reflection and transmissionformulae can be applied to account for the surface transmittance through the plano and prismatic interfaces ofthe Fresnel lens. These formulae are detailed in various optics texts; for example Born and Wolf6 and Hecht andZajac7 are often cited. They can then be used for each coordinate bin to yield the Tsurf transmittance:
t⊥ =2 sin θt cos θisin(θi + θt)
t‖ =t⊥
cos(θi − θt)
Tsurf =
(
nt cos θt2ni cos θi
)
(
t2⊥ + t2‖
)
(8)
where ni is the index of refraction for the ray in the incident media, nt is the index of refraction in the transmittedmedia, and θi and θt are the incident and refracted angles respectively in the plane of incidence.
2.4 Transmittance adjusted for geometry loss (Tgeom)
The geometry loss arises from the draft surface and prism tip rounding of the Fresnel lens facets. In the GFSCconcentrator configuration, assuming predominately collimated light input, a model for the geometric loss is
Proc. of SPIE Vol. 8129 81290J-5

derived in Davis3 with a small error. The correct equation should be:
Tgeom = 1−s+ b
d(9)
where s is the radius loss distance and b is the projected draft (see Fig. 2). Applying the ratios from Eqs. 1 and2, this can be rewritten as:
Tgeom = 1−R tan
(
π/2 + θ − φ
2
)
cos θ −D (10)
with θ representing the radial slope angle with respect to the plane of the optic and φ being the radial draft
angle with respect to the normal of the optic (see Fig. 2).
At this point, another useful parameterization to define is the aspect ratio (A) as the quotient between theprism height (h) and the prism pitch (d):
A =h
d=
tan θ
1 + tan θ tanφ(11)
Then the draft fraction (D) of Eq. 2, can be expressed as:
D = A tanφ (12)
Assuming a radial draft angle value of approximately φ = 3◦ over the full aperture, the draft fraction can beapproximated as D ≈ A/20.
Next the rounding ratio (R) might be considered a fixed value over the lens aperture, however previouswork4 shows a functional dependence of the rounding ratio on the aspect ratio (see. Fig 5). The rounding ratio
can be expressed as R = R(A) where R(A) is some known function based on experimental results from themanufacturing process conditions being utilized. Now Eq. 10 can be expressed completely as a function of theradial slope angles and radial draft angles:
Tgeom = 1−R(A(θ, φ)) tan
(
π/2 + θ − φ
2
)
cos θ −A(θ, φ) tan φ (13)
So at any coordinate bin, the geometric transmittance Tgeom can be computed.
2.5 Transmittance adjusted for material absorbance (Tmatl)
The Tmatl term in Eq. 3 compensates for the material absorbance. The absorption of radiation through ahomogeneous media is governed by the Beer-Lambert Law:
Tint = e−αt0 (14)
where Tint is the internal transmission through a path length thickness of t0 in a media with an absorption
coeffient of α.
One method of measuring Tint is to subject a plano-plano witness sample of the optical media to a spec-trophotmetric scan. If the index of refraction (n) vs. wavelength profile of the sample is well known, then thetheoretical surface reflectance terms can be removed from the measured data leaving just Tint. Consider a plano-plano sample oriented normally with respect to a substantially collimated sample beam and a spectrophotometricscan which yields transmittance values of Tt, then:
Tint =Tt · (n+ 1)4
16n2(15)
Accurately knowing the sample thickness (t0), Eq. 14 can be used to solve for the absorption coefficient (α). Butsince it is the internal transmission at an objective thickness we seek, we can calculate this directly; assuming a
Proc. of SPIE Vol. 8129 81290J-6

Various Condition Rounding Ratios vs. Aspect Ratio
0.00%
0.50%
1.00%
1.50%
2.00%
2.50%
3.00%
3.50%
4.00%
0% 10% 20% 30% 40% 50% 60% 70% 80%
Injection Molded
(Condition-3)
High Precision Molded
(Condition-1)
Aspect Ratio (h/d)
Rou
nd
ing R
ati
o (r/d
)
Fig. 5. Functional Rounding Ratio model based on Aspect Ratio from manufacturing experiments.4
known internal transmission (Tint) for a measured sample thickness (t0), the internal material transmission (Tmatl)through an objective thickness (t) is:
Tmatl = (Tint)t/t0 (16)
For this study, a material objective thickness of t = 3mm was implemented. The internal transmission (Tint) fora plano-plano witness sample thickness of t0 = 2.7mm was spectrophotometrically characterized and is plottedin Fig. 6. Using Eq. 16 then Tmatl for any wavelength can be found. This transmission is uniformly applied toall spatial coordinates since it is not aperture dependent.
2.6 Solar Spectral Irradiance Weighting
With solar concentration under interest, it will be of great utility to include the solar spectral irradiance as aweighting factor when computing the Fresnel lens transmittance. Let I0(λ) equal the direct plus circumsolarspectral irradiance for Air Mass 1.58 (see Fig. 7). Then Eq. 3 can be modified for the Fresnel lens solar spectralweighted transmission efficiency (Tsolar):
Tsolar =
∫
λ
I0(λ)Tmatl
∫
A
Tsurf · Tgeom · dAdλ∫
λ
I0(λ)
∫
A
dAdλ
(17)
Additional scale factors may be applied in this simulation process based on application specific assemblyknowledge (for example, the PV cell spectral response). However this investigation does not do any additionalscaling beyond spectral irradiance weighting.
2.7 Spot Size
Up to this point, the methodology presented yields the Fresnel lens solar spectral weighted transmission efficiency
(Tsolar) for an arbitrary f/# lens of circular, square or even arbitrary aperture shape. The values computed shouldbe of reasonable accuracy assuming substantially collimated light input.
For computing the optical concentration ratio however, the beam area at focus is required and assuming aperfectly collimated source model will not give results indicative of performance. The direct solar disk has a
Proc. of SPIE Vol. 8129 81290J-7

Transmission Through 2.7mm of Acrylic sans Surface Reflections
0%
10%
20%
30%
40%
50%
60%
70%
80%
90%
100%
200 400 600 800 1000 1200 1400 1600 1800 2000 2200 2400 2600
Wavelength (nm)
Tra
nsm
issio
n
Fig. 6. Measured Acrylic transmission through 2.7mm of material thickness with theoretical surface reflectancecontributions removed.
ASTM G173-03 Reference Spectra for AM1.5 Direct + Circumsolar
Wavelength (nm)
Spectr
al Ir
radia
nce
0.00
0.25
0.50
0.75
1.00
1.25
1.50
200 400 600 800 1000 1200 1400 1600 1800 2000 2200 2400 2600
Fig. 7. Spectral Irradiance Reference for Air Mass 1.5 Direct plus Circumsolar.8
half-angular extent of 4.65mrad (±0.2664◦), and to allow for alignment tolerances an acceptance cone of ±2◦
may also be considered.2 This report will evaluate a uniform field for these two angular extents. Further workmay consider the full direct plus circumsolar sunshape distribution.
A good statistical representation of the spot size at the focal plane requires a large sampling of rays over theacceptance cone of the Fresnel lens. However, since we only have a single collimated ray per spatial coordinatebin on the lens, we seek a way to estimate the spot size. Using a radialized coordinate system as per Sec. 2.2,the angular deviation of a ray through the lens may be calculated via Snell’s Law:
Proc. of SPIE Vol. 8129 81290J-8
u′′r =
n(
ur
n −Nru′z
)
+Nr
√
1 +N 2r − n2
(
ur
n −Nru′z
)2
1 +N 2r
(18)
Where u′z =
√
1−u2r
n2 and for a source with half-angle extent of θs: ur = sin θs.
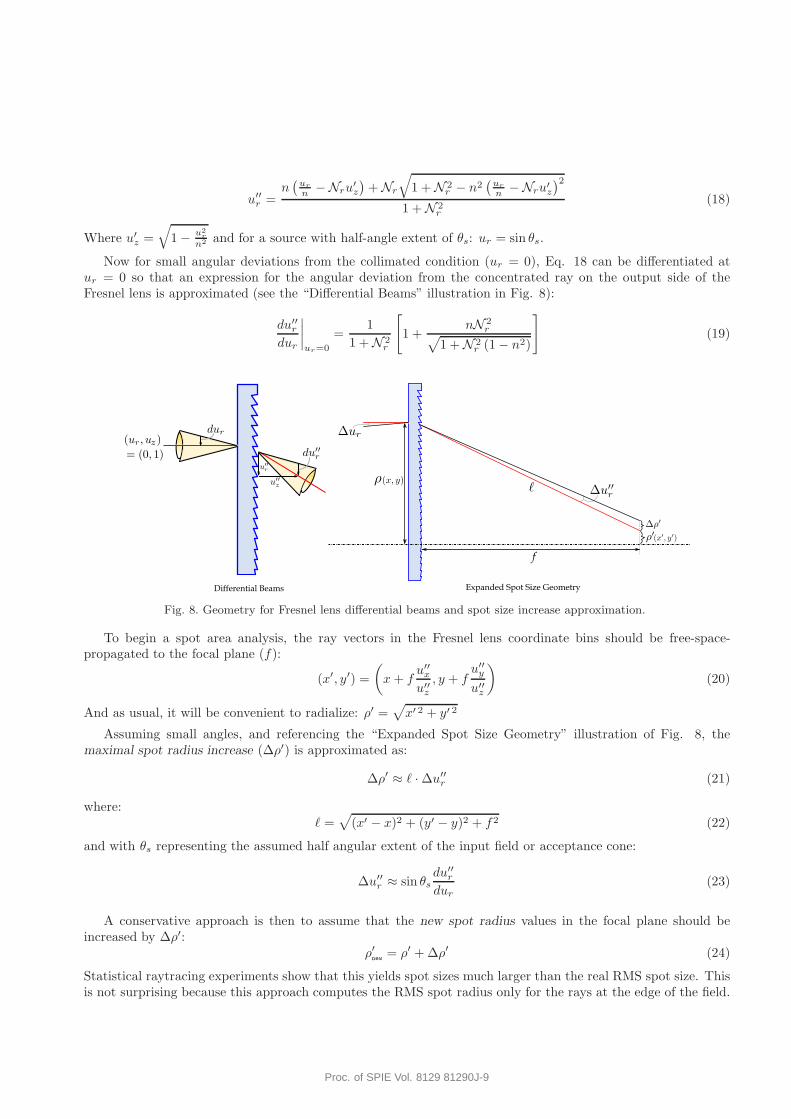
Now for small angular deviations from the collimated condition (ur = 0), Eq. 18 can be differentiated atur = 0 so that an expression for the angular deviation from the concentrated ray on the output side of theFresnel lens is approximated (see the “Differential Beams” illustration in Fig. 8):
du′′r
dur
∣
∣
∣
∣
ur=0
=1
1 +N 2r
[
1 +nN 2
r√
1 +N 2r (1− n2)
]
(19)
Differential Beams Expanded Spot Size Geometry
f
Fig. 8. Geometry for Fresnel lens differential beams and spot size increase approximation.
To begin a spot area analysis, the ray vectors in the Fresnel lens coordinate bins should be free-space-propagated to the focal plane (f):
(x′, y′) =
(
x+ fu′′x
u′′z
, y + fu′′y
u′′z
)
(20)
And as usual, it will be convenient to radialize: ρ′ =√
x′ 2 + y′ 2
Assuming small angles, and referencing the “Expanded Spot Size Geometry” illustration of Fig. 8, themaximal spot radius increase (∆ρ′) is approximated as:
∆ρ′ ≈ ℓ ·∆u′′r (21)
where:ℓ =
√
(x′ − x)2 + (y′ − y)2 + f2 (22)
and with θs representing the assumed half angular extent of the input field or acceptance cone:
∆u′′r ≈ sin θs
du′′r
dur(23)
A conservative approach is then to assume that the new spot radius values in the focal plane should beincreased by ∆ρ′:
ρ′new
= ρ′ +∆ρ′ (24)
Statistical raytracing experiments show that this yields spot sizes much larger than the real RMS spot size. Thisis not surprising because this approach computes the RMS spot radius only for the rays at the edge of the field.
Proc. of SPIE Vol. 8129 81290J-9

Nevertheless we will use the metric with the postulate that it establishes an upper bound on the spot diameterand consequently a lower bound on the concentration ratio.
Next, the transmission efficiency per coordinate value (Tcoord) is defined as:
Tcoord = Tmatl · Tsurf · Tgeom (25)
Each Tcoord associated with a new spot radius value (ρ′) is analogous to a flux vector given a unity flux inputdistribution. We can use these values to compute a wavelength dependent flux weighted RMS spot radius in thefocal plane ρ ′
rms(λ). Assuming M spatial coordinate bins over the lens aperture:
ρ ′rms(λ) =
√
√
√
√
M∑
i=1
(ρ′ 2new)M· (Tcoord)
M
/ M∑
i=1
(Tcoord)M
(26)
Then the solar spectral weighted RMS spot radius (ρρρsolar) is defined as:
ρρρsolar =
∫
λ
I0(λ) · ρ ′rms(λ) dλ
∫
λ
I0(λ)dλ
(27)
To make the results generally applicable to a wide range of lens geometries, it will be helpful to parameterizethe spot size on the clear aperture. In a similar manner as focal ratio or f/# is defined, we will define the spot
ratio or S/# as:
S/# =2ρρρsolar
CA(28)
The RMS spot diameter is immediately available then by multiplying the spot ratio (S/#) with the lens clear
aperture (CA).
2.8 Concentration Ratio
The spectral weighted optical concentration ratio C(λ) will be defined as:
C(λ) =η(λ)A
πρ ′rms(λ)
2 (29)
Where A is the Fresnel lens area and η(λ) is the spot efficiency for the flux contained within the RMS spotradius ρ ′
rms(λ). Knowing the flux distribution as a function of radial distance in the focal plane F (ρ′) from an
incident flux distribution of F0(A), the spot efficiency η(λ) employed in Eq. 29 is:
η(λ) =
∫ ρ ′rms
(λ)
0
F (ρ′)dρ′
∫
A
F0(A)dA
(30)
And the integrated solar concentration ratio Csolar is defined to be:
Csolar =
∫
λ
C(λ) · I0(λ) dλ∫
λ
I0(λ)dλ
(31)
Proc. of SPIE Vol. 8129 81290J-10

3. RESULTS
The program is run for both circular and square apertures for 3mm thick Acrylic. The aperture is sampled usingspatial coordinate bins of 0.5mm. A fixed focal length of 100mm is selected. Wavelength values are stepped at50nm increments over the 300nm to 2500nm solar spectrum. The design wavelength is chosen to be 500nm. Afixed radial draft angle of 3◦ is assumed.
Upon completion, the program writes out a large cache of data which may be post-processed for analyticalpurposes. In the following sections, selected data sets are culled from the cache and examined in detail.
3.1 Component Transmittances
At the design wavelength, the component transmittances Tsurf (Sec. 2.3), Tgeom (Sec. 2.4) and Tmatl (Sec. 2.5) areplotted in Fig. 9. In addition data acquired from raytracing the same geometry definition using commercialnonsequential raytracing software yields excellent agreement with the Tsurf ·Tgeom product. Inclusion of the materialabsorption is plotted as the product Tsurf·Tgeom·Tmatl which is equivalent to the transmission efficiency per coordinate
(Tcoord).
Raytraced
Transmission Efficiency Components
with Raytrace Comparison
Tra
nsm
issio
n
75%
80%
85%
90%
95%
100%
0.40.60.811.21.41.61.822.22.42.62.83
Fig. 9. Plotted Transmittance components at the design wavelength for a square Fresnel lens concentrator. Alsodata is included for a nonsequential raytrace indicating very good agreement with the model.
Fig. 9 is used for illustrative purposes and to show that the methodology produces results in good agreementwith conventional raytracing. However, since the results are only for a single wavelength we will defer analysisto the spectral weighted transmittance data presented in the next section.
3.2 Spectral Weighted Transmittance
As per Sec. 2.6, Tsolar is computed by integrating over the solar spectrum shown in Fig. 7. This is performedfor circular and square aperture lenses at different rounding conditions and plotted in Fig. 10.
Comparison of the various peak rounding conditions plotted in Fig. 10 indicates that a high quality manu-facturing process (“Condition-1, High Precision Molding”) yields results practically equivalent to the idealized“No Rounding” condition. However, depending on the f/#, about 1-2% loss is incurred using the “Condition-3,typical inection molding” process. Data presented from this point forward need only include “No Rounding”and “Condition-3” rounding since “Condition-1” deviation from ideal is negligible.
From Fig. 10, it appears that for a circular aperture lens it will be beneficial to keep the f/# greater thanf/0.7 and for a square aperture lens, greater than f/0.6. At these values the solar transmittance is approximately
Proc. of SPIE Vol. 8129 81290J-11

Spectr
al
Weig
hte
d T
ran
sm
issio
n E
ffic
ien
cy
60%
62%
64%
66%
68%
70%
72%
74%
76%
78%
80%
82%
0.40.60.811.21.41.61.82
No Rounding
Condition-1
Rounding
Condition-3
Rounding
Transmittance for
CIRCULAR LENS APERTURE
Spectr
al
Weig
hte
d T
ran
sm
issio
n E
ffic
ien
cy
60%
62%
64%
66%
68%
70%
72%
74%
76%
78%
80%
82%
0.40.60.811.21.41.61.82
No
Rounding
Condition-1
Rounding
Condition-3
Rounding
Transmittance for
SQUARE LENS APERTURE
Fig. 10. Solar Spectral Weighted Transmission Efficiency (Tsolar) plots for Circular and Square Aperture Lenses.
74% and decreasing the f/# further causes the efficiency to drop sharply. If the f/# is kept above f/1.3 forcircular and f/1.2 for square aperture lenses, better than 80% transmittance may be realized. Continuing toincrease the f/# from here only asymptotically improves efficiency up to around 82% .
As discussed in Sec. 1, the f/# for the square lens is defined using the circumscribed diameter of a circularclear aperture (Fig. 1: “Square Fresnel Lens Aperture”). For this reason, there is limited meaning in a one-for-one comparison using f/# between the transmission efficiency of a circular lens with a square lens. Indeed,referencing Fig. 10, it appears a square lens will have better transmittance at a given f/# compared with it’scircular counterpart. To make a fair comparison, a metric should be used which parameterizes the lens power onthe available lens area (instead of clear aperture). To accomplish this, we define the quantity squared focal ratio
as f2/A where A is the active optical lens area; a circular aperture lens will have A = π(CA/2)2 and a squareaperture lens will have A = CA2/2. Plotting transmission efficiency vs. f2/A as in Fig. 11 provides an unbiaseddata space for comparing differently shaped lens apertures. Per the figure, a circular lens has marginally bettertransmittance vs. a square lens of equivalent squared focal ratio. Of course a square lens has advantageous arraypacking when compared with a circular lens, but this is not herein under investigation.
3.3 Spot Size
Using the method detailed in Sec. 2.7, the solar spectral weighted RMS spot radius (ρρρsolar) is estimated and usedfor defining the spot ratio (S/#) from Eq. 28. The results are plotted in Fig. 12.
As noted in Sec. 2.7, Eq. 24 produces calculated spot sizes that are much larger than RMS spot sizescomputed from a statistical raytrace (∼2-4x). Since it is understood that this may be the case because of theundue weighting applied to the edge of the field caused by ρ′
new(Eq. 24) when calculating ρ ′
rms(λ) (Eq. 26), the
data should be interpreted as an upper limit for the spot size. But it is important to realize that even as alimiting function, it is not necessarily a constant offset from actual. Further work is necessary to investigate thisoffset and to improve the model.
Given the aforementioned caveat on the accuracy of the represented spot ratios, Fig. 12 shows the substantialdifference between the ±0.266◦ direct solar subtense and the ±2◦ acceptance cone fields. The spot ratio increasesfor higher f/# lenses (particularly noticeable for the ±2◦ field). As the f/# is decreased the spot ratio decreasesand then inflects (for the ±2◦ field circular aperture lens, the inflection is around f/0.9 and for the squareaperture lens around f/0.7). After the inflection, the spot ratio increases rapidly. This is likely due to theincreased transverse chromatic aberration at the high angles of refraction associated with low f/#’s.
Proc. of SPIE Vol. 8129 81290J-12

Spectr
al
Weig
hte
d T
ran
sm
issio
n E
ffic
ien
cy
60%
62%
64%
66%
68%
70%
72%
74%
76%
78%
80%
82%
00.511.522.533.544.55
Circular Aperture,
No Prism Rounding
Square Aperture,
No Prism Rounding
Circular Aperture,
Condition-3 Rounding
Square Aperture,
Condition-3 Rounding
Circular vs. Square Lens Aperture Transmittance
plotted against Squared Focal Ratio
Fig. 11. Circular vs. Square Lens Aperture Transmittance comparison when plotted on an axis of Squared Focal
Ratio f2/A.Solar RMS Spot Ratio for
CIRCULAR LENS APERTURE
f/#
S/#
0.00
0.05
0.10
0.15
0.20
0.25
0.30
0.40.60.81.01.21.41.61.82.02.22.42.62.83.0
Solar Subtense(±0.266°)
±2.0° Acceptance Cone
Solar RMS Spot Ratio for
SQUARE LENS APERTURE
f/#
S/#
0.00
0.05
0.10
0.15
0.20
0.25
0.30
0.40.60.81.01.21.41.61.82.02.22.42.62.83.0
Solar Subtense(±0.266°)
±2.0° Acceptance Cone
Fig. 12. Solar RMS Spot Ratio (S/#) for Circular and Square Lens Apertures. RMS Spot Diameter and FocalLength are available by multiplying S/# and f/# by the Lens Clear Aperture (CA) respectively.
3.4 Concentration Ratio
From Sec. 2.8, the integrated optical solar concentration ratio (Csolar) is computed for square and circularapertures with and without prism peak rounding at the ±0.266◦ direct solar subtense and±2◦ tolerant acceptancecone (see Fig. 13). Due to the large scale difference between the ±0.266◦ and the ±2◦ configurations, they areplotted independently with circular and square aperture data overlayed.
Since the concentration ratio calculation is directly dependent on the spot radius, the results must be consid-ered carefully as previously discussed. Spot radii that are unduly large will yield concentration ratios that aretoo small. Keeping this in mind, referencing Fig. 13, a circular aperture lens achieves peak concentration around
Proc. of SPIE Vol. 8129 81290J-13

Solar Optical Concentration Ratio for
DIRECT SOLAR SUBTENSE (±0.266°)
f/#
Con
cen
trati
on
Rati
o
0
100
200
300
400
500
600
700
800
0.40.60.81.01.21.41.61.82.02.22.42.62.83.0
Circular Aperture
No Rounding
Circular Aperture
Cond-3 Rounding
Square Aperture
No Rounding
Square Aperture
Cond-3 Rounding
Solar Optical Concentration Ratio for
±2° ACCEPTANCE CONE
f/#
Con
cen
trati
on
Rati
o
0
5
10
15
20
25
30
35
40
0.40.60.81.01.21.41.61.82.02.22.42.62.83.0
Circular Aperture
No Rounding
Circular Aperture
Cond-3 Rounding
Square Aperture
No Rounding
Square Aperture
Cond-3 Rounding
Fig. 13. Integrated Solar Concentration Ratio (Csolar) for the ±0.266◦ direct solar subtense and a ±2◦ tolerantacceptance cone.
f/0.95 for the ±0.266◦ field and f/0.85 for the ±2◦ field. A square aperture lens achieves peak concentrationaround f/0.7 for the ±0.266◦ field and f/0.8 for the ±2◦ field. The peak concentration for the ±0.266◦ field isapproximately 700x and for the ±2◦ field about 36x. The reduction in concentration ratio due to “Condition-3”prism peak rounding is most evident in the f/0.6-f/1.5 regime.
Recall that this analysis assumes an imaging based point focus Fresnel lens. Concentration ratio may beconsiderably adjusted by other factors. For example, inclusion of a secondary optical element.
4. CONCLUSIONS
A computational method which is a hybrid between analytic formulae and raytracing was discussed and im-plemented. The method generates a comprehensive cache of data allowing for rapid and insightful analysis.The method has a speed advantage compared to conventional statistical raytracing due to efficient data languagebased matrix computations and no requirement to generate representative surface geometry or make ray-interceptpredictions. It is particularly helpful for dynamically creating a model simulation for geometric loss factors suchas prism tip peak rounding and draft angle.
Various optical properties for flat acrylic polymer Fresnel lens solar concentrator primary lenses were inves-tigated over a landscape of possible geometries. Further it was found that transmission efficiency results werein excellent agreement with a statistical raytrace simulation thus validating the approach. However, the lack ofstatistical ray data required the derivation of an approximation for the RMS spot radius which yielded enlargedspot radii compared to raytracing.
Data was presented for both circular and square aperture Fresnel lenses and although the data plots seem toindicate noticeably better performance for square based lens apertures, this was an artifact of defining f/# forthe square aperture based on a circumscribed clear aperture. A proper comparison between aperture types wasproposed by defining the squared focal ratio which showed similar performance between circular apertures andsquare apertures (with circular apertures performing marginally better – see Fig. 11).
Further work may include: running simulations for lens prescriptions generated at different design wave-lengths; examination of different polymer materials, particularly Silicone-on-Glass (SOG); modification of prismdraft angles; exploration for an improved spot diameter model; inclusion of multi-junction PV cell sensitivity;implementing a direct plus circumsolar sun source angular distribution model; and generation of cell iradiancemaps and through-focus plots.
Proc. of SPIE Vol. 8129 81290J-14

REFERENCES
[1] B. A. Anicin, V. M. Bobovic, and D. M. Davidovic, “Fresnel lenses,” Am. J. Phys. 57, pp. 312–316, Apr.1989.
[2] R. Leutz and A. Suzuki, Nonimaging Fresnel Lenses: Design and Performance of Solar Concentrators,Springer, Berlin, 2001.
[3] A. Davis, “Raytrace assisted analytical formulation of fresnel lens transmission efficiency,” in Novel Optical
Systems Design and Optimization, R. John Koshel and G. Groot Gregory, ed., Proc. SPIE 7429, pp. D1–12,Aug. 2009.
[4] A. Davis, K. Levesque, and S. Wilt, “Prism peak rounding in injection molded fresnel lens solar concen-trators,” in Diamond Turning and Polymer Optics, Chris Ghio, ed., Optifab TD07, pp. 52(1)–52(3), May.2011.
[5] E. Jones, T. Oliphant, P. Peterson, et al., “SciPy: Open source scientific tools for Python, www.scipy.org,”2001–.
[6] M. Born and E. Wolf, Principles of Optics, Pergamon Press, Oxford, 6th ed., 1980. See in particular Sec. 1.5.2
“Fresnel Formulae”.
[7] E. Hecht and A. Zajac, Optics, Addison–Wesley, Reading, Massachusetts, 2nd ed., 1990. See in particular Sec.
4.3 “The Electromagnetic Approach”.
[8] American Society for Testing and Materials (ASTM), “http://rredc.nrel.gov/solar/spectra/am1.5/.”Internet Website, 2011. Terrestrial Reference Solar Spectral Irradiance: Air Mass 1.5.
COPYRIGHT
Copyright 2011 Society of Photo-Optical Instrumentation Engineers. One print or electronic copy may be madefor personal use only. Systematic reproduction and distribution, duplication of any material in this paper for afee or for commercial purposes, or modification of the content of the paper are prohibited.
Proc. of SPIE Vol. 8129 81290J-15


![Aperture antenna modelling by a finite number of … using a single probe spherical range measurement in the large anechoic chamber of the Institut Fresnel [5]. Once the equivalent](https://static.fdocuments.in/doc/165x107/5aa456fa7f8b9a517d8bc3dd/aperture-antenna-modelling-by-a-finite-number-of-using-a-single-probe-spherical.jpg)