![FRESNEL LENS-TYPE ENERGY CONCENTRATOR FOR ...Fresnel lenses are complex composed optical devices which are used in various fields [18]. We propose to assemble such a lens from concentric](https://static.fdocuments.in/doc/165x107/60b3471a7eb04b0212132280/fresnel-lens-type-energy-concentrator-for-fresnel-lenses-are-complex-composed.jpg)
FRESNEL LENS CHARACTERIZATION FOR SOLAR …
32
FRESNEL LENS CHARACTERIZATION FOR SOLAR CONCENTRATION EFFICIENCY An Undergraduate Research Scholars Thesis by MARK HALLAM and WILLIAM HARRIS Submitted to Honors and Undergraduate Research Texas A&M University in partial fulfillment of the requirements for the designation as an UNDERGRADUATE RESEARCH SCHOLAR Approved by Research Advisor: Dr. Christi Madsen May 2015 Major: Electrical Engineering
Transcript of FRESNEL LENS CHARACTERIZATION FOR SOLAR …
FRESNEL LENS CHARACTERIZATION FOR SOLAR
CONCENTRATION EFFICIENCY
An Undergraduate Research Scholars Thesis
by
MARK HALLAM
and
WILLIAM HARRIS
Submitted to Honors and Undergraduate Research
Texas A&M University
in partial fulfillment of the requirements for the designation as an
UNDERGRADUATE RESEARCH SCHOLAR
Approved by
Research Advisor: Dr. Christi Madsen
May 2015
Major: Electrical Engineering
TABLE OF CONTENTS
Page
ABSTRACT ................................................................................................................................................ 1
CHAPTER
I INTRODUCTION ........................................................................................................... 2
II METHODS ....................................................................................................................... 5
Photodiode Experiments .................................................................................... 6
Lens Characterization Unit ................................................................................ 6
III RESULTS ...................................................................................................................... 15
Photodiode Experiments ................................................................................. 15
LCU Experiment #1 .......................................................................................... 17
LCU Experiment #2 .......................................................................................... 19
LCU Experiment #3 .......................................................................................... 23
IV CONCLUSION ............................................................................................................. 29
REFERENCES ......................................................................................................................................... 30
1
ABSTRACT
Fresnel Lens Characterization For Solar Concentration Efficiency. (May 2015)
Mark Hallam and William Harris
Department of Electrical and Computer Engineering
Texas A&M University
Research Advisor: Dr. Christi Madsen
Department of Electrical and Computer Engineering
Due to the inexpensive and light weight nature of Fresnel lenses, they are key components in
many solar energy concentration systems. Thus, the ability to effectively characterize large
format Fresnel lenses is essential to verifying their system performance and efficiency. Under
high concentration, it becomes impractical to perform detailed spatial and spectral measurements
under full sun conditions. We have developed a method to characterize large Fresnel lenses for
concentrating solar applications. Our Lens Characterization Unit (LCU) analyzes the resultant
pattern of an incident laser beam which may be scanned across the lens. Using the LCU, we can
evaluate the portion of diffracted light that is concentrated on the receiver area at each point of
incidence. After running initial tests and quantifying our results, we have determined that this
method of lens characterization is effective for both focal point analysis and spatial distribution
of the incident beam.
2
CHAPTER I
INTRODUCTION
Solar energy has become a key influence in the energy sector, and it continues to be a primary
area of research in renewable energy. Concentrated sunlight could be used in steam turbines,
lighting, and concentrated photovoltaics. Concave or convex glass lenses have excellent optical
efficiencies, but are difficult to craft, fragile when in use, and bulky. The compact design of a
Fresnel lens and its ability to be manufactured out of plastic makes it a viable alternative to solar
concentration using traditional glass concave or convex lenses [3]. As such, we sought to create a
method by which to analyze various Fresnel lenses and determine their optical characteristics.
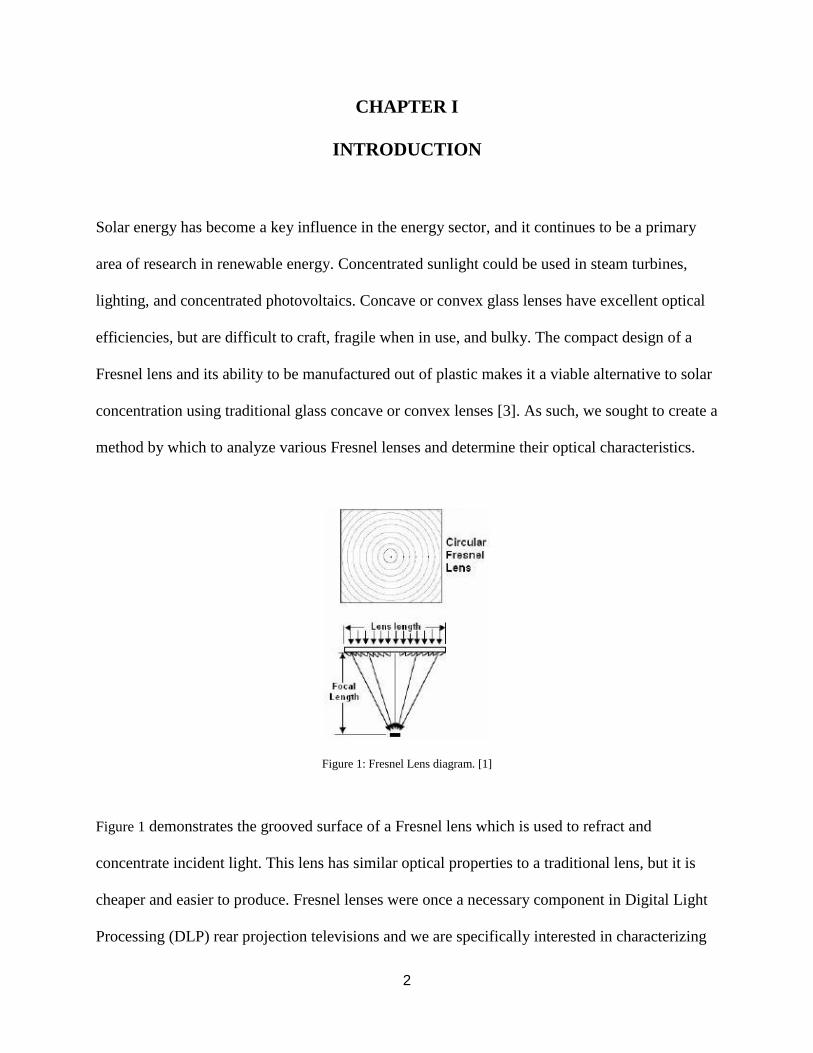
Figure 1: Fresnel Lens diagram. [1]
Figure 1 demonstrates the grooved surface of a Fresnel lens which is used to refract and
concentrate incident light. This lens has similar optical properties to a traditional lens, but it is
cheaper and easier to produce. Fresnel lenses were once a necessary component in Digital Light
Processing (DLP) rear projection televisions and we are specifically interested in characterizing
3
lenses we hope to repurpose from discarded DLP televisions. Due to the unknown properties of
these repurposed lenses, we found that we were unable to use previously developed methods of
lens characterization. The results of our lens characterization will allow us to improve the
efficiency of the Solar Irradiance Concentrating Lens Positioning System (SICLPS) project
currently in development under Dr. Madsen at Texas A&M University. SICLPS uses a large
repurposed Fresnel lens in conjunction with solar tracking to concentrate sunlight onto a thermal
receiver, where the energy of the light will be converted into thermal energy. Understanding the
optical properties of every Fresnel lens available will allow the design and efficiency of the
SICLPS project to improve.
Irradiance is typically measured in watts per meter squared. The goal of a lens is to concentrate
the incoming irradiance across the full surface area of the lens down to a smaller area for
absorption. Thus, for our purposes, we needed to design a method by which to analyze the
concentration of the lens and determine the optical efficiency thereof.
We chose to investigate photodiodes as a method of quantizing the irradiance at various points
on our grid; however, these proved to be more suitable as ambient light sensors rather than the
high-intensity concentration applications. These limitations will be discussed in more detail, but
this investigation led to modifications to our methodology, including the decision to pursue a
relative efficiency approach.
In order to determine the relative efficiency of our lens, we followed similar principles as David
Keeports. [4] This discussion on reflections from a Fresnel lens details the theory of ray paths
and the resulting measurable focal length. With this theory in mind, we elected to use an
approach of resultant pattern analysis by passing a Gaussian beam through the lens and
observing the refraction of the beam at various distances and grid locations. [2] We used a digital
4
camera to capture images which allowed us to see the degree of spreading from beam along with
the relative intensities at various locations on our grid. Due to the size of the lens, it proved
useful to characterize one quarter of the Fresnel lens and extrapolate the results for the remaining
quarters.
After assuming this as our methodology, we proceeded to automate this process and perform
image processing with MATLAB to determine the focal length and degree of concentration of
this lens. We saw various levels of spreading depending on the location at which the laser was
incident on the lens. In addition, we determined the focal length to be far greater than we had
previously believed. We successfully proved that our method is suitable for lens characterization
purposes, and we will be conducting future tests with varying wavelengths and angles of
incidence.
5
CHAPTER II
METHODS
The dimensions of the Fresnel lens tested were 40” x 33”, though we will be applying and further
developing this method of lens characterization to other Fresnel lenses in the future. Our Lens
Characterization Unit (LCU) is comprised of four major components: the light source, the lens,
the receiver, and the camera. The receiver must translate the incoming light to relative intensity
and patterns. An optimal receiver would display high resolution and be able to linearly convert
irradiance to voltage or other means of measuring intensity. Our original concept was to use a
laser as a collimated light source, which we hoped would act as a ray and refract while
maintaining its narrow waist and collimation. However, preliminary testing showed that the lens
scatters even the collimated light of the laser.
The most challenging aspect of the design was determining the optimal receiver. The
qualifications for a good receiver include linear output compared to irradiance, negligible
saturation, and high resolution. We knew from previous experience that Light Dependent
Resistors (LDRs) do not behave linearly with irradiance and did not include them as a possible
candidate for the receiver. Instead, we originally sought to test the linearity and the angle of
incidence for photodiodes. The angle of incidence tests demonstrated that the accepted angle of
incidence for the photodiodes was too small. This realization led to the abandonment of
photodiodes with our prototype Lens Characterization Unit (LCU) design. Instead, we turned to
image-based design using outlined in the LCU subsection below.
The thermal receiver is a flat-plate thermal exchanger with approximate dimensions of 3" by 7".
Future testing will determine if a different thermal receiver designs will be better suited for the
6
goals of SICLPS, however, for the purposes of this research, we assumed the dimensions and
shape of the thermal receiver were consistent with the flat-plate design. Finding the region of the
lens that concentrates light to the region the thermal receiver will occupy is the primary goal of
this characterization.
Photodiode Experiments
Photodiode Angle of Incidence Experimentation
In order to test the angular response of the photodiodes, we created an experiment that varied the
incident angle of a laser beam on the junction of a photodiode. We designed an apparatus which
was mounted on a stepper motor to attach each photodiode separately. By doing so, we were able
to control this stepper motor with an Arduino microcontroller and vary the angle of incidence of
the laser beam on the junction of the photodiode.
Photodiode Linearity Experimentation
The linearity testing was conducted using Vishay TEFD4300 Silicon PIN Photodiodes. A laser
diode was mounted 15 cm from the photodiode being tested so the laser beam was directly
incident to the photodiode. The irradiance of the laser was varied between 165-190 𝑊
𝑚2 by
incrementing the drive current.
Lens Characterization Unit (LCU)
After determining we would be unable to use photodiodes, we decided to use a camera to take
images of the transmitted light pattern from the LCU. There were three LCU configurations built
and an experiment designed for each configuration. Each LCU setup was composed of four
7
components: laser position matrix, Fresnel lens, receiver, and camera. The laser position matrix
represents the discrete laser positions where an image was taken. The receivers used in the three
LCU experiments discussed in this thesis were either paper or cardboard. Cardboard was proven
to be an unideal receiver surface. Paper was used because when a laser is incident on the paper,
the reflected and transmitted light intensity is proportional to incident light intensity. Whether
this relationship is linear was not rigorously tested as it was determined unnecessary for the goals
of this thesis. Future experiments will test this relationship to determine if the intensity of the
reflected and transmitted portions of the light may be directly correlated to incident optical
power.
LCU Experiment #1
Our initial approach was to use a camera mounted to the side of the LCU to record images of the
grid below the lens as a laser moved incrementally along each axis. The basic structure for this
method is shown in Figure 2 and was constructed using basic 1” diameter PVC parts. The laser
position matrix setup was composed of 3D printed parts, two rods traversing the width of the
lens, and a red 10 mW laser pointer. The same laser was used for all three experiments and was
manufactured to produce 650nm wavelength light. Our laser position matrix covered the entire
lens, with the bottom left corner used as the origin. Our vertical and horizontal distance between
laser position rows and columns was 4”. We avoided laser positions near the edge of the lens by
starting our first column at 4” from the left side of the lens frame and similarly starting our first
row at 4” from the bottom of the lens frame. The laser positioning on this initial setup had to be
done manually between each image capture.
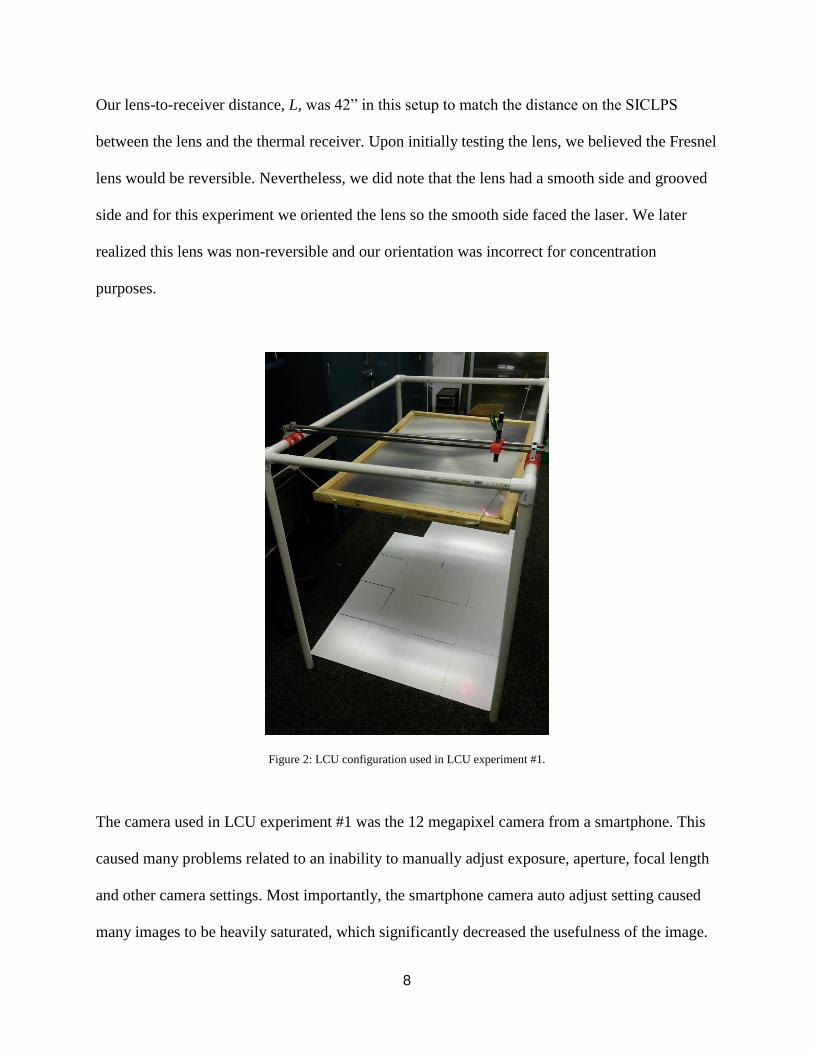
8
Our lens-to-receiver distance, L, was 42” in this setup to match the distance on the SICLPS
between the lens and the thermal receiver. Upon initially testing the lens, we believed the Fresnel
lens would be reversible. Nevertheless, we did note that the lens had a smooth side and grooved
side and for this experiment we oriented the lens so the smooth side faced the laser. We later
realized this lens was non-reversible and our orientation was incorrect for concentration
purposes.
Figure 2: LCU configuration used in LCU experiment #1.
The camera used in LCU experiment #1 was the 12 megapixel camera from a smartphone. This
caused many problems related to an inability to manually adjust exposure, aperture, focal length
and other camera settings. Most importantly, the smartphone camera auto adjust setting caused
many images to be heavily saturated, which significantly decreased the usefulness of the image.
9
Initially, we placed the camera to the side of the LCU frame and captured images of the light
reflected off the receiver. This configuration caused the images to become skewed. We hoped to
eliminate the skewing of the images by rectifying the images on MATLAB, however, the
progress towards this goal was unsatisfactory, leading to the abandonment of image rectification
reliance and the off-set camera position entirely. This issue was not solved until LCU experiment
#3.
LCU Experiment #2
Our second experiment improved upon our first by constructing the LCU out of 1” diameter
electrical conduit. This metal frame allowed the lens to be held more precisely level and steady.
For the receiver, we used a cardboard grid. In practice, this grid was not ideal and we elected not
to use it in future experiments. The grid was unideal because the lines of the grid changed the
image intensity and the grid had distracting elements visible in the images. We also upgraded to
a DSLR camera from the smartphone camera used in LCU experiment #1. This was a great
improvement for the resolution and saturation issues from the data in LCU experiment #1.
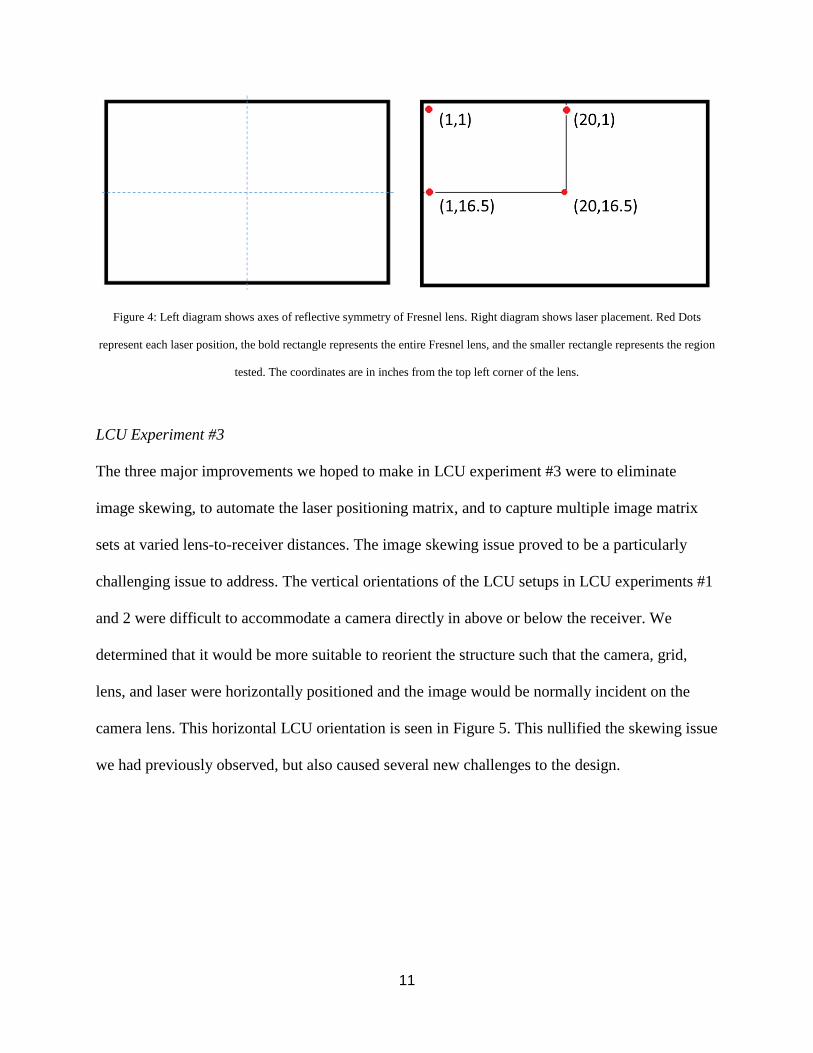
A major turning point in the lens characterization methodology came about after realizing the
images from LCU experiment #1 provided strong evidence for two axes of symmetry on the
Fresnel lens, as seen in Figure 4. We realized we could reduce the total area of our laser position
matrix to a single quarter of the lens and then extrapolate the results from our examination of the
quarterlens to accommodate the rest of the lens. This profoundly reduced the total time and
number of matrix positions required. For LCU experiment #2 we chose to measure the solely the
corners of the upper left quarterlens. Another alteration to the laser position matrix was the
decision to include the center of the lens as a position of the laser position matrix. The center of
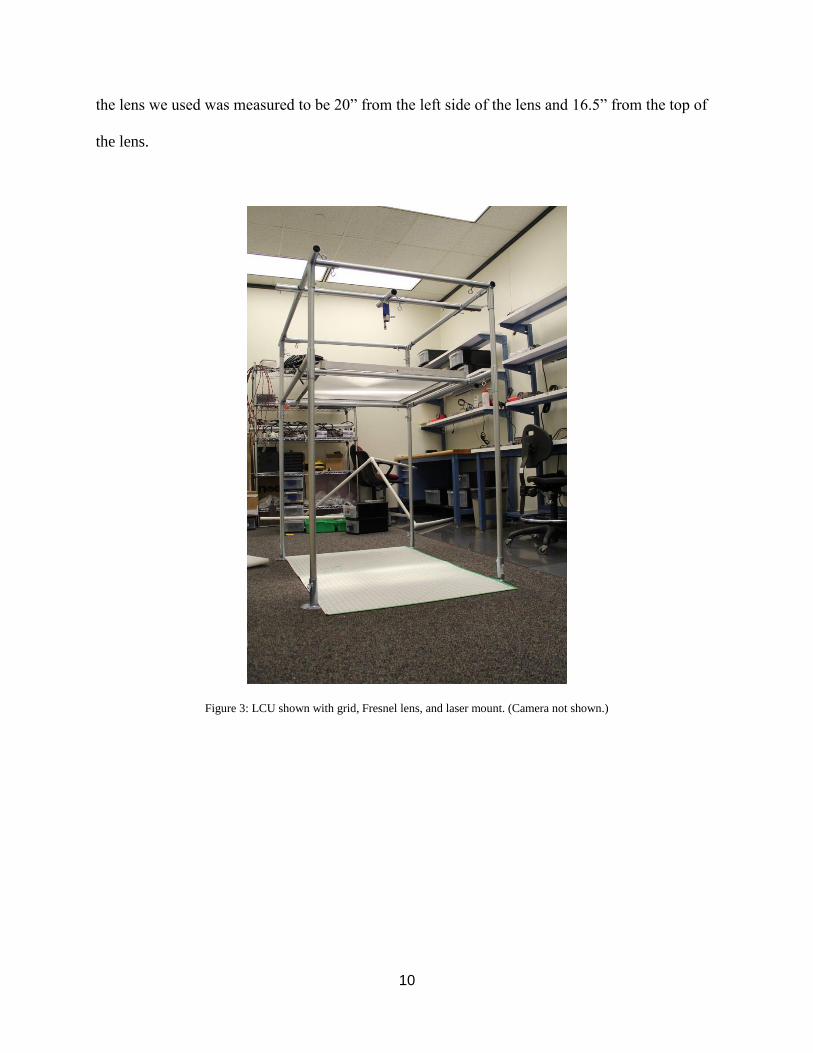
10
the lens we used was measured to be 20” from the left side of the lens and 16.5” from the top of
the lens.
Figure 3: LCU shown with grid, Fresnel lens, and laser mount. (Camera not shown.)
11
Figure 4: Left diagram shows axes of reflective symmetry of Fresnel lens. Right diagram shows laser placement. Red Dots
represent each laser position, the bold rectangle represents the entire Fresnel lens, and the smaller rectangle represents the region
tested. The coordinates are in inches from the top left corner of the lens.
LCU Experiment #3
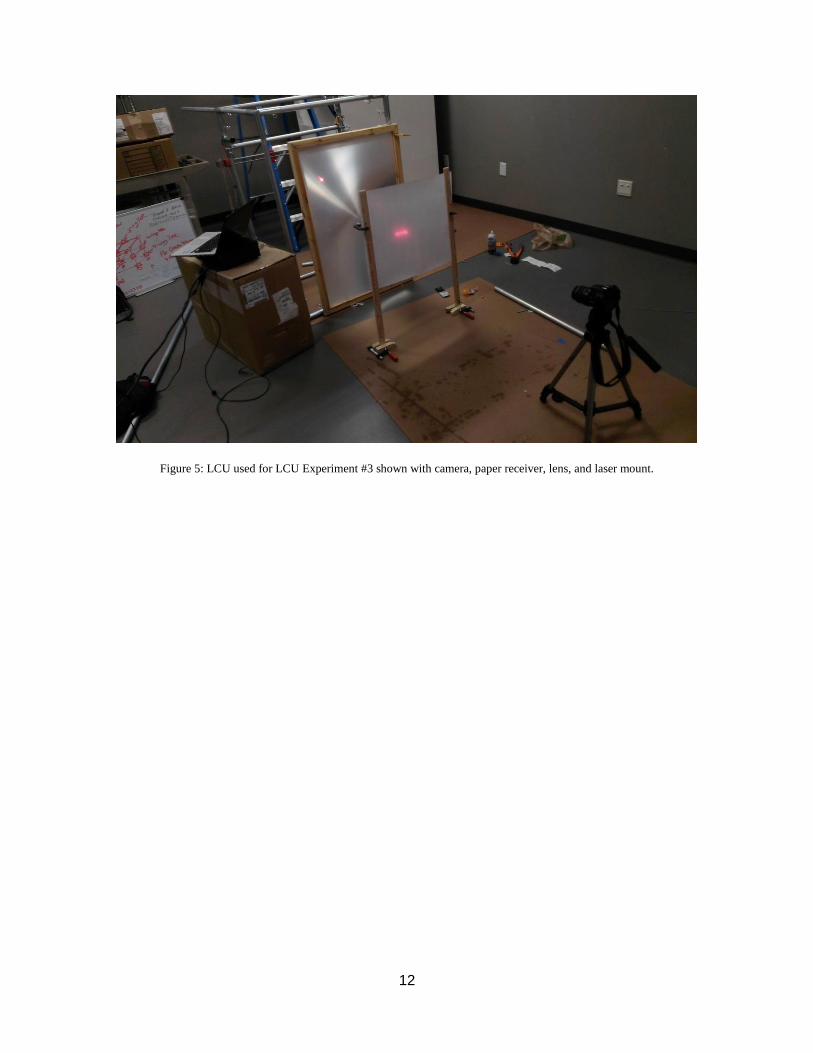
The three major improvements we hoped to make in LCU experiment #3 were to eliminate
image skewing, to automate the laser positioning matrix, and to capture multiple image matrix
sets at varied lens-to-receiver distances. The image skewing issue proved to be a particularly
challenging issue to address. The vertical orientations of the LCU setups in LCU experiments #1
and 2 were difficult to accommodate a camera directly in above or below the receiver. We
determined that it would be more suitable to reorient the structure such that the camera, grid,
lens, and laser were horizontally positioned and the image would be normally incident on the
camera lens. This horizontal LCU orientation is seen in Figure 5. This nullified the skewing issue
we had previously observed, but also caused several new challenges to the design.
12
Figure 5: LCU used for LCU Experiment #3 shown with camera, paper receiver, lens, and laser mount.

13
Two image matrix sets were captured at L = 10” and L = 23”. This allowed us to roughly
calculate the focal distance, though we will be finishing a more complex script in the future
which will take image matrix sets and more precisely calculate focal length and the axial and
lateral resolution of the Fresnel lens.
The camera used in this experiment was a NIKON D3200, which allowed precise and consistent
manual adjustment of the camera settings. We achieved negligible saturation for all image sets.
Figure 6: Stepper motors and 3D printed parts which control the laser stage.
14
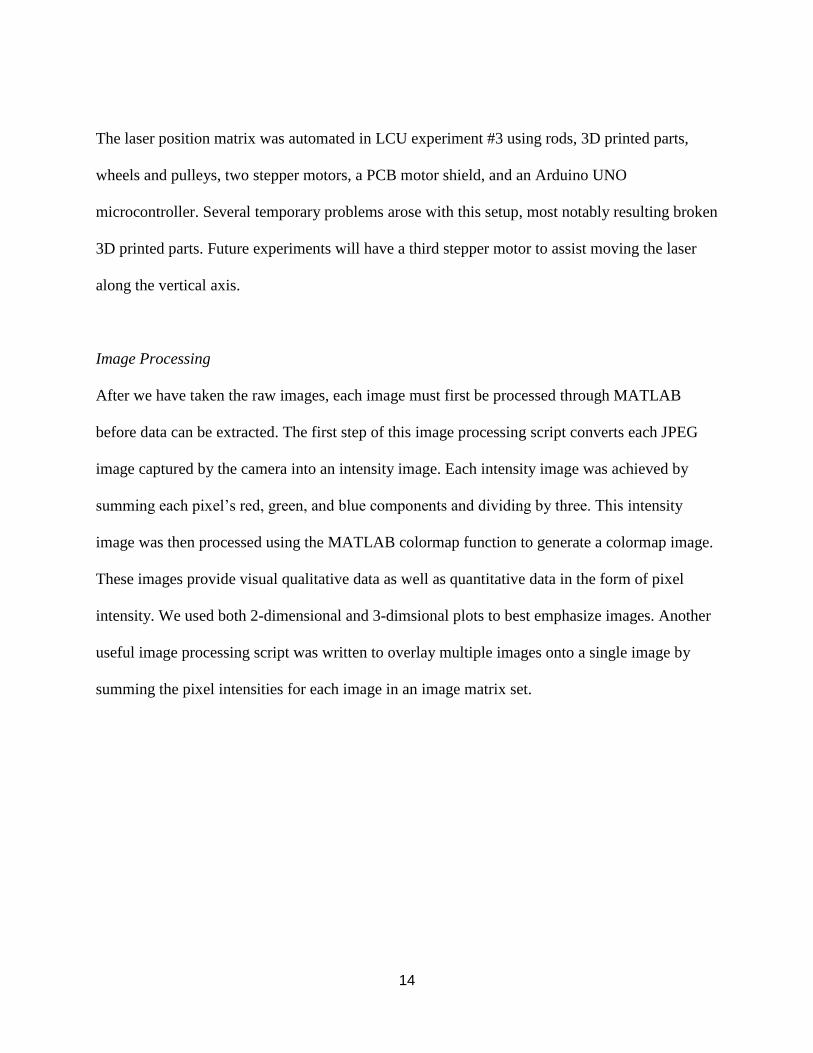
The laser position matrix was automated in LCU experiment #3 using rods, 3D printed parts,
wheels and pulleys, two stepper motors, a PCB motor shield, and an Arduino UNO
microcontroller. Several temporary problems arose with this setup, most notably resulting broken
3D printed parts. Future experiments will have a third stepper motor to assist moving the laser
along the vertical axis.
Image Processing
After we have taken the raw images, each image must first be processed through MATLAB
before data can be extracted. The first step of this image processing script converts each JPEG
image captured by the camera into an intensity image. Each intensity image was achieved by
summing each pixel’s red, green, and blue components and dividing by three. This intensity
image was then processed using the MATLAB colormap function to generate a colormap image.
These images provide visual qualitative data as well as quantitative data in the form of pixel
intensity. We used both 2-dimensional and 3-dimsional plots to best emphasize images. Another
useful image processing script was written to overlay multiple images onto a single image by
summing the pixel intensities for each image in an image matrix set.
15
CHAPTER III
RESULTS
Photodiode Experiments
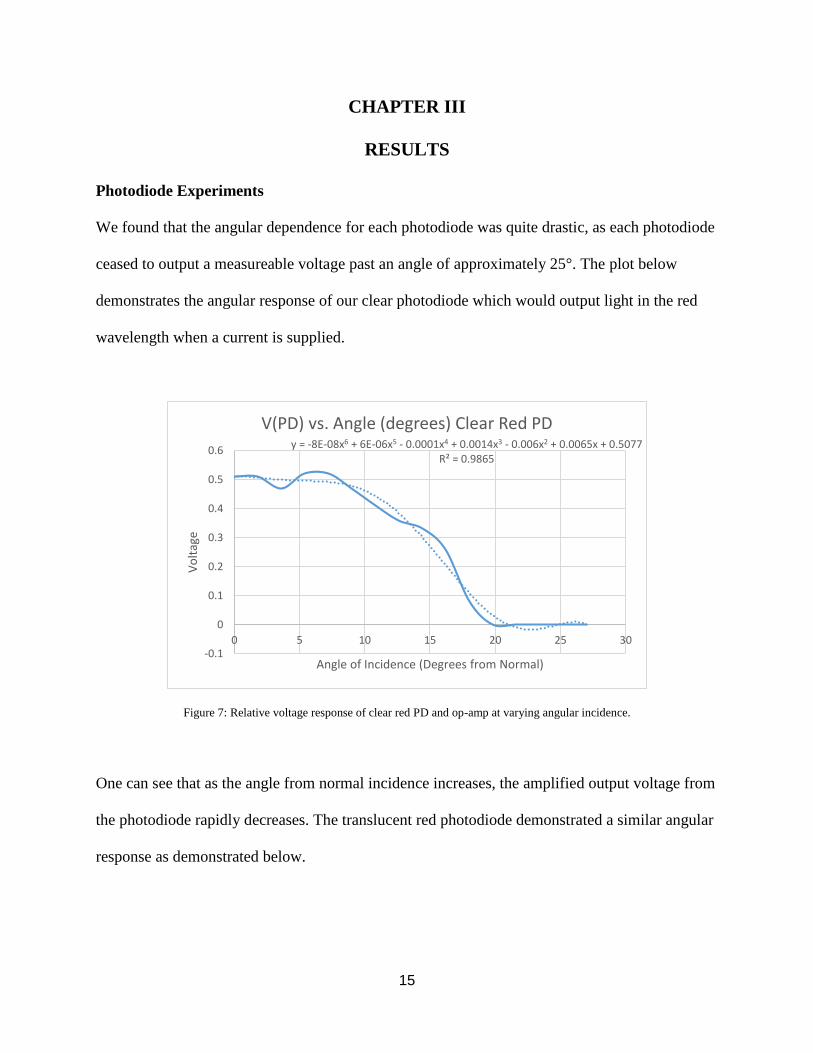
We found that the angular dependence for each photodiode was quite drastic, as each photodiode
ceased to output a measureable voltage past an angle of approximately 25°. The plot below
demonstrates the angular response of our clear photodiode which would output light in the red
wavelength when a current is supplied.
Figure 7: Relative voltage response of clear red PD and op-amp at varying angular incidence.
One can see that as the angle from normal incidence increases, the amplified output voltage from
the photodiode rapidly decreases. The translucent red photodiode demonstrated a similar angular
response as demonstrated below.
y = -8E-08x6 + 6E-06x5 - 0.0001x4 + 0.0014x3 - 0.006x2 + 0.0065x + 0.5077R² = 0.9865
-0.1
0
0.1
0.2
0.3
0.4
0.5
0.6
0 5 10 15 20 25 30
Vo
ltag
e
Angle of Incidence (Degrees from Normal)
V(PD) vs. Angle (degrees) Clear Red PD
16
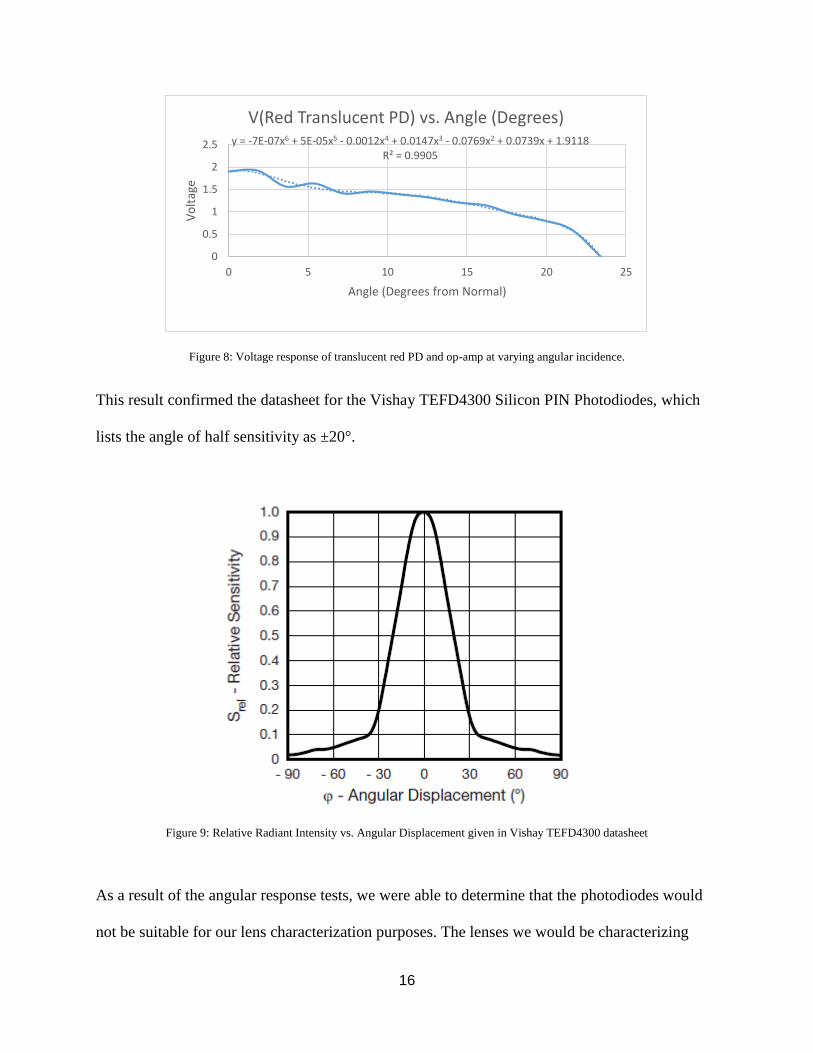
Figure 8: Voltage response of translucent red PD and op-amp at varying angular incidence.
This result confirmed the datasheet for the Vishay TEFD4300 Silicon PIN Photodiodes, which
lists the angle of half sensitivity as ±20°.
Figure 9: Relative Radiant Intensity vs. Angular Displacement given in Vishay TEFD4300 datasheet
As a result of the angular response tests, we were able to determine that the photodiodes would
not be suitable for our lens characterization purposes. The lenses we would be characterizing
y = -7E-07x6 + 5E-05x5 - 0.0012x4 + 0.0147x3 - 0.0769x2 + 0.0739x + 1.9118R² = 0.9905
0
0.5
1
1.5
2
2.5
0 5 10 15 20 25
Vo
ltag
e
Angle (Degrees from Normal)
V(Red Translucent PD) vs. Angle (Degrees)
17
were determined to potentially create incidence angles of around 40° and the smaller accepted
angle of incidence of the photodiode would lose information about the lens.
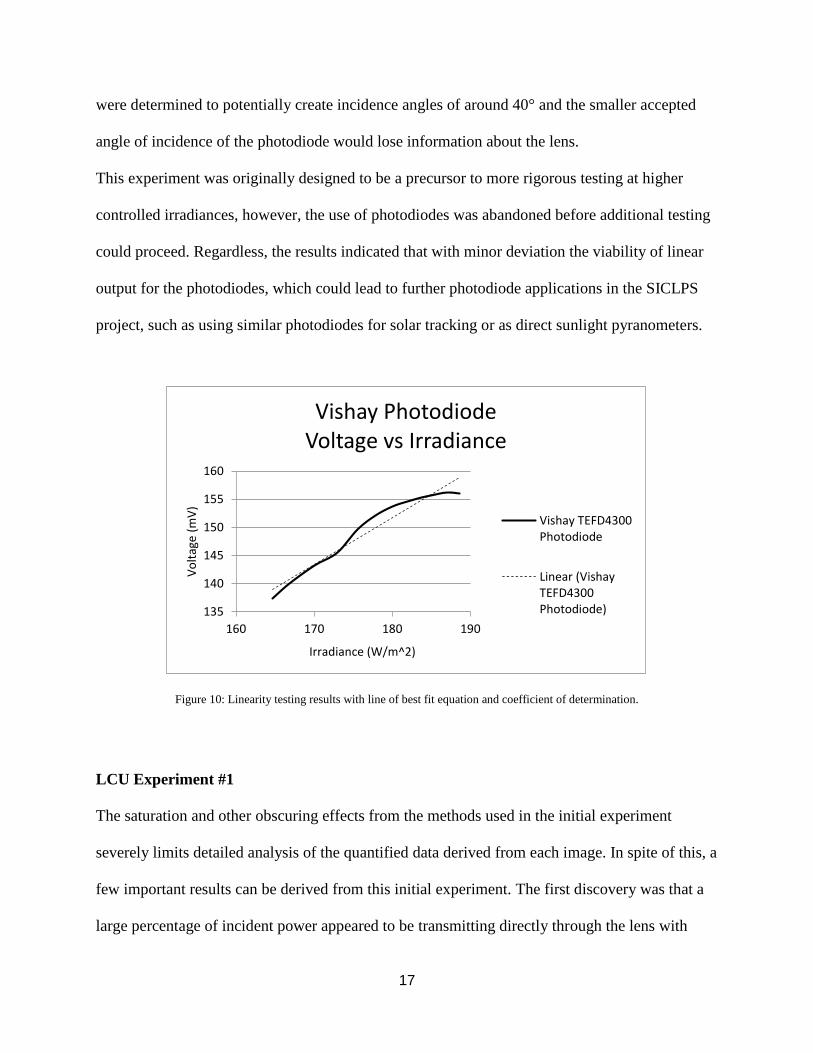
This experiment was originally designed to be a precursor to more rigorous testing at higher
controlled irradiances, however, the use of photodiodes was abandoned before additional testing
could proceed. Regardless, the results indicated that with minor deviation the viability of linear
output for the photodiodes, which could lead to further photodiode applications in the SICLPS
project, such as using similar photodiodes for solar tracking or as direct sunlight pyranometers.
Figure 10: Linearity testing results with line of best fit equation and coefficient of determination.
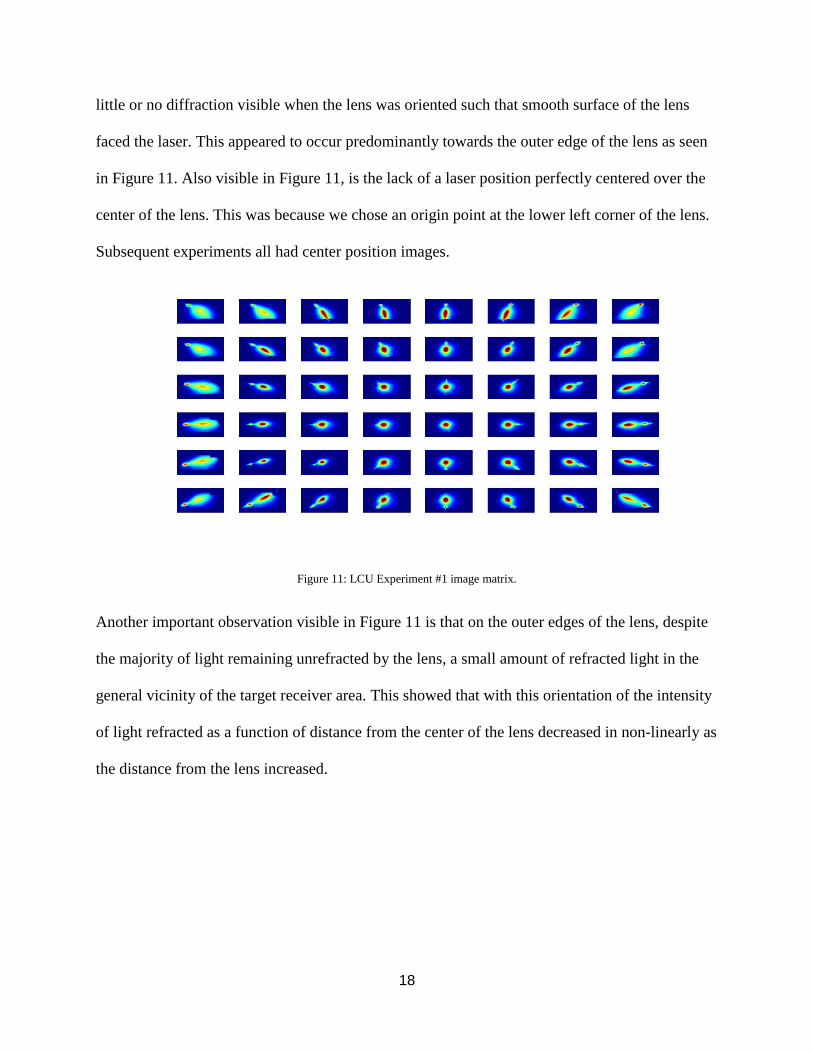
LCU Experiment #1
The saturation and other obscuring effects from the methods used in the initial experiment
severely limits detailed analysis of the quantified data derived from each image. In spite of this, a
few important results can be derived from this initial experiment. The first discovery was that a
large percentage of incident power appeared to be transmitting directly through the lens with
135
140
145
150
155
160
160 170 180 190
Vo
ltag
e (m
V)
Irradiance (W/m^2)
Vishay Photodiode Voltage vs Irradiance
Vishay TEFD4300Photodiode
Linear (VishayTEFD4300Photodiode)
18
little or no diffraction visible when the lens was oriented such that smooth surface of the lens
faced the laser. This appeared to occur predominantly towards the outer edge of the lens as seen
in Figure 11. Also visible in Figure 11, is the lack of a laser position perfectly centered over the
center of the lens. This was because we chose an origin point at the lower left corner of the lens.
Subsequent experiments all had center position images.
Figure 11: LCU Experiment #1 image matrix.
Another important observation visible in Figure 11 is that on the outer edges of the lens, despite
the majority of light remaining unrefracted by the lens, a small amount of refracted light in the
general vicinity of the target receiver area. This showed that with this orientation of the intensity
of light refracted as a function of distance from the center of the lens decreased in non-linearly as
the distance from the lens increased.
19
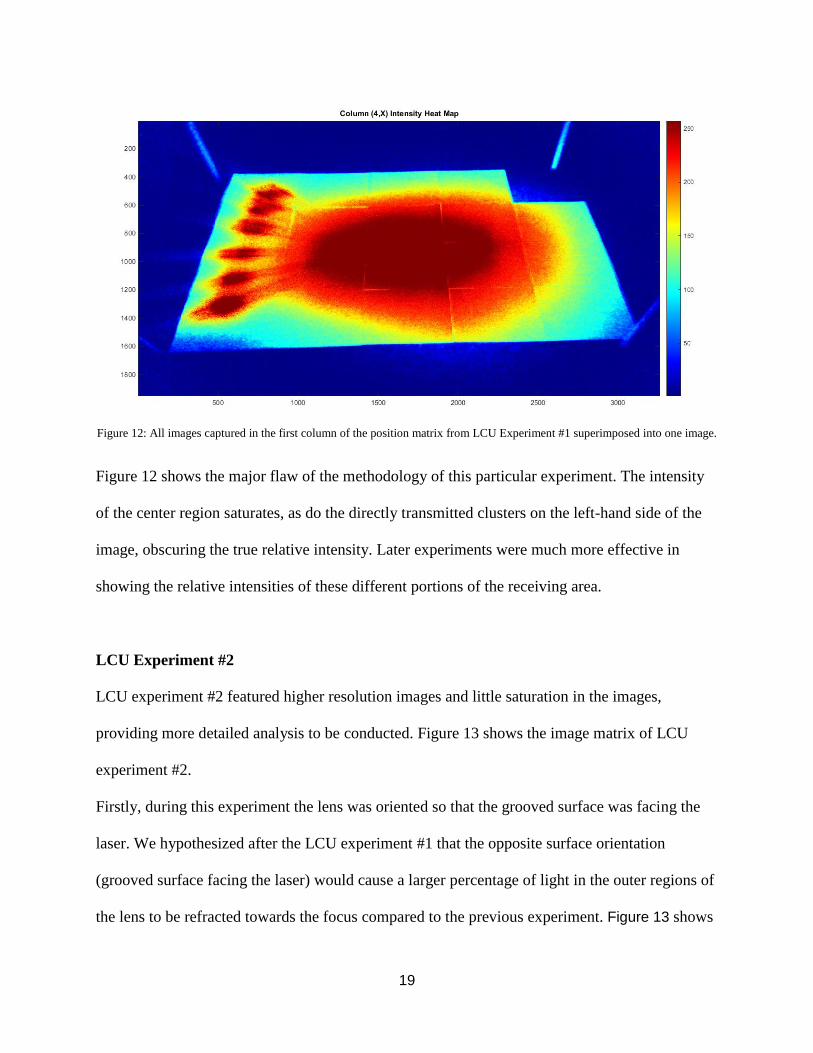
Figure 12: All images captured in the first column of the position matrix from LCU Experiment #1 superimposed into one image.
Figure 12 shows the major flaw of the methodology of this particular experiment. The intensity
of the center region saturates, as do the directly transmitted clusters on the left-hand side of the
image, obscuring the true relative intensity. Later experiments were much more effective in
showing the relative intensities of these different portions of the receiving area.
LCU Experiment #2
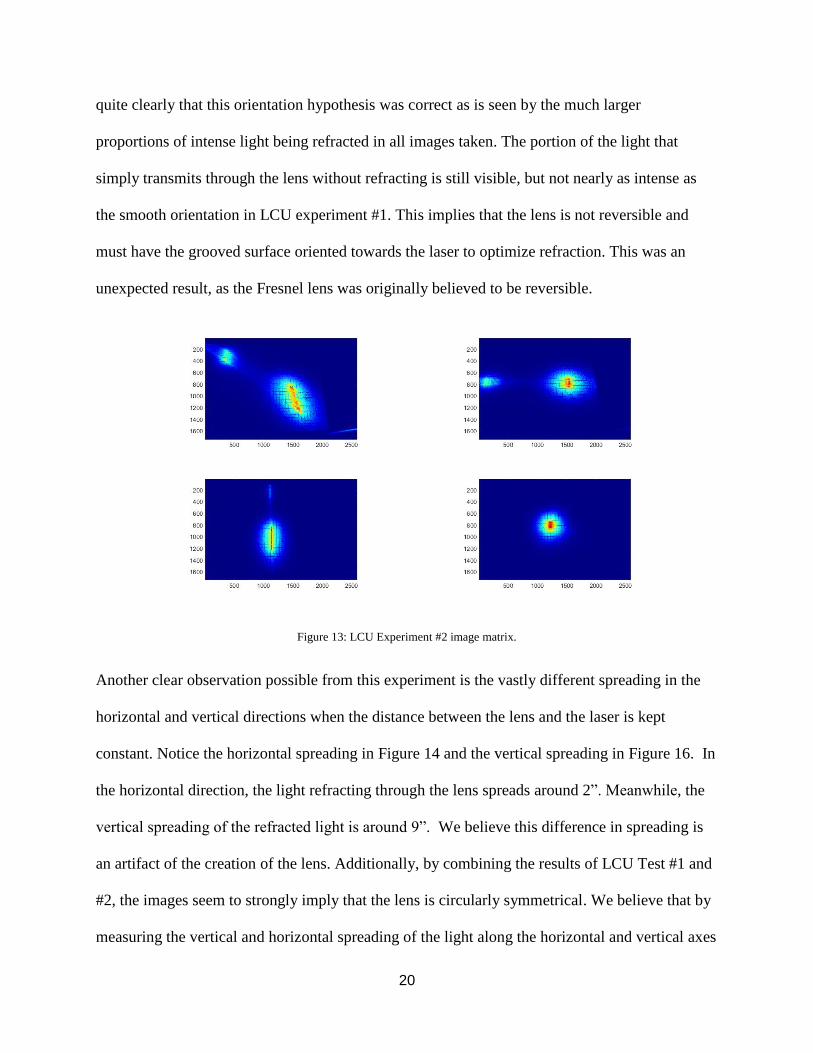
LCU experiment #2 featured higher resolution images and little saturation in the images,
providing more detailed analysis to be conducted. Figure 13 shows the image matrix of LCU
experiment #2.
Firstly, during this experiment the lens was oriented so that the grooved surface was facing the
laser. We hypothesized after the LCU experiment #1 that the opposite surface orientation
(grooved surface facing the laser) would cause a larger percentage of light in the outer regions of
the lens to be refracted towards the focus compared to the previous experiment. Figure 13 shows
20
quite clearly that this orientation hypothesis was correct as is seen by the much larger
proportions of intense light being refracted in all images taken. The portion of the light that
simply transmits through the lens without refracting is still visible, but not nearly as intense as
the smooth orientation in LCU experiment #1. This implies that the lens is not reversible and
must have the grooved surface oriented towards the laser to optimize refraction. This was an
unexpected result, as the Fresnel lens was originally believed to be reversible.
Figure 13: LCU Experiment #2 image matrix.
Another clear observation possible from this experiment is the vastly different spreading in the
horizontal and vertical directions when the distance between the lens and the laser is kept
constant. Notice the horizontal spreading in Figure 14 and the vertical spreading in Figure 16. In
the horizontal direction, the light refracting through the lens spreads around 2”. Meanwhile, the
vertical spreading of the refracted light is around 9”. We believe this difference in spreading is
an artifact of the creation of the lens. Additionally, by combining the results of LCU Test #1 and
#2, the images seem to strongly imply that the lens is circularly symmetrical. We believe that by
measuring the vertical and horizontal spreading of the light along the horizontal and vertical axes
21
of the center of the lens we can then map both vertical and horizontal spreading for any point on
the lens with the same radius.
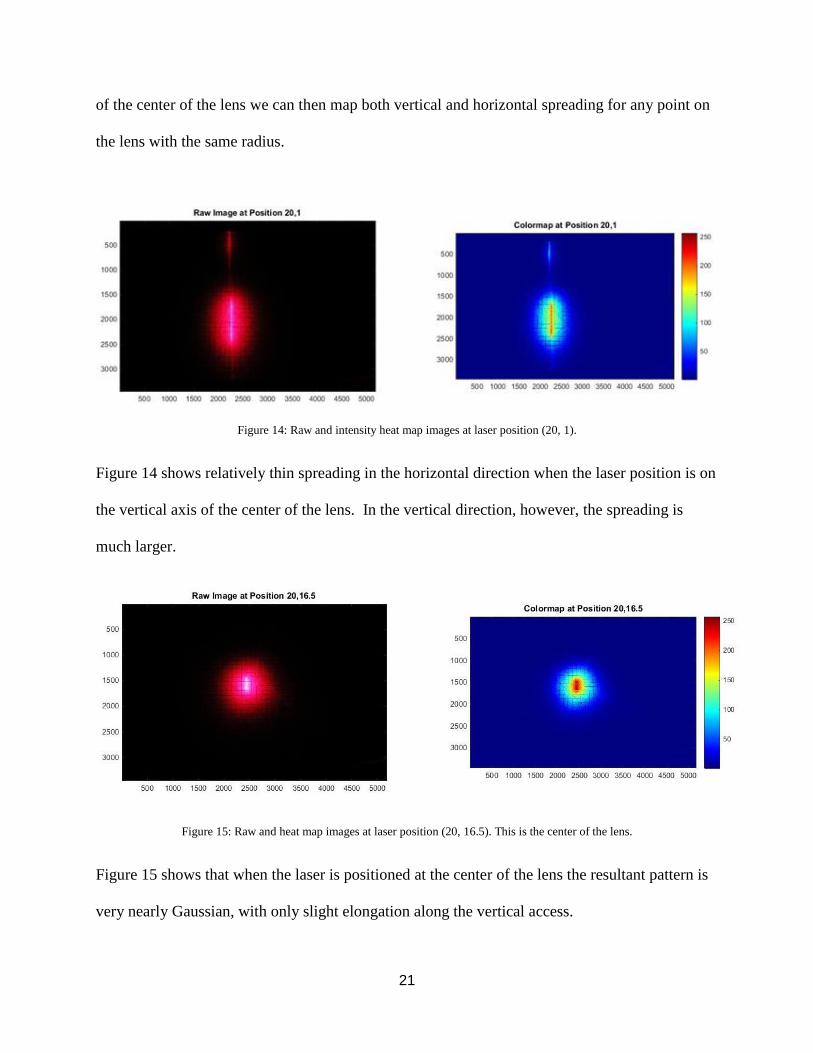
Figure 14: Raw and intensity heat map images at laser position (20, 1).
Figure 14 shows relatively thin spreading in the horizontal direction when the laser position is on
the vertical axis of the center of the lens. In the vertical direction, however, the spreading is
much larger.
Figure 15: Raw and heat map images at laser position (20, 16.5). This is the center of the lens.
Figure 15 shows that when the laser is positioned at the center of the lens the resultant pattern is
very nearly Gaussian, with only slight elongation along the vertical access.
22
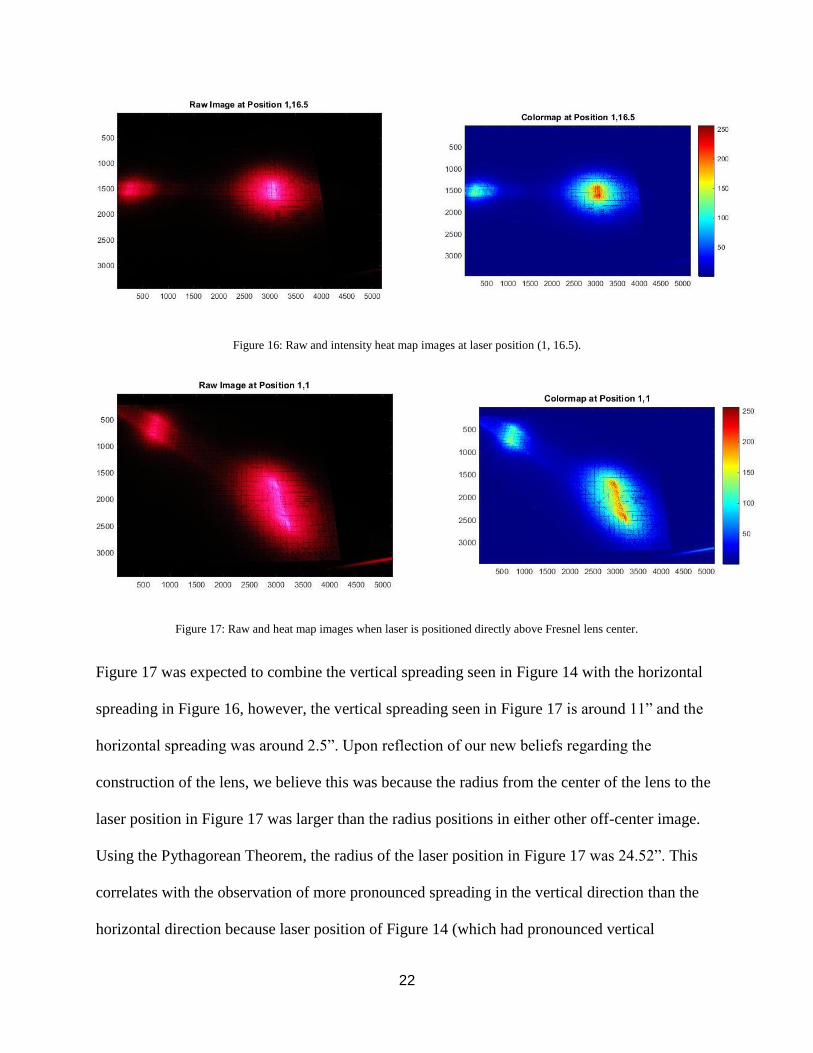
Figure 16: Raw and intensity heat map images at laser position (1, 16.5).
Figure 17: Raw and heat map images when laser is positioned directly above Fresnel lens center.
Figure 17 was expected to combine the vertical spreading seen in Figure 14 with the horizontal
spreading in Figure 16, however, the vertical spreading seen in Figure 17 is around 11” and the
horizontal spreading was around 2.5”. Upon reflection of our new beliefs regarding the
construction of the lens, we believe this was because the radius from the center of the lens to the
laser position in Figure 17 was larger than the radius positions in either other off-center image.
Using the Pythagorean Theorem, the radius of the laser position in Figure 17 was 24.52”. This
correlates with the observation of more pronounced spreading in the vertical direction than the
horizontal direction because laser position of Figure 14 (which had pronounced vertical
23
spreading) was only 15.5” away from the center, whereas the laser position of Figure 16 (which
had horizontal spreading) was 19” away from the center.
LCU Experiment #3
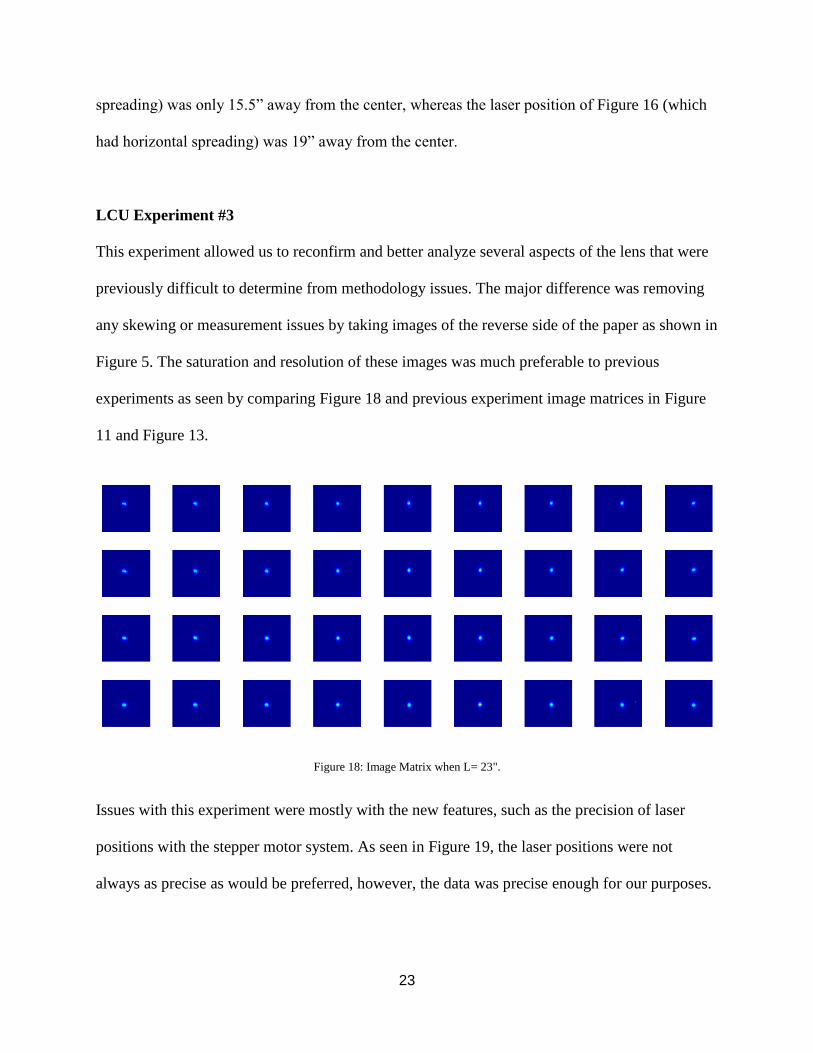
This experiment allowed us to reconfirm and better analyze several aspects of the lens that were
previously difficult to determine from methodology issues. The major difference was removing
any skewing or measurement issues by taking images of the reverse side of the paper as shown in
Figure 5. The saturation and resolution of these images was much preferable to previous
experiments as seen by comparing Figure 18 and previous experiment image matrices in Figure
11 and Figure 13.
Figure 18: Image Matrix when L= 23".
Issues with this experiment were mostly with the new features, such as the precision of laser
positions with the stepper motor system. As seen in Figure 19, the laser positions were not
always as precise as would be preferred, however, the data was precise enough for our purposes.
24
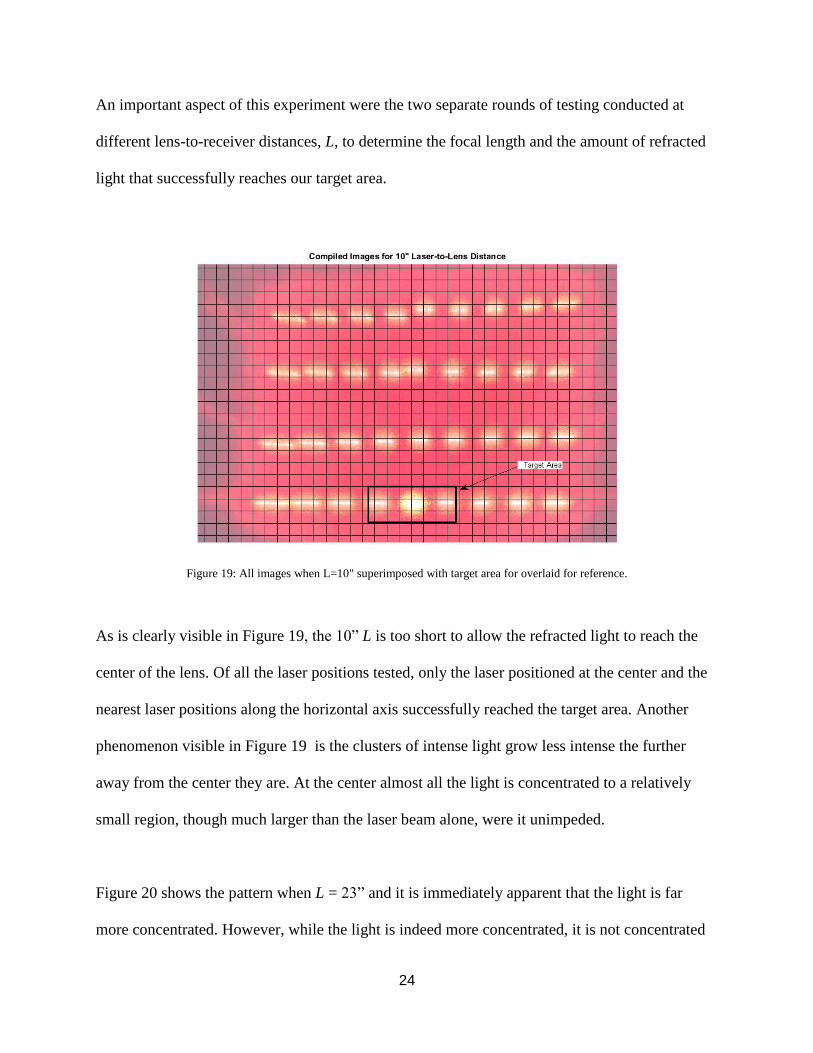
An important aspect of this experiment were the two separate rounds of testing conducted at
different lens-to-receiver distances, L, to determine the focal length and the amount of refracted
light that successfully reaches our target area.
Figure 19: All images when L=10" superimposed with target area for overlaid for reference.
As is clearly visible in Figure 19, the 10” L is too short to allow the refracted light to reach the
center of the lens. Of all the laser positions tested, only the laser positioned at the center and the
nearest laser positions along the horizontal axis successfully reached the target area. Another
phenomenon visible in Figure 19 is the clusters of intense light grow less intense the further
away from the center they are. At the center almost all the light is concentrated to a relatively
small region, though much larger than the laser beam alone, were it unimpeded.
Figure 20 shows the pattern when L = 23” and it is immediately apparent that the light is far
more concentrated. However, while the light is indeed more concentrated, it is not concentrated
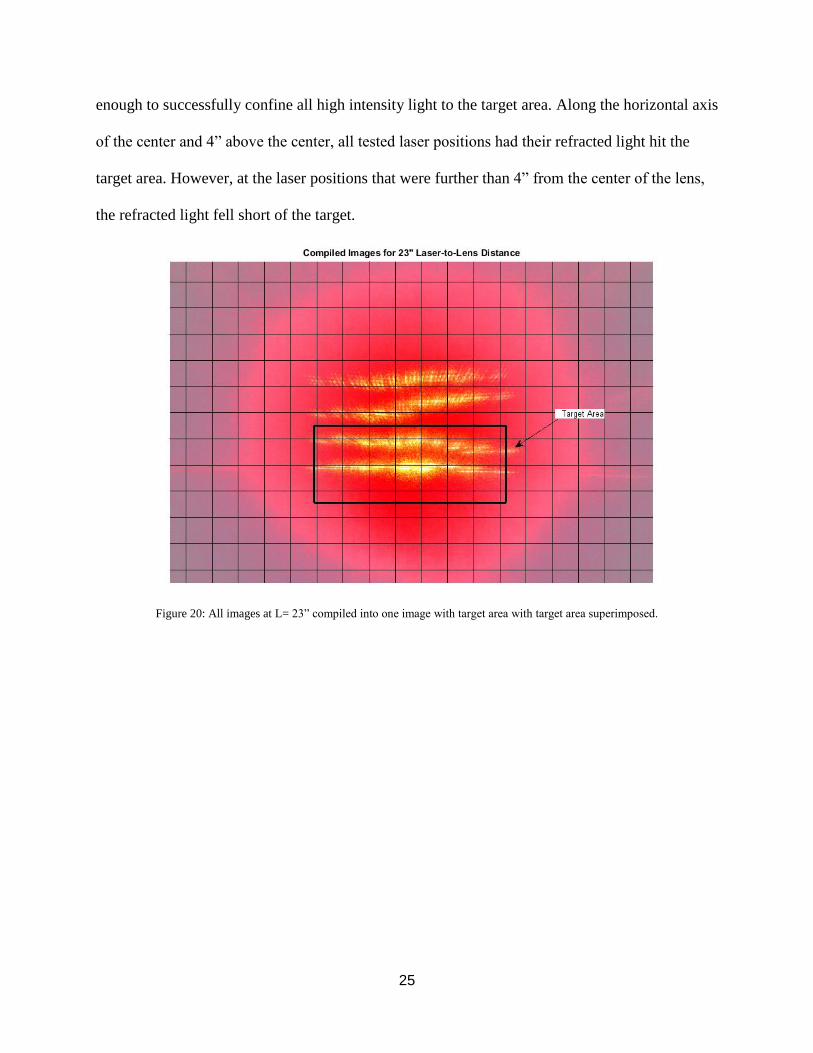
25
enough to successfully confine all high intensity light to the target area. Along the horizontal axis
of the center and 4” above the center, all tested laser positions had their refracted light hit the
target area. However, at the laser positions that were further than 4” from the center of the lens,
the refracted light fell short of the target.
Figure 20: All images at L= 23” compiled into one image with target area with target area superimposed.
26
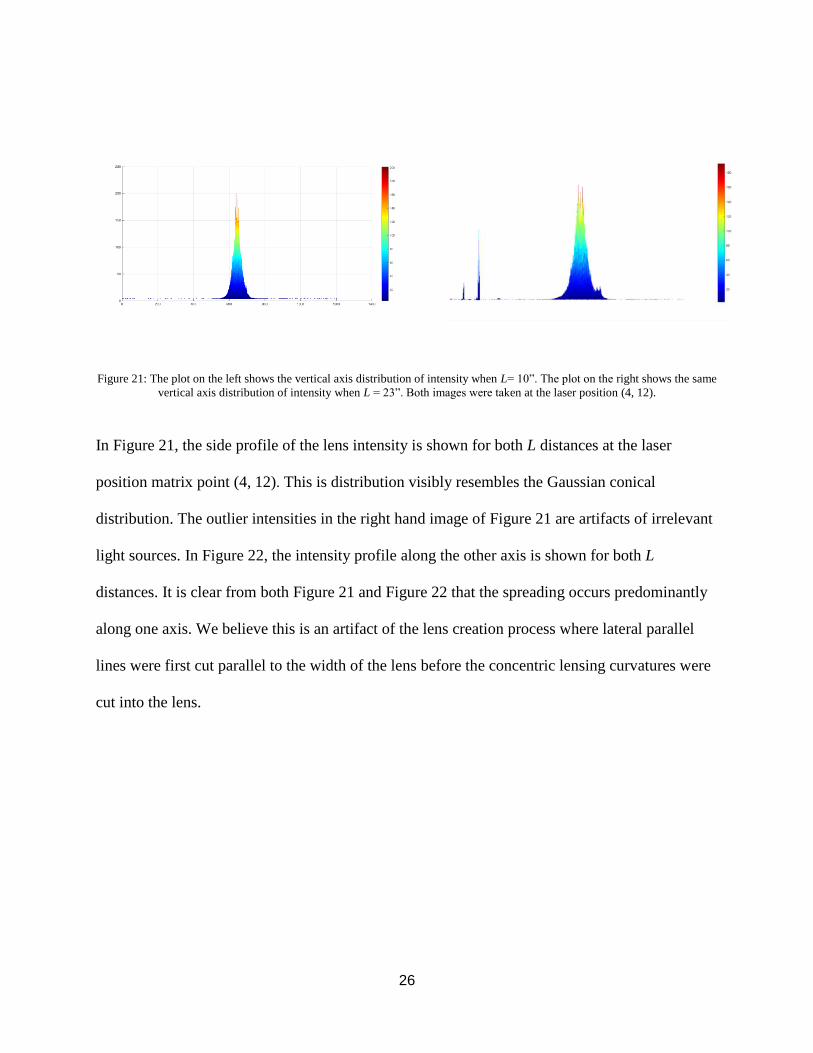
Figure 21: The plot on the left shows the vertical axis distribution of intensity when L= 10”. The plot on the right shows the same
vertical axis distribution of intensity when L = 23”. Both images were taken at the laser position (4, 12).
In Figure 21, the side profile of the lens intensity is shown for both L distances at the laser
position matrix point (4, 12). This is distribution visibly resembles the Gaussian conical
distribution. The outlier intensities in the right hand image of Figure 21 are artifacts of irrelevant
light sources. In Figure 22, the intensity profile along the other axis is shown for both L
distances. It is clear from both Figure 21 and Figure 22 that the spreading occurs predominantly
along one axis. We believe this is an artifact of the lens creation process where lateral parallel
lines were first cut parallel to the width of the lens before the concentric lensing curvatures were
cut into the lens.
27
Figure 22: The plot on the left shows the horizontal axis distribution of intensity when L= 10”. The plot on the left show the same
distribution of intensity when L= 23”. Both images were taken at the laser position (4, 12).
Figure 23 also shows a similar cluster patterns at two laser position points that are 12” apart
along the long axis of the lens. In both images, from left to right, three high intensity, red clusters
at regular intervals of approximately 1/16th of an inch followed by a space of approximately 1/8th
of an inch followed by another intensity cluster followed by another space of approximately 1/8th
of an inch followed by two more clusters separated by 1/16th of an inch. We believe patterns like
these throughout the lens provides strong evidence of two series of cuts in the lens; one series of
linear cuts parallel to the short axis of the lens and another series of concentric circular cuts with
varying radii centered at the center of the lens.
28
Figure 23: Magnified view of pattern at center of lens and 12 inches along x-axis of lens.
The focal length was estimated by calculating the vertical distance of the light that began at the
laser position (0, 12) when L = 10” and L = 23” and then mapping the trajectory of the light that
hit the lens at this position. The same type of calculation was done using data from the laser
position (8, 0). Using both of these light trajectories, our rough estimate of the focal length is
approximately 25”. This seems reasonable when considering the approximate depth of the DLP
television the Fresnel lens we were testing was recovered from. Further data analysis is required
to develop a better understanding of the focal length, focal depth, and resolution of the Fresnel
lens.
29
CHAPTER IV
CONCLUSION
We have determined several notable things about the Fresnel lens we tested. Our first discovery
was finding that the lens was not reversible and determining the correct surface orientation for
concentration. We also created the quarterlens method of lens characterization which describes
the optical properties of the lens using the lens’ inherent symmetries to minimize the number of
images required to describe the lens in sufficient detail for purposes of concentration.
The major optical properties we have not been able to experimentally verify as of the writing of
this thesis are the focal length of the Fresnel lens, relative optical efficiency of the lens (the ratio
of the summed light intensity falling in the target area over the total light intensity in the image
plane), and the Gaussian profile of the laser through free space and through the lens.
Determining the total optical efficiency of the lens, which accounts for light that does not reach
our receiver in addition to the light observed on our receiver, will be essential to optimizing the
efficiency of the system.
It also appears that the resolution of the Fresnel lens may not accommodate our current thermal
receiver area. Further experimentation is necessary to determine if strategically placed mirrors
could recapture this loss.
In the future, we will further streamline this method of Fresnel lens characterization to offer
more detailed optical descriptions of Fresnel lenses of varying size and purpose. Our method will
be generalized and expanded upon to accommodate larger lenses and arrays of smaller lenses.
30
REFERENCES
[1] Banchik, Leonardo D., Sahm, Aaron, Boehm, Robert, & Stone, Kenneth W., 2005, “Cleaning
Strategies for Parabolic Trough Solar-Collector Fields; Guidelines for decisions”, ASME,
ES2009-90321.
[2] M. Wiesenfarth, M. Steiner, J. Wolf, T. Schmidt and A. W. Bett. Investigation of different
fresnel lens designs and methods to determine the optical efficiency. AIP Conference
Proceedings 1616pp. 97-101. 2014. Available: http://lib-
ezproxy.tamu.edu:2048/login?url=http://search.ebscohost.com/login.aspx?direct=true&db=a9h&
AN=98606814&site=ehost-live. DOI: 10.1063/1.4897037.
[3] V. Kumar, R. L. Shrivastava and S. P. Untawale. Fresnel lens: A promising alternative of
reflectors in concentrated solar power. Renewable & Sustainable Energy Reviews 44pp. 376-
390. 2015. Available: http://lib-
ezproxy.tamu.edu:2048/login?url=http://search.ebscohost.com/login.aspx?direct=true&db=a9h&
AN=100981497&site=ehost-live. DOI: 10.1016/j.rser.2014.12.006.
[4] D. Keeports, "Reflections From a Fresnel Lens," Physics Education, vol. 40, pp. 60-66,
01/01, 2005.