Fraser-Fort George Investment Ready Community Profile · The Regional District of Fraser-Fort...
61
1 Regional District of Fraser-Fort George
Transcript of Fraser-Fort George Investment Ready Community Profile · The Regional District of Fraser-Fort...
1
Regional District of
Fraser-Fort George
2
3
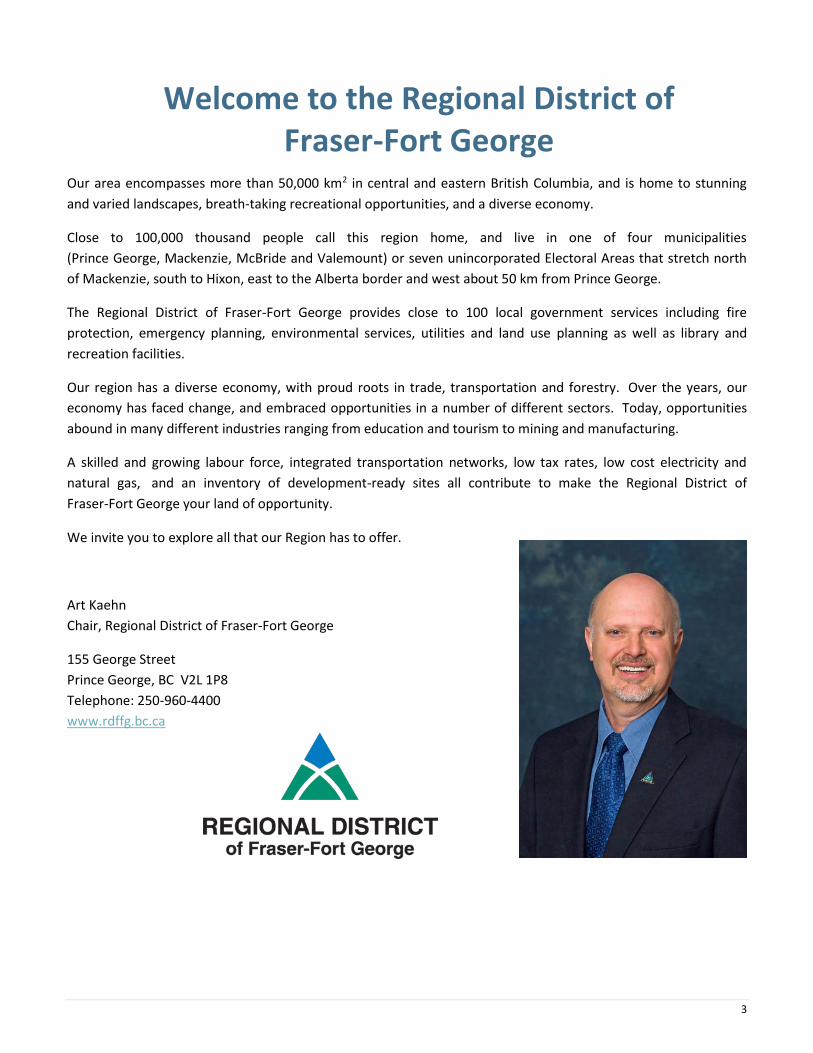
Welcome to the Regional District of Fraser-Fort George
Our area encompasses more than 50,000 km2 in central and eastern British Columbia, and is home to stunning
and varied landscapes, breath-taking recreational opportunities, and a diverse economy.
Close to 100,000 thousand people call this region home, and live in one of four municipalities
(Prince George, Mackenzie, McBride and Valemount) or seven unincorporated Electoral Areas that stretch north
of Mackenzie, south to Hixon, east to the Alberta border and west about 50 km from Prince George.
The Regional District of Fraser-Fort George provides close to 100 local government services including fire
protection, emergency planning, environmental services, utilities and land use planning as well as library and
recreation facilities.
Our region has a diverse economy, with proud roots in trade, transportation and forestry. Over the years, our
economy has faced change, and embraced opportunities in a number of different sectors. Today, opportunities
abound in many different industries ranging from education and tourism to mining and manufacturing.
A skilled and growing labour force, integrated transportation networks, low tax rates, low cost electricity and
natural gas, and an inventory of development-ready sites all contribute to make the Regional District of
Fraser-Fort George your land of opportunity.
We invite you to explore all that our Region has to offer.
Art Kaehn
Chair, Regional District of Fraser-Fort George
155 George Street
Prince George, BC V2L 1P8
Telephone: 250-960-4400
www.rdffg.bc.ca
4
CONTENTS
1. Demographics ........................................................................................................................... 6
Population 6
Household Income 7
Household total Income 2011 – Distribution 7
Workforce Education Attainment 8
Language Knowledge 8
2. Labour Force ............................................................................................................................. 9
Employment by Industry 9
Top Employers 10
AVERAGE INCOME BY OCCUPATION – NORTHERN BC 11
LABOUR FORCE 12
EMPLOYMENT RATE 12
LABOUR PARTICIPATION RATE 12
3. Payroll Costs ............................................................................................................................ 13
Workers Compensation – 2014 13
Employment Insurance – 2014 13
Social Insurance (Canada Pension Plan) – 2014 14
4. Higher Education ..................................................................................................................... 15
Four Year Institutions 15
Training Services 15
5. Transportation ........................................................................................................................ 16
Major Transportion Routes 16
Highways in british columbia 18
Northern Corridor Specifications 19
Highway Distances (From Prince George) 20
Railroads 20
Airports 21
Ports 25
Port Shipping Distances 28
6. Industrial & Commercial Land Use ............................................................................................ 29
Land Zoned and Designated in Official Community Plan 29
Local Permit Approvals 29
7. Utilities ................................................................................................................................... 31
Water System – District of Mackenzie 31
Water System – Village of McBride 31
5
Water System – Village of Valemount 31
Water System – City of Prince George 32
Waste Water System – District of Mackenzie 32
Waste Water System – Village of McBride 33
Waste Water System – City of Prince George 33
Waste Water System – Valemount 33
Landfill and Waste Management 34
Licensed Hazardous Materials Disposal 35
Electric Power 35
Natural Gas 38
Telecommunications 39
8. Business Support Services ........................................................................................................ 40
9. Government ............................................................................................................................ 41
Regional District 41
Municipal Government 41
Provincial 42
Provincial Government Representation 42
Federal Government Representation 43
10. Housing ................................................................................................................................... 44
Housing Characteristics 44
Average Housing Values 44
11. Taxation rates ......................................................................................................................... 45
Corporate Income Tax 45
Personal Income Tax 45
Sales / Use Tax 45
Sales Tax Rate by Utility 46
Property Tax 47
12. International Resources ........................................................................................................... 49
Investment and Business Support Offices 49
Financial Institutions 51
Employment Assistance 51
13. Quality of Life .......................................................................................................................... 52
Climate 52
Culture 55
Health 60
6
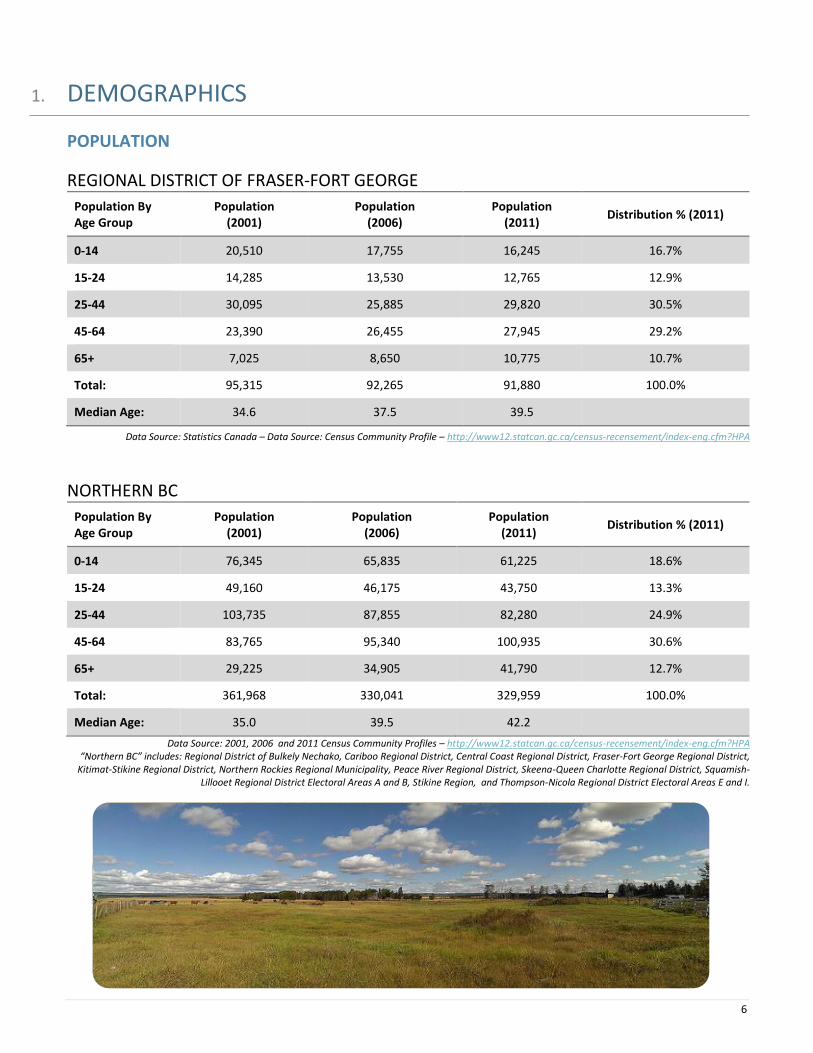
1. DEMOGRAPHICS
POPULATION
REGIONAL DISTRICT OF FRASER-FORT GEORGE
Population By Age Group
Population (2001)
Population (2006)
Population (2011)
Distribution % (2011)
0-14 20,510 17,755 16,245 16.7%
15-24 14,285 13,530 12,765 12.9%
25-44 30,095 25,885 29,820 30.5%
45-64 23,390 26,455 27,945 29.2%
65+ 7,025 8,650 10,775 10.7%
Total: 95,315 92,265 91,880 100.0%
Median Age: 34.6 37.5 39.5
Data Source: Statistics Canada – Data Source: Census Community Profile – http://www12.statcan.gc.ca/census-recensement/index-eng.cfm?HPA
NORTHERN BC
Population By Age Group
Population (2001)
Population (2006)
Population (2011)
Distribution % (2011)
0-14 76,345 65,835 61,225 18.6%
15-24 49,160 46,175 43,750 13.3%
25-44 103,735 87,855 82,280 24.9%
45-64 83,765 95,340 100,935 30.6%
65+ 29,225 34,905 41,790 12.7%
Total: 361,968 330,041 329,959 100.0%
Median Age: 35.0 39.5 42.2
Data Source: 2001, 2006 and 2011 Census Community Profiles – http://www12.statcan.gc.ca/census-recensement/index-eng.cfm?HPA “Northern BC” includes: Regional District of Bulkely Nechako, Cariboo Regional District, Central Coast Regional District, Fraser-Fort George Regional District,
Kitimat-Stikine Regional District, Northern Rockies Regional Municipality, Peace River Regional District, Skeena-Queen Charlotte Regional District, Squamish-Lillooet Regional District Electoral Areas A and B, Stikine Region, and Thompson-Nicola Regional District Electoral Areas E and I.
7
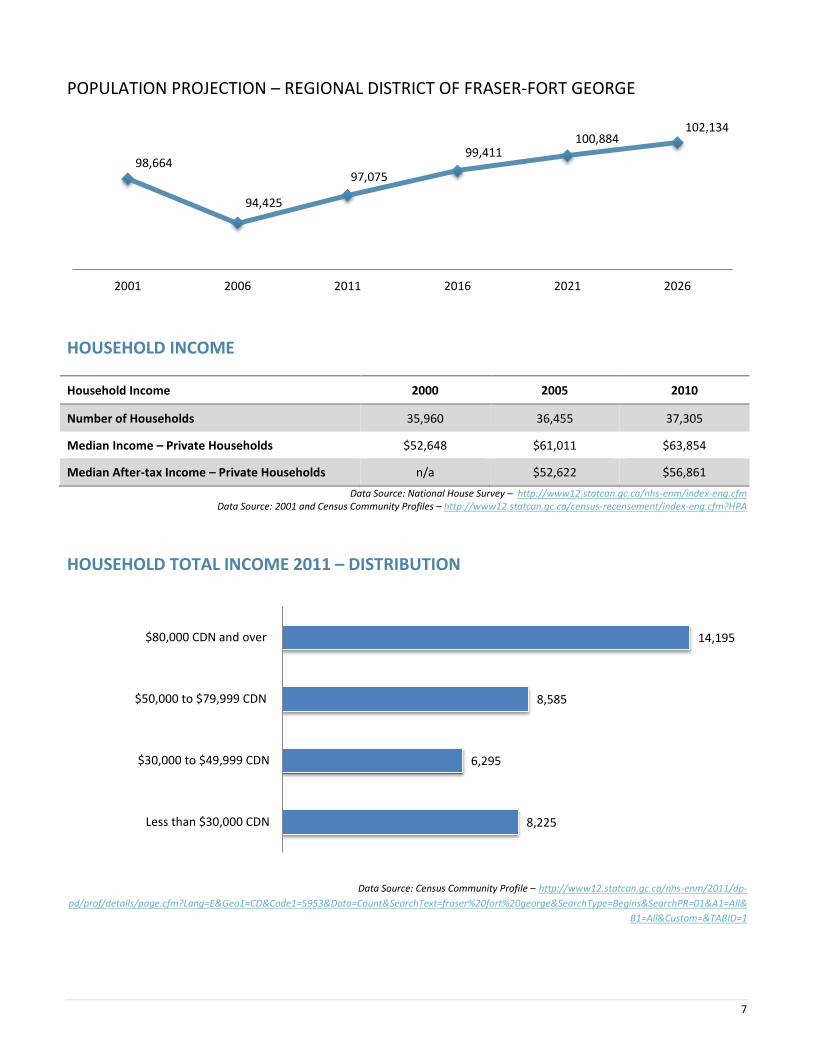
98,664
94,425
97,075
99,411 100,884
102,134
2001 2006 2011 2016 2021 2026
POPULATION PROJECTION – REGIONAL DISTRICT OF FRASER-FORT GEORGE
HOUSEHOLD INCOME
Household Income 2000 2005 2010
Number of Households 35,960 36,455 37,305
Median Income – Private Households $52,648 $61,011 $63,854
Median After-tax Income – Private Households n/a $52,622 $56,861
Data Source: National House Survey – http://www12.statcan.gc.ca/nhs-enm/index-eng.cfm Data Source: 2001 and Census Community Profiles – http://www12.statcan.gc.ca/census-recensement/index-eng.cfm?HPA
HOUSEHOLD TOTAL INCOME 2011 – DISTRIBUTION
Data Source: Census Community Profile – http://www12.statcan.gc.ca/nhs-enm/2011/dp-
pd/prof/details/page.cfm?Lang=E&Geo1=CD&Code1=5953&Data=Count&SearchText=fraser%20fort%20george&SearchType=Begins&SearchPR=01&A1=All&
B1=All&Custom=&TABID=1
8,225
6,295
8,585
14,195
Less than $30,000 CDN
$30,000 to $49,999 CDN
$50,000 to $79,999 CDN
$80,000 CDN and over
8
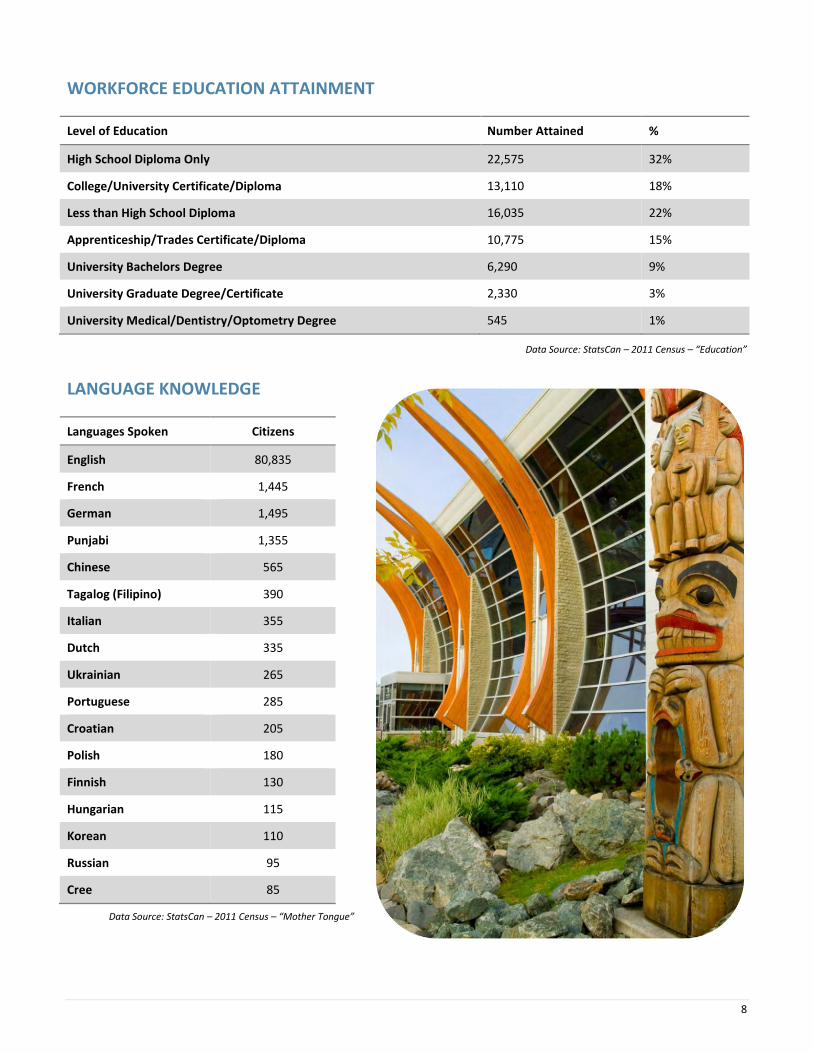
WORKFORCE EDUCATION ATTAINMENT
Level of Education Number Attained %
High School Diploma Only 22,575 32%
College/University Certificate/Diploma 13,110 18%
Less than High School Diploma 16,035 22%
Apprenticeship/Trades Certificate/Diploma 10,775 15%
University Bachelors Degree 6,290 9%
University Graduate Degree/Certificate 2,330 3%
University Medical/Dentistry/Optometry Degree 545 1%
Data Source: StatsCan – 2011 Census – “Education”
LANGUAGE KNOWLEDGE
Data Source: StatsCan – 2011 Census – “Mother Tongue”
Languages Spoken Citizens
English 80,835
French 1,445
German 1,495
Punjabi 1,355
Chinese 565
Tagalog (Filipino) 390
Italian 355
Dutch 335
Ukrainian 265
Portuguese 285
Croatian 205
Polish 180
Finnish 130
Hungarian 115
Korean 110
Russian 95
Cree 85
9
2. LABOUR FORCE
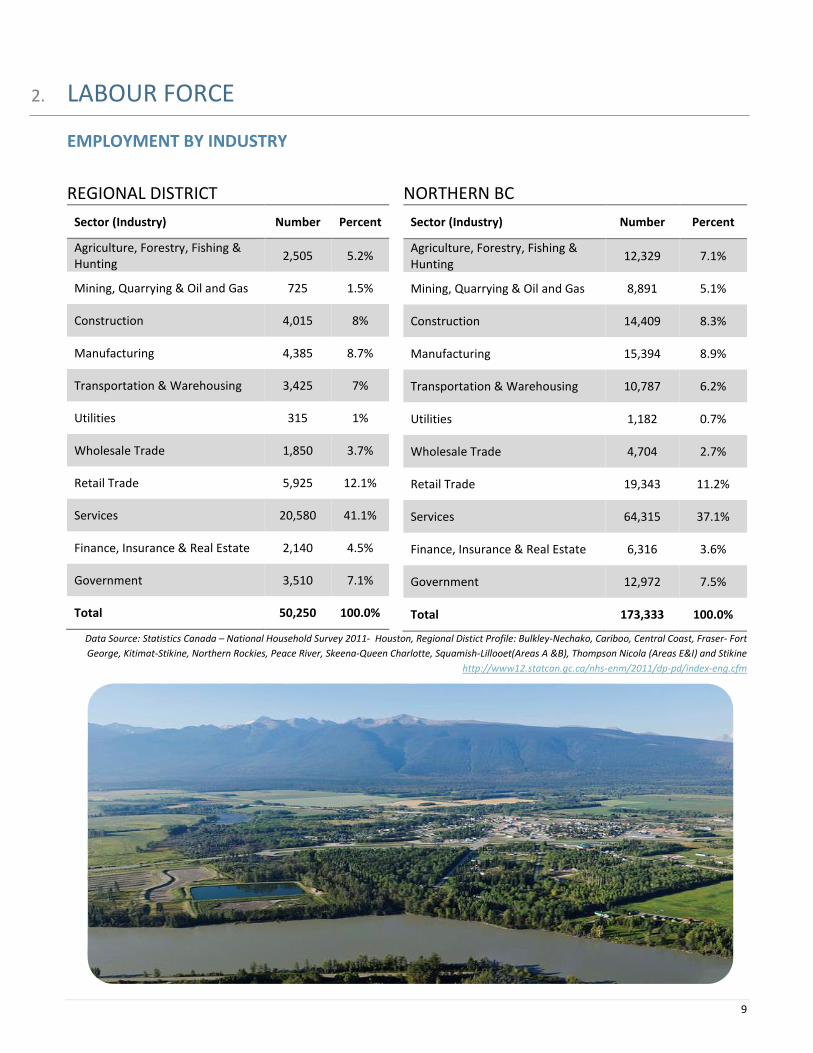
EMPLOYMENT BY INDUSTRY
REGIONAL DISTRICT
Sector (Industry) Number Percent
Agriculture, Forestry, Fishing & Hunting
2,505 5.2%
Mining, Quarrying & Oil and Gas 725 1.5%
Construction 4,015 8%
Manufacturing 4,385 8.7%
Transportation & Warehousing 3,425 7%
Utilities 315 1%
Wholesale Trade 1,850 3.7%
Retail Trade 5,925 12.1%
Services 20,580 41.1%
Finance, Insurance & Real Estate 2,140 4.5%
Government 3,510 7.1%
Total 50,250 100.0%
NORTHERN BC
Sector (Industry) Number Percent
Agriculture, Forestry, Fishing & Hunting
12,329 7.1%
Mining, Quarrying & Oil and Gas 8,891 5.1%
Construction 14,409 8.3%
Manufacturing 15,394 8.9%
Transportation & Warehousing 10,787 6.2%
Utilities 1,182 0.7%
Wholesale Trade 4,704 2.7%
Retail Trade 19,343 11.2%
Services 64,315 37.1%
Finance, Insurance & Real Estate 6,316 3.6%
Government 12,972 7.5%
Total 173,333 100.0%
Data Source: Statistics Canada – National Household Survey 2011- Houston, Regional Distict Profile: Bulkley-Nechako, Cariboo, Central Coast, Fraser- Fort
George, Kitimat-Stikine, Northern Rockies, Peace River, Skeena-Queen Charlotte, Squamish-Lillooet(Areas A &B), Thompson Nicola (Areas E&I) and Stikine
http://www12.statcan.gc.ca/nhs-enm/2011/dp-pd/index-eng.cfm
10
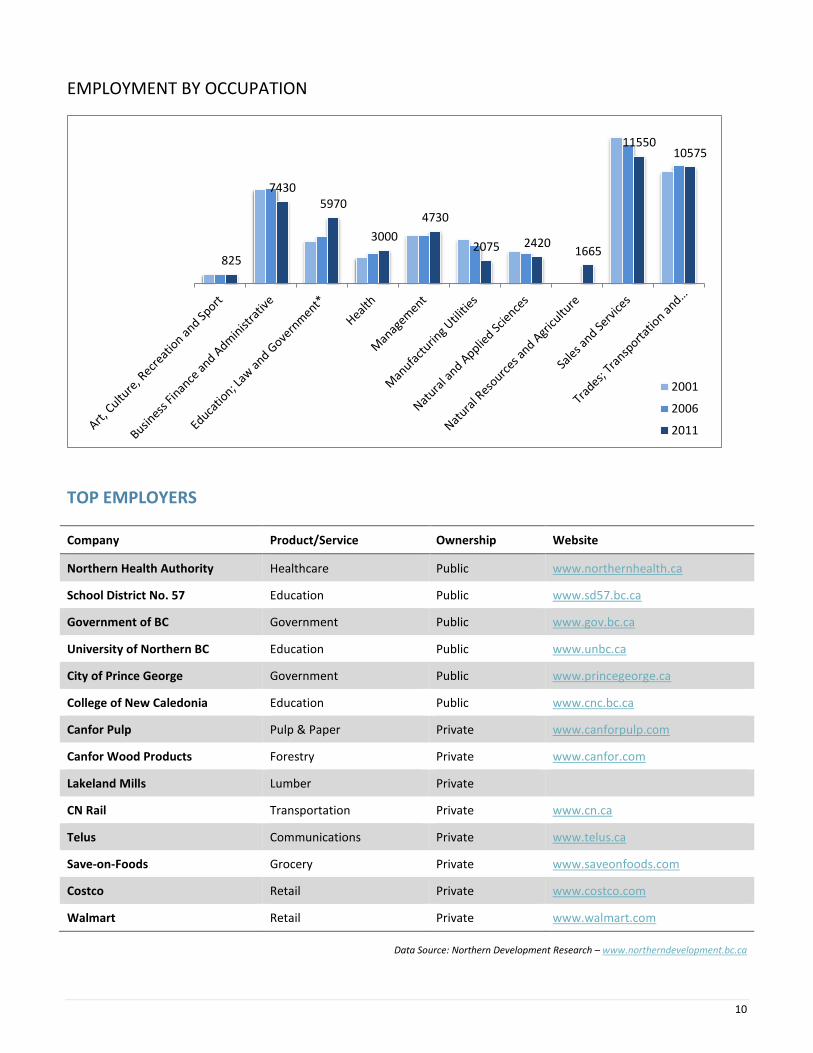
EMPLOYMENT BY OCCUPATION
TOP EMPLOYERS
Company Product/Service Ownership Website
Northern Health Authority Healthcare Public www.northernhealth.ca
School District No. 57 Education Public www.sd57.bc.ca
Government of BC Government Public www.gov.bc.ca
University of Northern BC Education Public www.unbc.ca
City of Prince George Government Public www.princegeorge.ca
College of New Caledonia Education Public www.cnc.bc.ca
Canfor Pulp Pulp & Paper Private www.canforpulp.com
Canfor Wood Products Forestry Private www.canfor.com
Lakeland Mills Lumber Private
CN Rail Transportation Private www.cn.ca
Telus Communications Private www.telus.ca
Save-on-Foods Grocery Private www.saveonfoods.com
Costco Retail Private www.costco.com
Walmart Retail Private www.walmart.com
Data Source: Northern Development Research – www.northerndevelopment.bc.ca
825
74305970
3000
4730
2075 24201665
1155010575
2001
2006
2011
11
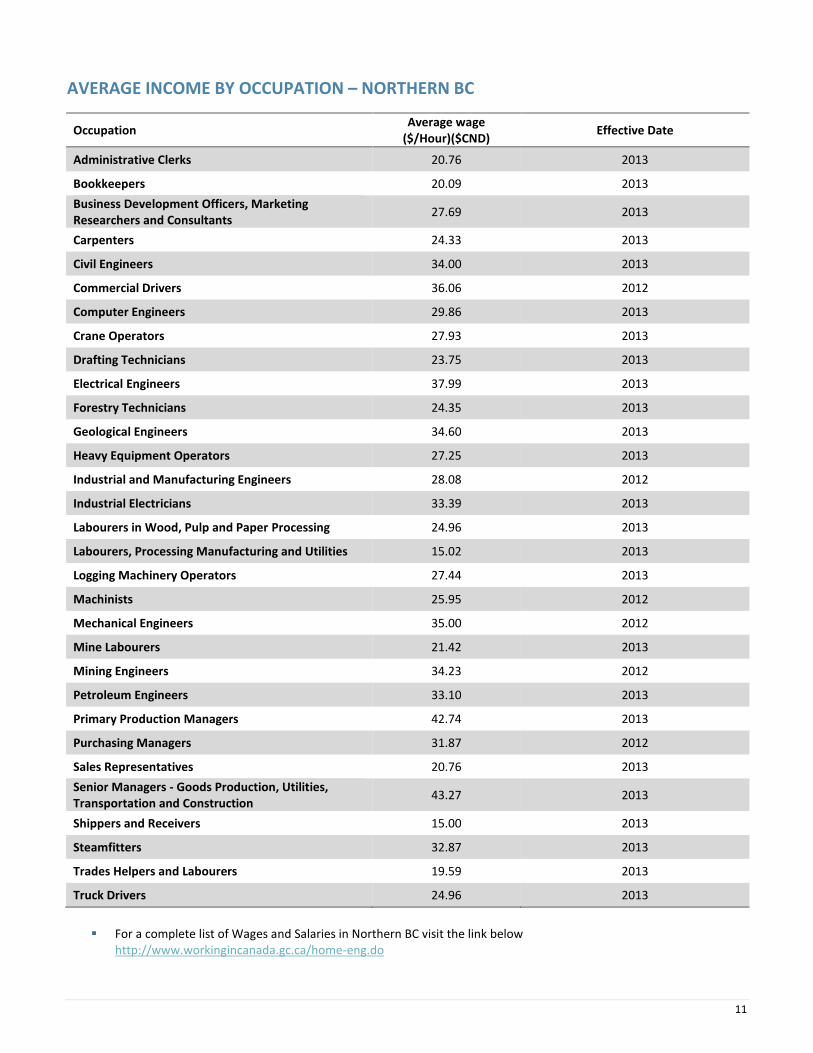
AVERAGE INCOME BY OCCUPATION – NORTHERN BC
Occupation Average wage
($/Hour)($CND) Effective Date
Administrative Clerks 20.76 2013
Bookkeepers 20.09 2013
Business Development Officers, Marketing Researchers and Consultants
27.69 2013
Carpenters 24.33 2013
Civil Engineers 34.00 2013
Commercial Drivers 36.06 2012
Computer Engineers 29.86 2013
Crane Operators 27.93 2013
Drafting Technicians 23.75 2013
Electrical Engineers 37.99 2013
Forestry Technicians 24.35 2013
Geological Engineers 34.60 2013
Heavy Equipment Operators 27.25 2013
Industrial and Manufacturing Engineers 28.08 2012
Industrial Electricians 33.39 2013
Labourers in Wood, Pulp and Paper Processing 24.96 2013
Labourers, Processing Manufacturing and Utilities 15.02 2013
Logging Machinery Operators 27.44 2013
Machinists 25.95 2012
Mechanical Engineers 35.00 2012
Mine Labourers 21.42 2013
Mining Engineers 34.23 2012
Petroleum Engineers 33.10 2013
Primary Production Managers 42.74 2013
Purchasing Managers 31.87 2012
Sales Representatives 20.76 2013
Senior Managers - Goods Production, Utilities, Transportation and Construction
43.27 2013
Shippers and Receivers 15.00 2013
Steamfitters 32.87 2013
Trades Helpers and Labourers 19.59 2013
Truck Drivers 24.96 2013
For a complete list of Wages and Salaries in Northern BC visit the link below
http://www.workingincanada.gc.ca/home-eng.do
12
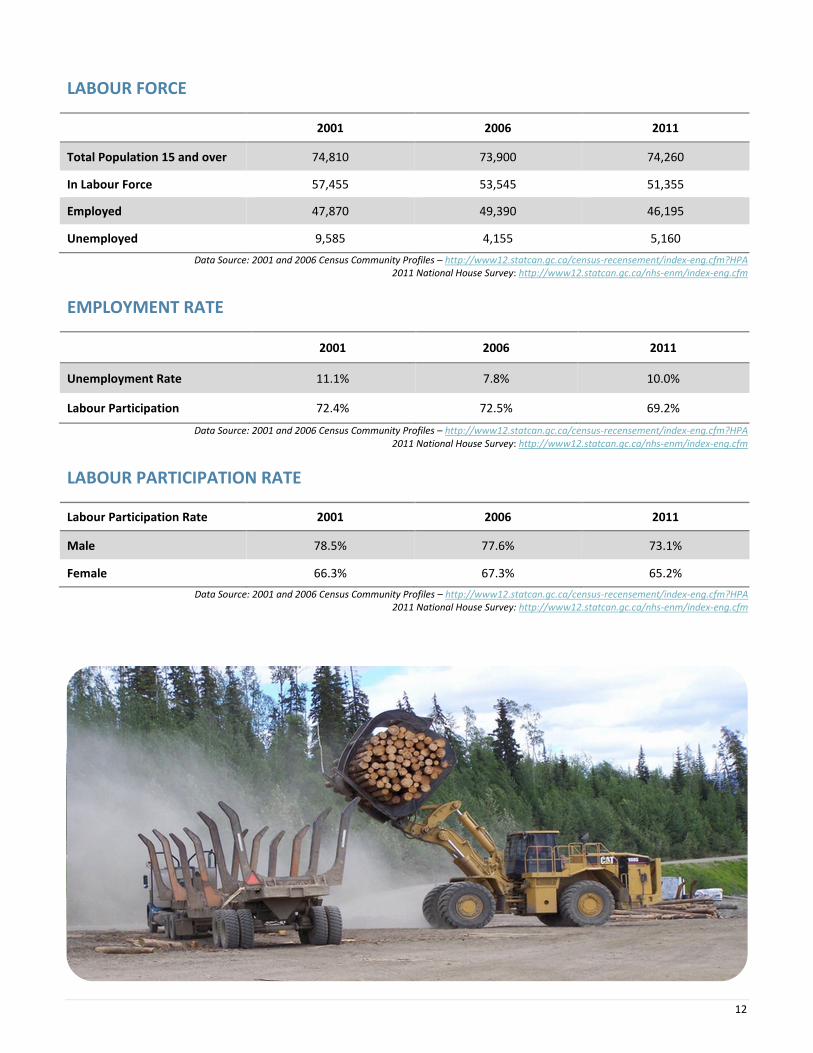
LABOUR FORCE
2001 2006 2011
Total Population 15 and over 74,810 73,900 74,260
In Labour Force 57,455 53,545 51,355
Employed 47,870 49,390 46,195
Unemployed 9,585 4,155 5,160
Data Source: 2001 and 2006 Census Community Profiles – http://www12.statcan.gc.ca/census-recensement/index-eng.cfm?HPA 2011 National House Survey: http://www12.statcan.gc.ca/nhs-enm/index-eng.cfm
EMPLOYMENT RATE
2001 2006 2011
Unemployment Rate 11.1% 7.8% 10.0%
Labour Participation 72.4% 72.5% 69.2%
Data Source: 2001 and 2006 Census Community Profiles – http://www12.statcan.gc.ca/census-recensement/index-eng.cfm?HPA 2011 National House Survey: http://www12.statcan.gc.ca/nhs-enm/index-eng.cfm
LABOUR PARTICIPATION RATE
Labour Participation Rate 2001 2006 2011
Male 78.5% 77.6% 73.1%
Female 66.3% 67.3% 65.2%
Data Source: 2001 and 2006 Census Community Profiles – http://www12.statcan.gc.ca/census-recensement/index-eng.cfm?HPA 2011 National House Survey: http://www12.statcan.gc.ca/nhs-enm/index-eng.cfm
13
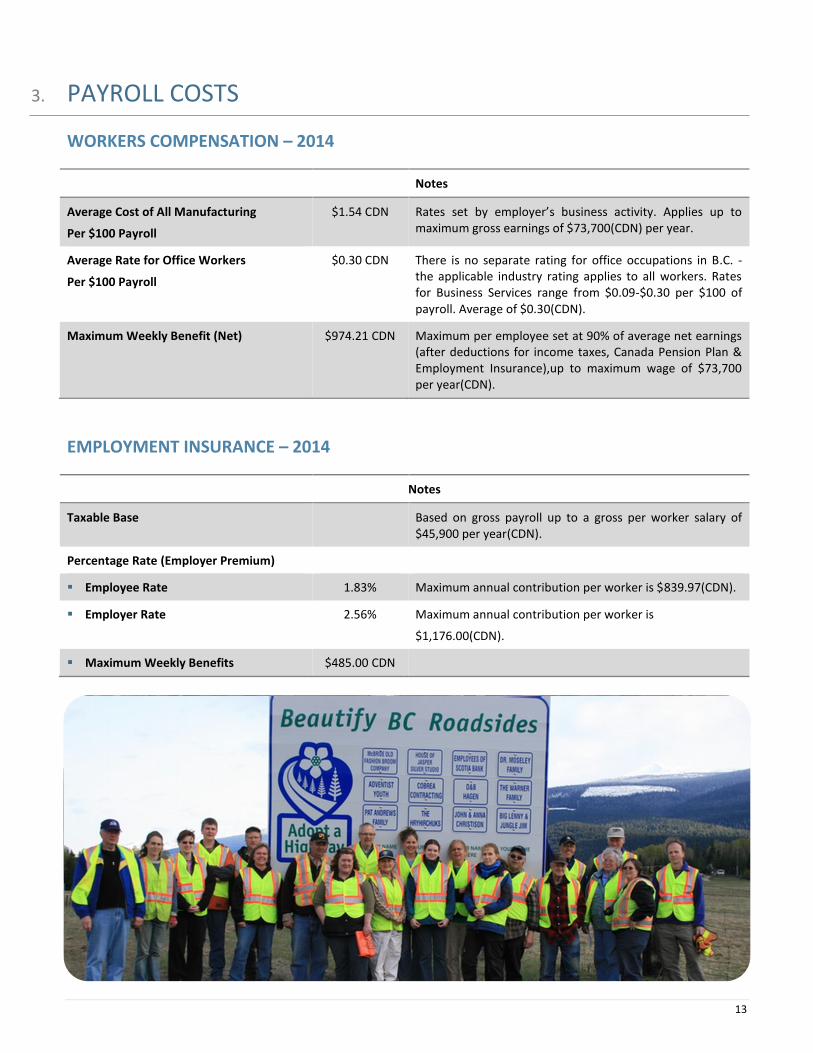
3. PAYROLL COSTS
WORKERS COMPENSATION – 2014
Notes
Average Cost of All Manufacturing
Per $100 Payroll
$1.54 CDN Rates set by employer’s business activity. Applies up to maximum gross earnings of $73,700(CDN) per year.
Average Rate for Office Workers
Per $100 Payroll
$0.30 CDN There is no separate rating for office occupations in B.C. - the applicable industry rating applies to all workers. Rates for Business Services range from $0.09-$0.30 per $100 of payroll. Average of $0.30(CDN).
Maximum Weekly Benefit (Net)
$974.21 CDN Maximum per employee set at 90% of average net earnings (after deductions for income taxes, Canada Pension Plan & Employment Insurance),up to maximum wage of $73,700 per year(CDN).
EMPLOYMENT INSURANCE – 2014
Notes
Taxable Base Based on gross payroll up to a gross per worker salary of $45,900 per year(CDN).
Percentage Rate (Employer Premium)
Employee Rate 1.83% Maximum annual contribution per worker is $839.97(CDN).
Employer Rate 2.56% Maximum annual contribution per worker is
$1,176.00(CDN).
Maximum Weekly Benefits $485.00 CDN
14
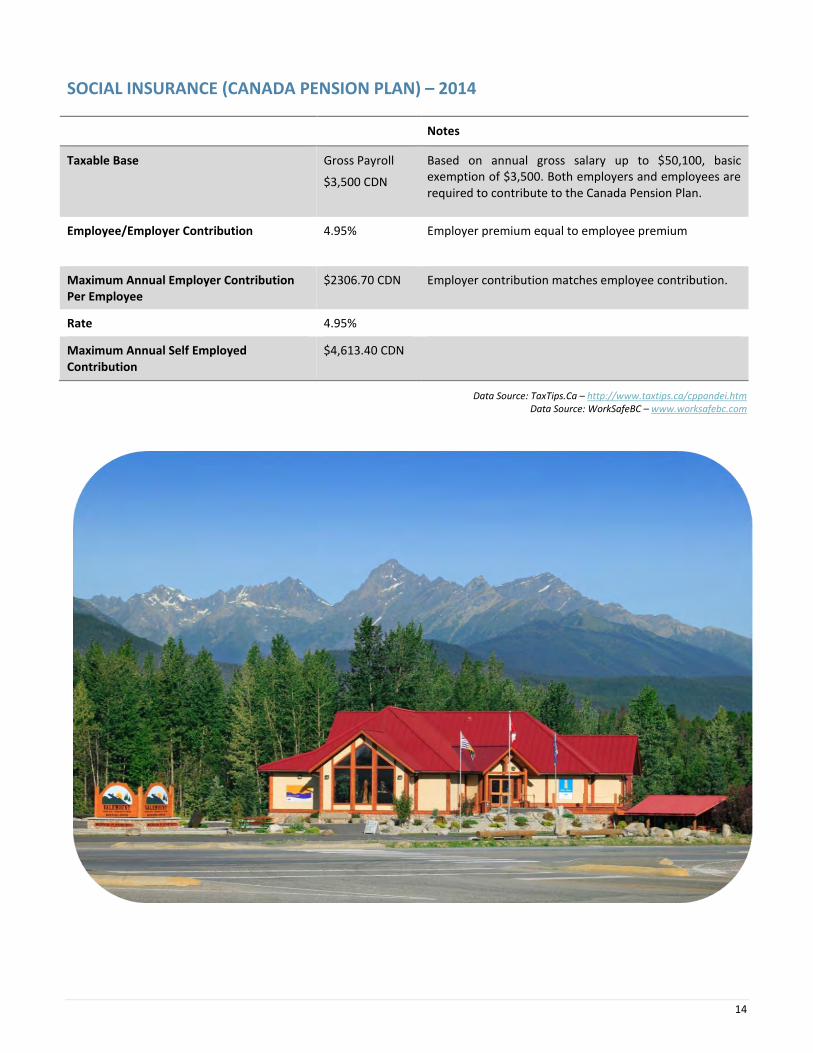
SOCIAL INSURANCE (CANADA PENSION PLAN) – 2014
Notes
Taxable Base
Gross Payroll
$3,500 CDN
Based on annual gross salary up to $50,100, basic exemption of $3,500. Both employers and employees are required to contribute to the Canada Pension Plan.
Employee/Employer Contribution 4.95% Employer premium equal to employee premium
Maximum Annual Employer Contribution Per Employee
$2306.70 CDN Employer contribution matches employee contribution.
Rate 4.95%
Maximum Annual Self Employed Contribution
$4,613.40 CDN
Data Source: TaxTips.Ca – http://www.taxtips.ca/cppandei.htm Data Source: WorkSafeBC – www.worksafebc.com
15
4. HIGHER EDUCATION
FOUR YEAR INSTITUTIONS
Institution University of Northern British Columbia
Campus/Address Prince George Main Campus 3333 University Way, Prince George, BC V2N 4Z9 Tel: 250-960-5555
Other Campuses Terrace, Fort St. John, Quesnel, Prince Rupert
Website www.unbc.ca
Driving Distance from Community Located in Community
Enrolment (2012/13) (All Campuses): 4,152
Institution College of New Caledonia
Campus/Address 3330 22nd Avenue Prince George, BC V2N 1P8 Tel: 250-562-2131
Other Campuses Valemount, Burns Lake, Fort St. James, Mackenzie, Quesnel, Vanderhoof
Website www.cnc.bc.ca
Driving Distance from Community Located in Community
Enrolment (2012/13) (All Campuses): 8,930
Data Source: Northern Development Research – www.northerndevelopment.bc.ca
TRAINING SERVICES
Institution Category Telephone Number Address
John A. Brink & Technology Centre
Trades 250-561-5804 1727 W. Central Avenue Prince George, BC V2N 1P6
Valemount Learning Centre Employment Assistance 250-566-4601 99 Gorse Street, Box 789 Valemount, BC V0E 2Z0
ABC Safety & First Aid Training Services
First Aid 250-960-1112 220 – 1990 Ogilvie Street Prince George, BC V2N 1X1
PTP ASEP Training Society Employment Assistance 250-561-1115 300 – 1460 6th Avenue Prince George, BC V2L 3N2
Data Source: Northern Development Research – www.northerndevelopment.bc.ca
16
5. TRANSPORTATION
MAJOR TRANSPORTION ROUTES
PACIFIC GATEWAY
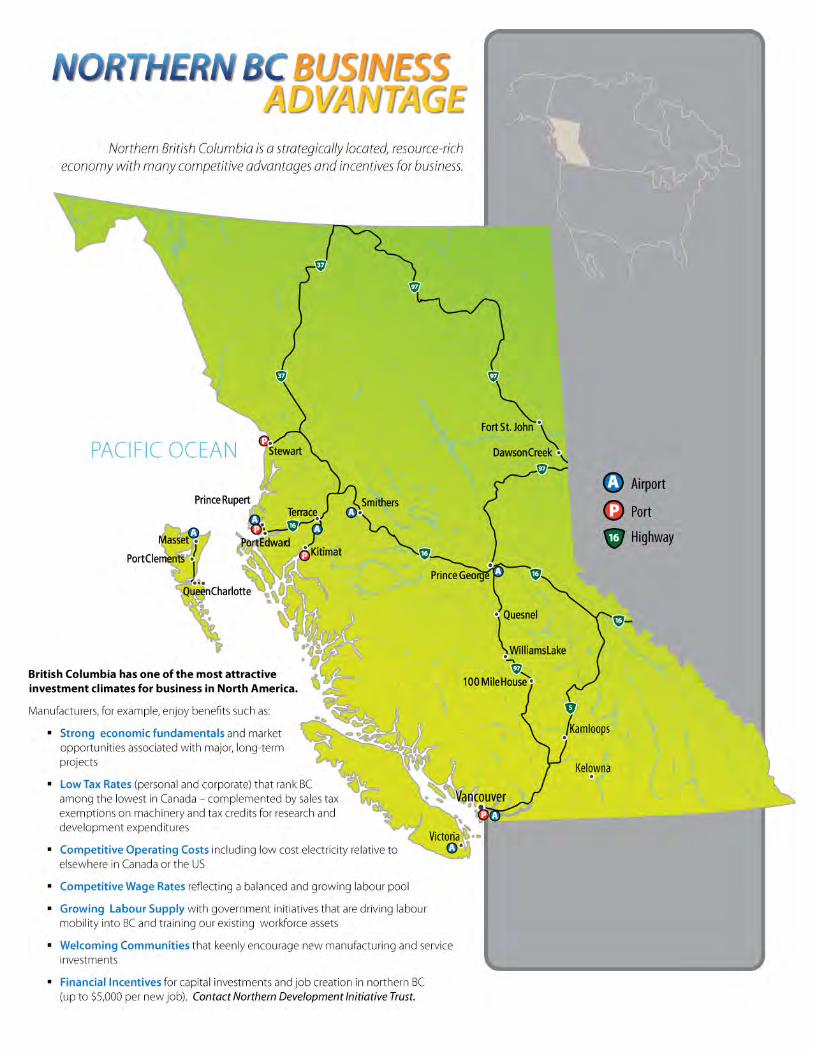
British Columbia’s ports in Vancouver, Kitimat, Stewart and Prince Rupert are Asia’s closest ports of entry on the west coast of North America, up to 58 hours closer than the ports of Los Angeles and Long Beach. Canadian ports and airports are seamlessly integrated with road and rail connections to all major U.S. economic centers. British Columbia is the only gateway on the west coast of the Americas served by three transcontinental railways. Today, Canada’s Pacific Gateway is an integrated, secure, reliable transportation network that includes world-class airports, seaports, railways, roadways and border crossings, bringing Canada and the North American market to Asia and the world. Canada’s Pacific Gateway, through British Columbia’s ports in Vancouver, Kitimat, Stewart and Prince Rupert, offers Asian shippers the most direct route between Asia and North America. Canada’s Pacific Gateway is a strong commitment by government and industry partners to make British Columbia’s ports the preferred gateway for Asia-Pacific trade, with the most competitive port system and supply chain on the west coast of the Americas. This commitment builds on Canada’s longstanding and strong cultural and economic ties with Asia. In the emerging new global economy, Canada’s Pacific Gateway is a gateway to the future.
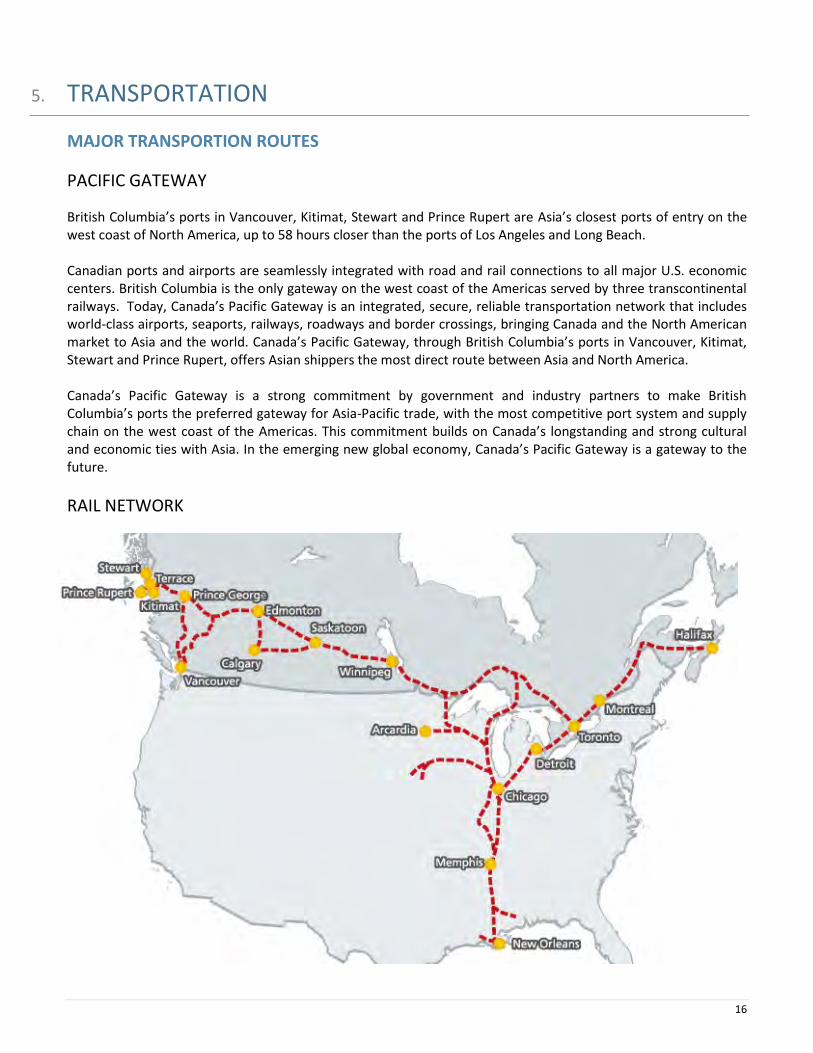
RAIL NETWORK
17
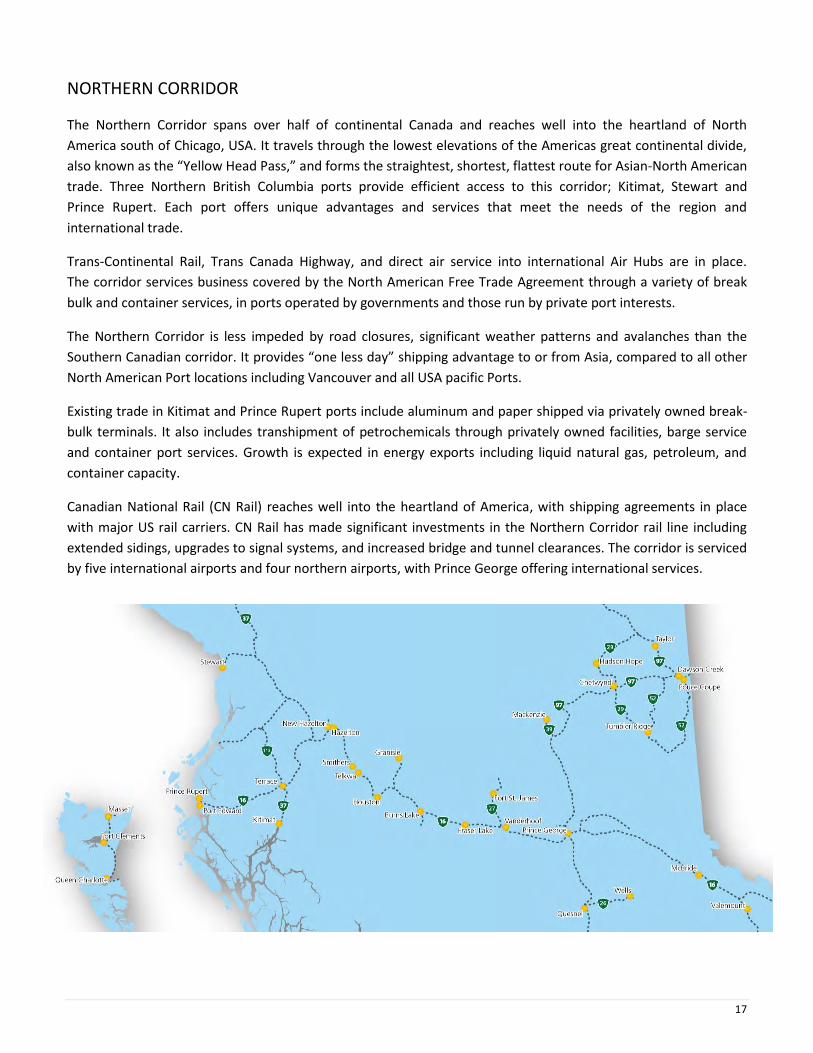
NORTHERN CORRIDOR
The Northern Corridor spans over half of continental Canada and reaches well into the heartland of North
America south of Chicago, USA. It travels through the lowest elevations of the Americas great continental divide,
also known as the “Yellow Head Pass,” and forms the straightest, shortest, flattest route for Asian-North American
trade. Three Northern British Columbia ports provide efficient access to this corridor; Kitimat, Stewart and
Prince Rupert. Each port offers unique advantages and services that meet the needs of the region and
international trade.
Trans-Continental Rail, Trans Canada Highway, and direct air service into international Air Hubs are in place.
The corridor services business covered by the North American Free Trade Agreement through a variety of break
bulk and container services, in ports operated by governments and those run by private port interests.
The Northern Corridor is less impeded by road closures, significant weather patterns and avalanches than the
Southern Canadian corridor. It provides “one less day” shipping advantage to or from Asia, compared to all other
North American Port locations including Vancouver and all USA pacific Ports.
Existing trade in Kitimat and Prince Rupert ports include aluminum and paper shipped via privately owned break-
bulk terminals. It also includes transhipment of petrochemicals through privately owned facilities, barge service
and container port services. Growth is expected in energy exports including liquid natural gas, petroleum, and
container capacity.
Canadian National Rail (CN Rail) reaches well into the heartland of America, with shipping agreements in place
with major US rail carriers. CN Rail has made significant investments in the Northern Corridor rail line including
extended sidings, upgrades to signal systems, and increased bridge and tunnel clearances. The corridor is serviced
by five international airports and four northern airports, with Prince George offering international services.
18
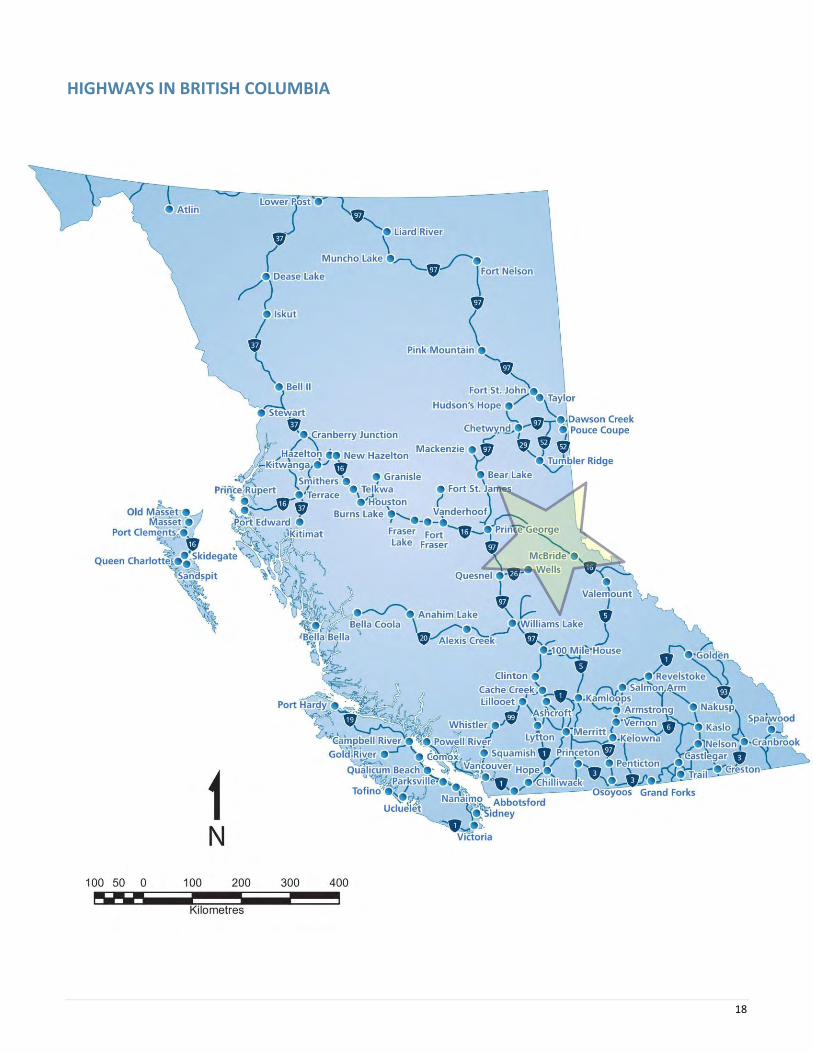
HIGHWAYS IN BRITISH COLUMBIA
19
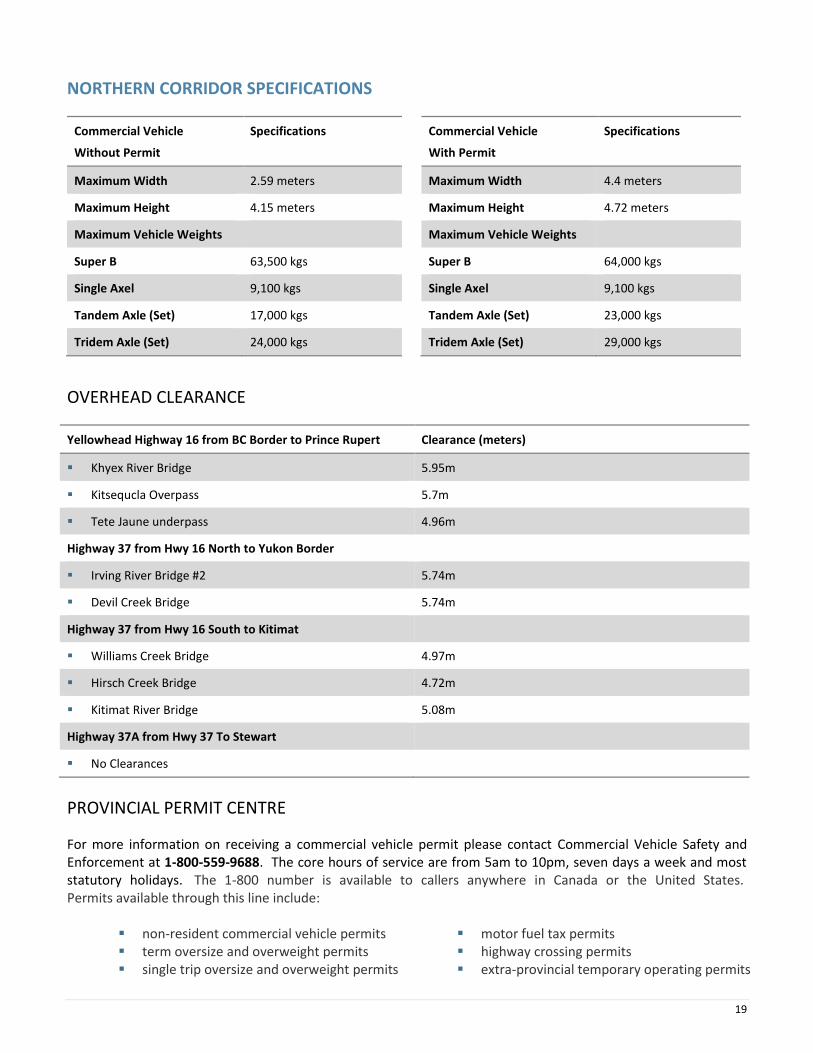
NORTHERN CORRIDOR SPECIFICATIONS
Commercial Vehicle
Without Permit
Specifications
Maximum Width 2.59 meters
Maximum Height 4.15 meters
Maximum Vehicle Weights
Super B 63,500 kgs
Single Axel 9,100 kgs
Tandem Axle (Set) 17,000 kgs
Tridem Axle (Set) 24,000 kgs
Commercial Vehicle
With Permit
Specifications
Maximum Width 4.4 meters
Maximum Height 4.72 meters
Maximum Vehicle Weights
Super B 64,000 kgs
Single Axel 9,100 kgs
Tandem Axle (Set) 23,000 kgs
Tridem Axle (Set) 29,000 kgs
OVERHEAD CLEARANCE
PROVINCIAL PERMIT CENTRE
For more information on receiving a commercial vehicle permit please contact Commercial Vehicle Safety and Enforcement at 1-800-559-9688. The core hours of service are from 5am to 10pm, seven days a week and most statutory holidays. The 1-800 number is available to callers anywhere in Canada or the United States. Permits available through this line include:
non-resident commercial vehicle permits term oversize and overweight permits single trip oversize and overweight permits
motor fuel tax permits highway crossing permits extra-provincial temporary operating permits
Yellowhead Highway 16 from BC Border to Prince Rupert Clearance (meters)
Khyex River Bridge 5.95m
Kitsequcla Overpass 5.7m
Tete Jaune underpass 4.96m
Highway 37 from Hwy 16 North to Yukon Border
Irving River Bridge #2 5.74m
Devil Creek Bridge 5.74m
Highway 37 from Hwy 16 South to Kitimat
Williams Creek Bridge 4.97m
Hirsch Creek Bridge 4.72m
Kitimat River Bridge 5.08m
Highway 37A from Hwy 37 To Stewart
No Clearances
20
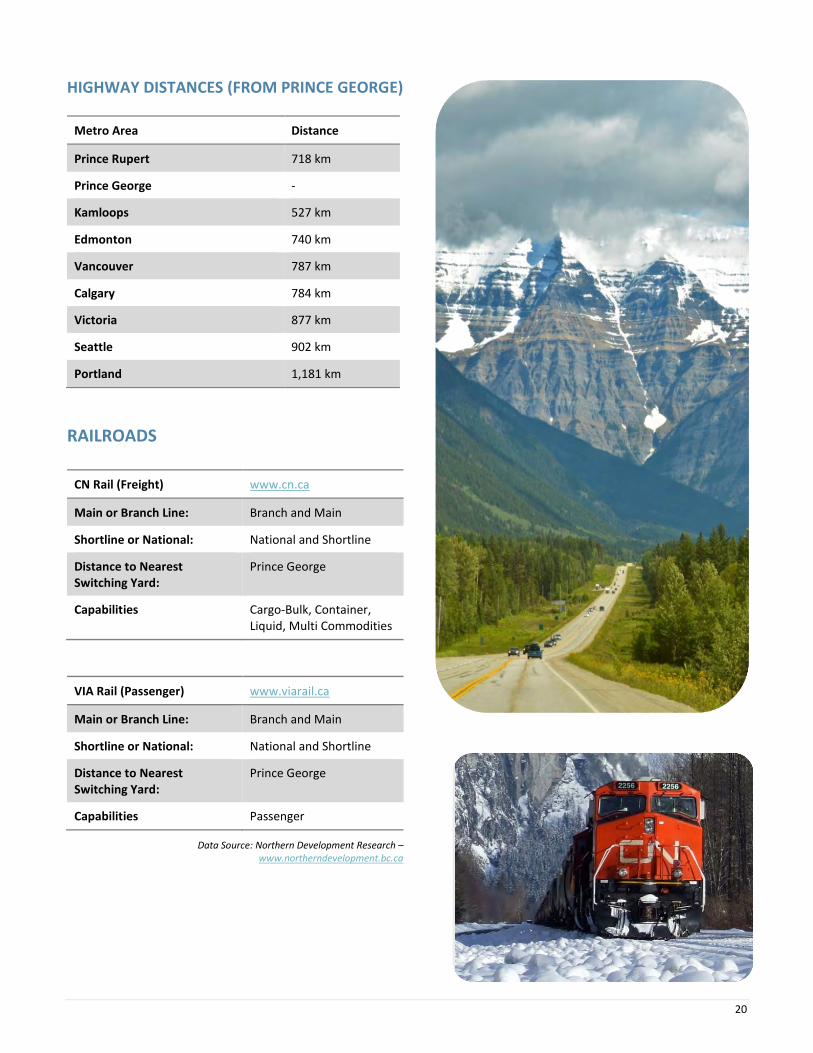
HIGHWAY DISTANCES (FROM PRINCE GEORGE)
RAILROADS
CN Rail (Freight) www.cn.ca
Main or Branch Line: Branch and Main
Shortline or National: National and Shortline
Distance to Nearest Switching Yard:
Prince George
Capabilities Cargo-Bulk, Container, Liquid, Multi Commodities
VIA Rail (Passenger) www.viarail.ca
Main or Branch Line: Branch and Main
Shortline or National: National and Shortline
Distance to Nearest Switching Yard:
Prince George
Capabilities Passenger
Data Source: Northern Development Research – www.northerndevelopment.bc.ca
Metro Area Distance
Prince Rupert 718 km
Prince George -
Kamloops 527 km
Edmonton 740 km
Vancouver 787 km
Calgary 784 km
Victoria 877 km
Seattle 902 km
Portland 1,181 km
21
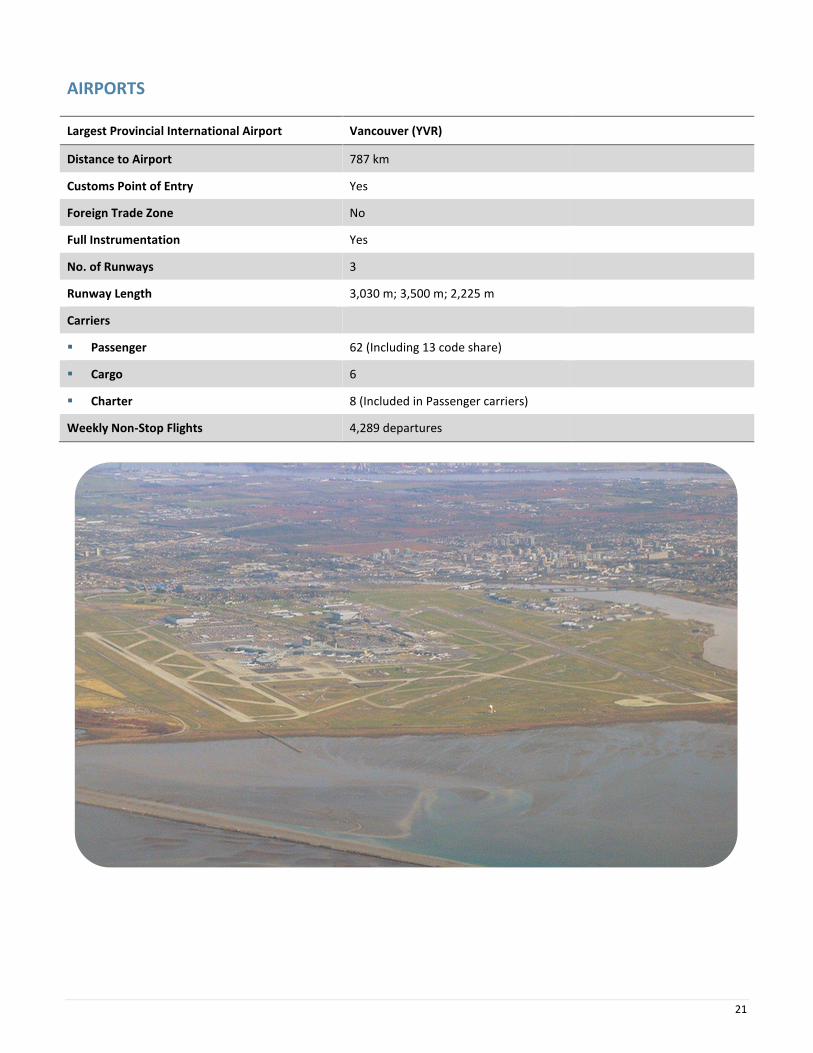
AIRPORTS
Largest Provincial International Airport Vancouver (YVR)
Distance to Airport 787 km
Customs Point of Entry Yes
Foreign Trade Zone No
Full Instrumentation Yes
No. of Runways 3
Runway Length 3,030 m; 3,500 m; 2,225 m
Carriers
Passenger 62 (Including 13 code share)
Cargo 6
Charter 8 (Included in Passenger carriers)
Weekly Non-Stop Flights 4,289 departures
22
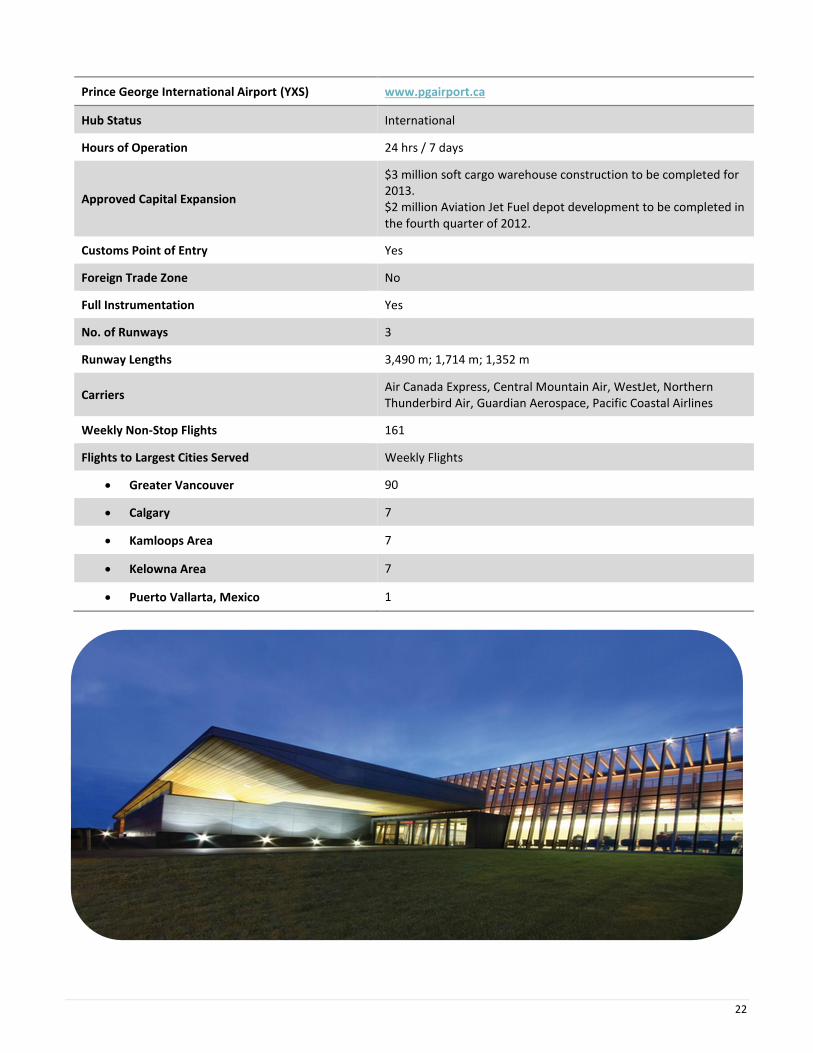
Prince George International Airport (YXS) www.pgairport.ca
Hub Status International
Hours of Operation 24 hrs / 7 days
Approved Capital Expansion
$3 million soft cargo warehouse construction to be completed for 2013. $2 million Aviation Jet Fuel depot development to be completed in the fourth quarter of 2012.
Customs Point of Entry Yes
Foreign Trade Zone No
Full Instrumentation Yes
No. of Runways 3
Runway Lengths 3,490 m; 1,714 m; 1,352 m
Carriers Air Canada Express, Central Mountain Air, WestJet, Northern Thunderbird Air, Guardian Aerospace, Pacific Coastal Airlines
Weekly Non-Stop Flights 161
Flights to Largest Cities Served Weekly Flights
Greater Vancouver 90
Calgary 7
Kamloops Area 7
Kelowna Area 7
Puerto Vallarta, Mexico 1
23
Mackenzie Airport
Hub Status Class C
Hours of Operation 24 hours/7 days
Approved Capital Expansion No
Customs Point of Entry No
Foreign Trade Zone No
Full Instrumentation No
No. of Runways 1
Runway Length 1,585 m
Carriers Northern Thunderbird Air, Pacific Western Helicopters, Yellowhead Helicopters
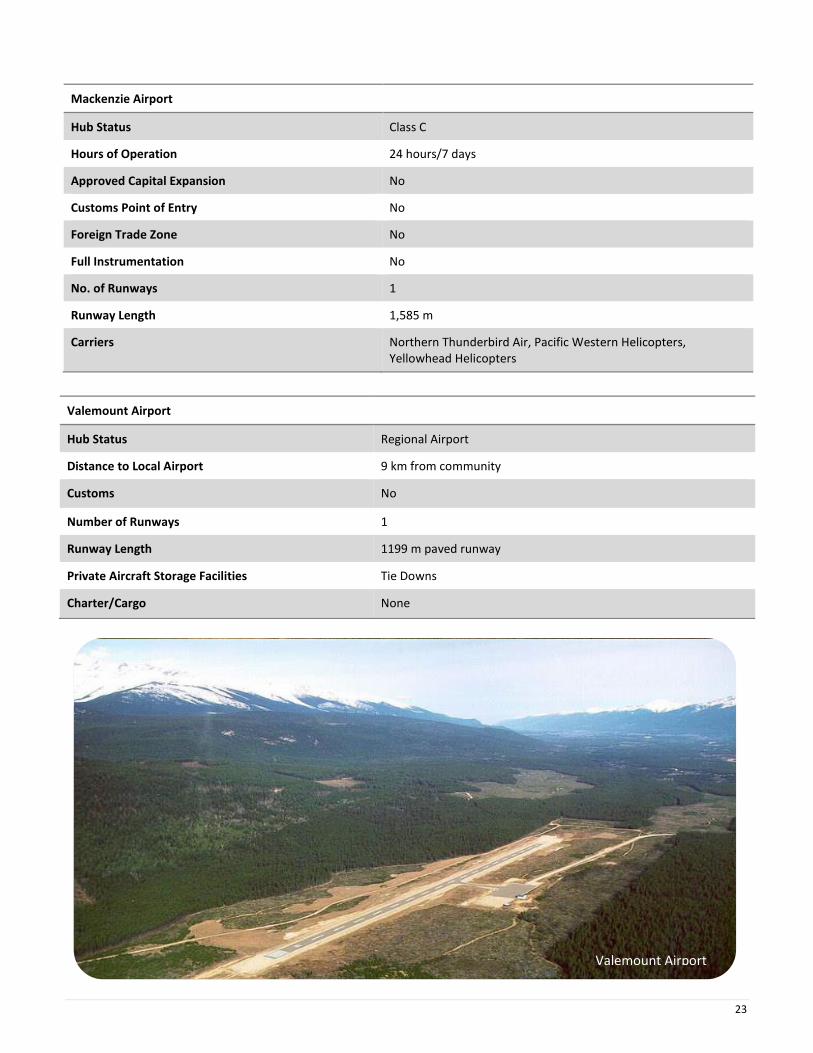
Valemount Airport
Hub Status Regional Airport
Distance to Local Airport 9 km from community
Customs No
Number of Runways 1
Runway Length 1199 m paved runway
Private Aircraft Storage Facilities Tie Downs
Charter/Cargo None
Valemount Airport
24
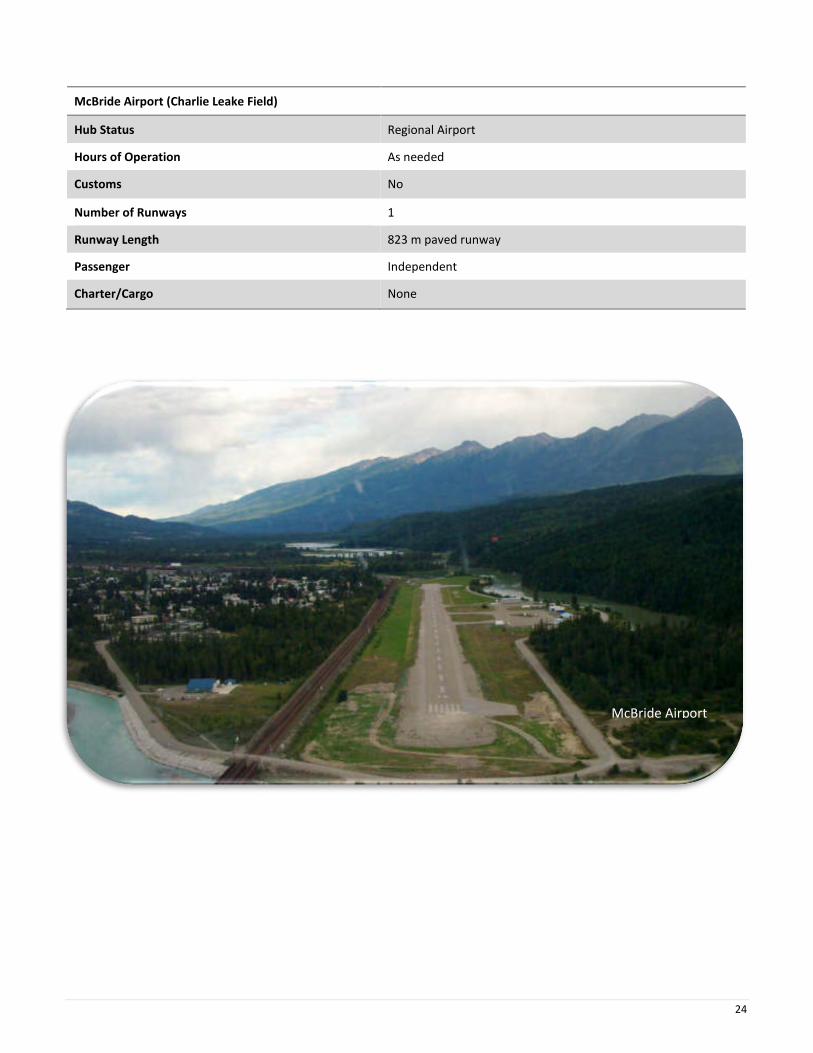
McBride Airport (Charlie Leake Field)
Hub Status Regional Airport
Hours of Operation As needed
Customs No
Number of Runways 1
Runway Length 823 m paved runway
Passenger Independent
Charter/Cargo None
McBride Airport
25
PORTS
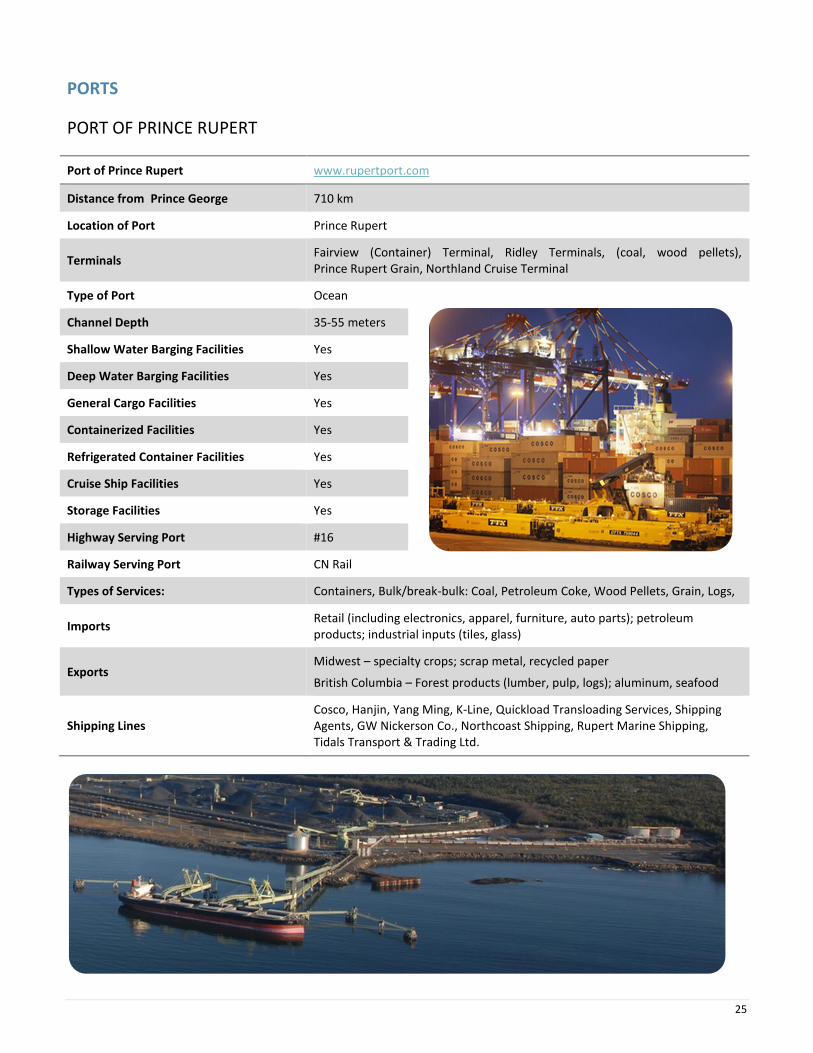
PORT OF PRINCE RUPERT
Port of Prince Rupert www.rupertport.com
Distance from Prince George 710 km
Location of Port Prince Rupert
Terminals Fairview (Container) Terminal, Ridley Terminals, (coal, wood pellets), Prince Rupert Grain, Northland Cruise Terminal
Type of Port Ocean
Channel Depth 35-55 meters
Shallow Water Barging Facilities Yes
Deep Water Barging Facilities Yes
General Cargo Facilities Yes
Containerized Facilities Yes
Refrigerated Container Facilities Yes
Cruise Ship Facilities Yes
Storage Facilities Yes
Highway Serving Port #16
Railway Serving Port CN Rail
Types of Services: Containers, Bulk/break-bulk: Coal, Petroleum Coke, Wood Pellets, Grain, Logs,
Imports Retail (including electronics, apparel, furniture, auto parts); petroleum products; industrial inputs (tiles, glass)
Exports Midwest – specialty crops; scrap metal, recycled paper
British Columbia – Forest products (lumber, pulp, logs); aluminum, seafood
Shipping Lines Cosco, Hanjin, Yang Ming, K-Line, Quickload Transloading Services, Shipping Agents, GW Nickerson Co., Northcoast Shipping, Rupert Marine Shipping, Tidals Transport & Trading Ltd.
26
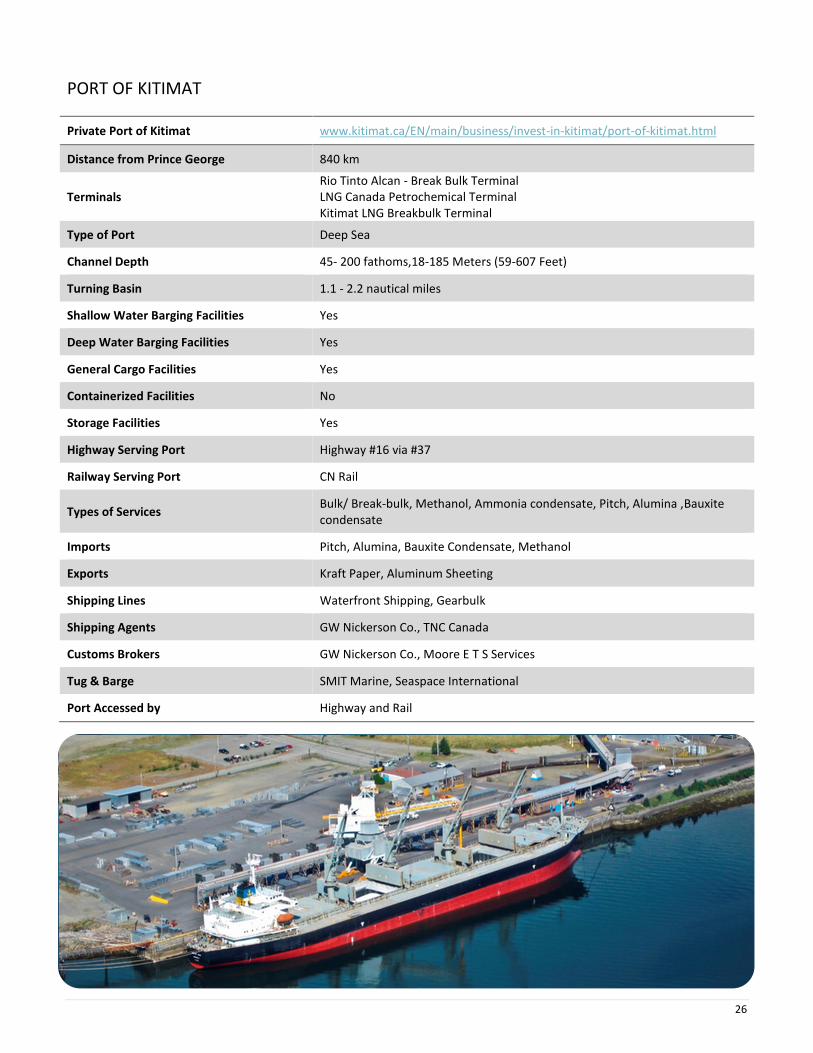
PORT OF KITIMAT
Private Port of Kitimat www.kitimat.ca/EN/main/business/invest-in-kitimat/port-of-kitimat.html
Distance from Prince George 840 km
Terminals Rio Tinto Alcan - Break Bulk Terminal LNG Canada Petrochemical Terminal Kitimat LNG Breakbulk Terminal
Type of Port Deep Sea
Channel Depth 45- 200 fathoms,18-185 Meters (59-607 Feet)
Turning Basin 1.1 - 2.2 nautical miles
Shallow Water Barging Facilities Yes
Deep Water Barging Facilities Yes
General Cargo Facilities Yes
Containerized Facilities No
Storage Facilities Yes
Highway Serving Port Highway #16 via #37
Railway Serving Port CN Rail
Types of Services Bulk/ Break-bulk, Methanol, Ammonia condensate, Pitch, Alumina ,Bauxite condensate
Imports Pitch, Alumina, Bauxite Condensate, Methanol
Exports Kraft Paper, Aluminum Sheeting
Shipping Lines Waterfront Shipping, Gearbulk
Shipping Agents GW Nickerson Co., TNC Canada
Customs Brokers GW Nickerson Co., Moore E T S Services
Tug & Barge SMIT Marine, Seaspace International
Port Accessed by Highway and Rail
27
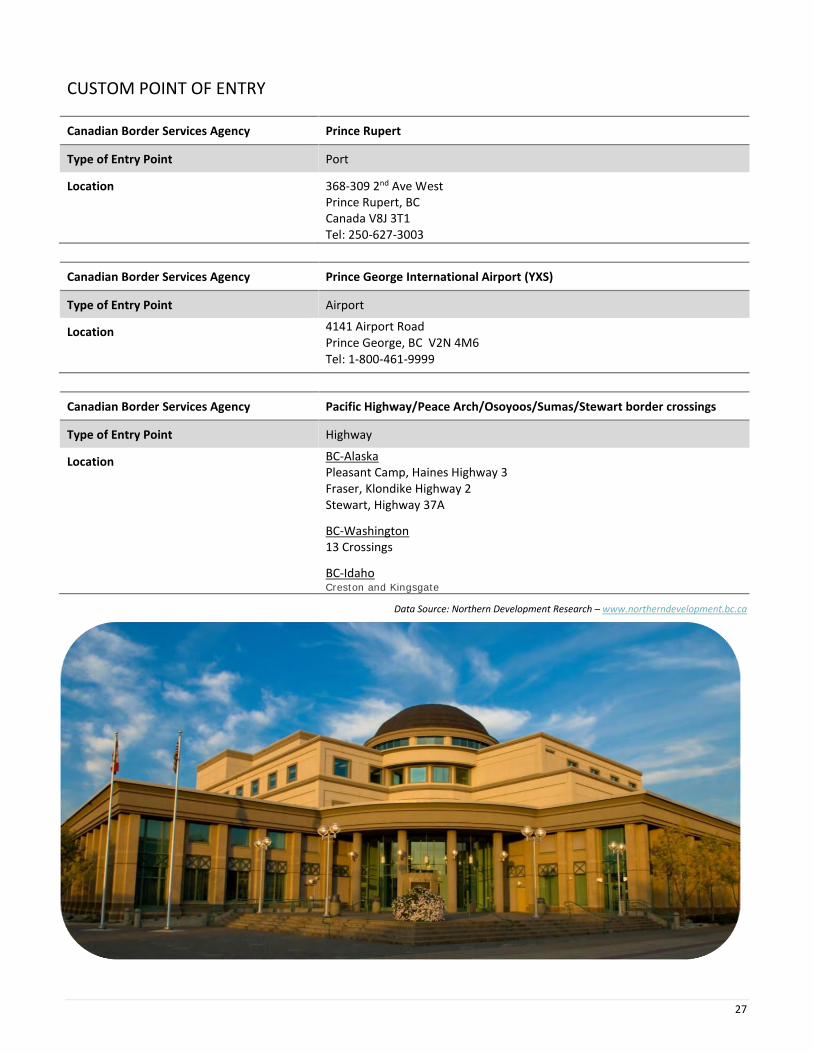
CUSTOM POINT OF ENTRY
Canadian Border Services Agency Prince Rupert
Type of Entry Point Port
Location 368-309 2nd Ave West Prince Rupert, BC Canada V8J 3T1 Tel: 250-627-3003
Canadian Border Services Agency Prince George International Airport (YXS)
Type of Entry Point Airport
Location 4141 Airport Road Prince George, BC V2N 4M6 Tel: 1-800-461-9999
Canadian Border Services Agency Pacific Highway/Peace Arch/Osoyoos/Sumas/Stewart border crossings
Type of Entry Point Highway
Location BC-Alaska Pleasant Camp, Haines Highway 3 Fraser, Klondike Highway 2 Stewart, Highway 37A
BC-Washington 13 Crossings
BC-Idaho Creston and Kingsgate
Data Source: Northern Development Research – www.northerndevelopment.bc.ca
28
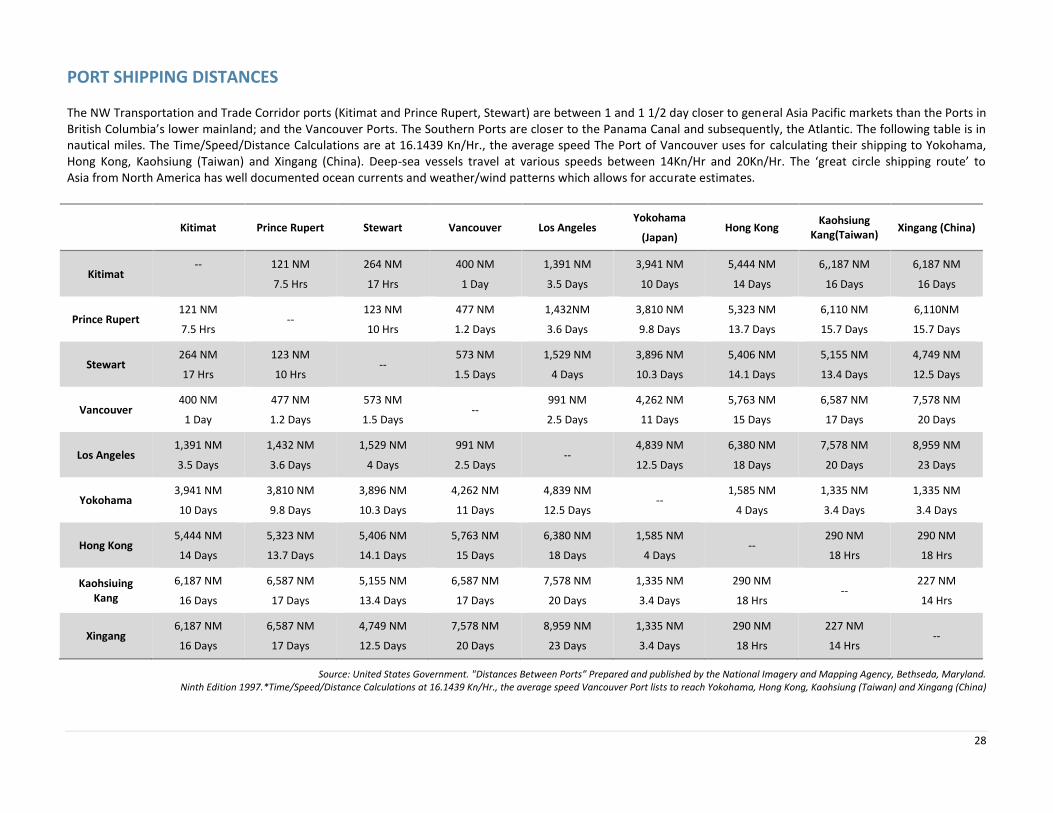
PORT SHIPPING DISTANCES
The NW Transportation and Trade Corridor ports (Kitimat and Prince Rupert, Stewart) are between 1 and 1 1/2 day closer to general Asia Pacific markets than the Ports in British Columbia’s lower mainland; and the Vancouver Ports. The Southern Ports are closer to the Panama Canal and subsequently, the Atlantic. The following table is in nautical miles. The Time/Speed/Distance Calculations are at 16.1439 Kn/Hr., the average speed The Port of Vancouver uses for calculating their shipping to Yokohama, Hong Kong, Kaohsiung (Taiwan) and Xingang (China). Deep-sea vessels travel at various speeds between 14Kn/Hr and 20Kn/Hr. The ‘great circle shipping route’ to Asia from North America has well documented ocean currents and weather/wind patterns which allows for accurate estimates.
Kitimat Prince Rupert Stewart Vancouver Los Angeles Yokohama
(Japan) Hong Kong
Kaohsiung Kang(Taiwan)
Xingang (China)
Kitimat --
121 NM
7.5 Hrs
264 NM
17 Hrs
400 NM
1 Day
1,391 NM
3.5 Days
3,941 NM
10 Days
5,444 NM
14 Days
6,,187 NM
16 Days
6,187 NM
16 Days
Prince Rupert 121 NM
7.5 Hrs --
123 NM
10 Hrs
477 NM
1.2 Days
1,432NM
3.6 Days
3,810 NM
9.8 Days
5,323 NM
13.7 Days
6,110 NM
15.7 Days
6,110NM
15.7 Days
Stewart 264 NM
17 Hrs
123 NM
10 Hrs --
573 NM
1.5 Days
1,529 NM
4 Days
3,896 NM
10.3 Days
5,406 NM
14.1 Days
5,155 NM
13.4 Days
4,749 NM
12.5 Days
Vancouver 400 NM
1 Day
477 NM
1.2 Days
573 NM
1.5 Days --
991 NM
2.5 Days
4,262 NM
11 Days
5,763 NM
15 Days
6,587 NM
17 Days
7,578 NM
20 Days
Los Angeles 1,391 NM
3.5 Days
1,432 NM
3.6 Days
1,529 NM
4 Days
991 NM
2.5 Days --
4,839 NM
12.5 Days
6,380 NM
18 Days
7,578 NM
20 Days
8,959 NM
23 Days
Yokohama 3,941 NM
10 Days
3,810 NM
9.8 Days
3,896 NM
10.3 Days
4,262 NM
11 Days
4,839 NM
12.5 Days --
1,585 NM
4 Days
1,335 NM
3.4 Days
1,335 NM
3.4 Days
Hong Kong 5,444 NM
14 Days
5,323 NM
13.7 Days
5,406 NM
14.1 Days
5,763 NM
15 Days
6,380 NM
18 Days
1,585 NM
4 Days --
290 NM
18 Hrs
290 NM
18 Hrs
Kaohsiuing Kang
6,187 NM
16 Days
6,587 NM
17 Days
5,155 NM
13.4 Days
6,587 NM
17 Days
7,578 NM
20 Days
1,335 NM
3.4 Days
290 NM
18 Hrs --
227 NM
14 Hrs
Xingang 6,187 NM
16 Days
6,587 NM
17 Days
4,749 NM
12.5 Days
7,578 NM
20 Days
8,959 NM
23 Days
1,335 NM
3.4 Days
290 NM
18 Hrs
227 NM
14 Hrs --
Source: United States Government. "Distances Between Ports” Prepared and published by the National Imagery and Mapping Agency, Bethseda, Maryland. Ninth Edition 1997.*Time/Speed/Distance Calculations at 16.1439 Kn/Hr., the average speed Vancouver Port lists to reach Yokohama, Hong Kong, Kaohsiung (Taiwan) and Xingang (China)
29
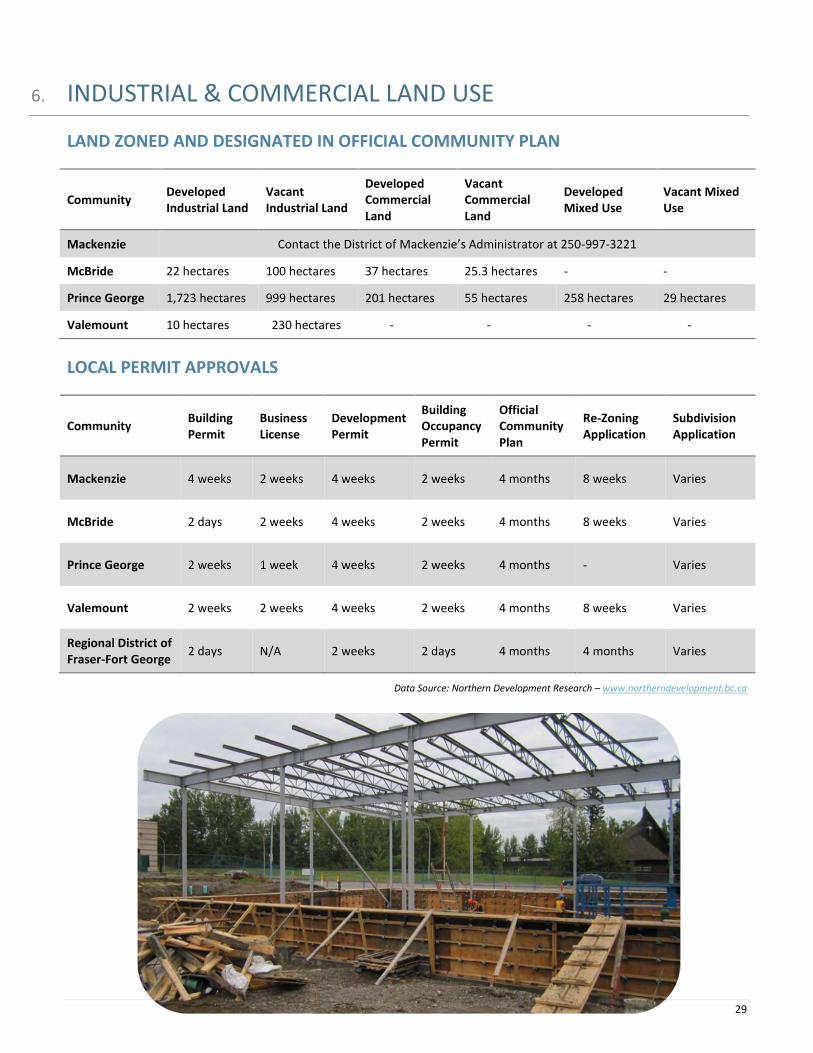
6. INDUSTRIAL & COMMERCIAL LAND USE
LAND ZONED AND DESIGNATED IN OFFICIAL COMMUNITY PLAN
Community Developed Industrial Land
Vacant Industrial Land
Developed Commercial Land
Vacant Commercial Land
Developed Mixed Use
Vacant Mixed Use
Mackenzie Contact the District of Mackenzie’s Administrator at 250-997-3221
McBride 22 hectares 100 hectares 37 hectares 25.3 hectares - -
Prince George 1,723 hectares 999 hectares 201 hectares 55 hectares 258 hectares 29 hectares
Valemount 10 hectares 230 hectares - - - -
LOCAL PERMIT APPROVALS
Community Building Permit
Business License
Development Permit
Building Occupancy Permit
Official Community Plan
Re-Zoning Application
Subdivision Application
Mackenzie 4 weeks 2 weeks 4 weeks 2 weeks 4 months 8 weeks Varies
McBride 2 days 2 weeks 4 weeks 2 weeks 4 months 8 weeks Varies
Prince George 2 weeks 1 week 4 weeks 2 weeks 4 months - Varies
Valemount 2 weeks 2 weeks 4 weeks 2 weeks 4 months 8 weeks Varies
Regional District of Fraser-Fort George
2 days N/A 2 weeks 2 days 4 months 4 months Varies
Data Source: Northern Development Research – www.northerndevelopment.bc.ca
30
ACQUISITION OF CROWN LAND
Crown land is land that is owned by the Province of British Columbia. The Province is the steward of the
land and can lease, license and sell crown land for a variety of purposes including residential, commercial,
industrial, agricultural, tourism and recreational purposes.
Government Ministry Contact Notes
Ministry of Forests, Lands and Natural Resource Operations: Land Tenures Branch
p: 1-877-855-3222
Administers and allocates Crown land parcels for lease, license and sale.
Ministry of Transportation Telephone: (250) 387-3198 Administers land sales related to public airports and port authorities.
To view properties that the Federal Government of Canada has for sale, please visit: http://id-reo.tpsgc-pwgsc.gc.ca/public/
31
7. UTILITIES
WATER SYSTEM – DISTRICT OF MACKENZIE
The District of Mackenzie’s water is municipally supplied and comes from three wells adjacent to Morfee Lake in
town and a fourth well in the rural subdivision. The water is of such high quality that it does not require any
treatment.
The District of Mackenzie’s Public Works is responsible for the operation of the water supply system. For further
information on the District of Mackenzie’s water system contact the Public Works Department at 250-997-3221.
WATER PRODUCTION
District of Mackenzie
Rated Capacity 109.8 (mld)
Average Daily Demand 24.6 (mld)
Peak Demand 6.4 (mld)
Residential Cost (flat rate) $217.67
Industrial Cost / 3,785 Liters $2.78/3,785 liters over 49,210 liters
Water Connection Fee: Industrial 0
Data Source: District of of Mackenzie – www.district.mackenzie.bc.ca
WATER SYSTEM – VILLAGE OF MCBRIDE
Water within the Village of McBride is sourced primarily from a surface supply source from Dominion Creek with
the Water Reservoir Located near Lucille Mountain. The water is treated with a UV Treatment and
Chlorine. Major upgrades were completed in 2010 improving the overall reliability of the system and water
quality.
The Village of McBride Public Works Department is responsible for the operation and maintenance of the System.
For more information contact the village office at 250- 569-2229.
WATER SYSTEM – VILLAGE OF VALEMOUNT
Average use 400m3/day, total system capacity: 1000m3/day. The Village of Valemount is responsible for the
distribution of Valemount’s water supply to areas where lines currently exist. For more information, please
contact the Village of Valemount municipal office at 250-566-4435.
32
WATER PRODUCTION
Village of Valemount
Water System Connection Fee $750.00 (up to 19 mm connection)
Water System Connection Fee $1,000.00 (over 19mm and up to 38 mm connection)
Data Source: Village of Valemount – www.valemount.ca
WATER SYSTEM – CITY OF PRINCE GEORGE
The City of Prince George’s drinking water comes from 6 municipal wells that draw 17.8 billion liters of water each
year from underground aquifers. By utilizing underground aquifers, residents are protected against bacteria and
other pollutants often found in surface sources such as lakes or rivers. Raw water is chlorinated according to
guidelines set out by the Northern Health Authority. The amount of chlorine used is monitored daily to maintain
system-wide balance and to ensure the highest degree of protection for all residents. Treated water is pumped to
and stored in 14 service reservoirs strategically located throughout the City.
WATER PRODUCTION
City of Prince George
Residential Cost (flat rate) $511.28/year
Connection Fee Contact City of Prince George municipal office
Data Source: City of Prince George – www.princegeorge.ca
WASTE WATER SYSTEM – DISTRICT OF MACKENZIE
The District of Mackenzie’s sewer system consists of a 757,000 liter mixed aeration talk, two settling ponds and an engineered wetland for final polishing. The District of Mackenzie’s Public Works is responsible for the operation of the sewer system. For further
information on the District of Mackenzie’s sewer system contact the Public Works Department at 250-997-3221.
SEWAGE SERVICE
District of Mackenzie
Rated Capacity 2.5 (mld)
Average Daily Demand 2,000 m³/day
Peak Demand 3,000 m³/day
Cost per 3,785 Liters- Industrial $1.91/3,785 liters over 49,210 liters
Sewer Connection Fee for Industrial Users 0
Data Source: District of Mackenzie – www.district.mackenzie.bc.ca
33
WASTE WATER SYSTEM – VILLAGE OF MCBRIDE
The Village’s four-cell sewer system is one of the first environmentally friendly, non-chemical system in North
America. The site operates on biological purification, relying on a variety of plant speciers within the cells, and
filtering into adjacent wetlands and tree lots to completely purify the waste.
WASTE WATER SYSTEM – CITY OF PRINCE GEORGE
The City of Prince George handles the removal of residential and normal commercial waste within the city limits
and uses an automated big system for which the resident is charged according to the zise of bin. The regional
landfill is managed by the Regional District of Fraser-Fort George. Waste management infrastructure and
policies for business are dependent on the characteristics of the operation. Please contact the Regional District
Fraser-Fort George at 1-800-667-1959 for more information.
WASTE WATER SYSTEM – VALEMOUNT
The Village of Valemount handles the removal of residential and normal commercial waste within the city limits.
For more information, please contact the Village of Valemount’s municipal office at 250-566-4435.
SEWAGE SERVICE
Village of Valemount
Rated Capacity -
Average Daily Demand 730 cubic metre/day
Peak Demand 1,000 cubic metre/day
Cost per 3,785 Liters - Industrial -
Sewer Connection fee for Industrial Users $750
Data Source: Village of Valemount – www.valemount.ca
34
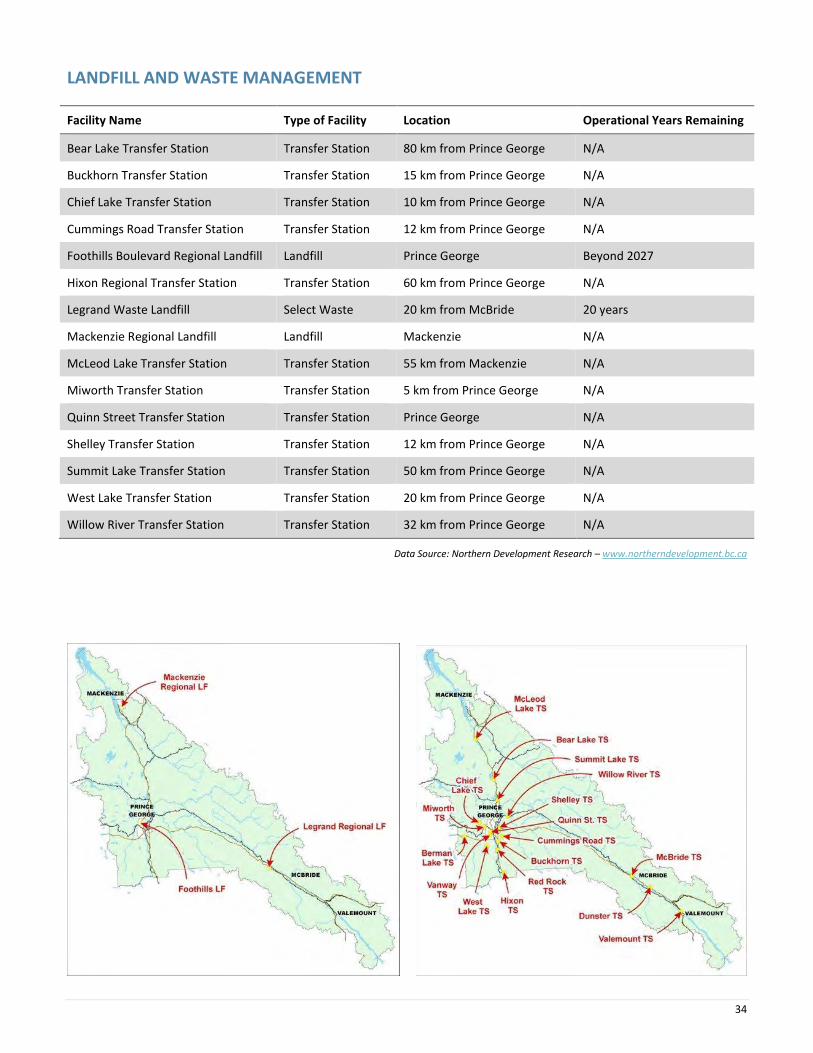
LANDFILL AND WASTE MANAGEMENT
Facility Name Type of Facility Location Operational Years Remaining
Bear Lake Transfer Station Transfer Station 80 km from Prince George N/A
Buckhorn Transfer Station Transfer Station 15 km from Prince George N/A
Chief Lake Transfer Station Transfer Station 10 km from Prince George N/A
Cummings Road Transfer Station Transfer Station 12 km from Prince George N/A
Foothills Boulevard Regional Landfill Landfill Prince George Beyond 2027
Hixon Regional Transfer Station Transfer Station 60 km from Prince George N/A
Legrand Waste Landfill Select Waste 20 km from McBride 20 years
Mackenzie Regional Landfill Landfill Mackenzie N/A
McLeod Lake Transfer Station Transfer Station 55 km from Mackenzie N/A
Miworth Transfer Station Transfer Station 5 km from Prince George N/A
Quinn Street Transfer Station Transfer Station Prince George N/A
Shelley Transfer Station Transfer Station 12 km from Prince George N/A
Summit Lake Transfer Station Transfer Station 50 km from Prince George N/A
West Lake Transfer Station Transfer Station 20 km from Prince George N/A
Willow River Transfer Station Transfer Station 32 km from Prince George N/A
Data Source: Northern Development Research – www.northerndevelopment.bc.ca
35
LICENSED HAZARDOUS MATERIALS DISPOSAL
Number Serving the Region 7 (Please contact individual municipalities for more information)
ELECTRIC POWER
Provider: BC Hydro www.bchydro.com
Enquiries to hook up new property 1-877-520-1355
Enquiries about existing properties already hooked up 1-800-224-9376
Net Importer/Exporter of Power: Net Exporter – BC Hydro generates between 43,000 and 54,000 GWH of electricity annually.
% of Reserve Margin Including Generation & Net Purchases
8% as per WSCC guidelines plus an additional 8% surplus
Average Electrical Service Availability Index
Most Recent Year
Last 5 Years
99.940
99.9314
Name of Power Pool Membership Formal membership in WSCC, WSPP, Power Pool of Alberta (PPA), MAPP. Also active in SPP and CalPX
Source Electric Power Deregulated Wholesale competition allowed
Residential Customers 6.80 cents per kWh for the first 1,350 kWh they use over a two-month billing period. Above that amount, customers pay 10.19 cents per kWh for the balance of the electricity used during the billing period.
Business Customers Average Cost Per kWh
Small General Service Rate Annual peak demand less than 35kW
Basic Charge 19.25 cents per day
All kWh $0.0915 per kWh
Minimum Charge The Basic Charge
Rate Rider 5% Rate Rider applied to all charges, before taxes and levies.
Medium General Service Conservation Rate Annual peak demand between 85 and 150 kW
Basic Charge 19.25 cents per day
Demand Charge
$0.00 per kW for first 35 kW
$4.69 per kW for next 115 kW
$9.00 per kW for remaining kW
36
Energy Charge
Part 1:
First 14,800 kWh $0.0897 per kWh All additional kWh $0.0490 per kWh up to baseline
Part 2:
$0.0942 per kWh for usage up to 20% above baseline
$0.0942 per kWh for savings down to 20% below baseline (credit)
Usage or savings beyond 20% of baseline are based on Part 1 prices
Discounts
1.5% on entire bill if customer’s electricity is metered at primary potential
$0.25 per kW if customer supplies transformation from a primary to a secondary potential.
If a customer is entitled to both discounts the 1.5% discount is applied first.
Minimum Charge
50% of the highest maximum demand charge billed in any month within an on-peak period (1 November to 31 March inclusive) during the preceding 11 months.
Rate Rider 5% Rate Rider applied to all charges, before taxes and levies.
Medium General Service Interim Rate Annualpeak demand between 35 and 150 kW. MGS accounts are moving from the MGS Interim Rate to the new MGS Conservation Rate wich better encourages conservation.
Basic Charge $0.1925 per day
Demand Charge $0.00 per kW for first 35 kW
$4.69 per kW for next 115 kW
$9.00 per kW for remaining kW
Energy Charge $0.0897 per kWh for last 14,800 kWh
$0.0490 per kWh for remaining kWh
Discounts 1.5% on entire bill if customer’s electricity is metered at primary potential
$0.25 per kW if customer supplies transformation from a primary to a secondary potential
If a customer is entitiled to both discounts the 1/5% discount is applied first
Monthly Minimun Charge 50% of th highest maximum demand charge billed in any month within an on-peak period (1 November to 31 March inclusive) during the preceding 11 months
Minimum Energy Charge $0.0281 per kWh applies when the Energy Charge (Part 1 and 2) divided by the total kWh is less than $0.0281 per kWh
Rate Rider 5% Rate Rider applied to all charges, before taxes and levies
Large General Service Conservation Rate Annual peak demands equal to or greater than 150 kW or total annual energy usage of at least 550,000kWh.
Basic Charge $0.1925 per day
37
Demand Charge $0.00 per kW for first 35 kW
$4.69 per kW for next 115 kW
$9.00 per kW for remaining kW
Energy Charge Part 1:
$0.0937 per kWh for first 14,800 kWh
$0.0451 per kWh for remaining kWh up to baseline
Part 2:
$0.0942 per kWh for usage up to 20% above baseline
$0.0942 per kWh for savings down to 20% below baseline (credit)
Usage or savings beyond 20% of baseline are based on Part 1 prices
Discounts 1.5% on entire bill if customer's electricity is metered at primary potential
$0.25 per kW if customer supplies transformation from a primary to a secondary potential
If a customer is entitled to both discounts the 1.5% discount is applied first
Monthly Minimum Charge 50% of the highest maximum demand charge billed in any month within an on-peak period (1 November to 31 March inclusive) during the preceding 11 months
Minimum Energy Charge $0.0281 per kWh applies when the Energy Charge (Part 1 and 2) divided by the total kWh is less than $0.0281 per kWh
Rate Rider 5% Rate Rider applied to all charges, before taxes and levies
Industrial: Transmission Service Mines, chemical plants, large sawmills, pulp and paper mills, large manufacturing
Demand Charge $6.263 per kVA of billing demand
Energy Charge $0.03261 per kWh applied to all kWh up to and including 90% of the costumers baseline load (CBL) in each billing year.
$0.07360 per kWh applied to all kWh above 90% of the CBL in each billing year.
Minimum Charge $6.027 per KVa of billing demand per billing period
Rate Rider 5% Rate Rider applied to all charges, before taxes and levies.
Data Source: BC Hydro “Rates” – www.bchydro.com
38
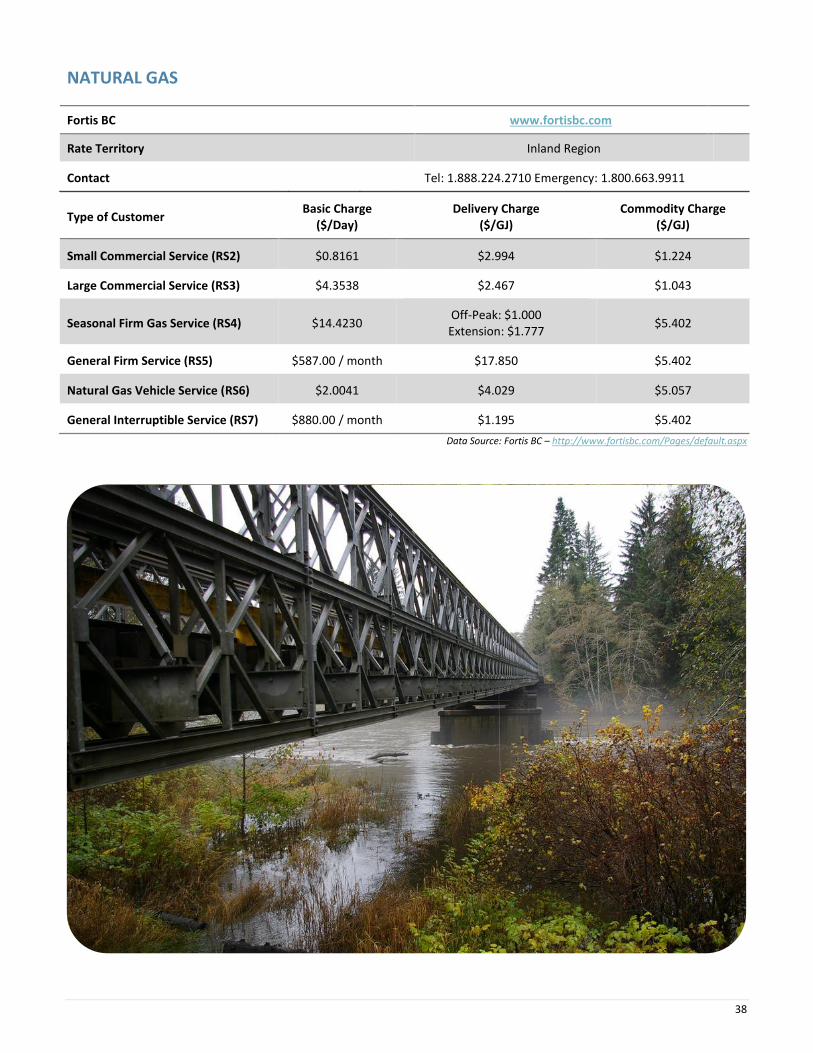
NATURAL GAS
Fortis BC www.fortisbc.com
Rate Territory Inland Region
Contact Tel: 1.888.224.2710 Emergency: 1.800.663.9911
Type of Customer Basic Charge
($/Day) Delivery Charge
($/GJ) Commodity Charge
($/GJ)
Small Commercial Service (RS2) $0.8161 $2.994 $1.224
Large Commercial Service (RS3) $4.3538 $2.467 $1.043
Seasonal Firm Gas Service (RS4) $14.4230 Off-Peak: $1.000 Extension: $1.777
$5.402
General Firm Service (RS5) $587.00 / month $17.850 $5.402
Natural Gas Vehicle Service (RS6) $2.0041 $4.029 $5.057
General Interruptible Service (RS7) $880.00 / month $1.195 $5.402
Data Source: Fortis BC – http://www.fortisbc.com/Pages/default.aspx
39
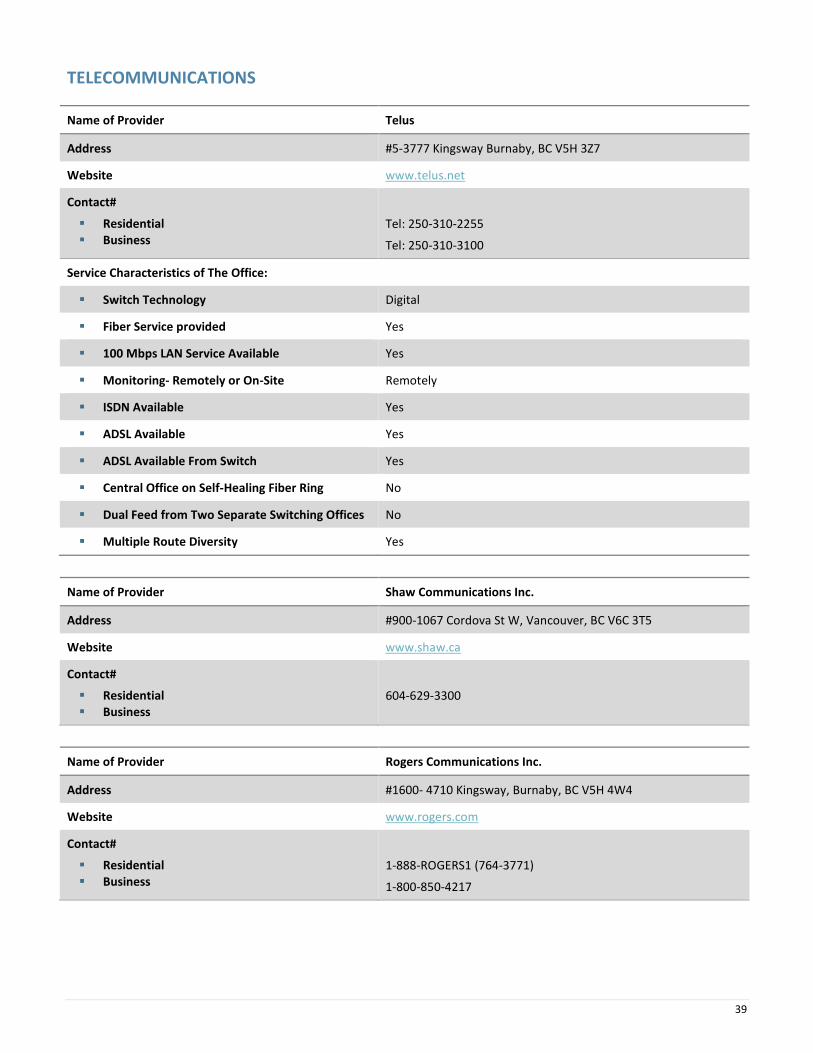
TELECOMMUNICATIONS
Name of Provider Telus
Address #5-3777 Kingsway Burnaby, BC V5H 3Z7
Website www.telus.net
Contact#
Residential Business
Tel: 250-310-2255
Tel: 250-310-3100
Service Characteristics of The Office:
Switch Technology Digital
Fiber Service provided Yes
100 Mbps LAN Service Available Yes
Monitoring- Remotely or On-Site Remotely
ISDN Available Yes
ADSL Available Yes
ADSL Available From Switch Yes
Central Office on Self-Healing Fiber Ring No
Dual Feed from Two Separate Switching Offices No
Multiple Route Diversity Yes
Name of Provider Shaw Communications Inc.
Address #900-1067 Cordova St W, Vancouver, BC V6C 3T5
Website www.shaw.ca
Contact#
Residential Business
604-629-3300
Name of Provider Rogers Communications Inc.
Address #1600- 4710 Kingsway, Burnaby, BC V5H 4W4
Website www.rogers.com
Contact#
Residential Business
1-888-ROGERS1 (764-3771)
1-800-850-4217
40
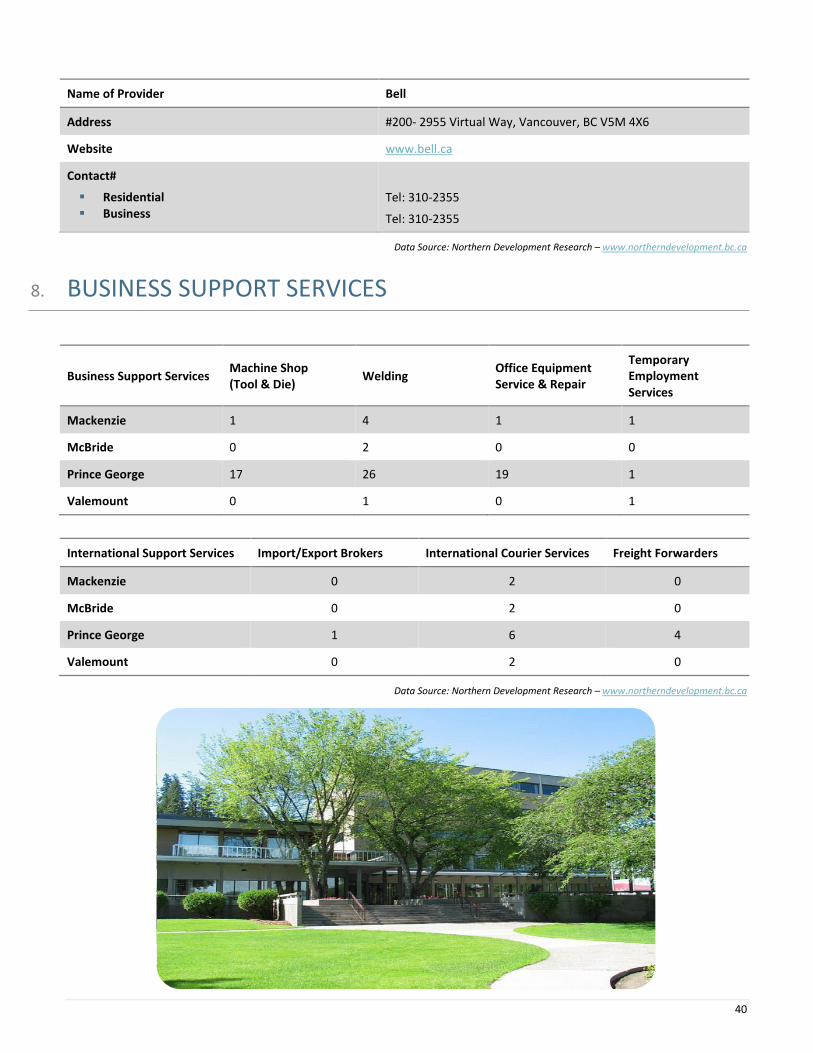
Name of Provider Bell
Address #200- 2955 Virtual Way, Vancouver, BC V5M 4X6
Website www.bell.ca
Contact#
Residential Business
Tel: 310-2355
Tel: 310-2355
Data Source: Northern Development Research – www.northerndevelopment.bc.ca
8. BUSINESS SUPPORT SERVICES
Business Support Services Machine Shop (Tool & Die)
Welding Office Equipment Service & Repair
Temporary Employment Services
Mackenzie 1 4 1 1
McBride 0 2 0 0
Prince George 17 26 19 1
Valemount 0 1 0 1
International Support Services Import/Export Brokers International Courier Services Freight Forwarders
Mackenzie 0 2 0
McBride 0 2 0
Prince George 1 6 4
Valemount 0 2 0
Data Source: Northern Development Research – www.northerndevelopment.bc.ca
41
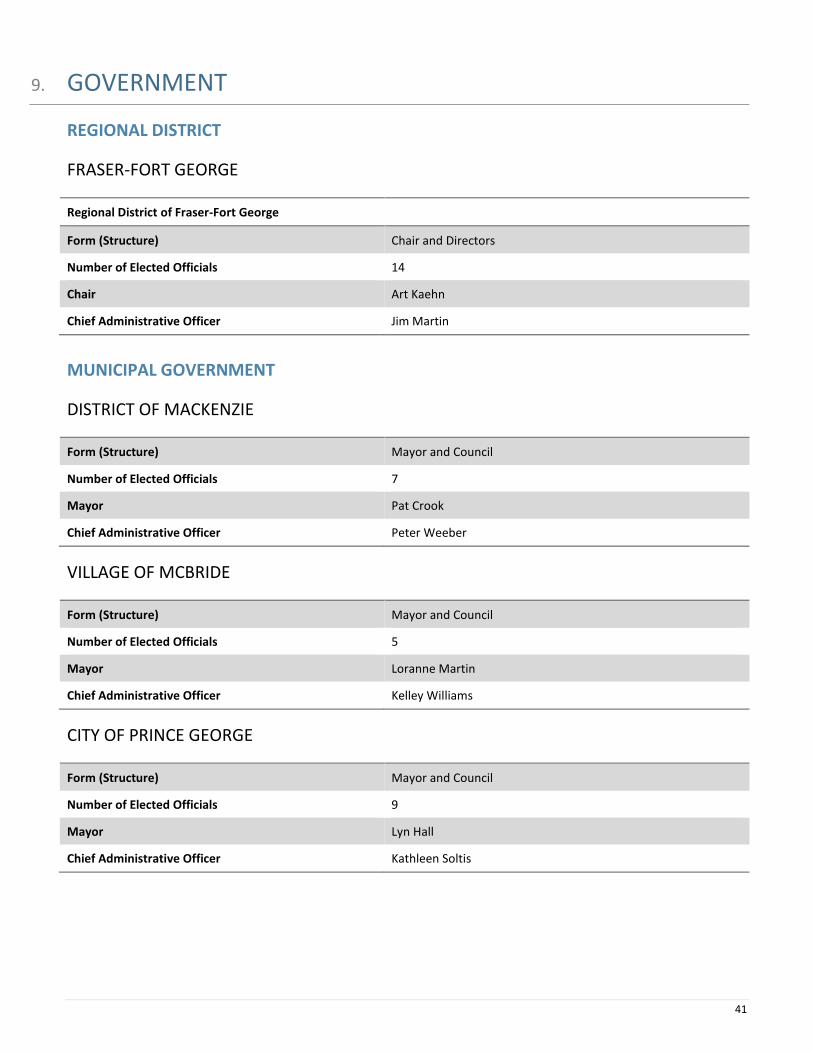
9. GOVERNMENT
REGIONAL DISTRICT
FRASER-FORT GEORGE
Regional District of Fraser-Fort George
Form (Structure) Chair and Directors
Number of Elected Officials 14
Chair Art Kaehn
Chief Administrative Officer Jim Martin
MUNICIPAL GOVERNMENT
DISTRICT OF MACKENZIE
Form (Structure) Mayor and Council
Number of Elected Officials 7
Mayor Pat Crook
Chief Administrative Officer Peter Weeber
VILLAGE OF MCBRIDE
Form (Structure) Mayor and Council
Number of Elected Officials 5
Mayor Loranne Martin
Chief Administrative Officer Kelley Williams
CITY OF PRINCE GEORGE
Form (Structure) Mayor and Council
Number of Elected Officials 9
Mayor Lyn Hall
Chief Administrative Officer Kathleen Soltis
42
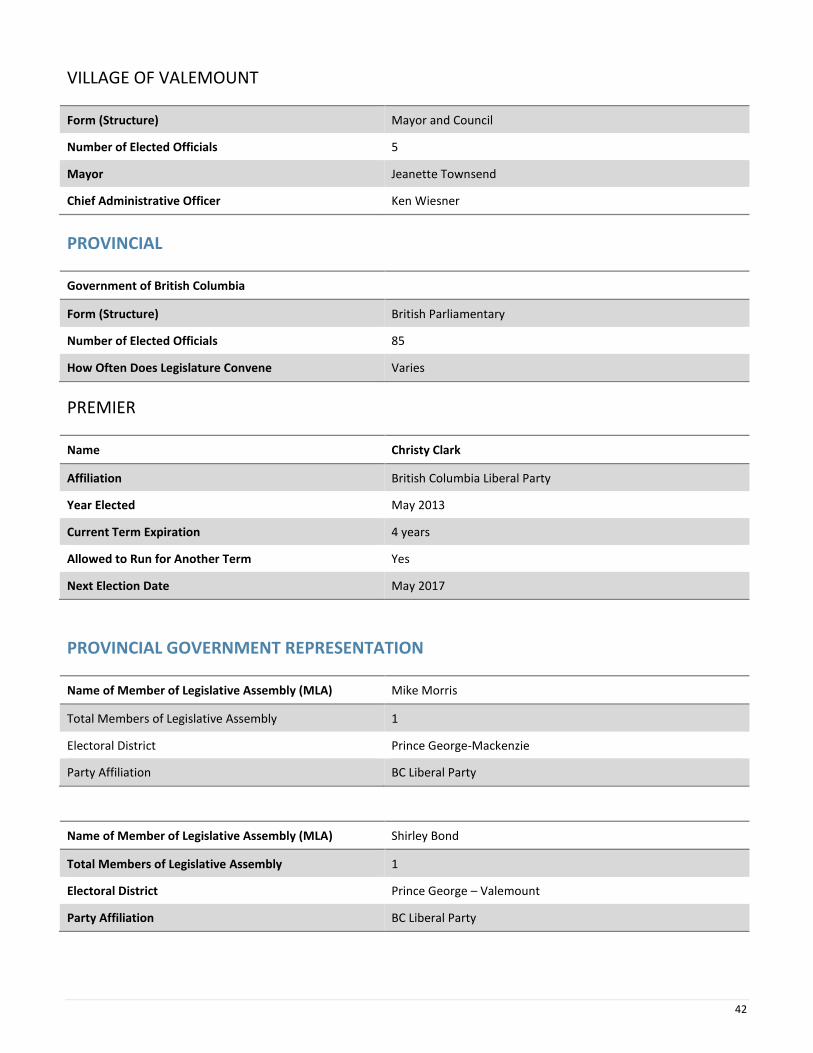
VILLAGE OF VALEMOUNT
Form (Structure) Mayor and Council
Number of Elected Officials 5
Mayor Jeanette Townsend
Chief Administrative Officer Ken Wiesner
PROVINCIAL
Government of British Columbia
Form (Structure) British Parliamentary
Number of Elected Officials 85
How Often Does Legislature Convene Varies
PREMIER
Name Christy Clark
Affiliation British Columbia Liberal Party
Year Elected May 2013
Current Term Expiration 4 years
Allowed to Run for Another Term Yes
Next Election Date May 2017
PROVINCIAL GOVERNMENT REPRESENTATION
Name of Member of Legislative Assembly (MLA) Mike Morris
Total Members of Legislative Assembly 1
Electoral District Prince George-Mackenzie
Party Affiliation BC Liberal Party
Name of Member of Legislative Assembly (MLA) Shirley Bond
Total Members of Legislative Assembly 1
Electoral District Prince George – Valemount
Party Affiliation BC Liberal Party
43
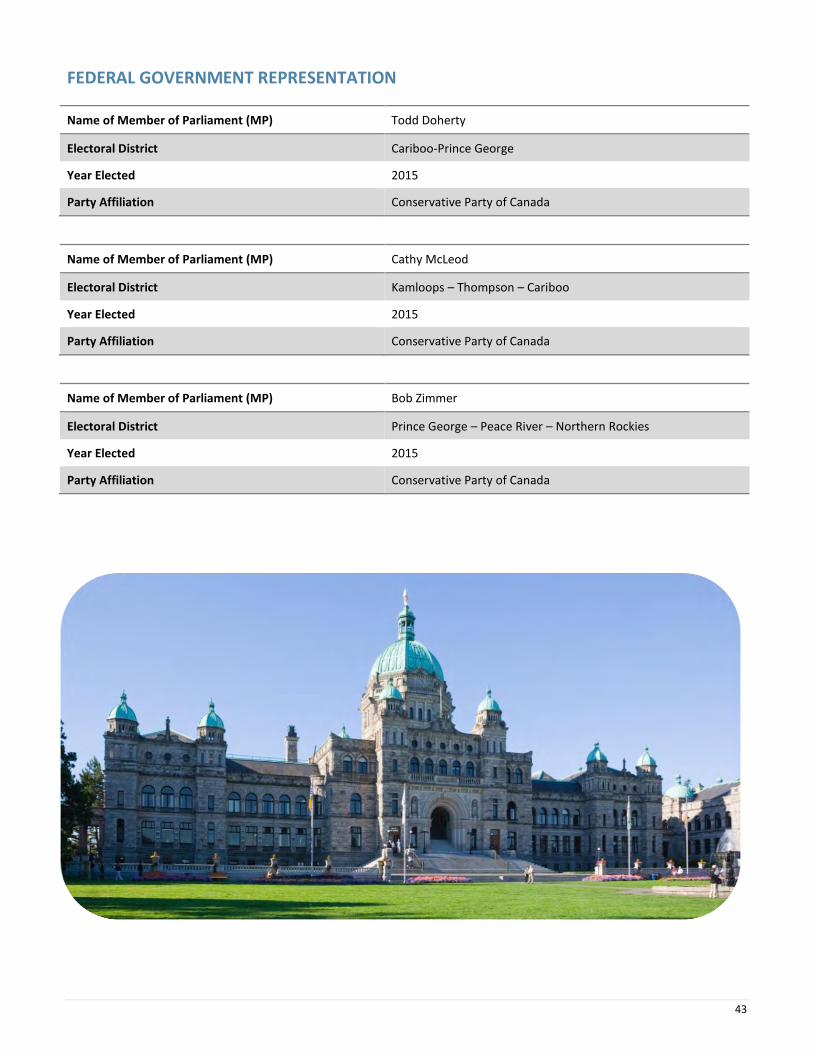
FEDERAL GOVERNMENT REPRESENTATION
Name of Member of Parliament (MP) Todd Doherty
Electoral District Cariboo-Prince George
Year Elected 2015
Party Affiliation Conservative Party of Canada
Name of Member of Parliament (MP) Cathy McLeod
Electoral District Kamloops – Thompson – Cariboo
Year Elected 2015
Party Affiliation Conservative Party of Canada
Name of Member of Parliament (MP) Bob Zimmer
Electoral District Prince George – Peace River – Northern Rockies
Year Elected 2015
Party Affiliation Conservative Party of Canada
44
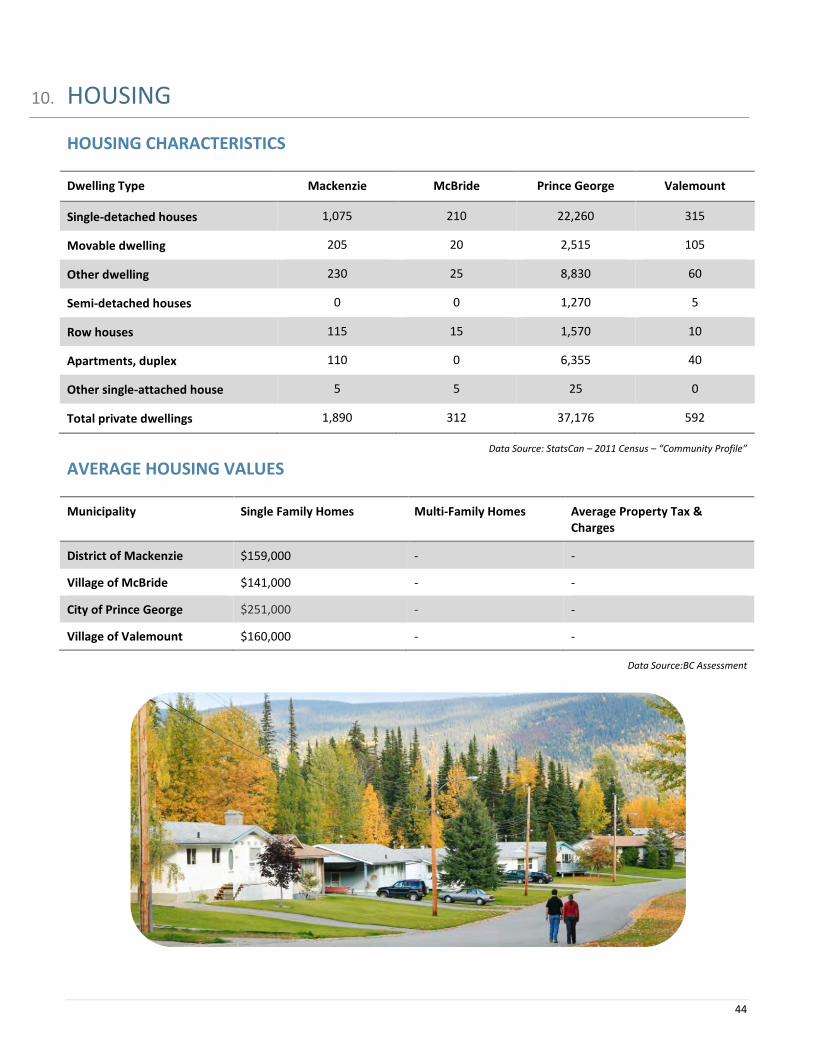
10. HOUSING
HOUSING CHARACTERISTICS
Dwelling Type Mackenzie McBride Prince George Valemount
Single-detached houses 1,075 210 22,260 315
Movable dwelling 205 20 2,515 105
Other dwelling 230 25 8,830 60
Semi-detached houses 0 0 1,270 5
Row houses 115 15 1,570 10
Apartments, duplex 110 0 6,355 40
Other single-attached house 5 5 25 0
Total private dwellings 1,890 312 37,176 592
Data Source: StatsCan – 2011 Census – “Community Profile”
AVERAGE HOUSING VALUES
Municipality Single Family Homes Multi-Family Homes Average Property Tax & Charges
District of Mackenzie $159,000 - -
Village of McBride $141,000 - -
City of Prince George $251,000 - -
Village of Valemount $160,000 - -
Data Source:BC Assessment
45
11. TAXATION RATES
CORPORATE INCOME TAX
Small Business Manufacturing Non-Manufacturing
Federal
Rate 11% 16.5% 16.5%
Formula (Sales, Property & Payroll) n/a n/a n/a
Accelerated Depreciated Permitted Yes Yes Yes
Provincial
Rate 2.5% 10.0% 10.0%
Formula (Sales, Property & Payroll) Sales & Payroll Sales & Payroll Sales & Payroll
Accelerated Depreciated Permitted No No No
Local
British Columbia has no local taxes
Total Federal and Provincial Corporate Income Tax 13.5% 26.5% 26.5%
PERSONAL INCOME TAX
Federal State/Provincial Local
Earned Income 15 – 29% 5.06 – 14.7% -
Unearned Income (e.g. Dividends) 0 – 14.55% 0 – 3.92% -
Capital Gains 7.5 – 14.5 % 2.08 – 7.35% -
SALES / USE TAX
Rate Notes
Goods and Services Tax 5% GST on business inputs is fully recoverable
B.C. Sales Tax 7% B.C. sales tax
Total (Effective Combined Rate) Business 12% Net of GST 0% for production machinery and equipment for eligible manufacturers
46
SALES TAX RATE BY UTILITY
Yes/No Rate Notes
Electric Power Yes 5% 5% GST is fully recoverable
Natural Gas Yes 5% 5% GST is fully recoverable subject to 0.4% tax on energy products to raise revenue for the ICE fund
Fuel Oil Yes 5% 5% GST is fully recoverable subject to 0.4% tax on energy products to raise revenue for the ICE fund
Water No 0% -
Sewer No 0% -
Hazardous Waste Disposal Yes 12% 5% GST is fully recoverable
TELEPHONE SUBJECT TO SALES/USE TAX
Yes/No Rate Notes
Local Yes 5% 5% GST is fully recoverable
Long Distance Yes 12% 5% GST is fully recoverable
MACHINERY AND EQUIPMENT SUBJECT TO SALES/USE TAX
Yes/No Rate Notes
Production No 0% -
Non-Production Yes 12% 5% GST is fully recoverable
Pollution Control Yes 12% 5% GST is fully recoverable
Office Equipment & Fixtures Yes 12% 5% GST is fully recoverable
SALES/USE TAX ON TANGIBLE PROPERTY
Yes/No Rate Notes
Office Building Construction Materials
Yes 12% 5% GST is fully recoverable
Industrial Building Construction Materials
Yes 12% 5% GST is fully recoverable
Manufactures Raw Materials No 0% -
Standard Software Yes 12% 5% GST is fully recoverable
Custom Software Yes 12% 5% GST is fully recoverable
47
SALES/USE TAX ON INTANGIBLE PROPERTY
Yes/No Rate Notes
Accounts Receivable No 0% -
Capital Stock No 0% -
Stock/Bond Transaction Fee No 0% -
Data Source: Government of BC - http://www2.gov.bc.ca/assets/gov/topic/BED47DA4EBDBA60A5F28622B8B2E1451/uploads/whats_taxable_whats_not.pdf
PROPERTY TAX
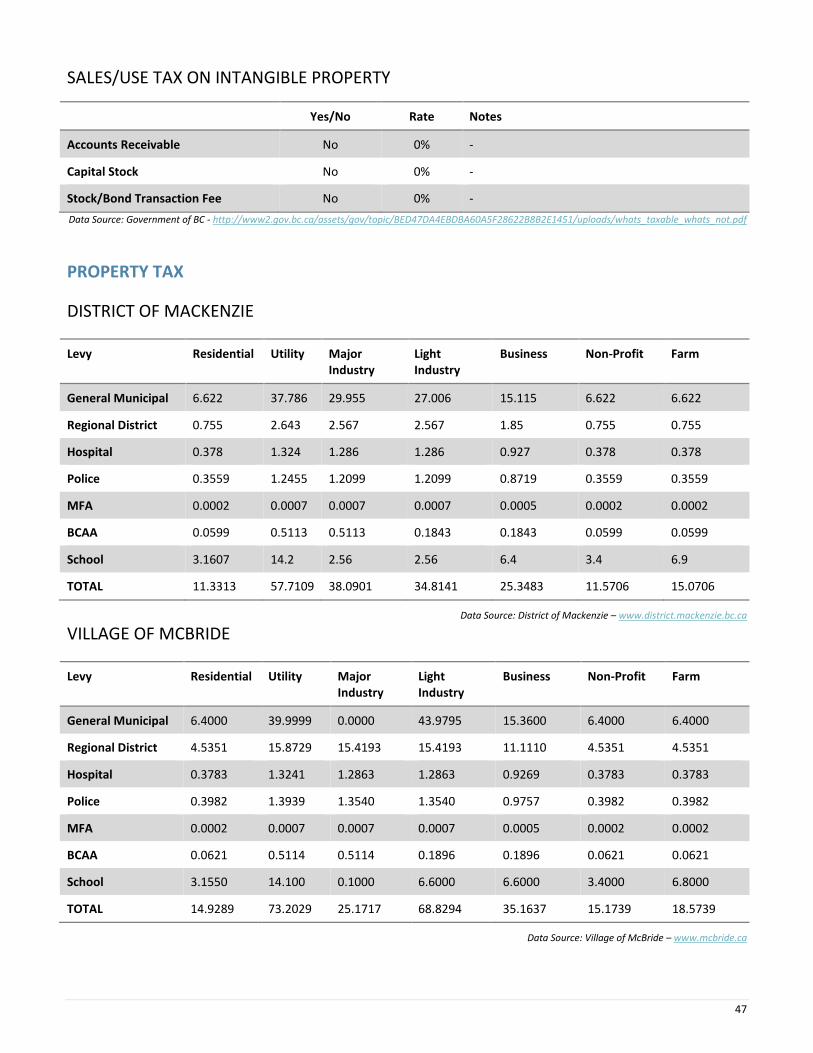
DISTRICT OF MACKENZIE
Levy Residential Utility Major Industry
Light Industry
Business Non-Profit Farm
General Municipal 6.622 37.786 29.955 27.006 15.115 6.622 6.622
Regional District 0.755 2.643 2.567 2.567 1.85 0.755 0.755
Hospital 0.378 1.324 1.286 1.286 0.927 0.378 0.378
Police 0.3559 1.2455 1.2099 1.2099 0.8719 0.3559 0.3559
MFA 0.0002 0.0007 0.0007 0.0007 0.0005 0.0002 0.0002
BCAA 0.0599 0.5113 0.5113 0.1843 0.1843 0.0599 0.0599
School 3.1607 14.2 2.56 2.56 6.4 3.4 6.9
TOTAL 11.3313 57.7109 38.0901 34.8141 25.3483 11.5706 15.0706
Data Source: District of Mackenzie – www.district.mackenzie.bc.ca
VILLAGE OF MCBRIDE
Levy Residential Utility Major Industry
Light Industry
Business Non-Profit Farm
General Municipal 6.4000 39.9999 0.0000 43.9795 15.3600 6.4000 6.4000
Regional District 4.5351 15.8729 15.4193 15.4193 11.1110 4.5351 4.5351
Hospital 0.3783 1.3241 1.2863 1.2863 0.9269 0.3783 0.3783
Police 0.3982 1.3939 1.3540 1.3540 0.9757 0.3982 0.3982
MFA 0.0002 0.0007 0.0007 0.0007 0.0005 0.0002 0.0002
BCAA 0.0621 0.5114 0.5114 0.1896 0.1896 0.0621 0.0621
School 3.1550 14.100 0.1000 6.6000 6.6000 3.4000 6.8000
TOTAL 14.9289 73.2029 25.1717 68.8294 35.1637 15.1739 18.5739
Data Source: Village of McBride – www.mcbride.ca
48
CITY OF PRINCE GEORGE
Levy Residential Utility Major Industry
Light Industry
Business Non-Profit Farm
General Municipal 6.70534 35.77529 42.09151 24.04037 14.31011 6.70534 4.56959
Regional District 0.54353 1.90236 1.84801 1.84801 1.33165 0.54353 0.54353
Hospital 0.37838 1.32434 1.28650 1.28650 0.92704 0.37838 0.37838
MFA 0.0002 0.0007 0.0007 0.0007 0.0005 0.0002 0.0002
BCAA 0.06210 0.51140 0.51140 0.18960 0.18960 0.06210 0.06210
School 3.15500 14.1000 0.10000 6.60000 6.60000 3.40000 6.80000
TOTAL 11.91810 59.06938 54.68994 33.82667 25.69694 12.16310 9.73271
Data Source: City of Prince George – “Tax Rates” – www.princegeorge.ca
VILLAGE OF VALEMOUNT
Property Class Total Tax Rates Per $1,000 of assessed value
Residential 4.264
Utilities 12.949
Major Industry -
Light Industry 52.041
Business/Other 8.504
Recreation Property 8.648
Data Source: Village of Valemount – www.valemount.ca Property Tax rates effective 2011, Property Tax rates per $1000 Assessed Personal Property (M&E, Inventory, Other)
Municipal Note: BC does not have Personal Property Taxes.
49
12. INTERNATIONAL RESOURCES
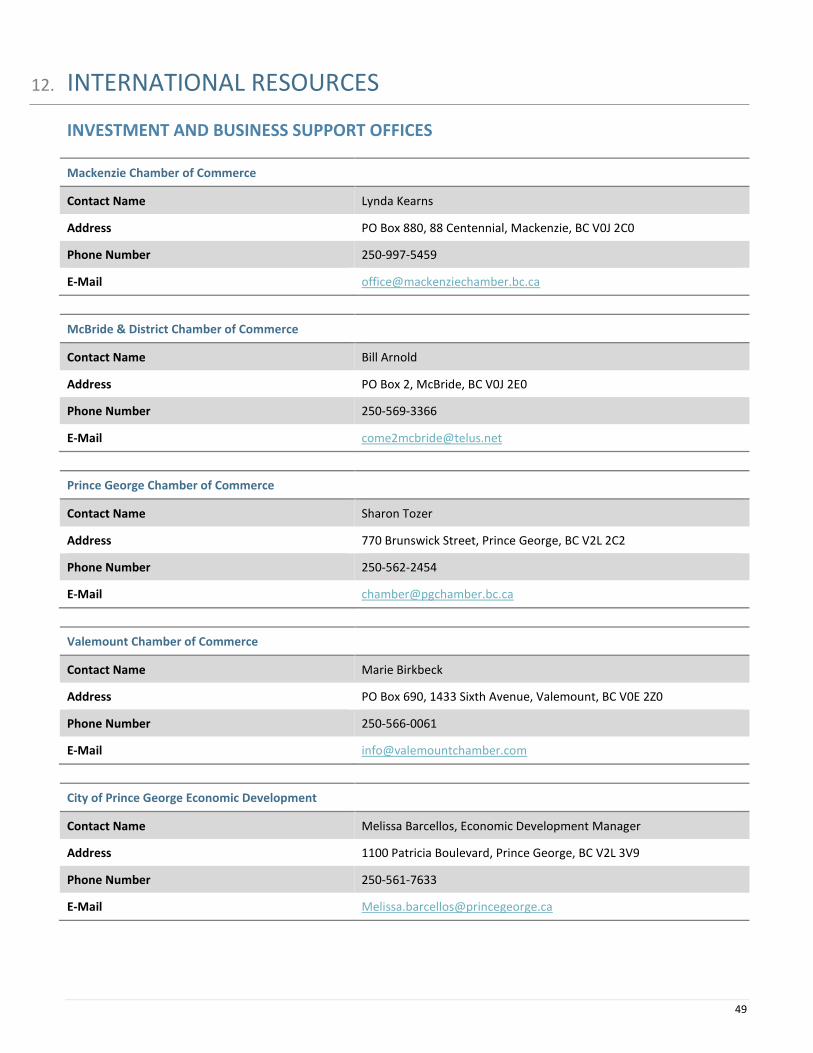
INVESTMENT AND BUSINESS SUPPORT OFFICES
Mackenzie Chamber of Commerce
Contact Name Lynda Kearns
Address PO Box 880, 88 Centennial, Mackenzie, BC V0J 2C0
Phone Number 250-997-5459
E-Mail [email protected]
McBride & District Chamber of Commerce
Contact Name Bill Arnold
Address PO Box 2, McBride, BC V0J 2E0
Phone Number 250-569-3366
E-Mail [email protected]
Prince George Chamber of Commerce
Contact Name Sharon Tozer
Address 770 Brunswick Street, Prince George, BC V2L 2C2
Phone Number 250-562-2454
E-Mail [email protected]
Valemount Chamber of Commerce
Contact Name Marie Birkbeck
Address PO Box 690, 1433 Sixth Avenue, Valemount, BC V0E 2Z0
Phone Number 250-566-0061
E-Mail [email protected]
City of Prince George Economic Development
Contact Name Melissa Barcellos, Economic Development Manager
Address 1100 Patricia Boulevard, Prince George, BC V2L 3V9
Phone Number 250-561-7633
E-Mail [email protected]
50
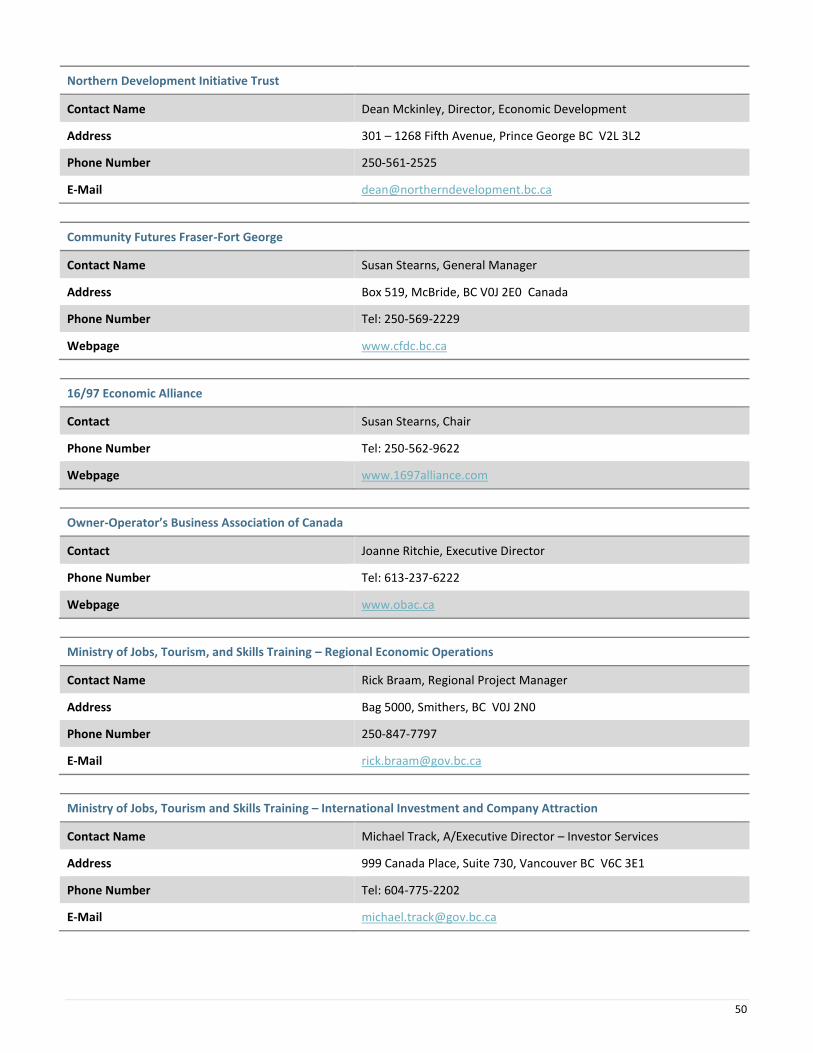
Northern Development Initiative Trust
Contact Name Dean Mckinley, Director, Economic Development
Address 301 – 1268 Fifth Avenue, Prince George BC V2L 3L2
Phone Number 250-561-2525
E-Mail [email protected]
Community Futures Fraser-Fort George
Contact Name Susan Stearns, General Manager
Address Box 519, McBride, BC V0J 2E0 Canada
Phone Number Tel: 250-569-2229
Webpage www.cfdc.bc.ca
16/97 Economic Alliance
Contact Susan Stearns, Chair
Phone Number Tel: 250-562-9622
Webpage www.1697alliance.com
Owner-Operator’s Business Association of Canada
Contact Joanne Ritchie, Executive Director
Phone Number Tel: 613-237-6222
Webpage www.obac.ca
Ministry of Jobs, Tourism, and Skills Training – Regional Economic Operations
Contact Name Rick Braam, Regional Project Manager
Address Bag 5000, Smithers, BC V0J 2N0
Phone Number 250-847-7797
E-Mail [email protected]
Ministry of Jobs, Tourism and Skills Training – International Investment and Company Attraction
Contact Name Michael Track, A/Executive Director – Investor Services
Address 999 Canada Place, Suite 730, Vancouver BC V6C 3E1
Phone Number Tel: 604-775-2202
E-Mail [email protected]
51
FINANCIAL INSTITUTIONS
Name of Company Address Phone Number Website
Bank of Montreal Prince George 250-614-4250 www.bmo.com
Bank of Nova Scotia McBride 250-569-2241 www.scotiabank.com
Bank of Nova Scotia Mackenzie 250-997-3223 www.scotiabank.com
Bank of Nova Scotia Prince George 250-960-4700 www.scotiabank.com
Business Development Bank of Canada Prince George 250-561-5323 www.bdc.ca
Canadian Imperial Bank of Commerce Valemount 250-566-4483 www.cibc.com
Canadian Imperial Bank of Commerce Prince George 250-614-6444 www.cibc.com
Canadian Western Bank Prince George 250-612-0123 www.cwbank.com
H&R Block Valemount 250-566-4210 www.hrblock.ca
Integris Credit Union Prince George 250-612-3456 www.integriscu.com
Royal Bank of Canada Mackenzie 250-997-3213 www.rbc.com
Royal Bank of Canada Prince George 250-960-4530 www.rbc.com
Spruce Credit Union Prince George 250-562-5415 www.sprucecu.bc.ca
TD Bank Group Prince George 250-612-6000 www.td.com
Western Union McBride 250-569-2241 www.westernunion.ca
Data Source: Northern Development Research – www.northerndevelopment.bc.ca
EMPLOYMENT ASSISTANCE
Name of Company Address Phone Number Website
Mackenzie Employment Services Centre
540 Mackenzie Blvd, Mackenzie, BC V0J 2C0
250-977-7208 www.workbcmackenzie.ca
Robson Valley Home Support Society
942 Third Avenue, McBride, BC V0J 2E0
250-569-2266
Trades Central Training Centre 200-1268 Fifth Avenue, Prince George, BC
250-561-0531
Valemount Learning Centre PO Box 789, 99 Gorse St., Valemount, BC V0E 2Z0
250-566-4601 www.valemountlearningcentre.org
Data Source: Northern Development Research – www.northerndevelopment.bc.ca
52
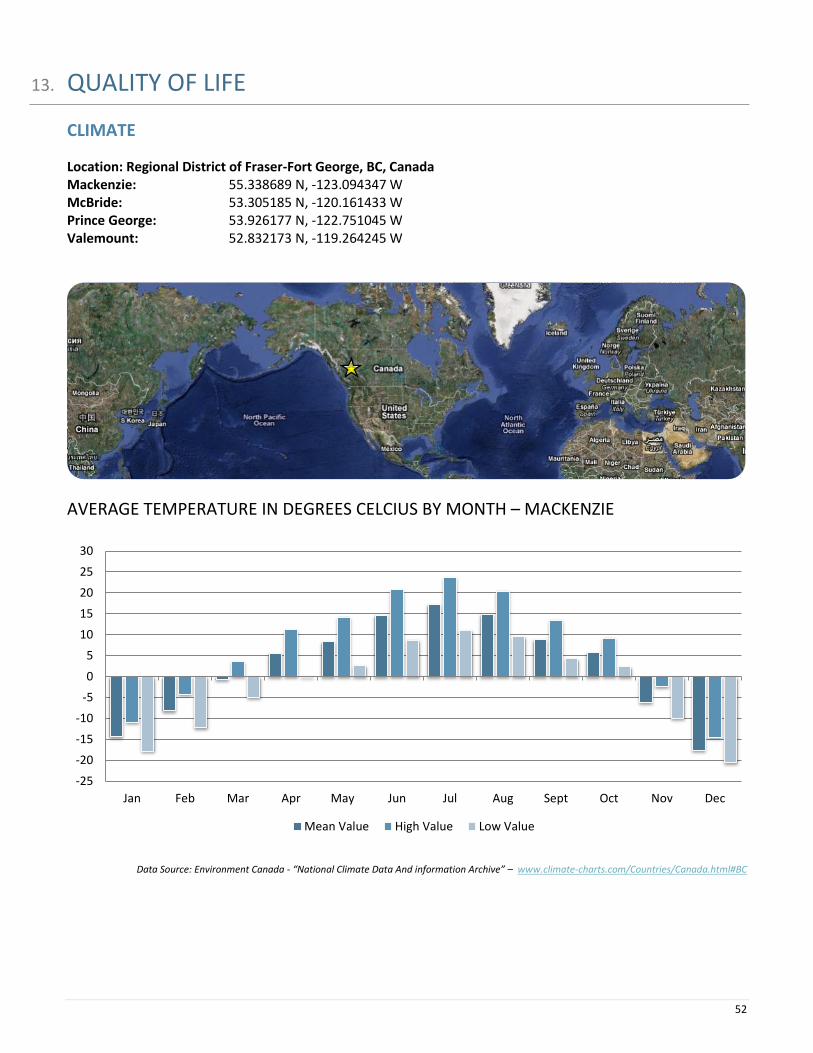
13. QUALITY OF LIFE
CLIMATE
Location: Regional District of Fraser-Fort George, BC, Canada Mackenzie: 55.338689 N, -123.094347 W McBride: 53.305185 N, -120.161433 W Prince George: 53.926177 N, -122.751045 W Valemount: 52.832173 N, -119.264245 W
AVERAGE TEMPERATURE IN DEGREES CELCIUS BY MONTH – MACKENZIE
Data Source: Environment Canada - “National Climate Data And information Archive” – www.climate-charts.com/Countries/Canada.html#BC
-25
-20
-15
-10
-5
0
5
10
15
20
25
30
Jan Feb Mar Apr May Jun Jul Aug Sept Oct Nov Dec
Mean Value High Value Low Value
53
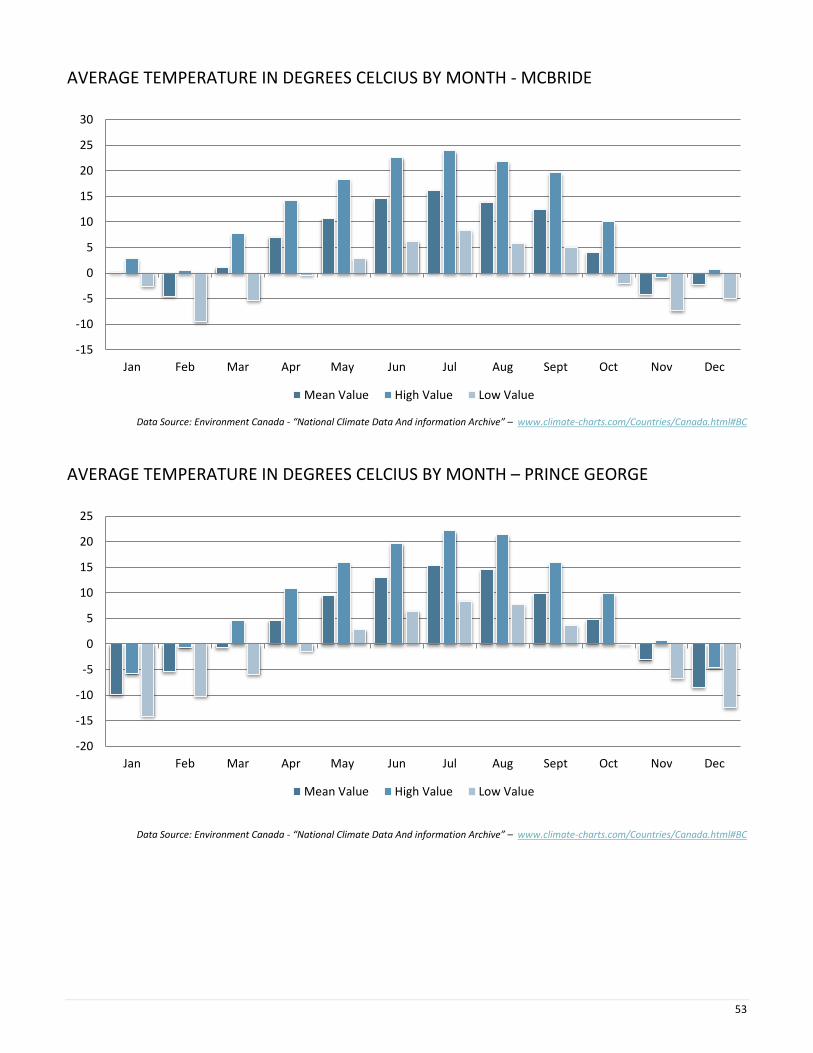
AVERAGE TEMPERATURE IN DEGREES CELCIUS BY MONTH - MCBRIDE
Data Source: Environment Canada - “National Climate Data And information Archive” – www.climate-charts.com/Countries/Canada.html#BC
AVERAGE TEMPERATURE IN DEGREES CELCIUS BY MONTH – PRINCE GEORGE
Data Source: Environment Canada - “National Climate Data And information Archive” – www.climate-charts.com/Countries/Canada.html#BC
-15
-10
-5
0
5
10
15
20
25
30
Jan Feb Mar Apr May Jun Jul Aug Sept Oct Nov Dec
Mean Value High Value Low Value
-20
-15
-10
-5
0
5
10
15
20
25
Jan Feb Mar Apr May Jun Jul Aug Sept Oct Nov Dec
Mean Value High Value Low Value
54
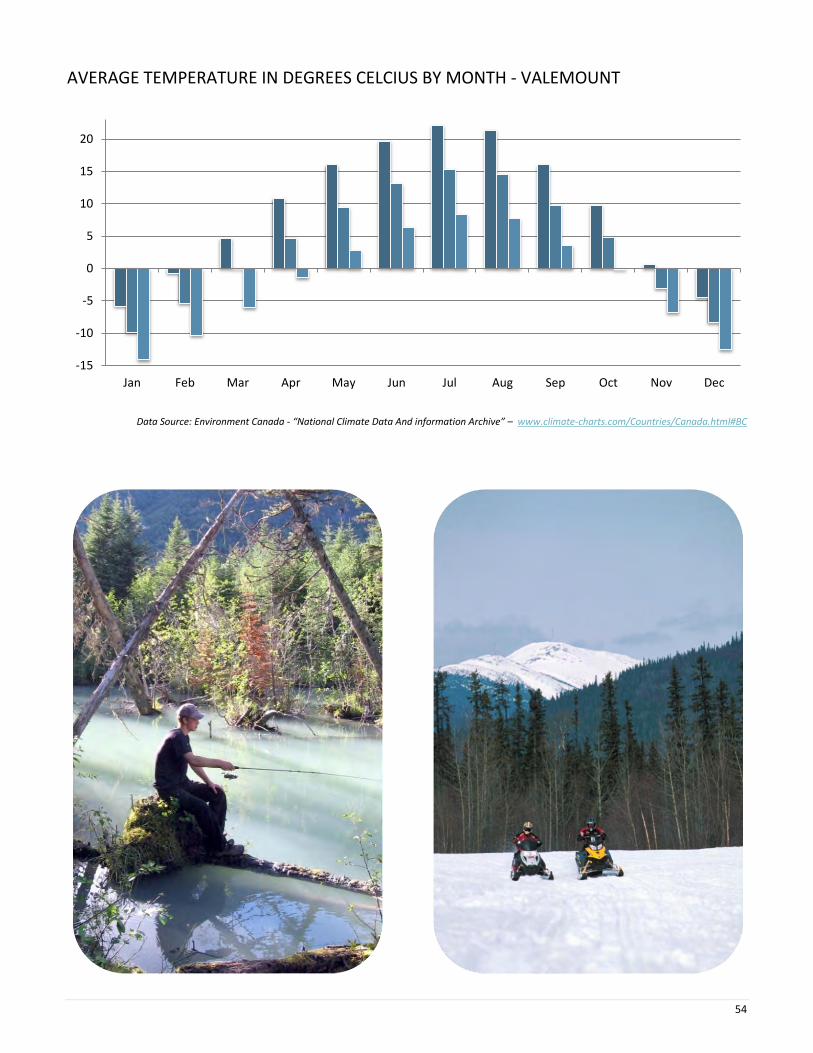
AVERAGE TEMPERATURE IN DEGREES CELCIUS BY MONTH - VALEMOUNT
Data Source: Environment Canada - “National Climate Data And information Archive” – www.climate-charts.com/Countries/Canada.html#BC
-15
-10
-5
0
5
10
15
20
Jan Feb Mar Apr May Jun Jul Aug Sep Oct Nov Dec
55
CULTURE
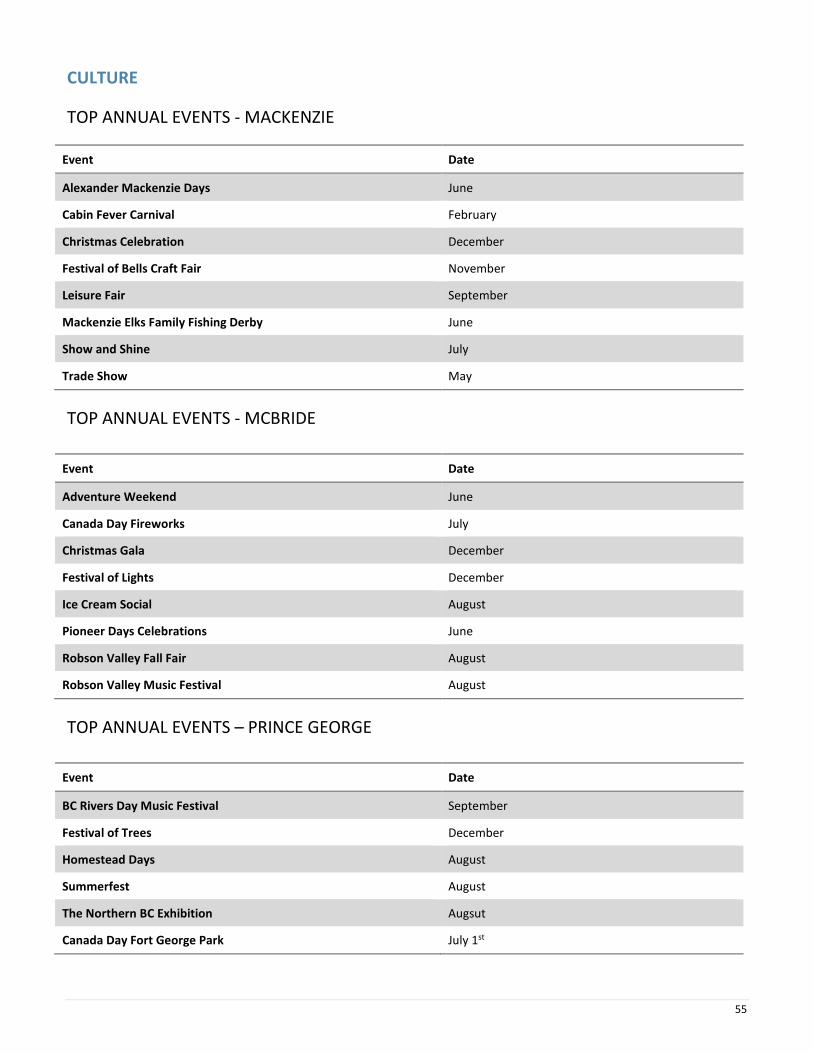
TOP ANNUAL EVENTS - MACKENZIE
Event Date
Alexander Mackenzie Days June
Cabin Fever Carnival February
Christmas Celebration December
Festival of Bells Craft Fair November
Leisure Fair September
Mackenzie Elks Family Fishing Derby June
Show and Shine July
Trade Show May
TOP ANNUAL EVENTS - MCBRIDE
Event Date
Adventure Weekend June
Canada Day Fireworks July
Christmas Gala December
Festival of Lights December
Ice Cream Social August
Pioneer Days Celebrations June
Robson Valley Fall Fair August
Robson Valley Music Festival August
TOP ANNUAL EVENTS – PRINCE GEORGE
Event Date
BC Rivers Day Music Festival September
Festival of Trees December
Homestead Days August
Summerfest August
The Northern BC Exhibition Augsut
Canada Day Fort George Park July 1st
56
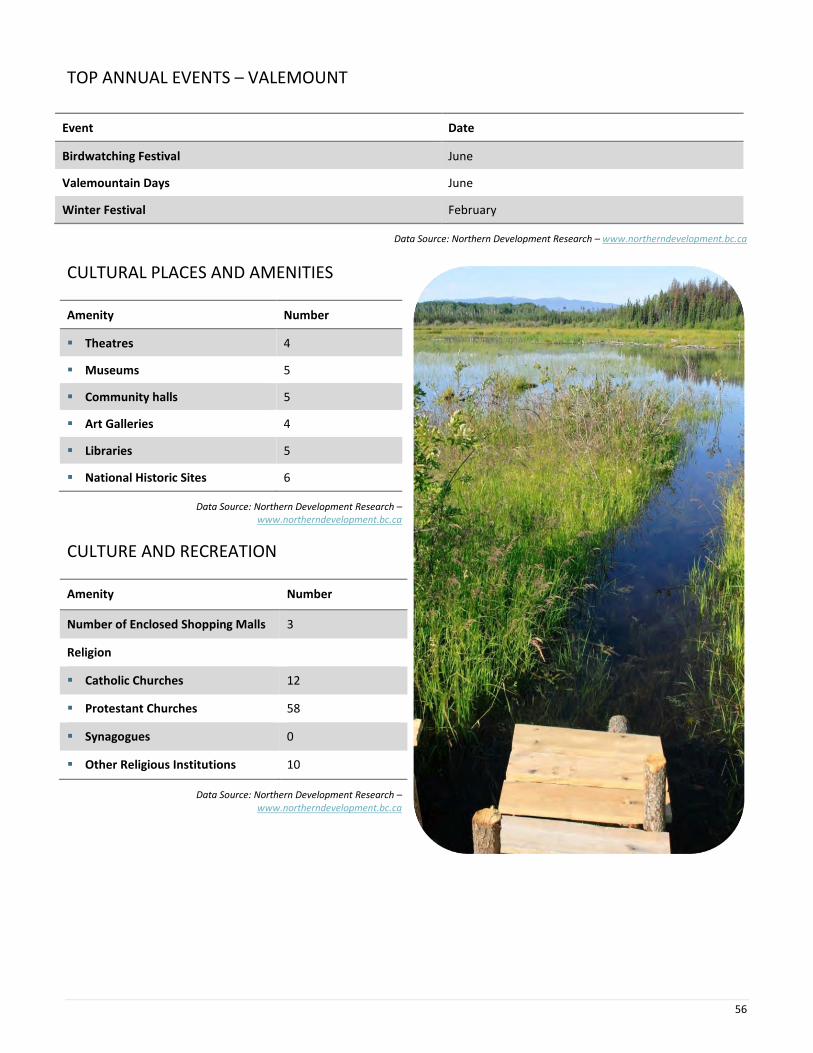
TOP ANNUAL EVENTS – VALEMOUNT
Event Date
Birdwatching Festival June
Valemountain Days June
Winter Festival February
Data Source: Northern Development Research – www.northerndevelopment.bc.ca
CULTURAL PLACES AND AMENITIES
Amenity Number
Theatres 4
Museums 5
Community halls 5
Art Galleries 4
Libraries 5
National Historic Sites 6
Data Source: Northern Development Research – www.northerndevelopment.bc.ca
CULTURE AND RECREATION
Amenity Number
Number of Enclosed Shopping Malls 3
Religion
Catholic Churches 12
Protestant Churches 58
Synagogues 0
Other Religious Institutions 10
Data Source: Northern Development Research – www.northerndevelopment.bc.ca
57
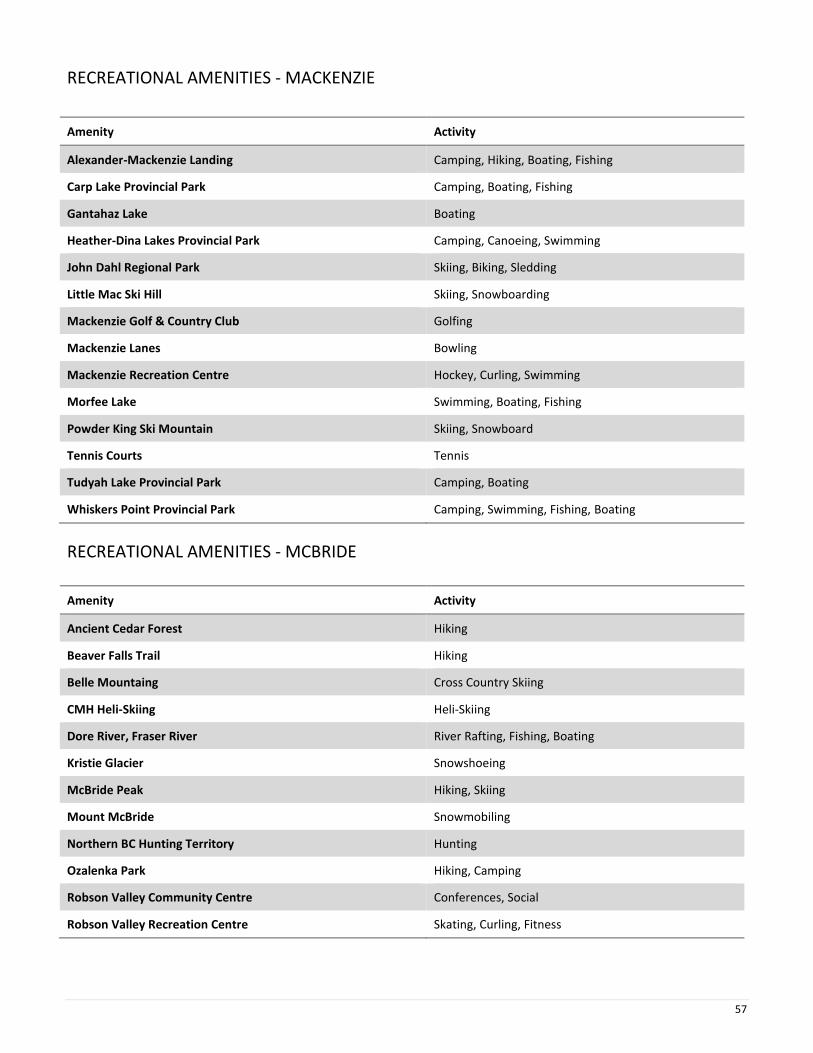
RECREATIONAL AMENITIES - MACKENZIE
RECREATIONAL AMENITIES - MCBRIDE
Amenity Activity
Alexander-Mackenzie Landing Camping, Hiking, Boating, Fishing
Carp Lake Provincial Park Camping, Boating, Fishing
Gantahaz Lake Boating
Heather-Dina Lakes Provincial Park Camping, Canoeing, Swimming
John Dahl Regional Park Skiing, Biking, Sledding
Little Mac Ski Hill Skiing, Snowboarding
Mackenzie Golf & Country Club Golfing
Mackenzie Lanes Bowling
Mackenzie Recreation Centre Hockey, Curling, Swimming
Morfee Lake Swimming, Boating, Fishing
Powder King Ski Mountain Skiing, Snowboard
Tennis Courts Tennis
Tudyah Lake Provincial Park Camping, Boating
Whiskers Point Provincial Park Camping, Swimming, Fishing, Boating
Amenity Activity
Ancient Cedar Forest Hiking
Beaver Falls Trail Hiking
Belle Mountaing Cross Country Skiing
CMH Heli-Skiing Heli-Skiing
Dore River, Fraser River River Rafting, Fishing, Boating
Kristie Glacier Snowshoeing
McBride Peak Hiking, Skiing
Mount McBride Snowmobiling
Northern BC Hunting Territory Hunting
Ozalenka Park Hiking, Camping
Robson Valley Community Centre Conferences, Social
Robson Valley Recreation Centre Skating, Curling, Fitness
58
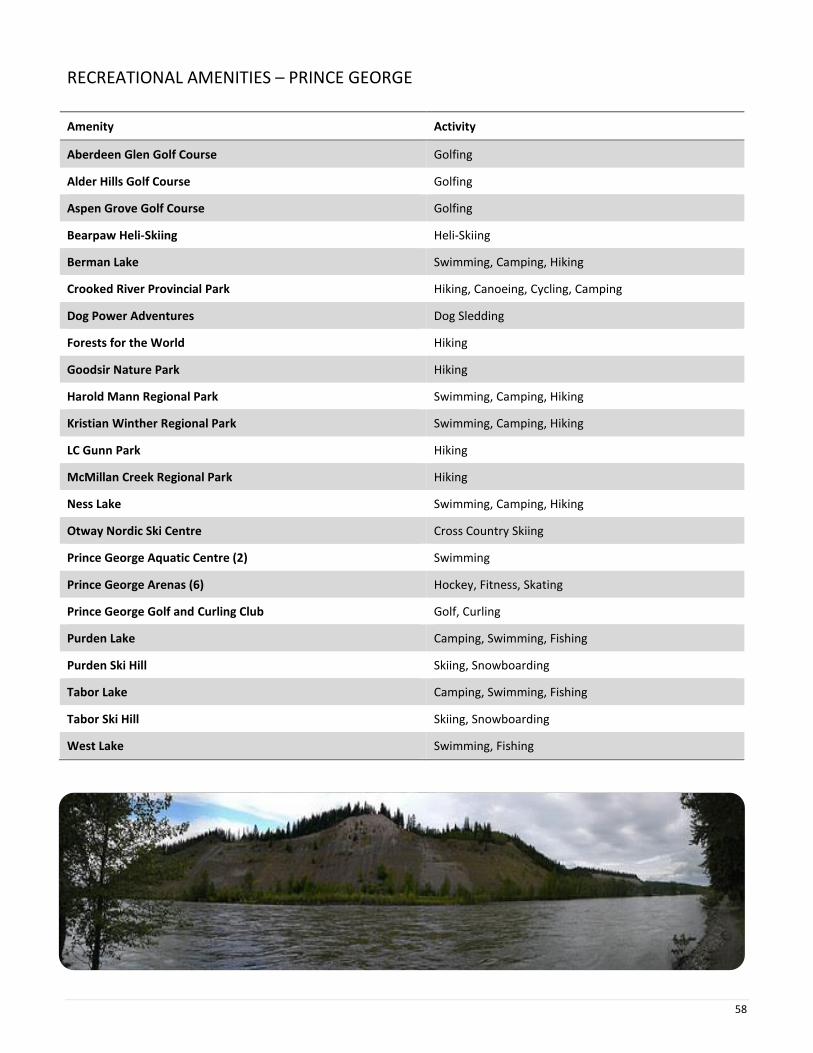
RECREATIONAL AMENITIES – PRINCE GEORGE
Amenity Activity
Aberdeen Glen Golf Course Golfing
Alder Hills Golf Course Golfing
Aspen Grove Golf Course Golfing
Bearpaw Heli-Skiing Heli-Skiing
Berman Lake Swimming, Camping, Hiking
Crooked River Provincial Park Hiking, Canoeing, Cycling, Camping
Dog Power Adventures Dog Sledding
Forests for the World Hiking
Goodsir Nature Park Hiking
Harold Mann Regional Park Swimming, Camping, Hiking
Kristian Winther Regional Park Swimming, Camping, Hiking
LC Gunn Park Hiking
McMillan Creek Regional Park Hiking
Ness Lake Swimming, Camping, Hiking
Otway Nordic Ski Centre Cross Country Skiing
Prince George Aquatic Centre (2) Swimming
Prince George Arenas (6) Hockey, Fitness, Skating
Prince George Golf and Curling Club Golf, Curling
Purden Lake Camping, Swimming, Fishing
Purden Ski Hill Skiing, Snowboarding
Tabor Lake Camping, Swimming, Fishing
Tabor Ski Hill Skiing, Snowboarding
West Lake Swimming, Fishing
59
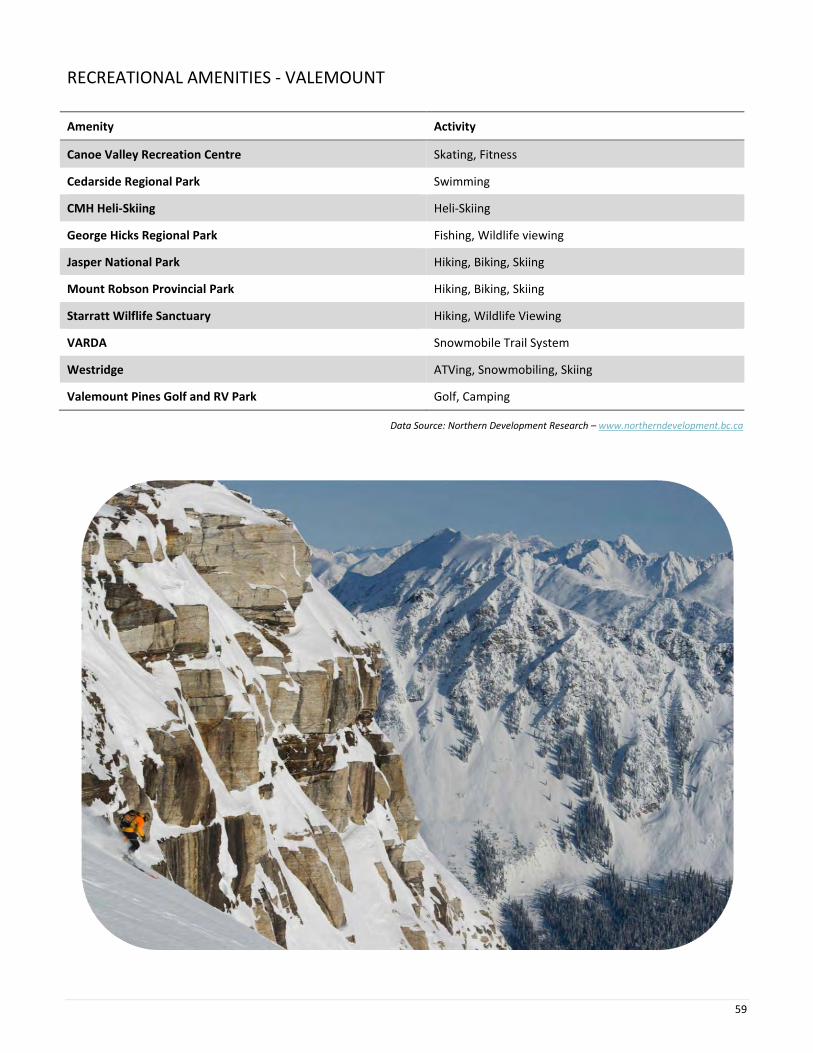
RECREATIONAL AMENITIES - VALEMOUNT
Data Source: Northern Development Research – www.northerndevelopment.bc.ca
Amenity Activity
Canoe Valley Recreation Centre Skating, Fitness
Cedarside Regional Park Swimming
CMH Heli-Skiing Heli-Skiing
George Hicks Regional Park Fishing, Wildlife viewing
Jasper National Park Hiking, Biking, Skiing
Mount Robson Provincial Park Hiking, Biking, Skiing
Starratt Wilflife Sanctuary Hiking, Wildlife Viewing
VARDA Snowmobile Trail System
Westridge ATVing, Snowmobiling, Skiing
Valemount Pines Golf and RV Park Golf, Camping
60
HEALTH
HOSPITALS
Hospital Location Teaching Hospital
Number of Beds
Outpatient Clinic
Contact Phone
Mackenzie & District Hospital
Mackenzie No 9 Yes 45 Centennial Drive Mackenzie, BC V0J 2C0
250-997-3263
McBride & District Hospital
McBride No 16 No Box 128, 1135 5th Ave McBride, BC V0J 2E0
250-569-2251
University Hospital of Northern BC
Prince George Yes 220 Yes 1475 Edmonton Street Prince George, BC V2M 1S2
250-565-2000
Valemount Health Centre
Valemount No 0 No 1455 5th Ave, Valemount, BC V0E 2Z0
250-556-9138
Data Source: Northern Development Research – www.northerndevelopment.bc.ca
PHYSICIANS AND DENTISTS
Health Providers Number
Physicians 98
Dentists 43
Data Source: Northern Development Research – www.northerndevelopment.bc.ca
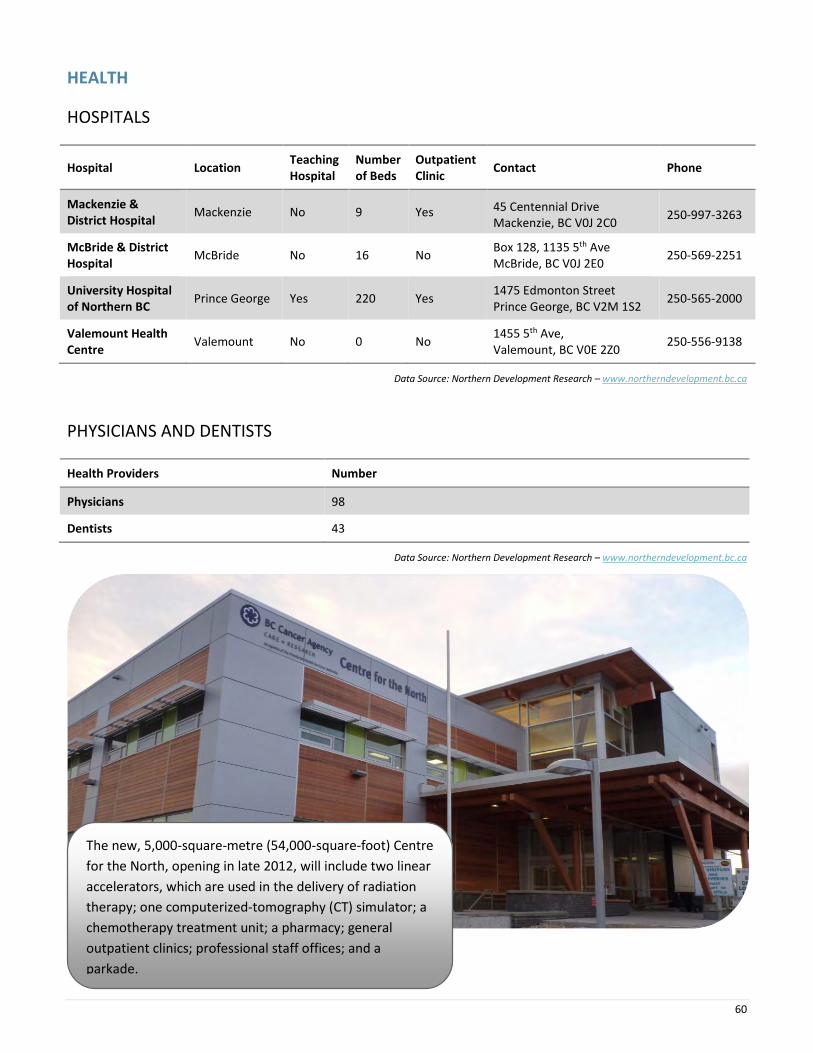
The new, 5,000-square-metre (54,000-square-foot) Centre
for the North, opening in late 2012, will include two linear
accelerators, which are used in the delivery of radiation
therapy; one computerized-tomography (CT) simulator; a
chemotherapy treatment unit; a pharmacy; general
outpatient clinics; professional staff offices; and a
parkade.
Jim Martin Chief Administrative Officer
Regional District of Fraser-Fort George
155 George Street, Prince George, BC V2L 1P8
Tel: 250-960-4400
Email: [email protected]
Website: www.rdffg.bc.ca
Facebook: facebook.com/rdffg
Robson Valley Region
Email: [email protected]
Website: www.DiscoverRVR.ca
Facebook: RobsonValleyRegion
Northern Development Initiative Trust
Contact for information on financial incentives for manufacturing companies
Invest BC
Contact for investor site selection and expansion services.
www.northerndevelopment.bc.ca www.investbc.com