Fracture toughness and fatigue crack growth rate ... · Fracture toughness and fatigue crack growth...
14
Fracture toughness and fatigue crack growth rate properties in wire + arc additive manufactured Ti-6Al-4V X ZHANG 1,2 , F MARTINA 1 , J DING 1 , X WANG 1,2 and SW WILLIAMS 1 1 School of Aerospace, Transport and Manufacturing, Cranfield University, UK, 2 Faculty of Engineering, Environment & Computing, Coventry University, UK Received Date: 30 July 2016; Accepted Date: 17 October 2016; Published Online: ABSTRACT This paper presents an experimental investigation of the fracture and fatigue crack growth properties of Ti-6Al-4V produced by the Wire + Arc Additive Manufacture (WAAM®) process. First, fracture toughness was measured for two different orientations with respect to the build direction; the effect of wire oxygen content and build strategy were also evaluated in the light of microstructure examination. Second, fatigue crack growth rates were measured for fully additive manufactured samples, as well as for samples containing an interface between WAAM® and wrought materials. The latter category covers five different scenarios of crack location and orientation with respect to the interface. Fatigue crack growth rates are compared with that of the wrought or WAAM® alone conditions. Crack growth trajectory of these tests is discussed in relation to the microstructure characteristics. Keywords fatigue crack growth; fracture toughness; microstructure; titanium; wire + arc additive manufacture. NOMENCLATURE a = Crack length B = Compact tension specimen thickness K IC = Plane-strain fracture toughness K Q = Conditional fracture toughness value P max = Applied load at fracture P Q = Conditional load value at fracture determined by ASTM Standard W = Compact tension specimen width σ ys = Material yield strength under tension load INTRODUCTION Titanium alloy Ti-6Al-4V (Ti64) has been used in the aerospace and other industries owing to its high specific strength, excellent resistance to fatigue and corrosion, and good performance at elevated temperature. With the increasing use of carbon fibre polymer composites in the airframes, titanium will be increasingly used because of its good compatibility with this material. However, titanium alloys are extremely expensive and very difficult to machine, if compared with other aero- space alloys such as aluminium. Therefore, using the Ad- ditive Manufacture (AM) technology to build titanium parts has become very attractive owing to the significant reduction in material waste, machining and tooling cost, manufacturing energy and time to market. Conventional powder bed AM also makes it possible to easily produce complicated parts. However, the cost of material powder is usually particularly high, which affects the overall cost of the process. This drawback is counterbalanced by the reduced material waste. Studies have shown that AM can be an economically and environmentally superior option to the traditional methods of machining from cast or forged billets for production in small batches. 1,2 The Wire + Arc Additive Manufacture (WAAM®) process works by feeding a wire at controlled rate into an electric or plasma arc, to melt the wire onto a substrate or previously deposited layers. It has found applications Correspondence: Xiang Zhang. E-mail: [email protected] WAAM® is a registered trademark of Cranfield University. © 2016 The Authors Fatigue & Fracture of Engineering Materials & Structures Published by John Wiley & Sons Ltd. Fatigue Fract Engng Mater Struct 00 1–14 1 ORIGINAL CONTRIBUTION doi: 10.1111/ffe.12547 This is an open access article under the terms of the Creative Commons Attribution License, which permits use, distribution and reproduction in any medium, provided the original work is properly cited.
Transcript of Fracture toughness and fatigue crack growth rate ... · Fracture toughness and fatigue crack growth...
Fracture toughness and fatigue crack growth rate properties in wire+arc additive manufactured Ti-6Al-4V
X ZHANG1,2, F MARTINA1, J DING1, X WANG1,2 and SW WILLIAMS11School of Aerospace, Transport and Manufacturing, Cranfield University, UK, 2Faculty of Engineering, Environment & Computing, CoventryUniversity, UK
Received Date: 30 July 2016; Accepted Date: 17 October 2016; Published Online:
ABSTRACT This paper presents an experimental investigation of the fracture and fatigue crackgrowth properties of Ti-6Al-4V produced by the Wire +Arc Additive Manufacture(WAAM®) process. First, fracture toughness was measured for two different orientationswith respect to the build direction; the effect of wire oxygen content and build strategywere also evaluated in the light of microstructure examination. Second, fatigue crackgrowth rates were measured for fully additive manufactured samples, as well as forsamples containing an interface between WAAM® and wrought materials. The lattercategory covers five different scenarios of crack location and orientation with respectto the interface. Fatigue crack growth rates are compared with that of the wrought orWAAM® alone conditions. Crack growth trajectory of these tests is discussed in relationto the microstructure characteristics.
Keywords fatigue crack growth; fracture toughness; microstructure; titanium; wire + arcadditive manufacture.
NOMENCLATURE a = Crack lengthB = Compact tension specimen thickness
KIC = Plane-strain fracture toughnessKQ = Conditional fracture toughness value
Pmax = Applied load at fracturePQ = Conditional load value at fracture determined by ASTM StandardW = Compact tension specimen widthσys = Material yield strength under tension load
INTRODUCT ION
Titanium alloy Ti-6Al-4V (Ti64) has been used in theaerospace and other industries owing to its high specificstrength, excellent resistance to fatigue and corrosion,and good performance at elevated temperature. Withthe increasing use of carbon fibre polymer compositesin the airframes, titanium will be increasingly usedbecause of its good compatibility with this material.However, titanium alloys are extremely expensive andvery difficult to machine, if compared with other aero-space alloys such as aluminium. Therefore, using the Ad-ditive Manufacture (AM) technology to build titaniumparts has become very attractive owing to the significant
reduction in material waste, machining and tooling cost,manufacturing energy and time to market. Conventionalpowder bed AM also makes it possible to easily producecomplicated parts. However, the cost of material powderis usually particularly high, which affects the overall costof the process. This drawback is counterbalanced by thereduced material waste. Studies have shown that AMcan be an economically and environmentally superioroption to the traditional methods of machining from castor forged billets for production in small batches.1,2
The Wire +Arc Additive Manufacture (WAAM®)process works by feeding a wire at controlled rate intoan electric or plasma arc, to melt the wire onto a substrateor previously deposited layers. It has found applications
Correspondence: Xiang Zhang. E-mail: [email protected]® is a registered trademark of Cranfield University.
© 2016 The Authors Fatigue & Fracture of Engineering Materials & Structures Published by John Wiley & Sons Ltd. Fatigue Fract Engng Mater Struct 00 1–14 1
ORIGINAL CONTRIBUTION doi: 10.1111/ffe.12547
This is an open access article under the terms of the Creative Commons Attribution License, which permits use, distribution and reproductionin any medium, provided the original work is properly cited.
e805814
Text Box
Fatique & Fracture of Engineering Materials & Structures, Volume 40, Issue 5, 2017, pp. 790-803 DOI: 10.1111/ffe.12547
e805814
Text Box

in the aerospace and other industrial sectors. The keyadvantage of wire-based AM if compared with powder-based processes is that WAAM® can produce large, nearnet shape parts with a deposition of several kilogramsper hour, at acceptable cost and in reasonable times.3,4
Furthermore, wire has much less safety issues. However,as-deposited WAAM® parts have lower accuracy indimension and surface roughness; therefore, a finish-machining pass is most likely required.5
One of the main barriers to the widespread applica-tion of AM to aerospace components is the lack ofsystematic knowledge of mechanical properties, particu-larly the fatigue and fracture response under service loadconditions, which is a key design requirement for productqualification and certification.2 Changes to the micro-structure and tensile residual stresses arising from themanufacturing process have been recognised as the mainfactors affecting the mechanical properties of AM com-ponents.6–10 While the reductions of structural weightand manufacturing cost have been the main driver tothe development of AM technology, durability and dam-age tolerance capabilities are primary and mandatoryrequirements for commercial transport. One of the strin-gent damage tolerance requirements is the capability ofpredicting fatigue crack growth life and residual strengthdue to accidental damage. For the AM alloys, this setstwo challenges: the development of adequate design toolsand predictive models; and the creation of a materialproperty database [e.g. static strength, high cycle fatiguestrength, fracture toughness and fatigue crack growthrates (FCGR)]. Because the AM process produces alloyswith anisotropic and inhomogeneous properties,7
different microstructure from the wrought alloy7,11 andnon-uniform residual stresses,12–15 it is important to in-vestigate the fracture toughness and fatigue crack growthproperties for what is effectively a new material form.
To date, most published work reports the static andfatigue strength properties, and only a small number ofpublications are available on the fracture toughnessand FCGR properties of Ti64 fabricated by powder bedor powder feed AM processes, for example via theelectron beam melting (EBM),16 selective laser melting(SLM)17–23 and laser engineered net shaping (LENS)24
The value of the apparent fracture toughness of theEBM Ti64 was found to be greater than a reference valuein annealed condition,16 which was attributed to the AMmetal’s coarse-grained basket-weave microstructure thatincreases the resistance to fracture. This is also reportedfor the laser engineered net shaping fabricated Ti6424
The SLM Ti64 however is found to have lower fracturetoughness than the wrought and cast forms.17,19 In bothstudies, the authors attributed the inferior fracturetoughness in the as-built form to the fine and brittle acic-ular martensitic structure caused by rapid solidification of
the material. In terms of the FCGR, the EBM Ti64exhibited slower crack growth rates in the Paris law regionthan that in the wrought condition, in both orientations,16
whereas FCGR in the SLMTi64 in the as-built conditionwas faster in the lower ΔK region (15–30MPa√m) andslower in the higher ΔK region (30–80MPa√m) at loadratio of 0.1.17 Similar trend was found by another study,19
in which SLM Ti64 had slower FCGR than the wroughtalloy in all three orientations at load ratio 0.1. However,another study recorded faster crack growth rate (by amagnitude) comparing with a reference alloy producedby conventional process.18 This was also tested at load ra-tio 0.1. The authors attributed the faster crack growth rateto the process induced porosity and residual stresses. Inthe same study,18 for heat-treated andHot Isostatic Press-ing (HIP) treated conditions, crack growth rates are foundto be comparable with, or slower than the referencewrought alloy. Computer tomography revealed that po-rosity was reduced byHIP process to a level below the res-olution limit of 22μm. Therefore, it is worth noting theremarkable effect of post-build heat treatments, such asstress relief annealing or HIP. FCGR is significantly re-duced by annealing,21,22 and the threshold value of stressintensity factor (SIF) range is increased23 There are alsowork on using heat and mechanical treatments to improvethe high cycle fatigue strength in AM build nickel25 andsteel alloys.26
Discrepancies in published crack growth rates can alsoarise from post-build machining. For example, specimensused in the work17,19 were machined from oversizedblocks, for example from 65 × 65 × 5mm block to C(T)sample of 50mm wide and 4mm thick.19 Conversely, inanother work18 surfaces were left in the as-built condi-tion20 as the aim was to test the three conditions of as-built, heat-treated and HIP. Therefore, specimens in18
may have surface roughness and internal defects thatmight have resulted in greater crack growth rate in theas-built condition. Furthermore, specimen size can alsoaffect the magnitude of residual stress. Study in12 showsthat residual stress is released considerably by machiningtest samples from a larger piece. Therefore, samples ex-tracted from oversized block in17,19 may have reducedthe residual stress magnitude and surface defectsresulting in slower crack growth rates.
In summary, EBM Ti64 has comparable or superiorfracture toughness and crack growth rates than wroughtcondition owing the building at elevated temperatureresulting in negligible residual stress. The as-built SLMhas poorer fracture and crack growth rate properties be-cause of internal porosity, surface roughness and residualstress. In general, hotter build process results in more duc-tilemicrostructure than that of SLM,which is richer inmar-tensite, strong but brittle.17,19 Both heat treatment and HIPprocesses can significantly improve these properties.21–23
2 X. ZHANG et al.
© 2016 The Authors Fatigue & Fracture of Engineering Materials & Structures Published by John Wiley & Sons Ltd. Fatigue Fract Engng Mater Struct 00 1–14

So far, there is no published work on the fracturetoughness and fatigue crack growth properties in thewire-fed AM Ti64. From a geometrical point of view,WAAM® can produce deposits of varying thickness bychanging process parameters, such as the current, wirefeed speed (WFS) or travel speed (TS). However, thereis an upper limit with regards to the maximum width thancan be produced with one bead only. If larger thicknessesare required, these can be achieved by laying beads nextto each other in a parallel fashion, in which case the totalwidth will be equal to the sum of the individual beads mi-nus the overlap. Alternatively, the deposition head can bemoved across the travel direction, in which case the totalwidth will be roughly equal to the oscillation range. Eachof these three deposition strategies will result in differentthermal conditions and consequently different micro-structures and residual stress variations.
This paper presents a series of experimental tests onthe fracture and fatigue crack growth performance ofTi64 produced by the WAAM® process. The main ob-jective is to obtain the fracture toughness and FCGRproperties for this new material form to support its appli-cation in safety critical components that are based on thedamage tolerance design criterion. Work reported in thispaper are: (i) fracture toughness, and effects of build di-rection, deposition strategy and wire oxygen content,(ii) FCGR, and (iii) crack propagation behaviour in theproximity of the interface betweenWAAM® and wroughtsubstrate. This is particularly relevant to the damage toler-ant design at connections to the substrate: in some compo-nents produced byWAAM® the starting plate will be partof the final component, hence the properties at the inter-face, where the crack location and/or orientation withrespect to the interface and loading direction can affectthe crack growth behaviour, must be characterised.
EXPER IMENTAL
Deposition process
Straight walls were manufactured using a EWM T552Tetrix Plasma power source. The motion was providedby a six-axis Fanuc Robot Arc Mate 120iB. Two typesof aerospace 1.2mm diameter Ti64 welding wire wereused, grade 5 and 23, respectively; their chemical compo-sition is shown in Table 1. The deposition parameters forthe single, parallel and oscillation strategies are provided
in Table 2 and their tool paths in Fig. 1. The single beaddeposition strategy gave a deposit width of 8mm, whilethe parallel and oscillation ones gave a width of 21mm.Regardless of the strategy, shielding of the molten poolwas provided by blowing BOC Pure Shield Argon at8 l/min, and the plasma gas flow rate was 0.8 l/min; theinter-layer cooling time was 60 s. Deposition was per-formed in an inert atmosphere, inside a welding tent filledalso with BOC Pure Shield Argon. In the tent, theachieved oxygen concentration, measured by an oxygenanalyser, was generally between 200–600ppm. The tem-perature of the room during welding was constant at 20 °C.
Specimens
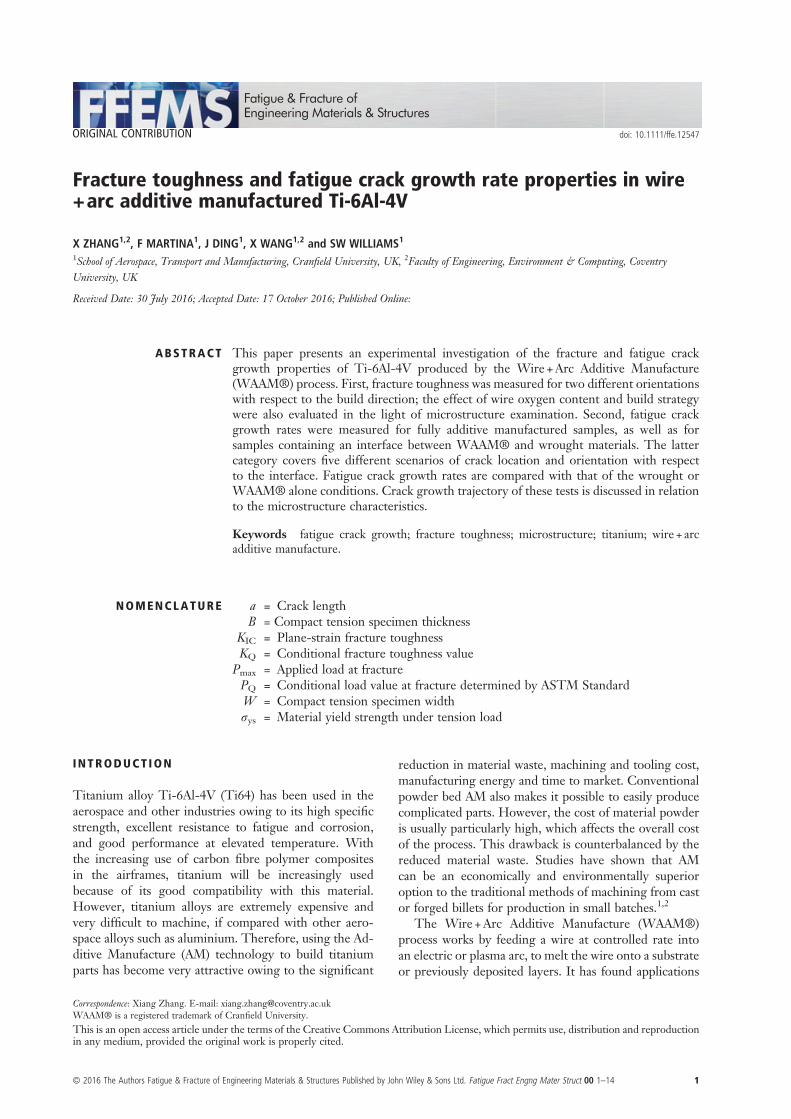
The standard Compact Tension [C(T)] geometry (Fig. 2)was used for all three types of tests. Electron DischargeMachining (EDM) was used to extract the specimensfrom the walls and to cut the notch. Pre-cracking testwas conducted to generate a crack from the notch rootto ensure that the formal test is free of the notch root ef-fect. Crack length generated at the end of pre-crackingtest is recommended to be in the range of 0.45–0.55W.In this work, the starting crack length was 35mm, equalto 0.5W.
Fracture toughness tests
Two different thicknesses were tested at 5mm and19mm (these are the net thickness after surface machin-ing fromWAAM® deposit); both at the width dimensionW = 70mm, according to the ASTM E399 standard27 forobtaining the apparent fracture toughness for a specifiedgeometry. Two material orientations were tested, that iscrack either in parallel or perpendicular to the WAAM®build direction. For the 5mm thick material, four speci-mens were extracted from a WAAM® wall built on a flatsubstrate made of wrought Ti64 (Fig. 3a), that is twosamples with the first orientation and other two withthe second one.
Table 1 Chemical compositions of the wires used for the present investigation
Ti Al V Fe O C N H TOE Y Others
Grade 5 Bal. 6.14 3.96 0.18 0.14 0.02 0.011 0.001 <0.1 <0.001 <0.05Grade 23 Bal. 6.18 4.02 0.099 0.052 0.021 0.0054 0.0016 <0.1 <0.0004 <0.03
Table 2 WAAM® deposition parameters
Depositionstrategy
Current(A)
WFS(m/min)
TS(mm/s)
Voltage(V)
Layerheight(mm)
Single pass 145 2 4.5 19.9 1.25Oscillation 150 2.3 4.75 20.1 1.50Parallel 160 2.2 4.5 20.7 1.50
F A T I G U E C R A C K A N D F R A C T U R E P R O P E R T I E S I N W A AM T I - 6A L - 4V 3
© 2016 The Authors Fatigue & Fracture of Engineering Materials & Structures Published by John Wiley & Sons Ltd. Fatigue Fract Engng Mater Struct 00 1–14
The 19mm thick test specimens are extracted from21mm thick deposited walls. After surface machiningthe thickness is 19mm. Three straight walls were built.
• parallel deposition strategy using Ti64 grade 5;• oscillation deposition strategy using Ti64 grade 5;• parallel deposition strategy using Ti64 grade 23.
Fatigue crack propagation in WAAM® alloy
C(T) specimens extracted from a wall produced withthe single bead deposition strategy were tested. Their
dimensions were W = 70mm and B = 5mm. Two materialorientations were tested, that is crack travelling along thelayers, or across the layers. Tests and data reduction wereconducted according to the ASTM E647 standard.28
Fatigue crack propagation near WAAM®-wrought interface
WAAM® was used to produce a straight wall along theedge of the starting plate, which was held vertically, usingthe single bead deposition strategy. The deposited wallsmeasured 445mm in length and 120mm in height, soto produce effectively a structure which has half depos-ited material and half wrought. Five C(T) specimenswere cut off from each wall representing five differentcrack location or orientation scenarios with respect tothe WAAM®-substrate interface as shown in Fig. 3b.All specimens were 6mm thick (after surface machining).Each test was repeated three times. The type A and Cspecimens have the interface aligned parallel to the ap-plied load direction; in A, the initial crack started in theWAAM® portion; in C, the initial crack started in thewrought portion. The other three types all have the in-terface perpendicular to the applied load and the initialcrack started at different material zones, that is on the in-terface (type B), or in theWAAM® portion (D), or in thewrought portion (E).
TestingFracture toughness testing
Fracture toughness test was conducted according to theASTM E399 standard27 using Instron machines of loadcapacity of 100 kN for the 19mm thick specimens and50 kN for the 5mm thickness. Test was also conductedon 19mm thick wrought Ti64 for comparison. A crackopening displacement (COD) gauge was used to measurethe crack mouth displacement. The loading rate was4mm/min. Applied load versus crack opening displace-ment was measured and then used to determine the
Fig. 1 Schematic of the tool path for the three deposition strategies (planar view).
Fig. 2 Compact Tension (C(T)) specimen used for fracture tough-ness and fatigue crack growth rate tests. Dimensions: W = 70 forall thickness values reported in this paper. Thickness values refer tothe finishing thickness (after surface machining). B = 5mm for crackgrowth rate test in WAAM® alloy; B = 6mm for crack growth ratetest in WAAM®-wrought interface specimens; B = 19mm for frac-ture toughness tests of all three different WAAM® depositionstrategies (unit: mm).
4 X. ZHANG et al.
© 2016 The Authors Fatigue & Fracture of Engineering Materials & Structures Published by John Wiley & Sons Ltd. Fatigue Fract Engng Mater Struct 00 1–14

maximum load at fracture Pmax and the conditional valuePQ as shown in Fig. 4.
Fatigue crack growth testing
Pre-cracking test was conducted at the maximum appliedload of 6 kN, load ratio 0.1 and loading frequency 10Hz.Fatigue crack growth test was conducted at the same loadratio and frequency at the maximum applied load 5 kN.Crack length was measured by a travelling optical micro-scope of ×7 magnification. Crack growth rate as function
of the SIF range was deduced from the measured cracklength versus cycle number data using the 7-point poly-nomial method according to the ASTM E647 standard.28
Optical observation
Optical observation was performed after the tests at bothmacro and microscopic levels. Recommended procedureswere followed for sample preparation, that is grinding,polishing and etching. Because the thickness of fatiguecrack specimens was 6mm, a 13mm thick aluminiumblock was bonded to each of the OM samples to assistthe polishing process.
RESULTS & DISCUSS ION
Fracture toughness
First, conditional fracture toughness value (KQ) was cal-culated for each test case according to ASTM E39927
Values are presented in Table 3. To obtain the plane-strain fracture toughness (KIC), test results must satisfythe following two requirements:
Pmax=PQ < 1:10 (1)
2:5KQ
σys
! "2
< W ! að Þ (2)
Fig. 3 a: Schematic of a WAAM® deposited wall and two orientations of specimens for fracture toughness tests. Four walls were made: forGrade 5 Ti64 using the single (8mm thick), parallel (21mm thick) and oscillation (21mm thick) deposition strategies, and for Grade 23using the parallel (21mm thick) deposition strategy. Thickness values refer to the as-deposited condition, that is before surface machining(unit: mm). b Layout of five types of specimens on a WAAM®-substrate wall for fatigue crack growth tests (unit: mm). The thickness of thedeposit was 8mm. The final thickness of the C(T) specimens is 6 mm after machining. (Note: type B, D and E specimens have the same di-mension as type A and C. Crack on B specimen is at the WAAM®-substrate interface; crack is 3 mm above the interface in D and 3mm belowthe interface in E.)
Fig. 4 Measured force versus crack mouth opening displacement infracture toughness test, demonstrating the determination of PQ.According to ASTM E399, this is the Type I case; thus P5 = PQ
F A T I G U E C R A C K A N D F R A C T U R E P R O P E R T I E S I N W A AM T I - 6A L - 4V 5
© 2016 The Authors Fatigue & Fracture of Engineering Materials & Structures Published by John Wiley & Sons Ltd. Fatigue Fract Engng Mater Struct 00 1–14

where Pmax is the maximum load at fracture, PQ a calcu-lated maximum load based on the test measured load ver-sus displacement relation according to ASTM E399.Values of yield strength (σys) used in the calculation aregiven in Table 3.
An example of measured force versus displacementcurve is shown in Fig. 4 with indication of the Pmax andPQ. Based on the calculated results from Eqs.1 and,2
which are also listed in Table 3, KQ equals to KIC forthe 19mm thick WAAM® and wrought materials(although the grade 23 wire specimens have slightlyhigher than the required Pmax/PQ ratio). For the wroughtcondition (19mm thick), toughness measured in thisstudy is 76.9MPa√m. Published wrought Ti64 planestrain fracture toughness is in the order of 66MPa√m.16
WAAM® plane strain fracture toughness is higher thanthat of the wrought based on the 19mm specimen test,or similar in the case of grade 5 wire with parallel depositstrategy. Figure 5 shows a comparison of all test results.Test of the 5mm thick WAAM® material is not a validKIC test; hence, the measured fracture toughness is onlyvalid for the specific thickness. In this case the elastic–plastic effect on toughness needs to be accounted, whichis beyond the scope of this study.
Effect of thickness
As expected, KQ of the thin specimen is greater than thatof the thicker specimens. Note that only specimens cutfrom the thick wall produced with parallel deposition
strategy are used for comparison with the 5mm thick-ness, as it was built using the same torch movement di-rection and wire oxygen content as the thinnerspecimen. When the crack propagates across the layers,the toughness of the thinner specimen is 11.7% higherthan the thicker specimen (81.8 versus 73.2MPa√m).When the crack propagates along the layers, the thinnerspecimen is only 4% higher than the thicker specimen
Table 3 KQ and other relevant parameters in fracture toughness tests of WAAM® Ti-6Al-4V
5mm thick (nominal) 19mm thick (nominal)
Crack orientationWAAM®Single
WAAM®Parallel grade 5
WAAM®Oscillated grade 5
WAAM®Parallel grade 23
Wrought(MA)
KQ (MPa√m) Across layers 81.8 73.2 82.1 96.2 76.9 (L-T)Along layers 73.9 70.9 74.3 95.1
SD Across layers 4.17 3.05 1.55 0.32 2.35Along layers 1.27 2.05 2.63 0.59
Pmax (kN) Across layers 15.88 43.04 48.37 59.79 55.00Along layers 14.56 40.14 41.6 57.38
PQ (kN) Across layers 11.15 40.92 47.42 53.28 41.27Along layers 10.15 36.84 39.64 49.34
Pmax/PQ Across layers 1.42 1.05 1.02 1.13 1.34Along layers 1.44 1.09 1.05 1.16
ac (mm) Across layers 35 32.8 32.8 32.2 34.33Along layers 35 34.4 34.8 33.8
W-ac (mm) Across layers 35 37.2 37.2 37.8 35.67Along layers 35 35.6 35.2 36.2
B (mm) Across layers 5.0 18.5 19.1 18.0 19.0Along layers 5.0 18.5 19.2 18.0
2.5(KQ/σys)2 (mm) Across layers 22.6 18.1 22.8 37.0 19.9 (L-T)Along layers 21.3 19.6 21.6 36.2
Note: Width W = 70mm for all specimens, B = thickness; ‘MA’ stands for ‘Milled and Annealed’ (wrought) condition; yield strengths used incalculations are: wrought (L-T): 950 ± 20MPa [7]; WAAM® grade 5 wire (parallel, oscillated): 860 ± .3.8MPa (along layers) [7], 800 ± 7.2MPa(across layers) [7]; WAAM® grade 23 wire: 760MPa [AMS B381-13] (used for both directions)
Fig. 5 Effect of build method, material orientation and wire oxygencontent on fracture toughness of WAAM® Ti-6Al-4V and compar-ison with that of wrought condition (all have 19mm thickness), andcomparison with a reference plane-strain value (thickness> 25mm).
6 X. ZHANG et al.
© 2016 The Authors Fatigue & Fracture of Engineering Materials & Structures Published by John Wiley & Sons Ltd. Fatigue Fract Engng Mater Struct 00 1–14

(73.9 versus 70.9MPa√m). However, these differencesare not as great as one would expect for ductile materialshaving big difference in thickness (5 versus 19mm).
Effect of testing orientation and anisotropy
The toughness of the crack propagating across the layerswas 1–3% higher than that of the crack propagatingalong the layers, regardless of the thickness or depositionstrategy. For the 19mm thick specimens, and for bothgrade 5 and grade 23 alloys, KQ across the layers was al-ways higher than along the layers (Fig. 5). For grade 5 de-posit produced using the oscillation strategy, KQ acrossthe layers was 9.5% higher than along the layers. Forthe deposits produced using the parallel strategy this dif-ference is smaller; in fact, for grade 5 parallel depositstrategy KQ across the layers was 3.1% higher than alongthe layers; and for grade 23 parallel strategy the differ-ence was just 1.2%.
The direction-dependant difference is ascribed to thebands observed in the microstructure of all specimensthus far produced by WAAM® as discussed in.3,11 Thebanding appearance is given by a systematic and repeti-tive variation in the size of the α lamellae along the builddirection, that is across the layers. Work reported in3,11
have full explanation of the origin and characteristics ofsuch bands. Regarding the present research, as shown inFig. 6, theWidmanstätten microstructure is much coarserat the top of a band than that at the bottom. Accordingto,29 fracture toughness increases when the α grain size in-creases in alloys with a Widmanstätten microstructurecharacteristic. When the crack propagated along thelayers, it followed the preferential path given by the finermicrostructure at the bottom of a band for most of its life-time. On the contrary, when the crack propagated acrossthe layers, the specimen had greater fracture resistance,hence higher toughness value, because of the continuousvariation of the α lamellae size seen at its tip.
Effect of deposition strategy
The test results show that the specimens produced usingthe oscillation deposition strategy had higher fracturetoughness than those produced using the parallel deposi-tion strategy. Optical microscopy images (Fig. 7) showedan overall much coarser microstructure for the oscillationdeposition strategy (Fig. 7a and b) compared with the par-allel one (Fig. 7c and d), with α lamellae that were not onlythicker but also grouped in colonies. This agrees withwhat reported previously for alloys with aWidmanstättenmicrostructure characteristic,23 in which fracture tough-ness increases as the α lamellae width increases. This isconfirmed also by Fig. 8, in which the microstructure atthe crack interface is shown. Fig. 8a, which refers to thespecimens produced with the oscillation deposition strat-egy, exhibits a much coarser microstructure than that ofthe parallel strategy (Fig. 8b and c). For a detailed imageof a large α colony present at the crack interface of thespecimens produced with the oscillation depositionstrategy, please refer to the higher magnification opticalmicroscopy image shown in Fig. 8b.
Effect of oxygen content
Published work shows that the oxygen element canchange the mechanical properties, for example the yieldstrength and fracture toughness.30,31 This study hasshown that fracture toughness is indeed affected by thewire oxygen content; lower oxygen element results in in-crease in fracture toughness. However, both the grade 5and grade 23 materials used in the present research satisfythe requirements of material standards. In particular,fracture toughness of grade 23 was 34% higher than thatof grade 5 material, and was higher than value of wroughtcondition (discussed later). However, no apparent micro-structural differences were observed between the grade 5and grade 23 specimens produced with the same parallel
Fig. 6 Changes in the size of the α observed in a linear deposit produced with the single bead deposition strategy: (a) fine structure at the bot-tom of a band, and (b) at the top of a band.
F A T I G U E C R A C K A N D F R A C T U R E P R O P E R T I E S I N W A AM T I - 6A L - 4V 7
© 2016 The Authors Fatigue & Fracture of Engineering Materials & Structures Published by John Wiley & Sons Ltd. Fatigue Fract Engng Mater Struct 00 1–14

deposition strategy (Fig. 7c and d versus Fig. 7e and f). Itshould be noted that grade 23 has lower static strengthvalues.
Fatigue crack growth behaviourCrack growth rates in wire + arc additive manufacturedmaterial
Fatigue crack growth rate in WAAM® grade 5 Ti64 asfunction of the SIF range is shown in Fig. 9a and com-pared with a wrought and a cast Ti64. Two observationscan be made. First, FCGR in the wrought condition isgreater than that in the WAAM® alloy, whereas the cast-ing condition alloy has the slowest FCGR. Second, the
specimen with crack propagating across the layers hadslightly greater crack growth rate than that of the speci-mens with crack propagating along the layers. However,the difference is smaller than the scatter range allowedin fatigue tests. Therefore, the WAAM® material canbe considered to have isotropic FCGR.
Crack growth rates in WAAM®-wrought interface specimens
Fatigue crack growth rates versus SIF range relation aspresented in Fig. 9b is calculated from measured cracklength versus load cycle relation using the 7-point poly-nomial method in the ASTM E647 standard. Followingobservations can be made.
Fig. 7 Optical microscopy images showing the bulk of the deposited material.
8 X. ZHANG et al.
© 2016 The Authors Fatigue & Fracture of Engineering Materials & Structures Published by John Wiley & Sons Ltd. Fatigue Fract Engng Mater Struct 00 1–14

Apart from type C specimen, FCGR is generallylower than the wrought condition, but greater than thatof WAAM® alone material. However, all test data arewithin the normal scatter range.
For the specimens with the crack propagating acrossthe layers orientation (type A and C), crack growth ratesare noticeably greater than those with the crack propa-gating along the layers (B, D and E), indicating thatcrack growth resistance is weaker when crack is per-pendicular to the build direction (i.e. along the layers).This may be attributed to the microstructure of theWAAM® Ti64 alloy that the interface between the βgrains is weaker (crack propagates parallel with the βgrains).
Type C has much greater crack growth rate thanothers, by 43–100% at higher K values owing to thesefactors: (i) crack started inWAAM® where there are ten-sile residual stress, although it only travelled a short dis-tance in WAAM® (about 8–10mm); (ii) cracksubsequently went into the HAZ and substrate; crackgrowth rate in the latter is faster owing to the equiaxedmicrostructure.
Residual stresses in type A, B and C specimens weremeasured by the contour method and also calculated byFEM by inputting residual stresses in the originalWAAM® wall (also measured by the contour method12)
before extracting these C(T) specimens. Details can befound in.12,32,33 As a summary, residual stresses areshown in Fig. 10. For type A specimen peak residualstress near the notch root of 100-130MPa is measured(ignoring the highest stress calculated by FEA that isinfluenced by the stress concentration and mesh de-pendent at the notch root); the lowest stress is about!50MPa. About 15mm away from the notch root, re-sidual stress is reduced to below 25MPa. For type Cspecimen, peak stress of about 100MPa is away fromthe notch root. Difference in stress distribution in Aand C has caused different crack growth rate. For typeB specimen, the peak stress is around 100MPa that isquickly reduced to between !25 and 25MPa. Althoughthe magnitude of residual stresses in these specimens isrelatively low comparing with the yield strength, theireffect on crack growth should be considered becausethe SIF owing to residual stress is not negligible becauseof the crack tip stress intensity. Because the longitudinalresidual stress is aligned with the applied load directioncausing increase in the total SIF, greater crack growthrates in the A and C specimens are found. Crack growthrate in the type C is much faster than A, because the for-mer had greater residual stress around the interface andthe HAZ than that in A.12 Type B has the slowest crackgrowth rate, suggesting that the WAAM®-wrought
Fig. 8 Optical microscopy images of the crack, highlighting the preferential path along the prior β grain boundaries.
F A T I G U E C R A C K A N D F R A C T U R E P R O P E R T I E S I N W A AM T I - 6A L - 4V 9
© 2016 The Authors Fatigue & Fracture of Engineering Materials & Structures Published by John Wiley & Sons Ltd. Fatigue Fract Engng Mater Struct 00 1–14

interface has greater resistance to fatigue crack growththan that between the WAAM® interlayers (type D)and that of the substrate (type E). It should be noted thatactual components made by WAAM® would be mostlikely stress-relieved prior to use. Therefore, the effectof residual stress will be null.
Crack trajectory
Macroscopic optical photographs show that crack in Aand C specimens have kept a straight path during thecrack propagation history (Fig. 11a and b). This is attrib-uted to the symmetry in the applied load, residual stressand material properties.12
For the type B, D and E specimens, optical photo-graphs show crack deviation from the initial crack plane(Fig. 11c, d and e). Mismatch of the bi-material proper-ties and unsymmetric residual stress distribution areidentified as the main causal mechanisms for the
observed crack deviation.30,32 It is noted that crack hasthe tendency to propagate into the substrate, even if thestarting crack is in the WAAM® zone and about 3mmfrom the interface (type D).
Fatigue crack morphology was investigated by opticalmicroscope observation of polished and etched speci-mens. First, microstructure of the wrought substrate hasfiner and equiaxed structure, whereas the WAAM®alloy has a Widmanstätten microstructure. This is in
Fig. 9 Fatigue crack growth rate versus stress intensity factor range:(a) WAAM® material only and comparison with baseline wroughtand cast conditions, (b) WAAM®-substrate interface and compari-son with WAAM® material only.
Fig. 10 Residual stresses in type A (a), B (b) and C (c) specimens.Residual stresses shown are in the direction of the applied load.32,33
10 X. ZHANG et al.
© 2016 The Authors Fatigue & Fracture of Engineering Materials & Structures Published by John Wiley & Sons Ltd. Fatigue Fract Engng Mater Struct 00 1–14

agreement with the findings of titanium alloys fabricatedby other additive manufacturing processes, for exampleSLM34,35 and EBM.36 Second, optical micrographs showthat the crack path pattern varies as the crack propagateswithin different material zones.
Crack morphology of the type A specimen ispresented in Fig. 12a and b. Crack path in the wroughtportion was quite smooth and in a straight line (Fig. 12a),whereas in the WAAM® region it manifested a tortuouspattern (Fig. 12b). Similar results are also observed intype C specimen.12
Crack morphology of type B is shown in Fig. 12c andd. Initial crack was on the interface (re-melted zone orHAZ) manifesting a tortuous crack path (Fig. 12c). Itsubsequently propagated into the substrate alloy showinga smooth and straight path (Fig. 12d). Reasons identifiedfor the observed crack deviation trend are: (i) both the re-sidual stress field and material properties are unsym-metrical around the interface,32 that is the crack ispropagating in a bi-material system; (ii) the wroughtalloy has less resistance to fatigue crack growth owing
to its equiaxed grains; hence the crack has the tendencyto grow into the wrought substrate.
Crack growth pattern in type D specimen (crackstarted in the WAAM® zone, 3mm above the interface)is shown in Fig. 12e and f. In this case, the crack wastransgranular through columnar prior β grains (Fig. 12e).Occasionally, the crack propagated along a prior β grainboundary; that explains the observed tortuous crack pathin the type B, D and E (Fig. 12f).
Based on these microscopic observations, it is under-stood that the crack growth rate in type E is faster thanthat in the B and D specimens (Fig. 9b). This is partlybecause that the initial crack in E started from thewrought portion (3mm from the interface), where thecrack growth rate is much faster than that in theWAAM® area. The WAAM®-substrate interface seemsto be a stronger weld bond with higher resistance to fa-tigue crack growth (specimen B) comparing with theWAAM® interlayer bond (D) and the wrought (E); thismay explain the reason why the B specimen has the low-est crack growth rate among the three types.
Fig. 11 Macroscopic photos showing the crack trajectory for each specimen type
F A T I G U E C R A C K A N D F R A C T U R E P R O P E R T I E S I N W A AM T I - 6A L - 4V 11
© 2016 The Authors Fatigue & Fracture of Engineering Materials & Structures Published by John Wiley & Sons Ltd. Fatigue Fract Engng Mater Struct 00 1–14

CONCLUS IONS
For the Ti-6Al-4V specimens produced in this study bythe WAAM® process, it was found that fracture tough-ness was comparable with or greater than properties ofwrought Ti-6Al-4V, and FCGR was considerably lowerthan that in the wrought alloy. Therefore, for damagetolerance driven designs, WAAM® appears to be a viablecandidate manufacturing process.This study also foundthat
• Grade 23 Ti-6Al-4V (lower oxygen content) has muchgreater fracture toughness (by 32%).
• Fracture toughness is direction dependent, i.e. it isslightly higher when crack propagates across the
additive layers comparing to crack aligned with thelayers. For grade 5 wire, the difference is within 3%(for the parallel deposition strategy) and 10% (for theoscillation deposition strategy).
• Fatigue crack growth rate is slightly faster when crackpropagates across the layers comparing to crack prop-agating along the layers, but the difference is verysmall and within the range of data scatter.
• At the WAAM®-wrought interface, fatigue crackgrowth rate is generally greater than that in the pureWAAM® alloy. The difference is within the datascatter range. The only exception is when crack startsfrom the WAAM® part propagating toward thesubstrate; in this case, the crack growth rate is signifi-cantly faster.
Fig. 12 Microscopic photos of crack growth patterns in type A, B and D specimens
12 X. ZHANG et al.
© 2016 The Authors Fatigue & Fracture of Engineering Materials & Structures Published by John Wiley & Sons Ltd. Fatigue Fract Engng Mater Struct 00 1–14

Acknowledgements
The work was performed at Cranfield University withthe support of the WAAMMat programme industrialpartners (waammat.com). Financial support from theEngineering and Physical Sciences Research Council(Grant No EP/K029010/1) is acknowledged. Authorsthank Emilie Lorant, Shijie Liu, Nick Hills and DongniWang for conducting part of the experiments, DrXianwei Liu and Andrew Dyer for their assistance onthe microstructure examination. The data referred to inthis article can be accessed at https://doi.org/10.17862/cranfield.rd.4042917.
REFERENCES
1 Williams, S. W., Martina, F. et al. (2015) Wire + air additivemanufacture. Mater Sci & Tech, IoM, DOI. DOI:10.1179/1743284715Y.0000000073.
2 Frazier, W. E. (2012) Metal additive manufacturing: a review.J. Mater. Eng. Perform., 23, 1917–1928.
3 Martina, F., Mehnen, J., Williams, S. W. et al (2012) Investiga-tion of the benefits of plasma deposition for the additive layermanufacture of Ti-6Al-4 V. J. Mater. Process. Technol., 212,1377–86.
4 Wang, F., Williams, S. W. and Rush, M. (2011) Morphology in-vestigation on direct current pulsed gas tungsten arc welded ad-ditive layer manufactured Ti6Al4V alloy. Int. J. Adv. Manuf.Tech., 57, 597–603.
5 Brandl, E., Baufeld, B., Leyens, C. et al (2010) Additivemanufactured Ti-6Al-4 V using welding wire: comparison of la-ser and arc beam deposition and evaluation with respect to aero-space material specifications. Phys. Procedia., 5, 595–606.
6 Brandl, E., Palm, F., Michailov, V., Viehweger, B. and Leyens,C. (2011) Mechanical properties of additive manufactured tita-nium (Ti-6Al-4 V) blocks deposited by a solid-state laser andwire. Materials & Design, 32, 4665–4675.
7 Wang, F., Williams, S., Colegrove, P. et al. (2013) Microstruc-ture and mechanical properties of wire and arc additivemanufactured Ti-6Al-4 V. Metallurgical and Materials Transac-tions A., 44A, 968–977.
8 Baufeld, B., Brandl, E. and Biest, O. (2011) Wire based additivelayer manufacturing: comparison of microstructure andmechanical properties of Ti-6Al-4 V components fabricated bylaser-beam deposition and shaped metal deposition. J ofMaterials Processing Technology, 21, 1146–58.
9 Baufeld, B., Van der Biest, O. and Gault, R. (2010) Additivemanufacturing of Ti-6Al-4 V components by shaped metaldeposition: microstructure and mechanical properties. Materialsand Design, 31, S106–S111.
10 Brandl E, Leyens C, Palm F (2011). Mechanical properties ofadditive manufactured Ti-6Al-4 V using wire and powder basedprocesses. In: Trends in Aerospace Manufacturing; 2009 Inter-national Conference, IoP Conf. Series: Materials Science andEngineering 26, 012004 doi:10.1088/1757-899X/26/1/ 012004,IOP Publishing Ltd.
11 Martina, F., Colegrove, P. A., Williams, S. W. and Meyer, J.(2015) Microstructure of interpass rolled wire + arc additivemanufacturing Ti-6Al-4 V components. Metallurgical andMaterials Transactions A, 46, 6103–6118.
12 Zhang, J., Wang, X., Paddea, S. and Zhang, X. (2016) Fatiguecrack propagation behaviour in wire + arc additive manufacturedTi-6Al-4 V: effects of microstructure and residual stress.Materials & Design, 90, 551–561.
13 Ding, J., Colegrove, P., Mehnen, J., Williams, S. W., Wang, F.and Sequeira Almeida, P. (2013) A computationally efficient fi-nite element model of wire and arc additive manufacture. Int JAdv Manuf Technol, 70, 227–236.
14 Martina F, Roy MJ, Szost BA, Terzi S, Colegrove PA, WilliamsSW, Withers PJ, Meyer J, Hoffmann M (2016). Residual stressof as-deposited and interpass rolled wire + arc additivemanufacturing Ti-6Al-4 V components. Materials science &technology, accepted 12 Jan 2016.
15 Szost, B., Terzi, S., Martina, F., Boisselier, D., Prytuliak, A.,Pirling, T., Hofmann, M. and Jarvis, D. J. (2015) A comparativestudy of additive manufacturing techniques: residual stress andmicrostructural analysis of CLAD and WAAM printedTi-6Al-4 V components. Materials & Design, 89, 559–567.
16 Edwards, P., O’Conner, A. and Ramulu, M. (2013) Electronbeam additive manufacturing of titanium components: proper-ties & performance. J Manufact Sci & Engng, 135, 061016/1–7.
17 Van Hooreweder, B., Moens, D., Boonen, R., Kruth, J.-P. andSas, P. (2012) Analysis of fracture toughness and crack propaga-tion of Ti-6Al-4 V produced by selective laser melting. AdvancedEngineering Materials, 14, 92–97.
18 Leuders, S., Thöne, M., Riemer, A., Niendorf, T., Tröster, T.,Richard, H. A. and Maier, H. J. (2013) On the mechanicalbehaviour of titanium alloy TiAl6V4 manufactured by selectivelaser melting: fatigue resistance and crack growth performance.Int J of Fatigue, 48, 300–307.
19 Edwards, P. and Ramulu, M. (2015) Effect of build direction onthe fracture toughness and fatigue crack growth in selective lasermelted Ti-6Al-4V. Fatigue Fract Engng Mater Struct., 38,1228–1236.
20 Niendorf T (2015). TU Bergakademie Freiberg, Germany.Private Communications, 10 Sept 2015.
21 Caina, V., Thijs, L., Van Humbeeck, J., Van Hooreweder, B.and Knutsen, R. (2015) Crack propagation and fracture tough-ness of Ti6Al4V alloy produced byselective laser melting.Additive Manufacturing, 5, 68–76.
22 Riemer A, Richard HA. Crack propagation in additivemanufactured materials and structure. 21st European Confer-ence on Fracture, ECF21, 20-24 June 2016, Catania, Italy.Published in Procedia Structural Integrity, 2(2016) 1229–1236.
23 Riemer, A., Richard, H. A., Brugemann, J.-P. and Wesendahl,J.-N. (2015) Fatigue crack growth in additive manufacturedproductes. Frattura ed Integrità Strutturale, 34, 437–446.DOI:10.3221/IGF-ESIS.34.49.
24 Zhai, Y., Lados, D. A., Brown, E. J. and Vigilante, G. N. (2016)Fatigue crack growth behavior and microstructural mechanismsin Ti-6Al-4 V manufactured by laser engineered net shaping. IntJ of Fatigue, 93, 51–63.
25 Scott-Emuakpor, O., Schwartz, J., George, T., Holycross, C.,Cross, C. and Slater, J. (2015) Bending fatigue life characterisa-tion of direct metal laser sintering nickel alloy 718. Fatigue FractEngng Mater Struct., 38, 1105–1117.
26 Croccolo, D., De Agostinis, M., Fini, S., Olmi, G., Vranic, A.and Ciric-Kostic, S. (2016) Influence of the build orientationon the fatigue strength of EOS maraging steel produced byadditive metal machine. Fatigue Fract Engng Mater Struct, 39,637–647.
27 ASTM E399 (2009) Standard Test Method for Linear-ElasticPlane-Strain Fracture Toughness KIc of Metallic Materials, AnnualBook of ASTM Standards: Pennsylvania, US.
F A T I G U E C R A C K A N D F R A C T U R E P R O P E R T I E S I N W A AM T I - 6A L - 4V 13
© 2016 The Authors Fatigue & Fracture of Engineering Materials & Structures Published by John Wiley & Sons Ltd. Fatigue Fract Engng Mater Struct 00 1–14
28 ASTM E647 (2013) Standard Test Methods for Measurement ofFatigue Crack Growth Rates, Annual Book of ASTM Standards:Pennsylvania, US.
29 Tsangarakis, N. (1983) On the dependence of fracture tough-ness on metallurgical factors. Materials Science and Engineering,58, 269–276.
30 Campbell FC (Ed.) (2012). Fatigue and fracture: understandingthe basics. ASM International, 242.
31 Wessel, J. K. (2004)Handbook of Advanced Materials: enabling newDesigns, John Wiley & Sons, pp. 292.
32 Zhang, J., Zhang, X., Wang, X., Ding, J., Traoré, Y., Paddea, S.andWilliams, S. (2016) Fatigue crack path selection at the inter-face of wire + arc additive manufactured Ti-6Al-4V. Materials &Design, 104, 365–375.
33 Zhang J, Chen B, Zhang X. n.d, Residual stress and its influenceat the interface of wire + arc additive manufactured titanium
alloys. Rare Metal Materials and Engineering, (in Chinese),accepted for publication.
34 Kelly, S. M. and Kampe, S. L. (2004) Microstructural evolutionin laser-deposited multilayer Ti-6Al-4 V builds: part I.Microstructural characterization. Metallurgical & Materials Trans-actions A, 35, 1861–1867.
35 Kelly, S. M. and Kampe, S. L. (2004) Microstructural evolutionin laser-deposited multilayer Ti-6Al-4 V builds: part II. Thermalmodeling. Metallurgical & Materials Transactions A, 35,1869–1879.
36 Taminger KM, Hafley RA (2006). Electron beam freeformfabrication for cost effective near-net shape manufacturing.NATO/RTOAVT-139 Specialists’ meeting on cost effectivemanufacture via net shape processing, Amsterdam, theNetherlands, pp. 9-25
14 X. ZHANG et al.
© 2016 The Authors Fatigue & Fracture of Engineering Materials & Structures Published by John Wiley & Sons Ltd. Fatigue Fract Engng Mater Struct 00 1–14