Fourth quarter and full year 2018 Box 73 SE-221 00 Lund Sweden Corporate registration number:...
25
Fourth quarter and full year 2018 This information is information that Alfa Laval AB (publ) is obliged to make public pursuant to the EU Market Abuse Regulation and the Securities Markets Act. The information was submitted for publication, through the agency of the contact person set out below, at CET 7.30 on February 5, 2019. Alfa Laval AB (publ) PO Box 73 SE-221 00 Lund Sweden Corporate registration number: 556587-8054 Visiting address: Rudeboksvägen 1 Phone: + 46 46 36 65 00 Website: www.alfalaval.com For more information, please contact: Gabriella Grotte, Investor Relations Manager Phone: +46 46 36 74 82, Mobile: +46 709 78 74 82, E-mail: [email protected] Summary Fourth quarter Full year SEK millions 2018 2017 % % * 2018 2017 % % * Order intake 11,561 9,780 18 13 45,005 36,628 23 19 Net sales 11,209 10,112 11 6 40,666 35,314 15 12 Adjusted EBITA ** 1,787 1,611 11 6,718 5,610 20 - adjusted EBITA margin (%) ** 15.9 15.9 16.5 15.9 Result after financial items 1,470 1,358 8 5,896 4,371 35 Net income for the period 1,297 1,061 22 4,537 2,988 52 Earnings per share (SEK) 3.07 2.52 22 10.77 7.09 52 Cash flow *** 1,490 1,573 -5 4,883 4,463 9 Impact on adjusted EBITA of foreign exchange effects -90 33 -85 223 Impact on result after financial items of comparison distortion items 14 - 151 - * Excluding currency effects. ** Alternative performance measures. *** From operating activities. Comment from Tom Erixon, President and CEO ”The business climate in the fourth quarter remained positive in most end markets, with order intake reaching SEK 11.6 billion, up 13 percent compared to the corresponding quarter in the previous year. Despite some volatility in oil prices, orders from the oil & gas sector climbed back to historically high levels in the quarter, supported by several large offshore orders. 2018 was the year when demand for our marine environmental solutions accelerated, bringing the order intake for Alfa Laval PureSOx and Alfa Laval PureBallast to SEK 5.6 billion. This, combined with the positive development in offshore oil and gas, brought the Marine Division’s annual order growth to 46 percent, despite yard contracting remaining flat compared to 2017. The operating margin for the year ended at 16.5 percent and net income reached a record level, bringing the EPS to SEK 10.77. The operating margin in the fourth quarter was flat compared to last year despite continued good business conditions. Partly, the development is explained by negative foreign exchange effects. Partly, an uneven load compared to capacity, in certain areas of heat exchanger manufacturing, weighed on the Energy Division, as well as the group. In all, 2018 was a strong year and we advanced our strategic agenda on many fronts. The investments in product development resulted in a substantial increase in product launches. The operational improvements of the Greenhouse businesses continued throughout the year and in the fourth quarter we signed an agreement to sell the major part of the remaining business. The Footprint restructuring of global manufacturing continued as planned, with both capital expenditure and operational costs affecting 2018. Finally, at the end of the year, we invested in a start-up company, focusing on developing thermal energy storage solutions for the future.“ Outlook for the first quarter “We expect demand in the first quarter to be somewhat higher than in the fourth quarter.” Earlier published outlook (October 25, 2018): “The demand in the fourth quarter is expected to be somewhat higher than in the third quarter.” The Board of Directors will propose a dividend of SEK 5.00 (4.25) per share to the Annual General Meeting. The fourth quarter and full year 2018 report has been reviewed by the company’s auditors, see page 25 for the review report.
Transcript of Fourth quarter and full year 2018 Box 73 SE-221 00 Lund Sweden Corporate registration number:...
Fourth quarter and full year 2018
This information is information that Alfa Laval AB (publ) is obliged to make public pursuant to the EU Market Abuse Regulation and the Securities Markets Act. The information was submitted for publication, through the agency of the contact person set out below, at CET 7.30 on February 5, 2019.
Alfa Laval AB (publ) PO Box 73 SE-221 00 Lund Sweden Corporate registration number: 556587-8054
Visiting address: Rudeboksvägen 1 Phone: + 46 46 36 65 00 Website: www.alfalaval.com
For more information, please contact: Gabriella Grotte, Investor Relations Manager Phone: +46 46 36 74 82, Mobile: +46 709 78 74 82, E-mail: [email protected]
Summary
Fourth quarter Full year
SEK millions 2018 2017 % % * 2018 2017 % % *
Order intake 11,561 9,780 18 13 45,005 36,628 23 19
Net sales 11,209 10,112 11 6 40,666 35,314 15 12
Adjusted EBITA ** 1,787 1,611 11 6,718 5,610 20
- adjusted EBITA margin (%) ** 15.9 15.9 16.5 15.9 Result after financial items 1,470 1,358 8 5,896 4,371 35
Net income for the period 1,297 1,061 22 4,537 2,988 52
Earnings per share (SEK) 3.07 2.52 22 10.77 7.09 52
Cash flow *** 1,490 1,573 -5 4,883 4,463 9
Impact on adjusted EBITA of foreign exchange effects -90 33 -85 223
Impact on result after financial items of comparison distortion items 14 - 151 -
* Excluding currency effects. ** Alternative performance measures. *** From operating activities.
Comment from Tom Erixon, President and CEO
”The business climate in the fourth quarter
remained positive in most end markets, with order
intake reaching SEK 11.6 billion, up 13 percent
compared to the corresponding quarter in the
previous year. Despite some volatility in oil prices,
orders from the oil & gas sector climbed back to
historically high levels in the quarter, supported by
several large offshore orders.
2018 was the year when demand for our marine
environmental solutions accelerated, bringing the
order intake for Alfa Laval PureSOx and Alfa Laval
PureBallast to SEK 5.6 billion. This, combined with
the positive development in offshore oil and gas,
brought the Marine Division’s annual order growth
to 46 percent, despite yard contracting remaining
flat compared to 2017.
The operating margin for the year ended at 16.5
percent and net income reached a record level,
bringing the EPS to SEK 10.77. The operating
margin in the fourth quarter was flat compared to
last year despite continued good business
conditions. Partly, the development is explained by
negative foreign exchange effects. Partly, an
uneven load compared to capacity, in certain
areas of heat exchanger manufacturing, weighed
on the Energy Division, as well as the group.
In all, 2018 was a strong year and we advanced
our strategic agenda on many fronts. The
investments in product development resulted in a
substantial increase in product launches. The
operational improvements of the Greenhouse
businesses continued throughout the year and in
the fourth quarter we signed an agreement to sell
the major part of the remaining business. The
Footprint restructuring of global manufacturing
continued as planned, with both capital
expenditure and operational costs affecting 2018.
Finally, at the end of the year, we invested in a
start-up company, focusing on developing thermal
energy storage solutions for the future.“
Outlook for the first quarter
“We expect demand in the first quarter to be
somewhat higher than in the fourth quarter.”
Earlier published outlook (October 25, 2018): “The demand in the
fourth quarter is expected to be somewhat higher than in the third
quarter.”
The Board of Directors will propose a dividend of
SEK 5.00 (4.25) per share to the Annual General
Meeting.
The fourth quarter and full year 2018 report has
been reviewed by the company’s auditors, see
page 25 for the review report.

Alfa Laval AB (publ) Fourth quarter and full year 2018
Page 2 (25)
Management’s discussion and analysis
Important events during the fourth quarter Alfa Laval has signed an agreement to sell part of
its air heat exchanger business related to
commercial/industrial air heat exchangers in the
Greenhouse division to the LU-VE Group. The
closing of the agreement is expected during the
first half of 2019.
Alfa Laval has acquired 13 percent of the shares
in the newly created technology company Malta
Inc for SEK 72 million. The company has
developed an innovative energy storage solution
to substantially grow the implementation of
renewable energy.
Large orders (>EUR 5 million) in the fourth quarter
Division Order Total per Business Unit
Business Unit Delivery amount Q4 2018 Q4 2017
Scope of supply date SEK millions
Energy
Welded Heat Exchangers
Air cooler systems to a gas processing plant in the U.S. 2019 110
Compact heat exchangers to a petrochemical plant in the U.S. 2019/2020 140
Air cooler systems to a gas processing plant in the U.S. 2019 110 360 270
Food & Water
Decanters
Separation equipment to a food processing company in the U.S. 2019 60 60 -
Marine
Marine Separation & Heat Transfer Equipment
Ballast water treatment systems to a shipowner in Turkey. 2019-2021 95 95 -
Pumping Systems
Framo pumping systems to oil platforms in the North Sea. 2019 175
Framo pumping systems to an oil facility in the Middle East and to an FPSO vessel to be built in China. 2019 180 355 60
Total 870 330 * FPSO = Floating Production, Storage and Offloading.
Order intake
Orders received was SEK 11,561 (9,780) million in
the fourth quarter and SEK 45,005 (36,628) million
in the full year 2018. The graph below shows the
historical development per quarter.
0
7,000
14,000
21,000
28,000
35,000
42,000
49,000
0
2,000
4,000
6,000
8,000
10,000
12,000
14,000
Q116 Q216 Q316 Q416 Q117 Q217 Q317 Q417 Q118 Q218 Q318 Q418
SEK millions12 months
SEK millionsquarter Orders received
Order intake per quarter Orders received rolling 12 months value
-9%
-14
%
-11
%
9%
14
%
15
%
16
%
16
%
26
%
% = change by quarter compared to corresponding period last year, at constant rates
-19
%
13
%
21
%
Alfa Laval AB (publ) Fourth quarter and full year 2018
Page 3 (25)
The change compared with the corresponding
periods last year and the previous quarter can be
split into:
Consolidated Order bridge
Change
Order intake Excluding currency effects After currency effects Order intake
Prior Structural Organic Currency Current
periods change 1) development 2) Total effects Total periods
SEK millions (%) (%) (%) (%) (%) SEK millions
Q4 2018/Q4 2017 9,780 -0.5 14.0 13.5 4.7 18.2 11,561
Q4 2018/Q3 2018 11,357 0.0 2.1 2.1 -0.3 1.8 11,561
YTD 2018/2017 36,628 -0.6 19.8 19.2 3.7 22.9 45,005
Orders received from the aftermarket Service3
constituted 25.1 (27.1) percent of the Group's total
orders received during the fourth quarter and 25.7
(29.8) percent during the full year 2018. The
change compared with the corresponding periods
last year and the previous quarter can be split into:
Consolidated Service order intake
Change excluding currency effects
Structural Organic
% change development Total
Q4 2018/Q4 2017 -0.2 5.4 5.2
Q4 2018/Q3 2018 0.0 1.2 1.2
YTD 2018/2017 -0.1 3.6 3.5
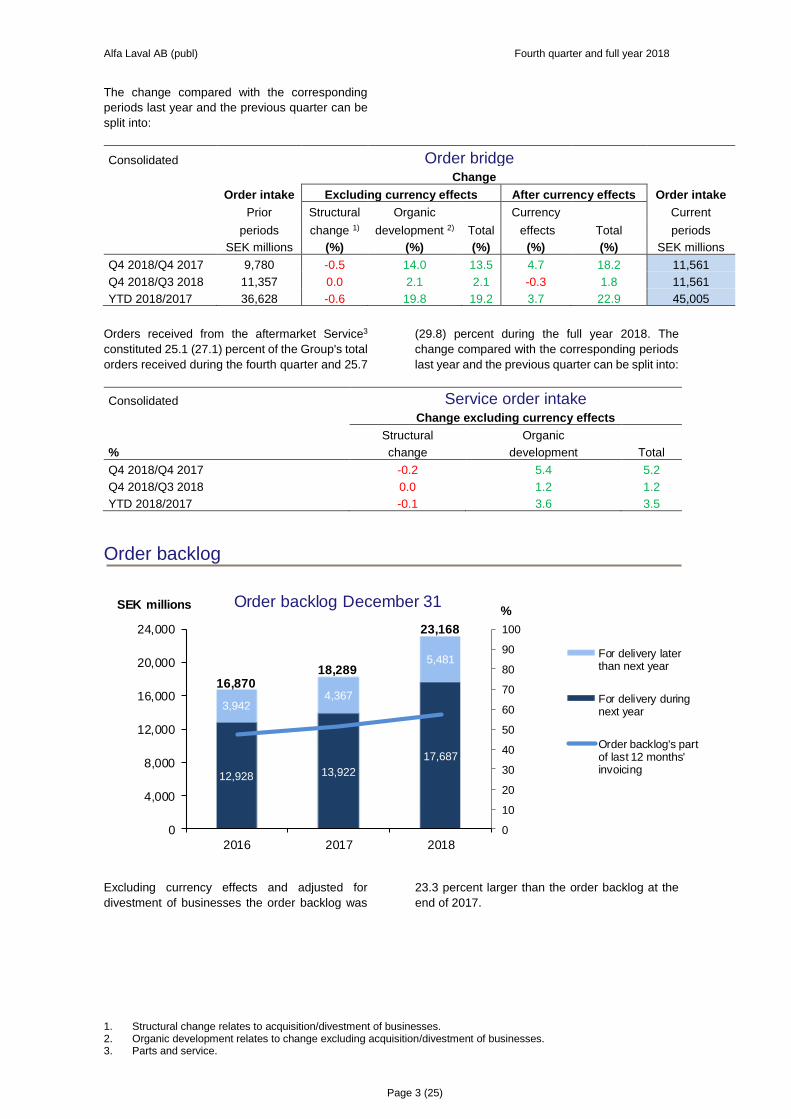
Order backlog
12,928 13,922
17,687
3,9424,367
5,481
0
10
20
30
40
50
60
70
80
90
100
0
4,000
8,000
12,000
16,000
20,000
24,000
2016 2017 2018
%SEK millions Order backlog December 31
For delivery laterthan next year
For delivery duringnext year
Order backlog's partof last 12 months'invoicing
16,87018,289
23,168
Excluding currency effects and adjusted for
divestment of businesses the order backlog was
23.3 percent larger than the order backlog at the
end of 2017.
1. Structural change relates to acquisition/divestment of businesses. 2. Organic development relates to change excluding acquisition/divestment of businesses. 3. Parts and service.

Alfa Laval AB (publ) Fourth quarter and full year 2018
Page 4 (25)
Net sales Net invoicing was SEK 11,209 (10,112) million for
the fourth quarter and SEK 40,666 (35,314) million
for the full year 2018. The change compared with
the corresponding periods last year and the
previous quarter can be split into:
Consolidated Sales bridge
Change
Net sales Excluding currency effects After currency effects Net sales
Prior Structural Organic Currency Current
periods change development Total effects Total periods
SEK millions (%) (%) (%) (%) (%) SEK millions
Q4 2018/Q4 2017 10,112 -0.8 7.1 6.3 4.5 10.8 11,209
Q4 2018/Q3 2018 10,131 0.0 10.3 10.3 0.3 10.6 11,209
YTD 2018/2017 35,314 -0.6 12.4 11.8 3.4 15.2 40,666
Net invoicing relating to Service constituted 27.6
(28.7) percent of the Group's total net invoicing in
the fourth quarter and 28.2 (30.5) percent in the
full year 2018. The change compared with the
corresponding periods last year and the previous
quarter can be split into:
Consolidated Service sales
Change excluding currency effects
Structural Organic
% change development Total
Q4 2018/Q4 2017 -0.1 2.3 2.2
Q4 2018/Q3 2018 0.0 9.9 9.9
YTD 2018/2017 -0.1 4.2 4.1

Alfa Laval AB (publ) Fourth quarter and full year 2018
Page 5 (25)
Income
CONSOLIDATED COMPREHENSIVE INCOME
Fourth quarter Full year
SEK millions 2018 2017 2018 2017
Net sales 11,209 10,112 40,666 35,314
Cost of goods sold -7,490 -6,673 -26,930 -23,379
Gross profit 3,719 3,439 13,736 11,935
Sales costs -1,208 -1,051 -4,539 -4,127
Administration costs -546 -501 -1,987 -1,809
Research and development costs -318 -256 -1,020 -874
Other operating income 341 155 906 588
Other operating costs -435 -400 -1,280 -1,135
Share of result in joint ventures -5 -9 15 11
Operating income 1,548 1,377 5,831 4,589
Dividends and other financial income 11 47 27 47
Interest income and financial exchange rate gains -12 23 377 237
Interest expense and financial exchange rate losses -77 -89 -339 -502
Result after financial items 1,470 1,358 5,896 4,371
Taxes -173 -297 -1,359 -1,383
Net income for the period 1,297 1,061 4,537 2,988
Other comprehensive income:
Items that will subsequently be reclassified to net income
Cash flow hedges -314 -54 -505 257
Market valuation of external shares 0 2 0 2
Translation difference -366 -68 641 -1,339
Deferred tax on other comprehensive income 73 70 83 152
Sum -607 -50 219 -928
Items that will subsequently not be reclassified to net income
Revaluations of defined benefit obligations 170 -135 200 15
Deferred tax on other comprehensive income -52 46 -60 4
Sum 118 -89 140 19
Comprehensive income for the period 808 922 4,896 2,079
Net income attributable to:
Owners of the parent 1,291 1,059 4,519 2,976
Non-controlling interests 6 2 18 12
Earnings per share (SEK) 3.07 2.52 10.77 7.09
Average number of shares 419,456,315 419,456,315 419,456,315 419,456,315
Comprehensive income attributable to:
Owners of the parent 801 915 4,876 2,069
Non-controlling interests 7 7 20 10
The gross profit has been affected positively by a
higher sales volume and negatively by currency
effects, an unfavourable mix between capital sales
and service and an uneven capacity utilisation
within parts of the manufacturing of heat
exchangers.
Sales and administration expenses were
SEK 1,754 (1,552) million during the fourth quarter
and SEK 6,526 (5,936) million during the full year
2018. Excluding currency effects and
acquisition/divestment of businesses, sales and
administration expenses were 9.8 percent and 6.6
percent respectively higher than the correspond-
ing periods last year. The corresponding figure
when comparing the fourth quarter 2018 with the
previous quarter is an increase with 11.8 percent.
The costs for research and development during
the full year 2018 corresponded to 2.5 (2.5)
percent of net sales. Excluding currency effects
and acquisition/divestment of businesses, the
Alfa Laval AB (publ) Fourth quarter and full year 2018
Page 6 (25)
costs for research and development have
increased by 22.1 percent during the fourth quarter
and by 13.9 percent during the full year 2018
compared to the corresponding periods last year.
The corresponding figure when comparing the
fourth quarter 2018 with the previous quarter is an
increase with 38.6 percent.
The increase in costs for sales, administration and
research and development is mainly explained by
the increased activity level within marine
environmental products.
Earnings per share, excluding amortisation of
step-up values and the corresponding tax*, was
SEK 12.69 (8.85) for the full year 2018.
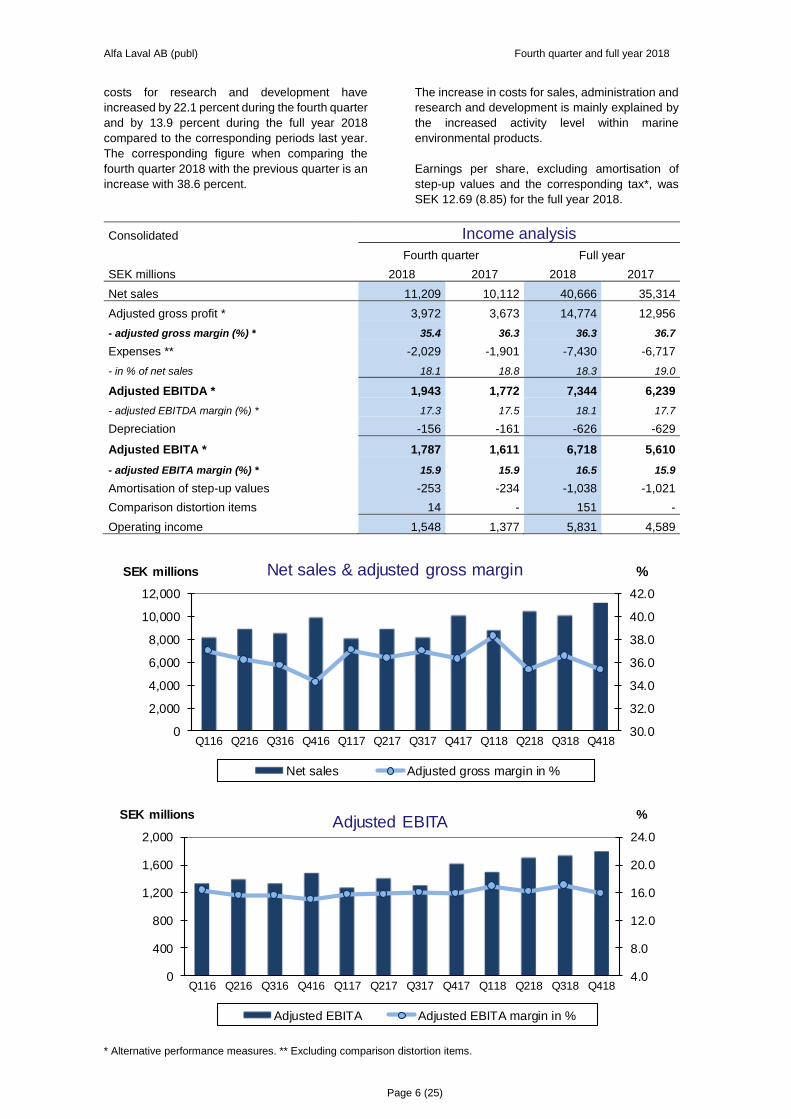
Consolidated Income analysis
Fourth quarter Full year
SEK millions 2018 2017 2018 2017
Net sales 11,209 10,112 40,666 35,314
Adjusted gross profit * 3,972 3,673 14,774 12,956
- adjusted gross margin (%) * 35.4 36.3 36.3 36.7
Expenses ** -2,029 -1,901 -7,430 -6,717
- in % of net sales 18.1 18.8 18.3 19.0
Adjusted EBITDA * 1,943 1,772 7,344 6,239
- adjusted EBITDA margin (%) * 17.3 17.5 18.1 17.7
Depreciation -156 -161 -626 -629
Adjusted EBITA * 1,787 1,611 6,718 5,610
- adjusted EBITA margin (%) * 15.9 15.9 16.5 15.9
Amortisation of step-up values -253 -234 -1,038 -1,021
Comparison distortion items 14 - 151 -
Operating income 1,548 1,377 5,831 4,589
30.0
32.0
34.0
36.0
38.0
40.0
42.0
0
2,000
4,000
6,000
8,000
10,000
12,000
Q116 Q216 Q316 Q416 Q117 Q217 Q317 Q417 Q118 Q218 Q318 Q418
%SEK millions Net sales & adjusted gross margin
Net sales Adjusted gross margin in %
4.0
8.0
12.0
16.0
20.0
24.0
0
400
800
1,200
1,600
2,000
Q116 Q216 Q316 Q416 Q117 Q217 Q317 Q417 Q118 Q218 Q318 Q418
%SEK millionsAdjusted EBITA
Adjusted EBITA Adjusted EBITA margin in %
* Alternative performance measures. ** Excluding comparison distortion items.

Alfa Laval AB (publ) Fourth quarter and full year 2018
Page 7 (25)
Comparison distortion items
Other operating income has been affected by
comparison distortion items of SEK 14 (-) million in
the fourth quarter and SEK 151 (-) million in the full
year 2018. The comparison distortion income
during the full year 2018 is relating to three items.
The divestments of the Alonte based commercial
tubular heat exchanger business and the heat
exchanger systems business have resulted in a
total gain of SEK 26 million.
The sale of a property in Lima in Peru resulted in
a realised gain of SEK 70 million.
Based on a court decision in a litigation against the
former owners of Ashbrook Simon-Hartley, Alfa
Laval has received a purchase price reduction of
SEK 55 million. The acquisition of Ashbrook
Simon-Hartley took place in 2012.
Consolidated financial net and taxes
The financial net for the full year 2018 was
SEK -54 (-54) million, excluding realised and
unrealised exchange rate losses and gains. The
main elements of costs were interest on the debt
to the banking syndicate of SEK -3 (-5) million,
interest on the bilateral term loans of SEK -43 (-41)
million, interest on the commercial papers of
SEK 0 (0) million, interest on the corporate bonds
of SEK -82 (-79) million and a net of dividends,
changes in fair value and other interest income
and interest costs of SEK 74 (71) million. The net
of realised and unrealised exchange rate differ-
ences was SEK 119 (-164) million.
The tax on the result after financial items was
SEK -173 (-297) million in the fourth quarter and
SEK -1,359 (-1,383) million in the full year 2018.
The tax cost for the fourth quarter and the full year
2018 has been affected by the following non-
recurring items:
• revaluation of future tax deductions with
SEK +130 million concerning and
• adjustments of deferred taxes relating to step
up values of about SEK +35 million, due to
reduced company taxes in several countries in
Europe and thereby decreased deferred tax
liabilities.
The tax cost for the full year 2017 was affected by
the following non-recurring items:
• a dividend distribution tax in India of SEK -100
million,
• additional tax of SEK -113 million relating to
prior years concerning acquired businesses
according to a settlement with the former
owners and
• adjustments of deferred taxes relating to step
up values of about SEK +29 million, due to
reduced company taxes in the U.S. and
thereby decreased deferred tax liabilities.
Key figures
Consolidated Key figures
December 31
2018 2017
Return on capital employed (%) * 22.4 17.7
Return on equity (%) ** 20.3 13.9
Solidity (%) *** 40.6 39.0
Net debt to EBITDA, times * 0.93 1.31
Debt ratio, times * 0.30 0.40
Number of employees (at the end of the period) 17,228 16,367 * Alternative performance measures. ** Net income in relation to average equity, calculated on 12 months’ revolving basis, expressed in percent. *** Equity in relation to total assets at the end of the period, expressed in percent.

Alfa Laval AB (publ) Fourth quarter and full year 2018
Page 8 (25)
Business Divisions
The development of the order intake for the
Divisions and their Business Units and the split
between capital sales and after sales & service
appear in the following charts.
Brazed & Fusion Bonded
Heat Exchangers
5%Energy
Separation
3%Gasketed Plate
Heat
Exchangers11%
Welded Heat Exchangers
10%
Decanters6%
Food Heat Transfer
5%
Food Systems5%
Hygienic Fluid Handling
10%
High Speed Separators
5%
Boiler & Gas Systems
13%
Marine Separation &
Heat Transfer Equipment
12%
Pumping Systems
13%
Greenhouse2%
Orders received by Business Unit Q4 2018
+/+
-/+=/= +/-
+/-
+/+
+/+
=/=
+/=+/+
+/-
+/+
-/=
Brazed & Fusion Bonded
Heat Exchangers
5%Energy
Separation
3%
Gasketed Plate Heat
Exchangers12%
Welded Heat Exchangers
8%
Decanters5%
Food Heat Transfer
5%
Food Systems5%Hygienic Fluid
Handling
11%
High Speed Separators
5%
Boiler & Gas Systems
15%
Marine Separation &
Heat Transfer Equipment
12%
Pumping Systems
11%
Greenhouse3%
Orders received by Business Unit YTD 2018
+
++ +
+
+
=
+
+=
+
+
-
YTD 2018 compared to YTD 2017
+ increase
- decrease
= unchanged (+/- 3 %)
at constant rates adjusted for acquisition/divestment of businesses
Q4 2018 compared to
Q4 2017 / Q4 2018
compared to Q3 2018
▲Energy
▲Food & Water
▲ Marine
Greenhouse
Greenhouse

Alfa Laval AB (publ) Fourth quarter and full year 2018
Page 9 (25)
95.5%4.5%
75.9%24.1%
70.2%29.8%
74.3%25.7%
0
5,000
10,000
15,000
20,000
25,000
30,000
35,000
40,000
45,000
50,000
0 5 10 15 20 25 30 35 40 45 50 55 60 65 70 75 80 85 90 95 100
SEK millions
%
Order intake split on capital sales and after sales & service by Business Division
Full year 2018
Energy Food & Water Marine Greenhouse Capital sales After sales & service

Alfa Laval AB (publ) Fourth quarter and full year 2018
Page 10 (25)
Energy Division
Consolidated
Fourth quarter Full year
SEK millions 2018 2017 2018 2017
Orders received 3,330 2,852 12,685 11,175
Order backlog* 4,857 4,471 4,857 4,471
Net sales 3,343 3,259 12,413 11,001
Operating income** 438 469 1,770 1,525
Operating margin*** 13.1% 14.4% 14.3% 13.9%
Depreciation and amortisation 74 87 304 317
Investments 48 36 83 84
Assets* 10,362 9,555 10,362 9,555
Liabilities* 4,323 3,743 4,323 3,743
Number of employees* 3,112 3,016 3,112 3,016 * At the end of the period. ** In management accounts. *** Operating income in relation to net sales.
Consolidated Change excluding currency effects
Order intake Net sales
Structural Organic Structural Organic
% change development Total change development Total
Q4 2018/Q4 2017 - 11.8 11.8 - -1.5 -1.5
Q4 2018/Q3 2018 - 8.6 8.6 - 9.2 9.2
YTD 2018/2017 - 10.5 10.5 - 9.7 9.7
Order intake*
The Energy Division’s overall order volumes
increased during the fourth quarter compared to
the third quarter, as strong demand from refinery
customers generated good growth in both the
base business** and mid-sized orders.
Another area developing well was oil & gas
production - supported by some large orders in
gas production. Demand from the drilling sector
was unchanged compared to the third quarter. The
same applied to demand from customers in the
petrochemical industry, where a slightly lower
base business was compensated by larger orders
for welded heat exchangers. The inorganic
chemicals industry, meanwhile did very well, with
increasing volumes for both base business and
mid-sized orders. Order intake from the HVAC
sector showed modest growth compared to the
previous quarter.
Service reported somewhat lower volumes
compared to the third quarter, when some larger
service contracts were booked. Overall, the
service business had very good growth compared
to the fourth quarter of the previous year.
Operating income
Consolidated Bridge
SEK millions Fourth quarter Full year
Operating income 2017 469 1,525
Volume 1) -19 362
Mix 1) -22 -73
Costs 1) 16 -44
Currency -6 0
Operating income 2018 438 1,770
1) Change excluding currency effects
The negative volume effect is explained by
decreased net sales, excluding currency effects, in
the fourth quarter compared to the corresponding
quarter last year. Lower capacity utilisation in
certain units had a negative effect on the
profitability. The costs decreased due to lower
quality costs.
* Comments excluding currency effects.
** Base business and base orders refer to orders with an order value of less than EUR 0.5 million.

Alfa Laval AB (publ) Fourth quarter and full year 2018
Page 11 (25)
Food & Water Division
Consolidated
Fourth quarter Full year
SEK millions 2018 2017 2018 2017
Orders received 3,540 3,053 13,691 12,388
Order backlog* 4,860 4,317 4,860 4,317
Net sales 3,604 3,261 13,210 11,824
Operating income** 607 517 2,110 1,780
Operating margin*** 16.8% 15.9% 16.0% 15.1%
Depreciation and amortisation 35 35 145 142
Investments 56 36 132 73
Assets* 9,675 8,124 9,675 8,124
Liabilities* 4,612 3,652 4,612 3,652
Number of employees* 4,194 3,997 4,194 3,997 * At the end of the period. ** In management accounts. *** Operating income in relation to net sales.
Consolidated Change excluding currency effects
Order intake Net sales
Structural Organic Structural Organic
% change development Total change development Total
Q4 2018/Q4 2017 - 11.9 11.9 - 6.5 6.5
Q4 2018/Q3 2018 - 12.4 12.4 - 7.5 7.5
YTD 2018/2017 - 7.9 7.9 - 9.0 9.0
Order intake*
The division’s order intake showed strong growth
in the fourth quarter compared to the previous
quarter. All major end market industries
contributed, except for water and waste. The base
business grew at a healthy pace, but it was the
larger orders that accounted for the most
significant increase in the quarter.
The project activity was very good within brewery,
mainly driven by the customers’ investments into
efficiency and quality, rather than capacity.
Business sentiment in pharma and biotech was
also continued positive, generating strong growth
for Alfa Laval’s offering to these industries in
general, and for high-speed separators in
particular. Dairy also had good growth in the
quarter, from an already high level, positively
impacting high-speed separators and also
hygienic fluid handling. Water and waste markets
showed a certain contraction, mainly as a result of
somewhat lower activity in the North American
market. Order intake from customers within edible
oil was overall higher. While the project side in this
particular market was unchanged, the base
business was very healthy, confirming the
opportunities that exist also outside of large
capacity-related investments.
The aftermarket grew somewhat compared to the
previous quarter, mainly explained by a positive
business sentiment in Europe and Asia, while
unchanged levels were noted in Americas.
Operating income
Consolidated Bridge
SEK millions Fourth quarter Full year
Operating income 2017 517 1,780
Volume 1) 72 371
Mix 1) -12 66
Costs 1) 13 -141
Currency 17 34
Operating income 2018 607 2,110
1) Change excluding currency effects
The improvement in operating income was to a
large extent driven by a strong increase in sales,
reflecting a period of strong order growth now
being delivered. An overall favourable cost as well
as foreign exchange development also contributed
positively, whereas the mix of sales had a negative
impact. This stemmed from a higher share of new
sales and particularly larger projects and
consequently a lower share of after sales, which
generated a lower average gross margin in the
quarter.
* Comments excluding currency effects.

Alfa Laval AB (publ) Fourth quarter and full year 2018
Page 12 (25)
Marine Division
Consolidated
Fourth quarter Full year
SEK millions 2018 2017 2018 2017
Orders received 4,439 3,497 17,322 11,456
Order backlog* 13,118 9,027 13,118 9,027
Net sales 3,869 3,157 13,583 10,809
Operating income** 659 600 2,328 1,771
Operating margin*** 17.0% 19.0% 17.1% 16.4%
Depreciation and amortisation 192 199 785 772
Investments 29 21 90 59
Assets* 24,244 23,861 24,244 23,861
Liabilities* 7,168 5,963 7,168 5,963
Number of employees* 3,098 2,914 3,098 2,914 * At the end of the period. ** In management accounts. *** Operating income in relation to net sales.
Consolidated Change excluding currency effects
Order intake Net sales
Structural Organic Structural Organic
% change development Total change development Total
Q4 2018/Q4 2017 - 21.6 21.6 - 16.9 16.9
Q4 2018/Q3 2018 - -8.5 -8.5 - 12.6 12.6
YTD 2018/2017 - 45.7 45.7 - 21.4 21.4
Order intake*
Order intake for the Marine Division decreased in
the fourth quarter compared to the previous
quarter, mainly as a result of PureSOx coming in
lower, following an extraordinary development in
the preceding quarter. Both offshore pumping
systems and ballast water equipment reported
significant growth compared to the third quarter,
but not enough to compensate for the swing in
PureSOx.
Regarding the environmental portfolio of products,
the market’s interest in PureSOx was on a
continued good level as there was no change to
the market’s view that the scrubber technology is
a long-term financially attractive solution. Actual
order intake was however lower after the
extraordinary third quarter, when most suppliers
filled up their backlog for delivery in 2019.
Meanwhile, PureBallast saw a lift in order intake
compared to the third quarter, as the legislation
comes closer to be enforced for the sailing fleet in
September 2019. Order intake for equipment tied
to the building of new vessels was on an overall
level unchanged, reflecting the contracting
development earlier in the year. Offshore orders
increased significantly in the quarter as a number
of contracts for pumping systems was booked,
reflecting a certain pick up for offshore floating
production facilities, but also more maintenance
related investments. Engine power orders
decreased in the fourth quarter compared to the
third as most product groups saw lower demand in
a market characterized by irregular order intake.
Order intake for Service was unchanged
compared to the third quarter as lower demand for
service of separators was offset by higher demand
for boiler service.
Operating income
Consolidated Bridge
SEK millions Fourth quarter Full year
Operating income 2017 600 1,771
Volume 1) 185 783
Mix 1) -111 -98
Costs 1) -29 -181
Currency 14 53
Operating income 2018 659 2,328
1) Change excluding currency effects
The main contribution to the increased profitability
is a strong volume effect driven by higher invoicing
of cargo pumping systems and exhaust gas
cleaning systems. This development creates a
negative mix effect as the share of after sales
compared to new sales decreases. The increase
in cost is largely driven by the higher activity level
within marine environmental products.
* Comments excluding currency effects.

Alfa Laval AB (publ) Fourth quarter and full year 2018
Page 13 (25)
Greenhouse Division
Consolidated
Fourth quarter Full year
SEK millions 2018 2017 2018 2017
Orders received 236 378 1,259 1,609
Order backlog* 328 474 328 474
Net sales 375 435 1,418 1,680
Operating income** 30 14 80 -12
Operating margin*** 8.0% 3.2% 5.6% -0.7%
Depreciation and amortisation 4 -11 14 26
Investments 8 12 21 17
Assets* 680 806 680 806
Liabilities* 431 593 431 593
Number of employees* 502 642 502 642 * At the end of the period. ** In management accounts. *** Operating income in relation to net sales.
Consolidated Change excluding currency effects
Order intake Net sales
Structural Organic Structural Organic
% change development Total change development Total
Q4 2018/Q4 2017 -8.8 -31.6 -40.4 -18.4 0.1 -18.3
Q4 2018/Q3 2018 0.0 -2.9 -2.9 0.0 25.5 25.5
YTD 2018/2017 -10.0 -14.7 -24.7 -10.3 -8.5 -18.8
Order intake*
Greenhouse order intake was unchanged in the
fourth quarter compared to the previous quarter as
growth for the air heat exchanger business was
offset by a decline for tubular heat exchangers.
Air heat exchangers’ positive development was
mainly driven by good demand in HVAC
applications and industrial refrigeration. Good
development was seen in Southern, Central and
Eastern Europe as well as in India. Tubular heat
exchangers decreased due to the phasing out of a
long-term contract in marine engine cooling
applications in the U.S.
Operating income
Consolidated Bridge
SEK millions Fourth quarter Full year
Operating income 2017 14 -12
Volume 1) -18 -45
Mix 1) -7 83
Costs 1) 41 52
Currency 0 2
Operating income 2018 30 80
1) Change excluding currency effects
Net sales have decreased due to the divestments
of two product groups - heat exchanger systems
and the Alonte based commercial tubular heat
exchanger business, partially offset by increased
sales for the air heat exchangers. The negative
mix effect is within capital sales. The divestments
are also the main explanation to the cost
development. In addition, the air heat exchangers
profitability has continued to improve mainly due
to good manufacturing capacity utilization but also
good cost control.
* Comments excluding currency effects.

Alfa Laval AB (publ) Fourth quarter and full year 2018
Page 14 (25)
Operations and Other Operations and Other covers procurement,
production and logistics as well as corporate over-
head and non-core businesses.
Consolidated
Fourth quarter Full year
SEK millions 2018 2017 2018 2017
Orders received 16 0 48 0
Order backlog* 5 0 5 0
Net sales 18 0 42 0
Operating income** -210 -230 -674 -533
Depreciation and amortisation 104 85 416 393
Investments 418 177 1,164 442
Assets* 6,778 5,372 6,778 5,372
Liabilities* 2,853 2,591 2,853 2,591
Number of employees* 6,322 5,798 6,322 5,798 * At the end of the period. ** In management accounts.
The order intake and net sales for Operations and
Other is relating to contract manufacturing of shell
and tube heat exchangers for BITZER after the
sale of the business to BITZER.
The improved operating income in the fourth
quarter 2018 compared to the corresponding
period last year is above all explained by lower
costs for the manufacturing restructuring program.
Reconciliation between Divisions and Group total
Consolidated
Fourth quarter Full year
SEK millions 2018 2017 2018 2017
Operating income
Total for divisions 1,524 1,370 5,614 4,531
Comparison distortion items 14 - 151 -
Consolidation adjustments * 10 7 66 58
Total operating income 1,548 1,377 5,831 4,589
Financial net -78 -19 65 -218
Result after financial items 1,470 1,358 5,896 4,371
Assets **
Total for divisions 51,739 47,718 51,739 47,718
Corporate *** 6,333 4,831 6,333 4,831
Group total 58,072 52,549 58,072 52,549
Liabilities **
Total for divisions 19,387 16,542 19,387 16,542
Corporate *** 15,086 15,507 15,086 15,507
Group total 34,473 32,049 34,473 32,049 * Difference between management accounts and IFRS. ** At the end of the period. *** Corporate refers to items in the statement on financial position that are interest bearing or are related to taxes.
Alfa Laval AB (publ) Fourth quarter and full year 2018
Page 15 (25)
Information about products and services
Consolidated Net sales by product/service *
Fourth quarter Full year
SEK millions 2018 2017 2018 2017
Own products within:
Separation 1,907 1,925 7,183 6,471
Heat transfer 4,859 4,941 17,932 16,726
Fluid handling 2,502 2,007 9,511 7,678
Other 922 432 2,515 1,180
Associated products 436 391 1,605 1,448
Services 583 416 1,920 1,811
Total 11,209 10,112 40,666 35,314
* The split of own products within separation, heat transfer and fluid handling is a reflection of the current three main technologies. Other is own products outside these main technologies. Associated products are
mainly purchased products that complement Alfa Laval’s product offering. Services cover all sorts of service, service agreements etc.
New products during the fourth quarter
During the fourth quarter Alfa Laval has introduced
among others the following new products:
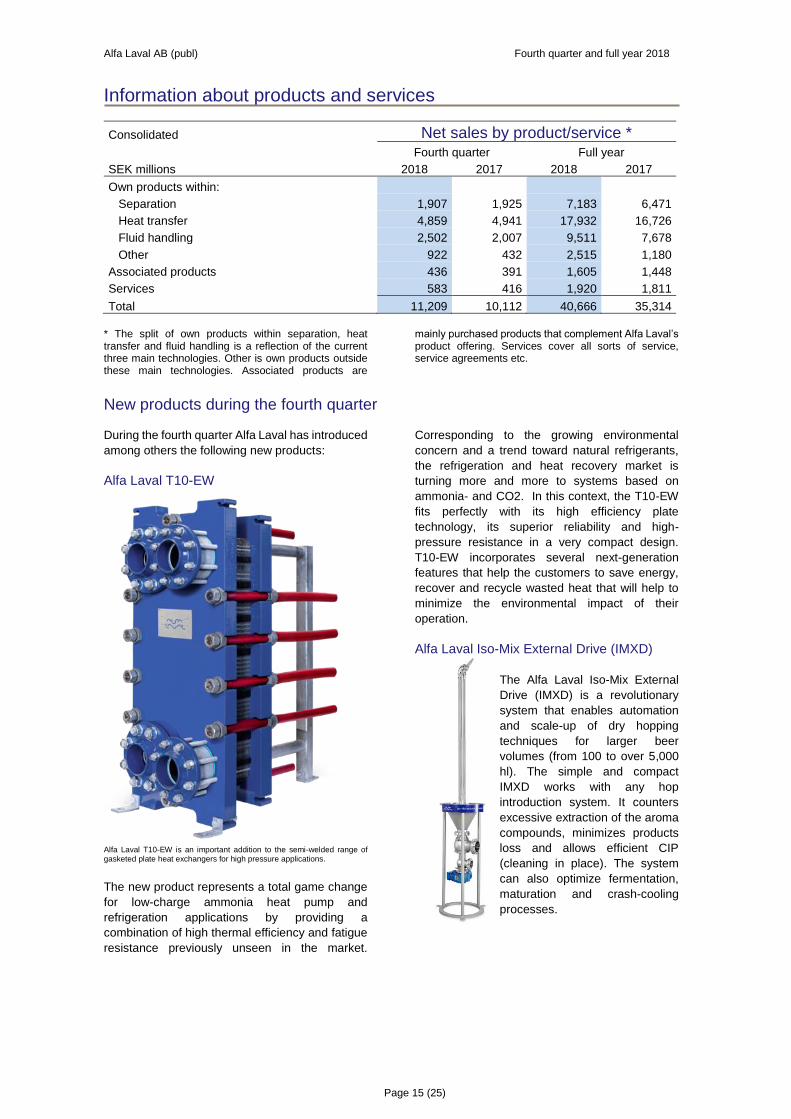
Alfa Laval T10-EW
Alfa Laval T10-EW is an important addition to the semi-welded range of gasketed plate heat exchangers for high pressure applications.
The new product represents a total game change
for low-charge ammonia heat pump and
refrigeration applications by providing a
combination of high thermal efficiency and fatigue
resistance previously unseen in the market.
Corresponding to the growing environmental
concern and a trend toward natural refrigerants,
the refrigeration and heat recovery market is
turning more and more to systems based on
ammonia- and CO2. In this context, the T10-EW
fits perfectly with its high efficiency plate
technology, its superior reliability and high-
pressure resistance in a very compact design.
T10-EW incorporates several next-generation
features that help the customers to save energy,
recover and recycle wasted heat that will help to
minimize the environmental impact of their
operation.
Alfa Laval Iso-Mix External Drive (IMXD)
The Alfa Laval Iso-Mix External
Drive (IMXD) is a revolutionary
system that enables automation
and scale-up of dry hopping
techniques for larger beer
volumes (from 100 to over 5,000
hl). The simple and compact
IMXD works with any hop
introduction system. It counters
excessive extraction of the aroma
compounds, minimizes products
loss and allows efficient CIP
(cleaning in place). The system
can also optimize fermentation,
maturation and crash-cooling
processes.

Alfa Laval AB (publ) Fourth quarter and full year 2018
Page 16 (25)
Information by region
Nordic
Western Europe
Central & Eastern Europe
Asia
Latin America
North America
Africa & Oceania
9%
20%
6%
41%
4%
18%
2%
Orders received fourth quarter
= Compared to Q4 2017 / Q3 2018 excluding currency effects
+8% / -5%
+5% / +12%
+20% / +24%
+14% / -7%
+23% / +17%
+25% / -6%
-1% / +3%
Nordic
Western Europe
Central & Eastern Europe
Asia
Latin America
North America
Africa & Oceania
10%
20%
5%
41%
5%
17%
2%
Orders received YTD 2018
= Compared to YTD 2017 excluding currency effects
+30%
+7%
+5%
+29%
+10%
+39%
+11%
All comments are excluding currency effects.
Western Europe including Nordic The region grew in the fourth quarter compared to
the previous quarter, driven by Energy and Food
& Water. In the Marine division, a good develop-
ment for offshore pumping systems and service
could not fully compensate for lower order intake
for PureSOx och PureBallast in the quarter.
Service grew in all three divisions compared to the
previous quarter.
Central and Eastern Europe Order intake increased in the fourth quarter
compared with the third, due to a good base
business* development in all three divisions and
several larger orders in Marine and Energy.
Russia reported strong growth compared to the
previous quarter, driven by a good base business
in all three divisions and a number of larger orders
in the Energy division. In spite of a tougher market
climate, also Turkey reported strong growth
compared to the previous quarter, driven by larger
orders in the Marine Division.
North America North America had a strong fourth quarter
compared to the third, driven by larger orders in oil
& gas and food in the U.S. The base business was
slightly muted compared to the third quarter
reflecting uncertainties regarding the macro
political situation.
Latin America The order intake declined in the fourth quarter
compared to the previous quarter, as a strong
base business across the region was unable to
fully compensate for the fact that there were fewer
larger orders than in the previous quarter. The
strong base business was driven by service in
Brazil, Argentina and Chile and by a strong capital
* Base business and base orders refer to orders with an
order value of less than EUR 0.5 million.

Alfa Laval AB (publ) Fourth quarter and full year 2018
Page 17 (25)
sales business across the region in all three
divisions. Brazil reported its third consecutive
quarter of base-business growth.
Asia The order intake declined in the fourth quarter
compared to the third quarter as there were fewer
PureSOx orders, particularly impacting countries
such as China and South Korea. Excluding
PureSOx, the region grew, supported by a positive
development across most countries. In China,
Food & Water had a strong quarter, driven by a
good base business development and larger
orders. Both South East Asia and India reported
growth across all three divisions.
Africa and Oceania A decline in order intake in Oceania in the fourth
quarter compared to the previous quarter was
compensated by strong growth in Africa, which
was supported by its land-based service business
as well as a strong development in Food & Water.
Consolidated Net sales
Fourth quarter Full year
SEK millions 2018 2017 2018 2017
To customers in:
Sweden 259 257 924 888
Other EU 2,982 2,857 11,033 9,627
Other Europe 860 846 2,918 2,726
USA 1,711 1,522 6,394 5,712
Other North America 214 245 896 816
Latin America 500 422 1,835 1,614
Africa 118 167 450 396
China 1,426 1,058 5,263 4,309
South Korea 770 878 3,041 2,952
Other Asia 2,230 1,703 7,346 5,754
Oceania 139 157 566 520
Total 11,209 10,112 40,666 35,314
Net sales are reported by country on the basis of
invoicing address, which is normally the same as
the delivery address.
Consolidated Non-current assets
December 31
SEK millions 2018 2017
Sweden 1,447 1,326
Denmark 4,728 4,654
Other EU 3,802 3,581
Norway 12,376 12,495
Other Europe 126 148
USA 3,964 3,707
Other North America 129 129
Latin America 259 284
Africa 7 9
Asia 3,262 2,919
Oceania 88 90
Subtotal 30,188 29,342
Other long-term securities 120 35
Pension assets 37 6
Deferred tax asset 1,755 1,589
Total 32,100 30,972
Information about major customers
Alfa Laval does not have any customer that
accounts for 10 percent or more of net sales. Tetra
Pak within the Tetra Laval Group is Alfa Laval's
single largest customer with a volume
representing 5.2 (5.3) percent of net sales.

Alfa Laval AB (publ) Fourth quarter and full year 2018
Page 18 (25)
Cash flows
CONSOLIDATED CASH FLOWS
Fourth quarter Full year
SEK millions 2018 2017 2018 2017
Operating activities Operating income 1,548 1,377 5,831 4,589
Adjustment for depreciation, amortisation and write down 409 395 1,664 1,650
Adjustment for other non-cash items -70 147 -208 107
1,887 1,919 7,287 6,346
Taxes paid -365 -209 -1,642 -1,583
1,522 1,710 5,645 4,763
Changes in working capital: Increase(-)/decrease(+) of receivables 34 -536 -1,026 -517
Increase(-)/decrease(+) of inventories -238 -144 -895 -774
Increase(+)/decrease(-) of liabilities 471 825 1,399 1,273
Increase(+)/decrease(-) of provisions -299 -282 -240 -282
Increase(-)/decrease(+) in working capital -32 -137 -762 -300
1,490 1,573 4,883 4,463
Investing activities Investments in fixed assets (Capex) -559 -282 -1,490 -675
Divestment of fixed assets 31 -2 120 23
Acquisition of businesses - - - -69
Divestment of businesses - - 77 -
-528 -284 -1,293 -721
Financing activities Received interests and dividends 43 79 142 168
Paid interests -31 -42 -192 -214
Realised financial exchange gains -58 21 182 77
Realised financial exchange losses -23 -38 -267 -245
Dividends to owners of the parent - - -1,783 -1,783
Dividends to non-controlling interests - -9 0 -14
Increase(-) of financial assets -116 -108 -116 -187
Decrease(+) of financial assets 195 0 601 0
Increase of loans 34 -60 726 715
Amortisation of loans - - -1,738 -1,676
44 -157 -2,445 -3,159
Cash flow for the period 1,006 1,132 1,145 583
Cash and cash equivalents at the beginning of the period 3,253 1,949 3,137 2,619
Translation difference in cash and cash equivalents 36 56 13 -65
Cash and cash equivalents at the end of the period 4,295 3,137 4,295 3,137
Free cash flow per share (SEK) * 2.29 3.07 8.56 8.92
Capex in relation to net sales 5.0% 2.8% 3.7% 1.9%
Average number of shares 419,456,315 419,456,315 419,456,315 419,456,315
* Free cash flow is the sum of cash flows from operating and investing activities.
During the full year 2018 cash flows from operating
and investing activities were SEK 3,590 (3,742)
million. Depreciation, excluding allocated step-up
values, was SEK 626 (629) million during the full
year 2018.
The sale of businesses during the full year is
relating to the sale of heat exchanger systems to
NIBE with SEK 40 million and shell and tube heat
exchangers to BITZER with SEK 37 million.

Alfa Laval AB (publ) Fourth quarter and full year 2018
Page 19 (25)
Financial position and equity
CONSOLIDATED FINANCIAL POSITION
December 31
SEK millions 2018 2017
ASSETS
Non-current assets
Intangible assets 24,410 24,467
Property, plant and equipment 5,732 4,851
Other non-current assets 1,958 1,654
32,100 30,972
Current assets
Inventories 9,253 8,424
Assets held for sale - 2
Assets related to disposal groups held for sale 526 -
Accounts receivable 6,496 5,941
Other receivables 4,694 2,700
Derivative assets 91 165
Other current deposits 617 1,208
Cash and cash equivalents * 4,295 3,137
25,972 21,577
TOTAL ASSETS 58,072 52,549
SHAREHOLDERS' EQUITY AND LIABILITIES
Equity
Owners of the parent 23,477 20,398
Non-controlling interests 122 102
23,599 20,500
Non-current liabilities
Liabilities to credit institutions etc. 8,540 11,092
Provisions for pensions and similar commitments 2,118 2,297
Provision for deferred tax 1,945 2,100
Other non-current liabilities 788 677
13,391 16,166
Current liabilities
Liabilities related to disposal groups held for sale 351 -
Liabilities to credit institutions etc. 3,323 1,404
Accounts payable 3,136 2,964
Advances from customers 5,221 3,537
Other provisions 1,929 2,024
Other liabilities 6,682 5,783
Derivative liabilities 440 171
21,082 15,883
Total liabilities 34,473 32,049
TOTAL SHAREHOLDERS' EQUITY & LIABILITIES 58,072 52,549 * The item cash and cash equivalents is mainly relating to bank deposits and liquid deposits.

Alfa Laval AB (publ) Fourth quarter and full year 2018
Page 20 (25)
Consolidated Financial assets and liabilities at fair value
Valuation hierarchy December 31
SEK millions level 2018 2017
Financial assets
Other non-current securities 1 and 2 76 4
Bonds and other securities 1 435 542
Derivative assets 2 137 189
Financial liabilities
Derivative liabilities 2 563 187 Valuation hierarchy level 1 is according to quoted prices in active markets for identical assets and liabilities. Valuation hierarchy level 2 is out of directly or indirectly observable market data outside level 1.
Consolidated Borrowings and net debt
December 31
SEK millions 2018 2017
Credit institutions 262 142
Swedish Export Credit 2,246 2,106
European Investment Bank 1,180 2,411
Corporate bonds 8,175 7,837
Capitalised financial leases 34 49
Interest-bearing pension liabilities 0 0
Total debt 11,897 12,545
Cash and cash equivalents and current deposits -4,912 -4,345
Net debt * 6,985 8,200 * Alternative performance measure.
Alfa Laval has a senior credit facility of EUR 400
million and USD 544 million, corresponding to SEK
8,981 million with a banking syndicate. The facility
was not utilised at December 31, 2018. The facility
matures in June 2021.
The corporate bonds are listed on the Irish stock
exchange and consist of one tranche of EUR 300
million that matures in September 2019 and one
tranche of EUR 500 million that matures in
September 2022.
The bilateral term loans from Swedish Export
Credit consist of one loan of EUR 100 million that
matures in June 2021 as well as a loan of USD
136 million that matures in June 2020.
The loan from the European Investment Bank of
EUR 115 million matures in June 2021. One loan
of EUR 130 million that matured was repaid on
March 29, 2018.
The commercial paper programme of SEK 2,000
million was not utilised at December 31, 2018.

Alfa Laval AB (publ) Fourth quarter and full year 2018
Page 21 (25)
CHANGES IN CONSOLIDATED EQUITY
Full year
SEK millions 2018 2017
At the beginning of the period* 20,486 20,276
Changes attributable to:
Owners of the parent
Comprehensive income
Comprehensive income for the period 4,876 2,069
Transactions with shareholders
Increase of ownership in subsidiaries
with non-controlling interests - -47
Dividends -1,783 -1,783
-1,783 -1,830
Subtotal 3,093 239
Non-controlling interests
Comprehensive income
Comprehensive income for the period 20 10
Transactions with shareholders
Decrease of non-controlling interests - -11
Dividends 0 -14
- -25
Subtotal 20 -15
At the end of the period 23,599 20,500
* The opening equity for 2018 has been adjusted with SEK -14 million due to IFRS 15.
Acquisitions and divestments of businesses The sale of the Alonte based commercial tubular
heat exchanger business in the Greenhouse
division to the BITZER Group was closed on May
1, 2018. The sale of the heat exchanger systems
business in the Greenhouse division to the NIBE
Group was closed on May 31, 2018. The
divestments have resulted in a total gain of
SEK 26 million that is reported as a comparison
distortion item.
Alfa Laval has signed an agreement to sell part of
its air heat exchanger business related to
commercial/industrial air heat exchangers in the
Greenhouse division to the LU-VE Group. The
closing of the agreement is expected during the
first half of 2019. This operation is as of the fourth
quarter and full year 2018 report reported as a
disposal group held for sale according to IFRS 5.
This means that all assets and liabilities relating to
this operation are presented separately in the
statement of financial position. The balance sheet
items are measured at the lower of their book
values and fair values less costs to sell, except for
deferred tax items and defined benefit obligations.
Since the transaction is estimated to result in a
realised gain, no write down to fair value has been
necessary.
Consolidated Disposal
group
December 31
SEK millions 2018
Assets
Property, plant and equipment 59
Inventories 166
Accounts receivable 275
Other receivables 26
Financial assets 0
Total 526
Liabilities
Accounts payable 120
Advances from customers 44
Other liabilities 187
Financial liabilities 0
Total 351

Alfa Laval AB (publ) Fourth quarter and full year 2018
Page 22 (25)
Parent company The parent company's result after financial items
for the full year 2018 was SEK 647 (1,073) million,
out of which dividends from subsidiaries SEK 668
(1,094) million, net interests SEK -0 (0) million,
realised and unrealised exchange rate gains and
losses SEK 1 (-0) million, costs related to the
listing SEK -4 (-4) million, fees to the Board SEK -9
(-8) million, cost for annual report and annual
general meeting SEK -2 (-2) million and other
operating income and operating costs the
remaining SEK -7 (-7) million.
PARENT COMPANY INCOME *
Fourth quarter Full year
SEK millions 2018 2017 2018 2017
Administration costs -2 -4 -15 -14
Other operating income 0 0 0 0
Other operating costs -1 -7 -7 -7
Operating income -3 -11 -22 -21
Revenues from interests in group companies - - 668 1,094
Interest income and similar result items 0 1 1 2
Interest expenses and similar result items 0 -1 0 -2
Result after financial items -3 -11 647 1,073
Change of tax allocation reserve -698 -251 -698 -251
Group contributions 2,810 1,439 2,810 1,439
Result before tax 2,109 1,177 2,759 2,261
Tax on this year's result -465 -260 -461 -258
Net income for the period 1,644 917 2,298 2,003 * The statement over parent company income also constitutes its statement over comprehensive income.
PARENT COMPANY FINANCIAL POSITION
December 31
SEK millions 2018 2017
ASSETS Non-current assets Shares in group companies 4,669 4,669
Current assets Receivables on group companies 10,111 8,891
Other receivables 5 3
Cash and cash equivalents - -
10,116 8,894
TOTAL ASSETS 14,785 13,563
SHAREHOLDERS' EQUITY AND LIABILITIES Equity Restricted equity 2,387 2,387
Unrestricted equity 9,932 9,417
12,319 11,804
Untaxed reserves
Tax allocation reserves, taxation 2013-2019 2,359 1,660
Current liabilities Liabilities to group companies 29 38
Accounts payable - 0
Tax liabilities 76 61
Other liabilities 2 -
107 99
TOTAL EQUITY AND LIABILITIES 14,785 13,563

Alfa Laval AB (publ) Fourth quarter and full year 2018
Page 23 (25)
Owners and shares Owners and legal structure Alfa Laval AB (publ) is the parent company of the
Alfa Laval Group. The company had 34,180
(32,967) shareholders on December 31, 2018.
The largest owner is Tetra Laval B.V., the
Netherlands, who owns 29.1 (29.1) percent. Next
to the largest owner, there are nine institutional
investors with ownership in the range of 5.2 to 0.6
percent. These ten largest shareholders owned
47.1 (47.9) percent of the shares.
Proposed disposition of earnings The parent company has unrestricted funds of
SEK 9,932 (9,417) million.
The Board of Directors propose a dividend of SEK
5.00 (4.25) per share corresponding to SEK 2,097
(1,783) million and that the remaining income
available for distribution in Alfa Laval AB (publ) of
SEK 7,835 (7,635) million be carried forward.
The Board of Directors are of the opinion that the
proposed dividend is consistent with the
requirements that the type and size of operations,
the associated risks, the capital needs, liquidity
and financial position put on the company.
Annual General Meeting 2019 The Annual General Meeting of Alfa Laval AB will
be held at Scandic Star Lund, Glimmervägen 5,
Lund, Sweden on Wednesday April 24, 2019, at
16.00 (CET).
Risks and other
Material factors of risk and uncertainty The main factors of risk and uncertainty facing the
Group concern the price development of metals,
fluctuations in major currencies and the business
cycle. It is the company’s opinion that the
description of risks made in the Annual Report for
2017 is still correct.
Asbestos-related lawsuits The Alfa Laval Group was as of December 31,
2018 named as a co-defendant in a total of 820
asbestos-related lawsuits with a total of
approximately 820 plaintiffs. Alfa Laval strongly
believes the claims against the Group are without
merit and intends to vigorously contest each
lawsuit.
Based on current information and Alfa Laval’s
understanding of these lawsuits, Alfa Laval
continues to believe that these lawsuits will not
have a material adverse effect on the Group’s
financial condition or results of operation.
Accounting principles The interim report for the fourth quarter 2018 is
prepared in accordance with IAS 34 Interim
Financial Reporting and the Swedish Annual
Accounts Act. The accounting principles are
according to IFRS (International Financial
Reporting Standards) as adopted by the European
Union. In the report, alternative performance
measures are used. See the annual report 2017
for definitions. Alfa Laval follows the Guidelines on
Alternative Performance Measures issued by
ESMA (European Securities and Markets
Authority).
IFRS 9 Financial Instruments and IFRS 15
Revenue from Contracts with Customers are
applied from January 1, 2018. Alfa Laval applies
them retrospectively with the cumulative effect of
initially applying them recognised as an
adjustment to the opening balance of unrestricted
equity at January 1, 2018. The opening order
backlog has also been adjusted as per January 1,
2018. The retrospective application only applies to
financial instruments and risks for credit losses
that existed at January 1, 2018 and contracts with
customers that were not completed contracts at
January 1, 2018. The effect of the initial application
was reported in the Annual Report for 2017 and
meant an adjustment of the opening equity of
SEK -14 million and an adjustment of the opening
order backlog of SEK +74 million.
“Fourth quarter” refers to the period October 1 to
December 31 and “Full year” refers to the period
January 1 to December 31. “The corresponding
period last year” refers to the fourth quarter 2017
or the full year 2017 depending on the context.
“Previous quarter” refers to the third quarter 2018.
“Currency effects” only relate to translation effects,
whereas “foreign exchange effects” also relate to
transactional and revaluation effects.
Comparison distortion items are reported in the
comprehensive income statement on each
concerned line but are specified on page 7.
The accounting and valuation principles of the
parent company comply with the Swedish Annual
Accounts Act and the recommendation RFR 2
Accounting for legal entities issued by the Council
for Financial Reporting in Sweden.
Annual report 2018 The annual report will be publishing the on Alfa
Laval’s website on March 26, 2019 at 10.00 CET
Alfa Laval AB (publ) Fourth quarter and full year 2018
Page 24 (25)
and by sending the printed annual report to the
shareholders starting in week 15, 2019.
Date for the next financial report Alfa Laval will publish interim reports during 2019
at the following dates:
Interim report for the first quarter April 24
Interim report for the second quarter July 17
Interim report for the third quarter October 24
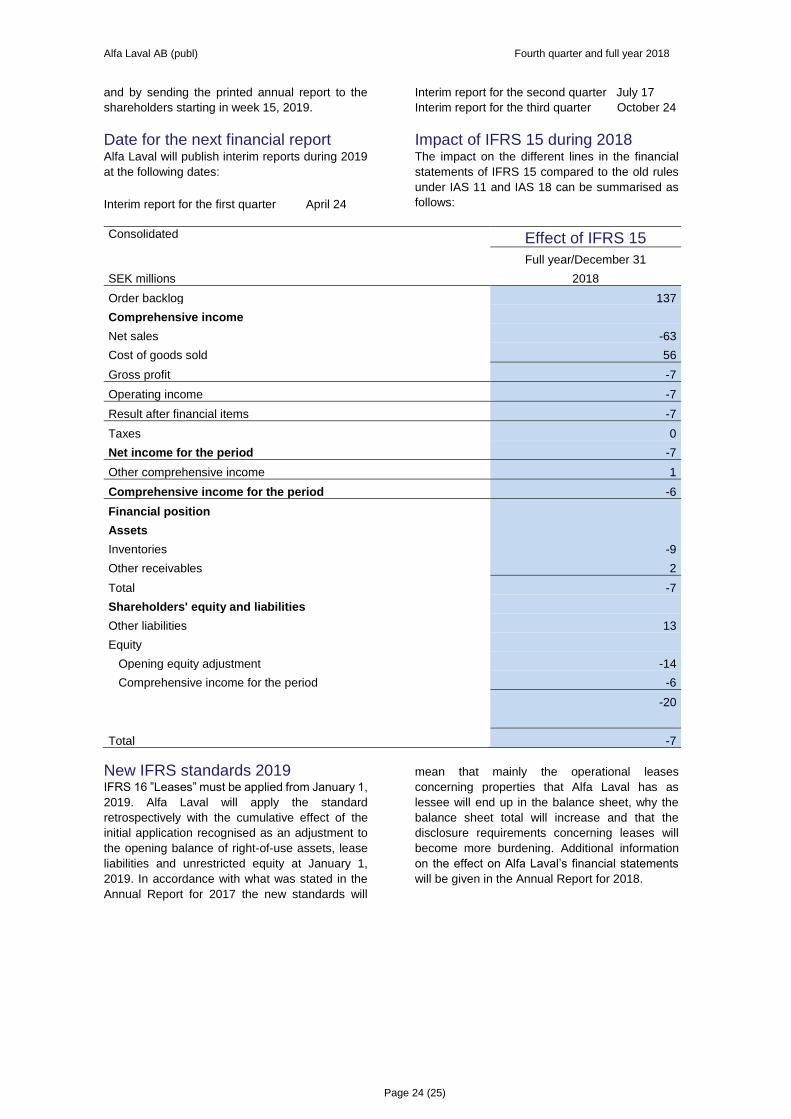
Impact of IFRS 15 during 2018 The impact on the different lines in the financial
statements of IFRS 15 compared to the old rules
under IAS 11 and IAS 18 can be summarised as
follows:
Consolidated Effect of IFRS 15
Full year/December 31
SEK millions 2018
Order backlog 137
Comprehensive income
Net sales -63
Cost of goods sold 56
Gross profit -7
Operating income -7
Result after financial items -7
Taxes 0
Net income for the period -7
Other comprehensive income 1
Comprehensive income for the period -6
Financial position
Assets
Inventories -9
Other receivables 2
Total -7
Shareholders' equity and liabilities
Other liabilities 13
Equity
Opening equity adjustment -14
Comprehensive income for the period -6
-20
Total -7
New IFRS standards 2019 IFRS 16 ”Leases” must be applied from January 1,
2019. Alfa Laval will apply the standard
retrospectively with the cumulative effect of the
initial application recognised as an adjustment to
the opening balance of right-of-use assets, lease
liabilities and unrestricted equity at January 1,
2019. In accordance with what was stated in the
Annual Report for 2017 the new standards will
mean that mainly the operational leases
concerning properties that Alfa Laval has as
lessee will end up in the balance sheet, why the
balance sheet total will increase and that the
disclosure requirements concerning leases will
become more burdening. Additional information
on the effect on Alfa Laval’s financial statements
will be given in the Annual Report for 2018.

Alfa Laval AB (publ) Fourth quarter and full year 2018
Page 25 (25)
The interim report has been issued at CET 7.30 on February 5, 2019 by the President and Chief Executive Officer Tom Erixon by proxy from the Board of Directors.
Lund, February 5, 2019,
Tom Erixon
President and Chief Executive Officer
Alfa Laval AB (publ)
Review report
Introduction We have reviewed the summary interim financial
information (the interim report) of Alfa Laval AB
(publ) as of December 31, 2018 and the twelve
months’ period then ended. The Board of Directors
and the President are responsible for the
preparation and presentation of this interim report
in accordance with IAS 34 and the Swedish
Annual Accounts Act. Our responsibility is to
express a conclusion on this interim report based
on our review.
Scope of review We conducted our review in accordance with
International Standard on Review Engagements
ISRE 2410 “Review of Interim Financial
Information Performed by the Independent Auditor
of the Entity”. A review consists of making
inquiries, primarily of persons responsible for
financial and accounting matters, and applying
analytical and other review procedures. A review
is substantially less in scope than an audit
conducted in accordance with the International
Standards on Auditing and other generally
accepted auditing practices. The procedures
performed in a review do not enable us to obtain a
level of assurance that would make us aware of all
significant matters that might be identified in an
audit. Therefore, the conclusion expressed based
on a review does not give the same level of
assurance as a conclusion expressed based on an
audit.
Conclusion Based on our review, nothing has come to our
attention that causes us to believe that the interim
report for 2018, in all material aspects, is not
prepared for the Group in accordance with IAS 34
and the Swedish Annual Accounts Act and for the
Parent company in accordance with the Swedish
Annual Accounts Act.
Other matters The review of the condensed interim report for
December 31, 2017 was performed by another
auditor who submitted a review report dated
January 30, 2018 with an unmodified conclusion.
Lund, February 5, 2019,
Staffan Landén Karoline Tedevall
Authorised Public Authorised Public
Accountant Accountant