Fortum investor presentation March 2018 · This presentation does not constitute an invitation to...
60
FORTUM – For a cleaner world Investor / Analyst material March 2018
Transcript of Fortum investor presentation March 2018 · This presentation does not constitute an invitation to...

FORTUM – For a cleaner world
Investor / Analyst material
March 2018

Disclaimer
This presentation does not constitute an invitation to underwrite, subscribe
for, or otherwise acquire or dispose of any Fortum shares.
Past performance is no guide to future performance, and persons needing
advice should consult an independent financial adviser.
Any references to the future represent the management’s current best
understanding. However the final outcome may differ from them.
2

Fortum today pages 4 – 18
European and Nordic power markets pages 19 – 26
Fortum’s nuclear fleet pages 27 – 30
Russia pages 31 – 33
Power capacity split in Russia page 33
Historical achieved prices page 34
Financial Statements Bulletin 2017 pages 35 – 55
Uniper investment pages 56 - 59
IR contacts pages 60
Content
3
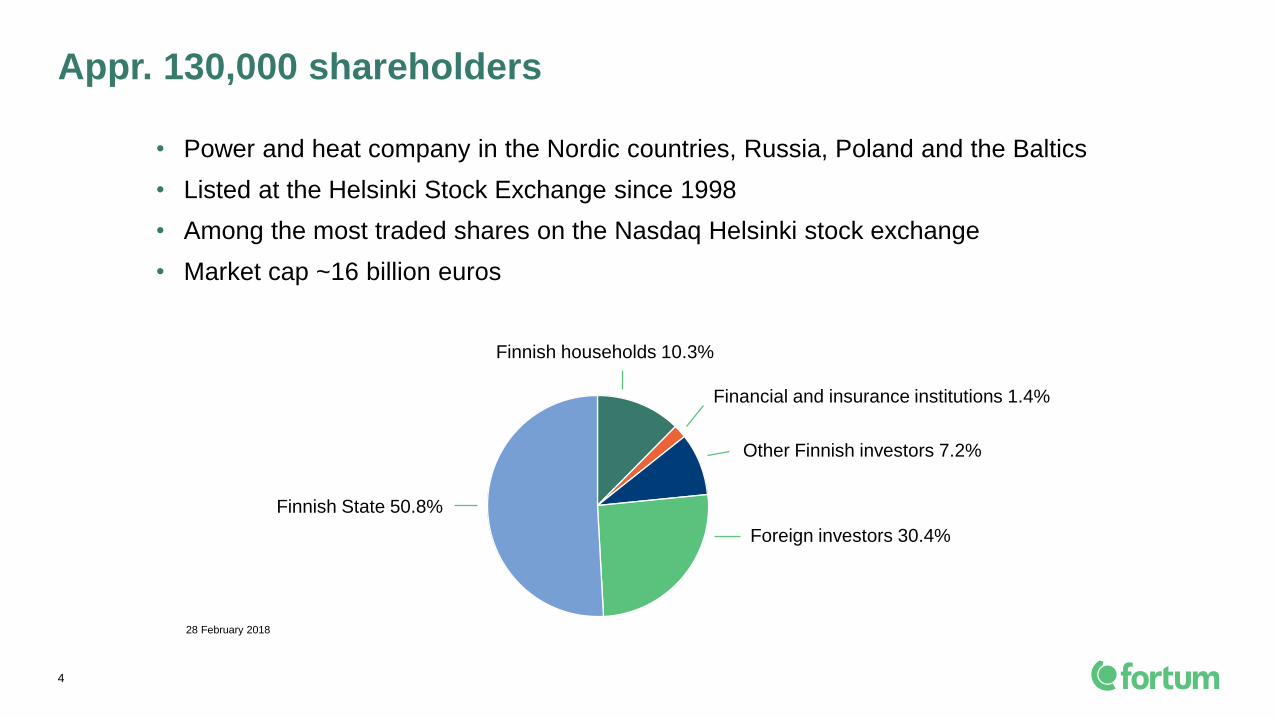
Appr. 130,000 shareholders
• Power and heat company in the Nordic countries, Russia, Poland and the Baltics
• Listed at the Helsinki Stock Exchange since 1998
• Among the most traded shares on the Nasdaq Helsinki stock exchange
• Market cap ~16 billion euros
4
28 February 2018
Foreign investors 30.4%
Finnish State 50.8%
Other Finnish investors 7.2%
Finnish households 10.3%
Financial and insurance institutions 1.4%

Capital returns: 2017 EUR 1.10 per share ~ EUR 1 billion
• Fortum’s dividend policy is based on the following preconditions:
– The dividend policy ensures that shareholders receive a fair remuneration for their entrusted capital, supported by the
company’s long-term strategy that aims at increasing earnings per share and thereby the dividend.
– When proposing the dividend, the Board of Directors looks at a range of factors, including the macro environment,
balance sheet strength as well as future investment plans.
5
Fortum's target is to pay a stable,
sustainable and over time increasing
dividend of 50-80% of earnings per share
excluding one-off items
Fortum has since 1998 annually paid dividends
in total ~14,580 MEUR2013
81%
2014
37%2015
24%
2016
196%
1.1 1.1 1.1
1.3
5 year dividend per share (EUR) history
2017*
112%
0.2
1.1
1.1
* The BoD proposal for the AGM

Fortum – For a cleaner world
6

Birka Energi
50% → 100%
Gullspång
Neste
Divestment of
non-strategic
heat business
Skandinaviska
Elverk
Länsivoima
45% → 65%
Birka Energi
50% Fortum
50% StockholmGullspång merged
with Stockholm Energi
Divestment of
Fingrid shares
Divestment of
heat operations
outside of
Stockholm
Divestment
of Lenenergo shares
1996
IVO Fortum
Divestment of
small scale
hydro
2012
TGC-10
2008
1997
Lenenergo
shares →
Stora Kraft
Länsivoima
→100%
2000
Elnova
50% → 100%
Østfold
Shares in
Lenenergo
Shares in
Hafslund
District heating
in Poland →
2003
Oil business
spin-off
TGC-1
established
2005
2011
1998 2002 2006
E.ON
Finland
2015
Divestment of
electricity
distribution
businessDivestment of electricity
distribution and heat
businesses
Divestment of electricity
distribution business
Divestment of
Grangemouth power plant
2014
Divestment
of Gasum
shares
DUON
Ekokem
2016
Turebergs
Recycling
2007
Nordkraft
wind power
2017
Restructuring
ownership in
Hafslund
Russian wind
power JV
Our strategic route
7
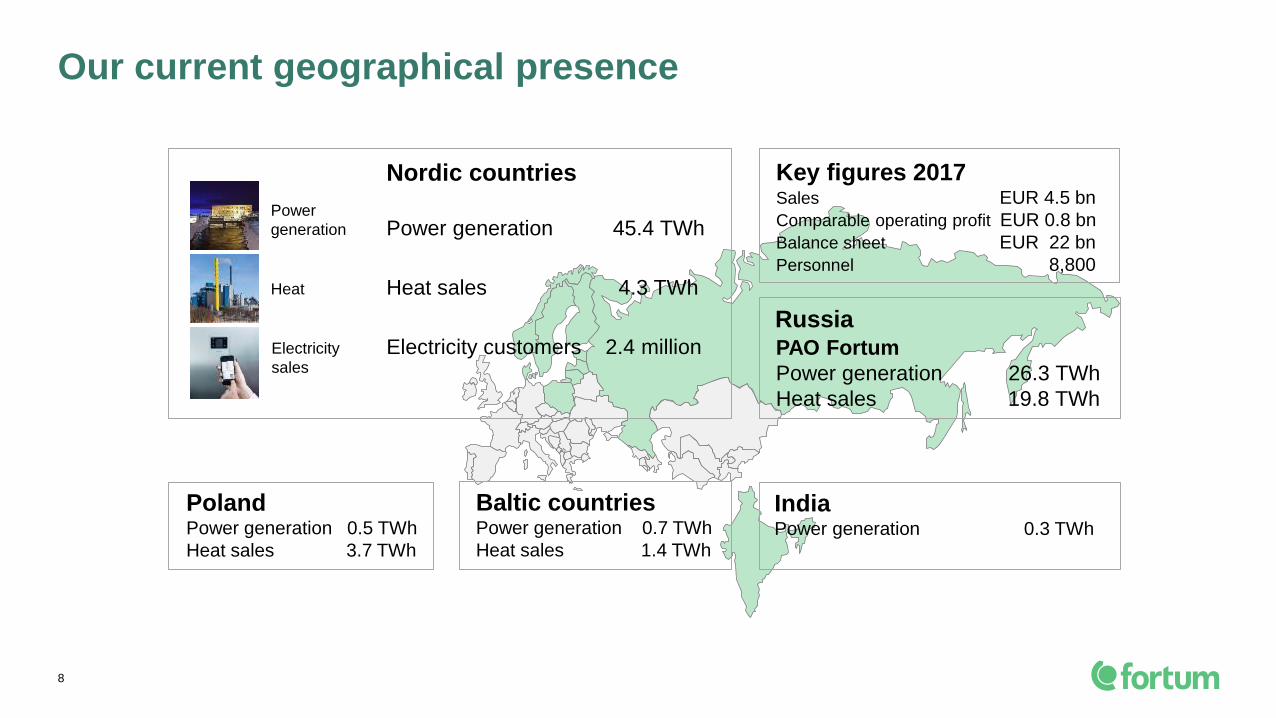
Our current geographical presence
8
PAO Fortum
Power generation 26.3 TWh
Heat sales 19.8 TWh
Russia
Nordic countries
Power generation 45.4 TWh
Heat sales 4.3 TWh
Electricity customers 2.4 million
Power
generation
Electricity
sales
Heat
PolandPower generation 0.5 TWh
Heat sales 3.7 TWh
Baltic countriesPower generation 0.7 TWh
Heat sales 1.4 TWh
IndiaPower generation 0.3 TWh
Key figures 2017Sales EUR 4.5 bn
Comparable operating profit EUR 0.8 bn
Balance sheet EUR 22 bn
Personnel 8,800

Still a highly fragmented Nordic power marketFortum has largest electricity customer base in the Nordics
9 Source: Fortum, company data, shares of the largest actors, pro forma 2016 figures (Fortum incl. Hafslund’s 1.1 million customers).
Vattenfall
36%Statkraft
Norsk Hydro
Others
Fortum
UniperPVO
DONG EnergyAgder Energi
E-CO Energi
BKK
Power generation in 2016
395 TWh
>350 companies
Electricity retail
15 million customers
~350 companies
Others
52%
Vattenfall
Fortum
DONG Energy
Jämtkraft
E.ON
Din El, Göteborg
HelenSEAS-NVE
Statkraft
SE-Syd Energi
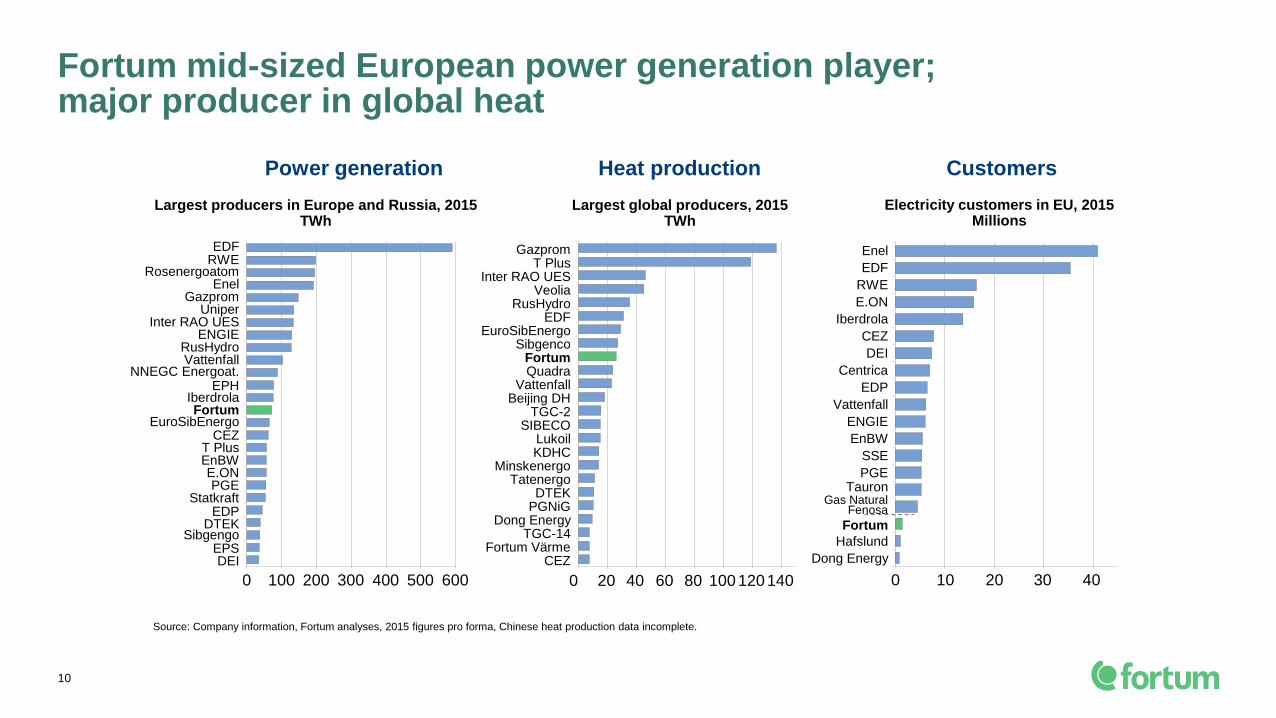
Fortum mid-sized European power generation player; major producer in global heat
10
Source: Company information, Fortum analyses, 2015 figures pro forma, Chinese heat production data incomplete.
Largest global producers, 2015 TWh
Largest producers in Europe and Russia, 2015TWh
Power generation Heat production
Electricity customers in EU, 2015Millions
Customers
TGC-2
KDHC
Quadra
TatenergoMinskenergo
DTEK
EuroSibEnergo
Fortum
Dong EnergyTGC-14
Lukoil
0 20 40 60 80 100 120140
Sibgenco
T Plus
Vattenfall
PGNiG
Inter RAO UES
EDFRusHydro
Veolia
Gazprom
Fortum Värme
Beijing DH
SIBECO
CEZ
EnBW
Rosenergoatom
Uniper
DEI
EuroSibEnergo
IberdrolaFortum
Inter RAO UES
CEZ
Enel
T Plus
Sibgengo
PGE
Gazprom
NNEGC Energoat.
RWEEDF
0 100 200 300 400 500 600
RusHydro
Statkraft
ENGIE
Vattenfall
EPS
EDPDTEK
E.ON
EPH
Gas NaturalFenosa
PGE
ENGIE
E.ON
DEI
CEZ
Enel
Centrica
EDP
Iberdrola
SSE
EnBW
Fortum
EDF
RWE
Tauron
Hafslund
Dong Energy
0 20 4010 30
Vattenfall

Biggest nuclear and hydro generators in Europe and Russia
111) Formerly GDF SUEZ
Source: Company information, Fortum analyses, 2013 figures pro forma
0
50
100
150
200
250
300
350
400
450
500
550
600
ED
F
Rosenerg
oato
m
RusH
ydro
NN
EG
C E
nerg
oato
m
Enel
E.O
N
Vatt
enfa
ll
Euro
Sib
Energ
o
EN
GIE
Sta
tkra
ft
Fort
um
Ibe
rdro
la
RW
E
CE
Z
EnB
W
Axpo
Verb
und
ED
P
Hid
roele
ctr
ica
Ukrh
ydro
energ
o
Centr
ica
Gazpro
m
Alp
iq
EP
S, S
erb
ia
Nors
k H
ydro
E-C
O E
nerg
i
Gas N
atu
ral F
enosa
Agder
Energ
i
BK
K
Lyse
Ene
rgi
DE
I
SS
E
Inte
r R
AO
UE
S
PG
E
DT
EK
IES
Other
Nuclear
Hydro
TWh
Total generation
1)
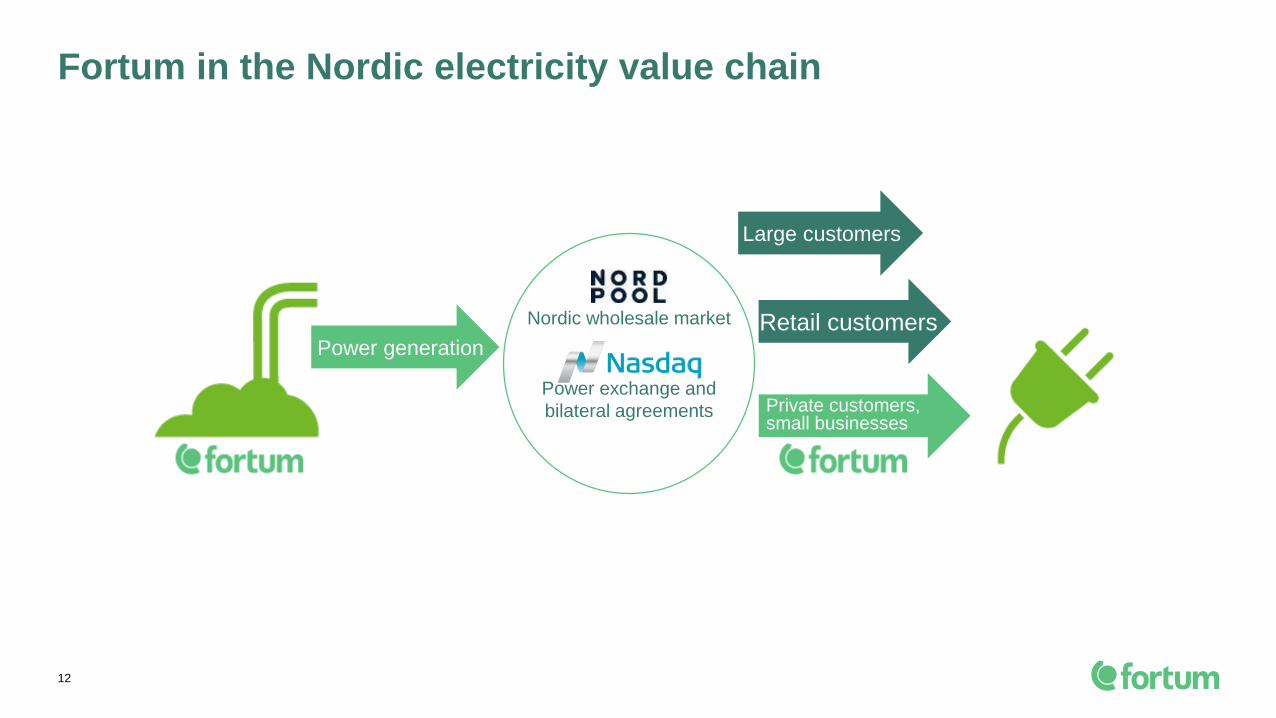
Fortum in the Nordic electricity value chain
12
Power generation
Nordic wholesale market
Power exchange and
bilateral agreements
Large customers
Retail customers
Private customers,small businesses

Fortum's power and heat production by source
13
Nuclear power
31%
Natural gas 35%
Coal 4%
Biomass 1%
Total generation 73.2 TWh
(Generation capacity 13,722 MW)
Hydropower 28%
Fortum's power generation
in 2017
Others 1%
Total production 28.6 TWh
(Production capacity 14,765 MW)
Fortum's heat production
in 2017
Biomass 7%
Heat pumps, electricity 2%
Waste 8%
Natural gas 65%
Coal 17%
Peat 1%
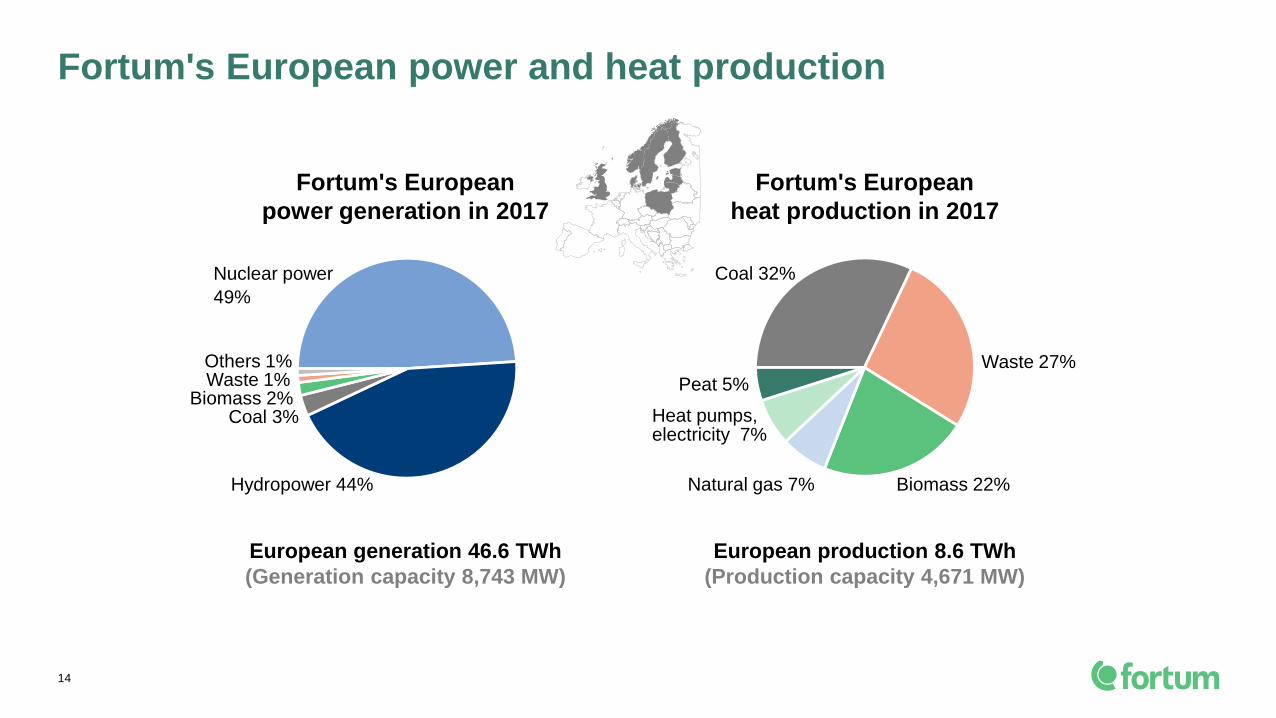
Fortum's European power and heat production
14
Waste 27%
Fortum's European
heat production in 2017
Peat 5%
Natural gas 7% Biomass 22%
Heat pumps, electricity 7%
Coal 32%
European production 8.6 TWh
(Production capacity 4,671 MW)
Nuclear power
49%
Coal 3%
Hydropower 44%
Biomass 2%
European generation 46.6 TWh
(Generation capacity 8,743 MW)
Fortum's European
power generation in 2017
Others 1%Waste 1%

Fortum’s Nordic, Baltic and Polish generation capacity
15
376
4 672
Other thermal
Hydro
Nuclear
CHP
2 814
Wind 107
Nordic, Baltic and Polish
generation capacity 8 743
774
Generation capacity MW MWFinland
Hydro 1 547
Nuclear 1 480
CHP 451
Other thermal 376
3 854Generation capacity
in Finland
MWBaltics and Poland
Generation capacity, CHP
26in Latvia
18in Lithuania
49in Estonia
186in Poland
Figures 31 December 2017
Associated companies’ plants
(not included in the MWs)
Stockholm Exergi (Former Fortum Värme),
Stockholm; TSE, Naantali
MW
75
9
Price areas
SE2
Hydro 1 550
Wind
SE3
Hydro 1 575
Nuclear 1 334
Sweden
4 543
Generation capacity
in Sweden
CHP
16
Generation capacity, CHP
in Denmark
Denmark, DK2 MW
MWPrice areas
NO4, Wind 32
NO1, CHP 19
Norway
51Generation capacity
in Norway
NO2
NO5 NO1
NO3
NO4 SE1
SE2
SE4
EE
LV
LT
PL
FI
SE3
DK1
DK2

We engage our customers and society to drive the change towards a cleaner
world. Our role is to accelerate this change by reshaping the energy system,
improving resource efficiency and providing smart solutions. This way we
deliver excellent shareholder value.
Fortum is listed in several sustainability indexes:
• CDP Nordic rating
• STOXX® Global ESG Leaders indices
• ECPI® Indices
• oekom
• OMX GES Sustainability Finland index
• Euronext Vigeo Eurozone 120 index
Fortum a forerunner in sustainability
16

0
200
400
600
800
1 000
DE
I
EP
H
RW
E
CE
Z
Un
ipe
r
Enel
A2A
Gas N
atu
ral F
enosa
EnB
W
ED
P
Dra
x
SS
E
Vattenfa
ll
En
eco
Fort
um
tota
l
Iberd
rola
E.O
N
Verb
und
Fort
um
EU
Sta
tkra
ft
28
g CO2/kWh electricity, 2016
2017
61% of Fortum's total power generation CO2-free
96% of Fortum’s power generation in the EU CO2-free
173
Fortum's carbon exposure among the lowest in Europe
17
Note:
All figures, except “Fortum total”, include only European power generation.
Fortum’s specific emissions of the power generation in 2017 in the EU were 28 g/kWh and in total 173 g/kWh, same as in the previous year.
Source: PwC, December 2017, Climate Change and Electricity (including those companies with data for power generation available only), Fortum
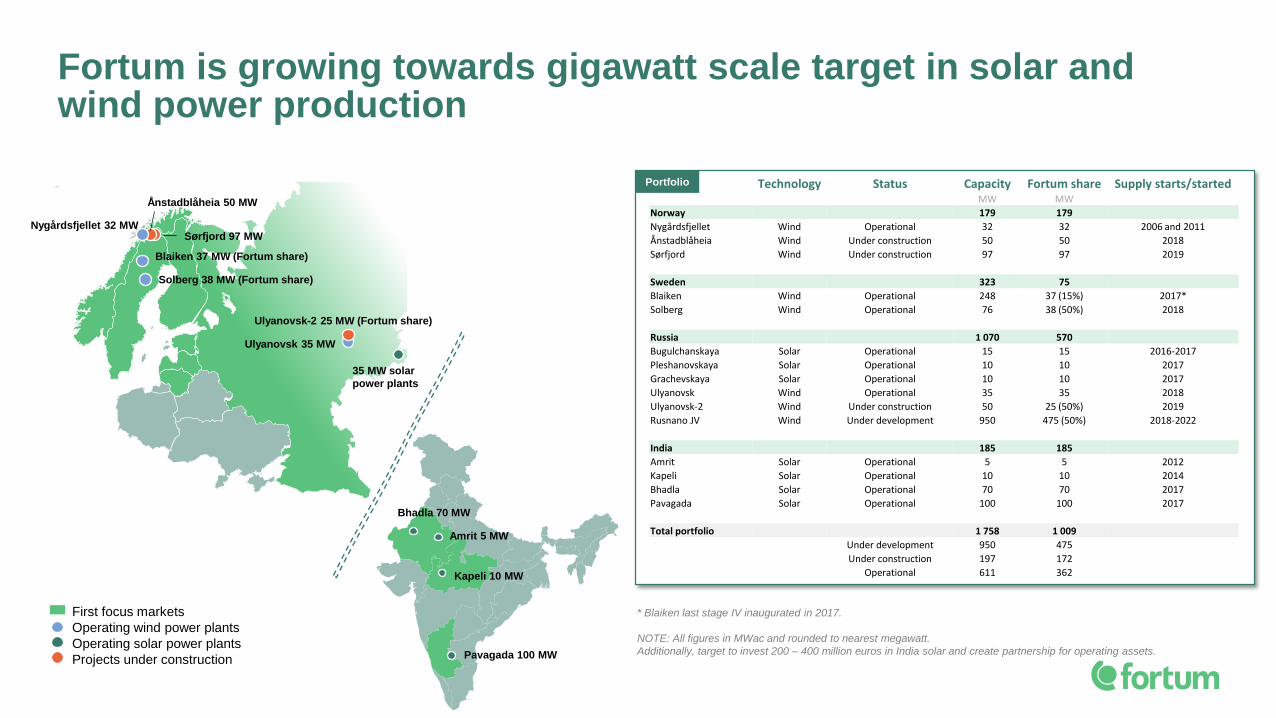
Fortum is growing towards gigawatt scale target in solar and wind power production
First focus markets
Operating wind power plants
Operating solar power plants
Projects under construction
Amrit 5 MW
Kapeli 10 MW
Bhadla 70 MW
Pavagada 100 MW
Ulyanovsk 35 MW
Nygårdsfjellet 32 MW
Solberg 38 MW (Fortum share)
Blaiken 37 MW (Fortum share)
Sørfjord 97 MW
Ånstadblåheia 50 MW
35 MW solar
power plants
Ulyanovsk-2 25 MW (Fortum share)
Technology Status Capacity Fortum share Supply starts/startedMW MW
Norway 179 179
Nygårdsfjellet Wind Operational 32 32 2006 and 2011
Ånstadblåheia Wind Under construction 50 50 2018
Sørfjord Wind Under construction 97 97 2019
Sweden 323 75
Blaiken Wind Operational 248 37 (15%) 2017*
Solberg Wind Operational 76 38 (50%) 2018
Russia 1 070 570
Bugulchanskaya Solar Operational 15 15 2016-2017
Pleshanovskaya Solar Operational 10 10 2017
Grachevskaya Solar Operational 10 10 2017
Ulyanovsk Wind Operational 35 35 2018
Ulyanovsk-2 Wind Under construction 50 25 (50%) 2019
Rusnano JV Wind Under development 950 475 (50%) 2018-2022
India 185 185
Amrit Solar Operational 5 5 2012
Kapeli Solar Operational 10 10 2014
Bhadla Solar Operational 70 70 2017
Pavagada Solar Operational 100 100 2017
Total portfolio 1 758 1 009
Under development 950 475
Under construction 197 172
Operational 611 362
Portfolio
* Blaiken last stage IV inaugurated in 2017.
NOTE: All figures in MWac and rounded to nearest megawatt.
Additionally, target to invest 200 – 400 million euros in India solar and create partnership for operating assets.

• Market coupling between NL, BE and FR since 2006
• Germany – Nord Pool coupling started 11/2009
• Market coupling for Central Western Europe (DE, FR, NL, BE) since 11/2010 with a
continued coupling with Nord Pool. NorNed (NO-NL) and BritNed (UK-NL) included in
2011
• Nord Pool price area for Estonia in 2010, Lithuania in 2012 and Latvia in 2013. Poland
coupled with Nord Pool since 2010
• Czech, Slovakia and Hungary coupled together since 2012. Romania joined in 2014
• A common day-ahead market coupling for the whole north-western Europe (incl. Spain
& Portugal) was started in 2014. Italy and Slovenia joined in 2015
• Flow-based cross-border capacity allocation for further trade optimisation taken into use
in May 2015 for the CWE region. Nordic flow-based implementation planned for 2020
• CEE (Central Eastern Europe) market coupling region due to join latest in 2019 with
flow-based capacity allocation. Switzerland waiting for agreement with the EU
• In addition to day-ahead coupling, European-wide intraday market coupling is due to
start with Nordic, Baltic and Continental Western European markets in June 2018
• Balancing market integration under development as well, based on both regional
projects and the EU Guideline on Electricity Balancing, in force since 18 December 2017
Market coupling milestones- Cross-border power flows optimised by power exchanges
2009
2015
2012-2014
2010-
2013
2018-2019
2014
19

Current transmission capacity from Nordic area is over 6,000 MW
20
• Theoretical maximum in transmission capacity ~40 TWh
per annum, but restrictions especially between DK & DE
• Net export from the Nordic area to Continental Europe
and Baltics during year 2017 was 9 TWh
• Net export was 18 TWh in 2015 and 10 TWh in 2016
• Approximately 25 TWh of net export is now reachable
Countries Transmission capacity MW
From Nordics To Nordics
Denmark - Germany 2,225 2,100
Sweden - Germany 615 615
Sweden - Poland 600 600
Sweden - Lithuania 700 700
Norway - Netherlands 723 723
Finland - Estonia 1,016 1,016
Finland - Russia 320 1,300
Total 6,199 7,054
723
2,225 615 600
1,016
320
700

Nordic, Baltic, Continental and UK markets are integrating– Interconnection capacity will double by 2023
21
Two 1,400 MW NO-UK links as EU Projects
of Common Interest: NSL to England due to
be ready in 2021, NorthConnect to Scotland
still requiring Norwegian permission
1,400 MW NordLink as first direct NO-DE link
is being built by end-2019
700 MW COBRAcable from DK to NL due to
be ready in March 2019
Jutland – DE capacity planned to grow by
860 MW in 2020, with further 1,000 MW
increase in 2022
New 400 MW Zealand – DE connection via
Kriegers Flak offshore wind area by end-2018
The Northern Seas Offshore Grid and the Baltic
Energy Market Integration Plan are included as
priority electricity corridors in EU’s Infrastructure
Guidelines, approved in April 2013
New interconnections will
double the export capacity
to over 12,000 MW by 2023
New internal Nordic grid investments
provide for increased available capacity
for export to the Continent and Baltics
EU’s Connecting Europe Facility
co-financing 3rd EE-LV transmission
line, due to be ready in 2020
1,400 MW DK-UK Viking Link planned to be
built by end-2022, with final investment
decision due in spring 2018
New interconnectors
New Nordic lines
Existing interconnectors
Svenska Kraftnät and 50Hertz signed
1/2017 a cooperation agreement on building
the 700 MW Hansa PowerBridge DC link
between Sweden and Germany by 2025/26

Nordic year forwards
22 Source: Nasdaq Commodities, Bloomberg
Year 20 Year 19 Year 10 Year 11 Year 12 Year 13 Year 14 Year 15 Year 16 Year 17 Year 18
0
10
20
30
40
50
60
70
€/MWh
Year15 Year17 Year19Year10 Year11 Year12 Year13 Year14 Year16 Year18 Year20
1 March 2018
2014
Q1
2008
Q2 Q3 Q4 Q1
2009
Q2 Q3 Q4 Q1
2010
Q2 Q3 Q4 Q1
2011
Q2 Q3 Q4 Q1
2012
Q2 Q3 Q4 Q1
2013
Q2 Q3 Q4 Q1 Q2 Q3 Q4
2015
Q1 Q2 Q3 Q4
2016
Q1 Q2 Q3 Q4 Q1
2017
Q2 Q3 Q4 Q1
2018
Dec
2017
Jan
2018
Year20
Year19
Feb
2018

Wholesale power prices
23 Source: Nord Pool, Nasdaq Commodities, Bloomberg Finance LP, ATS, NP “Market Council”, Fortum
0
10
20
30
40
50
60
70
80
90
100
German
Nordic
Russian*
Spot prices Forward pricesEUR/MWh
10
20
30
40
50
60
70
80
90
100
01 March 2018
* Including weighted average capacity price
2009 2010 2011 2012 2013 2014 2015 2016 2017 2018 2019

Power Generation in the Baltic Rim in 2016 (2015)
24
Others
Hydro
Nuclear
Solar
Conventional thermal
Wind
Source: Eurostat figures
Graph sizes are illustrative.
Germany
612 TWh
(610)
Lithuania
4 (5) TWh
Estonia
10 (9) TWh
Latvia
6 (5) TWh
Denmark
29 TWh
(28)
Poland
151 TWh
(151)
Norway
145 TWh
(144)
Sweden
152 TWh
(159)
Finland
66 TWh
(66)
*) Normal annual Nordic hydro generation
200 TWh, variation +/- 40 TWh.
Net export Net import
4 TWh 7 TWh
TWh %
Hydro
Nuclear
Conv. thermal
Wind
Solar
Others
Total generation
* 217
83
58
33
0.8
0
392
55
21
15
9
0.2
0
Nordics
2016 TWh %
4
-
15
2
0.1
0.3
21
18
-
72
9
0.2
1
Baltics
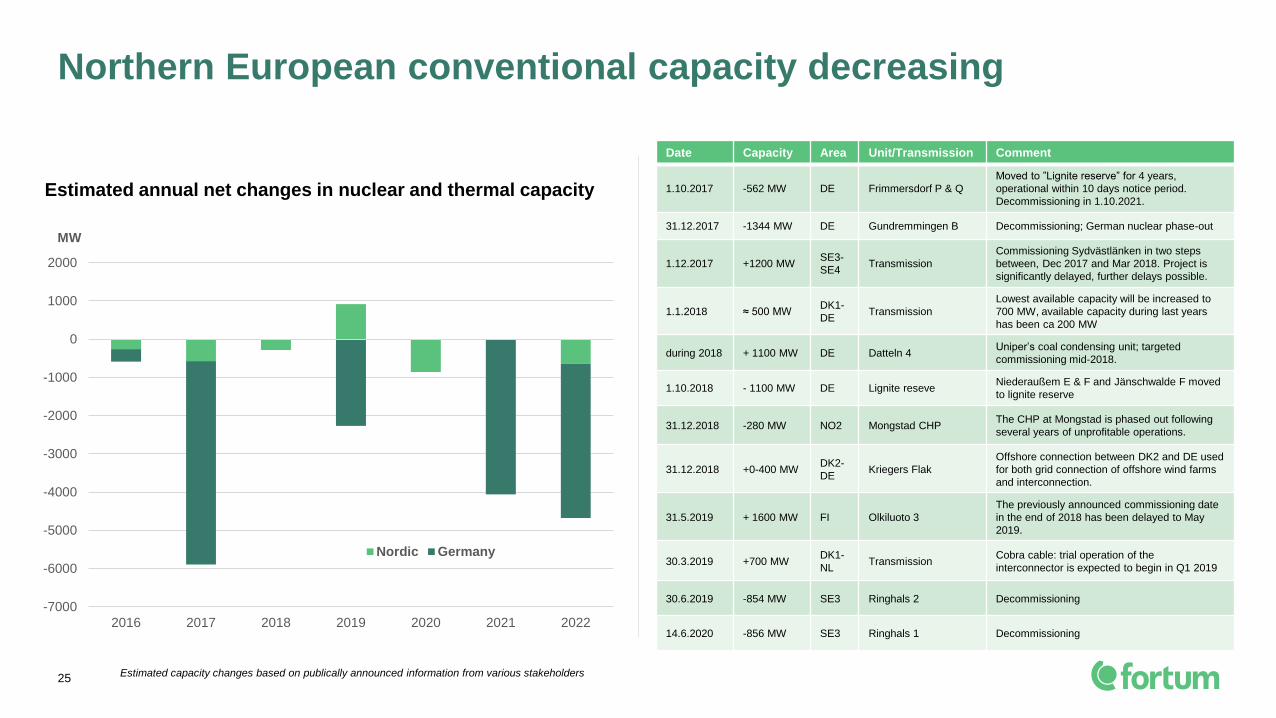
-7000
-6000
-5000
-4000
-3000
-2000
-1000
0
1000
2000
2016 2017 2018 2019 2020 2021 2022
MW
Nordic Germany
Date Capacity Area Unit/Transmission Comment
1.10.2017 -562 MW DE Frimmersdorf P & Q
Moved to ”Lignite reserve” for 4 years,
operational within 10 days notice period.
Decommissioning in 1.10.2021.
31.12.2017 -1344 MW DE Gundremmingen B Decommissioning; German nuclear phase-out
1.12.2017 +1200 MWSE3-
SE4Transmission
Commissioning Sydvästlänken in two steps
between, Dec 2017 and Mar 2018. Project is
significantly delayed, further delays possible.
1.1.2018 ≈ 500 MWDK1-
DETransmission
Lowest available capacity will be increased to
700 MW, available capacity during last years
has been ca 200 MW
during 2018 + 1100 MW DE Datteln 4Uniper’s coal condensing unit; targeted
commissioning mid-2018.
1.10.2018 - 1100 MW DE Lignite reseveNiederaußem E & F and Jänschwalde F moved
to lignite reserve
31.12.2018 -280 MW NO2 Mongstad CHPThe CHP at Mongstad is phased out following
several years of unprofitable operations.
31.12.2018 +0-400 MWDK2-
DEKriegers Flak
Offshore connection between DK2 and DE used
for both grid connection of offshore wind farms
and interconnection.
31.5.2019 + 1600 MW FI Olkiluoto 3
The previously announced commissioning date
in the end of 2018 has been delayed to May
2019.
30.3.2019 +700 MWDK1-
NLTransmission
Cobra cable: trial operation of the
interconnector is expected to begin in Q1 2019
30.6.2019 -854 MW SE3 Ringhals 2 Decommissioning
14.6.2020 -856 MW SE3 Ringhals 1 Decommissioning
25
Northern European conventional capacity decreasing
Estimated annual net changes in nuclear and thermal capacity
Estimated capacity changes based on publically announced information from various stakeholders

Wholesale electricity price too low to attract investments
26
NOTE: The presented figures are calculated based on data from recent public reports and do not represent Fortum’s view. Average achieved price (€/MWh) for the production
type depends on availability and flexibility. There are large variations in the cost of hydro, wind and solar depending on location and conditions.
0
10
20
30
40
50
60
70
80
90
100
110
Source: Nord Pool, Nasdaq Commodities
EUR/MWh
Futures
1 March 2018
1995 2018 20280
10
20
30
40
50
60
70
80
90
100
110
Gas Onshorewind
Coalcondensing
Solar PV inSpain
Nuclear Large hydro Offshorewind
Commodity prices are forward prices as of January 2018, extended with inflation
EUR/MWh
Average levelised costs of new electricity generation
Coalcondensing
Onshorewind
Gascondensing
Nuclear Largehydro
Solar PVIn Spain
Offshorewind

Overview of Fortum’s nuclear fleet
27
LOVIISA OLKILUOTO OSKARSHAMN FORSMARK
Commercial operation started
Unit 1: 1977
Unit 2: 1981
Unit 1: 1978
Unit 2: 1980
Unit 3: (Under construction)
Unit 1: 1972 (out of oper.)
Unit 2: 1974 (out of oper.)
Unit 3: 1985
Unit 1: 1980
Unit 2: 1981
Unit 3: 1985
Generation Capacity
Fortum’s share
Unit 1: 507 MW
Unit 2: 502 MW
Total: 1009 MW
Unit 1: 880 MW
Unit 2: 890 MW
(Unit 3: 1,600 MW)
Total: 1,770 MW (3,370)
27% 470 MW
Unit 1: 473 MW
Unit 2: 638 MW
Unit 3: 1,400 MW
Total: 1,400 MW
43% 602 MW
Unit 1: 984 MW
Unit 2: 1,120 MW
Unit 3: 1,167 MW
Total: 3,271 MW
22% 727 MW
Yearly production
Fortum’s share of
production
8 TWh
8 TWh
13 TWh
4 TWh
9 TWh
4 TWh
24 TWh
5 TWh
Share of Fortum’s
Nordic production19% 9% 11% 13%
Majority owner
Fortum’s share
Fortum Pohjolan Voima
26.6%
Uniper
43.4%
Vattenfall
22.2%
Operated by FortumTeollisuuden Voima(TVO)
OKG Aktiebolag Forsmarks Kraftgrupp
ResponsibilitiesLoviisa: Fortum is the owner, licensee and operator with all the responsibilities specified in the Nuclear Energy Act, Nuclear Liability Act, and other relevant nuclear legislation
Other units: Fortum is solely an owner with none of the responsibilities assigned to the licensee in the nuclear legislation. Other responsibilities are specified in the
Companies Act and the Articles of Association and are mostly financial.
*O1 was shut down for decommissioning earlier as originally announced, starting 17.6.2017.
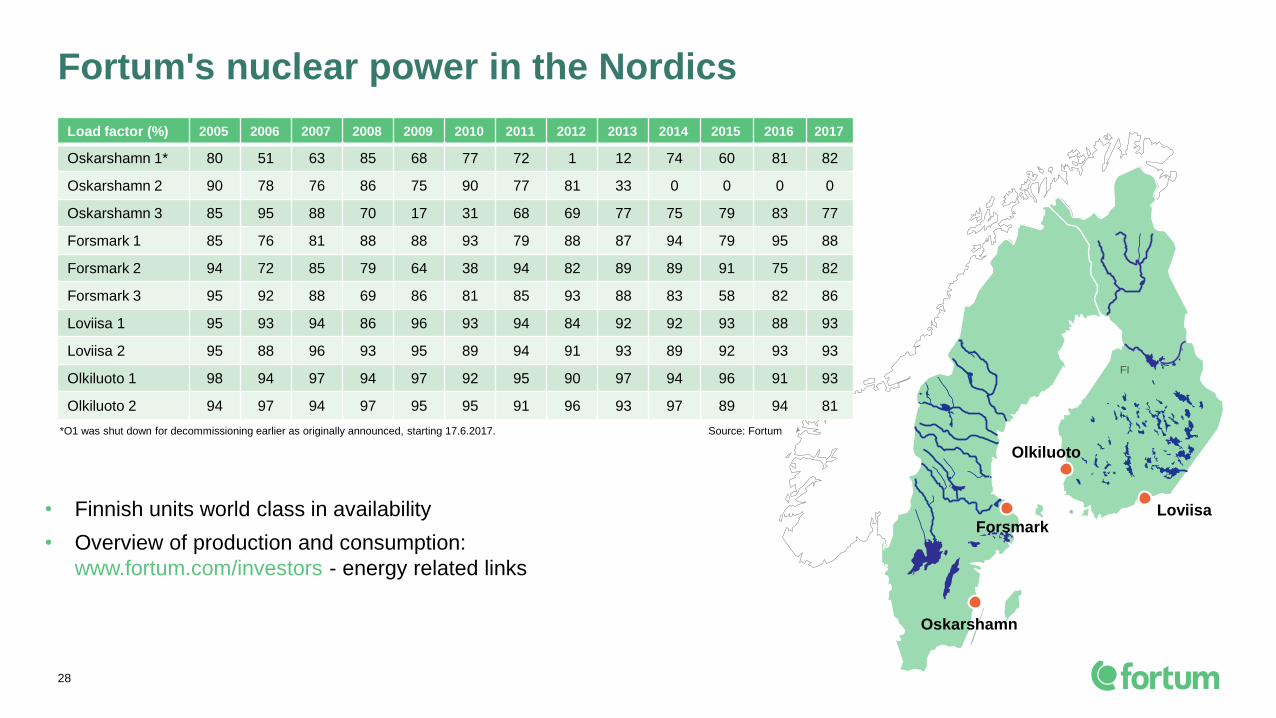
Fortum's nuclear power in the Nordics
28
• Finnish units world class in availability
• Overview of production and consumption:
www.fortum.com/investors - energy related links
Source: Fortum
FI
Olkiluoto
Loviisa
Oskarshamn
Forsmark
Load factor (%) 2005 2006 2007 2008 2009 2010 2011 2012 2013 2014 2015 2016 2017
Oskarshamn 1* 80 51 63 85 68 77 72 1 12 74 60 81 82
Oskarshamn 2 90 78 76 86 75 90 77 81 33 0 0 0 0
Oskarshamn 3 85 95 88 70 17 31 68 69 77 75 79 83 77
Forsmark 1 85 76 81 88 88 93 79 88 87 94 79 95 88
Forsmark 2 94 72 85 79 64 38 94 82 89 89 91 75 82
Forsmark 3 95 92 88 69 86 81 85 93 88 83 58 82 86
Loviisa 1 95 93 94 86 96 93 94 84 92 92 93 88 93
Loviisa 2 95 88 96 93 95 89 94 91 93 89 92 93 93
Olkiluoto 1 98 94 97 94 97 92 95 90 97 94 96 91 93
Olkiluoto 2 94 97 94 97 95 95 91 96 93 97 89 94 81
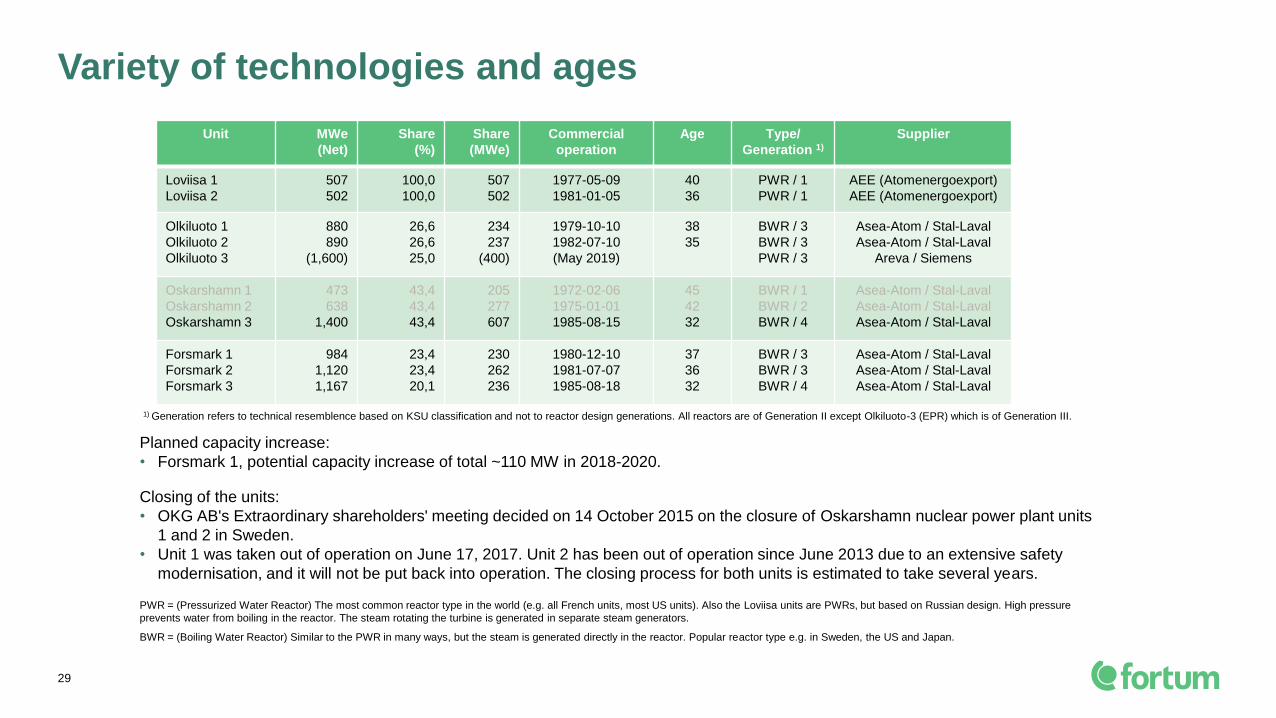
Variety of technologies and ages
29
Planned capacity increase:
• Forsmark 1, potential capacity increase of total ~110 MW in 2018-2020.
Closing of the units:
• OKG AB's Extraordinary shareholders' meeting decided on 14 October 2015 on the closure of Oskarshamn nuclear power plant units
1 and 2 in Sweden.
• Unit 1 was taken out of operation on June 17, 2017. Unit 2 has been out of operation since June 2013 due to an extensive safety
modernisation, and it will not be put back into operation. The closing process for both units is estimated to take several years.
PWR = (Pressurized Water Reactor) The most common reactor type in the world (e.g. all French units, most US units). Also the Loviisa units are PWRs, but based on Russian design. High pressure
prevents water from boiling in the reactor. The steam rotating the turbine is generated in separate steam generators.
BWR = (Boiling Water Reactor) Similar to the PWR in many ways, but the steam is generated directly in the reactor. Popular reactor type e.g. in Sweden, the US and Japan.
1) Generation refers to technical resemblence based on KSU classification and not to reactor design generations. All reactors are of Generation II except Olkiluoto-3 (EPR) which is of Generation III.
Unit MWe
(Net)
Share
(%)
Share
(MWe)
Commercial
operation
Age Type/
Generation 1)
Supplier
Loviisa 1
Loviisa 2
507
502
100,0
100,0
507
502
1977-05-09
1981-01-05
40
36
PWR / 1
PWR / 1
AEE (Atomenergoexport)
AEE (Atomenergoexport)
Olkiluoto 1
Olkiluoto 2
Olkiluoto 3
880
890
(1,600)
26,6
26,6
25,0
234
237
(400)
1979-10-10
1982-07-10
(May 2019)
38
35
BWR / 3
BWR / 3
PWR / 3
Asea-Atom / Stal-Laval
Asea-Atom / Stal-Laval
Areva / Siemens
Oskarshamn 1
Oskarshamn 2
Oskarshamn 3
473
638
1,400
43,4
43,4
43,4
205
277
607
1972-02-06
1975-01-01
1985-08-15
45
42
32
BWR / 1
BWR / 2
BWR / 4
Asea-Atom / Stal-Laval
Asea-Atom / Stal-Laval
Asea-Atom / Stal-Laval
Forsmark 1
Forsmark 2
Forsmark 3
984
1,120
1,167
23,4
23,4
20,1
230
262
236
1980-12-10
1981-07-07
1985-08-18
37
36
32
BWR / 3
BWR / 3
BWR / 4
Asea-Atom / Stal-Laval
Asea-Atom / Stal-Laval
Asea-Atom / Stal-Laval

Third party nuclear liability in case of severe accident
30
In force since 1 January 2012
Law approved by Parliament
in 2010, requires separate
decision from Government to
come into force.
Sweden
(new, not
in force)
Finland,
temporary
legislation
Current,
Sweden
700 M€
200 M€360 M€
500 M€Responsibility of company
(insurance or guarantee)
Unlimited
company
responsibility
Convention
parties 300 M€
State
responsibility
300 M€
500 M€
700 M€
New Paris
convention
700 M€
145 M€
145 M€
Old,
Finland
240 M€
145 M€Requires ratification by 2/3
of member states to come
into force. In Finland
approved by Parliament in
2005
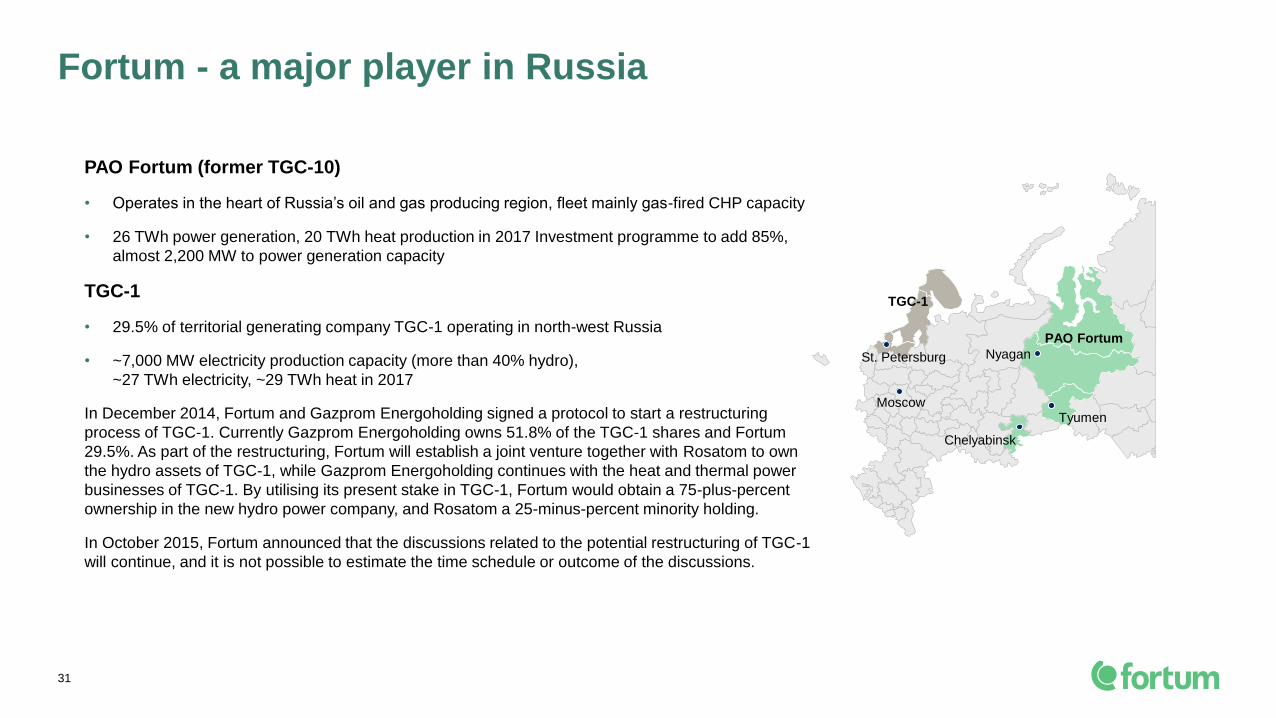
PAO Fortum (former TGC-10)
• Operates in the heart of Russia’s oil and gas producing region, fleet mainly gas-fired CHP capacity
• 26 TWh power generation, 20 TWh heat production in 2017 Investment programme to add 85%,
almost 2,200 MW to power generation capacity
TGC-1
• 29.5% of territorial generating company TGC-1 operating in north-west Russia
• ~7,000 MW electricity production capacity (more than 40% hydro),
~27 TWh electricity, ~29 TWh heat in 2017
In December 2014, Fortum and Gazprom Energoholding signed a protocol to start a restructuring
process of TGC-1. Currently Gazprom Energoholding owns 51.8% of the TGC-1 shares and Fortum
29.5%. As part of the restructuring, Fortum will establish a joint venture together with Rosatom to own
the hydro assets of TGC-1, while Gazprom Energoholding continues with the heat and thermal power
businesses of TGC-1. By utilising its present stake in TGC-1, Fortum would obtain a 75-plus-percent
ownership in the new hydro power company, and Rosatom a 25-minus-percent minority holding.
In October 2015, Fortum announced that the discussions related to the potential restructuring of TGC-1
will continue, and it is not possible to estimate the time schedule or outcome of the discussions.
Fortum - a major player in Russia
PAO Fortum
Tyumen
Chelyabinsk
Nyagan
TGC-1
St. Petersburg
Moscow
31

Day ahead wholesale market prices in Russia
32
IV/17 IV/16 2017 2016
Electricity spot price (market price),
Urals hub, RUB/MWh1,038 1,063 1,041 1,055
Average regulated gas price, Urals
region, RUB 1000 m3 3,755 3,614 3,685 3,614
Average capacity price for CCS ”old
capacity”, tRUB/MW/month157 155 148 140
Average capacity price for CSA ”new
capacity”, tRUB/MW/month 983 924 899 815
Average capacity price,
tRUB/MW/month577 556 535 481
Achieved power price for Fortum in
Russia, RUB/MWh1,845 1,818 1,813 1,734
Achieved power price for Fortum in
Russia, EUR/MWh 27.0 26.2 27.5 23.5
Key electricity, capacity and gas prices in the PAO Fortum area
0
200
400
600
800
1 000
1 200
1 400
RU
B /
MW
h
0
5
10
15
20
25
30
35
40
€/
MW
h
In addition to the power price generators receive a capacity payment. Source: ATS
Day ahead power market prices for Urals
2009 2010 2011 2012 2013 2014 2015 2016 2017 2018
2009 2010 2011 2012 2013 2014 2015 2016 2017 2018
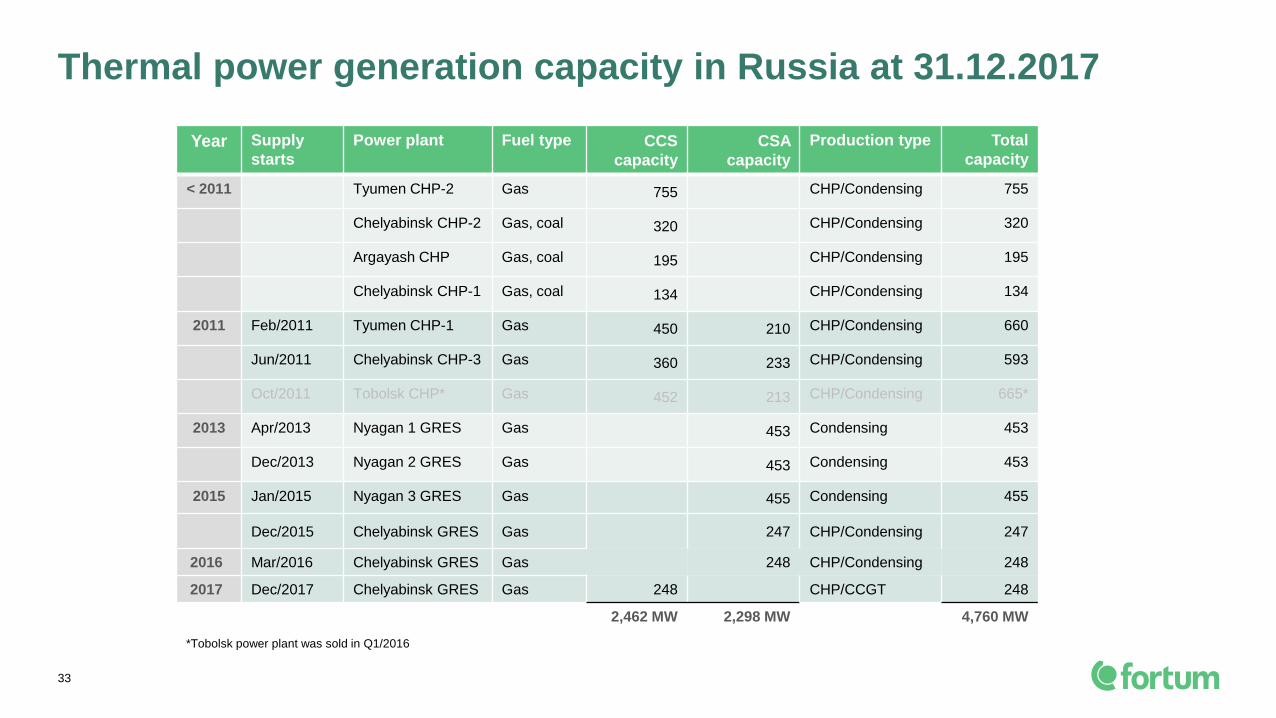
Thermal power generation capacity in Russia at 31.12.2017
Year Supply
starts
Power plant Fuel type CCS
capacity
CSA
capacity
Production type Total
capacity
< 2011 Tyumen CHP-2 Gas 755 CHP/Condensing 755
Chelyabinsk CHP-2 Gas, coal 320 CHP/Condensing 320
Argayash CHP Gas, coal 195 CHP/Condensing 195
Chelyabinsk CHP-1 Gas, coal 134 CHP/Condensing 134
2011 Feb/2011 Tyumen CHP-1 Gas 450 210 CHP/Condensing 660
Jun/2011 Chelyabinsk CHP-3 Gas 360 233 CHP/Condensing 593
Oct/2011 Tobolsk CHP* Gas 452 213 CHP/Condensing 665*
2013 Apr/2013 Nyagan 1 GRES Gas 453 Condensing 453
Dec/2013 Nyagan 2 GRES Gas 453 Condensing 453
2015 Jan/2015 Nyagan 3 GRES Gas 455 Condensing 455
Dec/2015 Chelyabinsk GRES Gas 247 CHP/Condensing 247
2016 Mar/2016 Chelyabinsk GRES Gas 248 CHP/Condensing 248
2017 Dec/2017 Chelyabinsk GRES Gas 248 CHP/CCGT 248
2,462 MW 2,298 MW 4,760 MW
33
*Tobolsk power plant was sold in Q1/2016

Hedging improves stability and predictability
34 2009 onwards thermal and import from Russia excluded

Chelyabinsk
GRES unit 3 started commercial
operation
International
growth for Nordic
market leader
Charge
& Drive
180 MW windpower in Norway,
35 MW in Russia
and a 1,000 MW
wind JV in Russia
170 MW solar power in India,
35 MW in Russia
Agreement
with E.ON Uniper public
takeover offer
Hafslund
restructuring
Delivering on our
growth strategy

36
Good performance in 2017
• Wholesale power prices showing signs of improvement,
yet still on low levels
• Comparable EBITDA +26% at EUR 1,275 million
• Comparable operating profit +26% at EUR 811 million
– Increase mainly related to Generation and Russia segments
• EPS at EUR 0.98 (0.56)
– Items affecting comparability EUR 0.38 (-0.02)
– Swedish tax case EUR -0.14 (0.00)
• Hafslund transaction completed
• Uniper offer – E.ON tendered their 46.65% stake in January
2018
• EUR 100 million fixed cost savings achieved
• The Board of Directors proposes that the dividend is
unchanged at EUR 1.10 per share
• Fortum on tehnyt E.ONin kanssa sopimuksen E.ONin 46,65 %:n
omistusosuudesta Uniperissa
• Fortum aikoo tehdä vapaaehtoisen julkisen ostotarjouksen Uniperin
osakkeista
• Fortumin aikomuksena on olla pitkäaikainen strateginen, rakentava
kumppani Uniperille
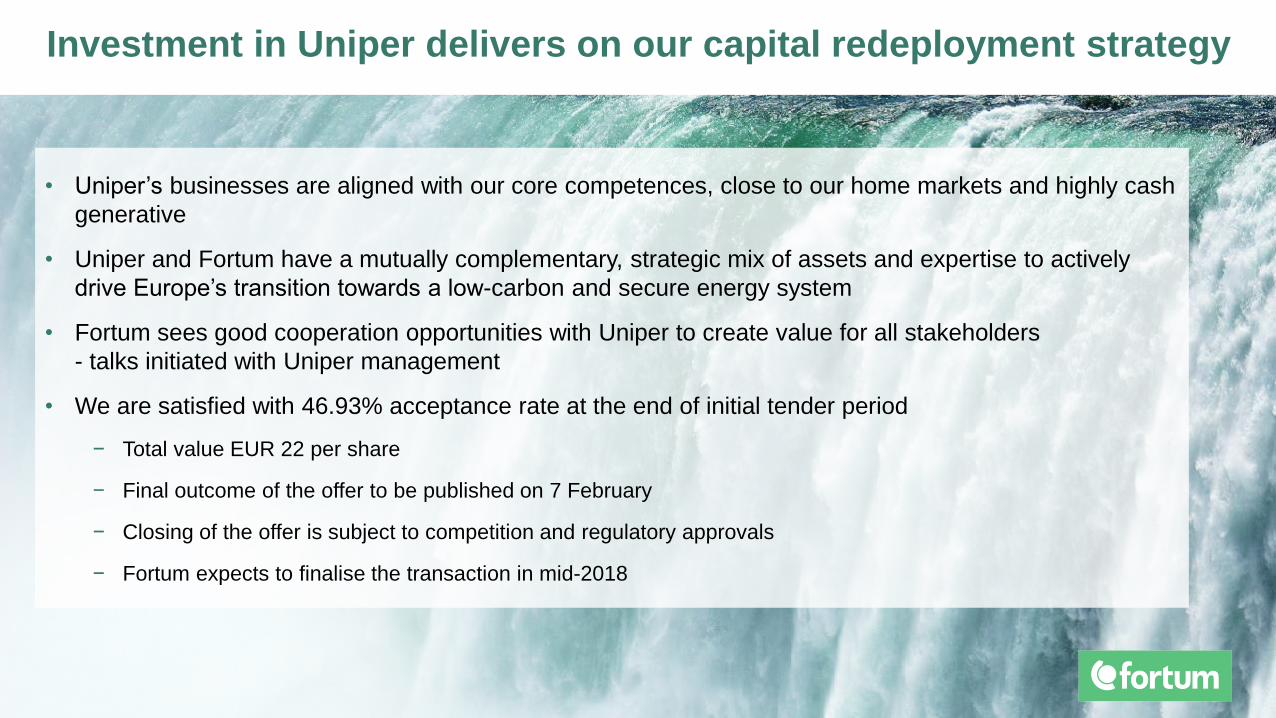
• Uniper’s businesses are aligned with our core competences, close to our home markets and highly cash
generative
• Uniper and Fortum have a mutually complementary, strategic mix of assets and expertise to actively
drive Europe’s transition towards a low-carbon and secure energy system
• Fortum sees good cooperation opportunities with Uniper to create value for all stakeholders
- talks initiated with Uniper management
• We are satisfied with 46.93% acceptance rate at the end of initial tender period
− Total value EUR 22 per share
− Final outcome of the offer to be published on 7 February
− Closing of the offer is subject to competition and regulatory approvals
− Fortum expects to finalise the transaction in mid-2018
Investment in Uniper delivers on our capital redeployment strategy

38
Stable market conditions with improving prices in 2017
Nordic countries
• Electricity consumption at 392 (390) TWh Y/Y
– The Nordic precipitation in Q4 and FY 2017 clearly above normal level
• System spot price increased to 29.4 (26.9) EUR/MWh
– Finnish area price was 33.2 (32.4) EUR/MWh and Swedish (SE3) area
price 31.2 (29.2) EUR/MWh
• Market price for CO2 emission allowances (EUA)
– Increase from EUR 6.5/t at the beginning of 2017 to EUR 8.2/t at the end
of 2017
Russia
• Electricity consumption slightly higher at 1,035 (1,027) TWh
– First price zone (Fortum’s operating area price) at 799 (787) TWh
– Average electricity spot price flat in Urals hub
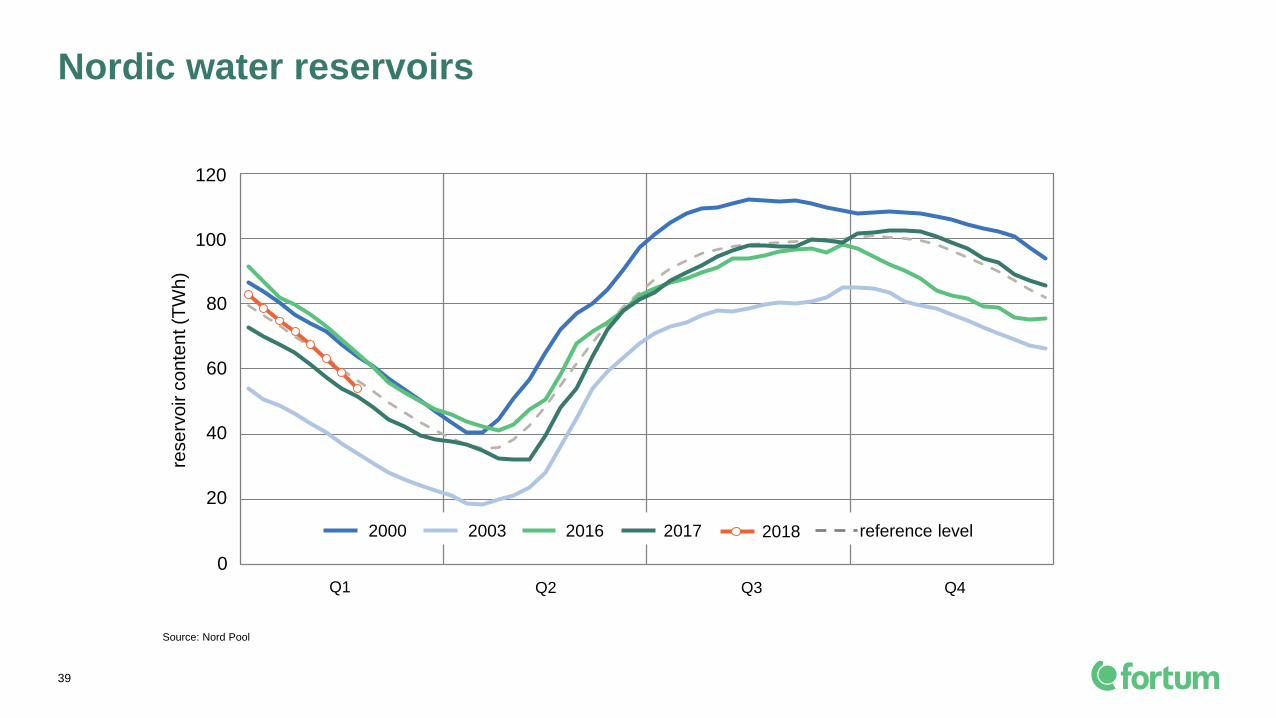
Nordic water reservoirs
Q1 Q2 Q3 Q4
20
40
60
80
100
120re
se
rvo
ir c
on
ten
t (T
Wh
)
0
2000 2003 20172016 reference level2018
39
Source: Nord Pool

0
30
60
90
120
150
US
D /
bb
l
Crude oil price (ICE Brent)
2008 2009 20122010 2011 20142013 2015 2016 2017 2018 2019
0
50
100
150
200
250
US
D /
t
Coal price (ICE Rotterdam)
2008 2009 20122010 2011 20142013 2015 2016 2017 2018 20190
20
40
60
80
100
GB
p /
th
erm
Gas price (ICE NBP)
2008 2009 20122010 2011 20142013 2015 2016 2017 2018 2019
0
7
14
21
28
35
EU
R /
tC
O2
CO2 price (ICE EUA)
2008 2009 20122010 2011 20142013 2015 2016 2017 2018 2019
40
Fuel and CO2 allowance prices
Source: ICE, Thomson Reuters
Market prices 1 March 2018; 2018-2019 future quotations

0
10
20
30
40
50
60
70
80
90
100
110
EUR/MWh Nord Pool System Price Futures
1 March 2018
1995 1997 1999 2001 2003 2005 2007 2009 2011 2013 2015 2017 2019 2021 2023 2025 2027
Wholesale power price
41 Source: Nord Pool, Nasdaq Commodities
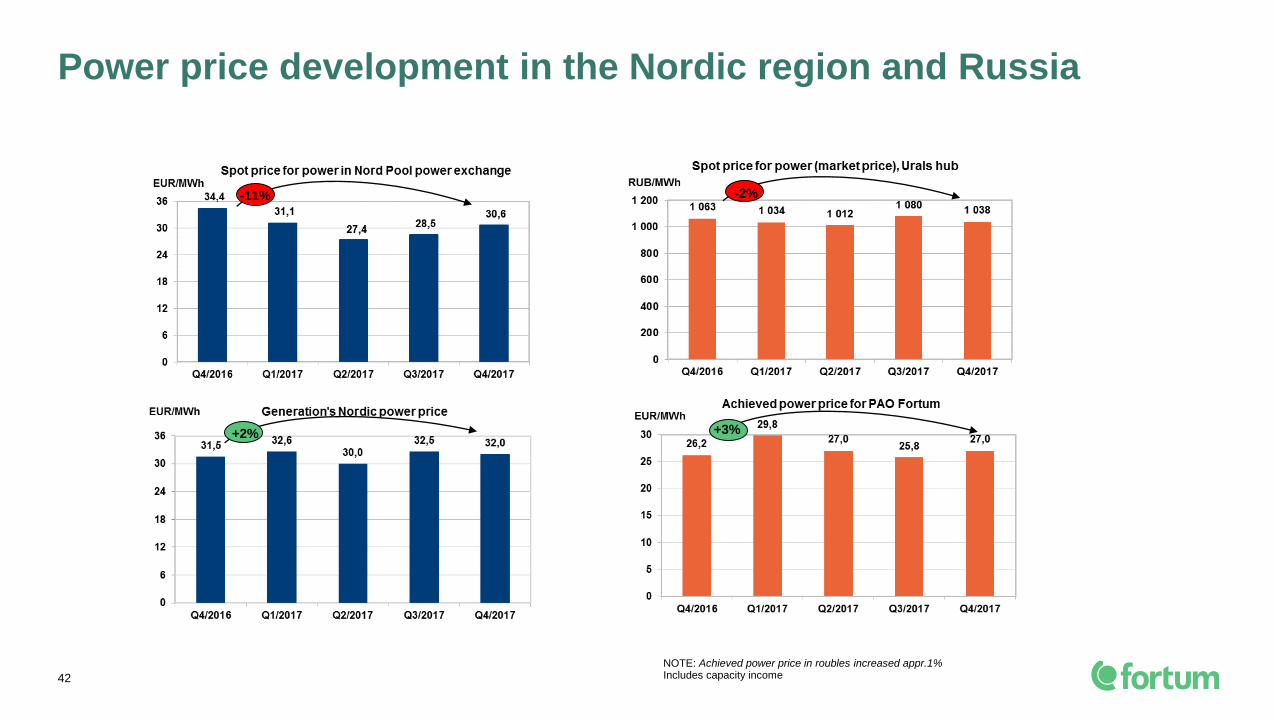
Power price development in the Nordic region and Russia
42
-11%
Includes capacity income
+3%
NOTE: Achieved power price in roubles increased appr.1%
-2%
+2%
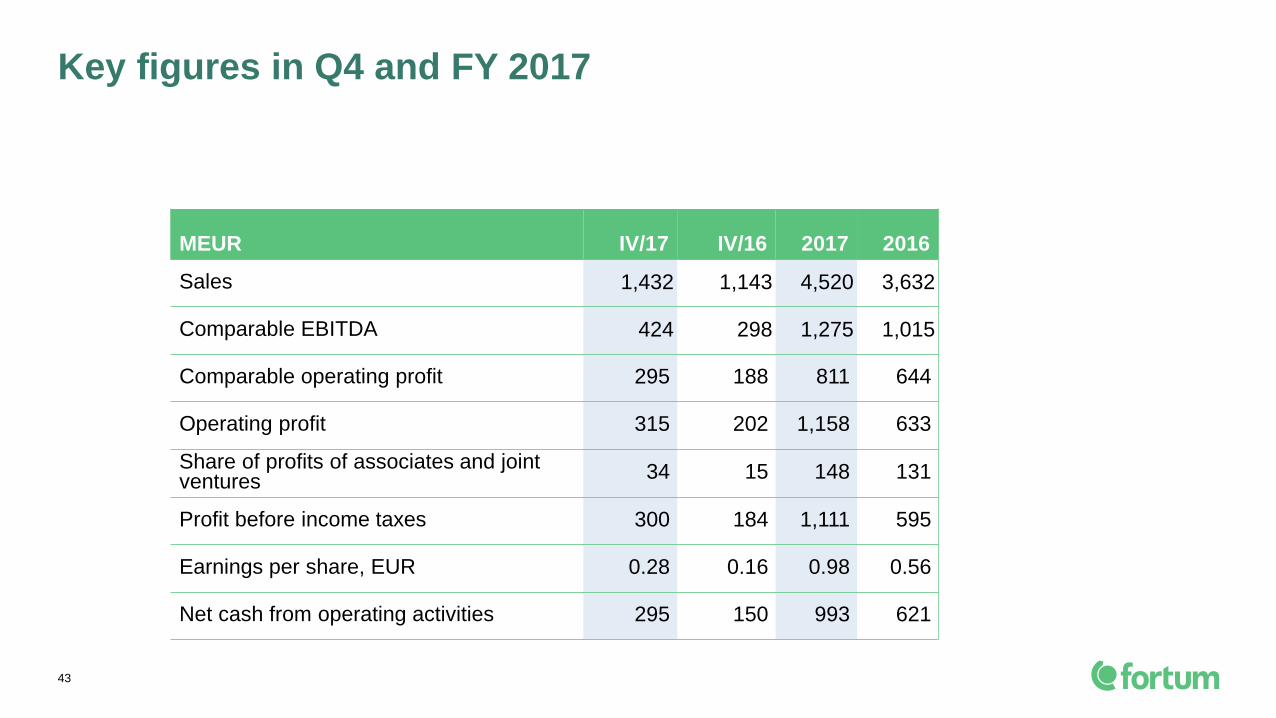
Key figures in Q4 and FY 2017
43
MEUR IV/17 IV/16 2017 2016
Sales 1,432 1,143 4,520 3,632
Comparable EBITDA 424 298 1,275 1,015
Comparable operating profit 295 188 811 644
Operating profit 315 202 1,158 633
Share of profits of associates and joint ventures 34 15 148 131
Profit before income taxes 300 184 1,111 595
Earnings per share, EUR 0.28 0.16 0.98 0.56
Net cash from operating activities 295 150 993 621
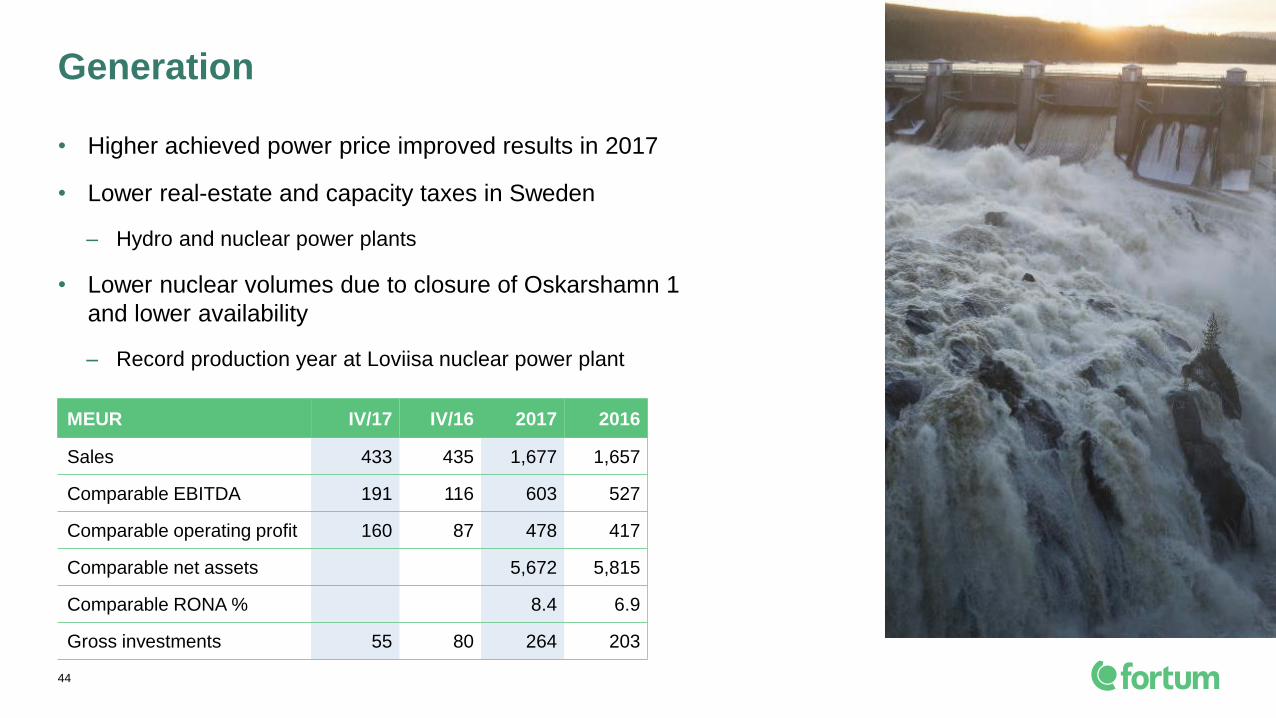
• Higher achieved power price improved results in 2017
• Lower real-estate and capacity taxes in Sweden
– Hydro and nuclear power plants
• Lower nuclear volumes due to closure of Oskarshamn 1
and lower availability
– Record production year at Loviisa nuclear power plant
Generation
44
MEUR IV/17 IV/16 2017 2016
Sales 433 435 1,677 1,657
Comparable EBITDA 191 116 603 527
Comparable operating profit 160 87 478 417
Comparable net assets 5,672 5,815
Comparable RONA % 8.4 6.9
Gross investments 55 80 264 203
City Solutions
45
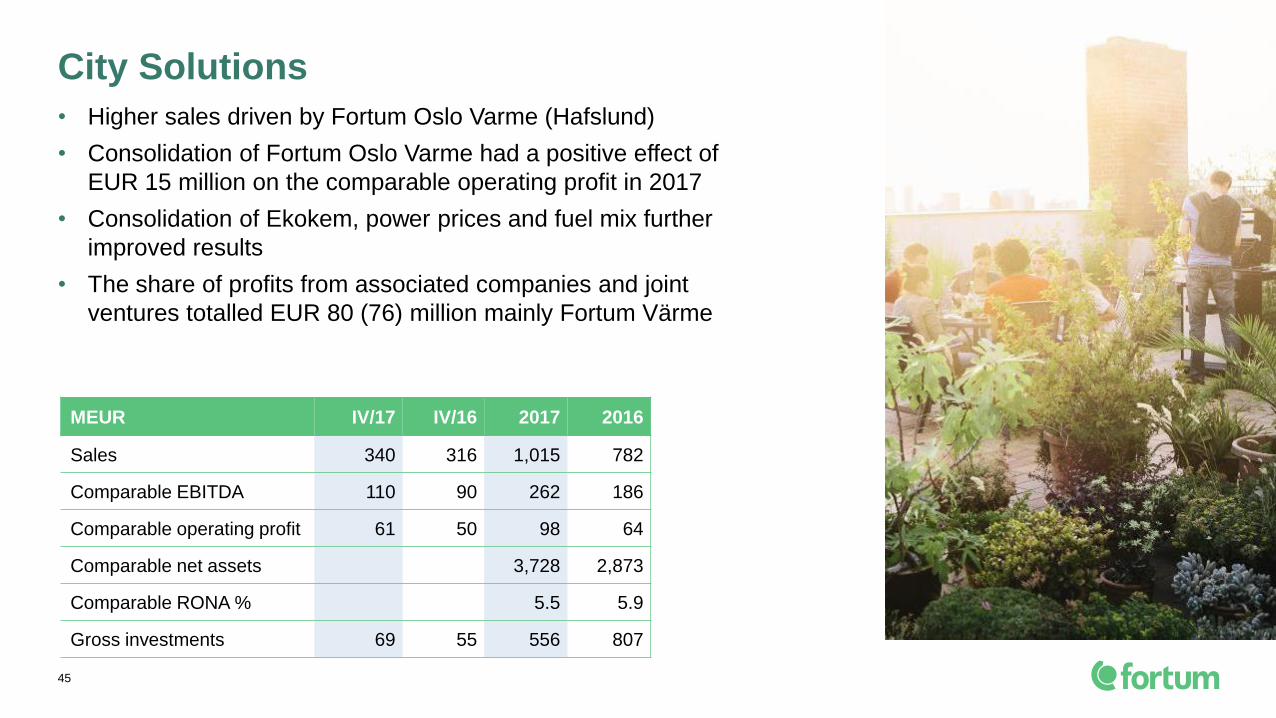
MEUR IV/17 IV/16 2017 2016
Sales 340 316 1,015 782
Comparable EBITDA 110 90 262 186
Comparable operating profit 61 50 98 64
Comparable net assets 3,728 2,873
Comparable RONA % 5.5 5.9
Gross investments 69 55 556 807
• Higher sales driven by Fortum Oslo Varme (Hafslund)
• Consolidation of Fortum Oslo Varme had a positive effect of
EUR 15 million on the comparable operating profit in 2017
• Consolidation of Ekokem, power prices and fuel mix further
improved results
• The share of profits from associated companies and joint
ventures totalled EUR 80 (76) million mainly Fortum Värme

Consumer Solutions
46
MEUR IV/17 IV/16 2017 2016
Sales 453 221 1,097 668
Comparable EBITDA 25 15 57 55
Comparable operating profit 18 13 41 48
Comparable net assets 638 154
Customer base, million 2.49 1.36
Gross investments 3 2 493 120
• Higher sales driven by the Hafslund transaction
– Total customer base at the end of the period was 2.49 (1.36) million
• Comparable operating profit EUR 13 million positively impacted
by Hafslund transaction in 2017
– Offset by lower average margin in electricity and gas products,
higher costs due to development of new digital services and
renegotiated invoicing service agreements for external distribution
companies

• Comparable operating profit in 2017 increased due to
– Commissioning of the new units, higher received CSA
payments, higher power volumes, and improved bad-debt
collections
– Positive effect of EUR 31 million from strengthened Russian
ruble
• New capacity from Chelyabinsk GRES (248 MW),
Ulyanovsk wind (35 MW) and solar (35 MW)
Russia
47
MEUR IV/17 IV/16 2017 2016
Sales 314 289 1,101 896
Comparable EBITDA 121 100 438 312
Comparable operating profit 84 66 296 191
Comparable net assets 3,161 3,284
Comparable RONA % 10.1 8.0
Gross investments 167 67 277 201

Q4/2017: Higher hydro volumes – improved results in Russia
Comparable operating profit, EUR million
• 1.5 TWh higher hydro volumes
• 0.5 EUR/MWh higher achieved price
• Lower taxes
• Higher CSA income and bad-debt
collection
• Lower electricity margin
48
• Increased profit due to
consolidation of Fortum Oslo
Varme
• Increased profit due to
consolidation of Hafslund
• Lower margins and increased
costs of new digital services
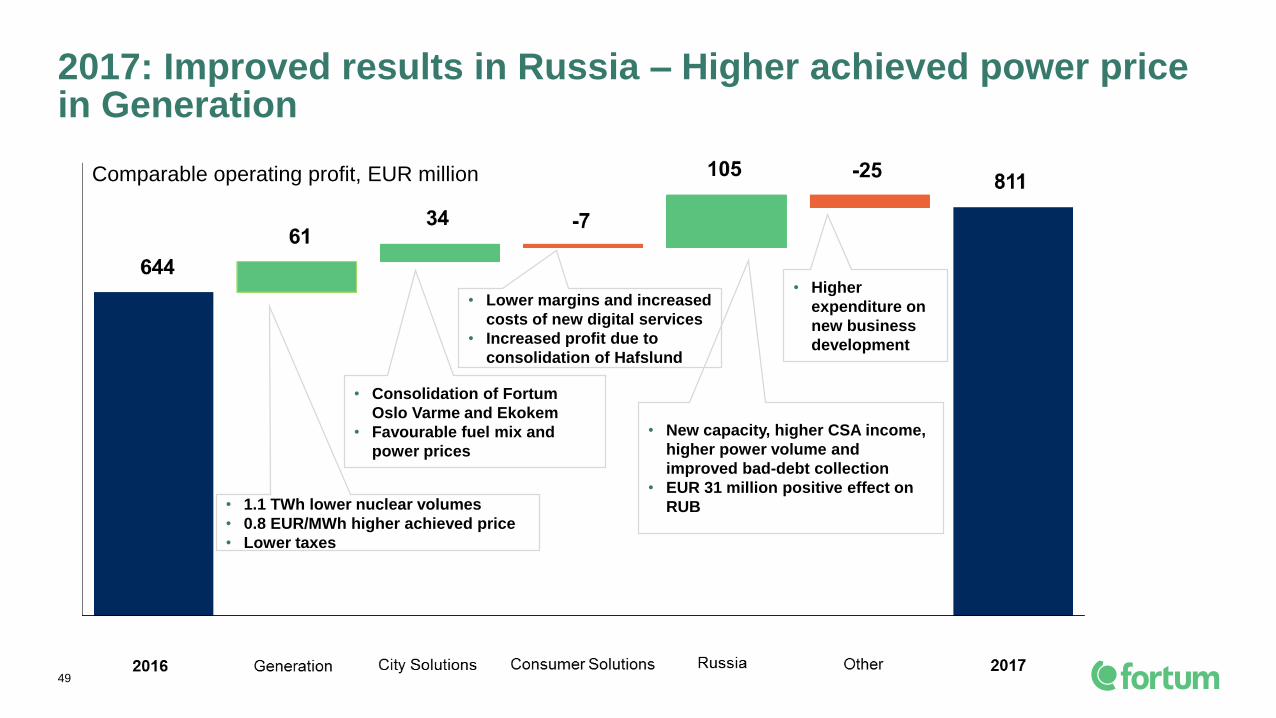
2017: Improved results in Russia – Higher achieved power price in Generation
• New capacity, higher CSA income,
higher power volume and
improved bad-debt collection
• EUR 31 million positive effect on
RUB
Comparable operating profit, EUR million
• 1.1 TWh lower nuclear volumes
• 0.8 EUR/MWh higher achieved price
• Lower taxes
49
• Consolidation of Fortum
Oslo Varme and Ekokem
• Favourable fuel mix and
power prices
• Lower margins and increased
costs of new digital services
• Increased profit due to
consolidation of Hafslund
• Higher
expenditure on
new business
development
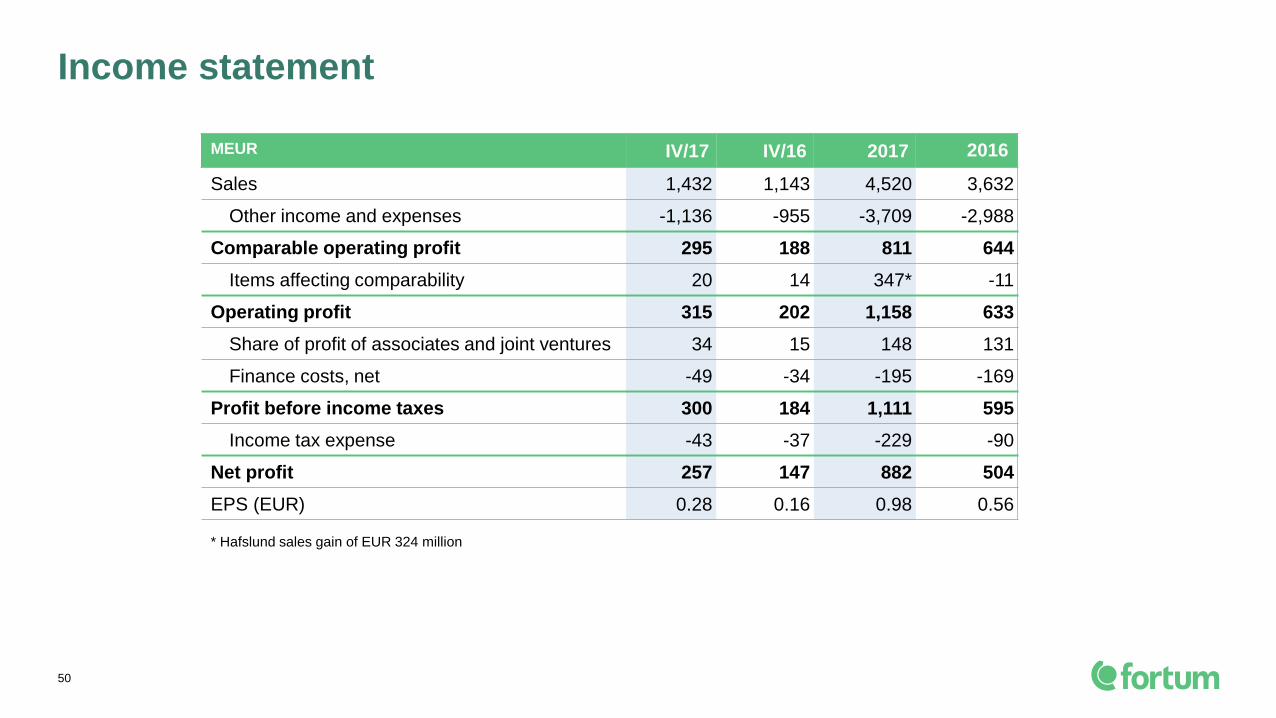
Income statement
MEUR IV/17 IV/16 2017 2016
Sales 1,432 1,143 4,520 3,632
Other income and expenses -1,136 -955 -3,709 -2,988
Comparable operating profit 295 188 811 644
Items affecting comparability 20 14 347* -11
Operating profit 315 202 1,158 633
Share of profit of associates and joint ventures 34 15 148 131
Finance costs, net -49 -34 -195 -169
Profit before income taxes 300 184 1,111 595
Income tax expense -43 -37 -229 -90
Net profit 257 147 882 504
EPS (EUR) 0.28 0.16 0.98 0.56
50
* Hafslund sales gain of EUR 324 million
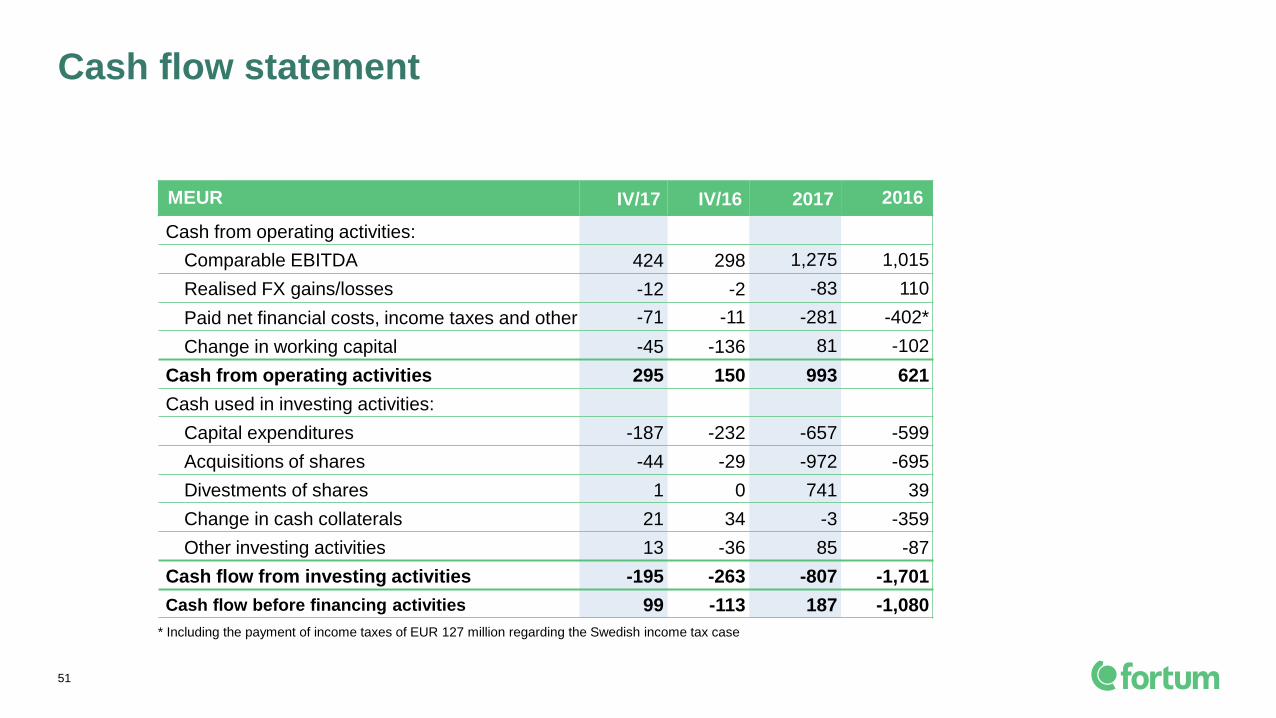
Cash flow statement
MEUR IV/17 IV/16 2017 2016
Cash from operating activities:
Comparable EBITDA 424 298 1,275 1,015
Realised FX gains/losses -12 -2 -83 110
Paid net financial costs, income taxes and other -71 -11 -281 -402*
Change in working capital -45 -136 81 -102
Cash from operating activities 295 150 993 621
Cash used in investing activities:
Capital expenditures -187 -232 -657 -599
Acquisitions of shares -44 -29 -972 -695
Divestments of shares 1 0 741 39
Change in cash collaterals 21 34 -3 -359
Other investing activities 13 -36 85 -87
Cash flow from investing activities -195 -263 -807 -1,701
Cash flow before financing activities 99 -113 187 -1,080
51
* Including the payment of income taxes of EUR 127 million regarding the Swedish income tax case
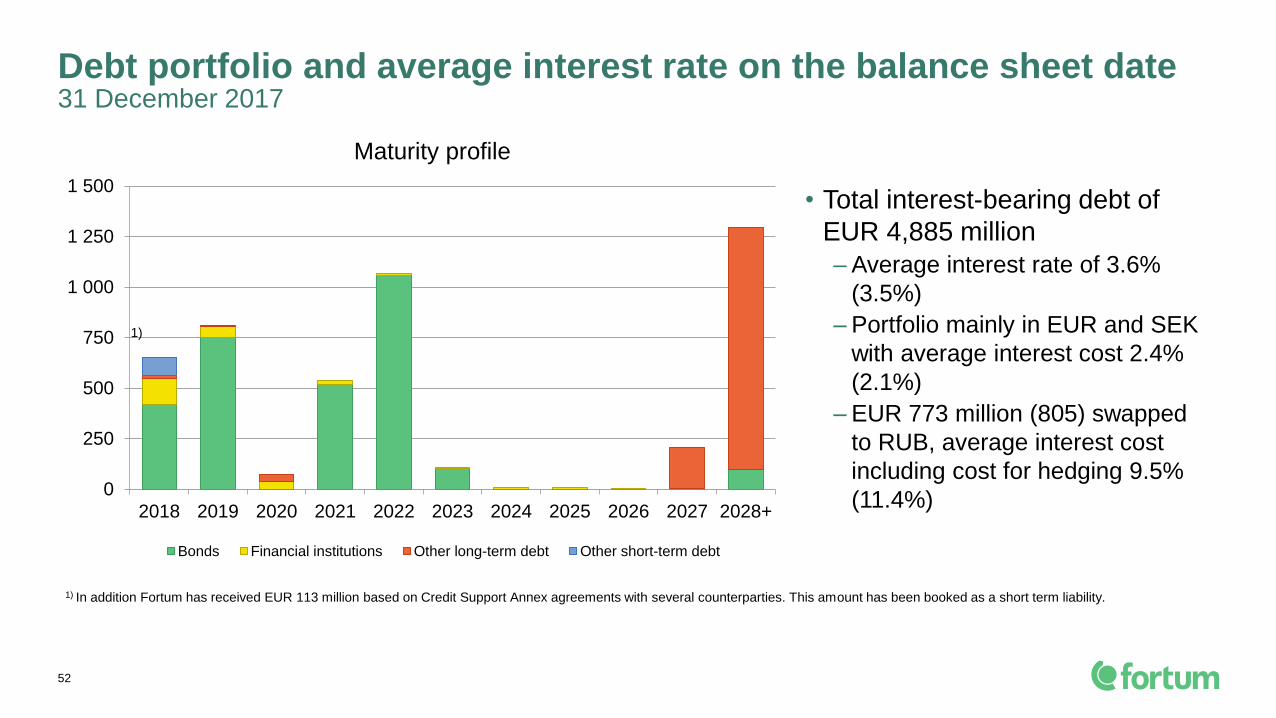
Debt portfolio and average interest rate on the balance sheet date31 December 2017
52
0
250
500
750
1 000
1 250
1 500
2018 2019 2020 2021 2022 2023 2024 2025 2026 2027 2028+
Bonds Financial institutions Other long-term debt Other short-term debt
• Total interest-bearing debt of
EUR 4,885 million
– Average interest rate of 3.6%
(3.5%)
– Portfolio mainly in EUR and SEK
with average interest cost 2.4%
(2.1%)
– EUR 773 million (805) swapped
to RUB, average interest cost
including cost for hedging 9.5%
(11.4%)
1) In addition Fortum has received EUR 113 million based on Credit Support Annex agreements with several counterparties. This amount has been booked as a short term liability.
Maturity profile
1)

Strong financial position - financial headroom enables the Uniper investment
MEUR 2017 2016 Target
Comparable EBITDA 1,275 1,015
Interest-bearing net debt 988 -48
Comparable net debt/EBITDA 0.8 0.0 Around 2.5
ROCE % Return on capital employed 7.1* 4.0 At least 10%
53
Liquid funds EUR 3.9 billion
Committed credit lines EUR 1.9 billion
In addition, EUR 12.0 billion for Fortum’s offer for Uniper shares
* Includes sales gain of Hafslund shares

54
Outlook
Nordic markets
• Fortum continues to expect that the annual electricity demand growth will be approximately 0.5%
on average
• Electricity is expected to continue to gain share of total energy consumption
2018 Estimated annual capital expenditure, excluding acquisitions• Approximately EUR 600-700 million (maintenance capex appr. EUR 300 million)
Hedging• 2018 approximately 70% hedged at EUR 28/MWh
• 2019 approximately 40% hedged at EUR 25/MWh
Synergies of Hafslund transaction going forward EUR 15-20 million by the end of 2020• City Solutions EUR 5-10 million by the end of 2020
• Consumer Solutions appr. EUR 10 million by the end of 2020
Taxation• Effective tax rate for 2018 for the Group 19-21%*
• In Sweden nuclear capacity tax abolished from 2018 and hydro assets’ real estate tax rate to
decrease over a four-year period
* Excluding the impact of the share of profits of associated companies and joint ventures, non-taxable capital gains, and a Swedish income tax case.

Annual General Meeting 2018 and dividend distribution proposal
• Fortum's Annual General Meeting 2018 is planned to take place
on 28 March 2018 at 11:00 a.m. EET
– At the Finlandia Hall in Helsinki
• The Board of Directors proposes a dividend of
EUR 1.10 per share
• Dividend-related dates planned for 2018:
– Ex-dividend 29 March 2018
– Record date for dividend payment 3 April 2018
– Dividend payment date 10 April 2018
55
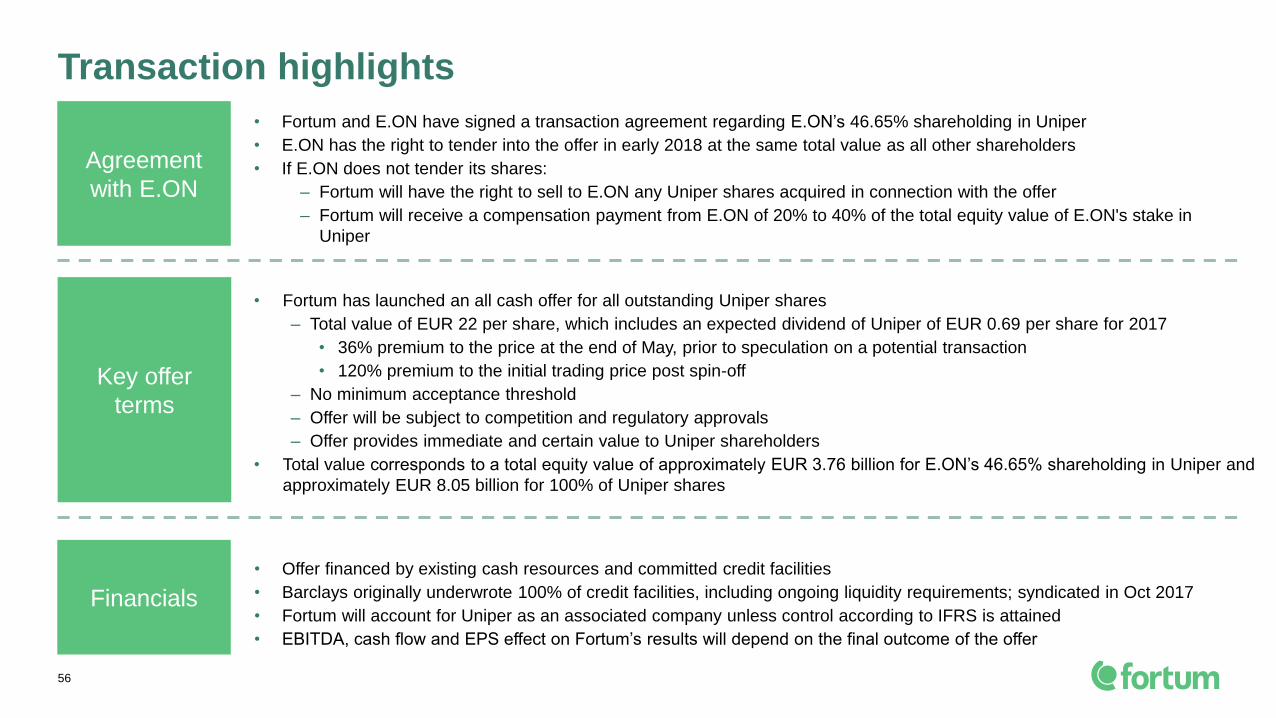
Transaction highlights
• Fortum has launched an all cash offer for all outstanding Uniper shares
– Total value of EUR 22 per share, which includes an expected dividend of Uniper of EUR 0.69 per share for 2017
• 36% premium to the price at the end of May, prior to speculation on a potential transaction
• 120% premium to the initial trading price post spin-off
– No minimum acceptance threshold
– Offer will be subject to competition and regulatory approvals
– Offer provides immediate and certain value to Uniper shareholders
• Total value corresponds to a total equity value of approximately EUR 3.76 billion for E.ON’s 46.65% shareholding in Uniper and
approximately EUR 8.05 billion for 100% of Uniper shares
Key offer
terms
Financials
• Offer financed by existing cash resources and committed credit facilities
• Barclays originally underwrote 100% of credit facilities, including ongoing liquidity requirements; syndicated in Oct 2017
• Fortum will account for Uniper as an associated company unless control according to IFRS is attained
• EBITDA, cash flow and EPS effect on Fortum’s results will depend on the final outcome of the offer
56
Agreement
with E.ON
• Fortum and E.ON have signed a transaction agreement regarding E.ON’s 46.65% shareholding in Uniper
• E.ON has the right to tender into the offer in early 2018 at the same total value as all other shareholders
• If E.ON does not tender its shares:
– Fortum will have the right to sell to E.ON any Uniper shares acquired in connection with the offer
– Fortum will receive a compensation payment from E.ON of 20% to 40% of the total equity value of E.ON's stake in
Uniper

Uniper and Fortum – two highly complementary businesses
57
3.6 GW of which 1.6 GW in Sweden
and 2.0 GW in Germany4.6 GW Nordic hydro portfolio
1.9 GW Swedish nuclear portfolio3.0 GW Nordic nuclear portfolio,
world class track record in availability
10.7 GW power production portfolio,
among most efficient operators
4.5 GW power and 9.9 GW heat portfolio and
strong renewables pipeline, most modern fleet
~22 GW power production portfolio in
Central Europe and UKGrowing power and heat player in Poland
Wind and solar in France, limited biomass
Growing in wind and solar, among EU’s largest
bioenergy companies, strong growth in waste,
consumer business and e-mobility
Large power and fuel trading, significant
mid-stream assets
Strong competence in asset
optimization and trading
Hydro
Nordic nuclear
Russia
European generation
Trading and mid-stream
gas business
Renewables, waste and
consumer business
____________________________________________Note: Uniper capacities presented represent accounting view.

• Delivers on Fortum’s, disciplined capital redeployment strategy and investment criteria
• Uniper has a:
– Strong EBITDA
– Strong operating profit
– Strong net profit
– Strong dividends
• EV/EBITDA multiple of 6.1x based on consensus estimates for 2018
• Contributes towards a stable and sustainable dividend for Fortum’s shareholders
• EBITDA and cash flow contribution, EPS effect on Fortum’s results, will depend on the final
outcome of the offer
An attractive investment for Fortum shareholders
58 1) Source: www.uniper.energy, December 2017
2) Dividend for 2018 to be paid in 2019
Broker consensus median for 2018 1)
Adj. EBITDA 1,564
Adj. EBIT 944
Net profit 626
Dividend 2) 274

Next steps
59
26 SEP Announcement of intention to launch public takeover offer
24 OCT The offer documents to the German Federal Financial Supervision Authority (BaFin)
7 NOV Publication of offer documents
7 NOV 10-week acceptance period commences
16 JAN-18 Acceptance period ends
20 JAN to Expected additional acceptance period
2 FEB-18
Mid 2018 Regulatory approvals expected
Mid 2018 Transaction closing expected
www.powerful-combination.com

Fortum Investor Relations and Financial CommunicationsFor more information, please visit www.fortum.com/investors
60
Follow us on:
www.twitter.com/Fortum www.linkedin.com/company/fortum
Fortum ForEnergy blog at
http://fortumforenergyblog.wordpress.com www.youtube.com/user/fortum
Måns Holmberg
Manager
+358 (0)44 518 1518
Next events:
AGM on 28 March 2018
Ex-dividend date on 29 March 2018
Dividend payment date on10 April 2018
Q1/2018 results on 26 April 2018
Q2/2018 results on 19 July 2018
Q3/2018 results on 24 October 2018
Meeting requests:
Pia LiljaExecutive Assistant
+358 (0)50 553 5529
Pirjo LifländerIR Specialist
+358 (0)40 643 3317
Rauno Tiihonen
Manager
+358 (0)10 453 6150
Ingela UlfvesVice President, Investor Relations and
Financial Communication
+358 (0)40 515 1531