Fortum Corporation
49
Fortum Corporation Interim Report January-March 2012 26 April 2012 Fortum Corporation Domicile Espoo Business ID 1463611-4
Transcript of Fortum Corporation

Fortum Corporation
Interim Report January-March 2012
26 April 2012
Fortum Corporation Domicile Espoo Business ID 1463611-4

Fortum Corporation Interim Report January - March 2012 26 April 2012 at 9:00 EEST
Overall good operative results January - March 2012
Comparable operating profit was EUR 651 (649) million, 0% Operating profit was EUR 736 (900) million, of which EUR
-16 (173) million relates to the IFRS accounting treatment of derivatives. Earnings per share was EUR 0.56 (0.76),-26%, of which -0.01 (0.14) EUR per share relates to the IFRS accounting treatment of derivatives Cash flow from operating activities was strong and reached EUR 553 (454) million, +22% Nordic system spot price was clearly lower than last year, EUR 38.2 (66.2)
Key figures I/12 I/11 2011 LTM*
Sales, EUR million 1,901 2,034 6,161 6,028
Operating profit, EUR million 736 900 2,402 2,238
Comparable operating profit, EUR million 651 649 1,802 1,804
Profit before taxes, EUR million 653 904 2,228 1,977
Earnings per share, EUR 0.56 0.76 1.99 1.79
Net cash from operating activities, EUR million 553 454 1,613 1,712
Shareholders’ equity per share, EUR 11.65 9.30 10.84 N/A
Interest-bearing net debt (at end of period), EUR million 6,523 6,367 7,023 N/A
Average number of shares, 1,000s 888,367 888,367 888,367 888,367 *) Last twelve months
Key financial ratios 2011 LTM Return on capital employed, % 14.8 12.8
Return on shareholders’ equity, % 19.7 16.7
Net debt/EBITDA 2.3 2.3
Comparable net debt/EBITDA 3.0 2.7
Outlook
Fortum currently expects that the annual electricity demand growth in the Nordic countries will be about 0.5% in the coming years.
Power Division's Nordic generation hedges: For the rest of the calendar year 2012, 70% hedged at EUR 48 per MWh and for the 2013 calendar year, 45% hedged at EUR 46 per MWh.
2 (49)

Fortum’s President and CEO Tapio Kuula: “Fortum performed well in the first quarter of 2012, despite the continuously demanding business environment. Nordic spot prices were clearly lower than last year. The Nordic water reservoir levels continued to increase and were above the long-term average throughout the first quarter. The strong hydro situation combined with warmer weather and pressed carbon dioxide (CO2) emission allowance prices, among other things, pushed Nordic electricity prices to below last year’s prices and below the continental prices. Electricity demand decreased in the Nordic countries, but increased slightly in Russia compared to the same period in 2011. Characteristic for Fortum’s business is its seasonality and we expect 2012 to be no different. The seasonal differences are driven by hydro levels, power prices, and the normal seasonality of the heat businesses. In the first quarter 2012 the company’s comparable operating profit was on last year’s level, and both the balance sheet as well as liquidity remained strong. The Power Division’s first-quarter comparable operating profit was somewhat higher than in the corresponding period in 2011. The system and all area prices were clearly lower, but a higher hedge price kept the achieved power price close to last year’s level. In addition, higher reservoir levels in the beginning of the year, compared to the corresponding period in 2011, increased hydro generation significantly. The Heat Division’s comparable operating profit decreased somewhat mainly due to lower volumes related to divestments in Sweden, Finland and Estonia. The comparable operating profit development in Russia was good, although electricity prices were clearly lower than a year ago. The Distribution business area's comparable operating profit decreased slightly. The decrease was mainly due to the warm weather, especially in March. Electricity Sales' comparable operating profit in the first quarter of 2012 was at last year’s level. A strong business foundation is essential in a changing business environment. Fortum is committed to continuously improving its operational performance.”
Financial results January - March In the first quarter of 2012, Group sales were EUR 1,901 (2,034) million. Group operating profit totalled EUR 736 (900) million. Fortum's operating profit for the period was affected by a EUR -16 (173) million IFRS accounting treatment (IAS 39) of derivatives mainly used for hedging Fortum's power production. The comparable operating profit, which was not impacted by the accounting treatment, totalled EUR 651 (649) million. Non-recurring items, mark-to-market effects and nuclear fund adjustments amounted to EUR 85 (251) million, of which EUR -16 (173) million was attributed to changes in fair values of derivatives to hedge future cash flow. Non-recurring items totalled EUR 110 (82) million, which mainly relates to the divestment of shares in power and heat operations (Note 4).
3 (49)

4 (49)
Sales by division EUR million I/12 I/11 2011 LTM Power 655 693 2,481 2,443
Heat 625 725 1,737 1,637
Russia 310 295 920 935
Distribution* 308 311 973 970
Electricity Sales* 247 373 900 774
Other 44 30 108 122
Netting of Nord Pool transactions -188 -366 -749 -571
Eliminations -100 -27 -209 -282
Total 1,901 2,034 6,161 6,028* Part of the Electricity Solutions and Distribution Division
Comparable operating profit by division EUR million I/12 I/11 2011 LTM
Power 341 325 1,201 1,217
Heat 161 171 278 268
Russia 48 34 74 88
Distribution* 110 124 295 281
Electricity Sales* 9 11 27 25
Other -18 -16 -73 -75
Total 651 649 1,802 1,804* Part of the Electricity Solutions and Distribution Division
Operating profit by division EUR million I/12 I/11 2011 LTM
Power 367 489 1,476 1,354
Heat 213 265 380 328
Russia 48 34 74 88
Distribution* 117 125 478 470
Electricity Sales* 11 -20 3 34
Other -20 7 -9 -36
Total 736 900 2,402 2,238* Part of the Electricity Solutions and Distribution Division The share of profits of associates and joint ventures was EUR -7 (59) million. The Russian territorial generating company 1 (TGC-1) and Hafslund ASA contributed to the positive figure in the first quarter of 2011. TGC-1 is not included in the first-quarter results as TGC-1 has not published its 2011 IFRS Financial Statements. The Group’s net financial expenses increased to EUR 76 (55) million. The increase is attributable to higher interest expenses, mainly due to higher SEK interest rates and to higher average net debt. Net financial expenses were negatively affected by changes in the fair value of financial instruments of EUR 7 (1) million. Profit before taxes was EUR 653 (904) million. Taxes for the period totalled EUR 119 (158) million. The tax rate according to the income statement was 18.3% (17.5). The tax rate excluding the impact of share of profits of associated companies and joint ventures as well as non-taxable capital gains was 21.0% (20.8). In Finland, the corporate tax rate was decreased to 24.5% from 26%, effective 1 January 2012. The profit for the period was EUR 534 (746) million. Fortum's earnings per share were EUR 0.56 (0.76). The effect on earnings per share by the accounting treatment of derivatives was EUR -0.01 (0.14).

Non-controlling (minority) interests amounted to EUR 39 (68) million. These are mainly attributable to Fortum Värme Holding AB, in which the city of Stockholm has a 50% economic interest. The decrease compared to last year is mainly due to the minority's share, EUR 32 million, of the gain recognised in the first quarter 2011 from the divestment of Fortum Värme’s heat businesses outside the Stockholm area.
Financial position and cash flow Cash flow In the first quarter of 2012, total net cash from operating activities increased by 22% to EUR 553 (454) million. The major part of the increase was attributable to lower foreign exchange losses in cash flow, EUR 170 million, and the lower taxes paid, EUR 36 million, which was offset by the EUR -113 million increase in working capital. The foreign exchange gains and losses relate to the rollover of foreign exchange contracts hedging loans to Fortum’s Swedish subsidiaries. Capital expenditures in cash flow increased by EUR 66 million to EUR 272 (206) million. Acquisitions of shares totalled EUR 0 (19) million. Proceeds from divestments totalled EUR 276 (207) million in cash flow. Cash flow before financing activities, i.e. dividend distributions and financing, increased by EUR 97 million to EUR 536 (439) million. After the reporting period, dividends amounting to EUR 888 million were paid on 23 April 2012 using the cash and cash equivalents Fortum had on 31 March and amounting to EUR 1 574 million.
Assets and capital employed Total assets increased by EUR 1,121 million to EUR 24,119 (22,998 at year-end 2011) million. Non-current assets increased by EUR 392 million from EUR 20,210 million to EUR 20,602 million. The majority, EUR 307 million, came from the increased value of property, plant and equipment, mainly due to the strengthening Russian rouble and other currencies. The increase in current assets was EUR 729 million, totalling EUR 3,517 million. The major part of the increase relates to the higher amount of cash and cash equivalents, EUR 843 million, offset by the EUR 183 million decrease in assets held for sale. The higher amount of cash was reserved for dividend payment amounting to EUR 888 million of 23 April 2012. Capital employed was EUR 19,016 (17,931 at year-end 2011) million, an increase of EUR 1,085 million. The increase was due to the higher amount of total assets, totalling EUR 1,121 million and the minor decrease in interest-free liabilities totalling EUR 36 million. (These interim financial statements do not reflect the dividend paid in April).
Equity Total equity was EUR 10,919 (10,161 at year-end 2011) million, of which equity attributable to owners of the parent company totalled EUR 10,346 (9,632 at year-end 2011) million and non-controlling interests EUR 573 (529 at year-end 2011) million. The increase in equity attributable to owners of the parent company totalled EUR 714 million and arose mainly from net profit for the period, amounting to EUR 495 million and from the translation differences mainly relating to Russian rouble totalling EUR 207 million.
Financing Net debt decreased during the first quarter of 2012 by EUR 500 million to EUR 6,523 (7,023 at year-end 2011) million. At the end of March 2012, the Group’s liquid funds totalled EUR 1,574 (747 at year-end 2011) million. Liquid funds include cash and bank deposits held by OAO Fortum amounting to EUR 249
5 (49)

(211 at year-end 2011) million. In addition to the liquid funds, Fortum had access to approximately EUR 2.7 billion of undrawn committed credit facilities. The Group's net financial expenses in the first quarter of 2012 were EUR 76 (55) million. The increase in financial expenses is mainly attributable to higher market interest rates and higher average net debt during the quarter. Net financial expenses also include changes in the fair value of financial instruments of EUR -7 (-1) million. Fortum Corporation's long-term credit rating from S&P and from Moody’s remained unchanged, A (negative) and A2 (stable), respectively.
Key figures For the last twelve months net debt to EBITDA was 2.3 (2.3 at year-end 2011) and comparable net debt to EBITDA 2.7 (3.0 at year-end 2011). Gearing was 60% (69% at year-end 2011) and the equity-to-assets ratio 45% (44% at year-end 2011). For the last twelve months, return on capital employed was 12.8% (14.8% at year-end 2011) and return on equity 16.7% (19.7% at year-end 2011). Equity per share was EUR 11.65 (10.84 at year-end 2011).
Market conditions Nordic countries The Nordic water reservoir level was well above the long-term average at the beginning of the first quarter of 2012 and remained so throughout the quarter. The milder weather and the above-average water reservoirs kept the Nordic power price clearly below the previous year's level. During most of the quarter, the Nordic price also remained below the continental price resulting in a nearly continuous export of power from the Nordic countries to the continent. According to preliminary statistics, the Nordic countries consumed 113 (116) terawatt-hours (TWh) of electricity in the first quarter of 2012, i.e. approximately 3% less than the year before. Most of the difference was due to the higher temperatures, even though the industrial consumption was somewhat lower than the year before. At the beginning of the year, the Nordic water reservoirs were 95 TWh, which is 12 TWh more than the long-term average. At the end of the quarter, the reservoirs were 15 TWh above the long-term average and 36 TWh above the corresponding level in 2011. During the first quarter, the average system spot price for electricity in Nord Pool was EUR 38.3 (66.2) per megawatt-hour (MWh). The area prices in Finland and Sweden were both above the system price, in Finland at 42.5 (64.8) per MWh and in Sweden (SE3) at 39.1 (65.9) per MWh. The Finnish area price started to deviate from the system price in February, when the import capacity from Sweden was significantly reduced due to a failure in the new Fenno-Skan 2 connection. In addition, in March, maintenance of a transmission network lead to a period of several weeks when the available import capacity from Sweden to Finland was less than half of its maximum level. In Germany, the average spot price during the first quarter in 2012 was EUR 45.1 (51.9) per MWh. At the beginning of the year, the market price for CO2 emission allowances was approximately EUR 6.6 per tonne. In the middle of February, the highest quoted price was approximately EUR 9.5 per tonne. At the end of the quarter, CO2 emission allowances closed at approximately EUR 7.1 per tonne.
6 (49)

Russia According to preliminary statistics, Russia consumed 293 (285) TWh of electricity during the first quarter of 2012. The corresponding figure in Fortum’s operating area in the First price zone (European and Urals part of Russia) was 217 (211) TWh. OAO Fortum operates in the Tyumen and Chelyabinsk areas. In the Tyumen area, where industrial production is dominated by the oil and gas industries, electricity demand in the first quarter of 2012 increased by approximately 0.2% compared to the same period in 2011. In the Chelyabinsk area, which is dominated by the metal industry, electricity demand increased by approximately 0.7% in the first quarter compared to the same period of the previous year. The increase is mainly due to industrial consumption. The average electricity spot price, excluding capacity price, decreased by 11% to RUB 915 (1,033) per MWh in the First price zone during the first quarter of 2012. More detailed information about the market fundamentals is included in the tables at the end of the report (page 47).
Division reviews
Power The Power Division consists of Fortum’s power generation, power trading and power capacity development as well as expert services for power producers. EUR million I/12 I/11 2011 LTM Sales 655 693 2,481 2,443
- power sales 631 657 2,353 2,327
of which Nordic power sales* 569 504 2,041 2,106
- other sales 24 36 128 116
Operating profit 367 489 1,476 1,354
Comparable operating profit 341 325 1,201 1,217
Comparable EBITDA 369 352 1,310 1,327
Net assets (at period-end) 6,117 5,996 6,247
Return on net assets, % 24.6 22.3
Comparable return on net assets, % 19.9 20.1
Capital expenditure and gross investments in shares 24 33 148 139
Number of employees 1,842 1,812 1,847 Power generation by source, TWh I/12 I/11 2011 LTM
Hydropower, Nordic 6.1 4.1 21.0 23.0
Nuclear power, Nordic 6.5 6.8 24.9 24.6
Thermal power, Nordic 0.2 1.7 2.2 0.7
Total in the Nordic countries 12.8 12.6 48.1 48.3
Thermal power in other countries 0.3 0.3 1.2 1.2
Total 13.1 12.9 49.3 49.5
7 (49)

8 (49)
Nordic sales volumes, TWh I/12 I/11 2011 LTM Nordic sales volume 13.2 13.2 50.0 50.0
of which Nordic power sales volume* 12.0 10.5 44.3 45.8 * The Nordic power sales income and volume do not include thermal generation, market price-related purchases or minorities (i.e. Meri-Pori, Inkoo and imports from Russia). Sales price, EUR/MWh I/12 I/11 2011 LTM Power's Nordic power price** 47.2 47.9 46.1 46.0 ** Power's Nordic power price does not include sales income from thermal generation, market price-related purchases or minorities (i.e. Meri-Pori, Inkoo and imports from Russia).
January - March In the first quarter of 2012, the Power Division’s operating profit was EUR 367 (489) million. A gain of EUR 47 (0) million, relating to the divestments of small hydro plants in Finland was booked into the first quarter of 2012. Operating profit was also impacted EUR -21 (164) million by Other items affecting comparability, mainly including the effects from financial derivatives hedging. The comparable operating profit in the first quarter was EUR 341 (325) million, EUR 16 million higher than in the corresponding period in 2011. The system and all area prices were clearly lower in the beginning of 2012, but a higher hedge price kept the achieved power price close to last year's level. Higher reservoir levels in the beginning of the year, compared to the corresponding period in 2011, increased hydro generation significantly. Nuclear availability was at a high level in all power plants except Oskarshamn 1 and 3. The total nuclear volume was thus slightly lower than during the corresponding period in 2011. Thermal production was clearly lower due to low area prices. The combined effect of increased hydro, less nuclear and thermal volumes combined with a slightly lower achieved power price had a positive impact of approximately EUR 30 million during the first quarter in 2012 compared to corresponding period in 2011. Operating costs increased by approximately EUR 10 million, mainly due to higher nuclear fuel costs and inflationary effects. During the first quarter, the nuclear waste fees increased in Sweden by EUR 4 million. The increase in waste fees is estimated to be approximately EUR 15 million for the full year 2012. In the first quarter of 2012, the division's total power generation in the Nordic countries was 12.8 (12.6) TWh, which corresponds to an approximately 2% increase compared to the same period in 2011. Power’s achieved Nordic power price amounted to EUR 47.2 per MWh, which was only EUR 0.7 per MWh lower than in the first quarter of 2011. Fortum has two fully-owned reactors in Loviisa and is a co-owner in eight reactors at the Olkiluoto, Oskarshamn and Forsmark nuclear power plants. Nuclear availability was at high level in all of the power plants except Oskarshamn. Oskarshamn 1 was shut down at the end of October 2011 for an extensive turbine overhaul and will stay shut down until after the planned annual outage 23 April – 17 June 2012. Oskarshamn 2 and 3 suffered from technical problems and were shut down for a total of 4 weeks. In addition, Oskarshamn 3 has been operating at an approximately 100-MW reduced output until the planned annual outage 12 April – 11 May 2012, waiting that all power increase related tests to be completed. European-wide safety evaluations have been carried out after the Fukushima incident. As part of the evaluations, so-called peer reviews were carried out in several European nuclear power plants, including the Loviisa nuclear power plant, in March 2012. The European Commission will submit a consolidated report of the national reports to the European Council in June 2012. In March, Fortum became involved in the purification of Fukushima. Fortum is a key supplier to EnergySolutions LLC, which has been selected by Toshiba Corporation as the technology supplier for a project to decontaminate water from the damaged nuclear power plant at Fukushima. The radioactive liquid purification process used in the project will use ion exchange materials developed by Fortum. Fortum will supply thousands of kilos of ion exchange materials in granule form to EnergySolutions for the purification process. The value of the supplies is estimated to be tens of millions of euros over the next couple of years. Fortum’s preparations for the French hydro concession bidding have progressed as planned.

9 (49)
Heat The Heat Division consists of combined heat and power (CHP) generation, district heating activities and business-to-business heating solutions in the Nordic countries and other parts of the Baltic Rim. EUR million I/12 I/11 2011 LTM Sales 625 725 1,737 1,637
- heat sales 465 529 1,238 1,174
- power sales 96 151 342 287
- other sales 64 45 157 176
Operating profit 213 265 380 328
Comparable operating profit 161 171 278 268
Comparable EBITDA 211 220 471 462
Net assets (at period-end) 4,171 4,030 4,191
Return on net assets, % 9.9 8.7
Comparable return on net assets, % 7.4 7.2
Capital expenditure and gross investments in shares 67 58 329 338
Number of employees 2,352 2,770 2,504
January - March Heat sales volumes during the first quarter of 2012 amounted to 8.1 (10.4) TWh. During the same period, power sales volumes from combined heat and power (CHP) production totalled 1.7 (2.7) TWh. The reduction in volumes is mainly attributable to the divestment in Sweden in 2011 and to divestments in Finland and Estonia in January 2012. The restructuring in the Turku region energy production in Finland also decreased volumes. Higher temperatures also impacted volumes somewhat negatively compared to the same period in 2011. The Heat Division’s operating profit in the first quarter totalled EUR 213 (265) million. It includes a gain of EUR 58 (80) million relating to divestments in Finland and Estonia. The division’s comparable operating profit in the first quarter was EUR 161 (171) million, EUR 10 million lower than in the corresponding period in 2011. The result decreased mainly due to the lower volumes that were primarily attributable to divestments and restructuring. However, especially in Sweden, the result improved due to good availability, fuel flexibility and the introduction of new district heat products. Heat sales volumes by area, TWh
I/12 I/11 2011 LTM
Finland 2.2 3.4 8.5 7.3
Sweden 3.3 4.2 8.5 7.6
Poland 2.0 2.1 4.3 4.2
Other countries 0.6 0.7 1.3 1.2
Total 8.1 10.4 22.6 20.3 Power sales volumes, TWh I/12 I/11 2011 LTM
Total 1.7 2.7 6.2 5.2

10 (49)
Russia The Russia Division consists of power and heat generation and sales in Russia. It includes OAO Fortum and Fortum’s over 25% holding in TGC-1, which is an associated company and is accounted for using the equity method. EUR million I/12 I/11 2011 LTM Sales 310 295 920 935
- power sales 181 162 590 609
- heat sales 126 132 324 318
- other sales 3 1 6 8
EBITDA 77 57 182 202
Operating profit 48 34 74 88
Comparable operating profit 48 34 74 88
Comparable EBITDA 77 57 148 168
Net assets (at period-end) 3,547 2,918 3,273
Return on net assets, % 3.5 3.5
Comparable return on net assets, % 3.5 3.5
Capital expenditure and gross investments in shares 81 75 694 700
Number of employees 4,337 4,418 4,379 OAO Fortum operates in the well-developed industrial regions of the Urals and in oil-producing western Siberia. The liberalisation of the Russian wholesale power market was completed by the beginning of 2011. However, all generating companies continue to sell a part of their electricity and capacity - an amount equalling the consumption of households and a few special groups of consumers - under regulated prices. In 2011, OAO Fortum sold approximately 84% of its power production at a liberalised electricity price. The new rules for the capacity market starting from 2011 were approved by the Russian Government. The generation capacity built after 2007 under the government capacity supply agreements (CSA – “new capacity”) receive guaranteed payments for a period of 10 years. Prices for capacity under CSA are defined to ensure a sufficient return on investments. At the time of the acquisition in 2008, Fortum made a provision, as penalty clauses are included in the CSA agreement in case of possible delays. Possible penalties can be claimed if the new capacity is delayed or if the agreed major terms of the capacity supply agreement are not otherwise fulfilled. The effect of changes in the timing of commissioning of new units is assessed at each balance sheet date and the provision is changed accordingly (see Note 18). The capacity selection for 2012 (CCS for “old capacity”, built prior 2008) was held in September 2011. The majority of Fortum’s power plants were selected in the auction, with a price level close to the level received in 2011. Approximately 4% (120 MW) of Fortum’s old capacity was not allowed to participate in the selection due to tightened minimal technical requirements. The capacity will, however, receive capacity payments at the average capacity market price for two additional years. January - March The Russia Division's power sales volumes amounted to 6.2 (5.6) TWh during the first quarter of 2012. Heat sales totalled 11.3 (11.0) TWh during the same period. The Russia Division’s comparable operating profit was EUR 48 (34) million in the first quarter of 2012. The positive effect from the commissioning of the new units in the first quarter amounted to approximately EUR 16 million. The improvement was offset by the lower electricity price compared

11 (49)
to the corresponding period last year. In addition, decreased capacity payments and volumes for the old capacity impacted somewhat negatively. Key electricity, capacity and gas prices for OAO Fortum
I/12 I/11 2011 LTM
Electricity spot price (market price), Urals hub, RUB/MWh 849 947 925 900
Average regulated gas price, Urals region, RUB/1000 m3 2,548 2,548 2,548 2,548
Average capacity price for CCS “old capacity”, tRUB/MW/month* 166 184 160 156
Average capacity price for CSA “new capacity”, tRUB/MW/month* 577 759 560 550
Average capacity price, tRUB/MW/month 243 214 209 218
Achieved power price for OAO Fortum, EUR/MWh 29.3 29.2 29.2 29.3
*Capacity prices paid for the capacity volumes excluding unplanned outages, repairs and own consumption OAO Fortum's new capacity will be a key driver for earnings growth in Russia, as it will bring income from new volumes sold and also receive considerably higher capacity payments than the old capacity. However, received capacity payments will differ depending on the age, location, type and size of the plant as well as seasonality and availability. Fortum is committed to its EUR 2.5 billion investment programme in Russia, and the schedule of the programme is to commission the last new units in 2014. The value of the remaining part of the investment programme, calculated at the exchange rates prevailing at the end of March 2012, is estimated to be approximately EUR 0.9 billion as of April 2012. Altogether, the investment programme consists of eight new power plant units, of which the first three units were commissioned in 2011. The return for the new capacity is guaranteed as regulated in the Capacity Supply Agreement. The regulator reviews the earnings from the electricity-only market after three years and six years and could revise the CSA payments accordingly. CSA payments can vary annually somewhat because they are linked to Russian Government long-term bonds with 8 to 10 years maturity. Fortum currently estimates the commissioning of the new units Nyagan 1 and Nyagan 2 to be postponed by some months due to construction delay. Fortum has made a provision (per unit) for penalties caused by possible commissioning delays, already in 2008. According to the agreement with the contractor, Fortum is entitled to adequate remedies in case of damages due to delays caused by the contractor. After completing the ongoing investment programme, Fortum’s goal is to achieve an operating profit level of about EUR 500 million in its Russia Division and to create positive economic value added in Russia. In March 2012, the Russian Ministry for Economic Development approved three of OAO Fortum's power plant units as Joint Implementation projects: one Chelyabinsk CHP-3 unit and two Nyagan GRES units. All of these units are part of Fortum’s extensive investment programme. The Joint Implementation projects, as defined in the Kyoto Protocol, will reduce carbon dioxide emissions in Russia, and Fortum will be able to use the related emission reduction units in the EU's emissions trading scheme or sell them on the market.

12 (49)
Electricity Solutions and Distribution The division is responsible for Fortum's electricity sales and distribution activities and consists of two business areas: Distribution and Electricity Sales. Distribution Fortum owns and operates distribution and regional networks and distributes electricity to a total of 1.6 million customers in Sweden, Finland and Norway. EUR million I/12 I/11 2011 LTM Sales 308 311 973 970
- distribution network transmission 261 271 809 799
- regional network transmission 35 28 96 103
- other sales 12 12 68 68
Operating profit 117 125 478 470
Comparable operating profit 110 124 295 281
Comparable EBITDA 159 171 482 470
Net assets (at period-end) 3,641 3,711 3,589
Return on net assets, % 13.7 13.3
Comparable return on net assets, % 8.6 8.0
Capital expenditure and gross investments in shares 44 34 289 299
Number of employees 851 888 898
January - March The volume of distribution and regional network transmissions during the first quarter of 2012 totalled 8.3 (8.6) TWh and 4.9 (4.9) TWh, respectively. The Distribution business area's comparable operating profit was EUR 110 (124) million. The decrease in the result was due to the warm weather, especially in March, which led to lower sales volumes. In addition, the timing of the re-location of existing cables and part of the networks reduced the results. The rollout of smart metering to 580,000 network customers in Finland continued as planned and by the end of first quarter 2012, approximately 242,000 customers had received new meters (160,000 at the end of 2011). A total of approximately 620,000 customers will have smart metering before the end of 2013. Invoices based on realised electricity consumption, better control in the use of electricity and a platform for new services are some of the benefits of the new system that has hourly measurement capabilities. The new Finnish legislation on hourly meter reading will become effective 1 January 2014. In Sweden, smart metering to customers had been completed earlier. A new regulation on network income for Swedish electricity distribution was passed in late 2011, with the first regulation period being 2012-2015. The decision included elements that Fortum believes lack legal ground. The Swedish regulation and transition rule was appealed by about half of the distribution companies and it is still unclear what the outcome will be. Proposed legislation in Sweden on hourly measurement of electricity consumption for household customers was ready for approval in the Parliament and expected to be approved during the second quarter of 2012. According to the proposal, hourly measurement is to be in force from 1 October 2012. In Finland, the decision regarding the 3rd regulatory period (2012-2015) was appealed to the market court by the industry. The main points of the appeal are that there should be reasonable limits on the quality risk and the risk/return relationship should be competitive.

13 (49)
The Finnish Ministry of the Economy and Employment has initiated a process to include time limits to electricity outage duration into the Electricity Market Act. The proposal would start a 15-year process to improve the quality of supply in the grids. Volume of distributed electricity in distribution network, TWh
I/12 I/11 2011 LTM
Sweden 4.4 4.5 14.2 14.1
Finland 3.1 3.2 9.5 9.4
Norway 0.8 0.8 2.3 2.3
Estonia 0.0 0.1 0.1 0.0
Total 8.3 8.6 26.1 25.8
Number of electricity distribution customers by area, thousands
31 March 2012 31 March 2011
Sweden 898 893
Finland 628 622
Norway 102 102
Estonia 0 24
Total 1,628 1,641
Electricity Sales The Electricity Sales business area is responsible for retail sales of electricity to a total of 1.2 million private and business customers. It is the leading seller of eco-labelled and CO2-free electricity in the Nordic countries. Electricity Sales buys its electricity from the Nordic power exchange. EUR million I/12 I/11 2011 LTM
Sales 247 373 900 774
- power sales 240 368 879 751
- other sales 7 5 21 23
Operating profit 11 -20 3 34
Comparable operating profit 9 11 27 25
Comparable EBITDA 9 12 29 26
Net assets (at period-end) 56 130 11
Return on net assets, % 4.2 53.6
Comparable return on net assets, % 33.5 44.6
Capital expenditure and gross investments in shares 0 3 5 2
Number of employees 516 500 519
January - March During the first quarter of 2012, the business area's electricity sales volume totalled 4.2 (5.5) TWh. The lower volume was due to the Business Market restructuring, which was still ongoing in the first quarter of 2011, but is now completed. Electricity Sales' comparable operating profit in the first quarter of 2012 totalled EUR 9 (11) million. Warmer weather than last year and customer retention activities decreased profits slightly compared to last year.

Capital expenditures, divestments and investments in shares Capital expenditures and investments in shares totalled EUR 218 (205) million in the first quarter of 2012. Investments, excluding acquisitions, were EUR 218 (167) million. Gross divestments in shares and fixed assets totalled EUR 295 (206) million. Fortum expects to start the supply of power and heat from new power plants and to upgrade existing plants as follows: Type Electricity
capacity, MWHeat
capacity, MWSupply starts *
Power Hydro refurbishment Hydropower 10 2012
Heat
Klaipeda, Lithuania Waste (CHP) 20 60 Q1 2013
Järvenpää, Finland Biofuel (CHP) 23 63 Q2 2013
Jelgava, Latvia Biofuel (CHP) 23 45 Q3 2013
Brista, Sweden Waste (CHP) 20 57 Q4 2013
Russia**
Nyagan 1 Gas (CCGT) 418 Q3/Q4 2012
Nyagan 2 Gas (CCGT) 418 Q4 2012/Q1 2013
Nyagan 3 Gas (CCGT) 418 2013*) Start of commercial operation, preceded by test runs, licensing, etc. **) Start of capacity sales, preceded by test runs, licensing, etc.
Power Fortum completed the divestment of small hydropower plants in Finland during the first quarter. The capital gains from these transactions were EUR 47 million, which were booked in the Power Division's first-quarter results. Through its interest in TVO (Teollisuuden Voima Oyj), Fortum is participating in the building of Olkiluoto 3, a 1,600-MW nuclear power plant unit in Finland. AREVA-Siemens Consortium, which is constructing Olkiluoto 3 on a fixed-price turn-key contract, has informed TVO that the unit is scheduled to be ready for regular electricity production in August 2014. In addition, TVO has started the bidding and engineering phase of the company’s fourth nuclear unit at Olkiluoto. Fortum’s share of the commitment for this phase is approximately EUR 77 million. During the first quarter of 2012 TVO raised EUR 20 million in shareholder loans; Fortum’s share of this is approximately EUR 5 million.
Heat Fortum concluded its divestment of Fortum Energiaratkaisut Oy and Fortum Termest AS to EQT Infrastructure Fund on 31 January 2012. It has been approved by the relevant competition authorities both in Finland and Estonia. The total sales price, including net debt, was approximately EUR 200 million. Fortum's sales gain was EUR 58 million. The divestment is in line with the strategy to focus on large-scale CHP production. The energy production of the co-owned Turun Seudun Maakaasu ja Energiatuatanto Oy (TSME) started as of January 1, as agreed by the different partners in late 2011. TSME is a co-owned company that consolidates the energy production in the Turku region in Finland.
14 (49)

During the first quarter of 2012 Fortum decided to invest about EUR 20 million in the commercialisation of new technology by building a bio-oil plant connected to the Joensuu power plant in Finland. The total value of the investment is about EUR 30 million, of which the Ministry of Employment and the Economy has granted EUR 8.1 million as a new technology investment. The new technology has been developed into a concept in co-operation between Metso, UPM, VTT (as part of the TEKES Biorefine research programme) and Fortum. In Stockholm, Sweden, Fortum Värme will open up the possibility for customers to sell their own surplus heat to Fortum's grid at market price. The first customers will be able to sell surplus heat already in 2012. The aim is for all customers to be able to sell their surplus heat starting in 2013. Distribution According to a deal signed with Imatran Seudun Sähkö on 20 December 2011, Imatran Seudun Sähkö acquired Distribution's Estonian subsidiary Fortum Elekter. In connection with the agreement, Distribution also sold its ownership in Imatran Seudun Sähkö Oy. The deal was finalised at the beginning of January, 2012.
Shares and share capital Fortum Corporation is listed on the NASDAQ OMX Helsinki Ltd. During January-March 2012, a total of 157.2 (139.2) million Fortum Corporation shares, totalling EUR 2,776 million, were traded on the NASDAQ OMX Helsinki Ltd. The highest quotation of Fortum Corporation shares was EUR 19.36, the lowest EUR 15.74. The volume-weighted average was EUR 17.65. The closing quotation on the last trading day of the first quarter of 2012 was EUR 18.20 (23.96). Fortum's market capitalisation, calculated using the closing quotation of the last trading day of the quarter, was EUR 16,168 million. In addition to the NASDAQ OMX Helsinki Ltd., Fortum shares were traded on several alternative market places, for example at Chi-X, BATS, Boat and Turquoise. During the first quarter approximately 51% of Fortum’s traded shares were traded on alternative market places. In 2011, alternative market places accounted for approximately 50% of the total amount of Fortum Corporation shares traded. At the end of the first quarter of 2012, Fortum Corporation’s share capital was EUR 3,046,185,953 and the total number of registered shares was 888,367,045. Fortum Corporation did not hold any of its own shares at the end of the quarter. The number of registered shareholders totalled 111,816 at the end of March 2012. The Finnish State's holding in Fortum was 50.8% and the proportion of nominee registrations and direct foreign shareholders was 27.4% at the end of the quarter. The Board of Directors has no unused authorisations from the Annual General Meeting of Shareholders to issue convertible loans or bonds with warrants or to issue new shares.
Group personnel Fortum’s operations are mainly based in the Nordic countries, Russia, Poland and the Baltic countries. The total number of employees at the end of the first quarter of 2012 was 10,542 (10,976 at the end of the first quarter of 2011). The decrease in employees is related mainly to the Heat Division’s divestments. In the first quarter 2012, the Power Division had 1,842 (1,812) employees, the Heat Division 2,352 (2,770), the Russia Division 4,337 (4,418), Distribution 851 (888), Electricity Sales 516 (500) and Other 644 (588).
15 (49)

Research and development Sustainability is at the core of Fortum’s strategy, and Fortum's research and development activities promote environmentally benign energy solutions. During the first quarter of 2012 Fortum decided to invest in the commercialisation of new technology by building a bio-oil plant connected to the Joensuu power plant in Finland. The CHP-integrated bio-oil plant, based on fast pyrolysis technology, is the first of its kind in the world on an industrial scale. The new technology has been developed into a concept in cooperation between Metso, UPM, VTT (as part of the TEKES Biorefine research programme) and Fortum. The bio-oil plant, which will be integrated with the combined heat and power production plant (CHP) in Joensuu, will produce electricity and district heat, and in the future, 50,000 tonnes of bio-oil per year. The bio-oil raw materials will include forest residues and other wood-based biomass. In addition, a new research programme on efficient energy use (EFEU) was started by CLEEN Ltd. The value of the five-year programme is approximately EUR 12 million and it will be carried out by a wide group of equipment manufacturers, energy companies and research institutions. Energy efficiency presents the most important means in managing global climate change. Fortum's main activities in the EFEU programme include eco-efficient heating and cooling solutions, climate-benign electricity and heat production chains and new energy-efficiency service business models integrated to new technologies. The Group reports its R&D expenditure on a yearly basis. In 2011, Fortum’s R&D expenditure was EUR 38 million (2010: 30 million) or 0.6% of sales (2010: 0.5%) and 1.1% of total expenses (2010: 0.8%).
Sustainability Fortum strives for balanced management of economic, social and environmental responsibility in the company’s operations. The company's sustainability approach defines Group-level targets guiding operations and key indicators to monitor them. Based on these, the divisions set their division-level targets and indicators and outline the measures needed to achieve the targets. The company is listed on the Dow Jones Sustainability Index World (only Nordic utility in the index), and Fortum is also included in the STOXX Global ESG Leaders indices and in the NASDAQ OMX and GES Investment Service's new OMX GES Sustainability Finland index.
Economic responsibility In the area of economic responsibility, the focus is on competitiveness, performance excellence and market-driven production. The aim is to create long-term economic value and enable profitable growth and added value for shareholders, customers, employees, goods suppliers, and other key stakeholders in the company's operating areas. Fortum's goal is to achieve excellent financial performance in strategically selected core areas through strong competence and responsible ways of operating. The key figures by which Fortum measures its financial success include return on capital employed (target: 12%), return on shareholders' equity (target: 14%) and capital structure (target: comparable net debt/EBITDA around 3). In addition, Fortum also uses the applicable Global Reporting Initiative (GRI) G3.1 indicators for reporting economic responsibility. Environmental responsibility Fortum's environmental responsibility emphasises mitigation of climate change, efficient use of resources and management of impacts of our energy production, distribution and supply chain. Our know-how in CO2-free hydro and nuclear power production and in energy-efficient CHP production is highlighted in environmental responsibility. Fortum’s Group-level environmental targets are related to carbon-dioxide emissions, energy efficiency and environmental management system certifications.
16 (49)

17 (49)
In addition, the divisions have defined their own environmental goals related to their respective business. The achievements of the environmental targets are monitored through monthly, quarterly and annual reporting. Fortum’s climate targets over the next five years comprise specific CO2 emissions from power generation in the EU of below 80 grams per kilowatt-hour (g/kWh) and specific CO2 emissions from the total energy production (electricity and heat) of below 200 g/kWh, covering all operating countries. Both targets are calculated as a five-year average. At the end of March 2012, the five-year average for specific CO2 emissions from power generation in the EU was at 64 g/kWh and the specific CO2 emissions from the total energy production was at 173 g/kWh, both better than the target level. Fortum's total CO2 emissions in the first quarter of 2012 amounted to 6.6 (9.4) million tonnes (Mt), of which 1.8 (4.2) Mt were within the EU's emissions trading scheme (ETS). In the first quarter of 2012, approximately 65% (54%) of the power generated by Fortum was CO2-free. The corresponding figure for Fortum's generation within the EU was 90% (73%).The increased share of CO2-free power is mainly due to decreased production of coal-condensing power at the Inkoo and Meri-Pori coal-fired power plants. Overall efficiency of fuel use was 69% as a five-year average, the target is >70%. In the first quarter of 2012, 99% of all Fortum’s operations in the EU had ISO 14001 environmental certification. Fortum’s total CO2 emissions (million tonnes, Mt)
I/12 I/11 2011 LTM
Total emissions 6.6 9.4 23.5 20.7
Emissions subject to ETS 1.8 4.0 8.0 5.8
Free emissions allocation 6.8
Emissions in Russia 4.7 4.8 14.7 14.6 Fortum’s specific CO2 emissions from power generation (g/kWh)
I/12 I/11 2011 LTM
Total emissions 173 253 192 167
Emissions in the EU 60 175 88 53
Emissions in Russia 467 476 483 481
Social responsibility In the area of social responsibility, Fortum's innovations and the secure supply of low-carbon power and heat support the development of society and increase well-being. Good corporate citizenship and ensuring a safe working environment for all employees and contractors at Fortum sites are emphasised. A Group-level target has been defined for occupational safety. In addition to ISO 14001, the goal is to have OHSAS 18001 certification for all operational management systems. In the first quarter of 2012, the Group-level lost workday injury frequency (LWIF) continued at a good level at 1.3 (1.3). Fortum’s safety target is to reach a LWIF level that is less than one per million working hours for its own personnel. This reflects the Group’s zero tolerance for accidents. During the first quarter of 2012, Fortum joined the Better Coal Initiative, aiming for continuous improvement of corporate responsibility in the supply chain of coal.

Changes in Fortum’s Management Markus Rauramo (43), M.Sc., Political Sciences, has been appointed as the new Chief Financial Officer (CFO) at Fortum Corporation. He will be a member of Fortum Management Team and report to President and CEO Tapio Kuula. Markus Rauramo will join Fortum from Stora Enso, where he has held various managerial and leadership positions since 1993, most recently as CFO. Markus Rauramo will start at Fortum in August 2012 and as a CFO on 1 September 2012. Fortum’s long-time CFO, Juha Laaksonen, will retire according to his terms of employment at the beginning of 2013.
Annual General Meeting 2012 Fortum Corporation’s Annual General Meeting, which was held in Helsinki on 11 April 2012, adopted the financial statements of the parent company and the Group for 2011, discharged Fortum’s Supervisory Board from liability for the time period 1 January - 4 April 2011, and Fortum's Board of Directors as well as the President and CEO from liability for 2011. The Annual General Meeting decided to pay a dividend of EUR 1.00 per share for 2011. The record date for the dividend payment was 16 April 2012 and the dividend payment date was 23 April 2012. The Annual General Meeting confirmed the number of members in the Board of Directors to be seven. Sari Baldauf was re-elected as chairman and Christian Ramm-Schmidt as deputy chairman, and members Minoo Akhtarzand, Heinz-Werner Binzel, Ilona Ervasti-Vaintola and Joshua Larson were re-elected. Kim Ignatius was elected as a new member to the Board of Directors. The Annual General Meeting confirmed the annual compensation of EUR 75,000 per year to the chairman, EUR 57,000 per year to the deputy chairman and EUR 40,000 per year to each member of the Board, as well as EUR 57,000 per year to the chairman of the Audit and Risk Committee if he or she is not at the same time acting as chairman or deputy chairman. In addition, a EUR 600 fee is paid for Board meetings as well as for committee meetings. The meeting fee is doubled for Board members who live outside Finland but in Europe and tripled for members living elsewhere outside Finland. Members of the Board of Directors are compensated for travel expenses in accordance with the company’s travel policy. The Annual General Meeting also confirmed the appointment of a Nomination Board to prepare proposals concerning Board members and their remuneration for the following annual general meeting. The Nomination Board will consist of the representatives of the three main shareholders and, in addition, the chairman of the Board of Directors as an expert member. The Nomination Board will be convened by the chairman of the Board of Directors, and the Nomination Board will choose a chairman from among its own members. The Nomination Board shall give its proposal to the Board of Directors of the company at the latest by 1 February preceding the annual general meeting. In addition, Authorised Public Accountant Deloitte & Touche Oy was re-elected as auditor and the auditor’s fee is paid pursuant to an invoice approved by the company.
18 (49)

Outlook Key drivers and risks Fortum's financial results are exposed to a number of strategic, financial and operational risks. The key factor influencing Fortum's business performance is the wholesale price of electricity in the Nordic region. The key drivers behind the wholesale price development in the Nordic region are the supply-demand balance, fuel and CO2 emissions allowance prices as well as the hydrological situation. The continued global economic uncertainty and Europe's sovereign-debt crisis weaken the outlook for economic growth in the mid-term, especially in the Euro zone. The overall economic uncertainty impacts the commodity and CO2 emission allowance prices and in combination with the stronger hydrological situation in the Nordic region could maintain downward pressure on the Nordic wholesale price for electricity in the short term. In the Russian business, the key factors are the development of the regulation around electricity and capacity markets and operational risks related to the investment projects according to the investment programme. In all regions, fuel prices and power plant availability also impacts the profitability. In addition, increased volatility in exchange rates due to financial turbulence might have both translation and transaction effects on Fortum's financials especially through the SEK and RUB.
Nordic market Despite macroeconomic uncertainty, electricity will continue to gain a higher share of the total energy consumption. Fortum currently expects the average annual growth rate in electricity consumption to be about 0.5%, while the growth rate for the nearest years will largely be determined by the macroeconomic development in Europe and especially in the Nordic countries. The price of crude oil increased throughout the first quarter of 2012, whereas the coal price continued to weaken. After declining since summer of 2011, the price of CO2 emissions allowance (EUA) abated, and the price fluctuated between EUR 6.6 - 9.5 per tonne. The electricity forward prices for the upcoming twelve months declined both in the Nordic countries and in Germany during the quarter, mainly with a lower expected spot price for the summer. In late April 2012, the electricity forward price in Nord Pool for the rest of 2012 was around EUR 34 per MWh. The electricity forward price for 2013 was around EUR 40 per MWh and for 2014 around EUR 41 per MWh. In Germany, the electricity forward price for the rest of the year was around EUR 47 per MWh and EUR 51 per MWh for 2013. At the same time, the future quotations for coal (ICE Rotterdam) for the rest of 2012 were around USD 102 per tonne and the market price for CO2
emissions allowances (EUA) for 2012 was about EUR 7 per tonne. In late April 2012, Nordic water reservoirs were about 15 TWh above the long-term average and 29 TWh above the corresponding level of 2011.
Power The Power Division's Nordic power price typically depends on e.g. the hedge ratio, hedge price, spot prices, availability and utilisation of Fortum's flexible production portfolio, and currency fluctuations. Excluding the potential effects from the changes in the power generation mix, a 1 EUR/MWh change in the Power Division’s Nordic power sales price will result in an approximately EUR 45 million change in Fortum's annual comparable operating profit. In addition, the comparable operating profit of the Power Division will be affected by the possible thermal power generation amount and its profit. The ongoing Swedish nuclear investment programmes over several years will enhance safety, improve availability and increase the capacity of the current nuclear fleet. The implementation of the investment programmes might affect availability. Fortum’s power procurement costs from co-owned
19 (49)

20 (49)
nuclear companies are affected by these investment programmes by increasing depreciation and finance costs. European-wide safety evaluations have been carried out post Fukushima. As part of the evaluations, so-called peer reviews were carried out in March 2012 in several European nuclear power plants, including the Loviisa nuclear power plant. The European Commission will submit a consolidated report of the national reports to the European Council in June 2012. Fortum believes that some additional safety criteria could be introduced for nuclear power plants based on the evaluations and that they could be implemented for the Loviisa nuclear power plant within the framework of the annual investment programmes. According to the legislation in Sweden, nuclear waste fees and guarantees are updated at regular intervals. At the end of December 2011, the Government decided upon fees and guarantees for 2012-2014. The negative impact on Fortum’s comparable operating profit is estimated to be approximately EUR 15 million per year in 2012-2014. Nuclear fuel costs in all Fortum nuclear power plants are expected to increase in total by approximately EUR 15 million in 2012 due to the increased market price of uranium and enrichment.
Russia The Russian wholesale power market was liberalised from the beginning of 2011. All generating companies continue to sell a part of their electricity and capacity equalling the consumption of households and a special group of consumers (Northern Caucasus Republic, Tyva Republic, Buryat Republic) under regulated prices. The new rules for the capacity market starting from 2011 have been approved by the Russian Government. The generation capacity built after 2007 under government capacity supply agreements (CSA – “new capacity”) receive guaranteed payments for a period of 10 years. Prices for capacity under CSA are defined in order to ensure a sufficient return on investments. Capacity not under CSA competes in competitive capacity selection (CCS – “old capacity”). The capacity selection for 2012 was held in September 2011. The majority of Fortum’s power plants were selected in the auction, with a price level close to the level received in 2011. Approximately 4% (120 MW) of the old capacity was not allowed to participate in the selection due to tightened minimal technical requirements. It will, however, receive capacity payments at the capacity market price for two additional years. OAO Fortum's new capacity will be a key driver for earnings growth in Russia as it will bring income from new volumes sold and also receive considerably higher capacity payments than the old capacity. However, the received capacity payment will differ depending on age, the location, size and type of the plants as well as seasonality and availability. Especially the old capacity payments for CHP power plants are burdened during the summer period due to the temperature constraints evolving from lower heat demand. Fortum is planning to commission the last new units by the end of 2014 of its EUR 2.5 billion investment programme. The value of the remaining part of the investment programme, calculated at exchange rates prevailing at the end of March 2012, is estimated to be approximately EUR 0.9 billion as of April 2012. The return for the new capacity is guaranteed as regulated in the Capacity Supply Agreement. The regulator reviews the earnings from the electricity-only market after three years and six years and could revise the CSA payments accordingly. CSA payments can vary annually somewhat because they are linked to Russian Government long-term bonds with 8 to 10 years maturity. Fortum currently estimates the commissioning of the new units Nyagan 1 and Nyagan 2 to be postponed by some months due to a construction delay. Fortum has made a provision (per unit) for penalties caused by possible commissioning delays, already in 2008. According to the agreement with the contractor, Fortum is entitled to adequate remedies in case of damages due to delays caused by the contractor.

21 (49)
After completing the ongoing investment programme in 2015, Fortum’s goal is to achieve an operating profit level of about EUR 500 million in its Russia Division and to create positive economic added value in Russia. The Russian Government decided that gas prices will increase beginning 1 July 2012; the increase is expected to be 15%. On the other hand, prices for regulated electricity sales, heat sales and CCS capacity income will be indexed at rates lower than in 2011.
Capital expenditure and divestments Fortum currently expects its capital expenditure in 2012 to be around EUR 1.6-1.8 billion and in 2013-2014 around EUR 1.1 -1.4 billion, excluding potential acquisitions. The main reason for the high capital expenditures in 2012 is the acceleration of Fortum's Russian investment programme. The annual maintenance capital expenditure is estimated to be about EUR 500-550 million in 2012, approximately at the level of depreciation.
Taxation The effective corporate tax rate for Fortum in 2012 is estimated to be 19-21%, excluding the impact of the share of profits of associated companies and joint ventures, non-taxable capital gains and non-recurring items. In Finland, the corporate tax rate was decreased to 24.5% from 26% starting 1 January 2012. In March 2012, the Finnish Government announced that a so-called windfall tax will be introduced in 2014. The process to update the real-estate taxation values for the year 2013 is ongoing in Sweden. The update is done in a cycle of six years.
Hedging At the end of March 2012, approximately 70% of the Power Division's estimated Nordic power sales volume was hedged at approximately EUR 48 per MWh for the rest of the calendar year 2012. The corresponding figures for the calendar year 2013 were about 45% at approximately EUR 46 per MWh. The hedge price for Fortum Power Division's Nordic generation excludes hedging of condensing power margin. In addition, the hedge ratio excludes the financial hedges and physical volume of Fortum's coal-condensing generation as well as the division’s imports from Russia. The reported hedge ratios may vary significantly, depending on Fortum's actions on the electricity derivatives markets. Hedges are mainly financial contracts, most of them Nord Pool forwards.

Dividend Payment The Annual General Meeting decided to pay a dividend of EUR 1.00 per share for 2011. The record date for the dividend payment was 16 April 2012 and the dividend payment date was 23 April 2012. Espoo, 25 April 2012 Fortum Corporation Board of Directors Further information: Tapio Kuula, President and CEO, tel. +358 10 452 4112 Juha Laaksonen, CFO, tel. +358 10 452 4519 Fortum’s Investor Relations, Sophie Jolly, +358 10 453 2552, Rauno Tiihonen, +358 10 453 6150 and Janna Haahtela, +358 10 453 2538 / [email protected] The condensed interim financial statements have been prepared in accordance with International Accounting Standard (IAS) 34, Interim Financial Reporting, as adopted by the EU. The interim financials have not been audited. Publication of financial results in 2012:
- Interim Report January – June on 19 July 2012 at approximately 9:00 EEST - Interim Report January – September on 19 October 2012 at approximately 9:00 EEST
Distribution: NASDAQ OMX Helsinki Key media www.fortum.com More information, including detailed quarterly information, is available on Fortum’s website at www.fortum.com/investors.
Tables to the interim financial statements Page Condensed consolidated income statement 23 Condensed consolidated balance sheet 25 Condensed consolidated statement of changes in total equity 26 Condensed consolidated cash flow statement 27 Change in net debt and key ratios 30 Notes to the condensed consolidated interim financial statements 31 Definition of key figures 45 Market conditions and achieved power prices 47 Production and sales volumes 48
22 (49)

Fortum CorporationJanuary-March 2012Interim Financial Statements are unaudited
EUR million Note Q1 2012 Q1 2011 2011
Last twelve
months
Sales 4 1,901 2,034 6,161 6,028Other income 14 13 91 92Materials and services -801 -951 -2,566 -2,416Employee benefit costs -138 -130 -529 -537Depreciation, amortisation and impairment charges 4,12,13 -158 -149 -606 -615Other expenses -167 -168 -749 -748Comparable operating profit 651 649 1,802 1,804Items affecting comparability 85 251 600 434Operating profit 736 900 2,402 2,238Share of profit/loss of associates and joint ventures 4, 14 -7 59 91 25
Interest expense -76 -62 -284 -298Interest income 14 15 56 55Fair value gains and losses on financial instruments -7 -1 5 -1Other financial expenses - net -7 -7 -42 -42
Finance costs - net -76 -55 -265 -286Profit before income tax 653 904 2,228 1,977Income tax expense 9 -119 -158 -366 -327Profit for the period 534 746 1,862 1,650
Attributable to:Owners of the parent 495 678 1,769 1,586Non-controlling interests 39 68 93 64
534 746 1,862 1,650
Earnings per share (in € per share) 10Basic 0.56 0.76 1.99 1.79Diluted 0.56 0.76 1.99 1.79
EUR million Q1 2012 Q1 2011 2011
Last twelve
months
Comparable operating profit 651 649 1,802 1,804Non-recurring items (capital gains and losses) 110 82 284 312
Changes in fair values of derivatives hedging future cash flow -16 173 344 155Nuclear fund adjustment -9 -4 -28 -33Items affecting comparability 85 251 600 434
Operating profit 736 900 2,402 2,238
Condensed consolidated income statement
23

Fortum CorporationJanuary-March 2012
EUR million Q1 2012 Q1 2011 2011 2010
Profit for the period 534 746 1,862 1,354
Other comprehensive incomeCash flow hedges
Fair value gains/losses in the period 66 50 299 -583Transfers to income statement -32 232 480 1Transfers to inventory/fixed assets -2 0 -23 -16Tax effect -9 -74 -195 151
Net investment hedgesFair value gains/losses in the period 0 -1 2 -1Tax effect 0 0 0 0
Available for sale financial assetsFair value changes in the period 0 0 -1 0
Exchange differences on translating foreign operations 214 38 -75 344Share of other comprehensive income of associates 1)
-12 21 2 -69Other changes -1 1 3 -16Other comprehensive income for the period, net of tax 224 267 492 -189Total comprehensive income for the year 758 1,013 2,354 1,165
Total comprehensive income attributable to Owners of the parent 714 939 2,255 1,064Non-controlling interests 44 74 99 101
758 1,013 2,354 1,165
- 6 0 -77
Condensed consolidated statement of comprehensive income
1) Of which fair value change in Hafslund ASA's shareholding in REC incl. translation differences
24

Fortum CorporationJanuary-March 2012
EUR million NoteMarch 31
2012March 31
2011Dec 31
2011
ASSETSNon-current assetsIntangible assets 12 455 435 433Property, plant and equipment 13 15,541 14,717 15,234Participations in associates and joint ventures 4, 14 2,039 2,129 2,019Share in State Nuclear Waste Management Fund 17 659 634 653Pension assets 60 65 60Other non-current assets 69 73 69Deferred tax assets 150 152 150Derivative financial instruments 6 401 124 396Long-term interest-bearing receivables 1,228 1,168 1,196Total non-current assets 20,602 19,497 20,210
Current assetsInventories 479 318 528Derivative financial instruments 6 385 156 326Trade and other receivables 1,079 1,189 1,020 Bank deposits - 158 - Cash and cash equivalents 1,574 1,171 731Liquid funds 16 1,574 1,329 731Assets held for sale 1)
7 - 128 183Total current assets 3,517 3,120 2,788
Total assets 24,119 22,617 22,998
EQUITYEquity attributable to owners of the parentShare capital 15 3,046 3,046 3,046Share premium 73 73 73Retained earnings 7,019 5,274 6,318Other equity components 208 -134 195Total 10,346 8,259 9,632Non-controlling interests 573 605 529Total equity 10,919 8,864 10,161
LIABILITIESNon-current liabilitiesInterest-bearing liabilities 16 7,192 6,557 6,845Derivative financial instruments 6 179 200 192Deferred tax liabilities 2,038 1,825 2,013Nuclear provisions 17 659 634 653Other provisions 18 220 246 205Pension obligations 25 28 26Other non-current liabilities 466 464 465Total non-current liabilities 10,779 9,954 10,399
Current liabilitiesInterest-bearing liabilities 16 905 1,139 925Derivative financial instruments 6 293 570 219Trade and other payables 2)
1,223 2,090 1,265Liabilities related to assets held for sale 7 - - 29Total current liabilities 2,421 3,799 2,438
Total liabilities 13,200 13,753 12,837
Total equity and liabilities 24,119 22,617 22,998
2)Trade and other payables as of 31 March 2011 includes dividends EUR 888 million that were paid in April 2011. Dividends for 2011 were decided in the Annual General Meeting held in April 2012 and therefore no bookings have been made for Q1 2012.
Condensed consolidated balance sheet
1) Assets held for sale as of 31 December 2011 includes cash balances of EUR 16 million.
25

Fortum CorporationJanuary-March 2012
Share capital
Share premium
Retained earnings Other equity components Owners of the
parent
Non-controllin
g interests
Total equity
EUR million
Retained earnings
and other funds
Translation of foreign
operations
Cash flow hedges
Other OCI items
OCI items associated companies
Total equity 31 December 2011 3,046 73 6,670 -352 136 -2 61 9,632 529 10,161Net profit for the period 495 495 39 534Translation differences 205 2 207 7 214Other comprehensive income 1 23 -12 12 -2 10Total comprehensive income for the period 496 205 25 0 -12 714 44 758Total equity 31 March 2012 3,046 73 7,166 -147 161 -2 49 10,346 573 10,919
Total equity 31 December 2010 3,046 73 5,726 -278 -419 0 62 8,210 532 8,742Net profit for the period 678 678 68 746Translation differences 35 35 3 38Other comprehensive income 1 205 -1 21 226 3 229Total comprehensive income for the period 679 35 205 -1 21 939 74 1,013Cash dividend -888 -888 -888
Dividends to non-controlling interests 0 0Changes due to business combinations -2 -2 -1 -3Total equity 31 March 2011 3,046 73 5,517 -243 -214 -3 83 8,259 605 8,864
Total equity 31 December 2010 3,046 73 5,726 -278 -419 0 62 8,210 532 8,742Net profit for the period 1,769 1,769 93 1,862Translation differences -74 -74 -74Other comprehensive income 6 555 -1 560 6 566Total comprehensive income for the period 1,775 -74 555 0 -1 2,255 99 2,354Cash dividend -888 -888 -888
Dividends to non-controlling interests 0 -21 -21Changes due to business combinations 54 -2 52 -81 -29Other 3 3 3Total equity 31 December 2011 3,046 73 6,670 -352 136 -2 61 9,632 529 10,161
Translation differences impacted equity attributable to owners of the parent company with EUR 207 million during Q1 2012 (Q1 2011: 35) mainly relating to RUB amounting to EUR 181 million in Q1 2012 (Q1 2011: 42).
Translation of financial information from subsidiaries in foreign currency is done using average rate for the income statement and end rate for the balance sheet. The exchange rate differences occurring from translation to EUR are booked to equity. For information regarding exchange rates used, see Note 8 Exchange rates.
Condensed consolidated statement of changes in total equity
The impact on equity attributable to owners of the parent from fair valuation of cash flow hedges, EUR 23 million during Q1 2012 (Q1 2011: 205), mainly relates to cash flow hedges hedging electricity price for future transactions, where hedge accounting is applied. When electricity price is lower/higher than the hedging price, the impact on equity is positive/negative.
Cash dividend
Cash flow hedges
The dividend for 2011 was decided at the Annual General Meeting on 11 April 2012. These Financial statements do not reflect this dividend.The dividend was paid on 23 April 2012. The dividend for 2010 was decided at the Annual General Meeting on 31 March 2011. In Q1 2011 the total dividend was included in the trade and other payables. See Note 11 Dividend per share.
Translation differences
26
Fortum CorporationJanuary-March 2012
EUR million Q1 2012 Q1 2011 2011
Last twelve
months
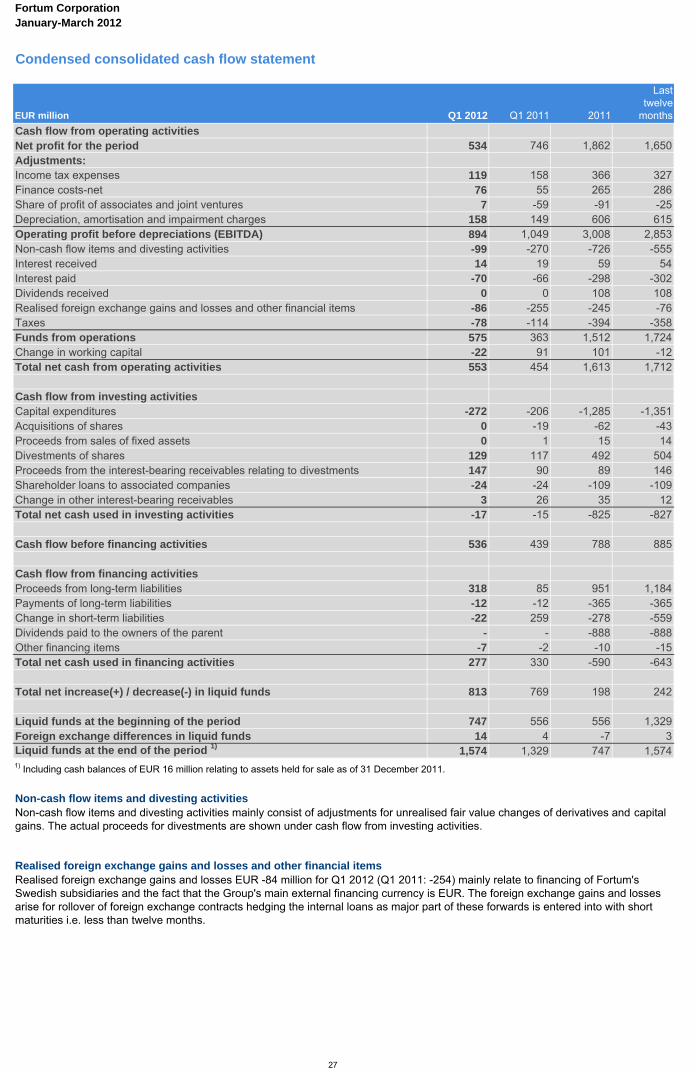
Cash flow from operating activitiesNet profit for the period 534 746 1,862 1,650Adjustments:Income tax expenses 119 158 366 327Finance costs-net 76 55 265 286Share of profit of associates and joint ventures 7 -59 -91 -25Depreciation, amortisation and impairment charges 158 149 606 615Operating profit before depreciations (EBITDA) 894 1,049 3,008 2,853Non-cash flow items and divesting activities -99 -270 -726 -555Interest received 14 19 59 54Interest paid -70 -66 -298 -302Dividends received 0 0 108 108Realised foreign exchange gains and losses and other financial items -86 -255 -245 -76Taxes -78 -114 -394 -358Funds from operations 575 363 1,512 1,724Change in working capital -22 91 101 -12Total net cash from operating activities 553 454 1,613 1,712
Cash flow from investing activitiesCapital expenditures -272 -206 -1,285 -1,351Acquisitions of shares 0 -19 -62 -43Proceeds from sales of fixed assets 0 1 15 14Divestments of shares 129 117 492 504Proceeds from the interest-bearing receivables relating to divestments 147 90 89 146Shareholder loans to associated companies -24 -24 -109 -109Change in other interest-bearing receivables 3 26 35 12Total net cash used in investing activities -17 -15 -825 -827
Cash flow before financing activities 536 439 788 885
Cash flow from financing activitiesProceeds from long-term liabilities 318 85 951 1,184Payments of long-term liabilities -12 -12 -365 -365Change in short-term liabilities -22 259 -278 -559Dividends paid to the owners of the parent - - -888 -888Other financing items -7 -2 -10 -15Total net cash used in financing activities 277 330 -590 -643
Total net increase(+) / decrease(-) in liquid funds 813 769 198 242 Liquid funds at the beginning of the period 747 556 556 1,329Foreign exchange differences in liquid funds 14 4 -7 3Liquid funds at the end of the period 1) 1,574 1,329 747 1,574
Non-cash flow items and divesting activities
Realised foreign exchange gains and losses and other financial items
Non-cash flow items and divesting activities mainly consist of adjustments for unrealised fair value changes of derivatives and capital gains. The actual proceeds for divestments are shown under cash flow from investing activities.
Realised foreign exchange gains and losses EUR -84 million for Q1 2012 (Q1 2011: -254) mainly relate to financing of Fortum's Swedish subsidiaries and the fact that the Group's main external financing currency is EUR. The foreign exchange gains and losses arise for rollover of foreign exchange contracts hedging the internal loans as major part of these forwards is entered into with short maturities i.e. less than twelve months.
Condensed consolidated cash flow statement
1) Including cash balances of EUR 16 million relating to assets held for sale as of 31 December 2011.
27

Fortum CorporationJanuary-March 2012
Change in working capital
EUR million Q1 2012 Q1 2011 2011
Last twelve
months
Change in interest-free receivables, decrease (+)/increase (-) -63 82 266 121Change in inventories, decrease (+)/increase (-) 54 75 -143 -164Change in interest-free liabilities, decrease (-)/increase (+) -13 -66 -22 31Total -22 91 101 -12
Capital expenditure in cash flow
EUR million Q1 2012 Q1 2011 2011
Last twelve
months
Capital expenditure 218 167 1,408 1,459Change in not yet paid investments 72 51 -70 -49Capitalised borrowing costs -18 -12 -53 -59Total 272 206 1,285 1,351
Acquisition of shares in cash flow
EUR million Q1 2012 Q1 2011 2011
Last twelve
months
Acquisition of subsidiaries, net of cash acquired 0 19 44 25
Acquisition of associates 1) - 0 16 16
Acquisition of available for sale financial assets 2) 0 0 2 2Total 0 19 62 43
Acquisition of shares in subsidiaries, net of cash acquired
EUR million Q1 2012 Q1 2011 2011
Last twelve
months
Gross investments of shares 0 22 47 25Changes in not yet paid acquisitions - -2 -2 0Interest bearing debt in acquired subsidiaries - -1 -1 0Total 0 19 44 25
Acquisition of shares in associates
EUR million Q1 2012 Q1 2011 2011
Last twelve
months
Gross investments of shares - 16 25 9Changes in not yet paid acquisitions - -16 -9 7Total - 0 16 16
Capital expenditures for intangible assets and property, plant and equipment were EUR 218 million (31 March 2011: 167). Capital expenditure in cash flow EUR 272 million in Q1 2012 (Q1 2011: 206) is presented without not yet paid investments i.e. change in trade payables related to investments EUR 72 million (Q1 2011: 51) and capitalised borrowing costs EUR 18 million (Q1 2011: 12), which are presented in interest paid.
Additional cash flow information
Negative effect from change in working capital during Q1 2012, EUR -22 million (Q1 2011: 91) is mainly due to increase of trade receivables, which is partly offset by decrease of fuel inventories.
1) Acquisition of associates includes share issues and other capital contributions.2) Available for sale financial assets are presented under Other non-current assets in the Balance sheet.
28

Fortum CorporationJanuary-March 2012
Additional cash flow information
Divestment of shares in cash flow
EUR million Q1 2012 Q1 2011 2011
Last twelve
months
Proceeds from sales of subsidiaries, net of cash disposed 126 110 117 133Proceeds from sales of associates 3 7 375 371Total 129 117 492 504
Gross divestment of shares in subsidiaries totalled EUR 295 million in Q1 2012 (Q1 2011: 200) including interest-bearing debt in sold subsidiaries of EUR 169 million (Q1/2011: 90), see Note 7. Proceeds from divestments of shares totalled EUR 129 million in Q1 2012 (Q1 2011: 117) including EUR 79 million related to divestment of certain heat businesses in Finland and Estonia (Fortum Energiaratkaisut Oy and Fortum Termest AS) and EUR 34 million related to divestment of small hydropower plants in Finland.
29

Fortum CorporationJanuary-March 2012
EUR million Q1 2012 Q1 2011 2011
Last twelve
months
Net debt beginning of the period 7,023 6,826 6,826 6,367Foreign exchange rate differences 29 6 7 30 EBITDA 894 1,049 3,008 2,853 Paid net financial costs, taxes and adjustments for non-cash and divestment items -319 -686 -1,496 -1,129 Change in working capital -22 91 101 -12 Capital expenditures -272 -206 -1,285 -1,351 Acquisitions 0 -19 -62 -43 Divestments 129 118 507 518 Proceeds from the interest-bearing receivables relating to divestments 147 90 89 146 Shareholder loans to associated companies -24 -24 -109 -109 Change in other interest-bearing receivables 3 26 35 12 Dividends - - -888 -888 Other financing activities -7 -2 -10 -15Net cash flow (- increase in net debt) 529 437 -110 -18
Fair value change of bonds, amortised cost valuation and other 0 -28 80 108Net debt end of period 6,523 6,367 7,023 6,523
March 312012
Dec 312011
Sept 302011
June 302011
March 312011
Last twelve
months
EBITDA, EUR million 894 3,008 2,274 1,813 1,049 2,853Comparable EBITDA, EUR million 809 2,374 1,723 1,279 798 2,385
Earnings per share (basic), EUR 0.56 1.99 1.52 1.29 0.76 1.79
Capital employed, EUR million 19,016 17,931 17,034 16,998 16,560 N/AInterest-bearing net debt, EUR million 6,523 7,023 6,929 6,783 6,367 N/A
Capital expenditure and gross investments in shares, EUR million 218 1,482 962 572 205 1,495Capital expenditure, EUR million 218 1,408 899 533 167 1,459
Return on capital employed, % 1)14.5 14.8 14.3 16.1 19.1 12.8
Return on shareholders' equity, % 1)17.9 19.7 19.1 22.0 26.9 16.7
Net debt / EBITDA 1)2.0 2.3 2.4 2.2 1.8 2.3
Comparable net debt / EBITDA 1)2.0 3.0 3.0 2.7 2.0 2.7
Interest coverage 11.9 10.5 11.2 14.8 19.0 9.2Interest coverage including capitalised borrowing costs 9.2 8.5 9.1 12.0 15.1 7.4
Funds from operations/interest-bearing net debt, % 1)39.1 21.5 20.7 24.2 34.8 26.4
Gearing, % 60 69 74 72 72 N/AEquity per share, EUR 11.65 10.84 10.05 9.93 9.30 N/AEquity-to-assets ratio, % 45 44 44 44 39 N/A
Number of employees 10,542 10,780 11,041 11,342 10,976 N/AAverage number of employees 10,587 11,010 11,062 11,030 10,913 N/A
Average number of shares, 1 000 shares 888,367 888,367 888,367 888,367 888,367 888,367
Diluted adjusted average number of shares, 1 000 shares 888,367 888,367 888,367 888,367 888,367 888,367Number of registered shares, 1 000 shares 888,367 888,367 888,367 888,367 888,367 888,367
Change in net debt
1) Quarterly figures are annualised except items affecting comparability. For definitions, see Note 26.
Key ratios
30

Fortum Corporation Notes to the condensed consolidated interim financial statementsJanuary-March 2012
Sales
EUR million Q1 2012 Q1 2011 2011
Last twelve
months
Power sales excluding indirect taxes 948 1,034 3,458 3,372Heating sales 604 671 1,602 1,535Network transmissions 296 299 905 902Other sales 53 30 196 219Total 1,901 2,034 6,161 6,028
Sales by segment
EUR million Q1 2012 Q1 2011 2011
Last twelve
months
Power 1) 655 693 2,481 2,443- of which internal 47 -103 -24 126Heat 1) 625 725 1,737 1,637- of which internal 9 -1 8 18Russia 310 295 920 935- of which internal - - - -Distribution 308 311 973 970- of which internal 10 4 15 21Electricity Sales 1) 247 373 900 774- of which internal 26 49 95 72Other 1) 44 30 108 122- of which internal 8 78 115 45Netting of Nord Pool transactions 2) -188 -366 -749 -571Eliminations -100 -27 -209 -282Total 1,901 2,034 6,161 6,028
3. Critical accounting estimates and judgements
The same accounting policies and presentation have been followed in these condensed interim financial statements as were applied in the preparation of the consolidated financial statements as at and for the year ended 31 December 2011.
1) Sales, both internal and external, includes effects from realised hedging contracts. Effect on sales can be negative or positive depending on the average contract price and realised spot price. 2) Sales and purchases with Nord Pool Spot is netted on Group level on an hourly basis and posted either as revenue or cost depending on if Fortum is a net seller or net buyer during any particular hour.
2. Accounting policies
Notes to the condensed consolidated interim financial statements
1. Basis of preparationThe condensed interim financial statements have been prepared in accordance with International Accounting Standard (IAS) 34, Interim Financial Reporting, as adopted by the EU. The condensed interim financial report should be read in conjunction with the annual financial statements for the year ended 31 December 2011.
The preparation of interim financial statements requires management to make judgements, estimates and assumptions that affect the reported amounts of assets and liabilities, income and expense. Actual results may differ from these estimates.
In preparing these interim financial statements, the significant judgements made by management in applying the Group's accounting policies and the key sources of estimation uncertainty were the same as those that applied to the consolidated financial statements as at and for the year ended 31 December 2011.
4. Segment information
31

Fortum Corporation Notes to the condensed consolidated interim financial statementsJanuary-March 2012
Comparable operating profit by segment
EUR million Q1 2012 Q1 2011 2011
Last twelve
months
Power 341 325 1,201 1,217Heat 161 171 278 268Russia 48 34 74 88Distribution 110 124 295 281Electricity Sales 9 11 27 25Other -18 -16 -73 -75Total 651 649 1,802 1,804
Operating profit by segment
EUR million Q1 2012 Q1 2011 2011
Last twelve
months
Power 367 489 1,476 1,354Heat 213 265 380 328Russia 48 34 74 88Distribution 117 125 478 470Electricity Sales 11 -20 3 34Other -20 7 -9 -36Total 736 900 2,402 2,238
Non-recurring items by segment
EUR million Q1 2012 Q1 2011 2011
Last twelve
months
Power 1) 47 0 2 49Heat 2) 58 80 86 64Russia 0 0 0 0Distribution 5 1 193 197Electricity Sales - 1 3 2Other 0 - 0 0Total 110 82 284 312
Other items affecting comparability by segment
EUR million Q1 2012 Q1 2011 2011
Last twelve
months
Power 1) -21 164 273 88Heat -6 14 16 -4Russia - - - -Distribution 2 0 -10 -8Electricity Sales 2 -32 -27 7Other -2 23 64 39Total -25 169 316 122
-9 -4 -28 -33
Non-recurring items include capital gains and losses.
1) Non-recurring items in Power segment in Q1 2012 include a gain of EUR 47 million recognised on the divestment of small hydropower plants in Finland. 2) Non-recurring items in Heat segment in Q1 2012 include a gain of EUR 58 million recognised on the divestment of certain heat businesses (Fortum Energiaratkaisut Oy and Fortum Termest AS).
1) Including effects from the accounting of Fortum's part of the Finnish State Nuclear Waste Management Fund with (EUR million):
Other items affecting comparability mainly include effects from financial derivatives hedging future cash-flows where hedge accounting is not applied according to IAS 39. Other segment includes mainly the effect arising from changes in hedge accounting status on group level. In Power segment there are also effects from the accounting of Fortum's part of the Finnish State Nuclear Waste Management Fund where the asset in the balance sheet cannot exceed the related liabilities according to IFRIC interpretation 5.
32
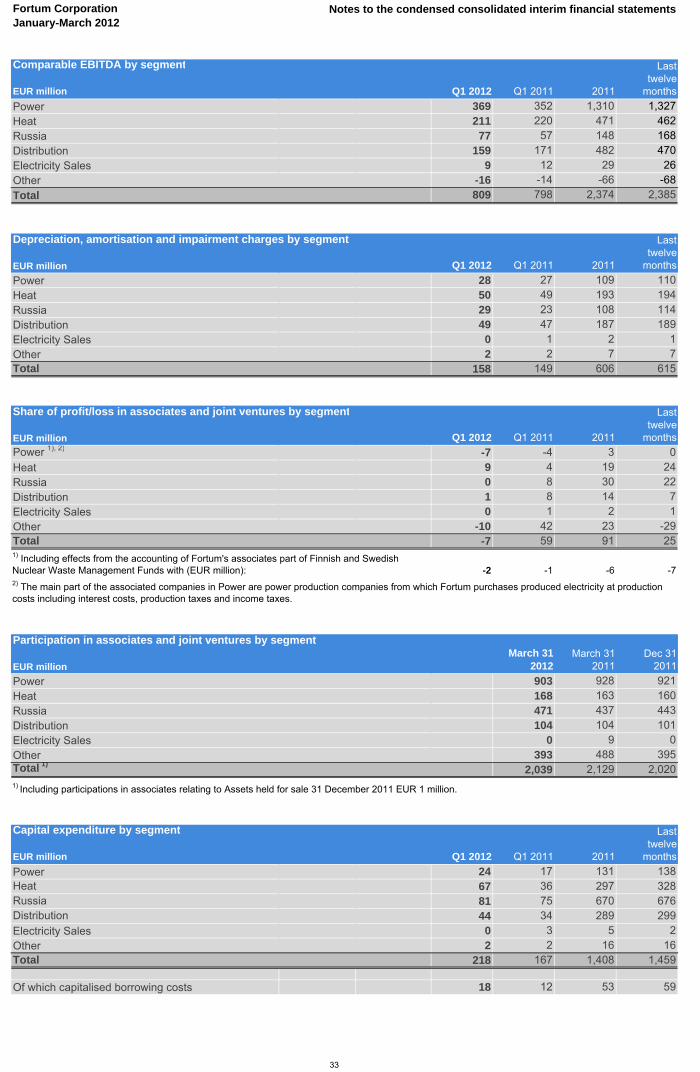
Fortum Corporation Notes to the condensed consolidated interim financial statementsJanuary-March 2012
Comparable EBITDA by segment
EUR million Q1 2012 Q1 2011 2011
Last twelve
months
Power 369 352 1,310 1,327Heat 211 220 471 462Russia 77 57 148 168Distribution 159 171 482 470Electricity Sales 9 12 29 26Other -16 -14 -66 -68
Total 809 798 2,374 2,385
Q1 2012 Q1 2011 2011
Last twelve
months
Power 28 27 109 110Heat 50 49 193 194Russia 29 23 108 114Distribution 49 47 187 189Electricity Sales 0 1 2 1Other 2 2 7 7Total 158 149 606 615
Q1 2012 Q1 2011 2011
Last twelve
months
Power 1), 2) -7 -4 3 0Heat 9 4 19 24Russia 0 8 30 22Distribution 1 8 14 7Electricity Sales 0 1 2 1Other -10 42 23 -29Total -7 59 91 25
-2 -1 -6 -7
March 312012
March 312011
Dec 312011
Power 903 928 921Heat 168 163 160Russia 471 437 443Distribution 104 104 101Electricity Sales 0 9 0Other 393 488 395Total 1)
2,039 2,129 2,020
Capital expenditure by segment
EUR million Q1 2012 Q1 2011 2011
Last twelve
months
Power 24 17 131 138Heat 67 36 297 328Russia 81 75 670 676Distribution 44 34 289 299Electricity Sales 0 3 5 2Other 2 2 16 16Total 218 167 1,408 1,459
Of which capitalised borrowing costs 18 12 53 59
1) Including effects from the accounting of Fortum's associates part of Finnish and Swedish Nuclear Waste Management Funds with (EUR million):
Participation in associates and joint ventures by segment
EUR million
2) The main part of the associated companies in Power are power production companies from which Fortum purchases produced electricity at production costs including interest costs, production taxes and income taxes.
1) Including participations in associates relating to Assets held for sale 31 December 2011 EUR 1 million.
Depreciation, amortisation and impairment charges by segment
EUR million
Share of profit/loss in associates and joint ventures by segment
EUR million
33

Fortum Corporation Notes to the condensed consolidated interim financial statementsJanuary-March 2012
Gross investments in shares by segment
EUR million Q1 2012 Q1 2011 2011
Last twelve
months
Power 0 16 17 1Heat 0 22 32 10Russia 0 0 24 24Distribution - - - -Electricity Sales - - - -Other 0 0 1 1Total 0 38 74 36
Gross divestments in shares by segment
EUR million Q1 2012 Q1 2011 2011
Last twelve
months
Power 63 0 3 66Heat 195 199 203 199Russia 0 0 23 23Distribution 37 1 323 359Electricity Sales - 5 16 11Other 0 - 0 0Total 295 205 568 658
Net assets by segment
EUR millionMarch 31
2012March 31
2011Dec 31
2011
Power 6,117 5,996 6,247Heat 4,171 4,030 4,191Russia 3,547 2,918 3,273Distribution 3,641 3,711 3,589Electricity Sales 56 130 11Other 230 345 208Total 17,762 17,130 17,519
Comparable return on net assets by segment
%
Last twelve
monthsDec 31
2011
Power 20.1 19.9Heat 7.2 7.4Russia 3.5 3.5Distribution 8.0 8.6Electricity Sales 44.6 33.5Other -27.4 -12.7
Return on net assets by segment
%
Last twelve
monthsDec 31
2011
Power 22.3 24.6Heat 8.7 9.9Russia 3.5 3.5Distribution 13.3 13.7Electricity Sales 53.6 4.2Other -20.2 5.3
Gross investments in shares in Q1 2011 in Power segment include additional share capital paid to Teollisuuden Voima Oyj. See Note 14. In January 2011 Heat segment invested in two Polish 's companies. See Note 7 for additional information.
Return on net assets is calculated by dividing the sum of operating profit and share of profit of associated companies and joint ventures with average net assets. Average net assets are calculated using the opening balance and end of each quarter values.
34
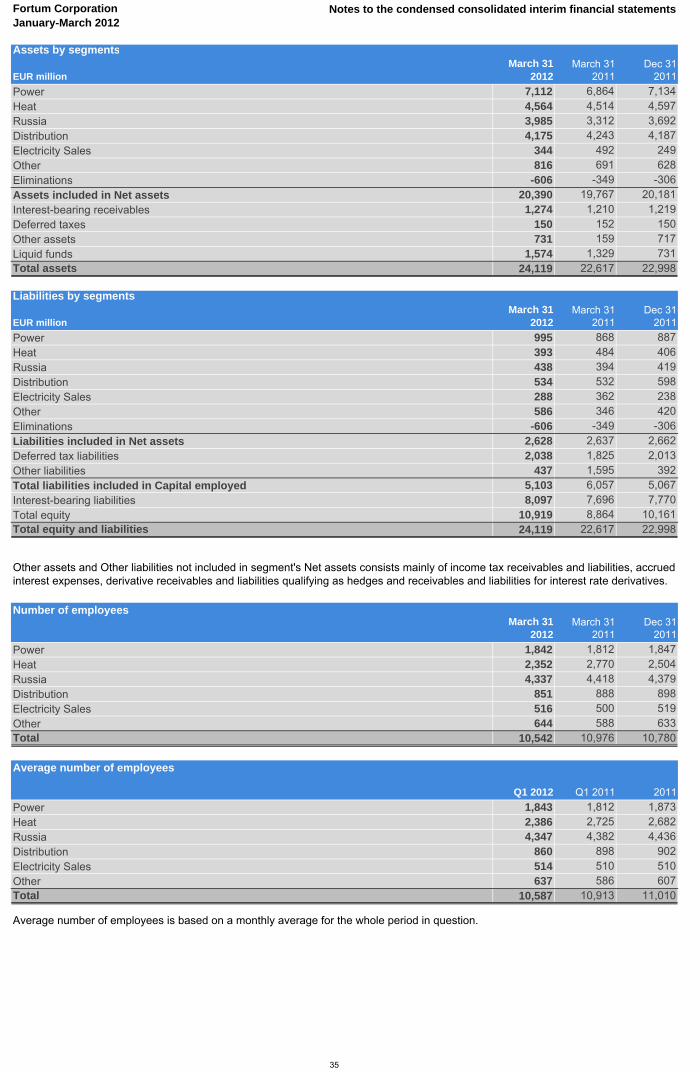
Fortum Corporation Notes to the condensed consolidated interim financial statementsJanuary-March 2012
Assets by segments
EUR millionMarch 31
2012March 31
2011Dec 31
2011
Power 7,112 6,864 7,134Heat 4,564 4,514 4,597Russia 3,985 3,312 3,692Distribution 4,175 4,243 4,187Electricity Sales 344 492 249Other 816 691 628Eliminations -606 -349 -306Assets included in Net assets 20,390 19,767 20,181Interest-bearing receivables 1,274 1,210 1,219Deferred taxes 150 152 150Other assets 731 159 717Liquid funds 1,574 1,329 731Total assets 24,119 22,617 22,998
Liabilities by segments
EUR millionMarch 31
2012March 31
2011Dec 31
2011
Power 995 868 887Heat 393 484 406Russia 438 394 419Distribution 534 532 598Electricity Sales 288 362 238Other 586 346 420Eliminations -606 -349 -306Liabilities included in Net assets 2,628 2,637 2,662Deferred tax liabilities 2,038 1,825 2,013Other liabilities 437 1,595 392Total liabilities included in Capital employed 5,103 6,057 5,067Interest-bearing liabilities 8,097 7,696 7,770Total equity 10,919 8,864 10,161Total equity and liabilities 24,119 22,617 22,998
Number of employeesMarch 31
2012March 31
2011Dec 31
2011
Power 1,842 1,812 1,847Heat 2,352 2,770 2,504Russia 4,337 4,418 4,379Distribution 851 888 898Electricity Sales 516 500 519Other 644 588 633Total 10,542 10,976 10,780
Average number of employees
Q1 2012 Q1 2011 2011
Power 1,843 1,812 1,873Heat 2,386 2,725 2,682Russia 4,347 4,382 4,436Distribution 860 898 902Electricity Sales 514 510 510Other 637 586 607Total 10,587 10,913 11,010
Other assets and Other liabilities not included in segment's Net assets consists mainly of income tax receivables and liabilities, accrued interest expenses, derivative receivables and liabilities qualifying as hedges and receivables and liabilities for interest rate derivatives.
Average number of employees is based on a monthly average for the whole period in question.
35

Fortum Corporation Notes to the condensed consolidated interim financial statements
January-March 2012
Quarterly sales by segment
EUR million
Q12012
Q42011
Q32011
Q22011
Q12011
Power 655 654 560 574 693- of which internal 47 68 35 -24 -103Heat 625 478 212 322 725- of which internal 9 6 2 1 -1Russia 310 274 156 195 295- of which internal - - - - -Distribution 308 244 203 215 311- of which internal 10 4 3 4 4Electricity Sales 247 205 139 183 373- of which internal 26 13 11 22 49Other 44 32 27 19 30- of which internal 8 -5 3 39 78Netting of Nord Pool transactions -188 -134 -99 -150 -366Eliminations -100 -86 -54 -42 -27Total 1,901 1,667 1,144 1,316 2,034
Q12012
Q42011
Q32011
Q22011
Q12011
Power 341 351 268 257 325Heat 161 96 -14 25 171Russia 48 35 -16 21 34Distribution 110 49 62 60 124Electricity Sales 9 2 4 10 11Other -18 -25 -7 -25 -16Total 651 508 297 348 649
Q12012
Q42011
Q32011
Q22011
Q12011
Power 367 443 273 271 489Heat 213 100 -10 25 265Russia 48 35 -16 21 34Distribution 117 41 60 252 125Electricity Sales 11 -6 6 23 -20Other -20 -34 1 17 7Total 736 579 314 609 900
Q12012
Q42011
Q32011
Q22011
Q12011
Power 47 0 0 2 0Heat 58 7 0 -1 80Russia 0 0 0 0 0Distribution 5 0 0 192 1Electricity Sales - 2 0 0 1Other 0 0 0 0 0Total 110 9 0 193 82
Q12012
Q42011
Q32011
Q22011
Q12011
Power 1) -21 92 5 12 164Heat -6 -3 4 1 14Russia - - - - -Distribution 2 -8 -2 0 0Electricity Sales 2 -10 2 13 -32Other -2 -9 8 42 23Total -25 62 17 68 169
-9 -10 -6 -8 -4
5. Quarterly segment information
Extended quarterly information is available on Fortum's website www.fortum.com (about Fortum/Investors/Financial information/Interim reports).
Quarterly comparable operating profit by segments
EUR million
Quarterly non-recurring items by segment
EUR million
Quarterly operating profit by segments
EUR million
1) Including effects from the accounting of Fortum's part of the Finnish State Nuclear Waste Management Fund with (EUR million):
Quarterly other items affecting comparability
EUR million
36

Fortum Corporation Notes to the condensed consolidated interim financial statements
January-March 2012
DerivativesMarch 31
2012March 31
2011Dec 31
2011
Interest and currency derivatives Notional
valueNet fair
valueNotional
valueNet fair
valueNotional
valueNet fair
value
MEUR MEUR MEUR MEUR MEUR MEUR
Interest rate swaps 5,091 130 4,068 43 4,737 141Forward foreign exchange contracts 7,782 -150 8,581 -117 8,257 -143Forward rate agreements 226 0 168 0 196 0Interest rate and currency swaps 247 -2 543 -20 247 1
Electricity derivatives VolumeNet fair
value VolumeNet fair
value VolumeNet fair
value
TWh MEUR TWh MEUR TWh MEUR
Sales swaps 99 628 115 -876 95 559Purchase swaps 53 -337 64 483 48 -289Purchased options 2 2 0 1 1 1Written options 5 2 2 -2 1 1
Oil derivatives VolumeNet fair
value VolumeNet fair
value VolumeNet fair
value
1000 bbl MEUR 1000 bbl MEUR 1000 bbl MEUR
Sales swaps and futures 27,727 -107 31,146 -257 10,000 -6Purchase swaps and futures 27,438 109 31,003 259 9,910 4
Coal derivatives VolumeNet fair
value VolumeNet fair
value VolumeNet fair
value
kt MEUR kt MEUR kt MEUR
Sold 11,445 93 10,680 -122 12,325 94Bought 12,285 -79 10,041 124 11,642 -80
CO2 emission allowance derivatives VolumeNet fair
value VolumeNet fair
value VolumeNet fair
value
ktCO2 MEUR ktCO2 MEUR ktCO2 MEUR
Sold 34,983 109 16,436 -28 15,283 89Bought 38,164 -80 14,831 27 13,981 -59
Share derivativesNotional
valueNet fair
valueNotional
valueNet fair
valueNotional
valueNet fair
value
MEUR MEUR MEUR MEUR MEUR MEUR
Share forwards 1)8 8 9 14 9 9
The Group has not made any significant changes in policies regarding risk management during the period. Aspects of the Group's financial risk management objectives and policies are consistent with those disclosed in the consolidated financial statements as at and for the year ended 31 December 2011.
The tables below disclose the notional values or volumes and net fair values for the Group's derivatives used in different areas mainly for hedging purposes.
1) Cash-settled share forwards are used as a hedging instrument for Fortum Group's performance share arrangement.
7. Acquisitions, disposals and assets held for sale
Acquisitions
6. Financial risk management
There were no material acquisitions during the first quarter 2012.
The acquisitions of 85% of the shares in the Polish power and heat companies Elektrociepłownia Zabrze S.A. and Zespół Elektrociepłowni Bytom S.A. was completed in January 2011. Acquisition price for the transaction was EUR 22 million (PLN 82 million).
37

Fortum Corporation Notes to the condensed consolidated interim financial statements
January-March 2012
Gross divestments of shares
Q1 2012 Q1 2011 2011
Last twelve
months
126 110 117 133169 90 89 168
295 200 206 3010 5 362 357
295 205 568 658
Average rateJan-March
2012Jan-Dec
2011Jan-Sept
2011Jan-June
2011Jan-March
2011
Sweden (SEK) 8.8658 9.0038 8.9982 8.9273 8.8775Norway (NOK) 7.6136 7.7824 7.7962 7.7996 7.8173Poland (PLN) 4.2389 4.1254 4.0320 3.9655 3.9692Russia (RUB) 39.9714 41.0219 40.7778 40.4461 40.4504
Balance sheet date rateMarch 31
2012Dec 31
2011Sept 30
2011June 30
2011March 31
2011
Sweden (SEK) 8.8455 8.9120 9.2580 9.1739 8.9329Norway (NOK) 7.6040 7.7540 7.8880 7.7875 7.8330Poland (PLN) 4.1522 4.4580 4.4050 3.9903 4.0106Russia (RUB) 39.2950 41.7650 43.3500 40.4000 40.2850
The balance sheet date rate is based on exchange rate published by the European Central Bank for the closing date. The average exchange rate is calculated as an average of each months ending rate from the European Central Bank during the year and ending rate previous year.
Key exchange rates for Fortum Group applied in the accounts:
Interest bearing debt in sold subsidiaries1)
Gross divestments of shares in subsidiaries 2)
1) Including EUR 22 million received in April 2012.
Gross divestment of associatesTotal
8. Exchange rates
Fortum closed its divestment of Fortum Energiaratkaisut Oy and Fortum Termest AS to EQT Infrastructure Fund as of January 31, 2012. It has been approved by relevant competition authorities both in Finland and in Estonia. The total sales price, including net debt, was approximately EUR 200 million. Fortum's capital gain was EUR 58 million. The assets and liabilities related to the divested operations were presented as assets and liabilities held for sale in December 2011.
According to a deal signed with Imatran Seudun Sähkö on 20 December 2011, Fortum sold Distribution's Estonian subsidiary Fortum Elekter AS to Imatran Seudun Sähkö. In connection with the agreement, Fortum also sold its ownership in Imatran Seudun Sähkö Oy. The closing was made in the beginning of January, 2012. The assets and liabilities related to the divested operations were presented as assets and liabilities held for sale in December 2011.
During Q1 2012 Fortum divested small hydropower plants in Finland with the sale of a 60% share in Killin Voima Oy to Koillis-Satakunnan Sähkö Oy and sale of 14 small hydropower plants in Finland to Koskienergia Oy. Capital gain from these transactions was EUR 47 million booked in the Power Division's first-quarter results.
In December 2010 Fortum signed an agreement to divest district heat operations and production facilities outside Stockholm in Sweden. The divestment was completed on 31 March 2011. The total sales price was approximately EUR 220 million and the recognised gain EUR 82 million. The operations were part of the Heat segment and the gain is recognised in Heat segment. Major part of the divested operations were owned by Fortum's subsidiary Fortum Värme in which the city of Stockholm has a 50% economic interest. The Stockholm City Board and the Swedish Competition Authority have given their approval to the transaction. The assets and liabilities related to the divested operations were presented as assets and liabilities held for sale in December 2010.
Fortum's divestment of 25% shareholding in the Finnish transmission system operator Fingrid was completed on 19 April 2011. See Note 14.
2) Liquid funds in sold subsidiaries EUR 9 million (Q1:2011 14) are netted from gross divestments.
EUR million
Proceeds settled in cash
Disposals
38

Fortum Corporation Notes to the condensed consolidated interim financial statements
January-March 2012
Q1 2012 Q1 2011 2011
495 678 1,769
888,367 888,367 888,367
888,367 888,367 888,367
EUR million
March 312012
March 312011
Dec 312011
Opening balance 433 421 421Increase through acquisition of subsidiary companies - - 0Capital expenditures 4 10 27Changes of emission rights 1 6 13Depreciation, amortisation and impairment -5 -5 -19Moved to Assets held for sale - - -2Reclassifications 2 - -Translation differences and other adjustments 20 3 -7Closing balance 455 435 433
Goodwill included in closing balance 313 305 29419 4 -7
Number of shares (thousands):
12. Changes in intangible assets
Change in goodwill during the period due to translation differences
9. Income tax expense
The calculation of basic and diluted earnings per share is based on the following data:
11. Dividend per share
A dividend in respect of 2011 of EUR 1.00 per share, amounting to a total dividend of EUR 888 million, was decided at the Annual General Meeting on 11 April 2012. These Financial statements do not reflect this dividend. The dividend was paid on 23 April 2012.
A dividend in respect of 2010 of EUR 1.00 per share, amounting to a total dividend of EUR 888 million, was decided at the Annual General Meeting on 31 March 2011. In Q1 2011 the total dividend was included in the trade and other payables. The dividend was paid on 12 April 2011.
Tax rate according to the income statement for Q1 2012 was 18.3% (Q1 2011: 17.5%).
The tax rate for Q1 2012, excluding the impact of share of profits of associated companies and joint ventures as well as non-taxable capital gains was 21.0% (Q1 2011: 20.8%). The tax rate for the full year 2011, excluding the impact of share of profits of associated companies and joint ventures as well as non-taxable capital gains was 21.4%.The tax rate used in the income statement is always impacted by the fact that share of profits of associates and joint ventures is recorded based on Fortum's share of profits after tax.
10. Earnings per share
Weighted average number of shares for the purpose of diluted earnings per share
Weighted average number of shares for the purpose of basic earnings per share
Earnings (EUR million):Profit attributable to the owners of the parent
39

Fortum Corporation Notes to the condensed consolidated interim financial statements
January-March 2012
EUR million
March 312012
March 312011
Dec 312011
Opening balance 15,234 14,621 14,621Increase through acquisition of subsidiary companies - 29 26Capital expenditures 214 157 1,381Changes of nuclear asset retirement cost 0 3 5Disposals 0 -1 -13Depreciation, amortisation and impairment -153 -144 -587Sale of subsidiary companies -18 - -Moved to Assets held for sale - - -128Reclassifications -2 - -Translation differences and other adjustments 266 52 -71Closing balance 15,541 14,717 15,234
EUR million
March 312012
March 312011
Dec 312011
Opening balance 2,019 2,161 2,161Share of profits of associates and joint ventures -7 59 91Investments - - 9Share issues and shareholders' contributions - 16 16Divestments - -4 -146Dividend income received 0 0 -108OCI items associated companies -12 21 -1Moved to Assets held for sale - -128 -1Translation differences and other adjustments 39 4 -2Closing balance 2,039 2,129 2,019
There were no investments or shares issues in associated companies during the first quarter of 2012.
Teollisuuden Voima Oyj's (TVO) Annual General meeting in March 2011 decided to raise the company's share capital by EUR 65 million of which Fortum's share is EUR 16 million. The increase in Fortum's participation in TVO was booked in Q1 2011 and was paid during Q4 2011.
Share of profits from associates and joint ventures
13. Changes in property, plant and equipment
According to Fortum Group accounting policies the share of profits from Hafslund will be included in Fortum Group figures based on the previous quarter information since updated interim information is not normally available. Q1 includes Fortum's share of Hafslund's Q4 profit.
Share of profits from associates in Q1 2012 was EUR -7 million (Q1 2011: 59) of which Hafslund ASA represented EUR -9 million (Q1 2011: 42) and TGC-1 EUR 0 million (Q1 2011: 8). Share of profits from TGC-1 is based on the company's published IFRS financial statements. The IFRS financial statements for 2011 from TGC-1 have not been available, when preparing Fortum's Q1 2012 results, so no share of profits from TGC-1 have been included in Fortum's result.
14. Changes in participations in associates and joint ventures
Investments and share issues
In December 2011 Hafslund sold its shareholding in REC. In Q1 2012 Fortum recognised EUR 7 million loss as part of the share of profit of associates and joint ventures in relation to Hafslund's divestment of REC shares while in Q1 2011 Fortum recognised EUR 38 million in relation to Hafslund's divestment of Hafslund Fibernett AS.
Fortum's share of profits for the full year 2011 amounted to EUR 91 million, of which Hafslund represented EUR 23 million, TGC-1 EUR 30 million, and Gasum EUR 16 million.
40

Fortum Corporation Notes to the condensed consolidated interim financial statements
January-March 2012
EUR million
Number ofshares
March 312012
Sharecapital
March 312012
Number ofsharesDec 31
2011
SharecapitalDec 31
2011
Registered shares at 1 January 888,367,045 3,046 888,367,045 3,046Registered shares at the end of the period 888,367,045 3,046 888,367,045 3,046
EUR million
March 312012
March 312011
Dec 312011
Carrying values in the balance sheetNuclear provisions 659 634 653Share in the State Nuclear Waste Management Fund 659 634 653
Legal liability and actual share of the State Nuclear Waste Management FundLiability for nuclear waste management according to the Nuclear Energy Act 968 944 968Funding obligation target 941 886 941
903 886 903
There were no divestments of shares in accociated companies during the first quarter of 2012.
17. Nuclear related assets and liabilities
16. Interest-bearing liabilities and liquid funds
15. Share capital
The liability regarding the Loviisa nuclear power plant is calculated according to the Nuclear Energy Act and was decided by the Ministry of Employment and Economy in December 2011. The liability is based on a technical plan, which is made every third year. The technical plan and the cost estimates were last updated in Q2 2010.
The legal liability on 31 March 2012 is EUR 968 million. The provision in the balance sheet related to nuclear waste management is based on cash flows for future costs which uses the same basis as the legal liability. The carrying value of the nuclear provision, calculated according to IAS 37, has increased by EUR 6 million compared to 31 December 2011, totalling EUR 659 million on 31 March 2012. The main reason for the difference between the carrying value of the provision and the legal liability is the fact that the legal liability is not discounted to net present value.
On 7 March 2012, Fortum Corporation issued two 5 year bonds under its existing Euro Medium Term Note Programme. The amount of SEK 2,750 million (about EUR 309 million) consisting of SEK 1,000 million floating rate and SEK 1,750 million at 3.25% fixed rate. The proceeds from these new financing arrangements will be used for general corporate purposes. Per quarter end the amount of short-term financing was EUR 235 million (31 December 2011: 254). The interest-bearing debt increased during the quarter by EUR 327 million from EUR 7,770 million to EUR 8,097 million. Total liquid funds increased by EUR 827 million from EUR 747 million to EUR 1,574 million.
Fortum contributes funds to the State Nuclear Waste Management Fund based on the yearly funding obligation target decided by the governmental authorities in December in connection with the decision of size of the legal liability. The current funding obligation target based on the legal liability decided in December 2011 and approved periodising of the payments to the Fund is EUR 941 million. Fortum has paid after this interim reporting (April 2 2012) the fee of EUR 38 million whereafter Fortum's share of the State Nuclear Waste Management Fund is fully funded. The Fund is from an IFRS perspective overfunded with EUR 244 million, since Fortum's share of the Fund on 31 March 2012 is EUR 903 million and the carrying value in the balance sheet is EUR 659 million.
Fortum's share of the State Nuclear Waste Management Fund
Divestments
In the first quarter of 2011 Electricity Sales segment divested its 30.78% share in Energiapolar Oy.
Nuclear related provisions
Fortum's share in the State Nuclear Waste Management Fund
41
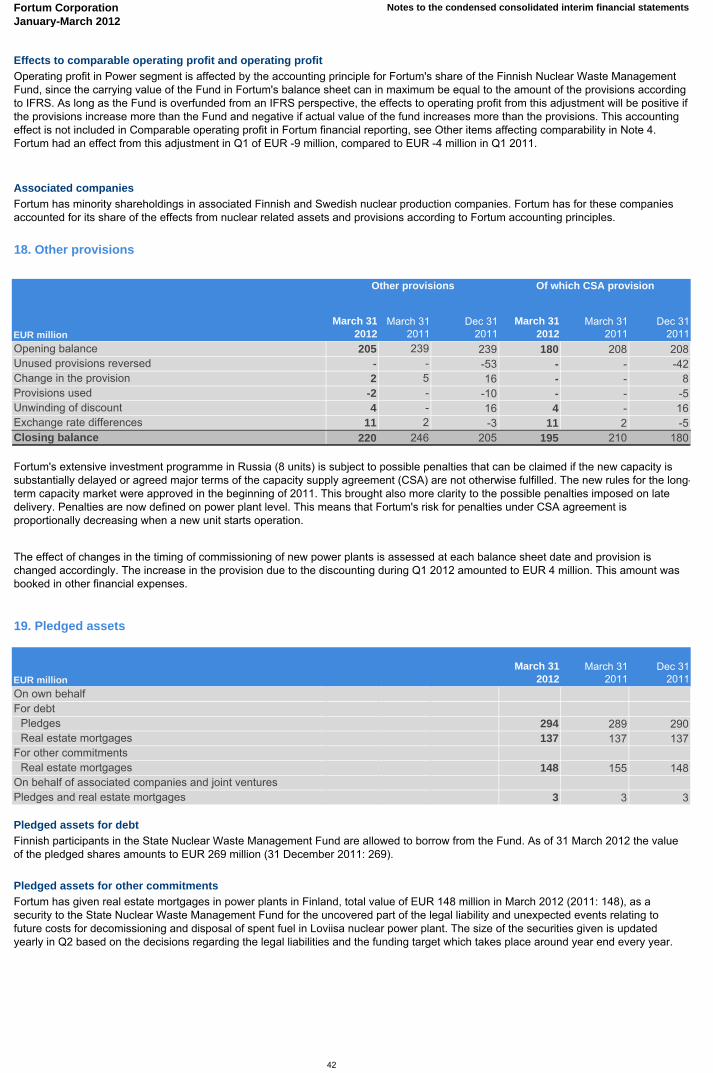
Fortum Corporation Notes to the condensed consolidated interim financial statements
January-March 2012
EUR million
March 312012
March 312011
Dec 312011
March 312012
March 312011
Dec 312011
Opening balance 205 239 239 180 208 208Unused provisions reversed - - -53 - - -42Change in the provision 2 5 16 - - 8Provisions used -2 - -10 - - -5Unwinding of discount 4 - 16 4 - 16Exchange rate differences 11 2 -3 11 2 -5Closing balance 220 246 205 195 210 180
EUR million
March 312012
March 312011
Dec 312011
On own behalfFor debt
Pledges 294 289 290Real estate mortgages 137 137 137
For other commitmentsReal estate mortgages 148 155 148
On behalf of associated companies and joint venturesPledges and real estate mortgages 3 3 3
Associated companies
Pledged assets for other commitments
Finnish participants in the State Nuclear Waste Management Fund are allowed to borrow from the Fund. As of 31 March 2012 the value of the pledged shares amounts to EUR 269 million (31 December 2011: 269).
Pledged assets for debt
19. Pledged assets
Fortum has given real estate mortgages in power plants in Finland, total value of EUR 148 million in March 2012 (2011: 148), as a security to the State Nuclear Waste Management Fund for the uncovered part of the legal liability and unexpected events relating to future costs for decomissioning and disposal of spent fuel in Loviisa nuclear power plant. The size of the securities given is updated yearly in Q2 based on the decisions regarding the legal liabilities and the funding target which takes place around year end every year.
The effect of changes in the timing of commissioning of new power plants is assessed at each balance sheet date and provision is changed accordingly. The increase in the provision due to the discounting during Q1 2012 amounted to EUR 4 million. This amount was booked in other financial expenses.
Of which CSA provisionOther provisions
Fortum's extensive investment programme in Russia (8 units) is subject to possible penalties that can be claimed if the new capacity is substantially delayed or agreed major terms of the capacity supply agreement (CSA) are not otherwise fulfilled. The new rules for the long-term capacity market were approved in the beginning of 2011. This brought also more clarity to the possible penalties imposed on late delivery. Penalties are now defined on power plant level. This means that Fortum's risk for penalties under CSA agreement is proportionally decreasing when a new unit starts operation.
Operating profit in Power segment is affected by the accounting principle for Fortum's share of the Finnish Nuclear Waste Management Fund, since the carrying value of the Fund in Fortum's balance sheet can in maximum be equal to the amount of the provisions according to IFRS. As long as the Fund is overfunded from an IFRS perspective, the effects to operating profit from this adjustment will be positive if the provisions increase more than the Fund and negative if actual value of the fund increases more than the provisions. This accounting effect is not included in Comparable operating profit in Fortum financial reporting, see Other items affecting comparability in Note 4. Fortum had an effect from this adjustment in Q1 of EUR -9 million, compared to EUR -4 million in Q1 2011.
Fortum has minority shareholdings in associated Finnish and Swedish nuclear production companies. Fortum has for these companies accounted for its share of the effects from nuclear related assets and provisions according to Fortum accounting principles.
18. Other provisions
Effects to comparable operating profit and operating profit
42

Fortum Corporation Notes to the condensed consolidated interim financial statements
January-March 2012
EUR million
March 312012
March 312011
Dec 312011
Due within a year 33 27 32Due after one year and within five years 75 59 68Due after five years 155 126 142Total 263 212 242
EUR million
March 312012
March 312011
Dec 312011
Property, plant and equipment 1,051 1,137 940Intangible assets 9 8 10Total 1,060 1,145 950
EUR million
March 312012
March 312011
Dec 312011
On own behalfOther contingent liabilities 67 208 68
On behalf of associated companies and joint venturesGuarantees 349 359 347Other contingent liabilities 125 125 125
On behalf of othersGuarantees 1 0 0
Guarantees on behalf of associated companies
Fortum’s subsidiaries, Fortum Sweden AB and Fortum Nordic AB, have received an income tax assessment for the year 2009 from the Swedish tax authorities. According to the tax authorities, Fortum would have to pay additional income taxes for the year 2009 for the reallocation of the loans between the Swedish subsidiaries in 2004-2005. The claim is based on the change in tax regulation as of 2009. Fortum considers the claim unjustifiable and has appealed the decision. No provision has been accounted for in the financial statements. If the decision by the tax authority remains final despite the appeals process, the impact on the net profit for the period would be approximately 420 MSEK.
22. Contingent liabilities
Capital commitments have increased compared to year end 2011. Commitments have mainly increased relating to OAO Fortum's investments, automatic meter reading investment in Distribution Finland as well as commitments relating to CHP investments in Järvenpää, Finland and Jelgava, Latvia.
21. Capital commitments
23. Legal actions and official proceedings
Guarantees and other contingent liabilities on behalf of associated companies and joint ventures mainly consist of guarantees relating to Fortum's associated nuclear companies (Teollisuuden Voima Oyj, Forsmarks Kraftgrupp AB and OKG AB). The guarantees for Forsmarks Kraftgrupp AB and OKG AB for 2012-2014 will be increased from current SEK 2.574 million (EUR 291 million) to SEK 3.696 million (EUR 418 million) later in 2012.
The guarantee given on behalf of Teollisuuden Voima Oyj (TVO) to the Finnish fund amount to EUR 44 million at 31 March 2012 (31 December 2011: 44).
The Swedish Energy Authority (EI), which regulates and supervises the distribution network tariffs in Sweden, has issued a decision concerning the allowed income frame for the years 2012-2015. EI has based its decision on a model with a transition rule stating that it takes 18 years to reach the allowed level of income according to the new model. The EI decision has been appealed to the County Administrative Court by more than 80 distribution companies, including Fortum Distribution AB. The basis for Fortum Distribution AB’s appeal is that the model is not compatible with the existing legislation and that EI has applied an incorrect method for the calculation of Weighted Average Cost of Capital (WACC).
In Finland, the Energy market authority has issued methodology decisions for the years 2012-2015. The decisions were appealed by more than 70 distribution companies. Main points of the appeal relate to the changes in WACC-calculation and increased quality sanctions. Market Court ruling is expected earliest by the end of 2012.
20. Operating lease commitments
43
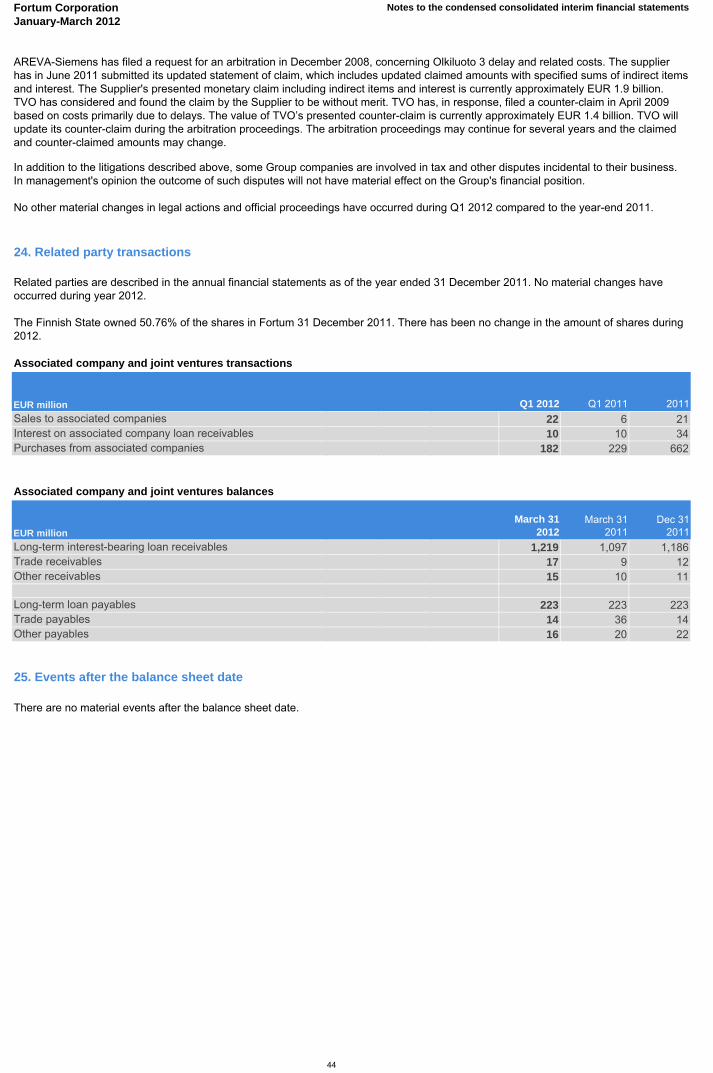
Fortum Corporation Notes to the condensed consolidated interim financial statements
January-March 2012
EUR million Q1 2012 Q1 2011 2011
Sales to associated companies 22 6 21Interest on associated company loan receivables 10 10 34Purchases from associated companies 182 229 662
Associated company and joint ventures balances
EUR million
March 312012
March 312011
Dec 312011
Long-term interest-bearing loan receivables 1,219 1,097 1,186Trade receivables 17 9 12Other receivables 15 10 11
Long-term loan payables 223 223 223Trade payables 14 36 14Other payables 16 20 22
In addition to the litigations described above, some Group companies are involved in tax and other disputes incidental to their business. In management's opinion the outcome of such disputes will not have material effect on the Group's financial position.
No other material changes in legal actions and official proceedings have occurred during Q1 2012 compared to the year-end 2011.
AREVA-Siemens has filed a request for an arbitration in December 2008, concerning Olkiluoto 3 delay and related costs. The supplier has in June 2011 submitted its updated statement of claim, which includes updated claimed amounts with specified sums of indirect items and interest. The Supplier's presented monetary claim including indirect items and interest is currently approximately EUR 1.9 billion. TVO has considered and found the claim by the Supplier to be without merit. TVO has, in response, filed a counter-claim in April 2009 based on costs primarily due to delays. The value of TVO’s presented counter-claim is currently approximately EUR 1.4 billion. TVO will update its counter-claim during the arbitration proceedings. The arbitration proceedings may continue for several years and the claimed and counter-claimed amounts may change.
There are no material events after the balance sheet date.
25. Events after the balance sheet date
24. Related party transactions
Related parties are described in the annual financial statements as of the year ended 31 December 2011. No material changes have occurred during year 2012.
The Finnish State owned 50.76% of the shares in Fortum 31 December 2011. There has been no change in the amount of shares during 2012.
Associated company and joint ventures transactions
44

Fortum Corporation Notes to the condensed consolidated interim financial statementsJanuary-March 2012
EBITDA (Earnings before interest, taxes, depreciation and amortisation)
=
Comparable EBITDA =
Items affecting comparability =
Comparable operating profit =
Non-recurring items =
Other items affecting comparability =
Funds from operations (FFO) =
Capital expenditure =
Gross investments in shares =
Return on shareholders' equity, % = x 100
Return on capital employed, % = x 100
Return on net assets, % =
x 100
Comparable return on net assets, % =
x 100
Capital employed =
Net assets =
26. Definition of key figures
Operating profit + Depreciation, amortisation and impairment charges
EBITDA - items affecting comparability - Net release of CSA provision
Profit for the year
Profit before taxes + interest and other financial expenses
Comparable operating profit + Share of profit (loss) in associated companies and joint ventures (adjusted for IAS 39 effects, nuclear fund adjustments and major sales gains or losses)
Capital gains and losses
Includes effects from financial derivatives hedging future cash-flows where hedge accounting is not applied according to IAS 39 and effects from the accounting of Fortum´s part of the Finnish Nuclear Waste Fund where the asset in the balance sheet cannot exceed the related liabilities according to IFRIC interpretation 5.
Operating profit + Share of profit (loss) in associated companies and joint ventures
Net assets average
Total equity average
Net cash from operating activities before change in working capital
Capitalised investments in property, plant and equipment and intangible assets including maintenance, productivity, growth and investments required by legislation including borrowing costs capitalised during the construction period. Maintenance investments expand the lifetime of an existing asset, maintain useage/availability and/or maintains reliability. Productivity investments improve productivity in an existing asset. Growth investments' purpose is to build new assets and/or to increase customer base within existing businesses. Legislation investments are done at certain point of time due to legal requirements.
Capital employed average
Investments in subsidiary shares, shares in associated companies and other shares in available for sale financial assets. Investments in subsidiary shares are net of cash and grossed with interest-bearing liabilities in the acquired company.
Comparable net assets average
Total assets - non-interest bearing liabilities - deferred tax liabilities - provisions
Non-interest bearing assets + interest-bearing assets related to the Nuclear Waste Fund - non-interest bearing liabilities - provisions (non-interest bearing assets and liabilities do not include finance related items, tax and deferred tax and assets and liabilities from fair valuations of derivatives where hedge accounting is applied)
Non-recurring items + other items affecting comparability
Operating profit - non-recurring items - other items affecting comparability
45

Fortum Corporation Notes to the condensed consolidated interim financial statementsJanuary-March 2012
26. Definition of key figures
Comparable net assets =
Interest-bearing net debt =
Gearing, % = x 100
Equity-to-assets ratio, % = x 100
Net debt / EBITDA =
Comparable net debt / EBITDA =
Interest coverage =
Interest coverage including capitalised borrowing costs
=
Earnings per share (EPS) =
Equity per share =
Last twelve months (LTM) =
Net assets adjusted for non-interest bearing assets and liabilities arising from financial derivatives hedging future cash flows where hedge accounting is not applied according to IAS 39
Operating profit
Twelve months preceding the reporting date
Shareholder's equity
Comparable EBITDA
Operating profit
Net interest expenses
Net interest expenses - capitalised borrowing costs
Number of shares excluding treasury shares at the end of the period
Average number of shares during the period
Total equity
Interest-bearing liabilities - liquid funds
Interest-bearing net debt
Total equity including non-controlling interest
Total assets
Interest-bearing net debt
Operating profit + Depreciation, amortisation and impairment charges
Interest-bearing net debt
Profit for the period - non-controlling interest
46

Fortum CorporationJanuary-March 2012
Power consumption
TWh Q1 2012 Q1 2011 2011
Last twelve
months
Nordic countries 113 116 382 379Russia 293 285 1,020 1,028Tyumen 22 22 82 82Chelyabinsk 10 10 36 36Russia Urals area 69 68 250 251
Average prices
Q1 2012 Q1 2011 2011
Last twelve
months
Spot price for power in Nord Pool power exchange, EUR/MWh 38.3 66.2 47.1 40.2Spot price for power in Finland, EUR/MWh 42.5 64.8 49.3 43.8Spot price for power in Sweden, SE3, Stockholm EUR/MWh 1)
39.1 65.9 47.9 41.2Spot price for power in Sweden, SE2, Sundsvall EUR/MWh 38.0 N/A N/A N/ASpot price for power in European and Urals part of Russia, RUB/MWh 2)
915 1,033 990 961Average capacity price, tRUB/MW/month 243 214 209 218Spot price for power in Germany, EUR/MWh 45.1 51.9 51.1 49.5Average regulated gas price in Urals region, RUB/1000 m3
2,548 2,548 2,548 2,548Average capacity price for old capacity, tRUB/MW/month 3)
166 184 160 156Average capacity price for new capacity, tRUB/MW/month 3)
577 759 560 550Spot price for power (market price), Urals hub, RUB/MWh 2)
849 947 925 900CO2, (ETS EUA), EUR/tonne CO2 8 15 13 11
Coal (ICE Rotterdam), USD/tonne 101 123 122 116Oil (Brent Crude), USD/bbl 118 106 111 1141) From 1st Nov 2011 onwards price area SE3 (Stockholm), before Sweden as one area.2) Excluding capacity tariff3) Capacity prices paid only for the capacity available at the time.
Water reservoirs
TWhMarch 31
2012March 31
2011Dec 31
2011
Nordic water reservoirs level 56 20 95Nordic water reservoirs level, long-term average 41 41 83
Export/import
TWh (+ = import to, - = export from Nordic area) Q1 2012 Q1 2011 2011
Last twelve
months
Export / import between Nordic area and Continental Europe+Baltics -5 5 -6 -16Export / import between Nordic area and Russia 2 3 11 10Export / import Nordic area, Total -3 8 5 -6
Power market liberalisation in Russia
% Q1 2012 Q1 2011 2011
Last twelve
months
Share of power sold on the liberalised market 100 100 100 100Share of power sold at the liberalised price by OAO Fortum 84 84 85 85
Achieved power prices
EUR/MWh Q1 2012 Q1 2011 2011
Last twelve
months
Power's Nordic power price 47.2 47.9 46.1 46.0Achieved power price for OAO Fortum 29.3 29.2 29.2 29.3
Market conditions and achieved power prices
47
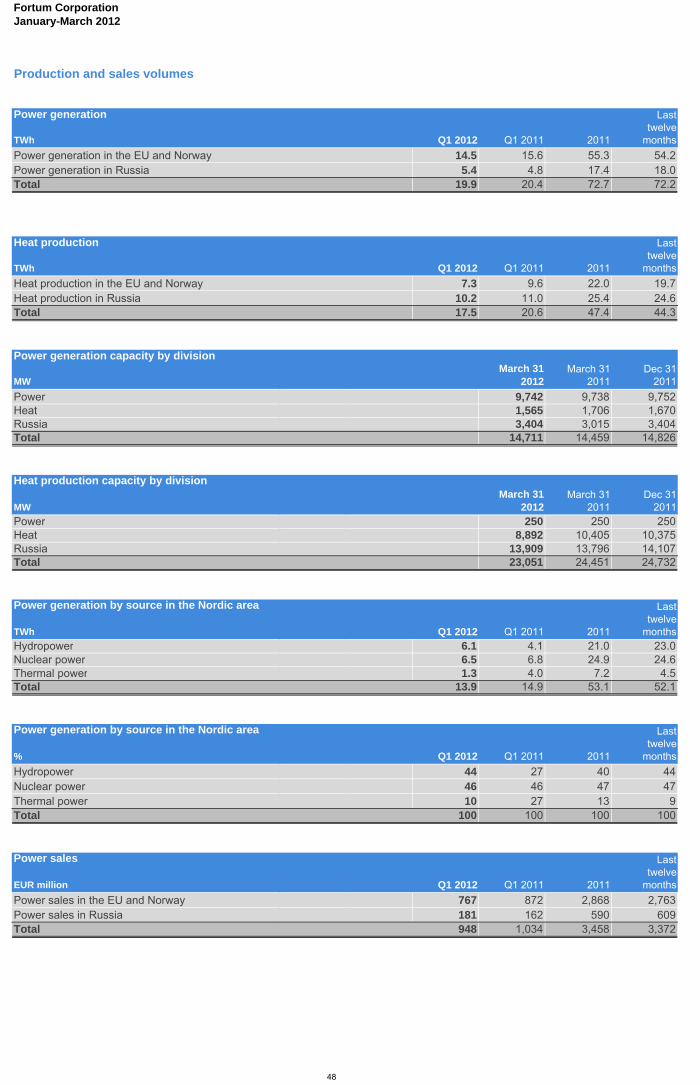
Fortum CorporationJanuary-March 2012
Power generation
TWh Q1 2012 Q1 2011 2011
Last twelve
months
Power generation in the EU and Norway 14.5 15.6 55.3 54.2Power generation in Russia 5.4 4.8 17.4 18.0Total 19.9 20.4 72.7 72.2
Heat production
TWh Q1 2012 Q1 2011 2011
Last twelve
months
Heat production in the EU and Norway 7.3 9.6 22.0 19.7Heat production in Russia 10.2 11.0 25.4 24.6Total 17.5 20.6 47.4 44.3
Power generation capacity by division
MW March 31
2012March 31
2011Dec 31
2011
Power 9,742 9,738 9,752Heat 1,565 1,706 1,670Russia 3,404 3,015 3,404Total 14,711 14,459 14,826
Heat production capacity by division
MWMarch 31
2012March 31
2011Dec 31
2011Power 250 250 250Heat 8,892 10,405 10,375Russia 13,909 13,796 14,107Total 23,051 24,451 24,732
Power generation by source in the Nordic area
TWh Q1 2012 Q1 2011 2011
Last twelve
monthsHydropower 6.1 4.1 21.0 23.0Nuclear power 6.5 6.8 24.9 24.6Thermal power 1.3 4.0 7.2 4.5Total 13.9 14.9 53.1 52.1
Power generation by source in the Nordic area
% Q1 2012 Q1 2011 2011
Last twelve
months
Hydropower 44 27 40 44Nuclear power 46 46 47 47Thermal power 10 27 13 9Total 100 100 100 100
Power sales
EUR million Q1 2012 Q1 2011 2011
Last twelve
months
Power sales in the EU and Norway 767 872 2,868 2,763Power sales in Russia 181 162 590 609Total 948 1,034 3,458 3,372
Production and sales volumes
48
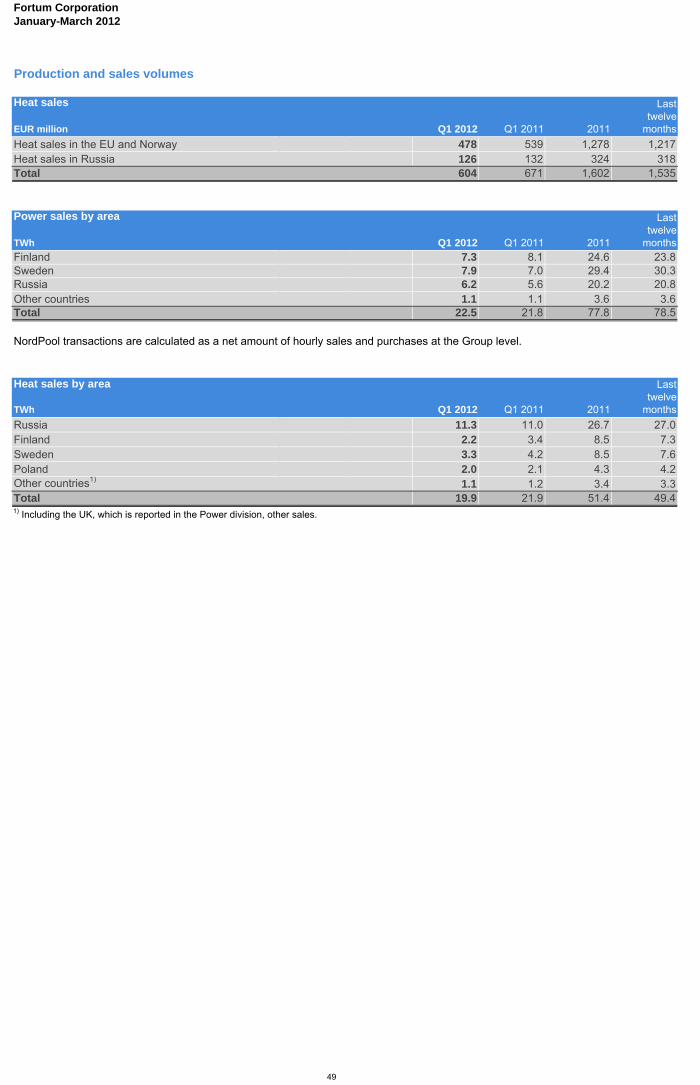
Fortum CorporationJanuary-March 2012
Production and sales volumes
Heat sales
EUR million Q1 2012 Q1 2011 2011
Last twelve
months
Heat sales in the EU and Norway 478 539 1,278 1,217Heat sales in Russia 126 132 324 318Total 604 671 1,602 1,535
Power sales by area
TWh Q1 2012 Q1 2011 2011
Last twelve
monthsFinland 7.3 8.1 24.6 23.8Sweden 7.9 7.0 29.4 30.3Russia 6.2 5.6 20.2 20.8Other countries 1.1 1.1 3.6 3.6Total 22.5 21.8 77.8 78.5
NordPool transactions are calculated as a net amount of hourly sales and purchases at the Group level.
Heat sales by area
TWh Q1 2012 Q1 2011 2011
Last twelve
months
Russia 11.3 11.0 26.7 27.0Finland 2.2 3.4 8.5 7.3Sweden 3.3 4.2 8.5 7.6Poland 2.0 2.1 4.3 4.2Other countries1)
1.1 1.2 3.4 3.3Total 19.9 21.9 51.4 49.41) Including the UK, which is reported in the Power division, other sales.
49