FORGING A NEW PATH - GlobalFoundries is the Arabic word for sustainability. The project will target...
8
FORGING A NEW PATH ON SUSTAINABLE BUSINESS PRACTICES ®
-
Upload
nguyendung -
Category
Documents
-
view
215 -
download
0
Transcript of FORGING A NEW PATH - GlobalFoundries is the Arabic word for sustainability. The project will target...

F O R G I N G A N E W P A T H
O N S U S T A I N A B L E B U S I N E S S P R A C T I C E S
®

®
GLOBALFOUNDRIES’ VISION IS TO BE THE FIRST TRULY
GLOBAL SEMICONDUCTOR FOUNDRY, HARNESSING THE WORLD’S RESOURCES TO DELIVER
MAXIMUM VALUE TO OUR CUSTOMERS AND UNLOCKING THEIR POTENTIAL TO INNOVATE.
WE ARE A FOUNDRY CREATED WITH AN INTEGRAL COMMITMENT TO
CORPORATE RESPONSIBILIT Y – A COMPANY DEDICATED GLOBALLY TO ETHICAL AND
RESPONSIBLE BUSINESS PRACTICES, THE PERSONAL AND SOCIAL WELL-BEING OF
OUR EMPLOYEES, AND ENVIRONMENTAL STEWARDSHIP IN OUR COMPANY AND THROUGHOUT
OUR SUPPLY CHAIN. CORPORATE RESPONSIBILIT Y IS FUNDAMENTAL TO OUR CULTURE
AND OUR VALUE PROPOSITION TO OUR CUSTOMERS, THE COMMUNITIES IN WHICH
WE LIVE AND DO BUSINESS, AND OUR FULL RANGE OF GLOBAL STAKEHOLDERS.
T H E G L O B A L F O U N D R I E S O F F I C E I N A B U D H A B I WA S O N E O F T H E S P O N S O R S O F T H E A L O F T R U N F O R C H I L D R E N , PA R T O F T H E ROA D TO AWA R E N E S S C A M PA I G N T O R A I S E M O N E Y F O R U N I C E F.
G L O B A L F O U N D R I E S E M P L O Y E E S I N S I N G A P O R E H AV E S H AV E D T H E I R H E A D S T O R A I S E F U N D S F O R T H E C H I L D R E N C A N C E R F O U N D AT I O N ’ S A N N U A L H A I R F O R H O P E E V E N T. I N 2 011 T H E E V E N T R A I S E D N E A R L Y S $ 4 0 , 0 0 0 .
G L O B A L F O U N D R I E S P R E S E N T E D AT T H E AWA R D S C E R E M O N Y A N D H E L P E D J U D G E “ Y O U N G S C I E N C E , ” G E R M A N Y ’ S L A R G E S T A N D M O S T L O N G - S TA N D I N G C O N T E S T F O R T O P - TA L E N T S T U D E N T S I N E N G I N E E R I N G S C I E N C E .

P L A C E S GLOBALFOUNDRIES is focused solely on our core business – servicing semiconductor foundry customers with a broad range of globally distributed manufacturing capabilities. Our leading-edge global manufacturing and technology capabilities are creating a new platform of innovation to drive current and future generations of semiconductor products. Not only are we stewards of semicon-ductor manufacturing technology and our customers’ intellectual property, but we are also stewards of the environment and our commu-nities, working to ensure that our operations bring mutual benefits for generations to come.
Fab 1 in Dresden, Germany is recognized throughout the indus-try as among the most successful leading-edge semiconductor production facilities in the world. This 300mm facility stands as a testament to both environmentally conscious manufacturing and the contributions of a highly skilled and dedicated family of employees. The Fab 1 campus hosts two separate but integrated modules, and we have completed construction of an annex that will expand the design capacity of the site to 80,000 wafers per month.
GLOBALFOUNDRIES Singapore fabs include both 200mm and 300mm wafer manufacturing facilities with a long-standing reputation for technology leadership and providing a safe work environment and award-winning EHS performance. In addition to being the first fabs in Singapore to adopt reclaimed NEWater as feed stock to the ultrapure water production systems, in 2010 the Woodlands campus increased its water reclaim rate to more than 50 percent.
Building on our commitment to sustainable semiconductor manufacturing facilities around the world, Fab 8 in Saratoga County, New York has been designed as a “green fab” and will be the most
advanced 300mm wafer fab in the world when fully operational in 2012. In 2010, we commenced an expansion of the manufactur-ing area, increasing the clean room space to 300,000 square feet and enabling the site’s total output to grow to 60,000 wafers per month once fully equipped. From the foundation of collaboration with like-minded partners such as the Rocky Mountain Institute and the New York State Energy Research and Development Authority (NYSERDA), we continue to drive towards LEED® (Leadership in Energy and Environmental Design) Gold certification for Fab 8 and the associated administrative buildings.
In addition to the capacity expansion projects at Fab 1 and Fab 8, GLOBALFOUNDRIES majority shareholder, the Advanced TechnologyInvestment Company (ATIC), announced initial plans to create an advanced technology cluster in Abu Dhabi, United Arab Emirates. ATIC and GLOBALFOUNDRIES are both committed to establishing a manufacturing and technology presence in Abu Dhabi as part of a larger technology ecosystem. This plan is consistent with Abu Dhabi’s long-term goal of diversifying its economy. A site has been selected for a potential new fab close to the Abu Dhabi International Airport and plans will progress as market conditions become more favorable. The fab’s design will be under the principles of Estidama, the Abu Dhabi Urban Planning Council’s sustainable development program. Estidama is the Arabic word for sustainability. The project will target an Estidama “2 Pearl” rating as well as LEED® Gold certification. Our globally distributed capacity is supported by major facilities for research and design enablement located near the principal hubs of semiconductor activities in Europe, Asia and the U.S. As we grow and expand, we will continue this progression, always look-ing ahead while learning from and improving upon past successes.
N E W P H OTO TO CO M E
DRESDEN: FA B 1 – T E C H N O L O G Y AT H O M E I N T H E C O M M U N I T Y.
SINGAPORE WOODL ANDS CAMPUS: FA B S 2 , 3 , 5 , 6 , A N D 7
SINGAPORE TAMPINES CAMPUS: FA B 3 E
SARATOGA COUNT Y, NEW YORK: FA B 8
SALES AND SUPPORT OFFICESMANUFACTURING CENTERSSaratoga County, New York Dresden, Germany Singapore
Saratoga County, NY Yokohama, Japan
Shanghai, ChinaHsinchu, Taiwan
Singapore
Dresden, GermanyMunich, Germany
London, UK
Silicon Valley, CAEast Fishkill, NY
Austin, TX
Abu Dhabi, UAE

P E O P L E We employ a diverse global workforce of approximately 12,000 highly talented and experienced colleagues, empowered to lead the delivery of high performance engineering solutions. Our employees are an extraordinary force focused on achieving GLOBALFOUNDRIES’ mission. Through our people, we help customers do and achieve more through deep collaboration, successful innovation, exceptional service and operational and manufacturing excellence.
The strength of our workforce not only demonstrates our commitment to recruit and hire exceptional people, but to provide them with the opportunity to develop personally and professionally. We provide a variety of foundational and skills-based development resources for employees, managers and executives to help them evolve their careers and grow into future opportunities. Our commitment to the development of people extends to the communities in which we operate.
FOR EXAMPLE: • We partnered with the Dresden community to develop
student programs that stimulate future innovation and sustain our technology leadership. We sponsored and h e l p e d j u d g e t h e “ Yo u n g S c i e n c e” c o m p e t i t i o n , Germany’s largest and most long-standing contest for top-talent students in engineering science.
• After two successful programs in Dresden, our Singapore
facility hosted the third annual Al Nokhba (“The Elite”) Summer Internship program. ATIC, GLOBALFOUNDRIES’ major investor, sponsored 25 engineering students from the United Arab Emirates to travel to Singapore for six weeks of training in the theory and practice of semiconductor manufacturing by highly skilled engineers and professionals.
• In New York, GLOBALFOUNDRIES is leading a regional initiative to promote Science Technology, Engineering and Mathematics (STEM) education among a variety of stakeholders including community colleges and trade schools.
Protecting the health, safety and well-being of our people is a fundamental responsibility at GLOBALFOUNDRIES. We employ a variety of tools and resources to create a safety culture in our operations including general and job-specific training, mentoring, and a risk management hierarchy appropriate to the risk being managed.
Recognizing that a healthy workforce is also a productive workforce, we provide employees with opportunities to learn about health and well-being and participate in related activities. Through events such as the Vitality Week held at our Dresden facility, GLOBALFOUNDRIES employees can learn about preventative and active well-being programs. In September 2011 we celebrated our first annual Global Health Day. Employees at our global locations also have access to a variety of health and well-being opportunities such as fitness centers, vaccinations, health screenings and surveillance, first aid training, and safety tips for travelers.
C O N T I N U O U S, C O L L A B O R A T I V E I N N O VA T I O N
GLOBALFOUNDRIES is the foundry leader in globally distributed capacity with a unique value proposition combining technology leadership with service
and flexibility and financial staying power. We measure technology leadership in time-to-volume for leading edge technologies, low leakage current,
low defect density, and fast manufacturing cycle times. GLOBALFOUNDRIES’ production ramps for advanced technologies outpace the rest of the foundry
market, offering substantial time-to-market advantages for customers. Our extensive global resources and alliances are helping to drive worldwide
standards for new technologies such as High K Metal Gate (HKMG). The global distribution of our fabs coincides with a globally distributed secure
supply chain offering unparalleled flexibility in the foundry industry.
We encourage cooperation among competitors through strategic industry organizations such as the U.S. Semiconductor Industry Association (SIA),
the European Semiconductor Industry Association (ESIA), Semiconductor Equipment and Materials International (SEMI), SEMATECH, IMEC, the
Semiconductor Research Corporation (SRC) and other industry groups. Through our participation and leadership, we enable the continuing technology
progression and environmental stewardship that customers and society demand.
1 2,0 0 0highly talented
and experienced col leagues
around the world
A P P R O X I M A T E L Y
GLOBALFOUNDRIES S INGAPORE RECEIVED 3 P L AT I N U M A N D 1 G O L D
H E A LT H (HELP ING EMPLOYEES A C H I E V E L I F E T I M E H E A LT H ) AWA R D S
A N D A L E T T E R O F C O M M E N D AT I O N F O R F I T N E S S F R O M T H E W O R K P L A C E
H E A LT H P R O M O T I O N ( W H P ) .
C O M M U N I T Y E N GAG E M E N T : F O L L O W I N G T W O S U C C E S S F U L P R O G R A M S I N D R E S D E N , G L O B A L F O U N D R I E S S I N G A P O R E H O S T E D 2 5 E N G I N E E R -I N G S T U D E N T S F R O M T H E U N I T E D A R A B E M I R AT E S F O R A L N O K H B A , A S I X W E E K I N T E N S I V E S E M I C O N D U C T O R M A N U FA C T U R I N G I N T E R N S H I P.
T H E S I L I C O N VA L L E Y G L O B A L F O U N D R I E S C A M P U S E S L A U N C H E D T H E I R I N A U G U R A L FOOD AND FUND DRIVE WITH SECOND HARVEST F O O D B A N K , F I L L I N G N U M E R O U S B A R R E L S W ITH FOOD AS WELL AS MAK ING A F INANC IAL D O N AT I O N F R O M E M P L O Y E E S .
F O R G I N G A N E W P A T H
O N S U S T A I N A B L E B U S I N E S S P R A C T I C E S
E M P L O Y E E S B Y R E G I O NAmericas 12%
Europe, Middle East / Africa 26%
Asia / Asia Pacific 62%

KEY ENVIRONMENTAL INDICATORSRegular collection and evaluation of performance indicators for manufacturing facilities is a key aspect of our environmental management systems. In addition to analyzing actual data trends, we use a manufacturing index that includes total output, wafer size and the average number of mask layers (a measure of product complexity) to normalize environmental indicators, comparing them year-on-year to evaluate overall operational efficiency. The following is a summary of key environmental indicators for 2009 and 2010.
WATER EFFICIENCY Figure 1 shows actual and normalized water use at our manufac-turing facilities for 2009 and 2010. Actual water use increased 10 percent in 2010 compared to 2009, as a result of increased wafer manufacturing, while normalized water use decreased 28 percent. We have achieved water reclaim rates of 50 percent or more at our manufacturing facilities. Some reclaimed water is used as a raw water supply to the ultra-pure water plant as well as for facility operations such as cooling towers and scrubbers.
ENERGY EFFICIENCY Figure 2 illustrates our global actual and normalized electric-ity use for 2009 and 2010. Electricity use increased as a direct result of increased wafer manufacturing in 2010. Fab 1 in Dresden receives electricity from two highly-efficient natural gas powered tri-generation Energy Centers (EVC1 and EVC2) that achieve peak efficiencies of greater than 82 percent. In addition to providing electricity, the Energy Centers provide heating and cooling to the Dresden manufacturing facilities, offering multiple opportunities to further increase overall energy productivity. In 2010, waste heat from GLOBALFOUNDRIES’ compressed air station and on-site oxygen and nitrogen production facilities was routed back to the Energy Centers, avoiding the need to add additional electricity-pow-ered cooling capacity. In Singapore, energy conservation efforts focused on lighting optimization, optimization of pumps and ad-dressing line losses in ducts and piping. GLOBALFOUNDRIES fabs at all locations continue to pursue energy conservation projects.
P E R F O R M A N C E Our commitment to safe, eco-efficient operations permeates the strategies, decisions, and ultimately the culture of our organization. Our Global EHS policy and Global EHS Standards form the foundation of integrated management systems employed at all of our manufacturing sites and set expectations beyond compliance wherever we do business, now and in the future. Our Executive Stewards Council steers these efforts at the highest level of the company to further integrate and embed a culture of EHS responsibility.
All of our manufacturing locations are certified to the ISO 14001 and OHSAS 18001 management systems standards. We will seek certification for Fab 8 once the fab is approaching full operations. Additionally, all of our operating fabs have either been certified under the Sony Green Partner program or maintain equivalent controls.
FAB 8 : O P E N H O U S E AT T E N D E E S PA I D U S $ 1 T O S I G N T H E I R N A M E S O N O N E O F T H E C O N S T R U C T I O N B E A M S . T H E M O N E Y WA S D O N AT E D T O A L O C A L FA M I L Y A F F E C T E D B Y A H O U S E F I R E .
I N 2 010 , D R E S D E N E M P L O Y E E S M A D E 13 , 5 0 0 B I K E T R I P S T O W O R K , C O V E R I N G 312 , 5 8 8 K I L O M E T E R S .
T H E K A M P U N G B O Y Z Z T E A M C E L E B R AT E S T H E I R S O C C E R C H A M P I O N S H I P I N T H E E I G H T H A N N U A L G L O B A L F O U N D R I E S S P O R T S C H A L L E N G E . T H I S S I N G A P O R E S I T E P R O G R A M P R O M O T E S A N A C T I V E , H E A L T H Y L I F E S T Y L E .
“ NYSERDA values the partnership we have developed with GLOBALFOUNDRIES that began during initial project planning, and has strengthened throughout design, construction and early stages of Fab 8 operations. Together we have identified new and rewarding opportunities to reduce greenhouse gas emissions and promote energy conservation and efficiency.”
RO B E RT C A L L E N D E RNew York State Energy Research and Development Authority,
Vice President for Programs
-
-
-
F I G U R E 1
Worldwide Actual and Normalized Water Use
1.00
0.80
0.60
0.40
0.20
0.00
14
12
10
8
6
4
2
20102009
Lite
rs / M
fg
In
de
x
Cu
bic
M
ete
rs in
M
illio
ns
Total Water Use Normalized Water Use
F I G U R E 2
Worldwide Actual and Normalized Electricity Use
0.1
0.075
0.05
0.025
0
1,500,000
1,200,000
1,000,000
750,000
500,000
250,000
0
20102009
Kilo
wa
tt-h
ou
rs / M
fg
In
de
x
Me
ga
wa
tt-h
ou
rs
Total Electricity Use Normalized Electricity Use
0.06
0.05
F I G U R E 3
Worldwide Actual and Normalized GHG Emissions
0.1
0.08
0.06
0.04
0.02
0
2,000,000
1,500,000
1,000,000
500,000
0
20102009
kg
C
O2
-e
q / M
I
Me
tric
To
ns C
O2
-e
Scope 1 GHG Emissions Scope 2 GHG Emissions
Normalized GHG Emissions
0.06
0.05
0.56
0.40
F I G U R E 4
Worldwide Actual and Normalized PFC Emissions
0.04
0.03
0.02
0.01
0.00
1,200,000
1,000,000
800,000
600,000
400,000
200,000
0
20102009
kg
C
O2
-e
/ M
fg
In
de
x
Me
tric
To
ns C
O2
-e
Total PFC Emissions Normalized PFC Emissions
0.03 0.03
Employees by Region
Americas 12%
Europe, Middle East,
Africa 26%
Asia / Asia Pacific 62%
Employees by Region
Americas 12%
Europe, Middle East,
Africa 26%
Asia / Asia Pacific 62%
F I G U R E 1
Worldwide Actual and Normalized Water Use
1.00
0.80
0.60
0.40
0.20
0.00
14
12
10
8
6
4
2
20102009
Lite
rs / M
fg
In
de
x
Millio
n C
ub
ic
M
ete
rs
Total Water Use Normalized Water Use
F I G U R E 2
Worldwide Actual and Normalized Electricity Use
0.1
0.075
0.05
0.025
0
1,500,000
1,200,000
1,000,000
750,000
500,000
250,000
0
20102009
Kilo
wa
tt-h
ou
rs / M
fg
In
de
x
Me
ga
wa
tt-h
ou
rs
Total Electricity Use Normalized Electricity Use
0.06
0.05
F I G U R E 3
Worldwide Actual and Normalized GHG Emissions
0.1
0.08
0.06
0.04
0.02
0
2,000,000
1,500,000
1,000,000
500,000
0
20102009
kg
C
O
2
-e
/ M
fg
In
de
x
Me
tric
To
ns C
O
2
-e
Scope 1 GHG Emissions Scope 2 GHG Emissions
Normalized GHG Emissions
0.06
0.05
0.56
0.41
F I G U R E 4
Worldwide Actual and Normalized PFC Emissions
0.04
0.03
0.02
0.01
0.00
1,200,000
1,000,000
800,000
600,000
400,000
200,000
0
20102009
kg
C
O
2
-e
/ M
fg
In
de
x
Me
tric
To
ns C
O
2
-e
Total PFC Emissions Normalized PFC Emissions
0.03 0.03
-
-
-
F I G U R E 1
Worldwide Actual and Normalized Water Use
1.00
0.80
0.60
0.40
0.20
0.00
14
12
10
8
6
4
2
20102009
Lite
rs / M
fg
In
de
x
Cu
bic
M
ete
rs in
M
illio
ns
Total Water Use Normalized Water Use
F I G U R E 2
Worldwide Actual and Normalized Electricity Use
0.1
0.075
0.05
0.025
0
1,500,000
1,200,000
1,000,000
750,000
500,000
250,000
0
20102009
Kilo
wa
tt-h
ou
rs / M
fg
In
de
x
Me
ga
wa
tt-h
ou
rs
Total Electricity Use Normalized Electricity Use
0.06
0.05
F I G U R E 3
Worldwide Actual and Normalized GHG Emissions
0.1
0.08
0.06
0.04
0.02
0
2,000,000
1,500,000
1,000,000
500,000
0
20102009
kg
C
O2
-e
q / M
I
Me
tric
To
ns C
O2
-e
Scope 1 GHG Emissions Scope 2 GHG Emissions
Normalized GHG Emissions
0.06
0.05
0.56
0.40
F I G U R E 4
Worldwide Actual and Normalized PFC Emissions
0.04
0.03
0.02
0.01
0.00
1,200,000
1,000,000
800,000
600,000
400,000
200,000
0
20102009
kg
C
O2
-e
/ M
fg
In
de
x
Me
tric
To
ns C
O2
-e
Total PFC Emissions Normalized PFC Emissions
0.03 0.03
Employees by Region
Americas 12%
Europe, Middle East,
Africa 26%
Asia / Asia Pacific 62%
Employees by Region
Americas 12%
Europe, Middle East,
Africa 26%
Asia / Asia Pacific 62%
F I G U R E 1
Worldwide Actual and Normalized Water Use
1.00
0.80
0.60
0.40
0.20
0.00
14
12
10
8
6
4
2
20102009
Lite
rs / M
fg
In
de
x
Millio
n C
ub
ic
M
ete
rs
Total Water Use Normalized Water Use
F I G U R E 2
Worldwide Actual and Normalized Electricity Use
0.1
0.075
0.05
0.025
0
1,500,000
1,200,000
1,000,000
750,000
500,000
250,000
0
20102009
Kilo
wa
tt-h
ou
rs / M
fg
In
de
x
Me
ga
wa
tt-h
ou
rs
Total Electricity Use Normalized Electricity Use
0.06
0.05
F I G U R E 3
Worldwide Actual and Normalized GHG Emissions
0.1
0.08
0.06
0.04
0.02
0
2,000,000
1,500,000
1,000,000
500,000
0
20102009
kg
C
O
2
-e
/ M
fg
In
de
x
Me
tric
To
ns C
O
2
-e
Scope 1 GHG Emissions Scope 2 GHG Emissions
Normalized GHG Emissions
0.06
0.05
0.56
0.41
F I G U R E 4
Worldwide Actual and Normalized PFC Emissions
0.04
0.03
0.02
0.01
0.00
1,200,000
1,000,000
800,000
600,000
400,000
200,000
0
20102009
kg
C
O
2
-e
/ M
fg
In
de
x
Me
tric
To
ns C
O
2
-e
Total PFC Emissions Normalized PFC Emissions
0.03 0.03

GREENHOUSE GAS EMISSIONSFigure 3 presents worldwide absolute and normalized Scope 1 and 2 Greenhouse Gas (GHG) emissions for our global operations. Scope 1 includes direct greenhouse gas emissions released from our facilities, including perfluorocompounds (PFCs), while Scope 2 includes indirect emissions related to the external sources of energy supporting our operations. Actual GHG emissions increased 33 percent in 2010 compared to 2009 while normalized GHG emissions declined 13 percent.
PERFLUOROCOMPOUND EMISSIONSPFCs are used for etch and chamber cleaning processes in wafer manufacturing. Fab 1 in Dresden participated in the industry-wide goal established by the World Semiconductor Council (WSC) to reduce PFC emissions 10 percent by 2010 compared to 1995. Beginning with its initial operation in the mid-1990’s, Fab 1 has applied best practices to minimize PFC emissions. Singapore is not a member of the WSC, and our fabs in Singapore were not included in the WSC process. However, several PFC reduction measures have been implemented, including substituting gases with lower global warming potential in CVD chamber cleaning. Additional reductions are currently being evaluated. As a result of significant production increases in Singapore in 2010 (compared to historically low production due to the global economic crisis in 2009), total PFC emissions increased 53 percent while normalized PFC emissions declined six percent in 2010 compared to 2009 (Figure 4).
In May 2011, the WSC announced that it had exceeded its PFC reduction goal and announced a new industry-wide goal to apply best practices for PFC reduction in all new fabs, including those built by their members anywhere in the world. These measures are expected to reduce emissions of PFCs normalized to wafer production by 30 percent from 2010 to 2020. GLOBALFOUNDRIES is aligning to the new WSC goal by implementing best practices in all new fabs – including Fab 8.
Efficient use of water and energy has been a major focus in the design of Fab 8. As a member of the New York Environmental Leaders (NYEL) Program, GLOBALFOUNDRIES set a design goal of a 40 percent reduction in incoming water demand for full production relative to a base design that assumes no water efficiency improvements. Water efficiency features that include reclaiming wastewater streams for other industrial uses, and recycling the cleanest fab rinse-waters are anticipated to reduce average incoming water demand by 40 percent. High efficiency motors, chillers, boilers, clean room fan filters, and vacuum pumps comprise some of the energy-saving features integrated into the facility. Other energy-saving features include fab support equipment, which can enter a low power “idle mode.” In addition, high-efficiency and LED lighting as well as an innovative heat recovery and reuse system are expected to reduce energy use in the administrative building by approximately 50 percent and Fab 8 by more than 25 percent. GLOBALFOUNDRIES also set an NYEL goal to divert 50 percent of non-hazardous construction waste away from landfills or incineration. At the end of 2010, the construction waste diversion rate was 79 percent.
GLOBALFOUNDRIES conducted a pilot “Carbon footprinting” project to apply the BSI PAS 2050:2008 standard, “Assess-ment of life-cycle greenhouse gas emissions of goods and services”, to a semiconductor product manufactured at Fab 1 in Dresden, Germany. Our methodology was certified by the Carbon Trust as meeting the PAS 2050 standard.
-
-
-
F I G U R E 1
Worldwide Actual and Normalized Water Use
1.00
0.80
0.60
0.40
0.20
0.00
14
12
10
8
6
4
2
20102009
Lite
rs / M
fg
In
de
x
Cu
bic
M
ete
rs in
M
illio
ns
Total Water Use Normalized Water Use
F I G U R E 2
Worldwide Actual and Normalized Electricity Use
0.1
0.075
0.05
0.025
0
1,500,000
1,200,000
1,000,000
750,000
500,000
250,000
0
20102009
Kilo
wa
tt-h
ou
rs / M
fg
In
de
x
Me
ga
wa
tt-h
ou
rs
Total Electricity Use Normalized Electricity Use
0.06
0.05
F I G U R E 3
Worldwide Actual and Normalized GHG Emissions
0.1
0.08
0.06
0.04
0.02
0
2,000,000
1,500,000
1,000,000
500,000
0
20102009
kg
C
O2
-e
q / M
I
Me
tric
To
ns C
O2
-e
Scope 1 GHG Emissions Scope 2 GHG Emissions
Normalized GHG Emissions
0.06
0.05
0.56
0.40
F I G U R E 4
Worldwide Actual and Normalized PFC Emissions
0.04
0.03
0.02
0.01
0.00
1,200,000
1,000,000
800,000
600,000
400,000
200,000
0
20102009
kg
C
O2
-e
/ M
fg
In
de
x
Me
tric
To
ns C
O2
-e
Total PFC Emissions Normalized PFC Emissions
0.03 0.03
Employees by Region
Americas 12%
Europe, Middle East,
Africa 26%
Asia / Asia Pacific 62%
Employees by Region
Americas 12%
Europe, Middle East,
Africa 26%
Asia / Asia Pacific 62%
F I G U R E 1
Worldwide Actual and Normalized Water Use
1.00
0.80
0.60
0.40
0.20
0.00
14
12
10
8
6
4
2
20102009
Lite
rs / M
fg
In
de
x
Millio
n C
ub
ic
M
ete
rs
Total Water Use Normalized Water Use
F I G U R E 2
Worldwide Actual and Normalized Electricity Use
0.1
0.075
0.05
0.025
0
1,500,000
1,200,000
1,000,000
750,000
500,000
250,000
0
20102009
Kilo
wa
tt-h
ou
rs / M
fg
In
de
x
Me
ga
wa
tt-h
ou
rs
Total Electricity Use Normalized Electricity Use
0.06
0.05
F I G U R E 3
Worldwide Actual and Normalized GHG Emissions
0.1
0.08
0.06
0.04
0.02
0
2,000,000
1,500,000
1,000,000
500,000
0
20102009
kg
C
O
2
-e
/ M
fg
In
de
x
Me
tric
To
ns C
O
2
-e
Scope 1 GHG Emissions Scope 2 GHG Emissions
Normalized GHG Emissions
0.06
0.05
0.56
0.41
F I G U R E 4
Worldwide Actual and Normalized PFC Emissions
0.04
0.03
0.02
0.01
0.00
1,200,000
1,000,000
800,000
600,000
400,000
200,000
0
20102009
kg
C
O
2
-e
/ M
fg
In
de
x
Me
tric
To
ns C
O
2
-e
Total PFC Emissions Normalized PFC Emissions
0.03 0.03
-
-
-
F I G U R E 1
Worldwide Actual and Normalized Water Use
1.00
0.80
0.60
0.40
0.20
0.00
14
12
10
8
6
4
2
20102009
Lite
rs / M
fg
In
de
x
Cu
bic
M
ete
rs in
M
illio
ns
Total Water Use Normalized Water Use
F I G U R E 2
Worldwide Actual and Normalized Electricity Use
0.1
0.075
0.05
0.025
0
1,500,000
1,200,000
1,000,000
750,000
500,000
250,000
0
20102009
Kilo
wa
tt-h
ou
rs / M
fg
In
de
x
Me
ga
wa
tt-h
ou
rs
Total Electricity Use Normalized Electricity Use
0.06
0.05
F I G U R E 3
Worldwide Actual and Normalized GHG Emissions
0.1
0.08
0.06
0.04
0.02
0
2,000,000
1,500,000
1,000,000
500,000
0
20102009
kg
C
O2
-e
q / M
I
Me
tric
To
ns C
O2
-e
Scope 1 GHG Emissions Scope 2 GHG Emissions
Normalized GHG Emissions
0.06
0.05
0.56
0.40
F I G U R E 4
Worldwide Actual and Normalized PFC Emissions
0.04
0.03
0.02
0.01
0.00
1,200,000
1,000,000
800,000
600,000
400,000
200,000
0
20102009
kg
C
O2
-e
/ M
fg
In
de
x
Me
tric
To
ns C
O2
-e
Total PFC Emissions Normalized PFC Emissions
0.03 0.03
Employees by Region
Americas 12%
Europe, Middle East,
Africa 26%
Asia / Asia Pacific 62%
Employees by Region
Americas 12%
Europe, Middle East,
Africa 26%
Asia / Asia Pacific 62%
F I G U R E 1
Worldwide Actual and Normalized Water Use
1.00
0.80
0.60
0.40
0.20
0.00
14
12
10
8
6
4
2
20102009
Lite
rs / M
fg
In
de
x
Millio
n C
ub
ic
M
ete
rs
Total Water Use Normalized Water Use
F I G U R E 2
Worldwide Actual and Normalized Electricity Use
0.1
0.075
0.05
0.025
0
1,500,000
1,200,000
1,000,000
750,000
500,000
250,000
0
20102009
Kilo
wa
tt-h
ou
rs / M
fg
In
de
x
Me
ga
wa
tt-h
ou
rs
Total Electricity Use Normalized Electricity Use
0.06
0.05
F I G U R E 3
Worldwide Actual and Normalized GHG Emissions
0.1
0.08
0.06
0.04
0.02
0
2,000,000
1,500,000
1,000,000
500,000
0
20102009
kg
C
O
2
-e
/ M
fg
In
de
x
Me
tric
To
ns C
O
2
-e
Scope 1 GHG Emissions Scope 2 GHG Emissions
Normalized GHG Emissions
0.06
0.05
0.56
0.41
F I G U R E 4
Worldwide Actual and Normalized PFC Emissions
0.04
0.03
0.02
0.01
0.00
1,200,000
1,000,000
800,000
600,000
400,000
200,000
0
20102009
kg
C
O
2
-e
/ M
fg
In
de
x
Me
tric
To
ns C
O
2
-e
Total PFC Emissions Normalized PFC Emissions
0.03 0.03
FAB 8 WATER AND ENERGY CONSERVATION AND WASTE MANAGEMENT
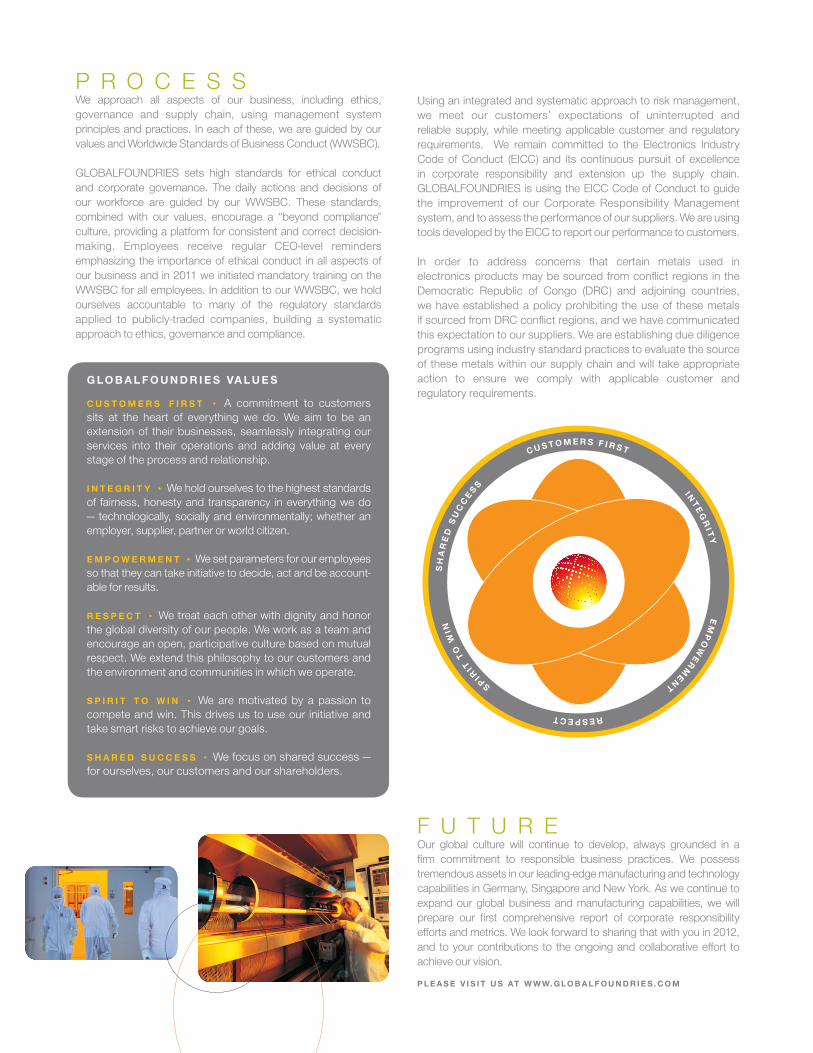
G LO B A L F O U N D R I E S VA L U E S
C U S T O M E R S F I R S T • A commitment to customers sits at the heart of everything we do. We aim to be an extension of their businesses, seamlessly integrating our services into their operations and adding value at every stage of the process and relationship.
I N T E G R I T Y • We hold ourselves to the highest standards of fairness, honesty and transparency in everything we do — technologically, socially and environmentally; whether an employer, supplier, partner or world citizen.
E M P O W E R M E N T • We set parameters for our employees so that they can take initiative to decide, act and be account-able for results.
R E S P E C T • We treat each other with dignity and honor the global diversity of our people. We work as a team and encourage an open, participative culture based on mutual respect. We extend this philosophy to our customers and the environment and communities in which we operate.
S P I R I T T O W I N • We are motivated by a passion to compete and win. This drives us to use our initiative and take smart risks to achieve our goals.
S H A R E D S U C C E S S • We focus on shared success — for ourselves, our customers and our shareholders.
F U T U R EOur global culture will continue to develop, always grounded in a firm commitment to responsible business practices. We possess tremendous assets in our leading-edge manufacturing and technology capabilities in Germany, Singapore and New York. As we continue to expand our global business and manufacturing capabilities, we will prepare our first comprehensive report of corporate responsibility efforts and metrics. We look forward to sharing that with you in 2012, and to your contributions to the ongoing and collaborative effort to achieve our vision.
P L E A S E V I S I T U S AT W W W. G LO B A L F O U N D R I E S . C O M
Using an integrated and systematic approach to risk management, we meet our customers’ expectations of uninterrupted and reliable supply, while meeting applicable customer and regulatory requirements. We remain committed to the Electronics Industry Code of Conduct (EICC) and its continuous pursuit of excellence in corporate responsibility and extension up the supply chain. GLOBALFOUNDRIES is using the EICC Code of Conduct to guide the improvement of our Corporate Responsibility Management system, and to assess the performance of our suppliers. We are using tools developed by the EICC to report our performance to customers.
In order to address concerns that certain metals used in electronics products may be sourced from conflict regions in the Democratic Republic of Congo (DRC) and adjoining countries, we have established a policy prohibiting the use of these metals if sourced from DRC conflict regions, and we have communicated this expectation to our suppliers. We are establishing due diligence programs using industry standard practices to evaluate the source of these metals within our supply chain and will take appropriate action to ensure we comply with applicable customer and regulatory requirements.
CUSTOMERS F I RST I NTEGRI T
Y E
MPOWERMEN
T RESPECT
SP
IRIT TO W
IN S
HARED S
UCCESS
P R O C E S S We approach all aspects of our business, including ethics, governance and supply chain, using management system principles and practices. In each of these, we are guided by our values and Worldwide Standards of Business Conduct (WWSBC).
GLOBALFOUNDRIES sets high standards for ethical conduct and corporate governance. The daily actions and decisions of our workforce are guided by our WWSBC. These standards, combined with our values, encourage a “beyond compliance” culture, providing a platform for consistent and correct decision-making. Employees receive regular CEO-level reminders emphasizing the importance of ethical conduct in all aspects of our business and in 2011 we initiated mandatory training on the WWSBC for all employees. In addition to our WWSBC, we hold ourselves accountable to many of the regulatory standards applied to publicly-traded companies, building a systematic approach to ethics, governance and compliance.

GLOBALFOUNDRIES, THE GLOBALFOUNDRIES LOGO AND COMBINATIONS THEREOF ARE TRADEMARKS OF GLOBALFOUNDRIES INC. IN THE UNITED STATES AND/OR OTHER JURISDICT IONS. OTHER NAMES USED IN THIS DOCUMENT ARE FOR IDENTIF ICAT ION PURPOSES ONLY AND MAY BE TRADEMARKS OF THEIR RESPECTIVE OWNERS.
THIS BROCHURE WAS PRINTED USING SOY-BASED INKS ON NEW LEAF PAPER® – MADE FROM 100% RECYCLED F IBER. ©2012 GLOBALFOUNDRIES INC. ALL R IGHTS RESERVED.
® W W W . G L O B A L F O U N D R I E S . C O M
100%