ford 2007 Q4 and Full Year Financial Result
63
FOURTH QUARTER AND FULL YEAR 2007 EARNINGS REVIEW & 2008 OUTLOOK JANUARY 24, 2008 (PRELIMINARY RESULTS)
-
Upload
quarterlyearningsreports3 -
Category
Business
-
view
499 -
download
0
Transcript of ford 2007 Q4 and Full Year Financial Result
FOURTH QUARTER AND
FULL YEAR 2007
EARNINGS REVIEW &
2008 OUTLOOK
JANUARY 24, 2008
(PRELIMINARY RESULTS)

SLIDE 1
BUSINESS OVERVIEW
Alan MulallyPresident and Chief Executive Officer

SLIDE 2
TOTAL COMPANY
2007 FOURTH QUARTER FINANCIAL RESULTS
Wholesales (000) 1,643 75 6,553 (44)Revenue (Bils.)* $ 45.5 $ 5.2 $173.9 $ 13.8
Continuing Operations*Pre-Tax Profits (Mils.) $ (620) $1,307 $ 126 $ 3,278After-Tax Profits (Mils.) (429) 1,525 (366) 2,334Earnings Per Share (0.20) 0.83 (0.19) 1.25
Special Items Pre-Tax (Mils.) $(3,852) $ (85) $(3,872) $ 8,050
Net IncomeAfter-Tax Profits (Mils.) $(2,753) $2,872 $(2,665) $9,948Earnings Per Share (1.30) 1.68 (1.35) 5.37
Automotive Gross Cash (Bils.)** $ 34.6 $ 0.7 $ 34.6 $ 0.7
* Excludes special items, see Slide 9 and Appendix for reconciliations to GAAP
** Automotive Gross Cash includes cash and cash equivalents, net marketable securities, loaned securities and short-term Voluntary Employee Beneficiary Association (VEBA) assets
Full YearFourth Quarter
2007O / (U)2006 2007
O / (U)2006

SLIDE 3
TOTAL COMPANY
2007 IN REVIEW*
• Made real progress on our plan to aggressively restructure to operate profitably, accelerate product development, finance our plan andimprove our balance sheet, and work together effectively as one team
• Reached historic four-year labor agreement with the UAW
• Achieved full-year Corporate cost reductions of $1.8 billion
• Ford North America improved by $2.5 billion compared with 2006
• Ford South America, Ford Europe, Premier Automotive Group, Ford Asia Pacific & Africa, and Mazda were all profitable for the full-year,and all achieved significant improvements compared with 2006
• Ford Credit continues to be profitable
* Profit and cost statements exclude special items; cost statements are at constant volume, mix and exchange

SLIDE 4
TOTAL COMPANY
PRODUCT HIGHLIGHTS
Ford Focus
Ford FlexLincoln MKS
Ford Mondeo
2007
2008
Ford F-150

SLIDE 5
TOTAL COMPANY
HIGHLIGHTS IN QUALITY, SAFETY AND INNOVATION
Safety InnovationQuality
GOVERNMENT CRASH TEST RATING

SLIDE 6
TOTAL COMPANY
ADDITIONAL COST IMPROVEMENT ACTIONS
• Enterprise-wide UAW Buyouts -- Two Open Windows
– Select closed plants
» Buyout window January 22 through week of February 18
» Employees separated by March 1
– All other Ford locations
» Buyout window February 18 through week of March 17
» Separations begin April 1 and complete by year end
• Sale of ACH Driveshaft Business
Revised

SLIDE 7
FINANCIAL RESULTS
Don LeclairChief Financial Officer
SLIDE 8SLIDE 8
TOTAL COMPANY
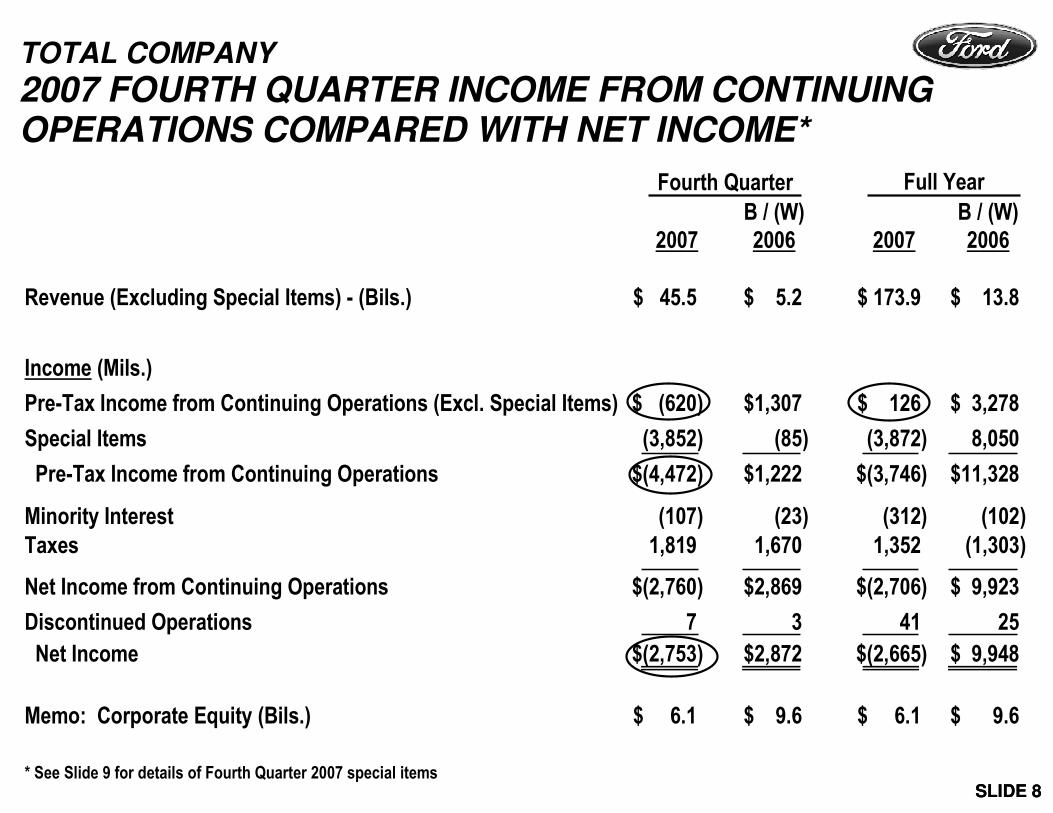
2007 FOURTH QUARTER INCOME FROM CONTINUING OPERATIONS COMPARED WITH NET INCOME*
Revenue (Excluding Special Items) - (Bils.) $ 45.5 $ 5.2 $ 173.9 $ 13.8
Income (Mils.)
Pre-Tax Income from Continuing Operations (Excl. Special Items) $ (620) $1,307 $ 126 $ 3,278
Special Items (3,852) (85) (3,872) 8,050
Pre-Tax Income from Continuing Operations $(4,472) $1,222 $(3,746) $11,328
Minority Interest (107) (23) (312) (102)
Taxes 1,819 1,670 1,352 (1,303)
Net Income from Continuing Operations $(2,760) $2,869 $(2,706) $ 9,923
Discontinued Operations 7 3 41 25
Net Income $(2,753) $2,872 $(2,665) $ 9,948
Memo: Corporate Equity (Bils.) $ 6.1 $ 9.6 $ 6.1 $ 9.6
* See Slide 9 for details of Fourth Quarter 2007 special items
Fourth Quarter
2007
Full Year
B / (W)2006 2007
B / (W)2006

SLIDE 9SLIDE 9
TOTAL COMPANY
2007 SPECIAL ITEMS FourthQuarter(Mils.)
Full Year(Mils.)
Ford North America Separation Programs $ (41) $ (750)Related OPEB Curtailment 11 1,332Related Pension Curtailment (5) (180)Gain / (Loss) on Sale of ACH Operations (1) 4
PAG Sale of Aston Martin (5) 208PAG Net Gains / (Losses) on Certain Undesignated Hedges (76) 143PAG Personnel Reduction Programs / Other (74) (187)PAG Asset Impairment (Volvo) (2,400) (2,400)
Ford Europe Personnel Reduction Programs / Other (5) (133)
Ford Asia Pacific and Africa Personnel Reduction Programs / Other (2) (23)
Gain on Exchange of Debt Security for Equity 120 120Loss on Conversion of Trust Preferred Securities 0 (632)Change in Business Practice -- Variable Marketing (1,374) (1,374)
Total Pre-Tax Special Items $(3,852) $(3,872)
Memo: Special Items Impact on Earnings Per Share $ (1.10) $ (1.18)

SLIDE 10
TOTAL COMPANY
2007 PRE-TAX PROFIT / (LOSS) BY SECTOR*
* Excludes special items; see Slide 9 and Appendix for reconciliation to GAAP
Memo:B / (W) 2006 $1,307 $1,454 $(147) $3,278 $4,020 $(742)
FinancialServices
Automotive
Fourth Quarter (Mils.)
Total FinancialServices
Automotive
Full Year (Mils.)
Total
$(620)
$(889)
$269
$1,224
$(1,098)
$126

SLIDE 11
* Excludes special items; see Slide 9 and Appendix for reconciliation to GAAP** At constant volume, exchange and mix
AUTOMOTIVE SECTOR
2007 FOURTH QUARTER AUTOMOTIVE PRE-TAX
PROFITS COMPARED WITH 2006*
(Bils.)
2006 NetPricing
CostChanges**
Volume /Mix
2007 Exchange Interest Other
Volume $0.3 Mix 0.2
$1.4
$(2.3)
$(0.9)
$0.5
$1.3
$0
$(0.1) $(0.1) $(0.2)
Memo:Full Year $(5.1) $(1.1) $0.6 $4.0 $1.8 $(0.9) $(0.8) $(0.7)

SLIDE 12
AUTOMOTIVE SECTOR
2007 FULL YEAR COST CHANGES*
2007 Costs B / (W) 2006 (Bils.)
NetProductCosts
Warranty OverheadSpending-Related
Mfg. /Engrg.
Pension /OPEB
* At constant volume, mix, and exchange; excludes special items
Advertising& Sales
Promotions
Total $1.8 Bils.
Memo:Fourth Quarter $0.1 $0 $(0.4) $0.2 $0 $0.1 $0
Incl. Commodity Costs $(1.4)
$1.0$0.8
$(1.9)
$0.7$0.8
$0.5
$(0.1)

SLIDE 13
OTHER AUTOMOTIVE
DETAIL OF FULL YEAR RESULTS
Q1(Mils.)
Q2(Mils.)
Q3(Mils.)
Q4(Mils.)
FullYear
(Mils.)
Net Interest $(219) $(180) $(159) $(190) $(748)
Fair Market Value Adj. (122) 73 188 62 201
Total $(341) $(107) $ 29 $(128) $(547)
Total B / (W) 2006 $(179) $ (22) $(524) $ (69) $(794)

SLIDE 14
AUTOMOTIVE SECTOR -- FORD NORTH AMERICA
FOURTH QUARTER KEY METRICS -- 2007 vs. 2006 Revenue (Bils.)*Wholesales (000) Pre-Tax Profits (Mils.)*
2007200620072006 20072006
Full Year 3,051 2,836 $69.4 $70.5 $(6,010) $(3,468)
Memo: U.S. Market ShareFourth Quarter 14.8% 14.1%Full Year 16.0 14.6U.S. Dealer Inventories 570 533
* Excludes special items; see Slide 9 and Appendix for reconciliation to GAAP
626$15.1
$(2,706)
$(1,554)
665 $17.0

SLIDE 15
(Bils.)
AUTOMOTIVE SECTOR -- FORD NORTH AMERICA
2007 FOURTH QUARTER AUTOMOTIVE PRE-TAX
PROFITS COMPARED WITH 2006*
20072006 Volume /Mix
NetPricing
CostChanges
Other
* Excludes special items; see Slide 9 and Appendix for reconciliation to GAAP
$1.1
Net Product Costs $(0.4) Engrg. / Advertising (0.2)Manufacturing / Overhead / Other 0.4
Exchange
Memo:Full Year $(6.0) $(3.5) $0 $2.8 $0.6 $(0.3) $(0.6)
$(2.7)
$(1.6)
$0.6
$1.0
$(0.2) $(0.1) $(0.2)Volume $0.3Mix 0.3

SLIDE 16* Ford and Lincoln Mercury
AUTOMOTIVE SECTOR -- FORD NORTH AMERICA
U.S. MARKET SHARE*
ThirdQuarter
Fleet
FourthQuarter
First Half
FullYear
2007
15.4%
5.2%
10.2%
13.4%
2.9%
10.5%
14.6%14.1%
9.8% 10.1%
4.3% 4.5%
Retail
Memo: Total (Worse) Than 2006 (1.5) Pts. (2.1) Pts. (0.7) Pts. (1.4) Pts.

SLIDE 17
AUTOMOTIVE SECTOR -- FORD NORTH AMERICA
PERSONNEL LEVELS FROM YEAR-END 2005
Salaried Personnel -- Full-Time Positions
Hourly ACH Employees*
Hourly (Excluding ACH)
December 31,2006
December 31,2007
* Excludes Supplemental Replacement Personnel
31,500
September 30,2007
23,900
77,90059,700
11,100
6,200
December 31,2006
December 31,2007
September 30,2007
December 31,2006
December 31,2007
September 30,2007
December 31,2005
December 31,2005
December 31,2005
85,600
13,900
34,50023,700
57,900
6,100

SLIDE 18
4.8
4.13.8
3.63.4
2.9 2.9
3.8
AUTOMOTIVE SECTOR -- FORD NORTH AMERICA
ASSEMBLY CAPACITY
Capacity (Millions - Annualized)
Fourth Quarter2005
Fourth Quarter2007
Third Quarter2007
Fourth Quarter2006
Maximum InstalledStraight-Time Manned

SLIDE 19
AUTOMOTIVE SECTOR -- FORD NORTH AMERICA
OPERATING COST REDUCTIONS*
Cumulative Costs B / (W) Than December 31, 2005 (Bils.)
December 31, 2007December 31, 2006
* At constant volume, mix and exchange; excludes special items
$1.5
$2.1

SLIDE 20
AUTOMOTIVE SECTOR -- FORD SOUTH AMERICA
FOURTH QUARTER KEY METRICS -- 2007 vs. 2006 Revenue (Bils.)*Wholesales (000)
Full Year 381 436 $5.7 $7.6 $551 $1,172Memo: Market Share**Fourth Quarter 11.3% 10.5% Full Year 11.5 10.7
* Excludes special items; see Slide 9 and Appendix for reconciliation to GAAP** South American 2007 market share based on estimated vehicle retail sales for our six major markets in that region
2007200620072006 20072006
Pre-Tax Profits (Mils.)*
106
$1.7
$114
126 $2.4$418

SLIDE 21
AUTOMOTIVE SECTOR -- FORD EUROPE
FOURTH QUARTER KEY METRICS -- 2007 vs. 2006
20072006
Revenue (Bils.)*
20072006
Wholesales (000)
20072006
Pre-Tax Profits (Mils.)*
Full Year 1,846 1,918 $30.4 $36.5 $455 $997
Memo: Market Share**Fourth Quarter 8.3% 8.3%Full Year 8.5 8.6
* Excludes special items; see Slide 9 and Appendix for reconciliation to GAAP** Market share for Ford Europe is based, in part, on estimated vehicle registrations for our 19 major European markets
494
$8.8
487$10.4
$218 $223

SLIDE 22
AUTOMOTIVE SECTOR -- PREMIER AUTOMOTIVE GROUP
FOURTH QUARTER KEY METRICS -- 2007 vs. 2006
20072006
Revenue (Bils.)*
20072006
Wholesales (000)
20072006
Pre-Tax Profits (Mils.)*
Full Year 730 774 $30.0 $33.2 $(344) $ 504
Memo: Market Share**
U.S. Fourth Qtr. 1.1% 1.1%U.S. Full Year 1.1 1.0
Europe Fourth Qtr. 2.2% 2.4%Europe Full Year 2.1 2.2
* Excludes special items; see Slide 9 and Appendix for reconciliation to GAAP** European 2007 market share for PAG is based, in part, on estimated vehicle registrations for our 19 major European markets
200 $8.6
$174
$59
204 $9.0

SLIDE 23
AUTOMOTIVE SECTOR -- FORD ASIA PACIFIC AND AFRICA / MAZDA
2007 PRE-TAX PROFITS*
* Excludes special items; see Slide 9 and Appendix for reconciliation to GAAP
Memo:B / (W) 2006 $177 $145 $32 $261 $225 $36
Fourth Quarter (Mils.)
Asia Pacificand
Africa / Mazda
Asia Pacificand Africa
Mazda andAssoc.
Operations
Full Year (Mils.)
Asia Pacificand
Africa / Mazda
Asia Pacificand Africa
Mazda andAssoc.
Operations
$93
$10
$83
$204
$40
$244

SLIDE 24
AUTOMOTIVE SECTOR -- FORD ASIA PACIFIC AND AFRICA
FOURTH QUARTER KEY METRICS -- 2007 vs. 2006
20072006
Revenue (Bils.)*
20072006
Wholesales (000) Pre-Tax Profits (Mils.)*
Full Year 517 535 $6.5 $7.0 $(185) $40
Memo: Market Share** Fourth Quarter 2.5% 2.4%Full Year 2.4 2.3
20072006
* Excludes special items; see Slide 9 and Appendix for reconciliation to GAAP** Asia Pacific and Africa 2007 market share is based on estimated vehicle sales for our twelve major markets in that region
125
$1.4
$(135)
145
$10
$1.7

SLIDE 25
AUTOMOTIVE SECTOR
2007 CASH* FourthQuarter(Bils.)
Cash, Net Marketable Securities, Loaned Securities, Short-Term VEBA AssetsDecember 31, 2007 $34.6 $34.6September 30, 2007 / December 31, 2006 35.6 33.9
Change in Gross Cash $(1.0) $ 0.7
Operating-Related Cash FlowAutomotive Pre-Tax Profits** $(0.9) $ (1.1)Capital Spending (1.8) (6.0)Depreciation and Amortization 1.6 6.8Changes in Receivables, Inventory, and Trade Payables (0.8) (0.7)Other -- Including Expense and Payment Timing Differences 0.7 1.4
Total Automotive Operating-Related Cash Flow $(1.2) $ 0.4
Other Changes in CashCash Impact of Jobs Bank / Employee Separation Programs $(0.3) $(2.5)Pension Contributions (0.2) (1.6)Net Effect of VEBA on Cash 0.2 1.2Tax Refunds, Tax Payments, and Tax Receipts from Affiliates 0.7 2.6Divestitures 0.1 1.1All Other -- Including Changes in Auto Sector Debt (0.3) (0.5)
Total Change in Gross Cash $(1.0) $ 0.7
* See Appendix for reconciliation to GAAP** Excludes special items; see Slide 9 and Appendix for reconciliation to GAAP
Full Year(Bils.)

SLIDE 26
AUTOMOTIVE SECTOR
AUTOMOTIVE FINANCIAL RESOURCES
Cash and Marketable Securities* $ 32.7
Short-Term VEBA** 1.9
Gross Cash $ 34.6
Available Automotive Credit Lines
(Secured and Unsecured)*** 11.9
Total Liquidity $ 46.5
Memo:
Long-Term VEBA $ 2.0
Debt 26.7
* Includes cash and cash equivalents, net marketable securities and loaned securities
** Historically, amounts accessible within 18 months -- short-term VEBA will no longer be reported within gross cashas of January 1, 2008, consistent with new UAW VEBA agreement, which is subject to court approval
*** Total committed secured and unsecured automotive credit lines (including local lines available to foreign affiliates) were $13.1 billion on December 31, 2007
Dec. 31, 2007(Bils.)

SLIDE 27
FINANCIAL SERVICES SECTOR
2007 PRE-TAX PROFIT / (LOSS) BY SEGMENT
* Includes a net gain of $40 million in the Fourth Quarter, and a net loss of $108 million in the Full Year related to market valuationadjustments from derivatives
Memo:B / (W) 2006 $(147) $(143) $(4) $(742) $(738) $(4)
Fourth Quarter (Mils.)
Total FordCredit
Other
$6
$263*$269
Full Year (Mils.)
Total FordCredit
Other
$1,224 $1,215*
$9

SLIDE 28
(Bils.)
FINANCIAL SERVICES SECTOR
2007 FOURTH QUARTER FORD CREDIT PRE-TAX PROFIT
COMPARED WITH 2006
FinancingMargin
LeaseResidual
Volume20072006 CreditLoss
Other SFAS 133*
$(0.2)
Full Year $1.9 $1.2 $0 $(0.4) $(0.5) $(0.4) $0.3 $0.3
* Market valuation adjustments from derivatives
$0.3
$0.4
$0
$(0.1)
$(0.2)
$(0.1)
$0.2
$0.1
$(0.1)

SLIDE 29
FINANCIAL SERVICES SECTOR
FORD CREDIT LIQUIDITY AND FUNDING STRATEGY
• Maintain strong liquidity to meet near-term funding obligations
– Hold substantial cash balance
– Continue to expand and diversify global asset-backed funding capabilities
– Renew committed asset-backed funding capacity (including outside of U.S.)
– Potentially issue unsecured term debt
• Continue to explore and execute various alternative business arrangements
• Resume regular distributions beginning in 2008
Committed Capacity / Liquidity
* Subject to availability of sufficient assets** To be used only to support on-balance sheet securitization transactions
*** Capacity in excess of eligible receivables as well as cash to support on-balance sheet securitization transactions**** Cash, cash equivalents and marketable securities (excludes marketable securities related to insurance activities)
Utilizationof Liquidity
CommittedCapacity *
Cash**** Total
$4.7**
$16.7
$73.5
$9.5***
$64.0
$56.8
CommittedCapacity &Cash****
Liquidity
December 31, 2007 (Bils.)
CommittedCapacity
UnsecuredCP
Total
$0.5
$35.6 $36.1
December 31, 2007 (Bils.)
$28

SLIDE 30
TOTAL COMPANY
PENSION UPDATE
• Worldwide Pre-Tax Expense (Bils.) $ 4.9 $ 2.0
Memo: Excluding Special Items 1.4 0.8
• Worldwide Pension Fund Contributions (Bils.) $ 0.8 $ 1.6
(Funded Plans)
• Year-End Over / (Under) Funded Status (Bils.)
– U.S. -- Funded Only $1.1 $ 2.8
– U.S. -- Total (0.6) 1.3
– Worldwide* (7.7) (3.1)
• Actual U.S. Asset Returns 14.2% 11.3%
U.S. Assumptions (Year-End)
• Expected Long-Term Asset Return 8.50% 8.25%
• Discount Rate -- Weighted Average 5.86% 6.25%
* Excludes Held for Sale operations
2006 2007

SLIDE 31
2006 2007
TOTAL COMPANY
OTHER POSTRETIREMENT EMPLOYEE BENEFITS (OPEB)
• Worldwide Pre-Tax Expense (Bils.) $ 2.2 $ 0.4
Memo: Excluding Special Items 2.1 1.7
• Worldwide Retiree Benefit Payments (Bils.) $ 1.5 $ 1.6
• Year-End VEBA Balance (Bils.) $ 4.9 $ 3.9
• Worldwide Year-End Over / (Under) Funded Status (Bils.) $(25.9) $(24.2)
U.S. Assumptions (Year-End)
• Cost Trends
- Initial Trend Rate 6% 3%
- Year Ultimate Trend Rate of 5% Reached 2011 2011
• Discount Rate -- Weighted Average 5.98% 6.45%

SLIDE 32
AUTOMOTIVE SECTOR
2007 PLANNING ASSUMPTIONS AND
OPERATIONAL METRICS
Planning Assumptions
Industry Volume (SAAR) -- U.S. (Mils.) 16.8 16.5-- Europe (Mils.)* 17.6 18.0
Operational MetricsCompared with 2006
- Quality Improved Improved- Market Share
» U.S. (Ford and Lincoln Mercury) Lower Lower» Other Regions Higher Mixed
- Automotive Costs** Improved $1.8 Billion Improved
Absolute Amount- Operating-Related Cash Flow Negative $0.4 Billion Positive- Capital Spending ~ $7 Billion $6.0 Billion
* European 19 markets
** At constant volume, mix, and exchange; excludes special items
PlanFull YearResults

SLIDE 33
2008 OUTLOOK

SLIDE 34
Planning AssumptionsIndustry Volume (SAAR) -- U.S. (Mils.) 16.0
-- Europe (Mils.)* 17.6
Operational MetricsCompared with 2007
- Quality Improve- Automotive Costs** Improve by about $3 Billion
Absolute Amount- U.S. Market Share (Ford and Lincoln Mercury) Low End of 14-15% Range- Operating-Related Cash Flow Negative- Capital Spending Around $6 Billion
* European 19 markets ** At constant volume, mix, and exchange; excludes special items
Plan
AUTOMOTIVE SECTOR
2008 PLANNING ASSUMPTIONS AND
OPERATING METRICS

SLIDE 35
NORTH AMERICA
OPERATING COST REDUCTIONS*
2006(Bils.)
2007(Bils.)
Proj.2008(Bils.)
Net Product Costs
Product Adds $(0.9) $(2.0) $ (0.6)
Commodities (0.3) (0.8) (0.3) - (0.4)
Material Cost Reductions 1.2 0.8 0.9 - 1.2
Subtotal $ 0 $(2.0) $ 0 - 0.2
Structural / Other 1.5 2.6 2.6 - 3.0
Total $ 1.5 $ 0.6 $ 2.6 - 3.2
* At constant volume, mix, and exchange; excludes special items
$5 billion

SLIDE 36
TOTAL COMPANY
2008 OUTLOOK
Automotive** Loss Equal to orBetter
Financial Services Profit Equal
Pre-Tax Operating Results** Loss Equal to or Better
Special Items Loss Better
Pre-Tax Results Loss Better
Net Income Loss Better
* Adjusted to exclude Jaguar / Land Rover
** Excludes special items
OutlookComparison
To 2007*

SLIDE 37
AUTOMOTIVE SECTOR
2008 FIRST QUARTER PRODUCTION VOLUMES
North America 685 (55)
Europe 530 7
Volvo 112 (23)
Units(000)
O / (U)2007(000)

SLIDE 38
TOTAL COMPANY
FORWARD YEAR KEY BUSINESS METRICS
• Profitable in North America andTotal Automotive in 2009 On Plan
• $5 billion cost reductions in North Americaby 2008 compared with 2005* On Plan
• 14-15% U.S. market share Low End of Range(Ford and Lincoln Mercury) for 2008
• $12 - $14 billion cash outflow in 2007 - 2009 to fund operating losses and restructuring On Plan(employee separations)
* At constant volume, mix, and exchange; excludes special items
Status

SLIDE 39
TOTAL COMPANY
ACHIEVING OUR PLAN
• Our operations outside of North America are performing well and we have many new products in 2008 in Europe, Asia and South America
• In North America, the U.S. economy is slowing, and the outlook for the automotive industry is challenging
– We outperformed our 2007 profit and cash targets, and our 2008 plan is based on prudent assumptions
– Many new products in mid-2008, including the new Ford F-150, all-new Ford Flex, and all-new Lincoln MKS in North America
– Aggressive plans in North America to improve our business:
» Focus on structural cost
» Continue and accelerate the flow of new products
» Reduce complexity
» Continue to adjust production to the changing business environment
• Overall, continue to monitor progress closely, and react accordingly

SLIDE 40
TOTAL COMPANY
OUR KEY PRIORITIES
• Aggressively restructure to operate profitably at the current demand and changing model mix
• Accelerate development of new products our customers want and value
• Finance our plan and improve our balance sheet
• Work together effectively as one team

SLIDE 41
SAFE HARBORRisk FactorsStatements included herein may constitute “forward-looking statements” within the meaning of the Private Securities Litigation ReformAct of 1995. Forward-looking statements are based on expectations, forecasts and assumptions by our management and involve a number of risks, uncertainties,and other factors that could cause actual results to differ materially from those stated, including, without limitation:
• Continued decline in market share;• Continued or increased price competition resulting from industry overcapacity, currency fluctuations or other factors;• An increase in or acceleration of market shift away from sales of trucks, sport utility vehicles, or other more profitable vehicles, particularly in the United States; • A significant decline in industry sales, particularly in the United States or Europe, resulting from slowing economic growth, geo-political events or other factors;• Lower-than-anticipated market acceptance of new or existing products;• Continued or increased high prices for or reduced availability of fuel;• Currency or commodity price fluctuations; • Adverse effects from the bankruptcy or insolvency of, change in ownership or control of, or alliances entered into by a major competitor;• Economic distress of suppliers that has in the past and may in the future require us to provide financial support or take other measures to ensure supplies of
components or materials;• Labor or other constraints on our ability to restructure our business; • Work stoppages at Ford or supplier facilities or other interruptions of supplies; • Single-source supply of components or materials;• Substantial pension and postretirement health care and life insurance liabilities impairing our liquidity or financial condition;• Inability to implement Memorandum of Understanding with UAW to fund and discharge retiree health care obligations because of failure to obtain court approval
or otherwise;• Worse-than-assumed economic and demographic experience for our postretirement benefit plans (e.g., discount rates, investment returns, and health care cost
trends);• The discovery of defects in vehicles resulting in delays in new model launches, recall campaigns or increased warranty costs;• Increased safety, emissions (e.g., CO
2), fuel economy, or other regulation resulting in higher costs, cash expenditures, and/or sales restrictions;
• Unusual or significant litigation or governmental investigations arising out of alleged defects in our products or otherwise;• A change in our requirements for parts or materials where we have entered into long-term supply arrangements that commit us to purchase minimum or fixed
quantities of certain parts or materials, or to pay a minimum amount to the seller ("take-or-pay" contracts);• Adverse effects on our results from a decrease in or cessation of government incentives; • Adverse effects on our operations resulting from certain geo-political or other events; • Substantial negative Automotive operating-related cash flows for the near- to medium-term affecting our ability to meet our obligations, invest in our business or
refinance our debt;• Substantial levels of Automotive indebtedness adversely affecting our financial condition or preventing us from fulfilling our debt obligations (which may grow
because we are able to incur substantially more debt, including additional secured debt);• Inability of Ford Credit to access debt or securitization markets around the world at competitive rates or in sufficient amounts due to additional credit rating
downgrades, market volatility, market disruption or otherwise;• Higher-than-expected credit losses; • Increased competition from banks or other financial institutions seeking to increase their share of financing Ford vehicles;• Changes in interest rates;• Collection and servicing problems related to finance receivables and net investment in operating leases; • Lower-than-anticipated residual values or higher-than-expected return volumes for leased vehicles; and• New or increased credit, consumer or data protection or other regulations resulting in higher costs and/or additional financing restrictions.
We cannot be certain that any expectation, forecast or assumption made by management in preparing forward-looking statements will prove accurate, or that anyprojection will be realized. It is to be expected that there may be differences between projected and actual results. Our forward-looking statements speak only asof the date of their initial issuance, and we do not undertake any obligation to update or revise publicly any forward-looking statement, whether as a result of newinformation, future events, or otherwise. For additional discussion of these risks, see "Item 1A. Risk Factors" in our 2006 Form 10-K Report.

APPENDIX

TOTAL COMPANY
CALCULATION OF EARNINGS PER SHARE
NetIncome(Mils.)
NumeratorNet Income $(2,753) $ (429) $(2,665) $ (366)Impact on Income from assumed exchangeof convertible notes and convertible trustpreferred securities 0 0 0 0
Income for EPS $(2,753) $ (429) $(2,665) $ (366)
DenominatorAverage shares outstanding 2,122 2,122 1,978 1,978Net issuable shares, primarily stock options 0 0 0 0Convertible notes 0 0 0 0Convertible trust preferred securities 0 0 0 0
Average shares for EPS 2,122 2,122 1,978 1,978
EPS $ (1.30) $(0.20) $ (1.35) $(0.19)
Appendix 1 of 20
Cont. Ops. --Excl.
Special Items(Mils.)
Fourth Quarter 2007
NetIncome(Mils.)
Cont. Ops. --Excl.
Special Items(Mils.)
Full Year 2007

TOTAL COMPANY
2007 FOURTH QUARTER EFFECTIVE TAX RATE
PBT $(620) $(4,472)
Less: Unconsolidated Subsidiaries (129) (129)
Adjusted PBT $(749) $262 35.0% $(4,601) $1,610 35.0%
Tax Credits / Adjustments 300 40.0 1,791 38.9
Ongoing Tax Before Valuation Allow. $562 75.0% $3,401 73.9%
Deferred Tax Asset Valuation Allowance (264) (35.2) (1,582) 34.4
Tax Provision $298 39.8% $1,819 39.5%
Appendix 2 of 20
PBT(Mils.)
Taxes(Mils.)
Tax Rate(Pct.)
Taxes(Mils.)
Tax Rate(Pct.)
Excluding Special Items Including Special Items
PBT(Mils.)
Continuing Operations

TOTAL COMPANY
2007 FULL YEAR EFFECTIVE TAX RATE
PBT $ 126 $(3,746)
Less: Unconsolidated Subsidiaries (403) (403)
Adjusted PBT $(277) $ 97 35.0% $(4,149) $1,452 35.0%
Tax Credits / Adjustments 391 141.2 1,631 39.3
Ongoing Tax Before Valuation Allowance $ 488 176.2% $3,083 74.3%
Deferred Tax Asset Valuation Allowance (668) (241.2) (1,731) (41.7)
Tax Provision $(180) (65.0)% $1,352 32.6%
Appendix 3 of 20
PBT(Mils.)
Taxes(Mils.)
Tax Rate(Pct.)
Taxes(Mils.)
Tax Rate(Pct.)
Excluding Special Items Including Special Items
PBT(Mils.)
Continuing Operations

TOTAL COMPANY
2006 – 2007 FOURTH QUARTER PRE-TAX RESULTS*
North America $(6,020) $(2,689) $(3,314) $(1,135) $(2,706) $(1,554)South America 114 418 0 0 114 418Total Americas $(5,906) $(2,271) $(3,314) $(1,135) $(2,592) $(1,136)
Europe $ 178 $ 98 $ (40) $ (125) $ 218 $ 223P.A.G. (114) (2,636) (288) (2,695) 174 59Total Europe / P.A.G. $ 64 $(2,538) $ (328) $(2,820) $ 392 $ 282
Asia Pacific and Africa $ (200) $ (7) $ (65) $ (17) $ (135) $ 10Mazda & Assoc. Operations (9) 83 (60) 0 51 83Total AP and Africa / Mazda $ (209) $ 76 $ (125) $ (17) $ (84) $ 93Subtotal Automotive Ops. $(6,051) $(4,733) $(3,767) $(3,972) $(2,284) $ (761)
Other Auto. (Primarily Interest) (59) (8) 0 120 (59) (128)Total Automotive $(6,110) $(4,741) $(3,767) $(3,852) $(2,343) $ (889)
Financial Services 416 269 0 0 416 269Total Company $(5,694) $(4,472) $(3,767) $(3,852) $(1,927) $ (620)
* From continuing operations
2007(Mils.)
Pre-Tax Profits(Incl. Special Items) Special Items
Pre-Tax Profits(Excl. Special Items)
2007(Mils.)
2007(Mils.)
Appendix 4 of 20
2006(Mils.)
2006(Mils.)
2006(Mils.)

TOTAL COMPANY
2006 – 2007 FULL YEAR PRE-TAX RESULTS*
North America $(15,992) $(4,161) $ (9,982) $ (693) $(6,010) $(3,468)South America 661 1,172 110 0 551 1,172Total Americas $(15,331) $(2,989) $ (9,872) $ (693) $(5,459) $(2,296)
Europe $ 371 $ 744 $ (84) $ (253) $ 455 $ 997P.A.G. (2,322) (1,872) (1,978) (2,376) (344) 504Total Europe / P.A.G. $ (1,951) $(1,128) $ (2,062) $(2,629) $ 111 $ 1,501
Asia Pacific and Africa $ (250) $ 2 $ (65) $ (38) $ (185) $ 40Mazda & Assoc. Operations 245 204 77 0 168 204Total AP and Africa / Mazda $ (5) $ 206 $ 12 $ (38) $ (17) $ 244Subtotal Automotive Ops. $(17,287) $(3,911) $(11,922) $(3,360) $(5,365) $ (551)
Other Auto. (Primarily Interest) 247 (1,059) 0 (512) 247 (547)Total Automotive $(17,040) $(4,970) $(11,922) $(3,872) $(5,118) $(1,098)
Financial Services 1,966 1,224 0 0 1,966 1,224Total Company $(15,074) $(3,746) $(11,922) $(3,872) $(3,152) $ 126
* From continuing operations
2007(Mils.)
Pre-Tax Profits(Incl. Special Items) Special Items
Pre-Tax Profits(Excl. Special Items)
2007(Mils.)
2007(Mils.)
Appendix 5 of 20
2006(Mils.)
2006(Mils.)
2006(Mils.)

TOTAL COMPANY
2006 – 2007 FOURTH QUARTER REVENUE*
North America $15,075 $15,846 $ 0 $(1,099) $15,075 $16,945 South America 1,723 2,411 0 0 1,723 2,411Total Americas $16,798 $18,257 $ 0 $(1,099) $16,798 $19,356
Europe $ 8,819 $10,167 $ 0 $ (120) $ 8,819 $10,287P.A.G. 8,645 8,884 0 (140) 8,645 9,024Total Europe / P.A.G. $17,464 $19,051 $ 0 $ (260) $17,464 $19,311
Asia Pacific and Africa $ 1,389 $ 1,753 $ 0 $ (15) $ 1,389 $ 1,768Mazda & Assoc. Operations 285 312 0 0 285 312Total AP and Africa / Mazda $ 1,674 $ 2,065 $ 0 $ (15) $ 1,674 $ 2,080
Total Automotive $35,936 $39,373 $ 0 $(1,374) $35,936 $40,747
Financial Services 4,367 4,743 0 0 4,367 4,743
Total Company $40,303 $44,116 $ 0 $(1,374) $40,303 $45,490
* From continuing operations
2007(Mils.)
Revenue(Incl. Special Items) Special Items
Revenue(Excl. Special Items)
2007(Mils.)
2007(Mils.)
Appendix 6 of 20
2006(Mils.)
2006(Mils.)
2006(Mils.)

TOTAL COMPANY
2006 – 2007 FULL YEAR REVENUE*
North America $ 69,367 $ 69,365 $ 0 $(1,099) $ 69,367 $ 70,464South America 5,697 7,585 0 0 5,697 7,585Total Americas $ 75,064 $ 76,950 $ 0 $(1,099) $ 75,064 $ 78,049
Europe $ 30,394 $ 36,330 $ 0 $ (120) $ 30,394 $ 36,450P.A.G. 30,028 33,067 0 (140) 30,028 33,207Total Europe / P.A.G. $ 60,422 $ 69,397 $ 0 $ (260) $ 60,422 $ 69,657
Asia Pacific and Africa $ 6,539 $ 7,031 $ 0 $ (15) $ 6,539 $ 7,046Mazda & Assoc. Operations 1,224 1,001 0 0 1,224 1,001Total AP and Africa / Mazda $ 7,763 $ 8,032 $ 0 $ (15) $ 7,763 $ 8,047
Total Automotive $143,249 $154,379 $ 0 $(1,374) $143,249 $155,753
Financial Services 16,816 18,076 0 0 16,816 18,076Total Company $160,065 $172,455 $ 0 $(1,374) $160,065 $173,829
* From continuing operations
2007(Mils.)
Revenue(Incl. Special Items) Special Items
Revenue(Excl. Special Items)
2007(Mils.)
2007(Mils.)
Appendix 7 of 20
2006(Mils.)
2006(Mils.)
2006(Mils.)

TOTAL COMPANY
FOURTH QUARTER EMPLOYMENT DATA BY
BUSINESS UNIT*
Automotive
North America 96 94
South America 14 14
Total Americas 110 108
Europe 67 67
P.A.G 42 42
Total Europe / P.A.G. 109 109
Asia Pacific and Africa 17 17
Total Automotive Operations 236 234
Financial Services 12 11
Total Company 248 245
Appendix 8 of 20
Sept. 30,2007 (000)
Dec. 31,2007 (000)
* This slide includes the approximate number of individuals employed by us and our consolidated entities (including entities we do not control)

TOTAL COMPANY
2007 FOURTH QUARTER SUMMARY
* Excludes special items; see Slide 9 and Appendix for reconciliation to GAAP
** Included in wholesales of Asia Pacific and Africa are Ford-badged vehicles sold in China and Malaysia by certain unconsolidated affiliatestotaling about 62,000 and 49,000 units in 2007 and 2006, respectively. “Revenue” above does not include revenue from these units
*** Includes consolidation of Automotive Alliance International (AAI): wholesales and revenue from production of Mazda6 vehicles only; pre-tax profits include Ford’s share of Mazda’s results and profits from AAI’s production of Mazda6 vehicles only
North America 626 665 $15,075 $16,945 $(2,706) $(1,554)South America 106 126 1,723 2,411 114 418
Total Americas 732 791 $16,798 $19,356 $(2,592) $(1,136)
Europe 494 487 $ 8,819 $10,287 $ 218 $ 223P.A.G. 200 204 8,645 9,024 174 59
Total Europe / P.A.G. 694 691 $17,464 $19,311 $ 392 $ 282
Asia Pacific and Africa** 125 145 $ 1,389 $ 1,768 $ (135) $ 10Mazda and Assoc. Operations*** 17 16 285 312 51 83
Total AP and Africa / Mazda 142 161 $ 1,674 $ 2,080 $ (84) $ 93Subtotal Automotive Ops. 1,568 1,643 $35,936 $40,747 $(2,284) $ (761)
Other Auto. (Primarily Interest) 0 0 0 0 (59) (128)Total Automotive 1,568 1,643 $35,936 $40,747 $(2,343) $ (889)
Financial Services 0 0 4,367 4,743 416 269Total Company 1,568 1,643 $40,303 $45,490 $(1,927) $ (620)
2007(000)
Wholesales Revenue* Pre-Tax Profits*2007
(Mils.)2007(Mils.)
2006(Mils.)
2006(Mils.)
2006(000)
Appendix 9 of 20

TOTAL COMPANY
2007 FULL YEAR SUMMARY
* Excludes special items; see Slide 9 and Appendix for reconciliation to GAAP
** Included in wholesales of Asia Pacific and Africa are Ford-badged vehicles sold in China and Malaysia by certain unconsolidated affiliatestotaling about 159,000 and 205,000 units in 2007 and 2006, respectively. “Revenue” above does not include revenue from these units
*** Includes consolidation of Automotive Alliance International (AAI): wholesales and revenue from production of Mazda6 vehicles only; pre-tax profits include Ford’s share of Mazda’s results and profits from AAI’s production of Mazda6 vehicles only
North America 3,051 2,836 $ 69,367 $ 70,464 $(6,010) $(3,468)South America 381 436 5,697 7,585 551 1,172
Total Americas 3,432 3,272 $ 75,064 $ 78,049 $(5,459) $(2,296)
Europe 1,846 1,918 $ 30,394 $ 36,450 $ 455 $ 997P.A.G. 730 774 30,028 33,207 (344) 504
Total Europe / P.A.G. 2,576 2,692 $ 60,422 $ 69,657 $ 111 $ 1,501
Asia Pacific and Africa** 517 535 $ 6,539 $ 7,046 $ (185) $ 40Mazda and Assoc. Operations*** 72 54 1,224 1,001 168 204
Total AP and Africa / Mazda 589 589 $ 7,763 $ 8,047 $ (17) $ 244Subtotal Automotive Ops. 6,597 6,553 $143,249 $155,753 $(5,365) $ (551)
Other Auto. (Primarily Interest) 0 0 0 0 247 (547)Total Automotive 6,597 6,553 $143,249 $155,753 $(5,118) $(1,098)
Financial Services 0 0 16,816 18,076 1,966 1,224Total Company 6,597 6,553 $160,065 $173,829 $(3,152) $ 126
2007(000)
Wholesales Revenue* Pre-Tax Profits*2007
(Mils.)2007(Mils.)
2006(Mils.)
2006(Mils.)
2006(000)
Appendix 10 of 20

AUTOMOTIVE SECTOR
2007 FOURTH QUARTER MARKET RESULTS
U.S.Industry SAAR (Mils.) 16.3 (0.4) 16.5 (0.6) Market Share (Pct.)- Ford and Lincoln Mercury 14.1% (0.7) Pts. 14.6% (1.4) Pts.- P.A.G. 1.1 0 1.0 (0.1)
Total U.S. Market Share 15.2% (0.7) Pts. 15.6% (1.5) Pts.
EuropeIndustry SAAR (Mils.) 18.0 0.1 18.0 0.2Market Share (Pct.)*- Ford 8.3% 0 Pts. 8.6% 0.1 Pts.- P.A.G. 2.4 0.2 2.2 0.1
Total Europe Market Share 10.7% 0.2 Pts. 10.8% 0.2 Pts.
Other RegionsFord Brand Market Share (Pct.)- South America** 10.5% (0.8) Pts. 10.7% (0.8) Pts.- Asia Pacific and Africa*** 2.4 (0.1) 2.3 (0.1)
* European market share for Ford Europe and P.A.G. is based, in part, on estimated vehicle registrations for our 19 major European markets
** South American market share based on estimated vehicle retail sales for our six major markets in that region
*** Asia Pacific and Africa market share is based on estimated vehicle sales for our twelve major markets in that region
AbsoluteB / (W)2006
Appendix 11 of 20
Fourth Quarter
AbsoluteB / (W)2006
Full Year

AUTOMOTIVE SECTOR
COSTS AND EXPENSES
Total Costs and Expenses $42,146 $44,198 $(2,052) $161,193 $158,647 $2,546
Select Cost Items:
Depreciation and Amortization
- Depreciation $ 880 $ 799 $ 81 $ 3,952 $ 3,474 $ 478
- Amortization -- Special Tools 944 839 105 3,406 3,289 117
- Fixed Asset Impairment 0 0 0 3,800 0 3,800
Total Deprec. / Amortization $ 1,824 $ 1,648 $ 186 $ 11,158 $ 6,763 $4,395
Postretirement Expense $ 2,600 $ 700 $ 1,900 $ 7,000 $ 2,400 $4,600
Appendix 12 of 20
2006(Mils.)
2007(Mils.)
2007B / (W)2006(Mils.)
Fourth Quarter
2006(Mils.)
2007(Mils.)
2007B / (W)2006(Mils.)
Full Year

AUTOMOTIVE SECTOR
PRODUCTION VOLUMES
North America 641 35 2,829 (192)
Europe 489 7 1,940 80
P.A.G. 187 8 753 59
Units(000)
O / (U)2006(000)
Units(000)
O / (U)2006(000)
Full YearActual
Fourth QuarterActual
2007
Appendix 13 of 20

AUTOMOTIVE SECTOR
GROSS CASH RECONCILIATION TO GAAP
Cash and Cash Equivalents $16.0 $20.7 $ 4.7 $18.9
Marketable Securities 11.3 2.0 (9.3) 7.2
Loaned Securities 5.3 10.3 5.0 7.8
Total Cash / Market. and Loaned Securities $32.6 $33.0 $ 0.4 $33.9
Securities-In-Transit (0.5) (0.3) 0.2 (0.4)
Short-Term VEBA Assets* 1.8 1.9 0.1 2.1
Gross Cash $33.9 $34.6 $ 0.7 $35.6
* Historically, amounts accessible within 18 months -- short-term VEBA will no longer be reported within gross cash as of January 1, 2008,
consistent with new UAW VEBA agreement, which is subject to court approval
Appendix 14 of 20
Dec. 31, 2007B / (W)
Dec. 31, 2006(Bils.)
Dec. 31,2007(Bils.)
Dec. 31,2006(Bils.)
Sept. 30, 2007(Bils.)
Memo:

AUTOMOTIVE SECTOR
GAAP RECONCILIATION OF
OPERATING-RELATED CASH FLOWS
Cash Flows from Operating Activities of Continuing Operations $ 2.8 $12.0 $ 8.7 $12.9
Items Included in Operating-Related Cash Flows- Capital Expenditures (1.8) (0.2) (6.0) 0.8- Net Transactions Between Automotive and
Financial Services Sector 0.5 0.5 (0.3) 0.3- Net Cash Flows from Non-Designated Derivatives 0.3 0.1 1.1 0.9
Items Not Included in Operating-Related Cash Flows- Cash Impact of Jobs Bank Benefits & Separation Programs 0.3 (0.1) 2.5 1.3- Net (Sales) / Purchases of Trading Securities (2.7) (11.3) (4.5) (11.3)- Pension Contributions 0.2 0 1.6 0.8- VEBA Cash Flows -- Net Reimbursement for Benefits Paid (0.4) (0.1) (1.1) 1.8- Tax Refunds and Tax Payments from Affiliates (0.7) (0.7) (2.6) (2.3)- Other 0.3 0.4 1.0 0.8
Operating-Related Cash Flows $(1.2) $ 0.6 $ 0.4 $ 6.0
Appendix 15 of 20
Absolute(Bils.)
Fourth Quarter 2007B / (W)Than2006(Bils.)
Absolute(Bils.)
Full YearB / (W)Than2006(Bils.)

Key Metrics*Pre-Tax Profits (Mils.) Fourth Quarter
Receivables (Bils.)On-Balance Sheet $135.3 $141.1Securitized Off-Balance Sheet 12.2 6.0
Managed $147.5 $147.1Charge-Offs (Mils.)On-Balance Sheet $ 189 $ 216Managed 210 233Loss-to-Receivables RatioOn-Balance Sheet 0.56% 0.61%Managed- U.S. Retail and Lease 0.75 1.13- Worldwide Total 0.56 0.62Allow. for Credit LossesWorldwide Amount (Bils.) $ 1.1 $ 1.1Pct. Of EOP Receivables 0.81% 0.77%Leverage (To 1)Financial Statement 11.9 10.4Managed 11.4 9.8Dividend/Distribution (Bils.) $ 0.4 $ 0Net Income (Mils.) $ 279 $ 186
2006 2007
Fourth Quarter2006
Fourth Quarter2007
* See Appendix for calculation, definitions and reconciliation to GAAP** Market valuation adjustments from derivatives
FINANCIAL SERVICES SECTOR
FORD CREDIT RESULTS AND METRICS --2007 FOURTH QUARTER
Appendix 16 of 20
$406
$263
SFAS 133** (Mils.) $(71) $ 40Pre-Tax Profits Excl.SFAS 133** (Mils.) 477 223
$(143)

Key Metrics*Pre-Tax Profits (Mils.) Full Year
Receivables (Bils.)On-Balance Sheet $135.3 $141.1Securitized Off-Balance Sheet 12.2 6.0
Managed $147.5 $147.1Charge-Offs (Mils.)On-Balance Sheet $ 523 $ 632Managed 609 697Loss-to-Receivables RatioOn-Balance Sheet 0.39% 0.46%Managed- U.S. Retail and Lease 0.57 0.73- Worldwide Total 0.41 0.47Allow. for Credit LossesWorldwide Amount (Bils.) $ 1.1 $ 1.1Pct. Of EOP Receivables 0.81% 0.77%Leverage (To 1)Financial Statement 11.9 10.4Managed 11.4 9.8Dividend/Distribution (Bils.) $ 1.4 $ 0Net Income (Mils.) $1,283 $ 775
2006 2007
Full Year2006
Full Year2007
SFAS 133** (Mils.) $(448) $ (108)Pre-Tax Profits Excl.SFAS 133** (Mils.) 2,401 1,323* See Appendix for calculation, definitions and reconciliation to GAAP
** Market valuation adjustments from derivatives
FINANCIAL SERVICES SECTOR
FORD CREDIT RESULTS AND METRICS --2007 FULL YEAR
Appendix 17 of 20
$1,215
$1,953 $(738)

FORD CREDIT KEY METRIC DEFINITIONS
In addition to evaluating Ford Credit’s financial performance on a GAAP financial statement basis, Ford Credit management also uses other criteria, some of which were previously disclosed in this presentation and are defined below. Information about the impact of on-balance sheet securitization is also included below:
Managed Receivables -- receivables reported on Ford Credit’s balance sheet and receivables Ford Credit sold in off-balance-sheet securitizations and continues to service
Serviced Receivables -- includes managed receivables and receivables Ford Credit sold in whole-loan sale transactions (i.e., receivables for which Ford Credit has no continuing exposure or risk of loss)
Charge-offs on Managed Receivables -- charge-offs associated with receivables reported on Ford Credit’s balance sheet plus charge-offs associated with receivables Ford Credit sold in off-balance sheet securitizations and continues to service
Equity -- shareholder’s interest and historical stockholder’s equity reported on Ford Credit’s balance sheet
Impact of On-Balance Sheet Securitization -- finance receivables (retail and wholesale) and net investment in operating leases reported on Ford Credit's balance sheet include assets included in securitizations that do not qualify for accounting sale treatment. These assets are available only for repayment of the debt or other obligations issued or arising in the securitization transactions; they are not available to pay the other obligations of Ford Credit or the claims of Ford Credit's other creditors. Debt reported on Ford Credit's balance sheet includes obligations issued or arising in securitizations that are payable only out of collections on the underlying securitized assets and related enhancements
Appendix 18 of 20

In addition to evaluating Ford Credit’s financial performance on a GAAP financial statement basis, Ford Credit management also uses other criteria, some of which were previously disclosed in this presentation and are defined below:
Leverage:
Total Debt- Financial Statement Leverage =
Equity
Total Debt
SecuritizedOff-Balance
SheetReceivables
Cash, CashEquivalents &
MarketableSecurities*
Adjustments forHedge Accounting
on Total Debt
Equity MinorityInterest
Adjustments for Hedge Accounting on Equity
- Managed Leverage + - - -=
+ -
RetainedInterest inSecuritizedOff-Balance
SheetReceivables
Charge-offs=
Average ReceivablesLoss-to-Receivables Ratio
* Excludes marketable securities related to insurance activities
Appendix 19 of 20
FINANCIAL SERVICES SECTOR
FORD CREDIT RATIO DEFINITIONS

Total Debt* $139.7 $139.4
Securitized Off-Balance Sheet Receivables Outstanding 12.2 6.0
Retained Interest in Securitized Off-Balance Sheet Receivables (1.0) (0.7)
Adjustments for Cash, Cash Equivalents and Marketable Securities** (21.8) (16.7)
Adjustments for Hedge Accounting (0.1) 0
Total Adjusted Debt $129.0 $128.0
Total Shareholder’s Equity (incl. minority interest) $ 11.8 $ 13.4
Adjustments for Hedge Accounting (0.5) (0.3)
Total Adjusted Equity $ 11.3 $ 13.1
Managed Leverage (to 1) 11.4 9.8
Financial Statement Leverage (to 1) 11.9 10.4
* Includes $59.6 billion and $69.2 billion on December 31, 2006 and December 31, 2007, respectively of long-term and short-termasset-backed debt obligations issued in securitizations that are payable only out of collections on the underlying securitized assetsand related enhancements
** Excludes marketable securities related to insurance activities
Dec. 31,2007(Bils.)Leverage Calculation
Dec. 31,2006(Bils.)
Appendix 20 of 20
FINANCIAL SERVICES SECTOR
FORD CREDIT RECONCILIATIONS OF MANAGED
LEVERAGE TO FINANCIAL STATEMENT LEVERAGE


![Announces Q4 & FY15 results [Result]](https://static.fdocuments.in/doc/165x107/577cb3551a28aba7118c3d58/announces-q4-fy15-results-result.jpg)


![Announces Q4 & FY16 Results (Standalone & Consolidated) for the period ended March 31, 2016 [Result]](https://static.fdocuments.in/doc/165x107/577c7c421a28abe05499f11a/announces-q4-fy16-results-standalone-consolidated-for-the-period-ended.jpg)