
ford 2008 Q2 Financial Result
75
SECOND QUARTER EARNINGS REVIEW JULY 24, 2008 (PRELIMINARY RESULTS)
-
Upload
quarterlyearningsreports3 -
Category
Sports
-
view
499 -
download
1
Transcript of ford 2008 Q2 Financial Result

SECOND QUARTER
EARNINGS REVIEWJULY 24, 2008
(PRELIMINARY RESULTS)

SLIDE 1
BUSINESS OVERVIEW
Alan MulallyPresident and Chief Executive Officer

SLIDE 2
TOTAL COMPANY
AGENDA
• Overview of Second Quarter Results and Accomplishments
• Details of Financial Results and Full Year Outlook
• Actions to Respond to Changes in the North American Business Environment
• Our Plan -- One

SLIDE 3
TOTAL COMPANY
2008 SECOND QUARTER FINANCIAL RESULTS
Wholesales (000)* 1,561 (212) 3,092 (331)Revenue (Bils.)* $ 38.6 $ (5.6) $ 78.0 $ (9.3)
Continuing Operations*Pre-Tax Results (Mils.) $(1,004) $(1,487) $ (288) $ (840)After-Tax Results (Mils.) (1,376) (1,634) (869) (956)Earnings Per Share (0.62) (0.75) (0.39) (0.44)
Special Items Pre-Tax (Mils.) $(8,026) $(8,469) $(8,426) $(8,756)
Net IncomeAfter-Tax Results (Mils.) $(8,667) $(9,417) $(8,567) $(9,035)Earnings Per Share (3.88) (4.19) (3.87) (4.09)
Automotive Gross Cash (Bils.)** $ 26.6 $ (10.8) $ 26.6 $ (10.8)
* Excludes special items, see Slides 7 to 9 and Appendix for reconciliations to GAAP
** Automotive Gross Cash includes cash and cash equivalents, net marketable securities, loaned securities, and for 2007 only, short-term Voluntary Employee Beneficiary Association (VEBA) assets
First HalfSecond Quarter
2008O / (U)2007 2008
O / (U)2007

SLIDE 4
TOTAL COMPANY
SECOND QUARTER 2008 OPERATIONS RESULTS*
• Ford North America incurred an operating loss of $1.3 billion; lower volume more than explained the decline from 2007 results
• Continued strong results at Ford Europe and Ford South America
• Ford Asia Pacific Africa and Mazda were profitable, and improvedfrom 2007
• Volvo incurred a loss, but improved sequentially as expected
• Ford Credit incurred a pre-tax operating loss of $294 million
• Achieved $1 billion in cost savings, including over $600 million in Ford North America, as we remain on track for our $5 billion cost reduction goal by the end of 2008
• Ford brand initial quality in the U.S. improved at a faster rate than the industry average, according to the latest J.D. Power survey
* Profit and cost statements exclude special items; cost statements are at constant volume, mix and exchange

SLIDE 5
TOTAL COMPANY
ACHIEVING OUR PLAN -- KEY SECOND QUARTERACCOMPLISHMENTS
• Launched the Ford Kuga in Europe, a compact crossover with the best fuel economy of any AWD vehicle in the segment
• Launched the 2009 Ford Flex, our all-new fuel efficient crossover vehicle, with fuel economy that is equal to or better than any of its crossover competitors, and the Lincoln MKS luxury sedan in North America
• Completed the sale of Jaguar Land Rover to Tata Motors
• Reduced North American hourly personnel by about 4,000 since the end of First Quarter. Began 15% reduction of salaried personnel costs

SLIDE 6
FINANCIAL RESULTS
Don LeclairExecutive Vice President and
Chief Financial Officer

SLIDE 7
TOTAL COMPANY
2008 SECOND QUARTER INCOME FROM CONTINUING OPERATIONS COMPARED WITH NET INCOME*
Income (Mils.)
Pre-Tax Income (Excl. Special Items) $(1,004) $(1,487) $ (288) $ (840)
Special Items (8,026) (8,469) (8,426) (8,756)
Pre-Tax Income (Incl. Special Items) $(9,030) $(9,956) $(8,714) $(9,596)
Minority Interest (89) (4) (211) (68)
Taxes 444 567 349 654
Net Income from Continuing Operations $(8,675) $(9,393) $(8,576) $(9,010)
Discontinued Operations 8 (24) 9 (25)
Net Income $(8,667) $(9,417) $(8,567) $(9,035)
* See Slides 8 and 9 for details of Second Quarter 2008 special items
Second Quarter
2008
First HalfB / (W)2007 2008
B / (W)2007

SLIDE 8
TOTAL COMPANY
2008 SECOND QUARTER SPECIAL ITEMS
North America- Personnel Reduction Programs $ (274) $ (505)- Related OPEB Curtailment 100 111- ACH Plant Sales (303) (305)- U.S. Dealer Reductions (Including Investment Write-Off) (39) (147)- Ballard Restructuring 0 (70)
Subtotal North America Before Impairments $ (516) $ (916)
Other Personnel Actions (42) (58)
Jaguar Land Rover 75 75Debt / Equity Swaps 57 73
Subtotal Special Items Before Impairments $ (426) $ (826)
Impairments (7,600) (7,600)
Total Special Items $(8,026) $(8,426)
Memo: Special Items Impact on Earnings Per Share* $ (3.26) $ (3.48)
* Earnings per share from continuing operations is calculated on a basis that includes pre-tax profit, provision for taxes, and minority interest; see Appendix for method of calculation
SecondQuarter(Mils.)
First Half(Mils.)

SLIDE 9
TOTAL COMPANY
2008 SECOND QUARTER SPECIAL ITEMS --IMPAIRMENTS
North America Long-Lived Assets $(5,300)
Ford Credit Operating Lease Portfolio (2,086)
Mazda Dealership Goodwill (214)
Total Impairments $(7,600)
Amount(Mils.)

SLIDE 10
TOTAL COMPANY
2008 SECOND QUARTER PRE-TAX PROFIT / (LOSS)
BY SECTOR*
* Excludes special items; see Slides 7 to 9 and Appendix for reconciliation to GAAP
Memo:B / (W) 2007 $(1,487) $(1,048) $(439)
FinancialServices
Automotive
(Mils.)
Total
$(1,004)
$(670)
$(334)

SLIDE 11
AUTOMOTIVE SECTOR
2008 SECOND QUARTER AUTOMOTIVE PRE-TAX
RESULTS COMPARED WITH 2007*Pre-Tax Profit (Bils.)*
20082007 Volume /Mix
NetPricing
CostChanges**
Exchange
Ongoing Automotive -- $(0.9)
JaguarLand Rover &Aston Martin***
* Excludes special items; see Slides 7 to 9 and Appendix for reconciliation to GAAP** At constant volume, mix and exchange*** Non-recurrence of 2007 Second Quarter results; 2008 Second Quarter operating results exclude Jaguar Land Rover
NetInterest
& Fair Market Value Adj.
$(1.1)
$0.4
$(0.7)
$(1.3)
$(0.2) $(0.2) $(0.2) $(0.2)
$1.0

SLIDE 12
AUTOMOTIVE SECTOR
2008 FIRST HALF COST CHANGES*
* At constant volume, mix, and exchange; excludes special items
2008 Costs B / (W) 2007 (Bils.)
NetProductCosts
OverheadSpending-Related
Mfg. /Engrg.
Pension /OPEB
Advertising& Sales
Promotions
Total $2.7 Bils.$0.6
$0.2
$0.5
$0.6
$0.3 $0.3
$0.2
Memo:Second Quarter $0 $0 $0.2 $0.3 $0.2 $0.2 $0.1
$1.0
Warranty

SLIDE 13
AUTOMOTIVE SECTOR
2008 SECOND QUARTER PROFIT / (LOSS)
BY SEGMENT*
* Excludes special items; see Slides 7 to 9 and Appendix for reconciliation to GAAP
B / (W) Than 2007 $(1,048) $(1,067) $133 $320 $(29) $24 $31 $(229) $(231)
Pre-Tax Profit (Mils.)*
SouthAmerica
Asia Pacific & Africa
Total NorthAmerica
OtherAuto.
VolvoEurope
Net Interest $(339)
Fair Market Value Adj. 3
Mazda JaguarLand Rover &Aston Martin
$0
$(336)
$103$50
$(120)
$582$388
$(1,337)
$(670)

SLIDE 14
AUTOMOTIVE SECTOR -- FORD NORTH AMERICA
SECOND QUARTER KEY METRICS -- 2008 vs. 2007
Revenue (Bils.)Wholesales (000) Pre-Tax Profits (Mils.)*
2008200720082007 20082007Memo: U.S. Market Share 15.6% 14.4%U.S. Dealer Inventories- Second Quarter 557 559- O / (U) Prior Quarter (11) (6)
* Excludes special items; see Slides 7 to 9 and Appendix for reconciliation to GAAP
816 $19.0
$(270)
679
$14.2
$(1,337)

SLIDE 15
(Bils.)
AUTOMOTIVE SECTOR -- FORD NORTH AMERICA
2008 SECOND QUARTER AUTOMOTIVE PRE-TAX
RESULTS COMPARED WITH 2007*
20082007 Volume /Mix
NetPricing
Cost Changes**
Other
* Excludes special items; see Slides 7 to 9 and Appendix for reconciliation to GAAP** At constant volume, mix and exchange; excluding special items
Exchange
Industry $(0.6)Share (0.3)Mix / Other (0.6)
$(1.0)
$(0.3)
$(1.3)$(1.5)
$(0.3)
$0.6
$0.1 $0.1

SLIDE 16
(Bils.)
AUTOMOTIVE SECTOR -- FORD NORTH AMERICA
2008 SECOND QUARTER AUTOMOTIVE PRE-TAX
RESULTS COMPARED WITH FIRST QUARTER*
SecondQuarter
FirstQuarter
Volume /Mix
NetPricing
CostChanges**
Other
* Excludes special items; see Slides 7 to 9 and Appendix for reconciliation to GAAP** At constant volume, mix and exchange; excluding special items
Commodities $(0.3)Warranty Reserves (0.3)
Exchange
$(1.3)
$0
$(1.3)
$(0.3)
$(0.6)
$(0.1) $(0.1)$(0.2)
Parts Profits

SLIDE 17* Ford and Lincoln Mercury
AUTOMOTIVE SECTOR -- FORD NORTH AMERICA
U.S. MARKET SHARE*
Memo: Total (Worse) Than Prior Year (1.1) Pts. (2.1) Pts. (0.7) Pts. (0.1) Pts. (1.2) Pts.
Second Quarter2007
Fleet
Third Quarter2007
First Quarter2008
15.6%
5.4%
10.2%
13.4%
2.9%
10.5%
14.1%
9.8%
4.3%
Retail
15.0%
9.8%
5.2%
Fourth Quarter2007
Second Quarter2008
5.2%
9.2%
14.4%

SLIDE 18
AUTOMOTIVE SECTOR -- NORTH AMERICA
OPERATING-RELATED COST REDUCTIONS*
2006(Bils.)
2007(Bils.)
Full Year(Bils.)
Net Product Costs
Product Adds $(0.9) $(2.0) $(0.1) $(0.1) $(0.5) $ (0.7)
Commodities (0.3) (0.8) 0.1 (0.2) (0.8) (0.9)
Material Cost Reductions / Other 1.2 0.8 0.3 0.3 0.7 1.3
Subtotal $ 0 $(2.0) $ 0.3 $ 0 $(0.6) $(0.3)
Structural / Other 1.5 2.6 0.9 0.6 1.7 3.2
Total $ 1.5 $ 0.6 $ 1.2 $ 0.6 $ 1.1 $ 2.9
Cumulative $ 1.5 $ 2.1 $ 3.3 $ 3.9 $ 5.0 $ 5.0
Memo (Absolute):
Total Personnel Level (000) 122 89 89 85
FirstQuarter(Bils.)
2008
SecondHalf(Bils.)
SecondQuarter(Bils.)
* At constant volume, mix and exchange; excluding special items
Projected

SLIDE 19
AUTOMOTIVE SECTOR -- FORD SOUTH AMERICA
SECOND QUARTER KEY METRICS -- 2008 vs. 2007 Revenue (Bils.)Wholesales (000)
Memo: Market Share** 10.9% 9.5%
* Excludes special items; see Slides 7 to 9 and Appendix for reconciliation to GAAP** South America market share is based, in part, on estimated vehicle registrations for our six major markets in that region
2008200720082007 20082007
Pre-Tax Profits (Mils.)*
110
$1.8
$255
118 $2.4
$388

SLIDE 20
AUTOMOTIVE SECTOR -- FORD EUROPE
SECOND QUARTER KEY METRICS -- 2008 vs. 2007
Revenue (Bils.)Wholesales (000) Pre-Tax Profits (Mils.)*
Memo: Market Share** 8.3% 8.5%
* Excludes special items; see Slides 7 to 9 and Appendix for reconciliation to GAAP** Market share for Ford Europe is based, in part, on estimated vehicle registrations for our 19 major European markets
2008200720082007 20082007
509
$9.2
$262
532 $11.5
$582

SLIDE 21
(Bils.)
AUTOMOTIVE SECTOR -- FORD EUROPE
2008 SECOND QUARTER AUTOMOTIVE PRE-TAX
RESULTS COMPARED WITH 2007*
20082007 Volume /Mix
NetPricing
CostChanges
* Excludes special items; see Slides 7 to 9 and Appendix for reconciliation to GAAP
Exchange
$0
$(0.1)
$0.1
$0.3
$0.6
$0.3
$0.3

SLIDE 22
AUTOMOTIVE SECTOR -- VOLVO
SECOND QUARTER KEY METRICS -- 2008 vs. 2007
20082007
Revenue (Bils.)
20082007
Wholesales (000)
20082007
Pre-Tax Profits (Mils.)*
Memo:Market Share**U.S. 0.6% 0.5%Europe 1.4 1.3
* Excludes special items; see Slides 7 to 9 and Appendix for reconciliation to GAAP** Europe market share for Volvo is based, in part, on estimated vehicle registrations for our 19 major European markets
125
107 $4.3$4.4
$(120)$(91)

SLIDE 23
(Mils.)
AUTOMOTIVE SECTOR -- VOLVO
2008 SECOND QUARTER AUTOMOTIVE PRE-TAX
RESULTS COMPARED WITH 2007*
20082007 Volume /Mix
NetPricing
CostChanges
* Excludes special items; see Slides 7 to 9 and Appendix for reconciliation to GAAP
Exchange
Structural $200Warranty 50Net Product 10
Other
$(91)$(120) $(120)
$(90)
$260
$(60)$(19)
$(29)Volume $(100)Mix (20)

SLIDE 24
AUTOMOTIVE SECTOR -- FORD ASIA PACIFIC AFRICA AND MAZDA
2008 SECOND QUARTER PRE-TAX PROFITS*
* Excludes special items; see Slides 7 to 9 and Appendix for reconciliation to GAAP
Memo:B / (W) 2007 $55 $24 $31
(Mils.)
Asia Pacific Africa and Mazda
Asia Pacific Africa Mazda
$153
$50
$103

SLIDE 25
AUTOMOTIVE SECTOR -- FORD ASIA PACIFIC AFRICA
SECOND QUARTER KEY METRICS -- 2008 vs. 2007
20082007
Revenue (Bils.)*
20082007
Wholesales (000)* Pre-Tax Profits (Mils.)**
Memo: Market Share*** 2.2% 1.9%
20082007
* Wholesales include Ford-badged vehicles sold in China and Malaysia by unconsolidated affiliates; revenue does not include these sales** Excludes special items; see Slides 7 to 9 and Appendix for reconciliation to GAAP*** Asia Pacific Africa market share is based on estimated vehicle sales for our twelve major markets in that region
135$1.7
$26
125 $1.7
$50

SLIDE 26
AUTOMOTIVE SECTOR
2008 SECOND QUARTER CASH*
Gross CashJune 30, 2008 $26.6 $26.6March 31, 2008 / December 31, 2007 28.7 34.6
Change in Gross Cash $ (2.1) $ (8.0)
Operating-Related Cash FlowAutomotive Pre-Tax Profits** $ (0.7) $ 0Capital Spending (1.6) (2.9)Depreciation and Amortization 1.5 3.0Changes in Working Capital / Other (incl. Timing Differences) (1.5) (3.1)
Subtotal $(2.3) $ (3.0)
Up-Front Subvention Payments to Ford Credit (0.8) (1.6)
Total Automotive Operating-Related Cash Flow $(3.1) $ (4.6)
Other Changes in CashPersonnel Separation Programs $(0.2) $ (0.3)Pension Contributions (0.2) (0.8)VEBA Related*** 0 (4.5)Tax Refunds, Tax Payments, and Tax Receipts from Affiliates 0 0.9Divestitures 1.7 1.8All Other (0.3) (0.5)
Change in Gross Cash $(2.1) $ (8.0)
* See Appendix for reconciliation to GAAP** Excludes special items; see Slides 7 to 9 and Appendix for reconciliation to GAAP*** Includes transfers to Temporary Asset Account
SecondQuarter(Bils.)
FirstHalf(Bils.)

SLIDE 27
AUTOMOTIVE SECTOR
AUTOMOTIVE FINANCIAL RESOURCES
Gross Cash* $ 26.6
Available Automotive Credit Lines
(Secured and Unsecured)** 11.6
Total Liquidity $ 38.2
Memo: Debt $ 26.5
* Includes cash and cash equivalents, net marketable securities, and loaned securities, and excludes UAW-Ford Temporary Asset Account securities
** As of July 1, 2008, total committed secured and unsecured Automotive credit lines (including local lines available to foreign affiliates) were $12.2 billion
June 30, 2008(Bils.)

SLIDE 28
FINANCIAL SERVICES SECTOR
2008 SECOND QUARTER PRE-TAX PROFIT / (LOSS)
BY SEGMENT*
Memo:B / (W) 2007 $(439) $(406) $(33)
(Mils.)
Total Ford Credit Other
* Excludes special items, see Slides 7 to 9 and appendix for reconciliation to GAAP
$(334)$(294)
$(40)

SLIDE 29
FINANCIAL SERVICES SECTOR
2008 SECOND QUARTER FORD CREDIT PRE-TAX
RESULTS COMPARED WITH 2007*
(Bils.)
$(0.5)
$0
FinancingMargin
LeaseResidual
$(0.5)
Volume2008
$0.3
2007 CreditLoss
$(0.3)
$0.1 $0.1
$0.2
Other SFAS 133**
$(0.7)
Managed Assets $149 $140
$(0.4)
* Excludes special items, see Slides 7 to 9 and Appendix for reconciliation to GAAP** Market valuation adjustments from derivatives
Change in Reserve $(0.3)Charge-Offs / Other (0.2)

SLIDE 30
FINANCIAL SERVICES SECTOR
FORD CREDIT LIQUIDITY AND FUNDING STRATEGY
* Subject to availability of sufficient assets** To be used only to support on-balance sheet securitization transactions*** Capacity in excess of eligible receivables**** Cash, cash equivalents and marketable securities (excludes marketable securities related to insurance activities)
• Maintain liquidity to meet near-term funding obligations
– Hold substantial cash balance
– Continue to diversify global asset-backed funding capabilities
– Renew committed asset-backed funding capacity while maintaining a diversity of liquidity providers
• Continue to explore and execute various alternative business arrangements
• Managed leverage at June 30, 2008 was 10 to 1 – below our 11.5 to 1 target
• Equity at June 30, 2008 was over $12 bils.
Committed Capacity / Liquidity
Utilizationof Liquidity
CommittedCapacity *
Cash**** Total
$5.4**
$7.8***
CommittedCapacity &Cash****
Liquidity
June 30, 2008 (Bils.)
Capacity Utilized
UnsecuredCP
Total
June 30, 2008 (Bils.)
$5.4**
$23
$37.3
$0.5
$37.8
$54.4
$19.6
$74.0
$60.8

SLIDE 31
AUTOMOTIVE SECTOR
2008 PLANNING ASSUMPTIONS ANDOPERATIONAL METRICS
Planning Assumptions
Industry Volume (SAAR) -- U.S. (Mils.)* 16.0 15.1 14.0 - 14.5-- Europe (Mils.)** 17.6 17.5 17.2 - 17.4
Operational MetricsCompared with 2007
- Quality Improve Improved On Track
- Automotive Costs*** Improve by about $3 Billion $2.7 Billion Over $3 Billion
Absolute Amount- U.S. Market Share (Ford and Lincoln Mercury) Low End of 14-15% Range 14.7% High 13%
- Operating-Related Cash Flow Negative $(4.6) Billion Greater Outflowthan Plan
- Capital Spending Around $6 Billion $2.9 Billion On Track
* Includes medium and heavy vehicles
** European 19 major markets*** At constant volume, mix, and exchange; excludes special items
Full YearPlan
FirstHalf
Full YearOutlook
2008 Operating and Overall Results Now Expected to be Worse than 2007
SLIDE 32
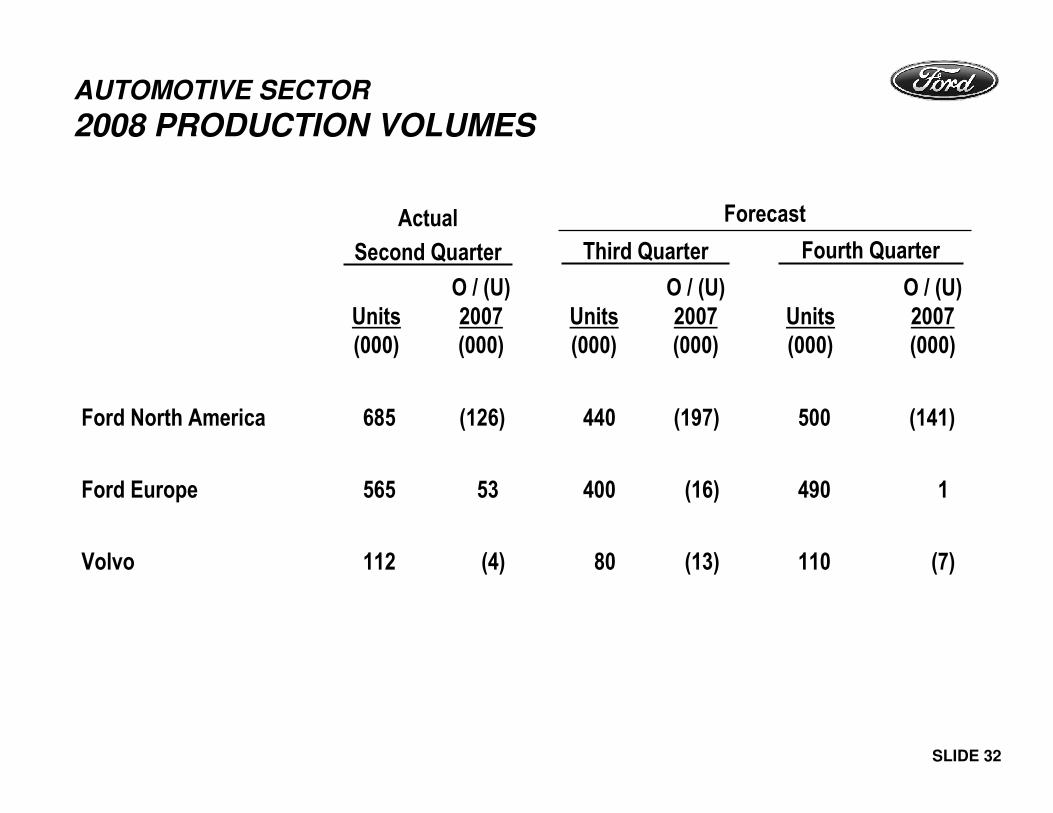
AUTOMOTIVE SECTOR
2008 PRODUCTION VOLUMES
Ford North America 685 (126) 440 (197) 500 (141)
Ford Europe 565 53 400 (16) 490 1
Volvo 112 (4) 80 (13) 110 (7)
Units(000)
O / (U)2007(000)
Second Quarter
Units(000)
O / (U)2007(000)
Third Quarter
Units(000)
O / (U)2007(000)
Fourth Quarter
ForecastActual

SLIDE 33
NORTH AMERICA
Mark FieldsExecutive Vice President and
President of the Americas

SLIDE 34
NORTH AMERICA
TRANSFORMATION THROUGH “ONE FORD”
• Ford uniquely positioned to respond to dramatically changing conditions in North America
• “One Ford” to deliver a lineup of highly acclaimed, smaller vehicles in global segments (B, C, C/D and Commercial Van) beginning in mid-2009
• Over 40% of Ford’s entries in these segments to be shared with Ford of Europe by 2010, with 100% alignment achieved by 2013
• Every new product expected to be the best or among the best in its segment for fuel economy driven by the most extensive powertrainupgrades ever for Ford
• The new products to be supported by a lean, flexible manufacturing system in which capacity matches demand
• Progress in fixing the fundamentals of the business to continue,including a continued reduction in structural costs in 2009 and broadening the ongoing consolidation of the U.S. dealer network

SLIDE 35
NORTH AMERICA
CURRENT PLANNING ASSUMPTIONS
• U.S. economic recovery to begin by early 2010
• U.S. industry sales to return to trend levels as economy returns to health
• Product mix changes permanent, but some recovery from current share-of-industry for full-size pickups (but not back to levels experienced previously) as the economy and housing recover
• Oil prices to remain volatile and high
• No near-term relief from current level of commodity prices
• About 14% U.S. market share (Ford, Lincoln and Mercury)

SLIDE 36
NORTH AMERICA
BALANCED PRODUCT PORTFOLIO
• Small car offensive with six vehicles coming to North America from global B-car and C-car platforms compared with two regional vehicles today
• Ford, Lincoln and Mercury lineup to be almost completely upgraded by end of 2010
• Hybrid vehicle production planned to double in 2009; capacity for North America four-cylinder engine production doubles by 2011
• EcoBoost engine technology (gas turbocharged direct-injection technology) introduced on V6 applications next year and I4 engines in 2010. Offered on 80% of the lineup by 2012
• Other fuel-saving technologies planned – PowerShift twin-clutch transmissions, start-stop engines, electric power-assisted steering, and direct injection and Twin Independent Variable CamTiming engines
• Expanded crossover offerings and leadership in trucks maintained

SLIDE 37
NORTH AMERICA
NEW PRODUCTS THROUGH 2009
• 2009 F-150 – most capability, choice and smart features of any full-size pickup and 7% better fuel economy
• 2010 Ford Fusion, Mercury Milan and Lincoln MKZ. Fusion’s and Milan’s four-cylinder fuel economy expected to top Accord and Camry
• 2010 Ford Fusion Hybrid and Mercury Milan Hybrid – fuel economy expected to top Camry hybrid
• New Ford Mustang in early 2009
• New Ford Taurus in mid-2009 with EcoBoost engine and advanced safety and convenience technologies
• New European Transit Connect small multi-purpose van in mid-2009
• New Lincoln seven-passenger crossover with EcoBoost engine in mid-2009

SLIDE 38
NORTH AMERICA
NEW PRODUCTS THROUGH 2010
• New Ford Fiesta, in both four- and five-door versions, in early 2010
• New Ford Focus, in both four- and five-door versions, in 2010
• New Mercury small car in 2010
• New small car “whitespace” entry in 2010
• Next-generation Explorer in 2010

SLIDE 39
NORTH AMERICA
FUEL ECONOMY PLANS
• With every new product, Ford expects to be the best or among thebest for fuel economy
• By the end of 2010, nearly all of Ford’s North American engines will have been upgraded or replaced
• Within two years, nearly all of the product lineup in North America will offer six-speed transmissions
• Other new powertrain technologies to be deployed across the product lineup
• Ford to be the largest domestic producer of full hybrid vehicles in North America

SLIDE 40
NORTH AMERICA
LEAN, FLEXIBLE MANUFACTURING SYSTEM
• Three truck assembly plants converted to small car production with initial changeover beginning this December
• Nearly all North American assembly plants to have flexible body shops
• Nearly half of our transmission and engine plants to be flexible
• Assembly capacity to match demand
• Targeted hourly buyouts at select U.S. facilities to continue

SLIDE 41
NORTH AMERICA
MANUFACTURING REALIGNMENTS
• Michigan Truck will be converted beginning in December 2008 from full-size SUVs to production of small cars from Ford’s global C-car platform in 2010
• Ford Expedition and Lincoln Navigator moved to Kentucky Truck in early 2009
• Cuautitlan in Mexico, currently producing F-Series pickups, to be converted to new Fiesta small car in early 2010
• Louisville, building Ford Explorer mid-size SUV, to be converted to small vehicles from Ford’s global C-car platform in 2011
• Twin Cities to continue production of Ford Ranger compact pickuptruck through 2011
• Kansas City to add third crew this year for Ford Escape, Escape Hybrid and Mercury Mariner and Mariner Hybrid

SLIDE 42
NORTH AMERICA
CONTINUING TO FIX THE FUNDAMENTALS
• Significant progress accomplished to date in fixing fundamentalsof the North American business
• Brands confirmed with focus on Ford (and aligned globally); Fordbrand opinion improving
• 90% reduction in U.S. order complexity by 2009 model year, with another 50%+ targeted for 2010
• Initial quality now among the best with continuous improvement planned
• Expect $5 billion reduction in cumulative operating costs this year compared with 2005, with further cost reductions targeted for 2009 and beyond*
• U.S. dealer network consolidation progressing well; initiative to be broadened
• ACH dispositions continuing
* At constant volume, mix and exchange; excluding special items and favorable impact of 2008 impairment

SLIDE 43
• Building on Way Forward accomplishments and leveraging “One Ford” opportunities to respond quickly and decisively to new environment
• Implementing a product plan aligned with Ford of Europe in global segments to deliver a balanced portfolio of products customers want and value
• Revamping North American manufacturing systems to rebalance capacity and build in flexibility
• Right blueprint for a new environment
NORTH AMERICA
SUMMARY

SLIDE 44
OUR PLAN
Alan MulallyPresident and Chief Executive Officer

SLIDE 45
TOTAL COMPANY
OUR PLAN . . . ONE
• Aggressively restructure to operate profitability at the current demand and changing model mix
• Accelerate development of new products our customers want and value to deliver profitable growth
• Finance our plan and improve our balance sheet
• Work together effectively as one team
• Create a global “ONE” Ford . . . leveraging our global assets
• Introduce a complete, competitive, leading fuel-efficient product family
• Continuously improve our quality and productivity, and reduce our costs
• Polish the Blue Oval brand

SLIDE 46
Number ofDifferent Platforms*
TOTAL COMPANY
OUR PLAN -- ONE FORD PRODUCT LINEUP
B-Vehicles (Fiesta) 4 1
C-Vehicles (Focus) 3 1
C / D-Vehicles (Fusion / Mondeo) 3 1
Commercial Van (Econoline, Transit) 4 1
Memo:
Total Platforms 25 9
* Excludes low volume applications
Today Future

SLIDE 47
MondeoFusion
Transit Connect
North American Focus
Fiesta
European Focus
TOTAL COMPANY
PRODUCT HIGHLIGHTS

SLIDE 48
TOTAL COMPANY
BUILD UPON PROFITABLE OVERSEAS OPERATIONS
Europe• New Focus and new Kuga AWD crossover launched earlier this year
• New Fiesta and new Ka small-car debuts later this year
• Adding Mondeo production this year and increasing Focus output in 2009 in St. Petersburg as Russian auto market continues to grow
• Retooling Craiova, Romania, to build Transit Connect for European markets in 2009
Asia Pacific and Africa• New Fiesta launches later this year in Nanjing
• Expanding capacity in Chennai, India, to produce new small cars and powertrains
• Expanding AAT in Thailand for new small car production
• South Africa to build new small pickup truck and diesel engine
South America• Launched new Ka in 2008, plan to launch more new vehicles later this year• Expanding capacity in Brazil for cars, heavy trucks, and engines
• Global products in Brazil and Argentina
* Excluding special items
Ford’s international automotive operations have earned over $4 billion during the past 18 months*

SLIDE 49
TOTAL COMPANY
WE ARE EXECUTING OUR PLAN
Business conditions have changed quickly but:
• We sold Aston Martin and Jaguar Land Rover to raise capital and increase focus on the Ford brand
• Took the right steps to obtain financing for our plan, and we continue to implement the UAW VEBA
• We are operating Volvo on a more stand-alone basis
• We are uniquely positioned through our focus on the Ford brand to leverage our global assets to bring more small, fuel-efficient vehicles to North America and the rest of the world
• We are pursuing profitable growth throughout the world

SLIDE 50
SAFE HARBORRisk FactorsStatements included herein may constitute “forward-looking statements” within the meaning of the Private Securities Litigation Reform Act of 1995. Forward-looking statements are based on expectations, forecasts and assumptions by our management and involve a number of risks, uncertainties, and other factors that could cause actual results to differ materially from those stated,including, without limitation:
• Continued decline in market share;
• Continued or increased price competition resulting from industry overcapacity, currency fluctuations or other factors;
• An increase in or acceleration of market shift away from sales of trucks, sport utility vehicles, or other more profitable vehicles, particularly in the United States;
• A significant decline in industry sales, particularly in the United States, Europe, or South America resulting from slowing economic growth, geo-political events or other factors;
• Lower-than-anticipated market acceptance of new or existing products;
• Continued or increased high prices for or reduced availability of fuel;
• Currency or commodity price fluctuations;
• Adverse effects from the bankruptcy or insolvency of, change in ownership or control of, or alliances entered into by a major competitor;
• Economic distress of suppliers that has in the past and may in the future require us to provide financial support or take other measures to ensure supplies of components or materials;
• Labor or other constraints on our ability to restructure our business;
• Work stoppages at Ford or supplier facilities or other interruptions of supplies;
• Single-source supply of components or materials;
• Substantial pension and postretirement health care and life insurance liabilities impairing our liquidity or financial condition;
• Inability to implement Retiree Health Care Settlement Agreement with UAW to fund and discharge retiree health care obligations because of failure to obtain court approval or otherwise;
• Worse-than-assumed economic and demographic experience for our postretirement benefit plans (e.g., discount rates, investment returns, and health care cost trends);
• The discovery of defects in vehicles resulting in delays in new model launches, recall campaigns or increased warranty costs;
• Increased safety, emissions (e.g., CO2), fuel economy, or other regulation resulting in higher costs, cash expenditures, and/or sales restrictions;
• Unusual or significant litigation or governmental investigations arising out of alleged defects in our products or otherwise;
• A change in our requirements for parts or materials where we have entered into long-term supply arrangements that commit us to purchase minimum or fixed quantities of certain parts or materials, or to pay a minimum amount to the seller ("take-or-pay" contracts);
• Adverse effects on our results from a decrease in or cessation of government incentives;
• Adverse effects on our operations resulting from certain geo-political or other events;
• Substantial negative Automotive operating-related cash flows for the near- to medium-term affecting our ability to meet our obligations, invest in our business or refinance our debt;
• Substantial levels of Automotive indebtedness adversely affecting our financial condition or preventing us from fulfilling our debt obligations (which may grow because we are able to incur substantially more debt, including additional secured debt);
• Inability of Ford Credit to access debt or securitization markets around the world at competitive rates or in sufficient amounts due to additional credit rating downgrades, market volatility, market disruption or otherwise;
• Higher-than-expected credit losses;
• Increased competition from banks or other financial institutions seeking to increase their share of financing Ford vehicles;
• Changes in interest rates;
• Collection and servicing problems related to finance receivables and net investment in operating leases;
• Lower-than-anticipated residual values or higher-than-expected return volumes for leased vehicles; and
• New or increased credit, consumer or data protection or other regulations resulting in higher costs and/or additional financing restrictions.
We cannot be certain that any expectation, forecast or assumption made by management in preparing forward-looking statements will prove accurate, or that any projection will be realized. It is tobe expected that there may be differences between projected and actual results. Our forward-looking statements speak only as of the date of their initial issuance, and we do not undertake anyobligation to update or revise publicly any forward-looking statement, whether as a result of new information, future events or otherwise. For additional discussion of these risks, see“Item 1A. Risk Factors” of our 2007 10-K Report.

APPENDIX

TOTAL COMPANY
CALCULATION OF EARNINGS PER SHARE
NumeratorNet Income $(8,667) $(1,376) $(8,567) $ (869)Impact on Income from assumed exchangeof convertible notes and convertible trustpreferred securities 0 0 0 0
Income for EPS $(8,667) $(1,376) $(8,567) $ (869)
DenominatorAverage shares outstanding 2,237 2,237 2,213 2,213Net issuable shares, primarily stock options 0 0 0 0Convertible notes 0 0 0 0Convertible trust preferred securities 0 0 0 0
Average shares for EPS 2,237 2,237 2,213 2,213
EPS $ (3.88) $ (0.62) $ (3.87) $(0.39)
Appendix 1 of 23
NetIncome(Mils.)
Cont. Ops. --Excl.
Special Items(Mils.)
Second Quarter 2008
NetIncome(Mils.)
Cont. Ops. --Excl.
Special Items(Mils.)
First Half 2008
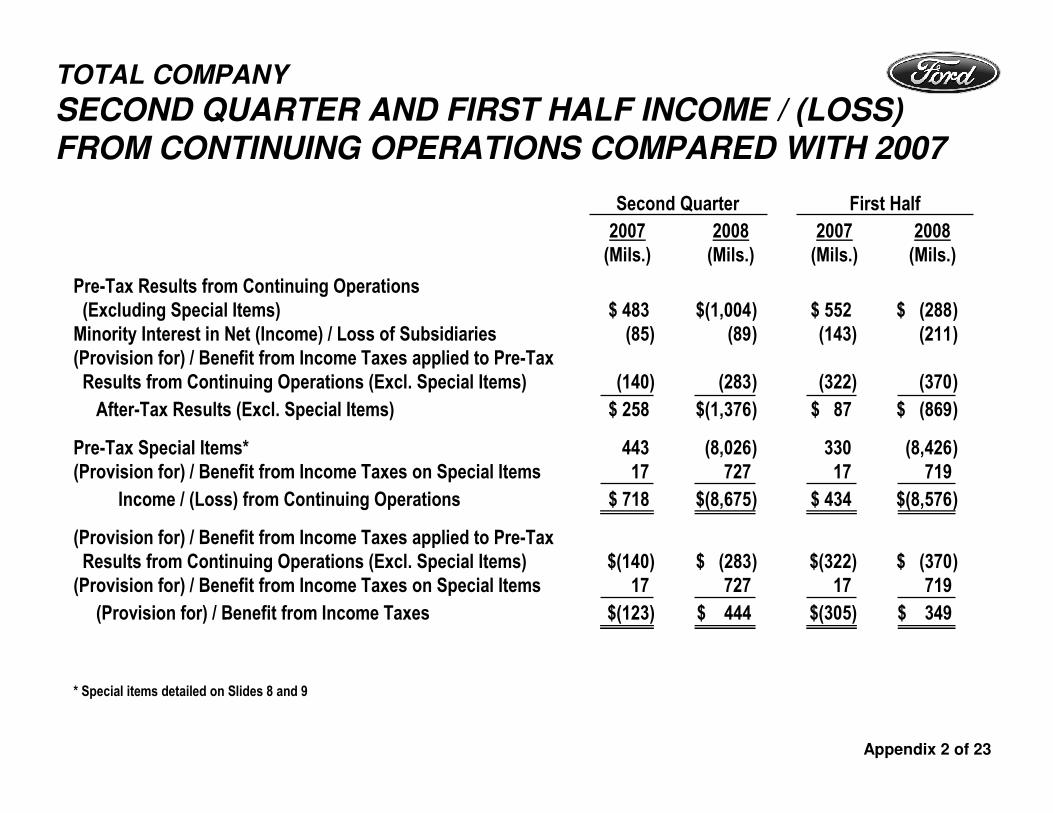
TOTAL COMPANY
SECOND QUARTER AND FIRST HALF INCOME / (LOSS)
FROM CONTINUING OPERATIONS COMPARED WITH 2007
Pre-Tax Results from Continuing Operations(Excluding Special Items) $ 483 $(1,004) $ 552 $ (288)Minority Interest in Net (Income) / Loss of Subsidiaries (85) (89) (143) (211)(Provision for) / Benefit from Income Taxes applied to Pre-TaxResults from Continuing Operations (Excl. Special Items) (140) (283) (322) (370)
After-Tax Results (Excl. Special Items) $ 258 $(1,376) $ 87 $ (869)
Pre-Tax Special Items* 443 (8,026) 330 (8,426)(Provision for) / Benefit from Income Taxes on Special Items 17 727 17 719
Income / (Loss) from Continuing Operations $ 718 $(8,675) $ 434 $(8,576)
(Provision for) / Benefit from Income Taxes applied to Pre-TaxResults from Continuing Operations (Excl. Special Items) $(140) $ (283) $(322) $ (370)(Provision for) / Benefit from Income Taxes on Special Items 17 727 17 719
(Provision for) / Benefit from Income Taxes $(123) $ 444 $(305) $ 349
* Special items detailed on Slides 8 and 9
Appendix 2 of 23
2007(Mils.)
Second Quarter First Half
2008(Mils.)
2007(Mils.)
2008(Mils.)

TOTAL COMPANY
2007 – 2008 SECOND QUARTER PRE-TAX RESULTS
North America $ (67) $(7,153) $ 203 $(5,816) $(270) $(1,337)South America 255 388 0 0 255 388
Europe 184 579 (78) (3) 262 582Volvo (91) (152) 0 (32) (91) (120)
Asia Pacific Africa 18 43 (8) (7) 26 50Mazda 72 (111) 0 (214) 72 103
Subtotal $ 371 $(6,406) $ 117 $(6,072) $ 254 $ (334)
Other Automotive (107) (279) 0 57 (107) (336)Subtotal Ongoing Auto. $ 264 $(6,685) $ 117 $(6,015) $ 147 $ (670)
JLR and Aston Martin 557 75 326 75 231 0Total Automotive $ 821 $(6,610) $ 443 $(5,940) $ 378 $ (670)
Financial Services 105 (2,420) 0 (2,086) 105 (334)Total Company $ 926 $(9,030) $ 443 $(8,026) $ 483 $(1,004)
2008(Mils.)
Pre-Tax Profits(Incl. Special Items) Special Items
Pre-Tax Profits(Excl. Special Items)
2008(Mils.)
2008(Mils.)
Appendix 3 of 23
2007(Mils.)
2007(Mils.)
2007(Mils.)

TOTAL COMPANY
2007 – 2008 FIRST HALF PRE-TAX RESULTS
North America $(769) $(7,598) $ 114 $(6,216) $(883) $(1,382)South America 368 645 0 0 368 645
Europe 392 1,307 (89) (14) 481 1,321Volvo (1) (303) (4) (32) 3 (271)
Asia Pacific Africa (10) 39 (10) (12) 0 51Mazda 93 (62) 0 (214) 93 152
Subtotal $ 73 $(5,972) $ 11 $(6,488) $ 62 $ 516Other Automotive (448) (461) 0 73 (448) (534)
Subtotal Ongoing Auto. $(375) $(6,433) $ 11 $(6,415) $(368) $ (18)
JLR and Aston Martin 858 75 319 75 539 0Total Automotive $ 483 $(6,358) $ 330 $(6,340) $ 153 $ (18)
Financial Services 399 (2,356) 0 (2,086) 399 (270)Total Company $ 882 $(8,714) $ 330 $(8,426) $ 552 $ (288)
2008(Mils.)
Pre-Tax Profits(Incl. Special Items) Special Items
Pre-Tax Profits(Excl. Special Items)
2008(Mils.)
2008(Mils.)
Appendix 4 of 23
2007(Mils.)
2007(Mils.)
2007(Mils.)

TOTAL COMPANY
2007 – 2008 SECOND QUARTER REVENUE
North America $18,961 $14,219 $ 0 $ 0 $18,961 $14,219South America 1,827 2,346 0 0 1,827 2,346
Europe 9,203 11,559 0 0 9,203 11,559Volvo 4,373 4,326 0 0 4,373 4,326
Asia Pacific Africa 1,727 1,778 0 0 1,727 1,778Mazda 0 0 0 0 0 0
Subtotal Ongoing Auto. $36,091 $34,228 $ 0 $ 0 $36,091 $34,228
JLR and Aston Martin 4,015 2,829 0 2,829 4,015 0Total Automotive $40,106 $37,057 $ 0 $ 2,829 $40,106 $34,228
Financial Services 4,136 4,455 0 0 4,136 4,455Total Company $44,242 $41,512 $ 0 $ 2,829 $44,242 $38,683
2008(Mils.)
Revenue(Incl. Special Items) Special Items
Revenue(Excl. Special Items)
2008(Mils.)
2008(Mils.)
Appendix 5 of 23
2007(Mils.)
2007(Mils.)
2007(Mils.)

TOTAL COMPANY
2007 – 2008 FIRST HALF REVENUE
North America $37,520 $31,329 $ 0 $ 0 $37,520 $31,329South America 3,110 4,188 0 0 3,110 4,188
Europe 17,835 21,714 0 0 17,835 21,714Volvo 8,945 8,523 0 0 8,945 8,523
Asia Pacific Africa 3,496 3,446 0 0 3,496 3,446Mazda - - - - - -
Subtotal Ongoing Auto. $70,906 $69,200 $ 0 $ 0 $70,906 $69,200
JLR and Aston Martin 7,830 6,974 0 6,974 7,830 0Total Automotive $78,736 $76,174 $ 0 $ 6,974 $78,736 $69,200
Financial Services 8,525 8,866 0 0 8,525 8,866Total Company $87,261 $85,040 $ 0 $ 6,974 $87,261 $78,066
2008(Mils.)
Revenue(Incl. Special Items) Special Items
Revenue(Excl. Special Items)
2008(Mils.)
2008(Mils.)
Appendix 6 of 23
2007(Mils.)
2007(Mils.)
2007(Mils.)

North America* 816 679 0 0 816 679South America 110 118 0 0 110 118
Europe 509 532 0 0 509 532Volvo 125 107 0 0 125 107
Asia Pacific Africa** 135 125 0 0 135 125Mazda 0 0 0 0 0 0Subtotal 1,695 1,561 0 0 1,695 1,561
Other Automotive 0 0 0 0 0 0Subtotal Automotive Ops. 1,695 1,561 0 0 1,695 1,561
JLR and Aston Martin 78 51 0 51 78 0Total Automotive 1,773 1,612 0 51 1,773 1,561
TOTAL COMPANY
2008 SECOND QUARTER WHOLESALES
* Includes consolidation of Automotive Alliance International (AAI) wholesales from production of Mazda6 vehicles only** Included in wholesales of Asia Pacific Africa are Ford-badged vehicles sold in China and Malaysia by certain unconsolidated affiliates
totaling about 49,000 and 55,000 units in 2008 and 2007, respectively.
2008(000)
Wholesales(Incl. Special Items) Special Items
2008(Mils.)
2008(Mils.)
2007(Mils.)
2007(Mils.)
2007(000)
Appendix 7 of 23
Wholesales(Excl. Special Items)

North America* 1,560 1,383 0 0 1,560 1,383South America 194 210 0 0 194 210
Europe 1,009 1,032 0 0 1,009 1,032Volvo 253 213 0 0 253 213
Asia Pacific Africa** 261 254 0 0 261 254Mazda 0 0 0 0 0 0Subtotal 3,277 3,092 0 0 3,277 3,092
Other Automotive 0 0 0 0 0 0Subtotal Automotive Ops. 3,277 3,092 0 0 3,277 3,092
JLR and Aston Martin 146 125 0 125 146 0Total Automotive 3,423 3,217 0 125 3,423 3,092
TOTAL COMPANY
2008 FIRST HALF WHOLESALES
* Includes consolidation of Automotive Alliance International (AAI) wholesales from production of Mazda6 vehicles only** Included in wholesales of Asia Pacific Africa are Ford-badged vehicles sold in China and Malaysia by certain unconsolidated affiliates
totaling about 104,000 and 93,000 units in 2008 and 2007, respectively.
2008(000)
Wholesales(Incl. Special Items) Special Items
2008(Mils.)
2008(Mils.)
2007(Mils.)
2007(Mils.)
2007(000)
Appendix 8 of 23
Wholesales(Excl. Special Items)

TOTAL COMPANY
SECOND QUARTER EMPLOYMENT DATA BY
BUSINESS UNIT*
Appendix 9 of 23
* This slide includes the approximate number of individuals employed by us and our consolidated entities (including entities we do not control)
March 31,2008 (000)
June 30,2008 (000)
North America 93 89South America 14 14
Europe 68 73Volvo 25 25
Asia Pacific Africa 17 17
Subtotal Ongoing Automotive 217 218
JLR and Aston Martin 16 -
Total Automotive 233 218
Financial Services 11 11
Total Company 244 229

AUTOMOTIVE SECTOR -- FORD NORTH AMERICA
PERSONNEL LEVELS FROM YEAR-END 2005
* Excludes Supplemental Replacement Personnel** Primarily entities that we do not control but are consolidated under FIN46 Appendix 10 of 23
Salaried 35,600 32,400 24,300 24,300 24,100
Hourly
- Manufacturing / Other 86,200 78,900 58,600 58,300 56,500
- ACH* 13,900 11,100 6,100 6,000 4,100
Total Hourly 100,100 90,000 64,700 64,300 60,600
Subtotal 135,700 122,400 89,000 88,600 84,700
Dealership Personnel** 7,000 5,700 4,600 4,400 4,200
Total 142,700 128,100 93,600 93,000 88,900
Dec. 31,2005
Dec. 31,2006
Dec. 31,2007
March 31,2008
June 30,2008

AUTOMOTIVE SECTOR
2008 SECOND QUARTER MARKET RESULTS
U.S.Industry SAAR (Mils.) 14.6 (1.8) 15.1 (1.6)Market Share (Pct.)- Ford and Lincoln Mercury 14.4% (1.2) Pts. 14.7% (0.7) Pts.- Volvo 0.5 (0.1) 0.6 0
Total U.S. Market Share 14.9% (1.3) Pts. 15.3% (0.7) Pts.
EuropeIndustry SAAR (Mils.) 17.2 (0.8) 17.5 (0.4)Market Share (Pct.)*- Ford 8.5% 0.2 Pts. 8.7% 0 Pts.- Volvo 1.3 (0.1) 1.4 (0.1)
Total Europe Market Share 9.8% 0.1 Pts. 10.1% (0.1) Pts.
Other RegionsFord Brand Market Share (Pct.)- South America** 9.5% (1.4) Pts. 9.5% (1.5) Pts.- Asia Pacific Africa*** 1.9 (0.3) 1.9 (0.3)
* European market share for Ford and Volvo is based, in part, on estimated vehicle registrations for the 19 major European markets that we track
** South American market share is based, in part, on estimated vehicle registrations for our six major markets in that region
*** Asia Pacific Africa 2008 market share is based, in part, on estimated vehicle sales for our twelve major markets in that region
Appendix 11 of 23
AbsoluteB / (W)2007
Second Quarter
AbsoluteB / (W)2007
First Half
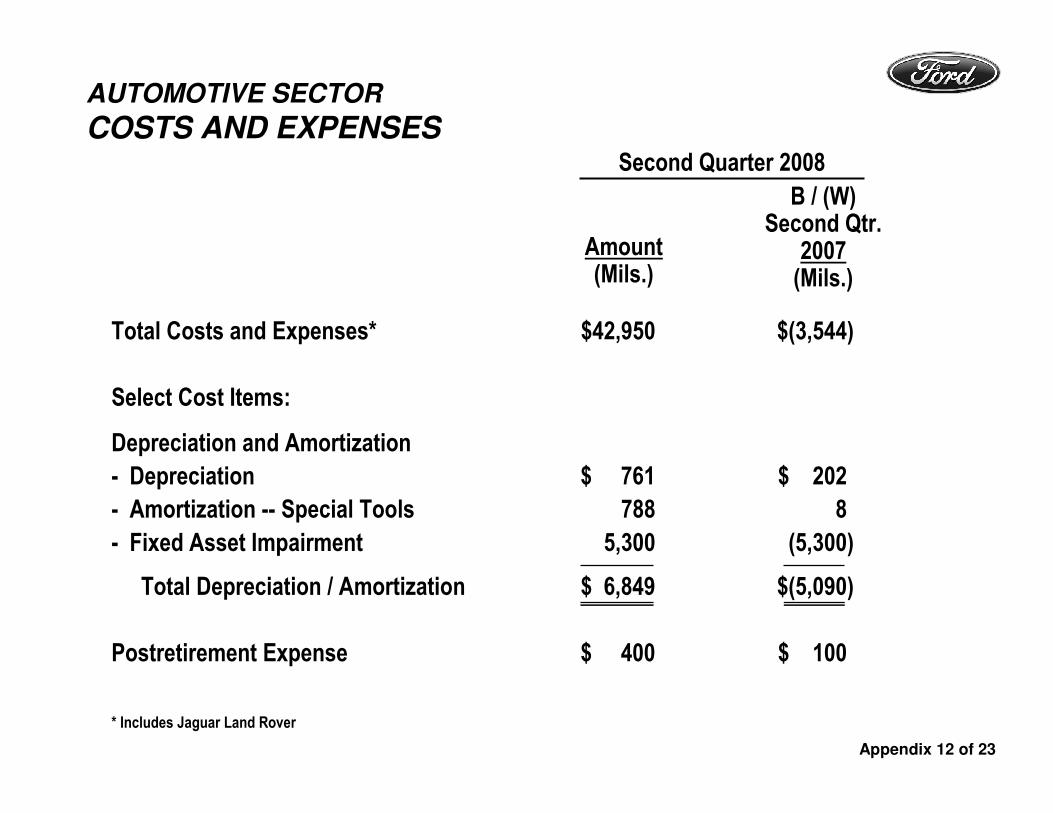
AUTOMOTIVE SECTOR
COSTS AND EXPENSES
Total Costs and Expenses* $42,950 $(3,544)
Select Cost Items:
Depreciation and Amortization
- Depreciation $ 761 $ 202
- Amortization -- Special Tools 788 8
- Fixed Asset Impairment 5,300 (5,300)
Total Depreciation / Amortization $ 6,849 $(5,090)
Postretirement Expense $ 400 $ 100
* Includes Jaguar Land Rover
Appendix 12 of 23
Amount(Mils.)
B / (W)Second Qtr.
2007(Mils.)
Second Quarter 2008

AUTOMOTIVE SECTOR
GROSS CASH RECONCILIATION TO GAAP
Cash and Cash Equivalents $20.7 $16.9 $(3.8) $17.1 $18.7
Marketable Securities 2.0 5.1 3.1 13.7 6.6
Loaned Securities 10.3 7.4 (2.9) 4.6 6.7
Total Cash / Marketable and Loaned Securities $33.0 $29.4 $(3.6) $35.4 $32.0
Securities-In-Transit (0.3) (0.1) 0.2 (0.3) (0.7)
Short-Term VEBA Assets* 1.9 - (1.9) 2.3 -
UAW-Ford Temporary Asset Account - (2.7) (2.7) - (2.6)
Gross Cash $34.6 $26.6 $(8.0) $37.4 $28.7
* Historically, amounts accessible within 18 months; short-term VEBA is no longer reported within gross cash as of January 1, 2008,
consistent with our new UAW VEBA agreement (which is subject to court approval)
Appendix 13 of 23
June 30, 2008B / (W)
Dec. 31, 2007(Bils.)
June 30,2008(Bils.)
Dec. 31,2007(Bils.)
June 30, 2007(Bils.)
March 31, 2008(Bils.)
Memo:

AUTOMOTIVE SECTOR
GAAP RECONCILIATION OF
OPERATING-RELATED CASH FLOWS*
Cash Flows from Operating Activities of Continuing Operations $(2.2) $(3.5) $(1.6)
Items Included in Operating-Related Cash Flows- Capital Expenditures (1.6) (0.3) (2.9)- Net Transactions Between Automotive and
Financial Services Sectors (0.7) (0.8) (1.3)- Net Cash Flows from Non-Designated Derivatives 0.6 0.3 0.8
Items Not Included in Operating-Related Cash Flows- Cash Impact of Job Security Program & Personnel Reduction Program 0.2 (0.2) 0.3- Net (Sales) / Purchases of Trading Securities - (0.7) -- Pension Contributions 0.2 (0.2) 0.8- VEBA Cash Flows -- Net Reimbursement for Benefits Paid - 0.3 -- Tax Refunds and Tax Payments from Affiliates - - (0.9)- Other 0.4 0.2 0.2
Operating-Related Cash Flows $(3.1) $(4.9) $(4.6)
* 2008 excludes Jaguar Land Rover and 2007 includes Jaguar Land RoverAppendix 14 of 23
Second Quarter(Bils.)
2008O / (U)2007(Bils.)
First Halfof 2008(Bils.)

Key MetricsPre-Tax Profit / (Loss) (Mils.)
Second Quarter
Receivables (Bils.)On-Balance Sheet $ 140 $ 136Managed 149 140Charge-Offs (Mils.)On-Balance Sheet $ 125 $ 246Managed 139 254Loss-to-Receivables RatioOn-Balance Sheet 0.36% 0.70%Managed- U.S. Retail and Lease 0.51 1.11- Worldwide Total 0.38 0.70Allow. for Credit LossesWorldwide Amount (Bils.) $ 1.0 $ 1.5Pct. Of EOP Receivables 0.72% 1.08%Leverage (To 1)Financial Statement 11.1 11.2Managed 10.6 10.0Dividend / Distribution (Bils.) $ 0 $ 0Net Income / (Loss) (Mils.) $ 62 $(1,427)
2007 2008
* See Appendix for calculation, definitions and reconciliation to GAAP
FINANCIAL SERVICES SECTOR
FORD CREDIT RESULTS AND METRICS --2008 SECOND QUARTER*
$(2,380)
Second Quarter2007
Second Quarter2008
$112
$(294)
$(406)
Pre-Tax Profit / (Loss) Excluding Impairment (Mils.)
$112
$(2,492)
Appendix 15 of 23

FORD CREDIT KEY METRIC DEFINITIONS
In addition to evaluating Ford Credit’s financial performance on a GAAP financial statement basis, Ford Credit management also uses other criteria, some of which were previously disclosed in this presentation and are defined below. Information about the impact of on-balance sheet securitization is also included below:
Managed Receivables -- receivables reported on Ford Credit’s balance sheet, excluding unearned interest supplements related to finance receivables, and receivables Ford Credit sold in off-balance sheet securitizations and continues to service
Serviced Receivables -- includes managed receivables and receivables Ford Credit sold in whole-loan sale transactions (i.e., receivables for which Ford Credit has no continuing exposure or risk of loss)
Charge-offs on Managed Receivables -- charge-offs associated with receivables reported on Ford Credit’s balance sheet plus charge-offs associated with receivables Ford Credit sold in off-balance sheet securitizations and continues to service
Equity -- shareholder’s interest and historical stockholder’s equity reported on Ford Credit’s balance sheet
Impact of On-Balance Sheet Securitization -- finance receivables (retail and wholesale) and net investment in operating leases reported on Ford Credit's balance sheet include assets included in securitizations that do not qualify for accounting sale treatment. These assets are available only for repayment of the debt or other obligations issued or arising in the securitization transactions; they are not available to pay the other obligations of Ford Credit or the claims of Ford Credit's other creditors. Debt reported on Ford Credit's balance sheet includes obligations issued or arising in securitizations that are payable only out of collections on the underlying securitized assets and related enhancements
Appendix 16 of 23

FINANCIAL SERVICES SECTOR
FORD CREDIT RATIO DEFINITIONS
In addition to evaluating Ford Credit’s financial performance on a GAAP financial statement basis, Ford Credit management also uses other criteria, some of which were previously disclosed in this presentation and are defined below:
Leverage:
Total Debt- Financial Statement Leverage =
Equity
Total Debt
SecuritizedOff-Balance
SheetReceivables
Cash, CashEquivalents &MarketableSecurities*
Adjustments forHedge Accountingon Total Debt**
Equity MinorityInterest
Adjustments for Hedge Accounting on Equity**
- Managed Leverage + - - -=
+ -
RetainedInterest inSecuritizedOff-Balance
SheetReceivables
Charge-offs=
Average ReceivablesLoss-to-Receivables Ratio
* Excludes marketable securities related to insurance activities** Primarily related to market valuation adjustments from derivatives due to movements in interest rates
Appendix 17 of 23

Total Debt* $ 137.7 $137.5
Securitized Off-Balance Sheet Receivables Outstanding 9.3 3.0
Retained Interest in Securitized Off-Balance Sheet Receivables (0.9) (0.4)
Adjustments for Cash, Cash Equivalents and Marketable Securities** (16.7) (19.6)
Adjustments for Hedge Accounting*** (0.0) (0.1)
Total Adjusted Debt $ 129.4 $120.4
Total Equity (incl. minority interest) $ 12.4 $ 12.3
Adjustments for Hedge Accounting*** (0.2) (0.2)
Total Adjusted Equity $ 12.2 $ 12.1
Financial Statement Leverage (to 1) 11.1 11.2
Managed Leverage (to 1) 10.6 10.0
* Includes $63.4 billion and $74.7 billion on June 30, 2007 and June 30, 2008, respectively, of long-term and short-term asset-backed debt obligations issued in securitizations that are payable only out of collections on the underlying securitized assets and related enhancements
** Excludes marketable securities related to insurance activities
*** Primarily related to market valuation adjustments from derivatives due to movements in interest rates
June 30,2008(Bils.)Leverage Calculation
June 30,2007(Bils.)
FINANCIAL SERVICES SECTOR
FORD CREDIT RECONCILIATIONS OF MANAGED
LEVERAGE TO FINANCIAL STATEMENT LEVERAGE
Appendix 18 of 23

TOTAL COMPANY2005 - 2008 PRE-TAX RESULTS INCLUDING SPECIAL ITEMS
North America $(2,461) $(16,006) $(702) $ (67) $(689) $(2,681) $(4,139) $(445)South America 399 661 113 255 386 418 1,172 257
Europe (437) 371 208 184 254 98 744 728Volvo 267 (256) 90 (91) (174) (2,543) (2,718) (151)
Asia Pacific Africa 42 (250) (28) 18 19 (7) 2 (4)Mazda 247 259 21 72 14 75 182 49Subtotal $(1,943) $(15,221) $(298) $ 371 $(190) $(4,640) $(4,757) $ 434
Other Automotive (55) 247 (341) (107) (603) (8) (1,059) (182)Subtotal Ongoing Automotive $(1,998) $(14,974) $(639) $ 264 $(793) $(4,648) $(5,816) 252
JLR and Aston Martin (1,901) (2,066) 301 557 81 (93) 846 0Total Automotive $(3,899) $(17,040) $(338) $ 821 $(712) $(4,741) $(4,970) $ 252
Financial Services 4,953 1,966 294 105 556 269 1,224 64Total Company $ 1,054 $(15,074) $ (44) $ 926 $(156) $(4,472) $(3,746) $ 316
Appendix 19 of 23
2005(Mils.)
2006(Mils.)
FirstQuarter(Mils.)
SecondQuarter(Mils.)
ThirdQuarter(Mils.)
FourthQuarter(Mils.)
FullYear(Mils.)
Full Year 2007 2008First
Quarter(Mils.)

TOTAL COMPANY
2005 - 2008 PRE-TAX SPECIAL ITEMS
North America $ (959) $(10,020) $ (89) $ 203 $ 328 $(1,135) $ (693) $(400)South America - 110 - - - - - 0
Europe (510) (84) (11) (78) (39) (125) (253) (11)Volvo (110) (217) (4) - (7) (2,543) (2,554) 0
Asia Pacific Africa (19) (65) (2) (8) (11) (17) (38) (5)Mazda - 115 - - - - - 0Subtotal $(1,598) $(10,161) $(106) $ 117 $ 271 $(3,820) $(3,538) $(416)
Other Automotive 152 - - - (632) 120 (512) 16Subtotal Ongoing Automotive $(1,446) $(10,161) $(106) $ 117 $(361) $(3,700) $(4,050) $(400)
JLR and Aston Martin (1,435) (1,761) (7) 326 11 (152) 178 0Total Automotive $(2,881) $(11,922) $(113) $ 443 $(350) $(3,852) $(3,872) $(400)
Financial Services 1,499 - - - - - - 0Total Company $(1,382) $(11,922) $(113) $ 443 $(350) $(3,852) $(3,872) $(400)
Appendix 20 of 23
2005(Mils.)
2006(Mils.)
FirstQuarter(Mils.)
SecondQuarter(Mils.)
ThirdQuarter(Mils.)
FourthQuarter(Mils.)
FullYear(Mils.)
Full Year 2007 2008First
Quarter(Mils.)

TOTAL COMPANY2005 - 2008 PRE-TAX RESULTS EXCLUDING SPECIAL ITEMS
North America $(1,502 ) $(5,986 ) $(613) $(270) $(1,017) $(1,546) $(3,446) $ (45)South America 399 551 113 255 386 418 1,172 257
Europe 73 455 219 262 293 223 997 739Volvo 377 (39 ) 94 (91) (167) 0 (164) (151)
Asia Pacific Africa 61 (185 ) (26) 26 30 10 40 1Mazda 247 144 21 72 14 75 182 49Subtotal $ (345 ) $(5,060 ) $(192) $ 254 $ (461) $ (820) $(1,219) $ 850
Other Automotive (207 ) 247 (341) (107) 29 (128) (547) (198)Subtotal Ongoing Automotive $ (552 ) $(4,813 ) $(533) $147 $ (432) $ (948) $(1,766) $ 652
JLR and Aston Martin (466 ) (305 ) 308 231 70 59 668 0Total Automotive $(1,018 ) $(5,118 ) $(225) $ 378 $ (362) $ (889) $(1,098) $ 652
Financial Services 3,454 1,966 294 105 556 269 1,224 64Total Company $ 2,436 $(3,152 ) $ 69 $ 483 $ 194 $ (620) $ 126 $ 716
Appendix 21 of 23
2005(Mils.)
2006(Mils.)
FirstQuarter(Mils.)
SecondQuarter(Mils.)
ThirdQuarter(Mils.)
FourthQuarter(Mils.)
FullYear(Mils.)
Full Year 2007 2008First
Quarter(Mils.)

TOTAL COMPANY
2005 - 2008 REVENUE*
North America $ 81,162 $ 70,591 $18,559 $18,961 $16,688 $17,257 $ 71,465 $17,110South America 4,366 5,697 1,283 1,827 2,064 2,411 7,585 1,842
Europe 29,918 30,394 8,632 9,203 8,328 10,287 36,450 10,155Volvo 17,109 16,105 4,572 4,373 3,844 5,070 17,859 4,197
Asia Pacific Africa 7,684 6,539 1,769 1,727 1,782 1,768 7,046 1,668Mazda - - - - - - - -Subtotal Ongoing Automotive $140,239 $129,326 $34,815 $36,091 $32,706 $36,793 $140,405 $34,972
JLR and Aston Martin 13,174 13,923 3,815 4,015 3,564 3,954 15,348 0Total Automotive $153,413 $143,249 $38,630 $40,106 $36,270 $40,747 $155,753 $34,972
Financial Services 23,422 16,816 4,389 4,136 4,808 4,743 18,076 4,411Total Company $176,835 $160,065 $43,019 $44,242 $41,078 $45,490 $173,829 $39,383
* Special items are reductions to Fourth Quarter 2007 revenues of $1,099 million for North America, $120 million for Europe, $87 million for Volvo, $15 million for Asia Pacific, $53 million for Jaguar Land Rover and Aston Martin, each representing a one-time non-cash charge related to a changein our business practice for offering and announcing retail variable marketing incentives to our dealers. First Quarter 2008 Jaguar Land Rover revenues of$4,145 million are excluded as special items
Appendix 22 of 23
2005(Mils.)
2006(Mils.)
FirstQuarter(Mils.)
SecondQuarter(Mils.)
ThirdQuarter(Mils.)
FourthQuarter(Mils.)
FullYear(Mils.)
Full Year 2007 2008First
Quarter(Mils.)

TOTAL COMPANY
2005 - 2008 WHOLESALES*
North America 3,442 3,123 744 816 649 681 2,890 704South America 335 381 84 110 116 126 436 92
Europe 1,753 1,846 500 509 422 487 1,918 500Volvo 485 460 128 125 102 127 482 106
Asia Pacific Africa 473 517 126 135 129 145 535 129Mazda - - - - - - - -Subtotal Ongoing Automotive 6,488 6,327 1,582 1,695 1,418 1,566 6,261 1,531
JLR and Aston Martin 279 270 68 78 69 77 292 0Total Automotive 6,767 6,597 1,650 1,773 1,487 1,643 6,553 1,531
* First Quarter 2008 Jaguar Land Rover wholesales of 74,000 units are excluded as special items
Appendix 23 of 23
2005(000)
2006(000)
FirstQuarter(000)
SecondQuarter(000)
ThirdQuarter(000)
FourthQuarter(000)
FullYear(000)
Full Year 2007 2008First
Quarter(Mils.)


![Q2 Result Presentation [Company Update]](https://static.fdocuments.in/doc/165x107/577ca7871a28abea748c70f6/q2-result-presentation-company-update.jpg)