For personal use only - ASX · Ferrovial approach On 7 December 2015, Ferrovial Services Australia...
33
CONTENTS PAGE Appendix 4D 2 Directors’ report 3 Financial report 15 Auditor’s independence declaration 30 Independent auditor’s review report to the members 31 Corporate directory 33 IMPORTANT NOTE: Throughout this document, non-International Financial Reporting Standards (IFRS) financial indicators are included to assist with understanding the Group’s performance. The primary non-IFRS information is underlying earnings before income tax, depreciation and amortisation (EBITDA), underlying earnings before income tax (EBIT) and underlying net profit after tax (NPAT). Management believes Underlying EBITDA, Underlying EBIT and Underlying NPAT are appropriate indicators of the ongoing operational earnings of the business and its segments because these measures do not include significant one-off items (both positive and negative) that relate to disposed or discontinued operations, pre-acquisition legal settlement costs, costs incurred to restructure the business in the current period or costs associated with a takeover defence. A reconciliation of non-IFRS to IFRS information is included in the Statutory Reconciliations section of the Directors’ Report on page 14. All comparisons are to the previous corresponding period of H1 FY2015 – the six months ended 31 December 2014, unless otherwise indicated. Certain figures provided in this document have been rounded. In some cases, totals and percentages have been calculated from information that has not been rounded, hence some columns in tables may not add exactly. For personal use only
Transcript of For personal use only - ASX · Ferrovial approach On 7 December 2015, Ferrovial Services Australia...

CONTENTS PAGE
Appendix 4D 2
Directors’ report 3
Financial report 15
Auditor’s independence declaration 30
Independent auditor’s review report to the members 31
Corporate directory 33
IMPORTANT NOTE: Throughout this document, non-International Financial Reporting Standards (IFRS) financial indicators are included to assist with understanding the Group’s performance. The primary non-IFRS information is underlying earnings before income tax, depreciation and amortisation (EBITDA), underlying earnings before income tax (EBIT) and underlying net profit after tax (NPAT).
Management believes Underlying EBITDA, Underlying EBIT and Underlying NPAT are appropriate indicators of the ongoing operational earnings of the business and its segments because these measures do not include significant one-off items (both positive and negative) that relate to disposed or discontinued operations, pre-acquisition legal settlement costs, costs incurred to restructure the business in the current period or costs associated with a takeover defence. A reconciliation of non-IFRS to IFRS information is included in the Statutory Reconciliations section of the Directors’ Report on page 14.
All comparisons are to the previous corresponding period of H1 FY2015 – the six months ended 31 December 2014, unless otherwise indicated.
Certain figures provided in this document have been rounded. In some cases, totals and percentages have been calculated from information that has not been rounded, hence some columns in tables may not add exactly.
For
per
sona
l use
onl
y
APPENDIX 4DSix months ended 31 December 2015
2| Broadspectrum Interim Report 2016
Name of entity
Broadspectrum Limited (ABN: 69 000 484 417)
Reporting period
Current reporting period: 1 July 2015 to 31 December 2015
Previous corresponding period: 1 July 2014 to 31 December 2014
Results for announcement to the market
$’millionsDecember
2015December
2014 Up/(Down)
Revenue 1,861.5 1,895.4 (1.8%)
Underlying EBITDA* 124.7 112.2 11.1%
EBITDA 119.6 98.3 21.7%
Underlying NPAT* 27.9 18.1 54.2%
NPAT 25.0 8.4 197.6%
Profit from continuing activities after tax attributable to members 25.1 8.3 202.4%
NPAT for the period attributable to members 25.1 8.3 202.4%
EBITDA: Earnings Before Interest, Tax, Depreciation and Amortisation
NPAT: Net Profit After Tax
* Numbers defined as “Underlying” exclude restructuring costs, gains and losses on disposal of assets or businesses, earnings from discontinued operations and other one-off non-recurring items. A reconciliation between statutory and underlying financial information is included in the Statutory Reconciliations’ section of the Directors’ Report for the six month ended 31 December 2015.
centsAmount
per securityFrankedamount
FY2015 final dividend Nil Nil
FY2016 interim dividend Nil Nil
Date
Record date for determining entitlement to the dividends Not applicable
Payment date of dividends Not applicable
$December
2015June2015
Net assets per share 1.63 1.58
Net tangible assets per share 0.57 0.52
This information should be read in conjunction with the FY2015 Annual Financial Report of Broadspectrum Limited and its controlled entities and any public announcements made in the period by Broadspectrum Limited in accordance with the continuous disclosure requirements of the Corporations Act 2001 and Listing Rules.
Additional Appendix 4D disclosure requirements can be found in the Directors’ Report and the consolidated financial statements for the six month ended 31 December 2015.
This report is based on the consolidated financial statements for the six month ended 31 December 2015 of Broadspectrum Limited and its controlled entities, which have been reviewed by KPMG. The Independent Auditor’s Review Report provided by KPMG is attached to the consolidated financial report for the six month ended 31 December 2015.
For
per
sona
l use
onl
y
3| Broadspectrum Interim Report 2016
DIRECTORS’ REPORTSix months ended 31 December 2015
Your Directors present their report on the consolidated entity consisting of Broadspectrum Limited (“the Company” or “Parent Entity”) and the entities it controlled at the end of, or during, the six month period ended 31 December 2015 (the “Group”).
DIRECTORS
The Directors of the Company at any time during or since the end of the six month period ended 31 December 2015 are:
• Diane Smith-Gander;
• Graeme Hunt;
• Douglas Snedden;
• Roy McKelvie;
• Katherine Hirschfeld;
• Dean Pritchard; and
• Geoffrey Kleemann.
SIGNIFICANT AFFAIRS DURING THE REPORTING PERIOD
Rebranding
The Company announced Broadspectrum Limited (“Broadspectrum) as its proposed new name and brand in its Notice of 2015 Annual General Meeting dated 25 September 2015. Shareholders approved the new name at the Annual General Meeting held on 28 October 2015.
Contract with the Department of Immigration and Border Protection (“DIBP”)
On 31 August 2015, the Company announced it was the preferred tenderer to provide welfare and garrison support services at the regional processing centres in the Republic of Nauru (“Nauru) and the Manus Province of Papua New Guinea (“Manus”). On 28 October 2015, the Company announced that it had signed a Deed of Variation with the DIBP, which extended the Company’s current contract for a further four months on existing terms and an expanded scope.
Ferrovial approach
On 7 December 2015, Ferrovial Services Australia Pty Limited, an indirectly and wholly owned subsidiary of Ferrovial, S.A. (“Ferrovial”) announced an off-market conditional takeover offer for 100% of the shares in Broadspectrum, offering cash consideration of $1.35 per Broadspectrum share (“the Offer”).
SIGNIFICANT AFFAIRS OUTSIDE THE REPORTING PERIOD
Contract with the DIBP
On 8 February 2016 Broadspectrum advised that its existing contract with the DIBP to provide welfare and garrison support services at the regional processing centres in Nauru and Manus was extended for a further 12 months from 29 February 2016. The Company will continue to operate on the existing expanded scope of services as has been the case since 1 November 2015 and on substantially similar terms. The contract extension is an indication of the strength of the client relationship and Broadspectrum’s delivery performance. In addition to the initial 12 month extension, the contract includes two options, each for an additional four-month period. These options are exercisable at the DIBP’s discretion.
Further to the extension of Broadspectrum’s existing contract, the DIBP has advised the Company that the existing tender process in relation to the granting of a new contract with at least a five year term will be extended due to increases in scope from the original tender. It is understood that Broadspectrum and one other party will receive a request to submit an amended tender under the framework of the existing tender process. The Company believes its incumbency and strong track record in Nauru and Manus means it remains well placed to secure a long-term contract with the DIBP when it is awarded.F
or p
erso
nal u
se o
nly
4| Broadspectrum Interim Report 2016
DIRECTORS’ REPORTSix months ended 31 December 2015
Ferrovial approach
Pursuant to legislative requirements, Broadspectrum issued its response to Ferrovial’s Bidder’s Statement through our Target’s Statement on 21 January 2016 and Supplementary Target’s Statement dated 8 February 2016. These documents advised shareholders that Broadspectrum’s Directors have unanimously recommended that shareholders reject the cash Offer of $1.35 per share because it significantly undervalues Broadspectrum’s Shares.
The current Offer from Ferrovial expires on 7 March 2016. Your Directors’ believe that it is highly unlikely that the Offer will become unconditional prior to this date, noting in particular that New Zealand Overseas Investment Office (“NZ OIO”) approval is required. The NZ OIO’s reported target is to process 90% of applications within 50 business days, although recent statistics suggest that the approval process has taken on average at least 80 business days.
Please refer to the Target’s Statement dated 21 January 2016 and Supplementary Target’s Statement dated 8 February 2016, which provides shareholders with more detail in respect of the Ferrovial Offer.
Extension of syndicated facility agreement
On 12 February 2016, Broadspectrum concluded amendments to its existing senior syndicated bank facility, the changes will deliver interest savings of approximately $5 million per annum, extend the funding commitment by a further 12 months to 1 July 2018, and improves flexibility.
Share buy-back1
Given the Company’s continued strong cash generation, the Company announced a share buy-back on 15 February 2016. Broadspectrum’s Board has advised that it intends to purchase up to 10% of the Company’s shares on-market over the next 12 months. The buy-back will commence no earlier than 8 March 2016.
DIVIDEND1
Any further decisions with respect to dividends or capital return alternatives will be made having regard to all the relevant circumstances at the time, including the status of the Ferrovial Offer which includes conditions to the effect that no dividends or capital distributions are paid.
SAFETY PERFORMANCE
Total Recordable Injury Frequency Rate (“TRIFR”) decreased from 6.3 to 5.3 injuries per one million hours worked in the Prior Comparative Period (“PCP”). The TRIFR shows a positive trend, improving by 16% over the period. The Company achieved a Lost Time Injury Frequency Rate (“LTIFR”) of 1.4 injuries per one million hours worked for the 6 months ending 31 December 2015, up from 1.2 injuries per one million hours worked in the PCP”).
REVIEW OF OPERATIONS
Principal activities
During the period, the principal activities of Broadspectrum Limited and its subsidiaries are the provision of operations, maintenance, asset management and project management services. Principal operations are in Australia, New Zealand, the Americas (comprising the United States, Canada and Chile) and parts of Asia and the wider Pacific region.
Business overview
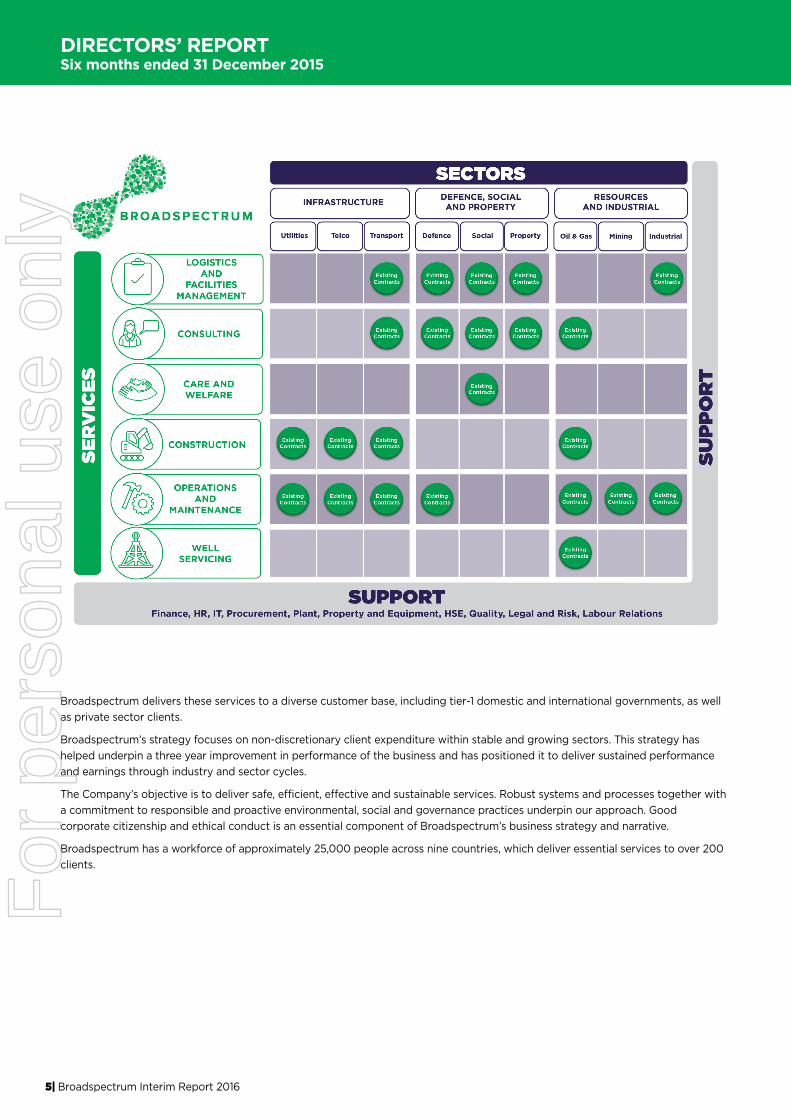
Broadspectrum delivers a range of essential services to its clients. The Company’s operations are organised across four key sectors:
• Defence, Social and Property;
• Infrastructure;
• Resources and Industrial; and
• Americas.
Across these sectors, Broadspectrum performs services grouped into the following categories:
• Logistics and Facilities Management (including Care and Welfare);
• Operations and Maintenance;
• Well Servicing;
• Consulting (comprising Planning, Feasibility and Development Services as well as Engineering Design and Project Management Services); and
• Construction.
1 All forward debt and leverage metrics do not include dividends or capital management initiatives such as a share buy-back.
For
per
sona
l use
onl
y
5| Broadspectrum Interim Report 2016
DIRECTORS’ REPORTSix months ended 31 December 2015
Broadspectrum delivers these services to a diverse customer base, including tier-1 domestic and international governments, as well as private sector clients.
Broadspectrum’s strategy focuses on non-discretionary client expenditure within stable and growing sectors. This strategy has helped underpin a three year improvement in performance of the business and has positioned it to deliver sustained performance and earnings through industry and sector cycles.
The Company’s objective is to deliver safe, efficient, effective and sustainable services. Robust systems and processes together with a commitment to responsible and proactive environmental, social and governance practices underpin our approach. Good corporate citizenship and ethical conduct is an essential component of Broadspectrum’s business strategy and narrative.
Broadspectrum has a workforce of approximately 25,000 people across nine countries, which deliver essential services to over 200 clients.
For
per
sona
l use
onl
y
6| Broadspectrum Interim Report 2016
DIRECTORS’ REPORTSix months ended 31 December 2015
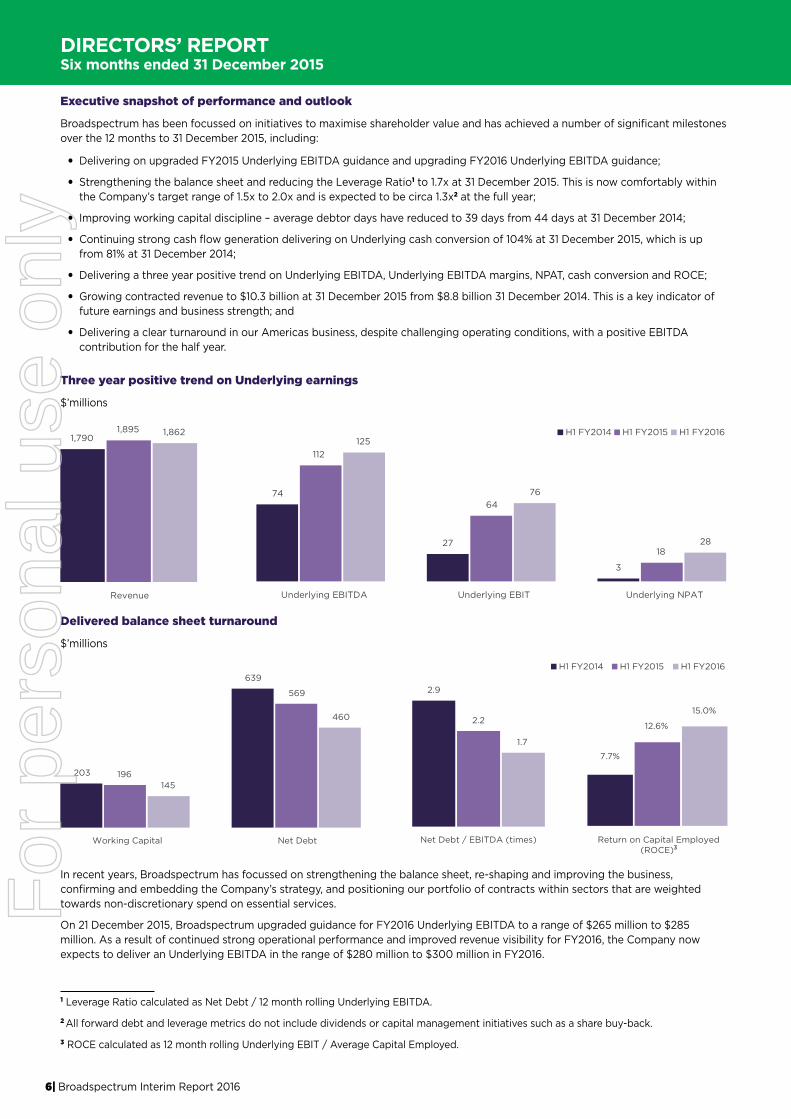
Executive snapshot of performance and outlook
Broadspectrum has been focussed on initiatives to maximise shareholder value and has achieved a number of significant milestones over the 12 months to 31 December 2015, including:
• Delivering on upgraded FY2015 Underlying EBITDA guidance and upgrading FY2016 Underlying EBITDA guidance;
• Strengthening the balance sheet and reducing the Leverage Ratio1 to 1.7x at 31 December 2015. This is now comfortably within the Company’s target range of 1.5x to 2.0x and is expected to be circa 1.3x2 at the full year;
• Improving working capital discipline – average debtor days have reduced to 39 days from 44 days at 31 December 2014;
• Continuing strong cash flow generation delivering on Underlying cash conversion of 104% at 31 December 2015, which is up from 81% at 31 December 2014;
• Delivering a three year positive trend on Underlying EBITDA, Underlying EBITDA margins, NPAT, cash conversion and ROCE;
• Growing contracted revenue to $10.3 billion at 31 December 2015 from $8.8 billion 31 December 2014. This is a key indicator of future earnings and business strength; and
• Delivering a clear turnaround in our Americas business, despite challenging operating conditions, with a positive EBITDA contribution for the half year.
Three year positive trend on Underlying earnings
$’millions
1,7901,895 1,862
Revenue
74
27
3
112
64
18
125
76
28
Underlying EBITDA Underlying EBIT Underlying NPAT
H1 FY2014 H1 FY2015 H1 FY2016
1 Leverage Ratio calculated as Net Debt / 12 month rolling Underlying EBITDA.
2 All forward debt and leverage metrics do not include dividends or capital management initiatives such as a share buy-back.
3 ROCE calculated as 12 month rolling Underlying EBIT / Average Capital Employed.
Delivered balance sheet turnaround
$’millions
2.9
2.2
1.7
Net Debt / EBITDA (times) Return on Capital Employed(ROCE)1
7.7%
12.6%
15.0%
H1 FY2014 H1 FY2015 H1 FY2016
203
639
196
569
145
460
Working Capital Net Debt
In recent years, Broadspectrum has focussed on strengthening the balance sheet, re-shaping and improving the business, confirming and embedding the Company’s strategy, and positioning our portfolio of contracts within sectors that are weighted towards non-discretionary spend on essential services.
On 21 December 2015, Broadspectrum upgraded guidance for FY2016 Underlying EBITDA to a range of $265 million to $285 million. As a result of continued strong operational performance and improved revenue visibility for FY2016, the Company now expects to deliver an Underlying EBITDA in the range of $280 million to $300 million in FY2016.
3
For
per
sona
l use
onl
y
7| Broadspectrum Interim Report 2016
DIRECTORS’ REPORTSix months ended 31 December 2015
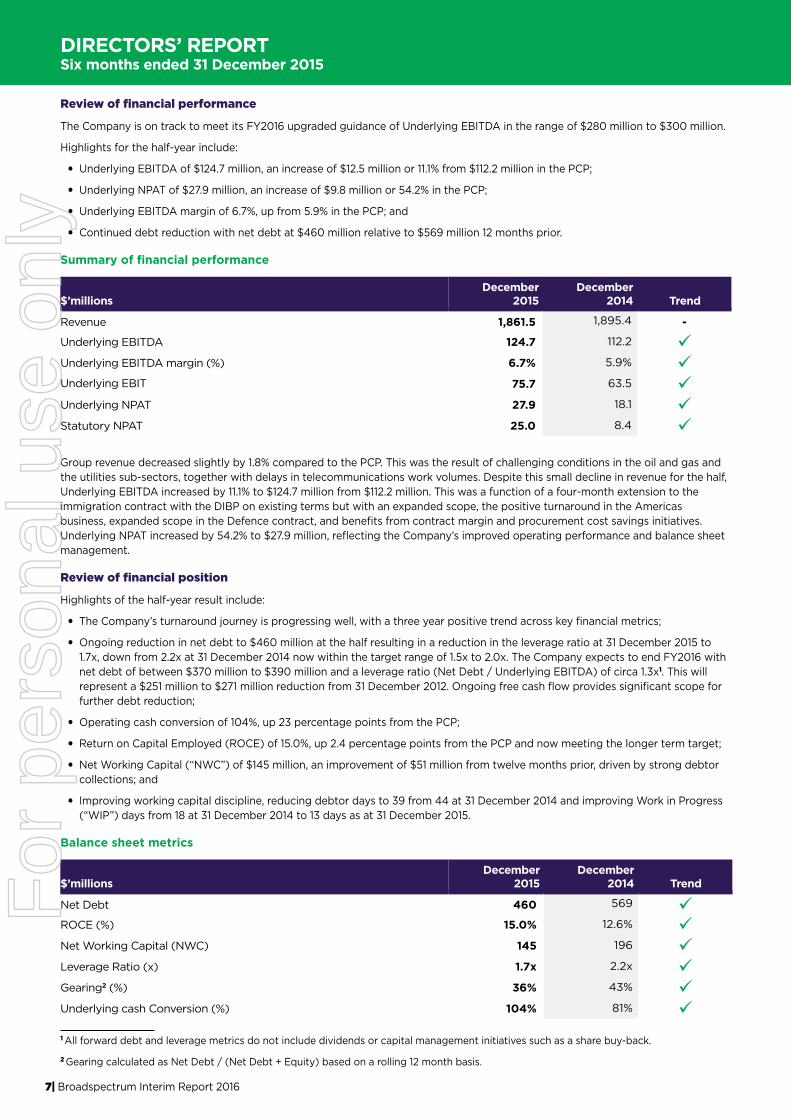
Review of financial performance
The Company is on track to meet its FY2016 upgraded guidance of Underlying EBITDA in the range of $280 million to $300 million.
Highlights for the half-year include:
• Underlying EBITDA of $124.7 million, an increase of $12.5 million or 11.1% from $112.2 million in the PCP;
• Underlying NPAT of $27.9 million, an increase of $9.8 million or 54.2% in the PCP;
• Underlying EBITDA margin of 6.7%, up from 5.9% in the PCP; and
• Continued debt reduction with net debt at $460 million relative to $569 million 12 months prior.
Summary of financial performance
$’millionsDecember
2015December
2014 Trend
Revenue 1,861.5 1,895.4 -
Underlying EBITDA 124.7 112.2 Underlying EBITDA margin (%) 6.7% 5.9% Underlying EBIT 75.7 63.5 Underlying NPAT 27.9 18.1 Statutory NPAT 25.0 8.4
Group revenue decreased slightly by 1.8% compared to the PCP. This was the result of challenging conditions in the oil and gas and the utilities sub-sectors, together with delays in telecommunications work volumes. Despite this small decline in revenue for the half, Underlying EBITDA increased by 11.1% to $124.7 million from $112.2 million. This was a function of a four-month extension to the immigration contract with the DIBP on existing terms but with an expanded scope, the positive turnaround in the Americas business, expanded scope in the Defence contract, and benefits from contract margin and procurement cost savings initiatives. Underlying NPAT increased by 54.2% to $27.9 million, reflecting the Company’s improved operating performance and balance sheet management.
Review of financial position
Highlights of the half-year result include:
• The Company’s turnaround journey is progressing well, with a three year positive trend across key financial metrics;
• Ongoing reduction in net debt to $460 million at the half resulting in a reduction in the leverage ratio at 31 December 2015 to 1.7x, down from 2.2x at 31 December 2014 now within the target range of 1.5x to 2.0x. The Company expects to end FY2016 with net debt of between $370 million to $390 million and a leverage ratio (Net Debt / Underlying EBITDA) of circa 1.3x1. This will represent a $251 million to $271 million reduction from 31 December 2012. Ongoing free cash flow provides significant scope for further debt reduction;
• Operating cash conversion of 104%, up 23 percentage points from the PCP;
• Return on Capital Employed (ROCE) of 15.0%, up 2.4 percentage points from the PCP and now meeting the longer term target;
• Net Working Capital (“NWC”) of $145 million, an improvement of $51 million from twelve months prior, driven by strong debtor collections; and
• Improving working capital discipline, reducing debtor days to 39 from 44 at 31 December 2014 and improving Work in Progress (“WIP”) days from 18 at 31 December 2014 to 13 days as at 31 December 2015.
Balance sheet metrics
$’millionsDecember
2015December
2014 Trend
Net Debt 460 569 ROCE (%) 15.0% 12.6% Net Working Capital (NWC) 145 196 Leverage Ratio (x) 1.7x 2.2x Gearing2 (%) 36% 43% Underlying cash Conversion (%) 104% 81% 1 All forward debt and leverage metrics do not include dividends or capital management initiatives such as a share buy-back.
2 Gearing calculated as Net Debt / (Net Debt + Equity) based on a rolling 12 month basis.
For
per
sona
l use
onl
y
8| Broadspectrum Interim Report 2016
DIRECTORS’ REPORTSix months ended 31 December 2015
Net debt
The strength of the Company’s balance sheet continues to improve, with the Company’s net debt as at 31 December 2015 being $460 million, which is $109 million lower than at 31 December 2014. Net debt includes a $22 million negative impact due to foreign exchange revaluation since 31 December 2014, because a portion of the Company’s debt package (US Private Placement Notes), is held in US dollars. This revaluation is effected via reserves and has no impact on the Company’s Profit and Loss Statement.
Notwithstanding this restatement, the Company’s leverage ratio as at 31 December 2015 is now 1.7x and is within the Company’s target range of 1.5x – 2.0x. This improvement is pleasing, given the impact of foreign exchange movements and continues the strong trend of debt reduction over the last three years. Broadspectrum also anticipates a further material reduction in its net debt balance at 30 June 2016 with net debt anticipated to be between $370 million to $390 million based on cash flows from ordinary operations. This excludes any cash realisations from the sale of assets.
Gearing has improved to 36% from 43% at 31 December 2014. In prior years, the Company had some cyclicality in its net debt profile, with net debt generally increasing in the first half of the fiscal year (31 December), before falling in the second half (30 June). Significantly, this cyclicality is not evident in the first half of the 2016 fiscal year, with Broadspectrum’s net debt at 31 December 2015 of $460 million being less than the balance at 30 June 2015 ($471 million), due to both strong EBITDA and cash conversion.
On 12 February 2016, Broadspectrum concluded amendments to its existing senior syndicated bank facility, the changes will deliver interest savings of approximately $5 millon per annum, extend the funding commitment by a further 12 months to 1 July 2018, and improves flexibility.
In line with the FY2017 outlook provided, Broadspectrum expects further significant free cash flow generation in FY2017 of at least $100 million, which may be used for any combination of debt repayment, dividends and / or other capital returns. This free cash flow generation has the potential to result in the further material debt reduction and deleveraging of Broadspectrum.
Operating cashflow
The Company reported underlying operating cash flow before interest and tax payments of $129.6 million, which represents an underlying cash conversion of 104%. This strong performance has been achieved through continued focus on disciplined billing, cash collection and working capital management. The Company’s net working capital was $145 million, representing a reduction of $51 million from 31 December 2014. Debtor days improved to 39 days from 44 days, while creditor days fell to 39 days from 47 days at 31 December 2014.
Return on Capital Employed (“ROCE”)
ROCE increased to 15.0% as at 31 December 2015 compared with 12.6% as at 31 December 2014.
Contract margin and procurement initiatives
Management are implementing initiatives that target annualised benefits of between $75 million to $100 million by 30 June 20161. The benefits have been identified across four principal categories:
1. Commercial model renegotiation;
2. Procurement;
3. Productivity and efficiency improvement; and
4. Operational discipline and innovation.
In relation to the procurement initiatives, the following has been achieved:
• $421 million of procurement expenditure has been put out to tender in the last six months, with an average discount on prior rates of 11.8% received, achieving an annualised run rate benefit of $43 million; and
• A further $698 million is being reviewed and prepared to take to the market this financial year, with a further $41 million of annualised benefits being targeted.
Gains in the other three areas mentioned are also being defined, scoped and implemented. These initiatives will ensure that we remain competitive in challenged sectors, while at least maintaining or improving margins.
1 The benefits from contract and procurement initiatives may directly reduce Broadspectrum’s operating costs base or be used to maintain and win work with Broadspectrum’s clients.
For
per
sona
l use
onl
y
9| Broadspectrum Interim Report 2016
DIRECTORS’ REPORTSix months ended 31 December 2015
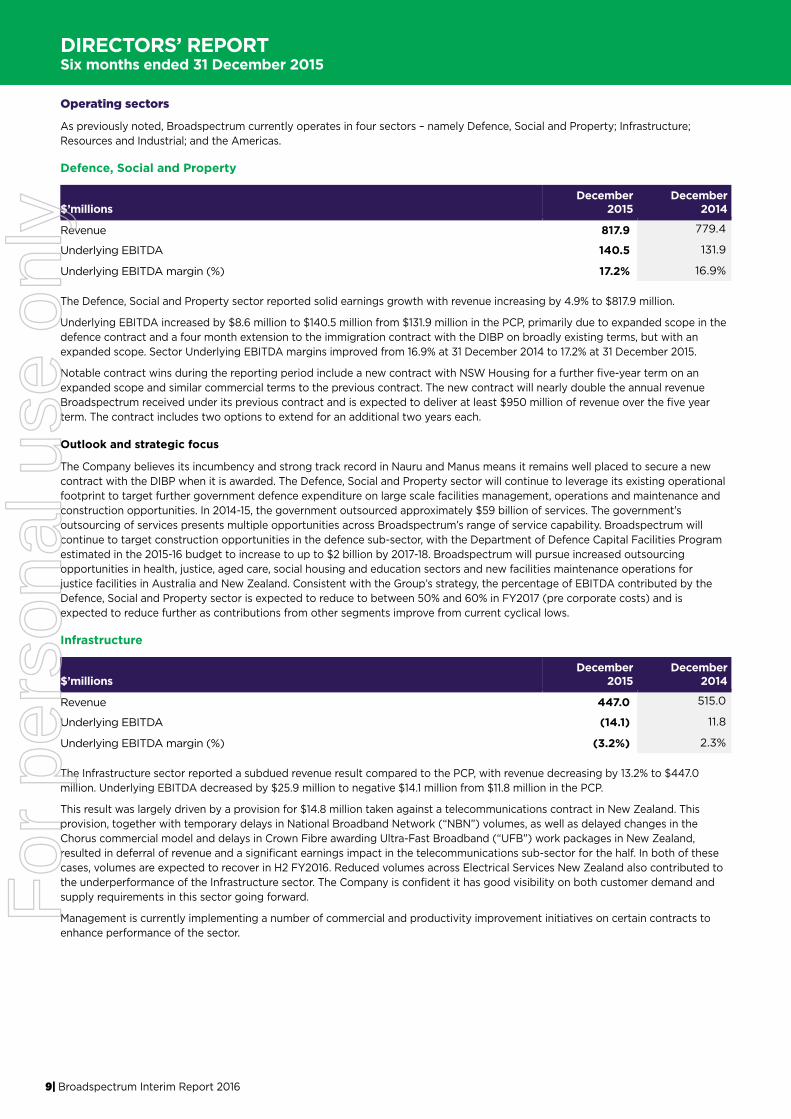
Operating sectors
As previously noted, Broadspectrum currently operates in four sectors – namely Defence, Social and Property; Infrastructure; Resources and Industrial; and the Americas.
Defence, Social and Property
$’millionsDecember
2015December
2014
Revenue 817.9 779.4
Underlying EBITDA 140.5 131.9
Underlying EBITDA margin (%) 17.2% 16.9%
The Defence, Social and Property sector reported solid earnings growth with revenue increasing by 4.9% to $817.9 million.
Underlying EBITDA increased by $8.6 million to $140.5 million from $131.9 million in the PCP, primarily due to expanded scope in the defence contract and a four month extension to the immigration contract with the DIBP on broadly existing terms, but with an expanded scope. Sector Underlying EBITDA margins improved from 16.9% at 31 December 2014 to 17.2% at 31 December 2015.
Notable contract wins during the reporting period include a new contract with NSW Housing for a further five-year term on an expanded scope and similar commercial terms to the previous contract. The new contract will nearly double the annual revenue Broadspectrum received under its previous contract and is expected to deliver at least $950 million of revenue over the five year term. The contract includes two options to extend for an additional two years each.
Outlook and strategic focus
The Company believes its incumbency and strong track record in Nauru and Manus means it remains well placed to secure a new contract with the DIBP when it is awarded. The Defence, Social and Property sector will continue to leverage its existing operational footprint to target further government defence expenditure on large scale facilities management, operations and maintenance and construction opportunities. In 2014-15, the government outsourced approximately $59 billion of services. The government’s outsourcing of services presents multiple opportunities across Broadspectrum’s range of service capability. Broadspectrum will continue to target construction opportunities in the defence sub-sector, with the Department of Defence Capital Facilities Program estimated in the 2015-16 budget to increase to up to $2 billion by 2017-18. Broadspectrum will pursue increased outsourcing opportunities in health, justice, aged care, social housing and education sectors and new facilities maintenance operations for justice facilities in Australia and New Zealand. Consistent with the Group’s strategy, the percentage of EBITDA contributed by the Defence, Social and Property sector is expected to reduce to between 50% and 60% in FY2017 (pre corporate costs) and is expected to reduce further as contributions from other segments improve from current cyclical lows.
Infrastructure
$’millionsDecember
2015December
2014
Revenue 447.0 515.0
Underlying EBITDA (14.1) 11.8
Underlying EBITDA margin (%) (3.2%) 2.3%
The Infrastructure sector reported a subdued revenue result compared to the PCP, with revenue decreasing by 13.2% to $447.0 million. Underlying EBITDA decreased by $25.9 million to negative $14.1 million from $11.8 million in the PCP.
This result was largely driven by a provision for $14.8 million taken against a telecommunications contract in New Zealand. This provision, together with temporary delays in National Broadband Network (“NBN”) volumes, as well as delayed changes in the Chorus commercial model and delays in Crown Fibre awarding Ultra-Fast Broadband (“UFB”) work packages in New Zealand, resulted in deferral of revenue and a significant earnings impact in the telecommunications sub-sector for the half. In both of these cases, volumes are expected to recover in H2 FY2016. Reduced volumes across Electrical Services New Zealand also contributed to the underperformance of the Infrastructure sector. The Company is confident it has good visibility on both customer demand and supply requirements in this sector going forward.
Management is currently implementing a number of commercial and productivity improvement initiatives on certain contracts to enhance performance of the sector.
For
per
sona
l use
onl
y
10| Broadspectrum Interim Report 2016
DIRECTORS’ REPORTSix months ended 31 December 2015
Broadspectrum announced a number of contract wins in the Infrastructure sector in the utilities, transport and water sub-sectors. Notable contract wins during the reporting period include:
• TW Power Services (formerly TWPS) Joint Venture renewed a five and a half year contract with AGL, valued at approximately $200 million to provide services to Loy Yang A power station in Victoria and the adjacent mine. The new contract was effective from 1 January 2016 and Broadspectrum’s share is worth approximately $100 million;
• A new three-year NZ$78 million contract with Transpower, to provide high-voltage maintenance and project services for transmission lines and substations in Auckland, Hawkes Bay, Wellington and Canterbury;
• Utilita Water Solutions, a joint venture between Broadspectrum and Downer, won a five-year $170 million contract with Queensland Urban Utilities (“QUU”) to deliver electrical, civil and mechanical maintenance services. Broadspectrum’s share of the contract is worth approximately $85 million; and
• Broadspectrum is a party to the Nexus Consortium, which was the successful tenderer on the $1.6 billion construction of the second range crossing in Toowoomba. Broadspectrum’s scope of work includes operations and maintenance services upon completion of construction, which is expected to be in late 2018.
Outlook and strategic focus
Notwithstanding previous delays in the planned NBN and UFB roll-outs, the Infrastructure sector is expected to achieve its FY2016 earnings target given the anticipated increase in volumes in H2 FY2016 and certain productivity improvement initiatives currently underway in the telecommunications sub-sector. The expected increase in telecommunications volumes (some of which represent a ‘catch-up’ on lower H1 FY2016 volumes), along with a number of opportunities in water, position the Infrastructure sector well for growth into FY2017. Further, the anticipated privatisation of infrastructure along with the outsourcing of related operations and maintenance activities in the near term presents a significant opportunity for Broadspectrum to grow its Infrastructure business. The Company remains comfortable that earnings from this sector will represent between 20%-30% of FY2017 Underlying EBITDA (pre corporate costs).
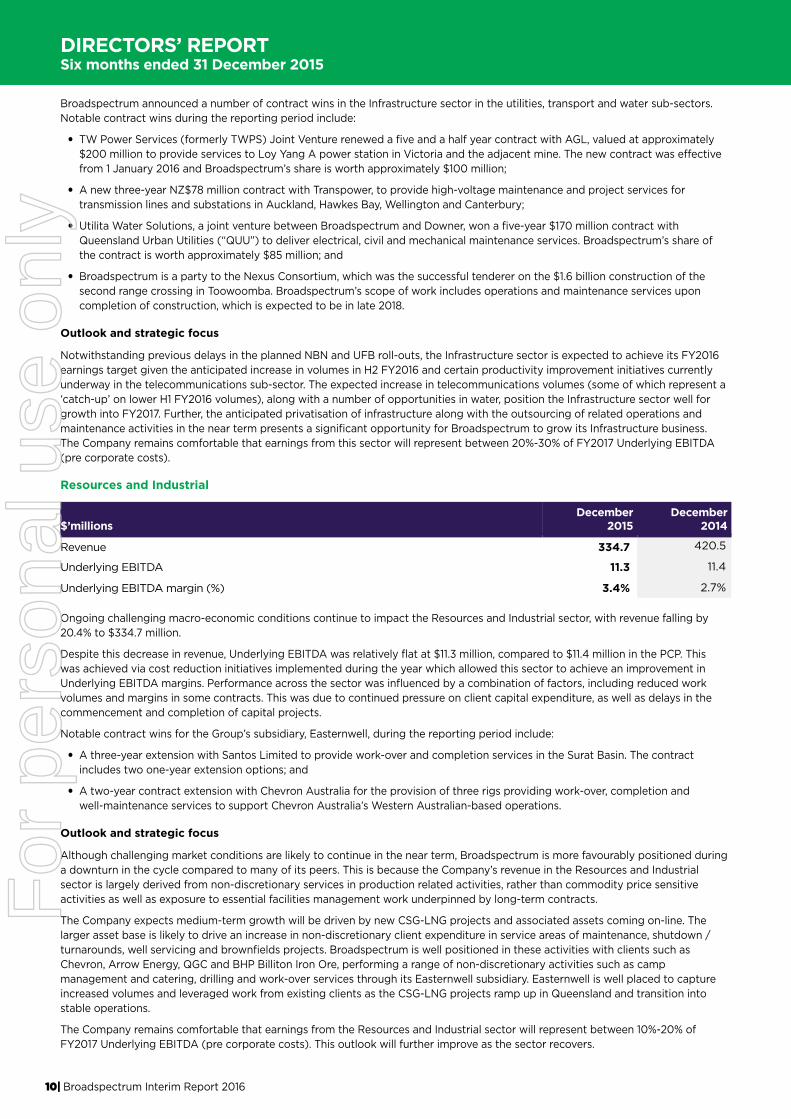
Resources and Industrial
$’millionsDecember
2015December
2014
Revenue 334.7 420.5
Underlying EBITDA 11.3 11.4
Underlying EBITDA margin (%) 3.4% 2.7%
Ongoing challenging macro-economic conditions continue to impact the Resources and Industrial sector, with revenue falling by 20.4% to $334.7 million.
Despite this decrease in revenue, Underlying EBITDA was relatively flat at $11.3 million, compared to $11.4 million in the PCP. This was achieved via cost reduction initiatives implemented during the year which allowed this sector to achieve an improvement in Underlying EBITDA margins. Performance across the sector was influenced by a combination of factors, including reduced work volumes and margins in some contracts. This was due to continued pressure on client capital expenditure, as well as delays in the commencement and completion of capital projects.
Notable contract wins for the Group’s subsidiary, Easternwell, during the reporting period include:
• A three-year extension with Santos Limited to provide work-over and completion services in the Surat Basin. The contract includes two one-year extension options; and
• A two-year contract extension with Chevron Australia for the provision of three rigs providing work-over, completion and well-maintenance services to support Chevron Australia’s Western Australian-based operations.
Outlook and strategic focus
Although challenging market conditions are likely to continue in the near term, Broadspectrum is more favourably positioned during a downturn in the cycle compared to many of its peers. This is because the Company’s revenue in the Resources and Industrial sector is largely derived from non-discretionary services in production related activities, rather than commodity price sensitive activities as well as exposure to essential facilities management work underpinned by long-term contracts.
The Company expects medium-term growth will be driven by new CSG-LNG projects and associated assets coming on-line. The larger asset base is likely to drive an increase in non-discretionary client expenditure in service areas of maintenance, shutdown / turnarounds, well servicing and brownfields projects. Broadspectrum is well positioned in these activities with clients such as Chevron, Arrow Energy, QGC and BHP Billiton Iron Ore, performing a range of non-discretionary activities such as camp management and catering, drilling and work-over services through its Easternwell subsidiary. Easternwell is well placed to capture increased volumes and leveraged work from existing clients as the CSG-LNG projects ramp up in Queensland and transition into stable operations.
The Company remains comfortable that earnings from the Resources and Industrial sector will represent between 10%-20% of FY2017 Underlying EBITDA (pre corporate costs). This outlook will further improve as the sector recovers.
For
per
sona
l use
onl
y
11| Broadspectrum Interim Report 2016
DIRECTORS’ REPORTSix months ended 31 December 2015
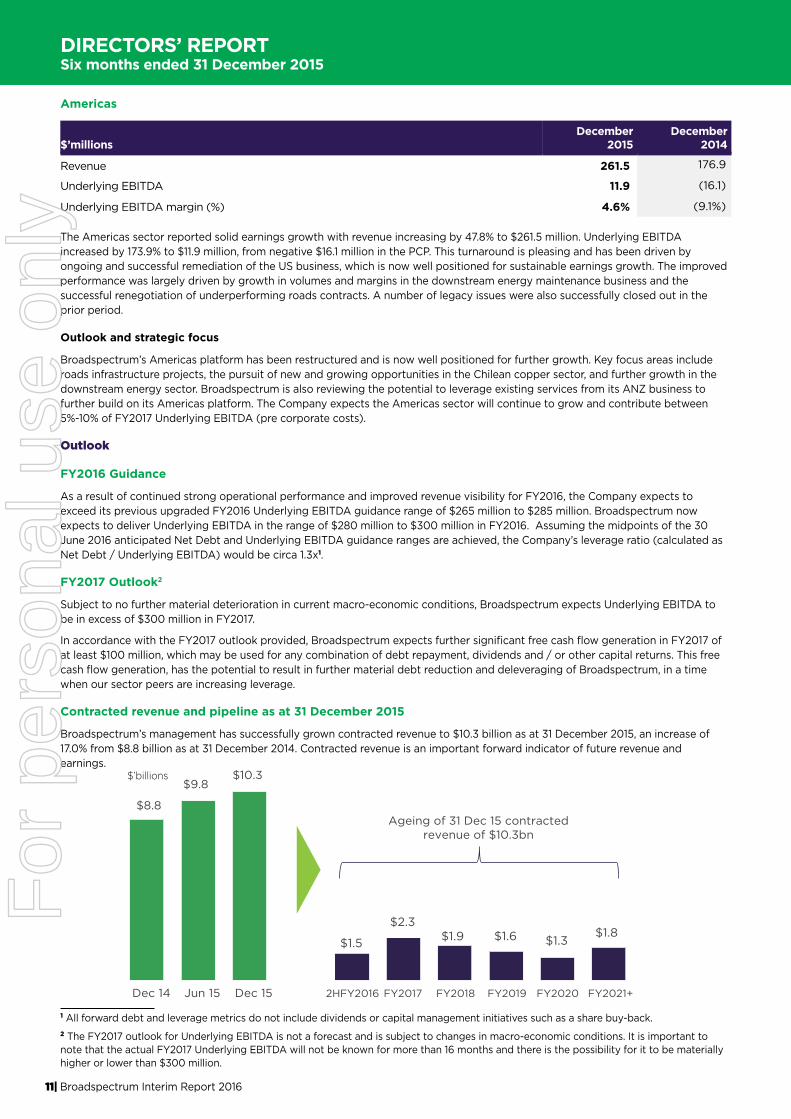
Americas
$’millionsDecember
2015December
2014
Revenue 261.5 176.9
Underlying EBITDA 11.9 (16.1)
Underlying EBITDA margin (%) 4.6% (9.1%)
The Americas sector reported solid earnings growth with revenue increasing by 47.8% to $261.5 million. Underlying EBITDA increased by 173.9% to $11.9 million, from negative $16.1 million in the PCP. This turnaround is pleasing and has been driven by ongoing and successful remediation of the US business, which is now well positioned for sustainable earnings growth. The improved performance was largely driven by growth in volumes and margins in the downstream energy maintenance business and the successful renegotiation of underperforming roads contracts. A number of legacy issues were also successfully closed out in the prior period.
Outlook and strategic focus
Broadspectrum’s Americas platform has been restructured and is now well positioned for further growth. Key focus areas include roads infrastructure projects, the pursuit of new and growing opportunities in the Chilean copper sector, and further growth in the downstream energy sector. Broadspectrum is also reviewing the potential to leverage existing services from its ANZ business to further build on its Americas platform. The Company expects the Americas sector will continue to grow and contribute between 5%-10% of FY2017 Underlying EBITDA (pre corporate costs).
Outlook
FY2016 Guidance
As a result of continued strong operational performance and improved revenue visibility for FY2016, the Company expects to exceed its previous upgraded FY2016 Underlying EBITDA guidance range of $265 million to $285 million. Broadspectrum now expects to deliver Underlying EBITDA in the range of $280 million to $300 million in FY2016. Assuming the midpoints of the 30 June 2016 anticipated Net Debt and Underlying EBITDA guidance ranges are achieved, the Company’s leverage ratio (calculated as Net Debt / Underlying EBITDA) would be circa 1.3x1.
FY2017 Outlook2
Subject to no further material deterioration in current macro-economic conditions, Broadspectrum expects Underlying EBITDA to be in excess of $300 million in FY2017.
In accordance with the FY2017 outlook provided, Broadspectrum expects further significant free cash flow generation in FY2017 of at least $100 million, which may be used for any combination of debt repayment, dividends and / or other capital returns. This free cash flow generation, has the potential to result in further material debt reduction and deleveraging of Broadspectrum, in a time when our sector peers are increasing leverage.
Contracted revenue and pipeline as at 31 December 2015
Broadspectrum’s management has successfully grown contracted revenue to $10.3 billion as at 31 December 2015, an increase of 17.0% from $8.8 billion as at 31 December 2014. Contracted revenue is an important forward indicator of future revenue and earnings.
Ageing of 31 Dec 15 contracted revenue of $10.3bn
$8.8
$9.8$10.3
$1.5
$2.3$1.9 $1.6 $1.3
$1.8
Dec 14 Jun 15 Dec 15 2HFY2016 FY2017 FY2018 FY2019 FY2020 FY2021+
$’billions
1 All forward debt and leverage metrics do not include dividends or capital management initiatives such as a share buy-back.2 The FY2017 outlook for Underlying EBITDA is not a forecast and is subject to changes in macro-economic conditions. It is important to note that the actual FY2017 Underlying EBITDA will not be known for more than 16 months and there is the possibility for it to be materially higher or lower than $300 million.
For
per
sona
l use
onl
y
12| Broadspectrum Interim Report 2016
DIRECTORS’ REPORTSix months ended 31 December 2015
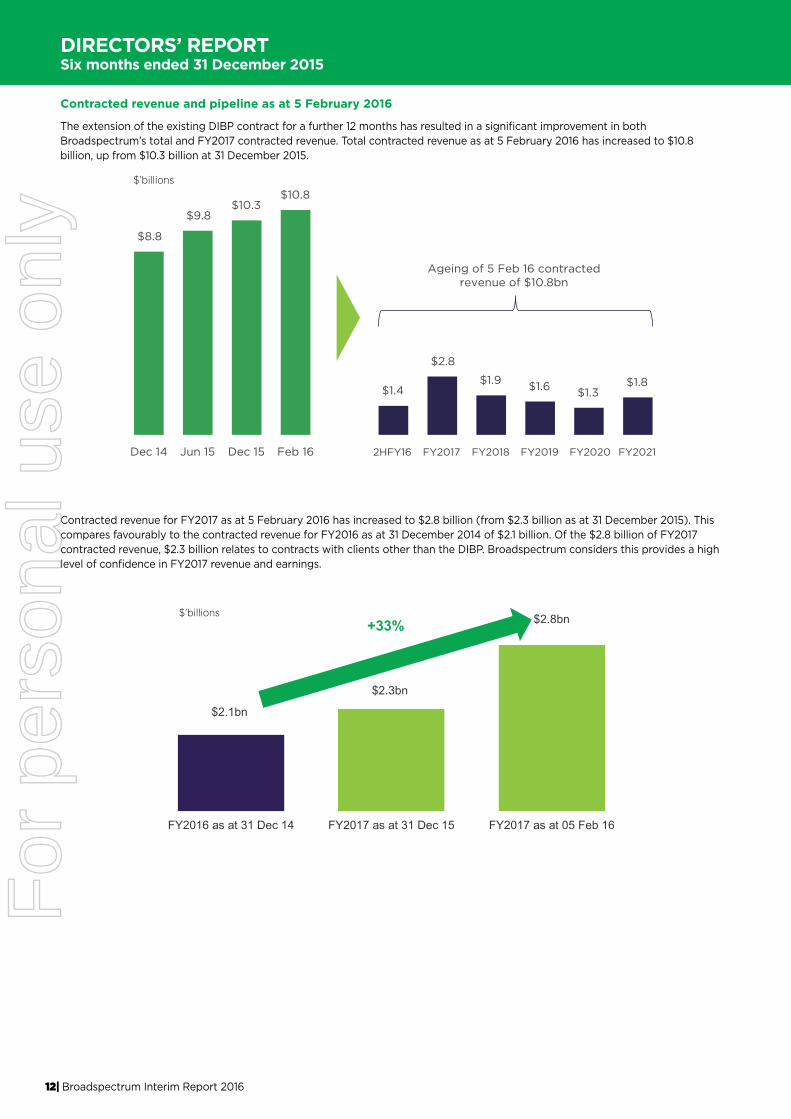
Contracted revenue and pipeline as at 5 February 2016
The extension of the existing DIBP contract for a further 12 months has resulted in a significant improvement in both Broadspectrum’s total and FY2017 contracted revenue. Total contracted revenue as at 5 February 2016 has increased to $10.8 billion, up from $10.3 billion at 31 December 2015.
Contracted revenue for FY2017 as at 5 February 2016 has increased to $2.8 billion (from $2.3 billion as at 31 December 2015). This compares favourably to the contracted revenue for FY2016 as at 31 December 2014 of $2.1 billion. Of the $2.8 billion of FY2017 contracted revenue, $2.3 billion relates to contracts with clients other than the DIBP. Broadspectrum considers this provides a high level of confidence in FY2017 revenue and earnings.
$8.8
$9.8 $10.3
$10.8
$1.4
$2.8
$1.9 $1.6 $1.3 $1.8
Dec 14 Jun 15 Dec 15 Feb 16 2HFY16 FY2017 FY2018 FY2019 FY2020 FY2021
Ageing of 5 Feb 16 contracted revenue of $10.8bn
$2.1bn
$2.3bn
$2.8bn
FY2016 as at 31 Dec 14 FY2017 as at 31 Dec 15 FY2017 as at 05 Feb 16
+33%
$’billions
$’billions
For
per
sona
l use
onl
y
13| Broadspectrum Interim Report 2016
DIRECTORS’ REPORTSix months ended 31 December 2015
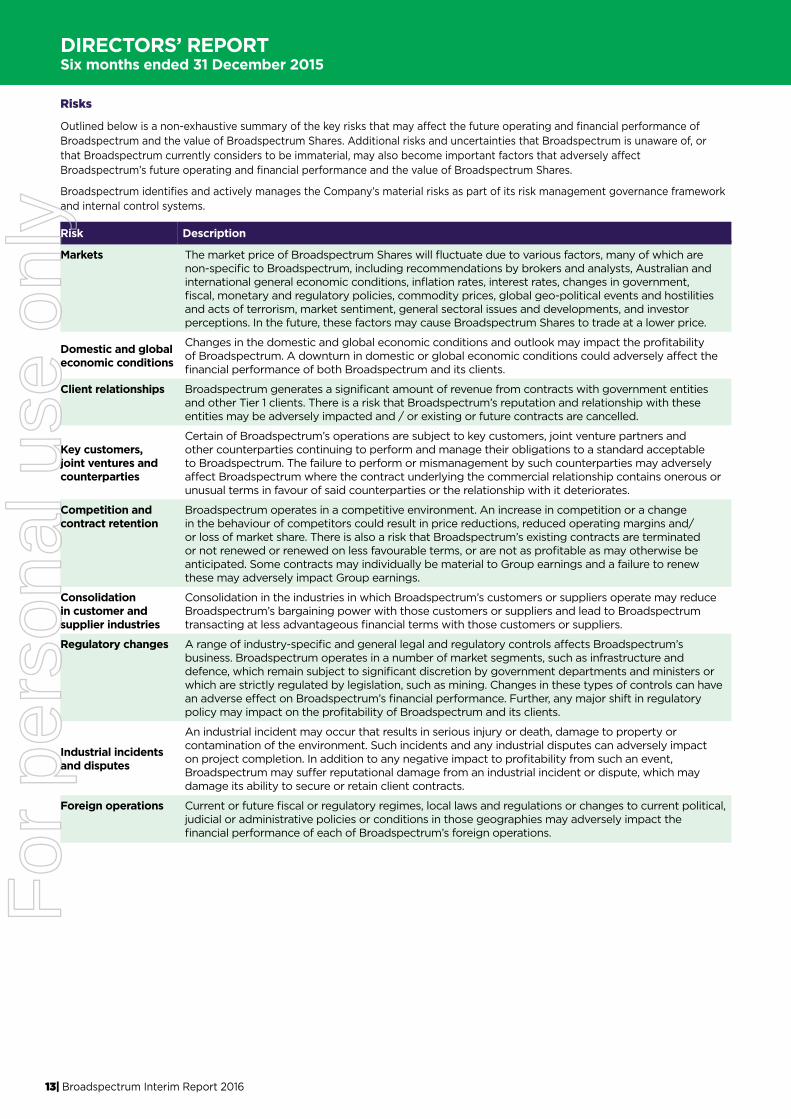
Risks
Outlined below is a non-exhaustive summary of the key risks that may affect the future operating and financial performance of Broadspectrum and the value of Broadspectrum Shares. Additional risks and uncertainties that Broadspectrum is unaware of, or that Broadspectrum currently considers to be immaterial, may also become important factors that adversely affect Broadspectrum’s future operating and financial performance and the value of Broadspectrum Shares.
Broadspectrum identifies and actively manages the Company’s material risks as part of its risk management governance framework and internal control systems.
Risk Description
Markets The market price of Broadspectrum Shares will fluctuate due to various factors, many of which are non-specific to Broadspectrum, including recommendations by brokers and analysts, Australian and international general economic conditions, inflation rates, interest rates, changes in government, fiscal, monetary and regulatory policies, commodity prices, global geo-political events and hostilities and acts of terrorism, market sentiment, general sectoral issues and developments, and investor perceptions. In the future, these factors may cause Broadspectrum Shares to trade at a lower price.
Domestic and global economic conditions
Changes in the domestic and global economic conditions and outlook may impact the profitability of Broadspectrum. A downturn in domestic or global economic conditions could adversely affect the financial performance of both Broadspectrum and its clients.
Client relationships Broadspectrum generates a significant amount of revenue from contracts with government entities and other Tier 1 clients. There is a risk that Broadspectrum’s reputation and relationship with these entities may be adversely impacted and / or existing or future contracts are cancelled.
Key customers, joint ventures and counterparties
Certain of Broadspectrum’s operations are subject to key customers, joint venture partners and other counterparties continuing to perform and manage their obligations to a standard acceptable to Broadspectrum. The failure to perform or mismanagement by such counterparties may adversely affect Broadspectrum where the contract underlying the commercial relationship contains onerous or unusual terms in favour of said counterparties or the relationship with it deteriorates.
Competition and contract retention
Broadspectrum operates in a competitive environment. An increase in competition or a change in the behaviour of competitors could result in price reductions, reduced operating margins and/or loss of market share. There is also a risk that Broadspectrum’s existing contracts are terminated or not renewed or renewed on less favourable terms, or are not as profitable as may otherwise be anticipated. Some contracts may individually be material to Group earnings and a failure to renew these may adversely impact Group earnings.
Consolidation in customer and supplier industries
Consolidation in the industries in which Broadspectrum’s customers or suppliers operate may reduce Broadspectrum’s bargaining power with those customers or suppliers and lead to Broadspectrum transacting at less advantageous financial terms with those customers or suppliers.
Regulatory changes A range of industry-specific and general legal and regulatory controls affects Broadspectrum’s business. Broadspectrum operates in a number of market segments, such as infrastructure and defence, which remain subject to significant discretion by government departments and ministers or which are strictly regulated by legislation, such as mining. Changes in these types of controls can have an adverse effect on Broadspectrum’s financial performance. Further, any major shift in regulatory policy may impact on the profitability of Broadspectrum and its clients.
Industrial incidents and disputes
An industrial incident may occur that results in serious injury or death, damage to property or contamination of the environment. Such incidents and any industrial disputes can adversely impact on project completion. In addition to any negative impact to profitability from such an event, Broadspectrum may suffer reputational damage from an industrial incident or dispute, which may damage its ability to secure or retain client contracts.
Foreign operations Current or future fiscal or regulatory regimes, local laws and regulations or changes to current political, judicial or administrative policies or conditions in those geographies may adversely impact the financial performance of each of Broadspectrum’s foreign operations.
For
per
sona
l use
onl
y
14| Broadspectrum Interim Report 2016
DIRECTORS’ REPORTSix months ended 31 December 2015
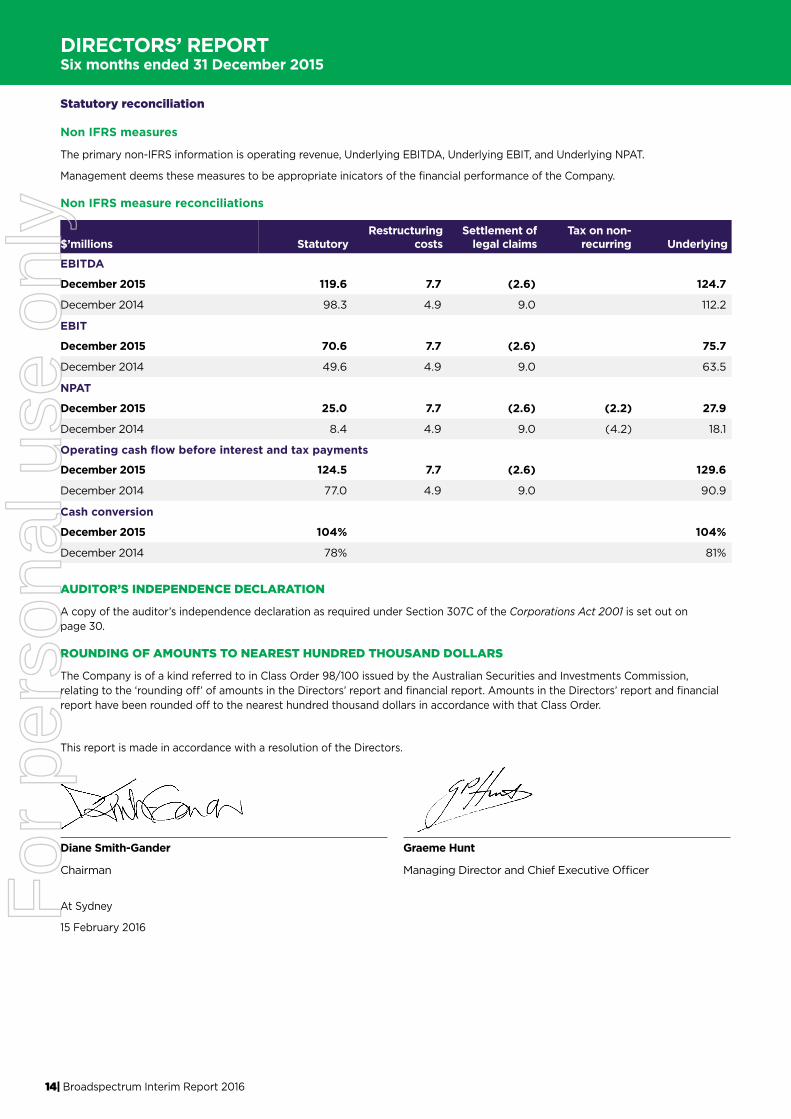
Statutory reconciliation
Non IFRS measures
The primary non-IFRS information is operating revenue, Underlying EBITDA, Underlying EBIT, and Underlying NPAT.
Management deems these measures to be appropriate inicators of the financial performance of the Company.
Non IFRS measure reconciliations
$’millions StatutoryRestructuring
costs Settlement of
legal claimsTax on non-
recurring Underlying
EBITDA
December 2015 119.6 7.7 (2.6) 124.7
December 2014 98.3 4.9 9.0 112.2
EBIT
December 2015 70.6 7.7 (2.6) 75.7
December 2014 49.6 4.9 9.0 63.5
NPAT
December 2015 25.0 7.7 (2.6) (2.2) 27.9
December 2014 8.4 4.9 9.0 (4.2) 18.1
Operating cash flow before interest and tax payments
December 2015 124.5 7.7 (2.6) 129.6
December 2014 77.0 4.9 9.0 90.9
Cash conversion
December 2015 104% 104%
December 2014 78% 81%
AUDITOR’S INDEPENDENCE DECLARATION
A copy of the auditor’s independence declaration as required under Section 307C of the Corporations Act 2001 is set out on page 30.
ROUNDING OF AMOUNTS TO NEAREST HUNDRED THOUSAND DOLLARS
The Company is of a kind referred to in Class Order 98/100 issued by the Australian Securities and Investments Commission, relating to the ‘rounding off’ of amounts in the Directors’ report and financial report. Amounts in the Directors’ report and financial report have been rounded off to the nearest hundred thousand dollars in accordance with that Class Order.
This report is made in accordance with a resolution of the Directors.
Diane Smith-Gander Graeme Hunt
Chairman Managing Director and Chief Executive Officer
At Sydney
15 February 2016
For
per
sona
l use
onl
y
CONTENTS PAGEFinancial statements
Consolidated statement of profit or loss 16
Consolidated statement of comprehensive income 17
Consolidated statement of financial position 18
Consolidated statement of cash flows 19
Consolidated statement of changes in equity 20
Notes to the consolidated financial statements 21
Directors’ declaration 29
This interim financial report does not include all the notes of the type normally included in an annual financial report. Accordingly, this report is to be read in conjunction with the annual report for the year ended 30 June 2015 and any public announcements made by Broadspectrum Limited during the interim reporting period in accordance with the continuous disclosure requirements of the Corporations Act 2001.
All comparisons are to the previous corresponding period of H1 FY2015 – the six months ended 31 December 2014, unless otherwise indicated.
Press releases, financial reports and other information are available on our website at www.broadspectrum.com.
For
per
sona
l use
onl
y
16| Broadspectrum Interim Report 2016
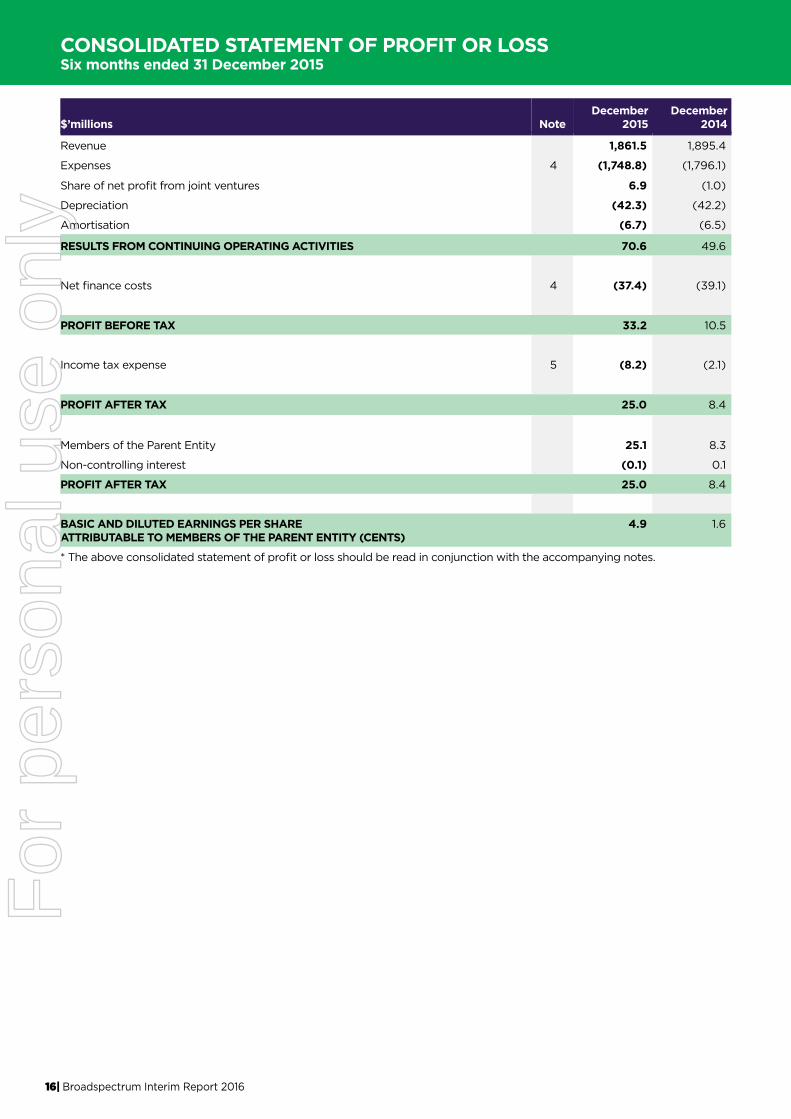
CONSOLIDATED STATEMENT OF PROFIT OR LOSSSix months ended 31 December 2015
$’millions NoteDecember
2015December
2014
Revenue 1,861.5 1,895.4
Expenses 4 (1,748.8) (1,796.1)
Share of net profit from joint ventures 6.9 (1.0)
Depreciation (42.3) (42.2)
Amortisation (6.7) (6.5)
RESULTS FROM CONTINUING OPERATING ACTIVITIES 70.6 49.6
Net finance costs 4 (37.4) (39.1)
PROFIT BEFORE TAX 33.2 10.5
Income tax expense 5 (8.2) (2.1)
PROFIT AFTER TAX 25.0 8.4
Members of the Parent Entity 25.1 8.3
Non-controlling interest (0.1) 0.1
PROFIT AFTER TAX 25.0 8.4
BASIC AND DILUTED EARNINGS PER SHAREATTRIBUTABLE TO MEMBERS OF THE PARENT ENTITY (CENTS)
4.9 1.6
* The above consolidated statement of profit or loss should be read in conjunction with the accompanying notes.
For
per
sona
l use
onl
y
17| Broadspectrum Interim Report 2016
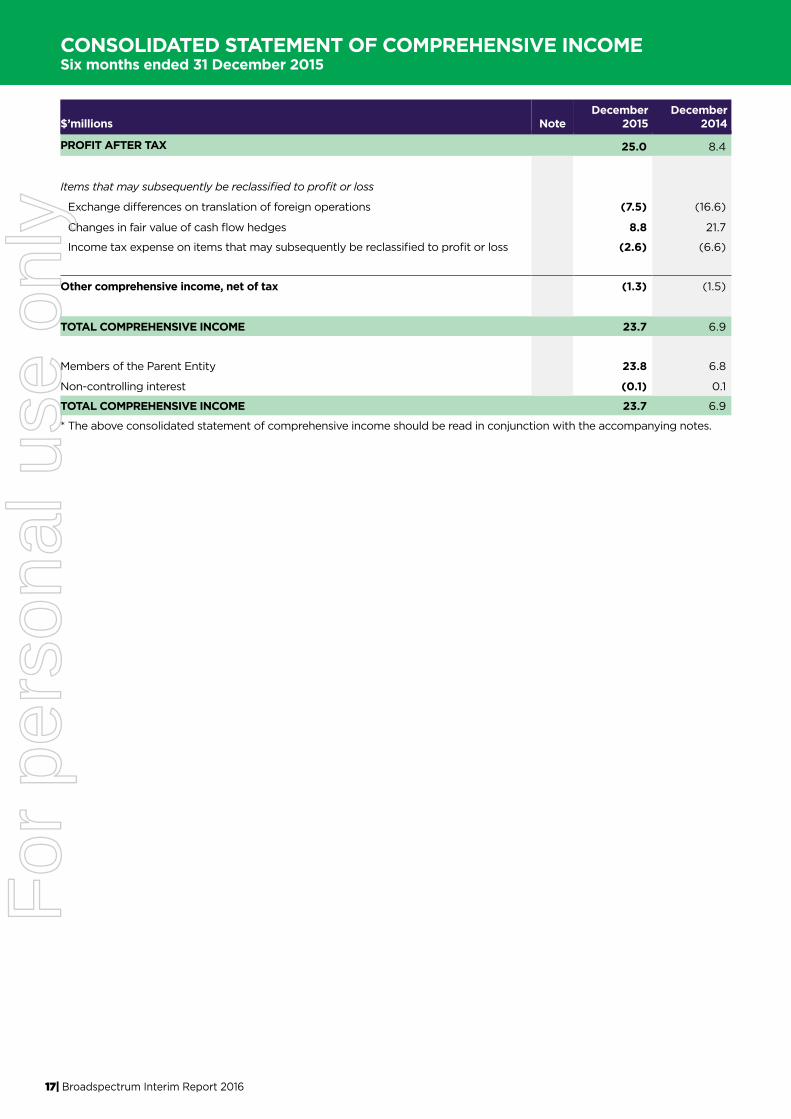
CONSOLIDATED STATEMENT OF COMPREHENSIVE INCOMESix months ended 31 December 2015
$’millions NoteDecember
2015December
2014
PROFIT AFTER TAX 25.0 8.4
Items that may subsequently be reclassified to profit or loss
Exchange differences on translation of foreign operations (7.5) (16.6)
Changes in fair value of cash flow hedges 8.8 21.7
Income tax expense on items that may subsequently be reclassified to profit or loss (2.6) (6.6)
Other comprehensive income, net of tax (1.3) (1.5)
TOTAL COMPREHENSIVE INCOME 23.7 6.9
Members of the Parent Entity 23.8 6.8
Non-controlling interest (0.1) 0.1
TOTAL COMPREHENSIVE INCOME 23.7 6.9
* The above consolidated statement of comprehensive income should be read in conjunction with the accompanying notes.
For
per
sona
l use
onl
y
18| Broadspectrum Interim Report 2016
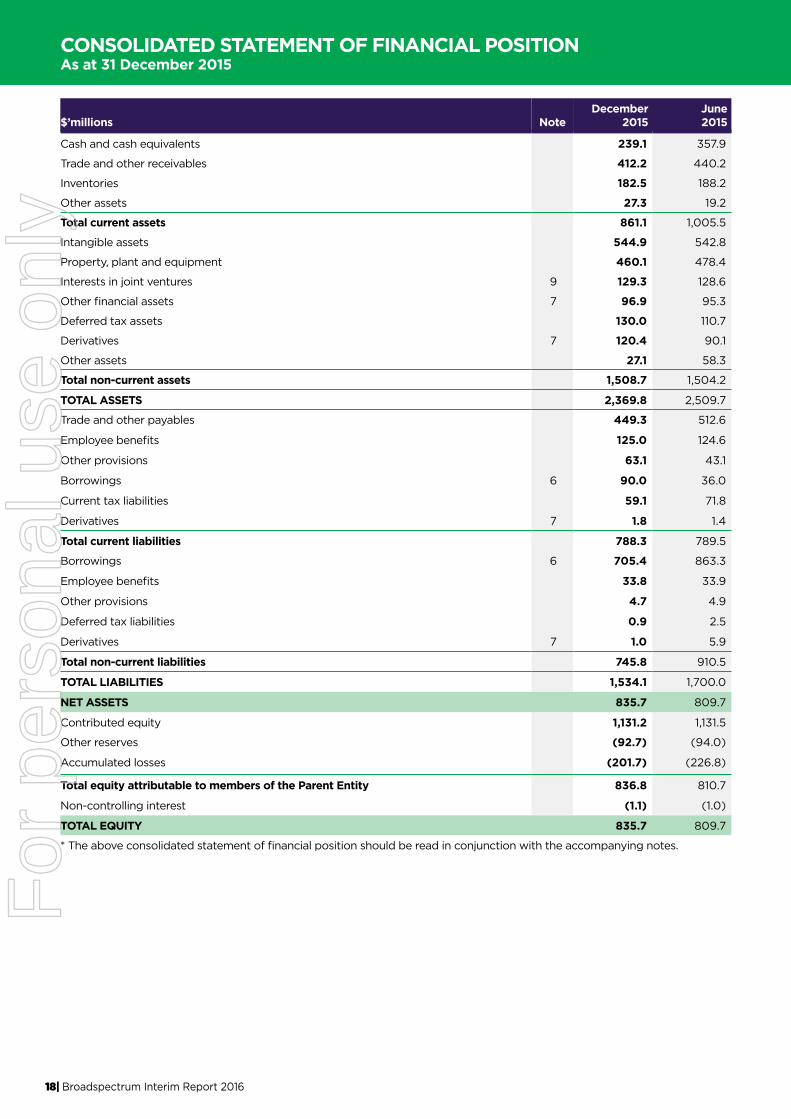
CONSOLIDATED STATEMENT OF FINANCIAL POSITION As at 31 December 2015
$’millions NoteDecember
2015June2015
Cash and cash equivalents 239.1 357.9
Trade and other receivables 412.2 440.2
Inventories 182.5 188.2
Other assets 27.3 19.2
Total current assets 861.1 1,005.5
Intangible assets 544.9 542.8
Property, plant and equipment 460.1 478.4
Interests in joint ventures 9 129.3 128.6
Other financial assets 7 96.9 95.3
Deferred tax assets 130.0 110.7
Derivatives 7 120.4 90.1
Other assets 27.1 58.3
Total non-current assets 1,508.7 1,504.2
TOTAL ASSETS 2,369.8 2,509.7
Trade and other payables 449.3 512.6
Employee benefits 125.0 124.6
Other provisions 63.1 43.1
Borrowings 6 90.0 36.0
Current tax liabilities 59.1 71.8
Derivatives 7 1.8 1.4
Total current liabilities 788.3 789.5
Borrowings 6 705.4 863.3
Employee benefits 33.8 33.9
Other provisions 4.7 4.9
Deferred tax liabilities 0.9 2.5
Derivatives 7 1.0 5.9
Total non-current liabilities 745.8 910.5
TOTAL LIABILITIES 1,534.1 1,700.0
NET ASSETS 835.7 809.7
Contributed equity 1,131.2 1,131.5
Other reserves (92.7) (94.0)
Accumulated losses (201.7) (226.8)
Total equity attributable to members of the Parent Entity 836.8 810.7
Non-controlling interest (1.1) (1.0)
TOTAL EQUITY 835.7 809.7
* The above consolidated statement of financial position should be read in conjunction with the accompanying notes.
For
per
sona
l use
onl
y
19| Broadspectrum Interim Report 2016
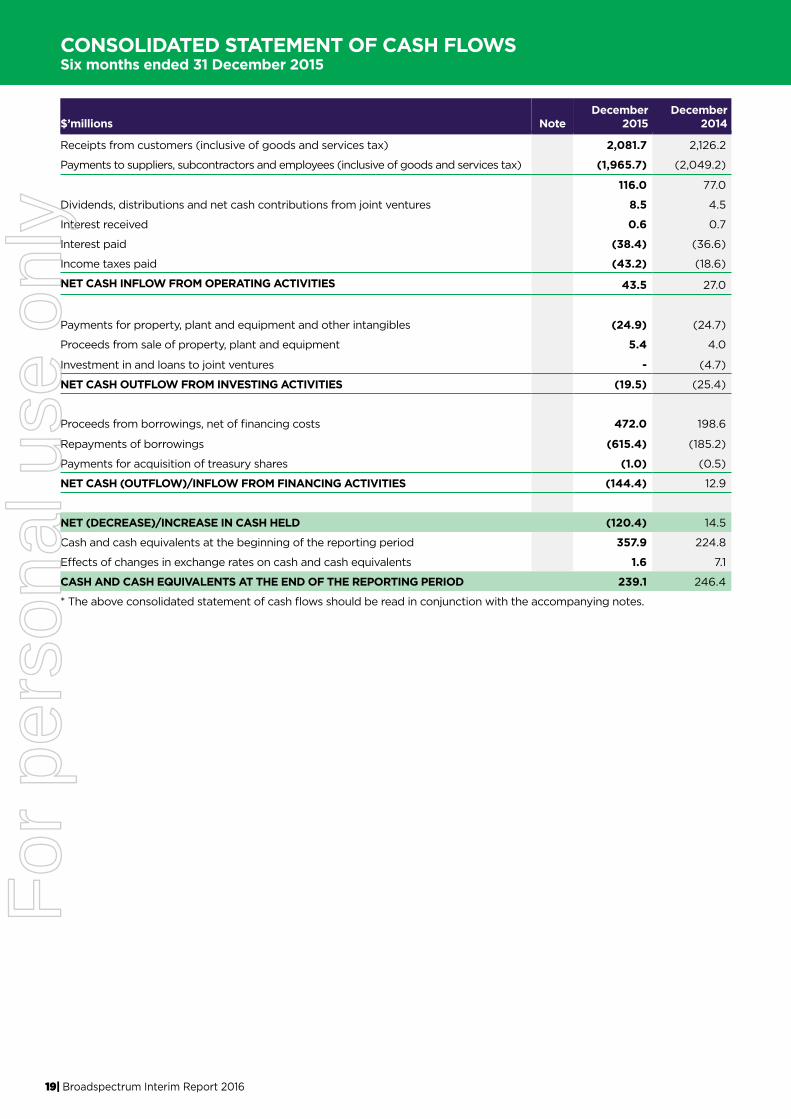
CONSOLIDATED STATEMENT OF CASH FLOWS Six months ended 31 December 2015
$’millions NoteDecember
2015December
2014
Receipts from customers (inclusive of goods and services tax) 2,081.7 2,126.2
Payments to suppliers, subcontractors and employees (inclusive of goods and services tax) (1,965.7) (2,049.2)
116.0 77.0
Dividends, distributions and net cash contributions from joint ventures 8.5 4.5
Interest received 0.6 0.7
Interest paid (38.4) (36.6)
Income taxes paid (43.2) (18.6)
NET CASH INFLOW FROM OPERATING ACTIVITIES 43.5 27.0
Payments for property, plant and equipment and other intangibles (24.9) (24.7)
Proceeds from sale of property, plant and equipment 5.4 4.0
Investment in and loans to joint ventures - (4.7)
NET CASH OUTFLOW FROM INVESTING ACTIVITIES (19.5) (25.4)
Proceeds from borrowings, net of financing costs 472.0 198.6
Repayments of borrowings (615.4) (185.2)
Payments for acquisition of treasury shares (1.0) (0.5)
NET CASH (OUTFLOW)/INFLOW FROM FINANCING ACTIVITIES (144.4) 12.9
NET (DECREASE)/INCREASE IN CASH HELD (120.4) 14.5
Cash and cash equivalents at the beginning of the reporting period 357.9 224.8
Effects of changes in exchange rates on cash and cash equivalents 1.6 7.1
CASH AND CASH EQUIVALENTS AT THE END OF THE REPORTING PERIOD 239.1 246.4
* The above consolidated statement of cash flows should be read in conjunction with the accompanying notes.
For
per
sona
l use
onl
y
20| Broadspectrum Interim Report 2016
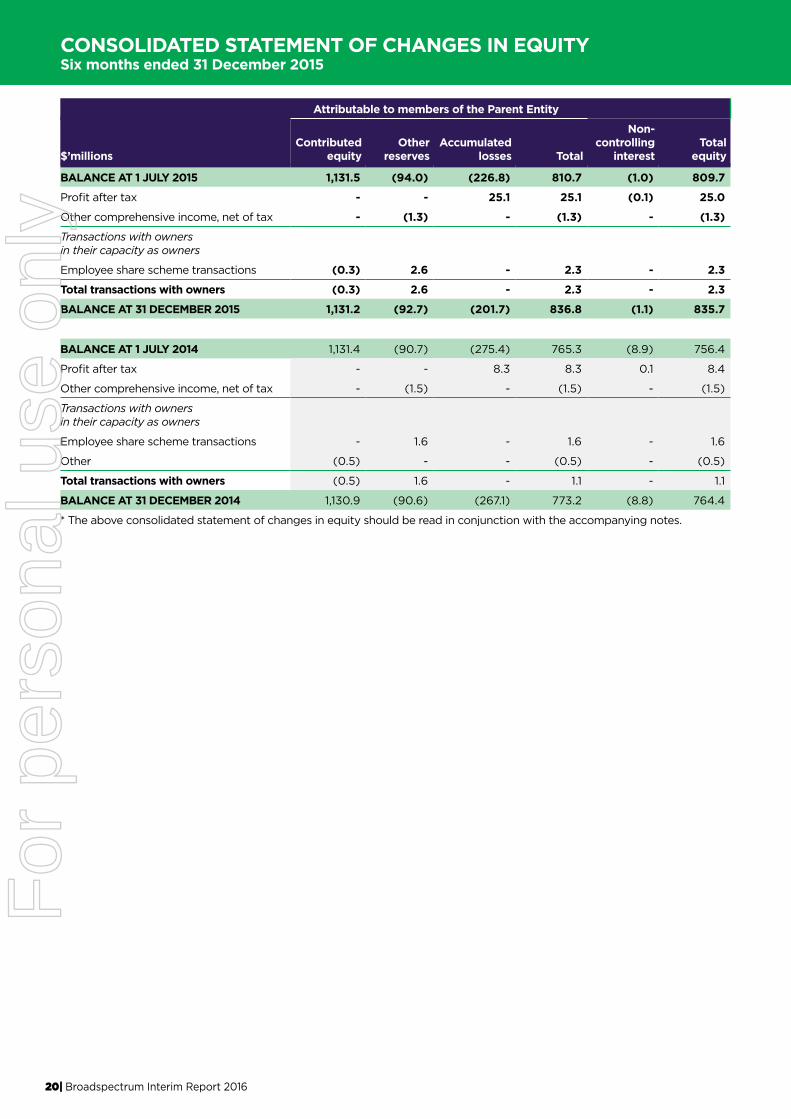
CONSOLIDATED STATEMENT OF CHANGES IN EQUITY Six months ended 31 December 2015
Attributable to members of the Parent Entity
$’millionsContributed
equityOther
reservesAccumulated
losses Total
Non- controlling
interestTotal
equity
BALANCE AT 1 JULY 2015 1,131.5 (94.0) (226.8) 810.7 (1.0) 809.7
Profit after tax - - 25.1 25.1 (0.1) 25.0
Other comprehensive income, net of tax - (1.3) - (1.3) - (1.3)
Transactions with ownersin their capacity as owners
Employee share scheme transactions (0.3) 2.6 - 2.3 - 2.3
Total transactions with owners (0.3) 2.6 - 2.3 - 2.3
BALANCE AT 31 DECEMBER 2015 1,131.2 (92.7) (201.7) 836.8 (1.1) 835.7
BALANCE AT 1 JULY 2014 1,131.4 (90.7) (275.4) 765.3 (8.9) 756.4
Profit after tax - - 8.3 8.3 0.1 8.4
Other comprehensive income, net of tax - (1.5) - (1.5) - (1.5)
Transactions with ownersin their capacity as owners
Employee share scheme transactions - 1.6 - 1.6 - 1.6
Other (0.5) - - (0.5) - (0.5)
Total transactions with owners (0.5) 1.6 - 1.1 - 1.1
BALANCE AT 31 DECEMBER 2014 1,130.9 (90.6) (267.1) 773.2 (8.8) 764.4
* The above consolidated statement of changes in equity should be read in conjunction with the accompanying notes.
For
per
sona
l use
onl
y
NOTES TO THE CONSOLIDATED FINANCIAL STATEMENTSSix months ended 31 December 2015
21| Broadspectrum Interim Report 2016
1. REPORTING ENTITY
At the 2015 Annual General Meeting of Transfield Services Limited (the Company) held on Wednesday, 28 October 2015, the resolution to change the name of the Company from Transfield Services Limited to Broadspectrum Limited was passed.
As a result of the name change, the ASX ticker code has changed from “TSE” to “BRS” from Wednesday, 4 November 2015.
The Company is a company domiciled in Australia. These consolidated interim financial statements (interim financial statements) as at and for the six months ended 31 December 2015 comprise the Company and its subsidiaries (the Group).
The Group delivers a broad range of services that are essential to clients across multiple sectors.
The Group approach integrates a focus on optimising performance, integrity and output of its clients’ businesses and assets to deliver real business outcomes safely and responsibly, with a diverse, collaborative and caring workforce.
The Group operates in the Defence, Property, Social, Infrastructure, Resources and Industrial sectors, and provides Logistics and Facilities Management, Care and Welfare, Consulting, Construction, Operations and Maintenance, Well Servicing and Business Support services.
2. BASIS OF PREPARATION
These interim financial statements are general purpose financial statements prepared in accordance with AASB 134 Interim Financial Reporting and the Corporations Act 2001, and with IAS 34 Interim Financial Reporting.
Selected explanatory notes are included to explain events and transactions that are significant to an understanding of the changes in financial position and performance of the Group since the last annual consolidated financial statements as at and for the year ended 30 June 2015.
The consolidated interim financial statements do not include all of the information required for full annual financial statements, and should be read in conjunction with the consolidated annual financial statements of the Group as at and for the year ended 30 June 2015.
The accounting policies adopted are consistent with those of the previous financial year and corresponding interim reporting period.
3. OPERATING SEGMENTS
Operating segments are reported in a manner consistent with the internal reporting provided to the chief operating decision maker. The Chief Operating Decision Maker (CODM), who is responsible for allocating resources and assessing performance of the operating segments, has been identified as the Managing Director and Chief Executive Officer.
The Group’s primary segments, which are based on a geographic region and market sector now comprise:
• Australia and New Zealand Infrastructure (Infrastructure);
• Australia and New Zealand Defence, Social and Property (Defence, Social & Property);
• Australia and New Zealand Resources and Industrial (Resources & Industrial);
• Americas; and
• Corporate, which includes the Group’s investment in RATCH - Australia Corporation Limited and inter-segment eliminations.
The Group’s Corporate segment includes transactions relating to the Group’s governance, finance, legal, risk management and company secretarial functions. Expenses related to back office functions that are allocated to the Group’s operations such as information technology or payroll are included in the Group’s operating segments.
Each segment derives revenue from its principal activities across the following service lines:
• Logistics & Facilities Management (including Care and Welfare);
• Construction;
• Consulting;
• Operations & Maintenance; and
• Well Servicing.
The primary measure of performance is segment Earnings Before Interest, Tax, Depreciation and Amortisation (EBITDA). Other measures regularly reviewed by the CODM include:
• Segment revenue;
• EBITDA excluding material non-recurring items of income and expense (Underlying EBITDA); and
• Earnings Before Interest and Tax (EBIT).
For
per
sona
l use
onl
y
NOTES TO THE CONSOLIDATED FINANCIAL STATEMENTSSix months ended 31 December 2015
22| Broadspectrum Interim Report 2016
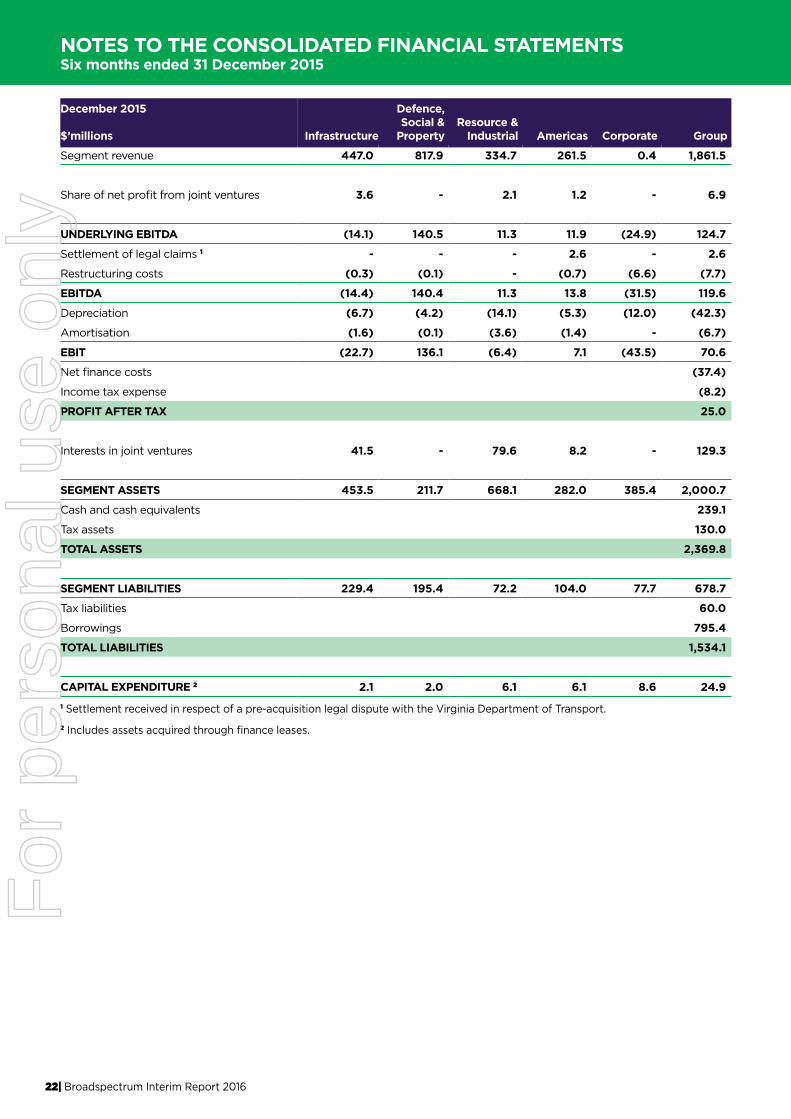
December 2015
$’millions Infrastructure
Defence, Social &
PropertyResource &
Industrial Americas Corporate Group
Segment revenue 447.0 817.9 334.7 261.5 0.4 1,861.5
Share of net profit from joint ventures 3.6 - 2.1 1.2 - 6.9
UNDERLYING EBITDA (14.1) 140.5 11.3 11.9 (24.9) 124.7
Settlement of legal claims 1 - - - 2.6 - 2.6
Restructuring costs (0.3) (0.1) - (0.7) (6.6) (7.7)
EBITDA (14.4) 140.4 11.3 13.8 (31.5) 119.6
Depreciation (6.7) (4.2) (14.1) (5.3) (12.0) (42.3)
Amortisation (1.6) (0.1) (3.6) (1.4) - (6.7)
EBIT (22.7) 136.1 (6.4) 7.1 (43.5) 70.6
Net finance costs (37.4)
Income tax expense (8.2)
PROFIT AFTER TAX 25.0
Interests in joint ventures 41.5 - 79.6 8.2 - 129.3
SEGMENT ASSETS 453.5 211.7 668.1 282.0 385.4 2,000.7
Cash and cash equivalents 239.1
Tax assets 130.0
TOTAL ASSETS 2,369.8
SEGMENT LIABILITIES 229.4 195.4 72.2 104.0 77.7 678.7
Tax liabilities 60.0
Borrowings 795.4
TOTAL LIABILITIES 1,534.1
CAPITAL EXPENDITURE 2 2.1 2.0 6.1 6.1 8.6 24.91 Settlement received in respect of a pre-acquisition legal dispute with the Virginia Department of Transport.
2 Includes assets acquired through finance leases.
For
per
sona
l use
onl
y
NOTES TO THE CONSOLIDATED FINANCIAL STATEMENTSSix months ended 31 December 2015
23| Broadspectrum Interim Report 2016
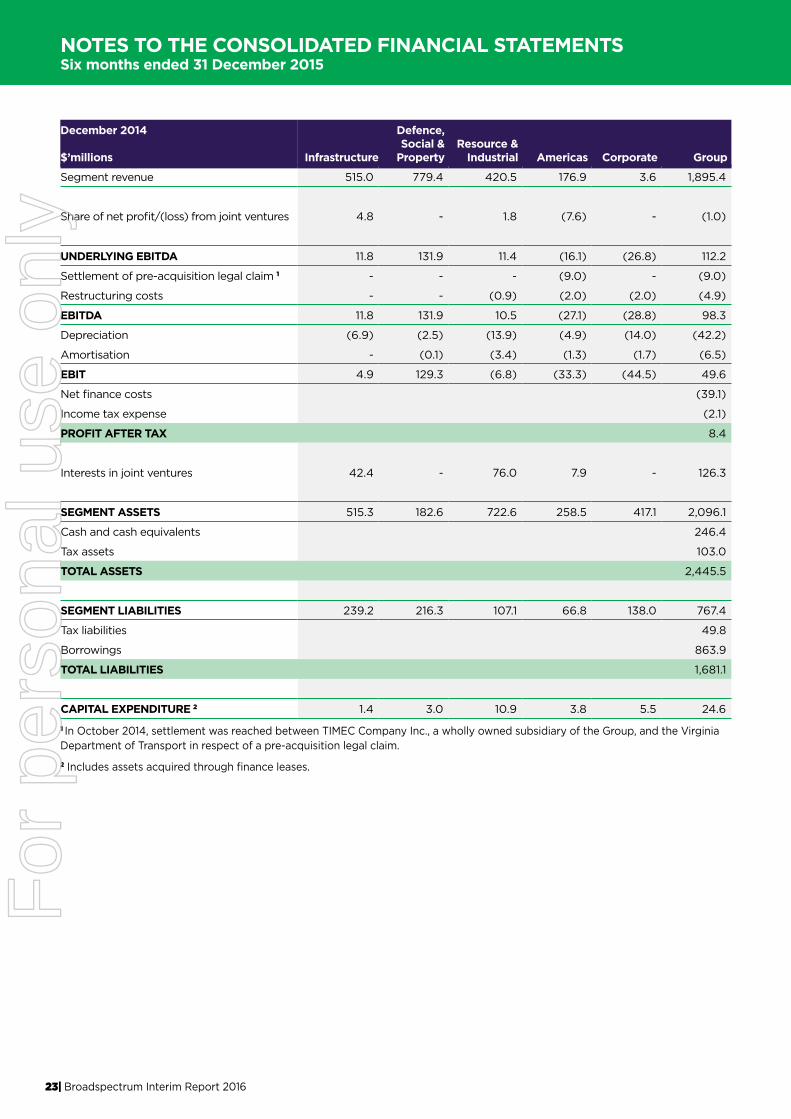
December 2014
$’millions Infrastructure
Defence, Social &
PropertyResource &
Industrial Americas Corporate Group
Segment revenue 515.0 779.4 420.5 176.9 3.6 1,895.4
Share of net profit/(loss) from joint ventures 4.8 - 1.8 (7.6) - (1.0)
UNDERLYING EBITDA 11.8 131.9 11.4 (16.1) (26.8) 112.2
Settlement of pre-acquisition legal claim 1 - - - (9.0) - (9.0)
Restructuring costs - - (0.9) (2.0) (2.0) (4.9)
EBITDA 11.8 131.9 10.5 (27.1) (28.8) 98.3
Depreciation (6.9) (2.5) (13.9) (4.9) (14.0) (42.2)
Amortisation - (0.1) (3.4) (1.3) (1.7) (6.5)
EBIT 4.9 129.3 (6.8) (33.3) (44.5) 49.6
Net finance costs (39.1)
Income tax expense (2.1)
PROFIT AFTER TAX 8.4
Interests in joint ventures 42.4 - 76.0 7.9 - 126.3
SEGMENT ASSETS 515.3 182.6 722.6 258.5 417.1 2,096.1
Cash and cash equivalents 246.4
Tax assets 103.0
TOTAL ASSETS 2,445.5
SEGMENT LIABILITIES 239.2 216.3 107.1 66.8 138.0 767.4
Tax liabilities 49.8
Borrowings 863.9
TOTAL LIABILITIES 1,681.1
CAPITAL EXPENDITURE 2 1.4 3.0 10.9 3.8 5.5 24.6
1 In October 2014, settlement was reached between TIMEC Company Inc., a wholly owned subsidiary of the Group, and the Virginia Department of Transport in respect of a pre-acquisition legal claim.
2 Includes assets acquired through finance leases.
For
per
sona
l use
onl
y
NOTES TO THE CONSOLIDATED FINANCIAL STATEMENTSSix months ended 31 December 2015
24| Broadspectrum Interim Report 2016
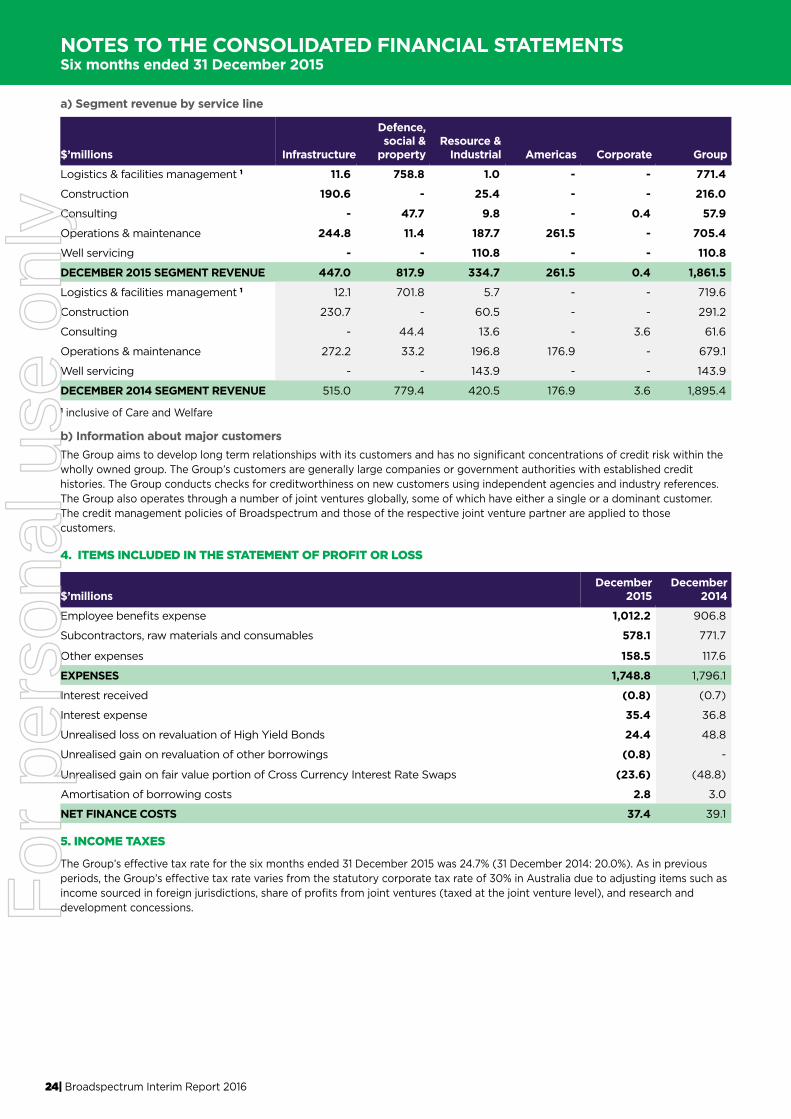
a) Segment revenue by service line
$’millions Infrastructure
Defence, social &
propertyResource &
Industrial Americas Corporate Group
Logistics & facilities management 1 11.6 758.8 1.0 - - 771.4
Construction 190.6 - 25.4 - - 216.0
Consulting - 47.7 9.8 - 0.4 57.9
Operations & maintenance 244.8 11.4 187.7 261.5 - 705.4
Well servicing - - 110.8 - - 110.8
DECEMBER 2015 SEGMENT REVENUE 447.0 817.9 334.7 261.5 0.4 1,861.5
Logistics & facilities management 1 12.1 701.8 5.7 - - 719.6
Construction 230.7 - 60.5 - - 291.2
Consulting - 44.4 13.6 - 3.6 61.6
Operations & maintenance 272.2 33.2 196.8 176.9 - 679.1
Well servicing - - 143.9 - - 143.9
DECEMBER 2014 SEGMENT REVENUE 515.0 779.4 420.5 176.9 3.6 1,895.4
1 inclusive of Care and Welfare
b) Information about major customersThe Group aims to develop long term relationships with its customers and has no significant concentrations of credit risk within the wholly owned group. The Group’s customers are generally large companies or government authorities with established credit histories. The Group conducts checks for creditworthiness on new customers using independent agencies and industry references.The Group also operates through a number of joint ventures globally, some of which have either a single or a dominant customer. The credit management policies of Broadspectrum and those of the respective joint venture partner are applied to those customers.
4. ITEMS INCLUDED IN THE STATEMENT OF PROFIT OR LOSS
$’millionsDecember
2015December
2014
Employee benefits expense 1,012.2 906.8
Subcontractors, raw materials and consumables 578.1 771.7
Other expenses 158.5 117.6
EXPENSES 1,748.8 1,796.1
Interest received (0.8) (0.7)
Interest expense 35.4 36.8
Unrealised loss on revaluation of High Yield Bonds 24.4 48.8
Unrealised gain on revaluation of other borrowings (0.8) -
Unrealised gain on fair value portion of Cross Currency Interest Rate Swaps (23.6) (48.8)
Amortisation of borrowing costs 2.8 3.0
NET FINANCE COSTS 37.4 39.1
5. INCOME TAXES
The Group’s effective tax rate for the six months ended 31 December 2015 was 24.7% (31 December 2014: 20.0%). As in previous periods, the Group’s effective tax rate varies from the statutory corporate tax rate of 30% in Australia due to adjusting items such as income sourced in foreign jurisdictions, share of profits from joint ventures (taxed at the joint venture level), and research and development concessions.F
or p
erso
nal u
se o
nly
NOTES TO THE CONSOLIDATED FINANCIAL STATEMENTSSix months ended 31 December 2015
25| Broadspectrum Interim Report 2016
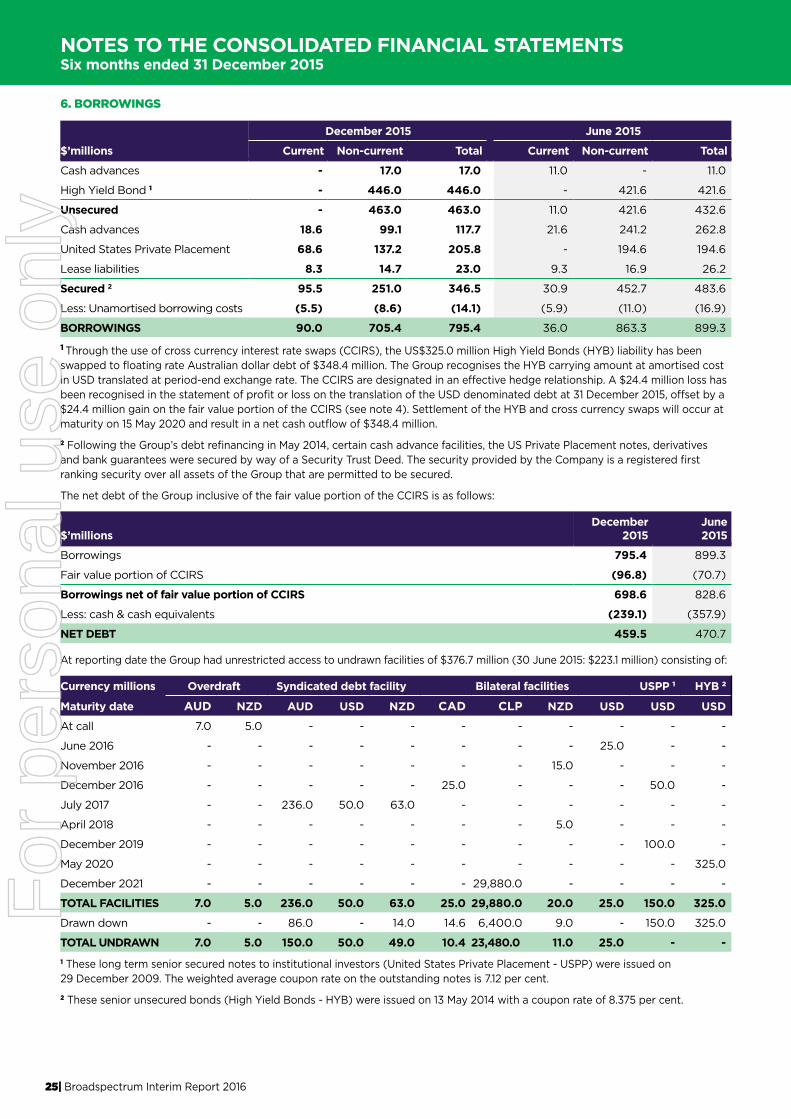
6. BORROWINGS
December 2015 June 2015
$’millions Current Non-current Total Current Non-current Total
Cash advances - 17.0 17.0 11.0 - 11.0
High Yield Bond 1 - 446.0 446.0 - 421.6 421.6
Unsecured - 463.0 463.0 11.0 421.6 432.6
Cash advances 18.6 99.1 117.7 21.6 241.2 262.8
United States Private Placement 68.6 137.2 205.8 - 194.6 194.6
Lease liabilities 8.3 14.7 23.0 9.3 16.9 26.2
Secured 2 95.5 251.0 346.5 30.9 452.7 483.6
Less: Unamortised borrowing costs (5.5) (8.6) (14.1) (5.9) (11.0) (16.9)
BORROWINGS 90.0 705.4 795.4 36.0 863.3 899.3
1 Through the use of cross currency interest rate swaps (CCIRS), the US$325.0 million High Yield Bonds (HYB) liability has been swapped to floating rate Australian dollar debt of $348.4 million. The Group recognises the HYB carrying amount at amortised cost in USD translated at period-end exchange rate. The CCIRS are designated in an effective hedge relationship. A $24.4 million loss has been recognised in the statement of profit or loss on the translation of the USD denominated debt at 31 December 2015, offset by a $24.4 million gain on the fair value portion of the CCIRS (see note 4). Settlement of the HYB and cross currency swaps will occur at maturity on 15 May 2020 and result in a net cash outflow of $348.4 million.
2 Following the Group’s debt refinancing in May 2014, certain cash advance facilities, the US Private Placement notes, derivatives and bank guarantees were secured by way of a Security Trust Deed. The security provided by the Company is a registered first ranking security over all assets of the Group that are permitted to be secured.
The net debt of the Group inclusive of the fair value portion of the CCIRS is as follows:
$’millionsDecember
2015June2015
Borrowings 795.4 899.3
Fair value portion of CCIRS (96.8) (70.7)
Borrowings net of fair value portion of CCIRS 698.6 828.6
Less: cash & cash equivalents (239.1) (357.9)
NET DEBT 459.5 470.7
At reporting date the Group had unrestricted access to undrawn facilities of $376.7 million (30 June 2015: $223.1 million) consisting of:
Currency millions Overdraft Syndicated debt facility Bilateral facilities USPP 1 HYB 2
Maturity date AUD NZD AUD USD NZD CAD CLP NZD USD USD USD
At call 7.0 5.0 - - - - - - - - -
June 2016 - - - - - - - - 25.0 - -
November 2016 - - - - - - - 15.0 - - -
December 2016 - - - - - 25.0 - - - 50.0 -
July 2017 - - 236.0 50.0 63.0 - - - - - -
April 2018 - - - - - - - 5.0 - - -
December 2019 - - - - - - - - - 100.0 -
May 2020 - - - - - - - - - - 325.0
December 2021 - - - - - - 29,880.0 - - - -
TOTAL FACILITIES 7.0 5.0 236.0 50.0 63.0 25.0 29,880.0 20.0 25.0 150.0 325.0
Drawn down - - 86.0 - 14.0 14.6 6,400.0 9.0 - 150.0 325.0
TOTAL UNDRAWN 7.0 5.0 150.0 50.0 49.0 10.4 23,480.0 11.0 25.0 - -1 These long term senior secured notes to institutional investors (United States Private Placement - USPP) were issued on 29 December 2009. The weighted average coupon rate on the outstanding notes is 7.12 per cent.
2 These senior unsecured bonds (High Yield Bonds - HYB) were issued on 13 May 2014 with a coupon rate of 8.375 per cent.
For
per
sona
l use
onl
y
NOTES TO THE CONSOLIDATED FINANCIAL STATEMENTSSix months ended 31 December 2015
26| Broadspectrum Interim Report 2016
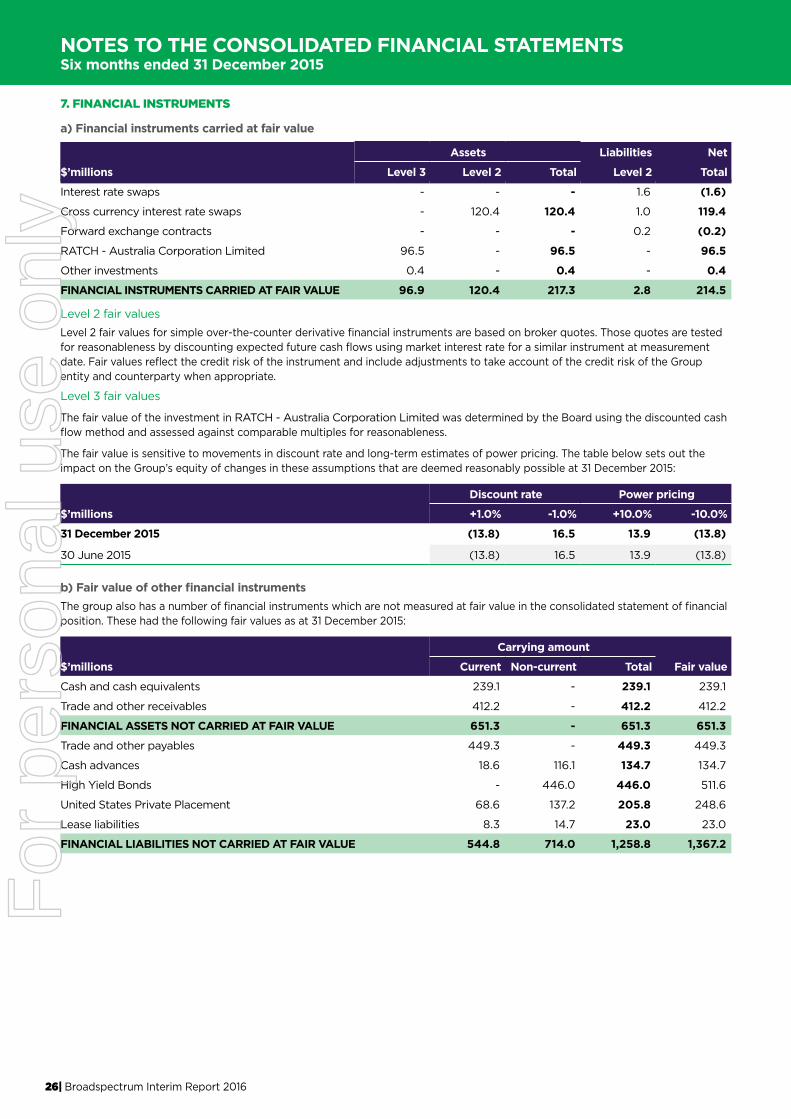
7. FINANCIAL INSTRUMENTS
a) Financial instruments carried at fair value
Assets Liabilities Net
$’millions Level 3 Level 2 Total Level 2 Total
Interest rate swaps - - - 1.6 (1.6)
Cross currency interest rate swaps - 120.4 120.4 1.0 119.4
Forward exchange contracts - - - 0.2 (0.2)
RATCH - Australia Corporation Limited 96.5 - 96.5 - 96.5
Other investments 0.4 - 0.4 - 0.4
FINANCIAL INSTRUMENTS CARRIED AT FAIR VALUE 96.9 120.4 217.3 2.8 214.5
Level 2 fair valuesLevel 2 fair values for simple over-the-counter derivative financial instruments are based on broker quotes. Those quotes are tested for reasonableness by discounting expected future cash flows using market interest rate for a similar instrument at measurement date. Fair values reflect the credit risk of the instrument and include adjustments to take account of the credit risk of the Group entity and counterparty when appropriate.
Level 3 fair values
The fair value of the investment in RATCH - Australia Corporation Limited was determined by the Board using the discounted cash flow method and assessed against comparable multiples for reasonableness.
The fair value is sensitive to movements in discount rate and long-term estimates of power pricing. The table below sets out the impact on the Group’s equity of changes in these assumptions that are deemed reasonably possible at 31 December 2015:
Discount rate Power pricing
$’millions +1.0% -1.0% +10.0% -10.0%
31 December 2015 (13.8) 16.5 13.9 (13.8)
30 June 2015 (13.8) 16.5 13.9 (13.8)
b) Fair value of other financial instrumentsThe group also has a number of financial instruments which are not measured at fair value in the consolidated statement of financial position. These had the following fair values as at 31 December 2015:
Carrying amount
$’millions Current Non-current Total Fair value
Cash and cash equivalents 239.1 - 239.1 239.1
Trade and other receivables 412.2 - 412.2 412.2
FINANCIAL ASSETS NOT CARRIED AT FAIR VALUE 651.3 - 651.3 651.3
Trade and other payables 449.3 - 449.3 449.3
Cash advances 18.6 116.1 134.7 134.7
High Yield Bonds - 446.0 446.0 511.6
United States Private Placement 68.6 137.2 205.8 248.6
Lease liabilities 8.3 14.7 23.0 23.0
FINANCIAL LIABILITIES NOT CARRIED AT FAIR VALUE 544.8 714.0 1,258.8 1,367.2
For
per
sona
l use
onl
y
NOTES TO THE CONSOLIDATED FINANCIAL STATEMENTSSix months ended 31 December 2015
27| Broadspectrum Interim Report 2016
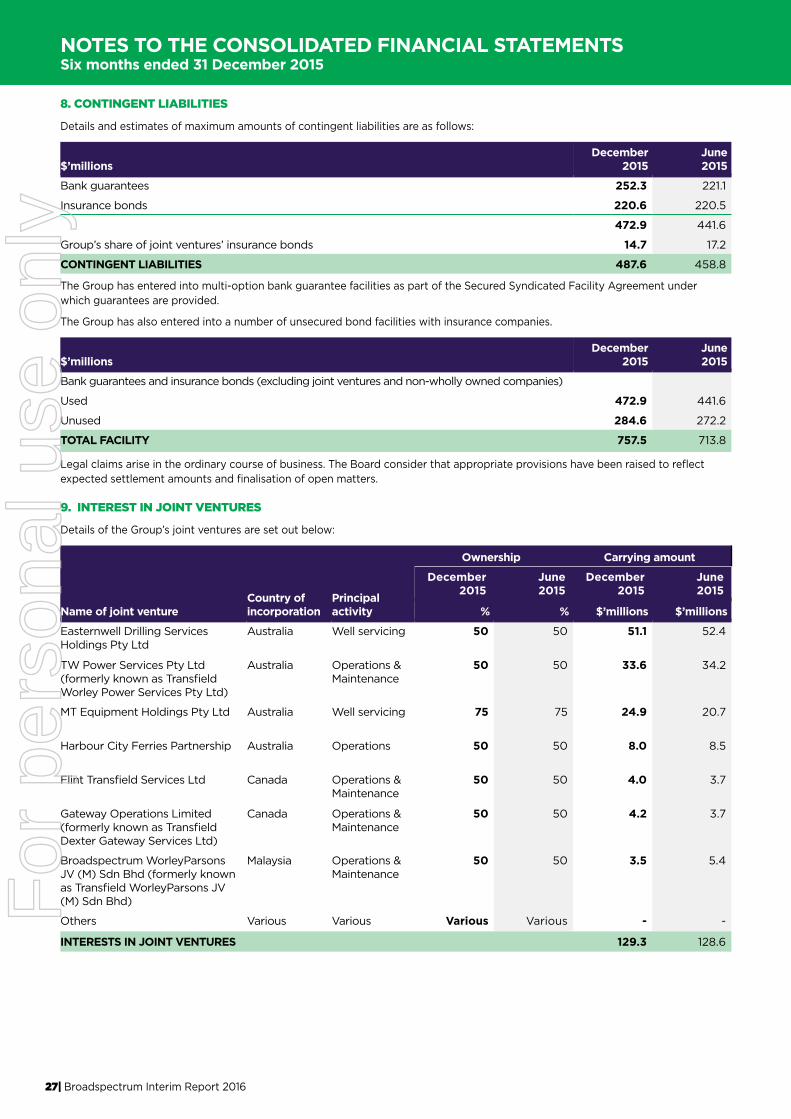
8. CONTINGENT LIABILITIES
Details and estimates of maximum amounts of contingent liabilities are as follows:
$’millionsDecember
2015June2015
Bank guarantees 252.3 221.1
Insurance bonds 220.6 220.5
472.9 441.6
Group’s share of joint ventures’ insurance bonds 14.7 17.2
CONTINGENT LIABILITIES 487.6 458.8
The Group has entered into multi-option bank guarantee facilities as part of the Secured Syndicated Facility Agreement under which guarantees are provided.
The Group has also entered into a number of unsecured bond facilities with insurance companies.
$’millionsDecember
2015June2015
Bank guarantees and insurance bonds (excluding joint ventures and non-wholly owned companies)
Used 472.9 441.6
Unused 284.6 272.2
TOTAL FACILITY 757.5 713.8
Legal claims arise in the ordinary course of business. The Board consider that appropriate provisions have been raised to reflect expected settlement amounts and finalisation of open matters.
9. INTEREST IN JOINT VENTURES
Details of the Group’s joint ventures are set out below:
Ownership Carrying amount
Name of joint ventureCountry ofincorporation
Principalactivity
December2015
June2015
December2015
June2015
% % $’millions $’millions
Easternwell Drilling Services Holdings Pty Ltd
Australia Well servicing 50 50 51.1 52.4
TW Power Services Pty Ltd (formerly known as Transfield Worley Power Services Pty Ltd)
Australia Operations & Maintenance
50 50 33.6 34.2
MT Equipment Holdings Pty Ltd Australia Well servicing 75 75 24.9 20.7
Harbour City Ferries Partnership Australia Operations 50 50 8.0 8.5
Flint Transfield Services Ltd Canada Operations & Maintenance
50 50 4.0 3.7
Gateway Operations Limited (formerly known as Transfield Dexter Gateway Services Ltd)
Canada Operations & Maintenance
50 50 4.2 3.7
Broadspectrum WorleyParsons JV (M) Sdn Bhd (formerly known as Transfield WorleyParsons JV (M) Sdn Bhd)
Malaysia Operations & Maintenance
50 50 3.5 5.4
Others Various Various Various Various - -
INTERESTS IN JOINT VENTURES 129.3 128.6
For
per
sona
l use
onl
y

NOTES TO THE CONSOLIDATED FINANCIAL STATEMENTSSix months ended 31 December 2015
28| Broadspectrum Interim Report 2016
10. SUBSEQUENT EVENTS
On 12 February 2016, Broadspectrum concluded amendments to its existing senior syndicated bank facility. These amendments were negotiated under similar terms to the original facility and include a 1 year extension to the syndicated bank facility to July 2018 and a reduction in facility commitment by $50 million.
On 15 February 2016, Broadspectrum announced a share buy-back to purchase up to 10% of the Company’s shares on-market over 12 months, to commence no earlier than 8 March 2016.
No other events have occurred since the end of the reporting period that may materially affect the Group’s operations, the results of those operations or the Group’s state of affairs in future financial years.
In making their determination management have had full regard to the events announced to the ASX on 8 Februray 2016 concerning the recent Bid Offer by Ferrovial and the extension of the DIBP contract. Neither of these events are considered to have a material impact on the half year financial report as presented.
In making their determination management have had full regard to the events announced to the ASX on 8 February 2016concerning the recent Bid Offer by Ferrovial and the extension of the DIBP contract. Neither of these events are considered to havea material impact on the half year financial report as presented.
For
per
sona
l use
onl
y

29| Broadspectrum Interim Report 2016
DIRECTORS’ DECLARATION Six months ended 31 December 2015
In the Directors’ opinion the financial statements and notes set out on pages 16 to 28 are in accordance with the Corporations Act 2001, including:
• giving a true and fair view of the Group’s financial position as at 31 December 2015 and of its performance for the six month period ended on that date.
• complying with Australian Accounting Standard AASB 134 Interim Financial Reporting and the Corporations Regulations 2001.
In the Directors’ opinion, there are reasonable grounds to believe that the Company will be able to pay its debts as and when they become due and payable at the date of this declaration.
Signed in accordance with a resolution of the directors:
Diane Smith-Gander Graeme Hunt
Chairman Managing Director and Chief Executive Officer
At Sydney
15 February 2016
For
per
sona
l use
onl
y
30| Broadspectrum Interim Report 2016
AUDITOR’S INDEPENDENCE DECLARATIONSix months ended 31 December 2015
For
per
sona
l use
onl
y
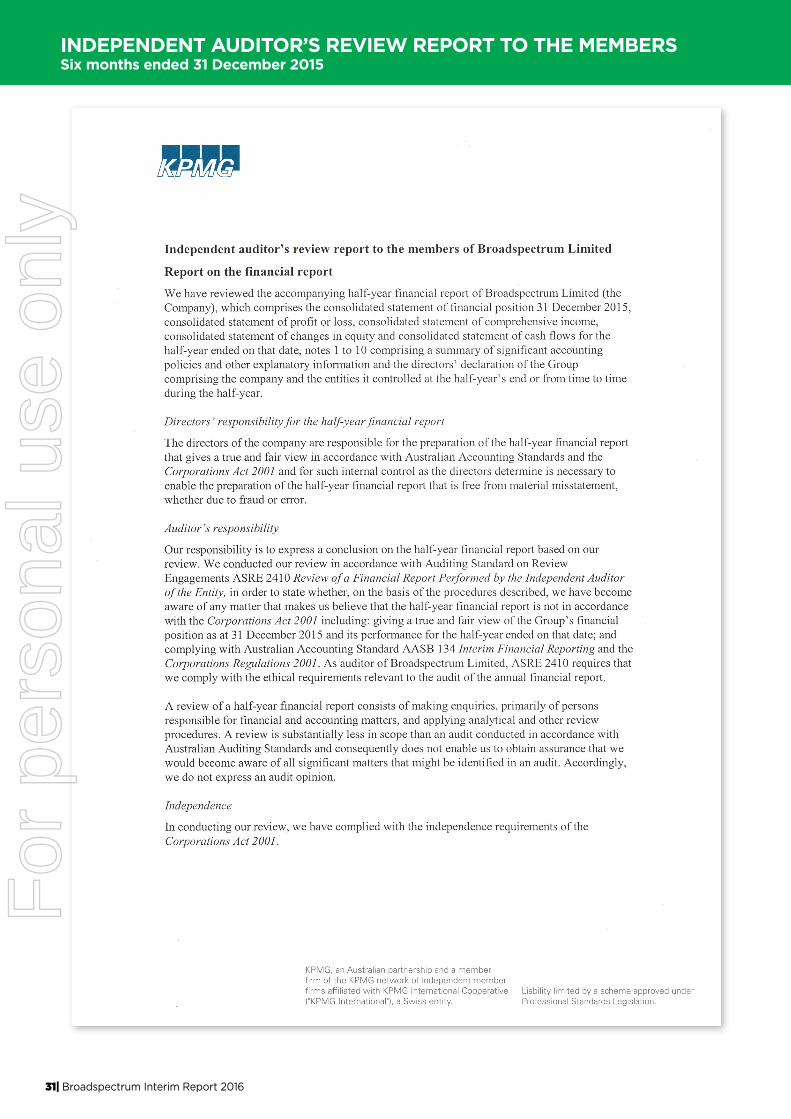
31| Broadspectrum Interim Report 2016
INDEPENDENT AUDITOR’S REVIEW REPORT TO THE MEMBERSSix months ended 31 December 2015
For
per
sona
l use
onl
y
32| Broadspectrum Interim Report 2016
INDEPENDENT AUDITOR’S REVIEW REPORT TO THE MEMBERSSix months ended 31 December 2015
For
per
sona
l use
onl
y

33| Broadspectrum Interim Report 2016
CORPORATE DIRECTORY
DIRECTORSDiane Smith-GanderChairman
Graeme HuntManaging Director and Chief Executive Officer
Douglas SneddenRoy McKelvieKatherine HirschfeldDean PritchardGeoffrey Kleemann
COMPANY SECRETARYAngelique Nesbitt
PRINCIPAL REGISTERED OFFICE IN AUSTRALIALevel 10, 111 Pacific HighwayNorth Sydney NSW 2060
SHARE REGISTERComputershare Investor Services Pty Limited Level 3, 60 Carrington StreetSydney NSW 2000
AUDITORSKPMG10 Shelley StreetSydney NSW 2000
SECURITIES EXCHANGE LISTINGBroadspectrum Limited shares are listed on the Australian Securities Exchange under the code ‘BRS’.
WEBSITE ADDRESSwww.broadspectrum.com
For
per
sona
l use
onl
y