
FERROVIAL, S.A. SEPARATE DIRECTORS' REPORT AND FINANCIAL ...
Upload
ferrovialCategory
view
34download
0
1
Ferrovial Investing for Growth
2
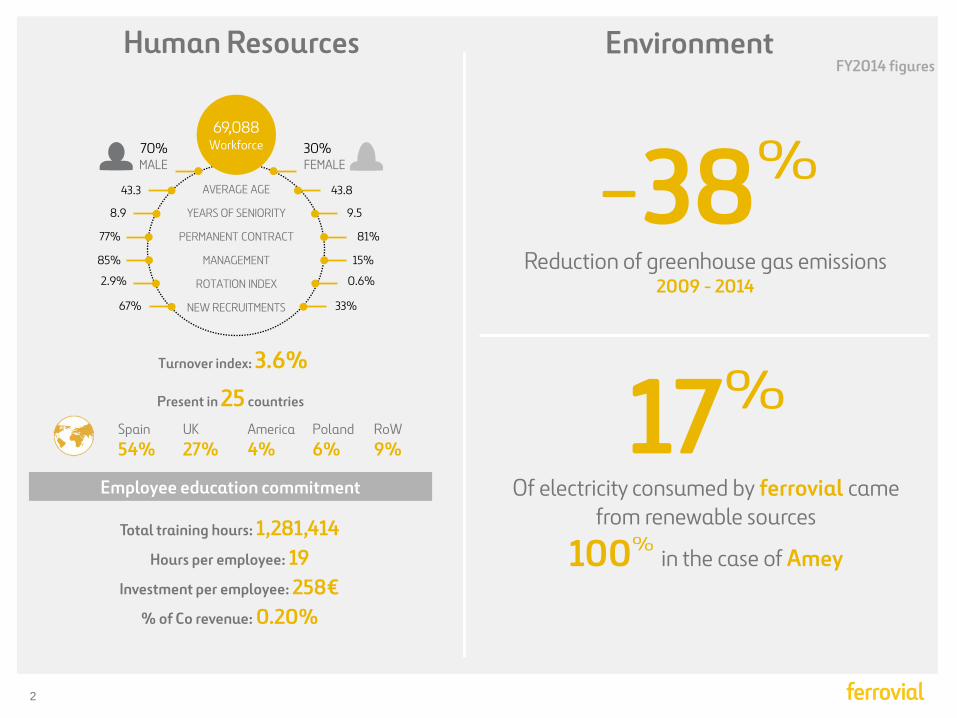
Human Resources
Total training hours: 1,281,414 Hours per employee: 19
Investment per employee: 258€ % of Co revenue: 0.20%
-38Reduction of greenhouse gas emissions
2009 - 2014
Employee education commitment
Environment
17Of electricity consumed by ferrovial came
from renewable sources
100 in the case of Amey
FY2014 figures
Spain 54%
America 4%
UK 27%
Poland 6%
RoW 9%
70% MALE
30% FEMALE
43.3 43.8 AVERAGE AGE
8.9 9.5 YEARS OF SENIORITY
77% 81% PERMANENT CONTRACT
85% 15% MANAGEMENT
2.9% 0.6% ROTATION INDEX
67% 33% NEW RECRUITMENTS
Present in 25 countries
69,088 Workforce
Turnover index: 3.6%

3
Ferrovial Overview & Strategy
4
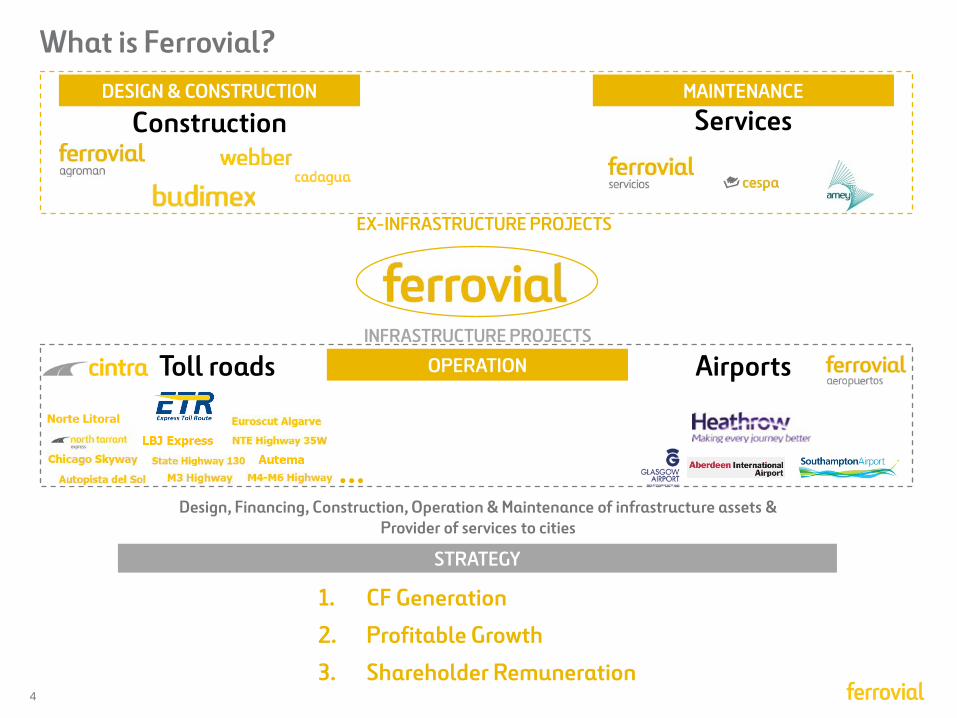
What is Ferrovial? DESIGN & CONSTRUCTION MAINTENANCE
OPERATION
Construction Services
Toll roads Airports
Design, Financing, Construction, Operation & Maintenance of infrastructure assets & Provider of services to cities
1. CF Generation
2. Profitable Growth
3. Shareholder Remuneration
STRATEGY
INFRASTRUCTURE PROJECTS
EX-INFRASTRUCTURE PROJECTS
…

5
INFRASTRUCTURE
PROJECTS
EX-INFRASTRUCTURE
PROJECTS
Capital intensive / Inflation protected / LT duration & financing
Controlling Shareholder 43% Free float 57%
Non capital intensive / Backlog visibility / EPS accretive
Ring fenced debt
Net cash position
1. Cash Flow Generation
€255mn Dividends from Toll roads
€341mn Dividends from Airports
€387mn
€349mn EBITDA from Construction
EBITDA from Services
PARENT COMPANY
€ million 2014 figures
6
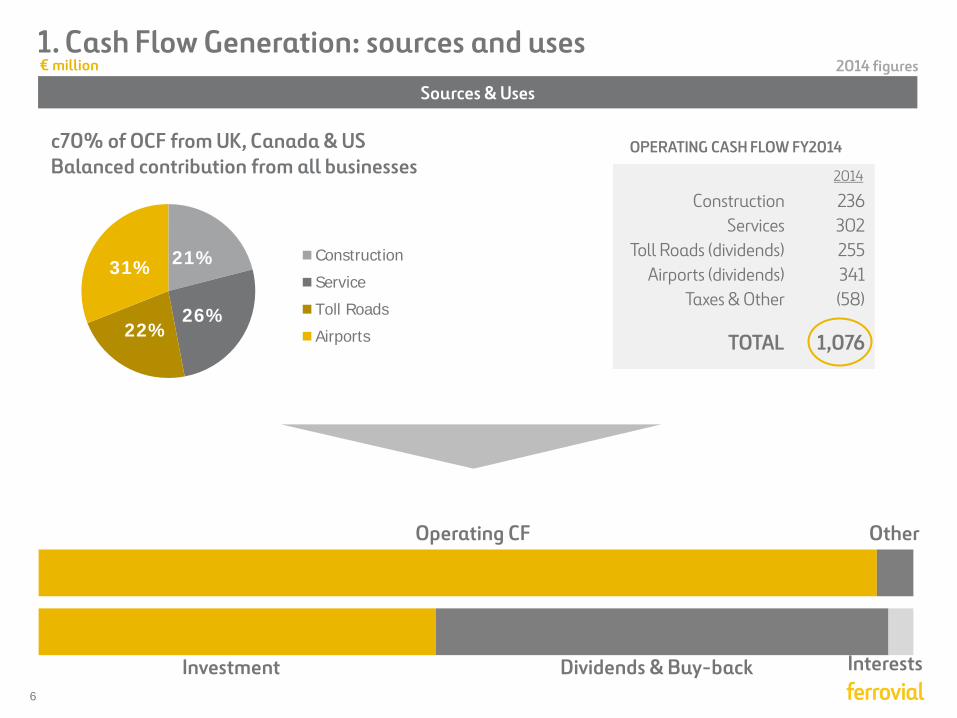
1. Cash Flow Generation: sources and uses
21%
26% 22%
31% Construction
Service
Toll Roads
Airports
€ million
OPERATING CASH FLOW FY2014
236 302 255 341 (58)
1,076
Construction Services
Toll Roads (dividends) Airports (dividends)
Taxes & Other
TOTAL
2014
Operating CF Other
Dividends & Buy-back Interests
Sources & Uses
Investment
c70% of OCF from UK, Canada & US Balanced contribution from all businesses
2014 figures
7
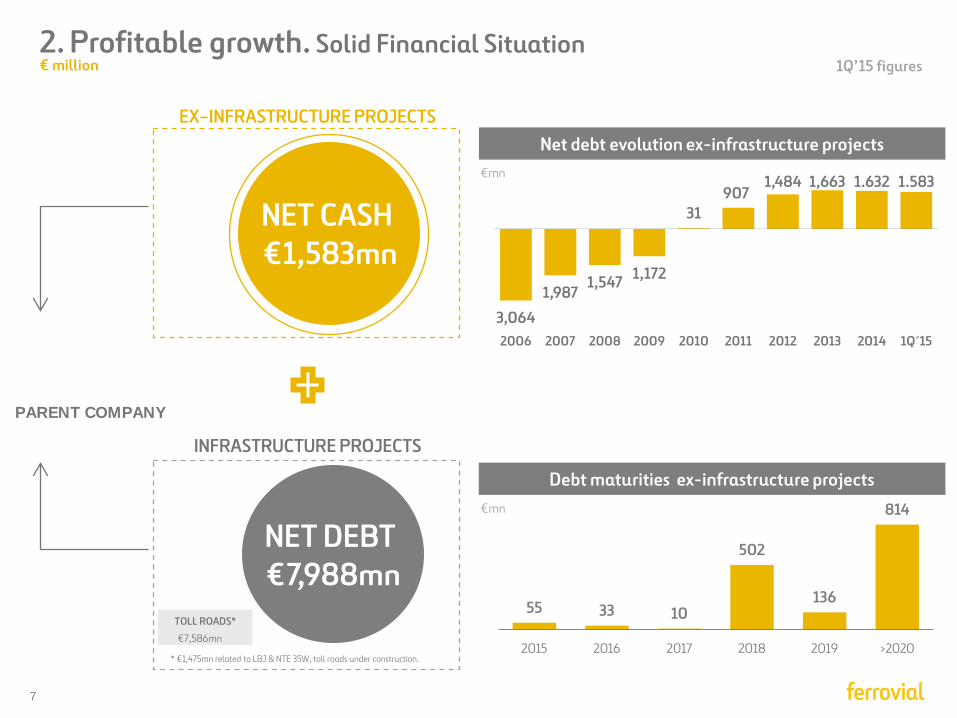
PARENT COMPANY
2. Profitable growth. Solid Financial Situation
Net debt evolution ex-infrastructure projects
3,064
1,987 1,547 1,172
31 907
1,484 1,663 1.632 1.583
2006 2007 2008 2009 2010 2011 2012 2013 2014 1Q´15
EX–INFRASTRUCTURE PROJECTS
TOLL ROADS* €7,586mn
* €1,475mn related to LBJ & NTE 35W, toll roads under construction.
INFRASTRUCTURE PROJECTS
Debt maturities ex-infrastructure projects
NET CASH €1,583mn
€mn
€mn
NET DEBT €7,988mn
55 33 10
502
136
814
2015 2016 2017 2018 2019 >2020
€ million 1Q’15 figures
8
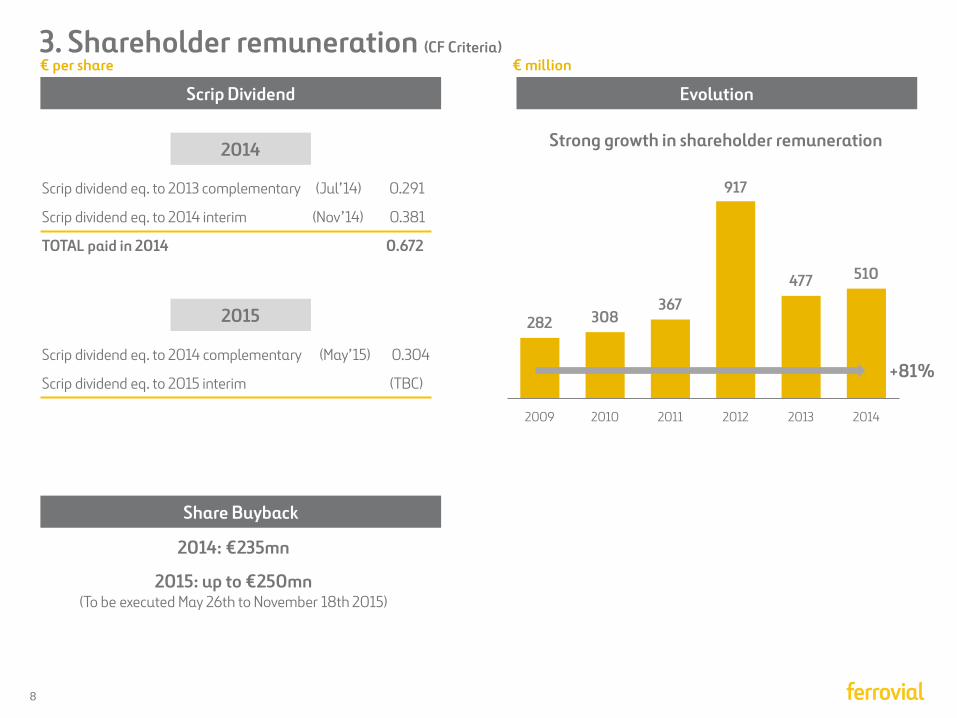
3. Shareholder remuneration (CF Criteria)
Scrip Dividend
Scrip dividend eq. to 2013 complementary (Jul’14) 0.291
Scrip dividend eq. to 2014 interim (Nov’14) 0.381
TOTAL paid in 2014 0.672
2014: €235mn
Evolution
Share Buyback
Scrip dividend eq. to 2014 complementary (May’15) 0.304
Scrip dividend eq. to 2015 interim (TBC)
2015: up to €250mn (To be executed May 26th to November 18th 2015)
282 308 367
917
477 510
2009 2010 2011 2012 2013 2014
€ per share
+81%
Strong growth in shareholder remuneration
€ million
2014
2015
9
Ferrovial today: 1Q’15 Results
Double digit revenues & EBITDA growth Supported by operational performance & FX impact
Significant traffic growth at key assets Airports, Highways (Canada, US, Europe) on the back of:
Strong financial position Net cash (ex-infra projects) at €1,583mn.
Reducing borrowing costs & extending maturity Renewing liquidity line &^issuing bonds • Heathrow issued c.£850mn (of which €750mn at 15Y, 1.5%. Cost) • ETR407 issued CAD150mn 30Y bonds at 3.30% • Increased & extended €1.3bn liquidity line (5Y, 50bps)
Higher dividends from 407ETR & Heathrow +7% & +11%, respectively (Ferrovial receives a combined €85mn)
All time high combined construction & services backlog >€32bn (including JV)
Better weather conditions vs 1Q’14 Easter holidays in March Lower oil prices Economic recovery since 2H’14
10
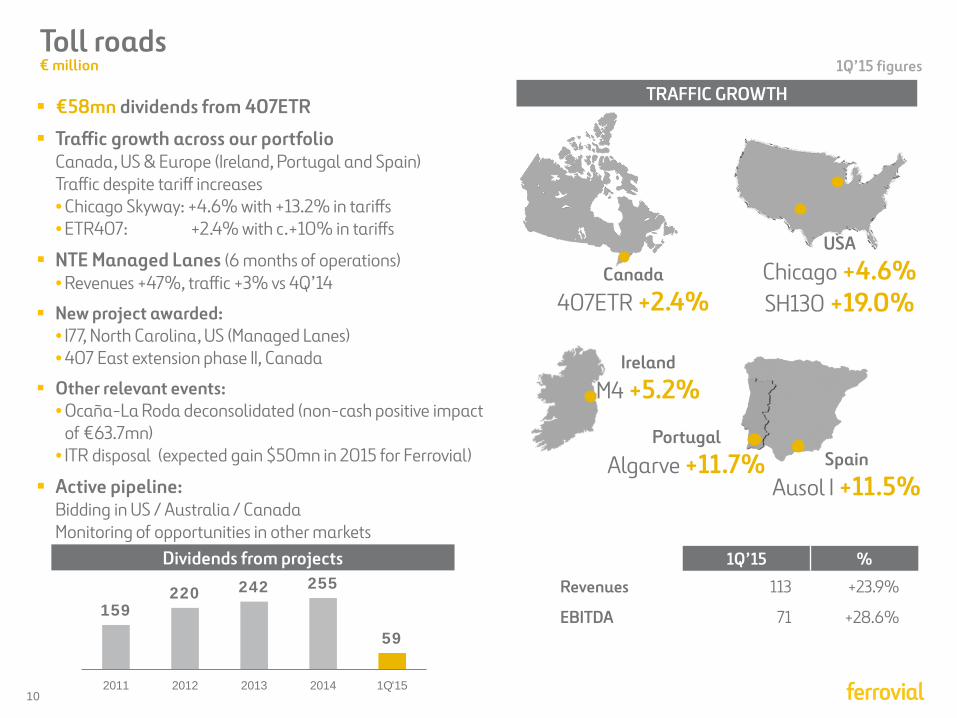
Toll roads € million
TRAFFIC GROWTH
1Q’15 figures
1Q’15 %
Revenues 113 +23.9%
EBITDA 71 +28.6%
€58mn dividends from 407ETR
Traffic growth across our portfolio Canada, US & Europe (Ireland, Portugal and Spain) Traffic despite tariff increases • Chicago Skyway: +4.6% with +13.2% in tariffs • ETR407: +2.4% with c.+10% in tariffs
NTE Managed Lanes (6 months of operations) • Revenues +47%, traffic +3% vs 4Q’14
New project awarded: • I77, North Carolina, US (Managed Lanes) • 407 East extension phase II, Canada
Other relevant events: • Ocaña-La Roda deconsolidated (non-cash positive impact
of €63.7mn) • ITR disposal (expected gain $50mn in 2015 for Ferrovial)
Active pipeline: Bidding in US / Australia / Canada Monitoring of opportunities in other markets
159 220 242 255
59
2011 2012 2013 2014 1Q'15
Dividends from projects
Canada
407ETR +2.4%
USA
Chicago +4.6% SH130 +19.0%
Ireland
M4 +5.2%
Portugal
Algarve +11.7% Spain
Ausol I +11.5%
11
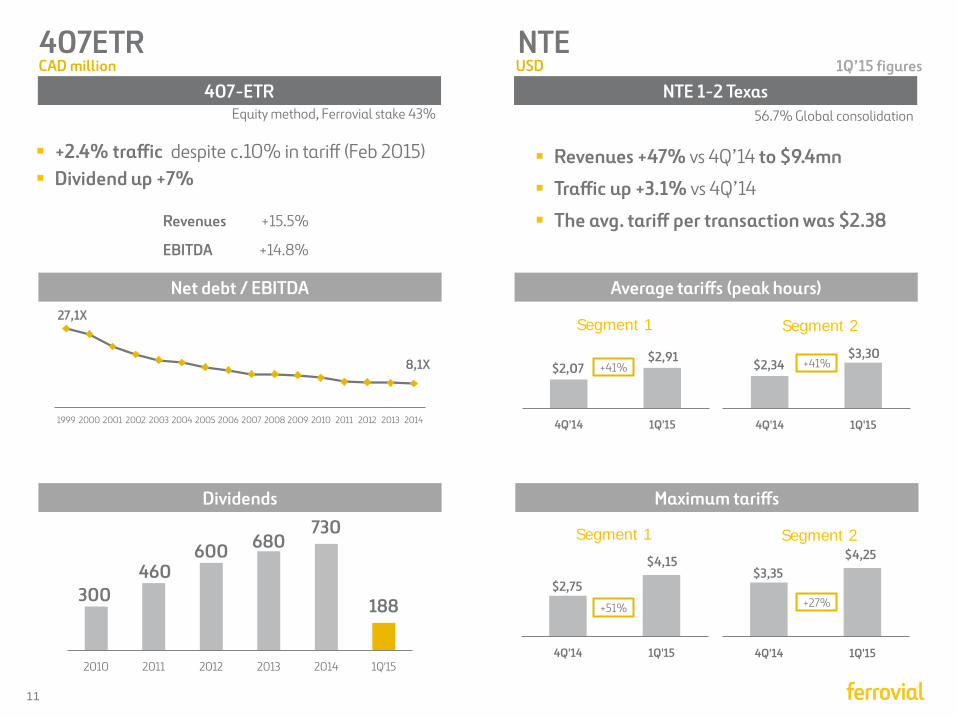
407ETR NTE CAD million USD
Revenues +15.5%
EBITDA +14.8%
+2.4% traffic despite c.10% in tariff (Feb 2015)
Dividend up +7%
300 460
600 680 730
188
2010 2011 2012 2013 2014 1Q'15
Revenues +47% vs 4Q’14 to $9.4mn
Traffic up +3.1% vs 4Q’14
The avg. tariff per transaction was $2.38
27,1X
8,1X
1999 2000 2001 2002 2003 2004 2005 2006 2007 2008 2009 2010 2011 2012 2013 2014
Equity method, Ferrovial stake 43% NTE 1-2 Texas 407-ETR
56.7% Global consolidation
Net debt / EBITDA
Dividends
Average tariffs (peak hours)
1Q’15 figures
$2,07
$2,91
4Q'14 1Q'15
Segment 1
Maximum tariffs
$2,34
$3,30
4Q'14 1Q'15
Segment 2
$2,75
$4,15
4Q'14 1Q'15
Segment 1
$3,35
$4,25
4Q'14 1Q'15
Segment 2
+41%
+51%
+41%
+27%
12
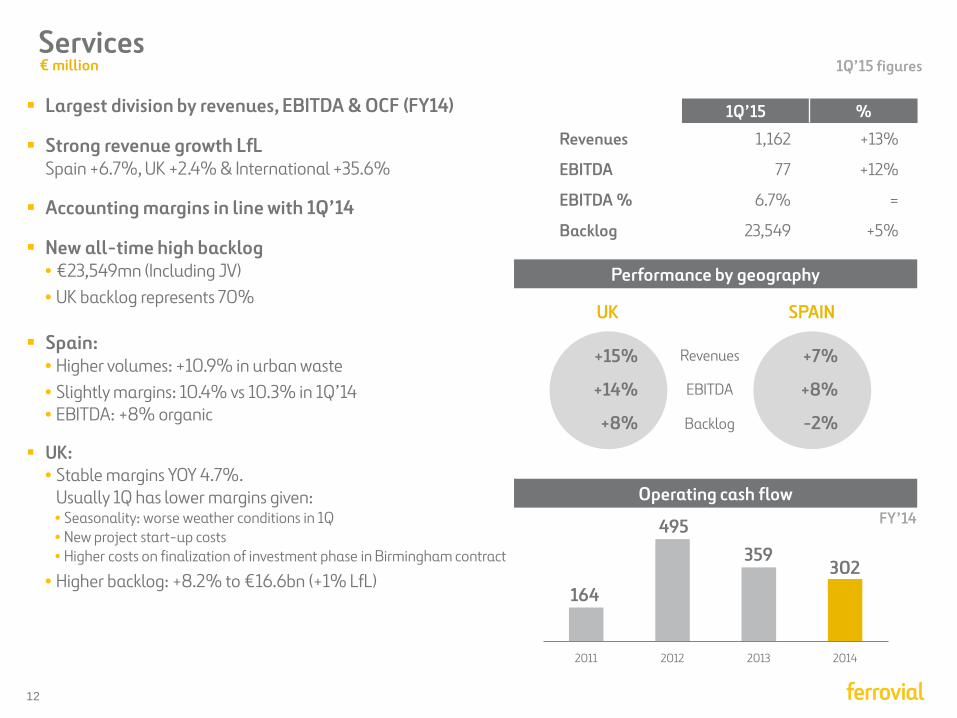
Services
Largest division by revenues, EBITDA & OCF (FY14)
Strong revenue growth LfL Spain +6.7%, UK +2.4% & International +35.6%
Accounting margins in line with 1Q’14
New all-time high backlog • €23,549mn (Including JV) • UK backlog represents 70%
Spain:
• Higher volumes: +10.9% in urban waste • Slightly margins: 10.4% vs 10.3% in 1Q’14 • EBITDA: +8% organic
UK: • Stable margins YOY 4.7%.
Usually 1Q has lower margins given: • Seasonality: worse weather conditions in 1Q • New project start-up costs • Higher costs on finalization of investment phase in Birmingham contract
• Higher backlog: +8.2% to €16.6bn (+1% LfL)
SPAIN UK
+15%
+14%
+8%
+7%
+8%
-2%
Revenues
EBITDA
Backlog
164
495 359
302
2011 2012 2013 2014
1Q’15 %
Revenues 1,162 +13%
EBITDA 77 +12%
EBITDA % 6.7% =
Backlog 23,549 +5%
Performance by geography
Operating cash flow
€ million 1Q’15 figures
FY’14
13
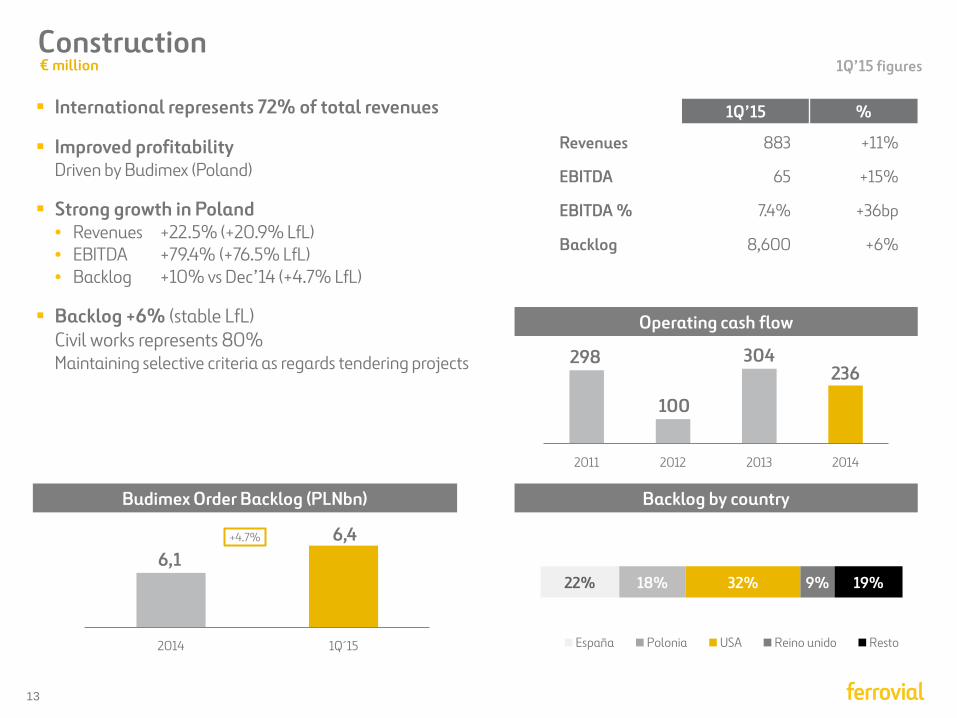
Construction
International represents 72% of total revenues
Improved profitability Driven by Budimex (Poland)
Strong growth in Poland • Revenues +22.5% (+20.9% LfL) • EBITDA +79.4% (+76.5% LfL) • Backlog +10% vs Dec’14 (+4.7% LfL)
Backlog +6% (stable LfL) Civil works represents 80% Maintaining selective criteria as regards tendering projects
1Q’15 %
Revenues 883 +11%
EBITDA 65 +15%
EBITDA % 7.4% +36bp
Backlog 8,600 +6%
298
100
304 236
2011 2012 2013 2014
Operating cash flow
Backlog by country Budimex Order Backlog (PLNbn)
6,1 6,4
2014 1Q´15
+4.7%
22% 18% 32% 9% 19%
España Polonia USA Reino unido Resto
€ million 1Q’15 figures
14
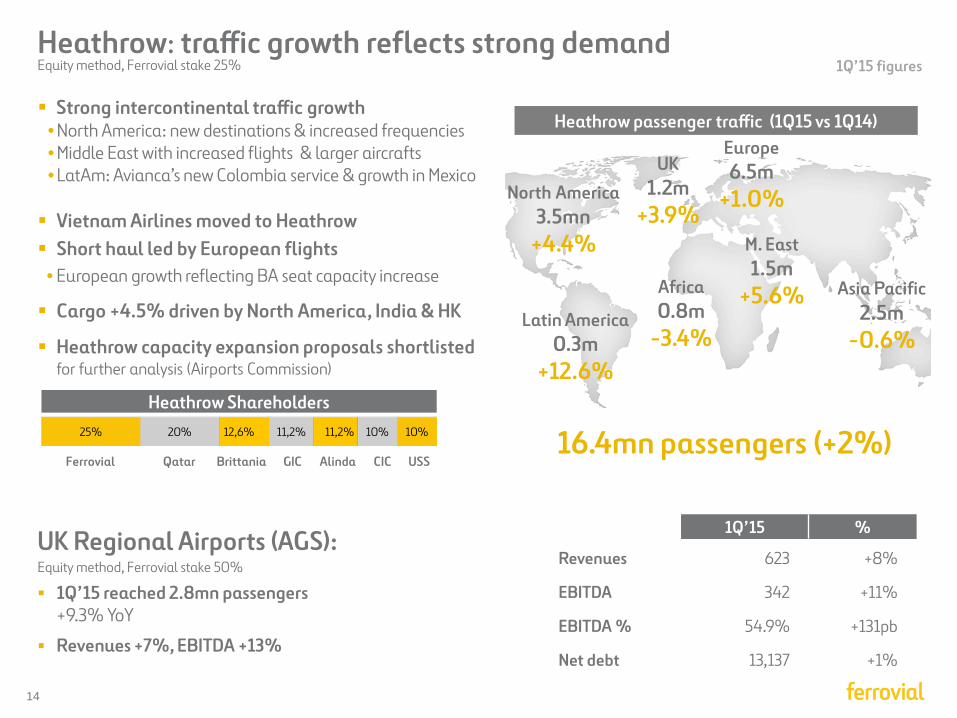
Heathrow: traffic growth reflects strong demand
Strong intercontinental traffic growth • North America: new destinations & increased frequencies • Middle East with increased flights & larger aircrafts • LatAm: Avianca’s new Colombia service & growth in Mexico
Vietnam Airlines moved to Heathrow Short haul led by European flights • European growth reflecting BA seat capacity increase
Cargo +4.5% driven by North America, India & HK
Heathrow capacity expansion proposals shortlisted for further analysis (Airports Commission)
Heathrow passenger traffic (1Q15 vs 1Q14)
1Q’15 figures
Africa 0.8m
-3.4%
M. East 1.5m
+5.6% Asia Pacific 2.5m
-0.6%
UK 1.2m
+3.9%
Europe 6.5m
+1.0%
Latin America 0.3m
+12.6%
North America 3.5mn
+4.4%
1Q’15 %
Revenues 623 +8%
EBITDA 342 +11%
EBITDA % 54.9% +131pb
Net debt 13,137 +1%
16.4mn passengers (+2%)
Equity method, Ferrovial stake 25%
Equity method, Ferrovial stake 50%
25% 20% 12,6% 11,2% 11,2% 10% 10%
Ferrovial Qatar Brittania GIC CIC Alinda USS
Heathrow Shareholders
UK Regional Airports (AGS):
1Q’15 reached 2.8mn passengers +9.3% YoY
Revenues +7%, EBITDA +13%
15
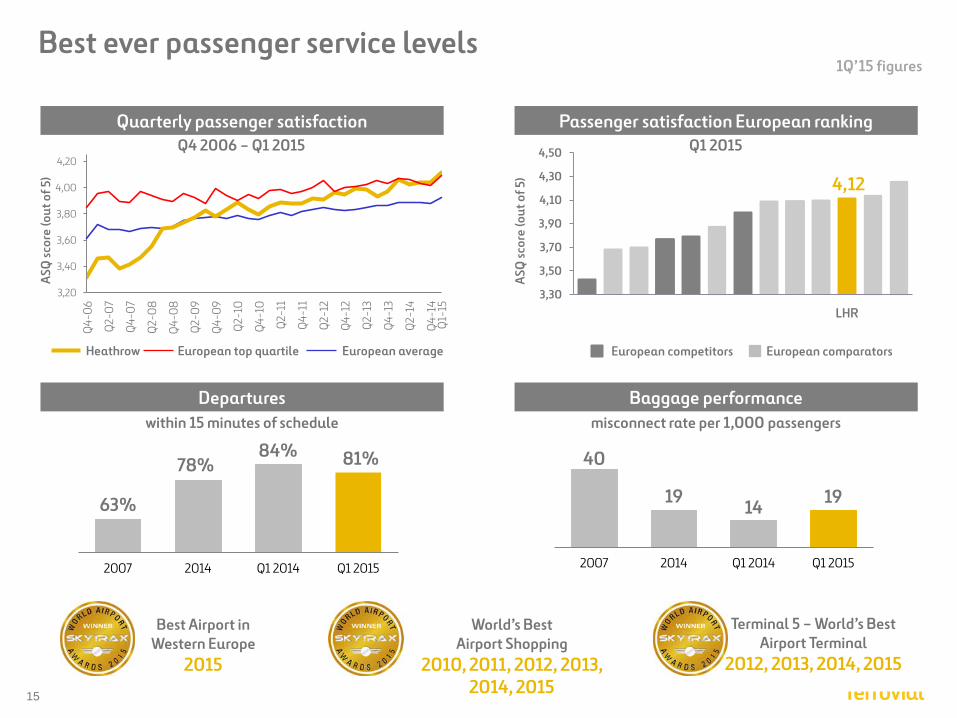
Best ever passenger service levels
Passenger satisfaction European ranking
1Q’15 figures
Best Airport in Western Europe
2015
World’s Best Airport Shopping
2010, 2011, 2012, 2013, 2014, 2015
Terminal 5 – World’s Best Airport Terminal
2012, 2013, 2014, 2015
Quarterly passenger satisfaction Q1 2015 Q4 2006 – Q1 2015
4,12
3,30
3,50
3,70
3,90
4,10
4,30
4,50
LHR
ASQ
scor
e (o
ut o
f 5)
3,20
3,40
3,60
3,80
4,00
4,20
Q4-
06
Q2-
07
Q4-
07
Q2-
08
Q4-
08
Q2-
09
Q4-
09
Q2-
10
Q4-
10
Q2-
11
Q4-
11
Q2-
12
Q4-
12
Q2-
13
Q4-
13
Q2-
14
Q4-
14Q
1-15
ASQ
scor
e (o
ut o
f 5)
European competitors European comparators Heathrow European average European top quartile
Baggage performance Departures misconnect rate per 1,000 passengers within 15 minutes of schedule
63%
78% 84% 81%
2007 2014 Q1 2014 Q1 2015
40
19 14 19
2007 2014 Q1 2014 Q1 2015
17
Appendix
Introduction to 407ETR Toll road
Managed Lanes Toll roads
18
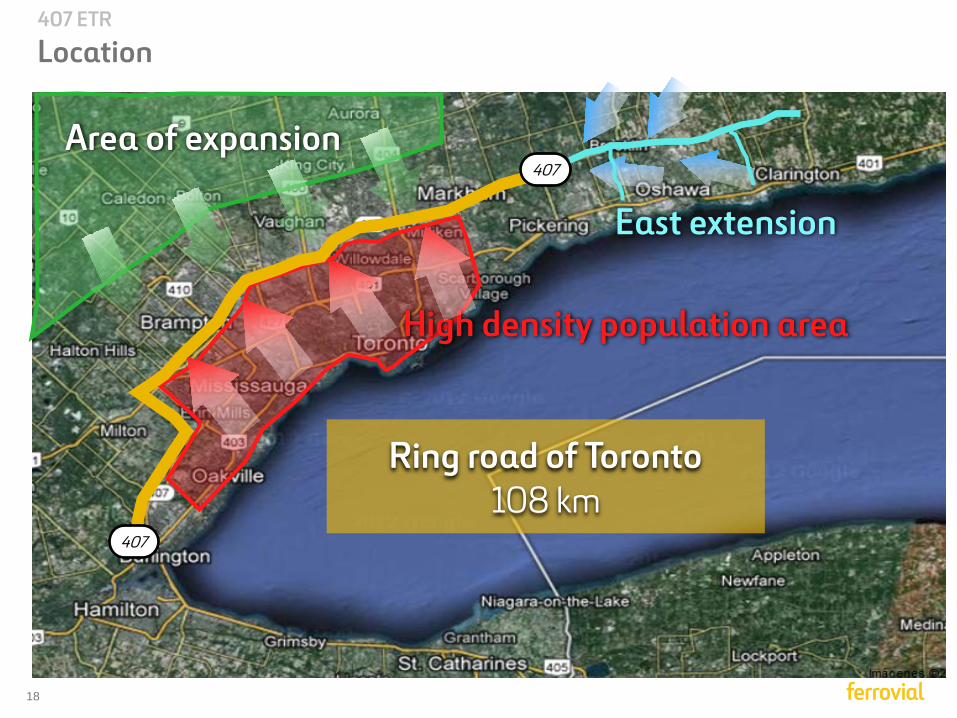
High density population area
Ring road of Toronto 108 km
407
407
East extension
Area of expansion
407 ETR
Location
19
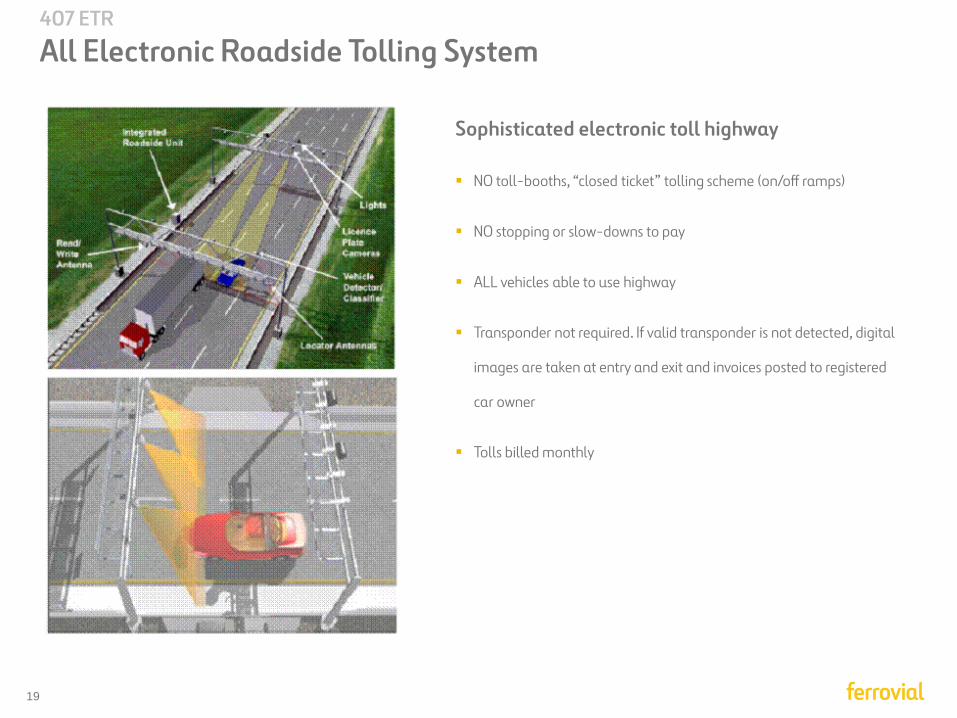
407 ETR
All Electronic Roadside Tolling System
Sophisticated electronic toll highway
NO toll-booths, “closed ticket” tolling scheme (on/off ramps)
NO stopping or slow-downs to pay
ALL vehicles able to use highway
Transponder not required. If valid transponder is not detected, digital
images are taken at entry and exit and invoices posted to registered
car owner
Tolls billed monthly
20
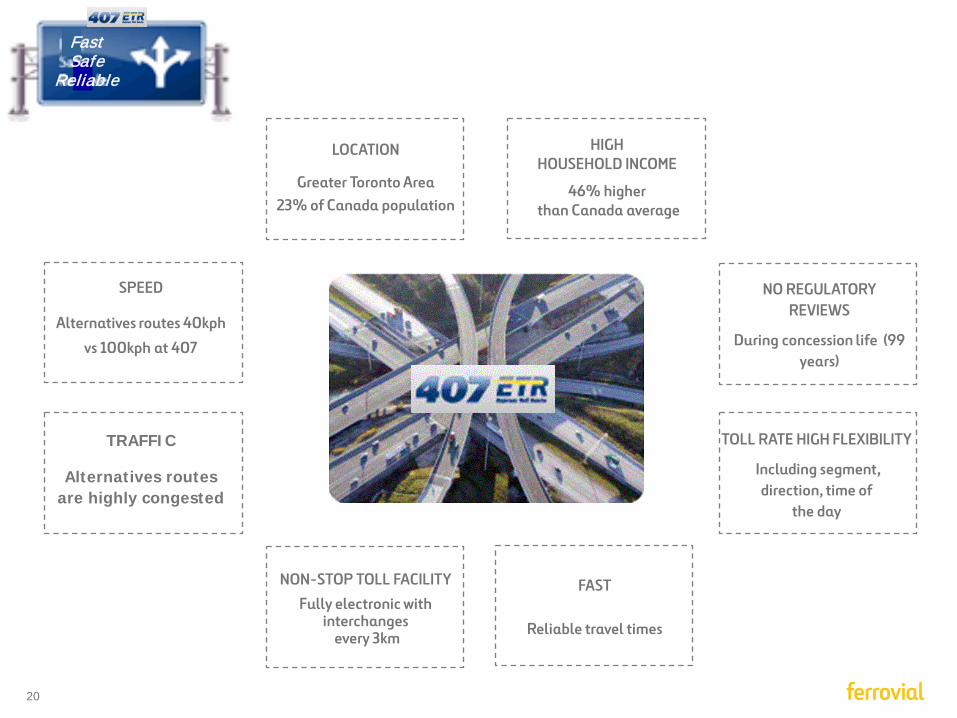
407 ETR
LOCATION
Greater Toronto Area 23% of Canada population
TRAFFIC
Alternatives routes are highly congested
HIGH HOUSEHOLD INCOME
46% higher than Canada average
NO REGULATORY REVIEWS
During concession life (99 years)
SPEED
Alternatives routes 40kph
vs 100kph at 407
NON-STOP TOLL FACILITY
Fully electronic with interchanges
every 3km
TOLL RATE HIGH FLEXIBILITY
Including segment, direction, time of
the day
FAST
Reliable travel times
Fast Safe
Reliable
21
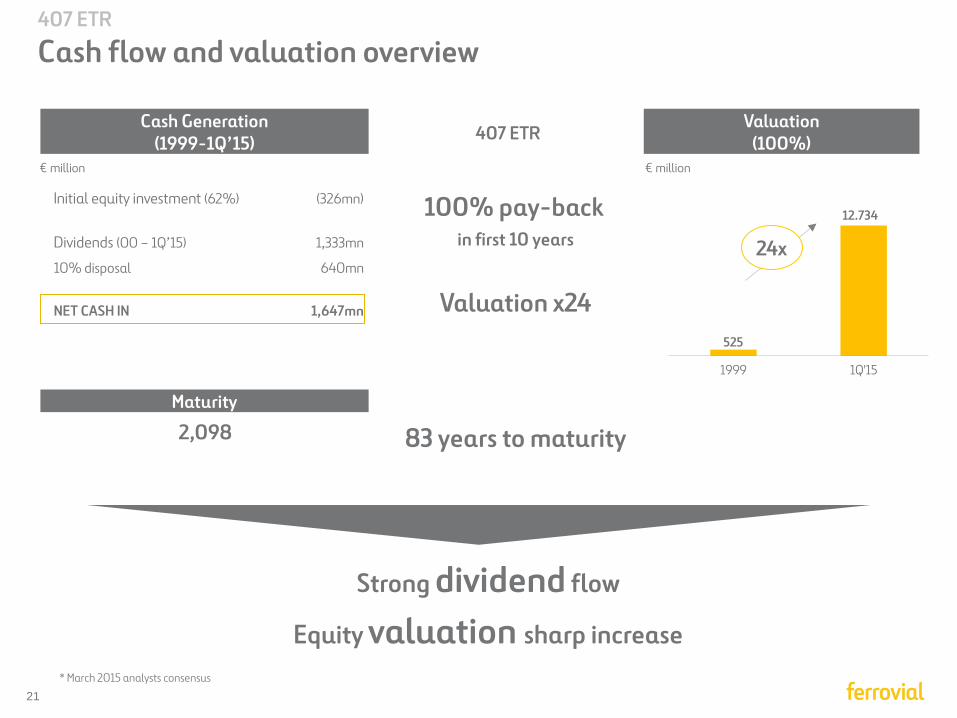
Strong dividend flow
Equity valuation sharp increase
Initial equity investment (62%) (326mn)
Dividends (00 – 1Q’15) 1,333mn
10% disposal 640mn
NET CASH IN 1,647mn
2,098
100% pay-back
in first 10 years
Valuation x24
* March 2015 analysts consensus
525
12.734
1999 1Q'15
24x
407 ETR
83 years to maturity
407 ETR
Cash flow and valuation overview
€ million
Cash Generation (1999-1Q’15)
Valuation (100%)
€ million
Maturity
22
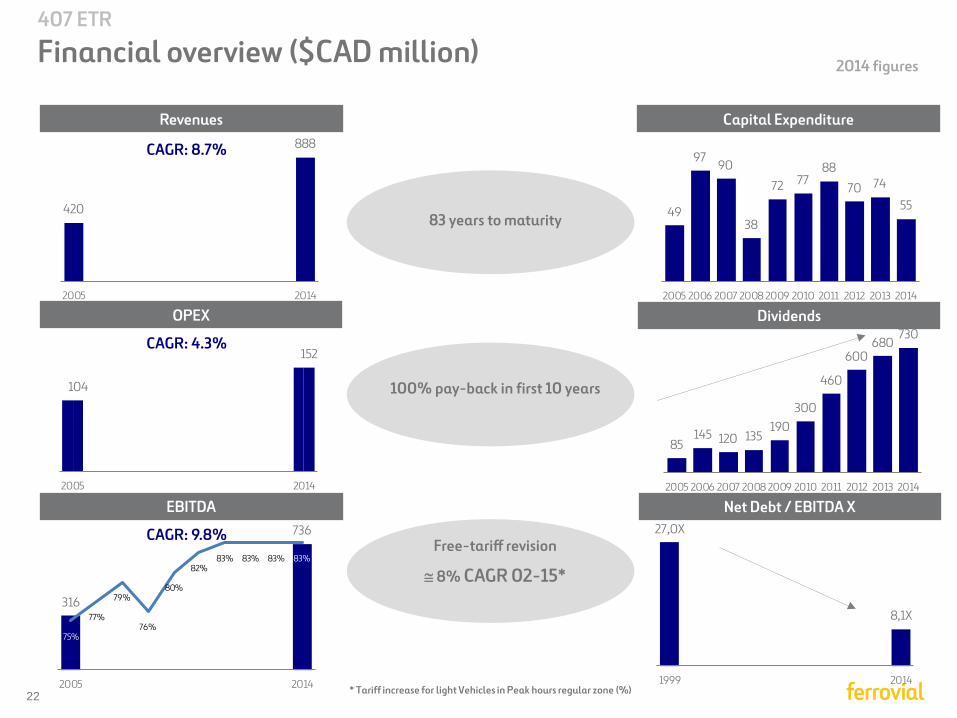
83 years to maturity
100% pay-back in first 10 years
Free-tariff revision
≅ 8% CAGR 02-15*
* Tariff increase for light Vehicles in Peak hours regular zone (%)
407 ETR
Financial overview ($CAD million)
Revenues
EBITDA
OPEX
Capital Expenditure
Dividends
Net Debt / EBITDA X
420
888
2005 2014
104
152
2005 2014
316
736
75%
77%
79%
76%
80%
82%83% 83% 83% 83%
2005 2014
CAGR: 8.7%
CAGR: 9.8%
CAGR: 4.3%
49
9790
38
72 7788
70 74
55
2005 2006 2007 2008 2009 2010 2011 2012 2013 2014
85145 120 135
190300
460
600680
730
2005 2006 2007 2008 2009 2010 2011 2012 2013 2014
27,0X
8,1X
1999 2014
2014 figures
23
Appendix
Introduction to 407ETR Toll road
Managed Lanes Toll roads
24
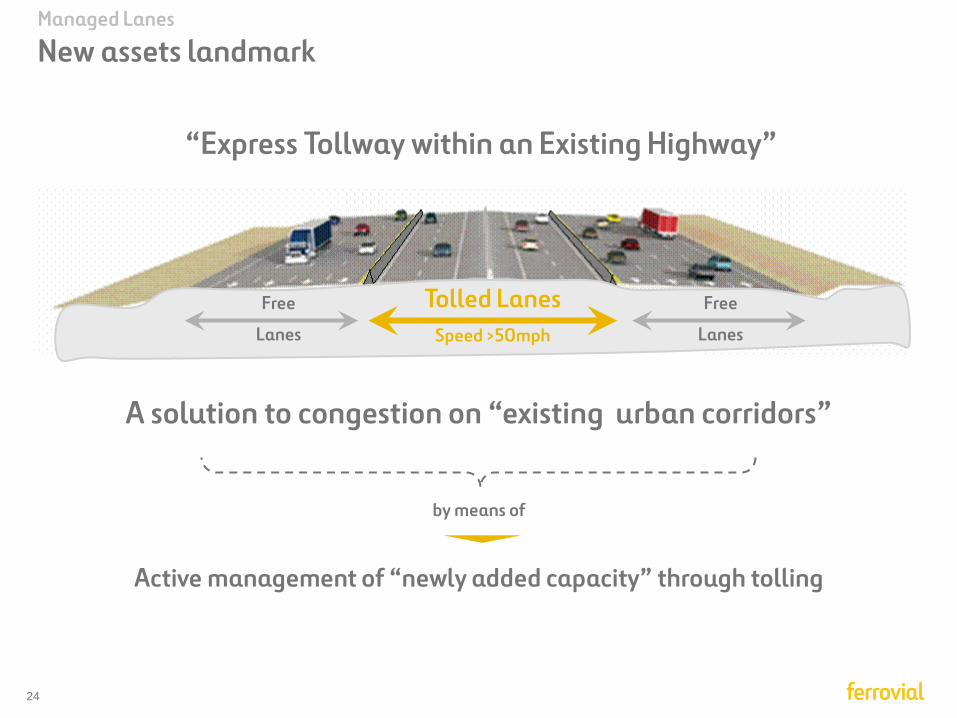
A solution to congestion on “existing urban corridors”
Active management of “newly added capacity” through tolling
by means of
Free
Lanes
Free
Lanes
Tolled Lanes Speed >50mph
“Express Tollway within an Existing Highway”
Managed Lanes
New assets landmark

25
Time of the day
Eastbound Westbound
00.00 2.00 4.00 6.00 8.00 10.00 12.00 14.00 16.00 18.00 20.00 22.00 24.00 12.00 2.00 4.00 6.00 8.00 10.00 12.00 2.00 4.00 6.00 8.00 10.00 12.00
Time of the day
Peak period
Managed Lanes
Level of demand
NTE (untolled) 407ETR (tolled)
26
Tim
e (m
in)
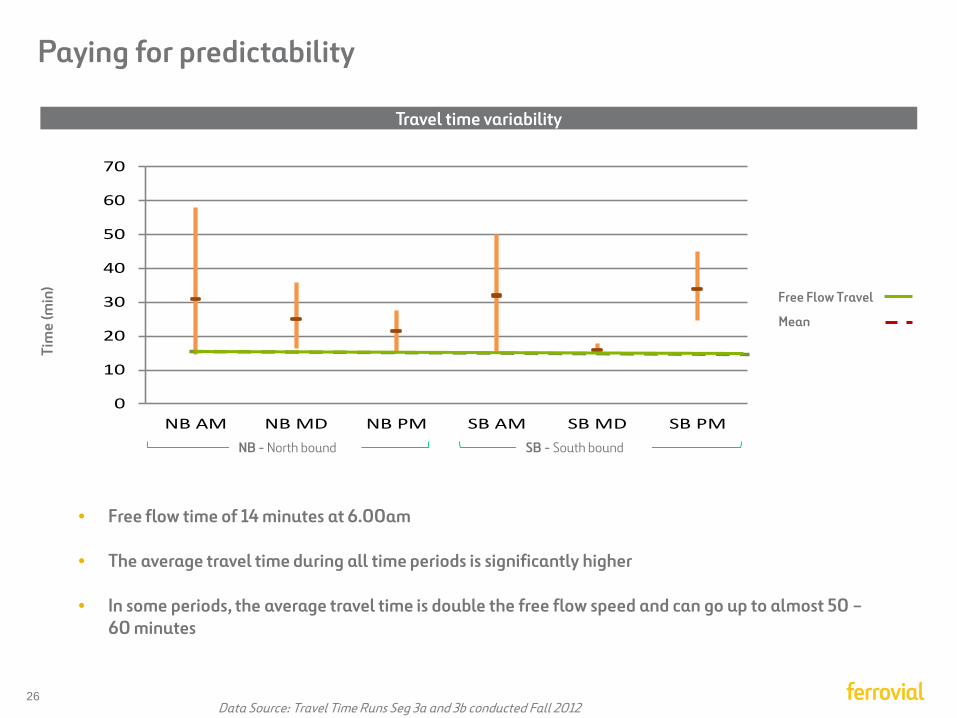
• Free flow time of 14 minutes at 6.00am
• The average travel time during all time periods is significantly higher
• In some periods, the average travel time is double the free flow speed and can go up to almost 50 – 60 minutes
0
10
20
30
40
50
60
70
NB AM NB MD NB PM SB AM SB MD SB PM
Tim
e (m
in)
Data Source: Travel Time Runs Seg 3a and 3b conducted Fall 2012
Paying for predictability
Free Flow Travel
Mean
NB - North bound SB - South bound
Travel time variability
27
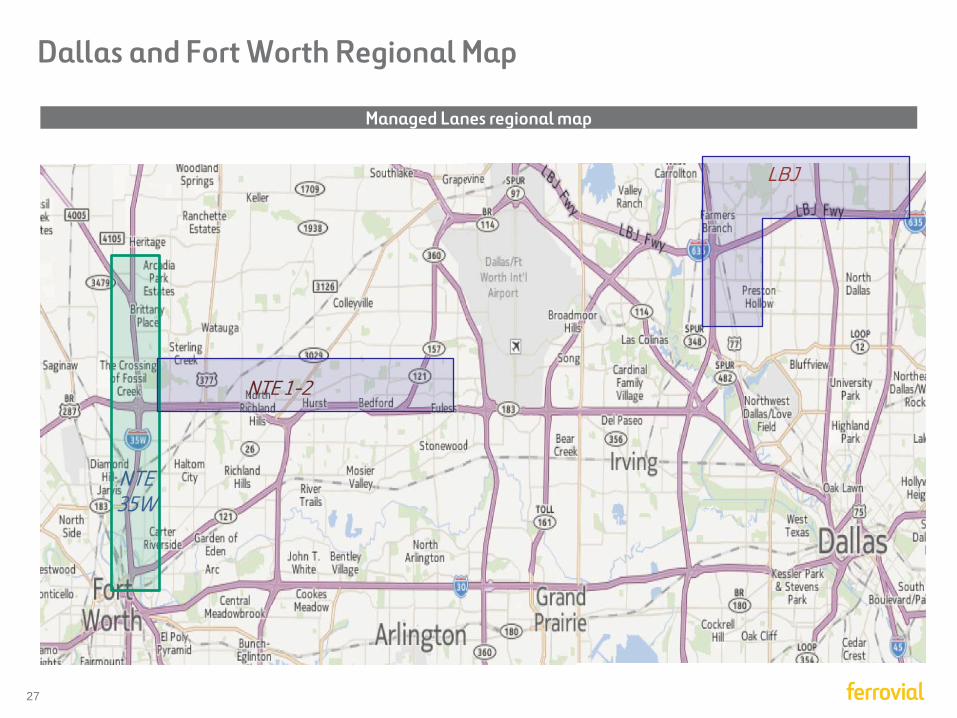
LBJ
Dallas and Fort Worth Regional Map
Managed Lanes regional map
NTE 1-2
NTE 35W

28
CINTRA MERIDIAM DALLAS
FIRE&POLICE PENSION SCHEME
DESCRIPTION:
LENGTH:
CONCESSION PERIOD:
TARIFF POLICY:
Dallas-Fort Worth Metroplex, Major thoroughfares
between Fort Worth and DFW Airport
13 mile section (IH 820 & SH 183 in Tarrant County)
52 years
Open Road Tolling System (no toll booths) with a dynamic tolling
regime (every 5 minutes) to maintain at all times a minimum speed of
50 mph
● No toll-booths, fully electronic free flow tolling system
● Tollway within a freeway: Motorists will be provided with a choice of
driving in non-tolled GP lanes or paying a toll to bypass such GP
lanes
● Tolls setting to ensure minimum speed on new lanes
● As demand grows and capacity becomes scarce, pricing power
increases
● Physically separated from the GP lanes with controlled access
EQUITY DEBT PUBLIC FUNDS
Managed Lanes
North Tarrant Express Opened on October 4th, 9 months ahead of schedule
57% 33% 10%
21% 52% 27%
Key characteristics
Shareholder structure
Financial structure
29
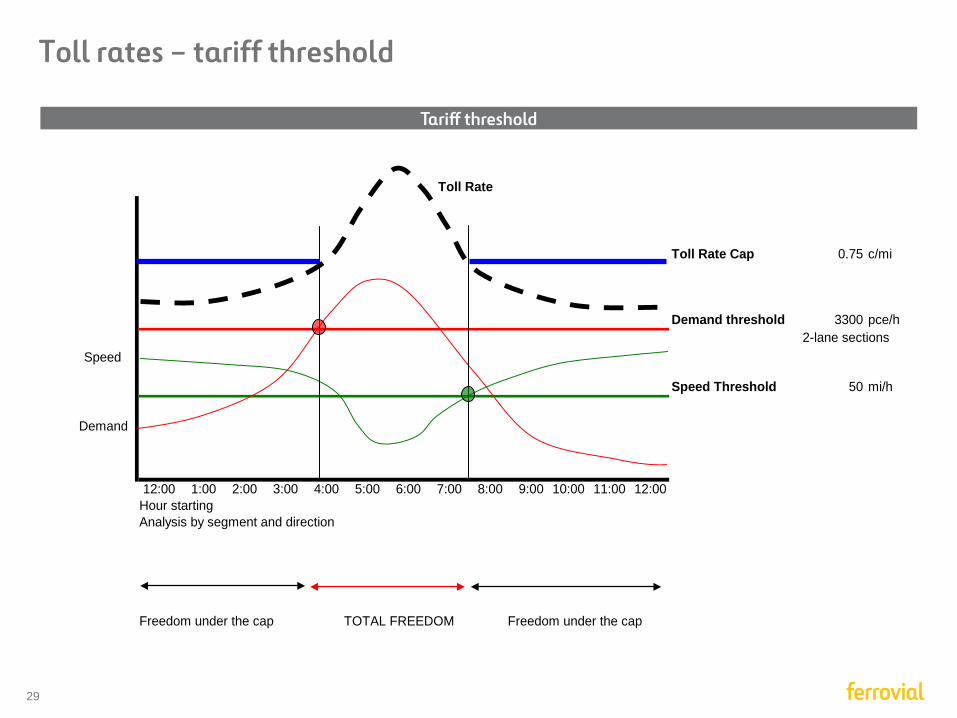
Toll rates – tariff threshold
Toll Rate Cap 0.75 c/mi
Demand threshold 3300 pce/h2-lane sections
Speed Threshold 50 mi/h
12:00 1:00 2:00 3:00 4:00 5:00 6:00 7:00 8:00 9:00 10:00 11:00 12:00Hour startingAnalysis by segment and direction
Freedom under the cap TOTAL FREEDOM Freedom under the cap
Speed
Demand
Toll Rate
Tariff threshold
30
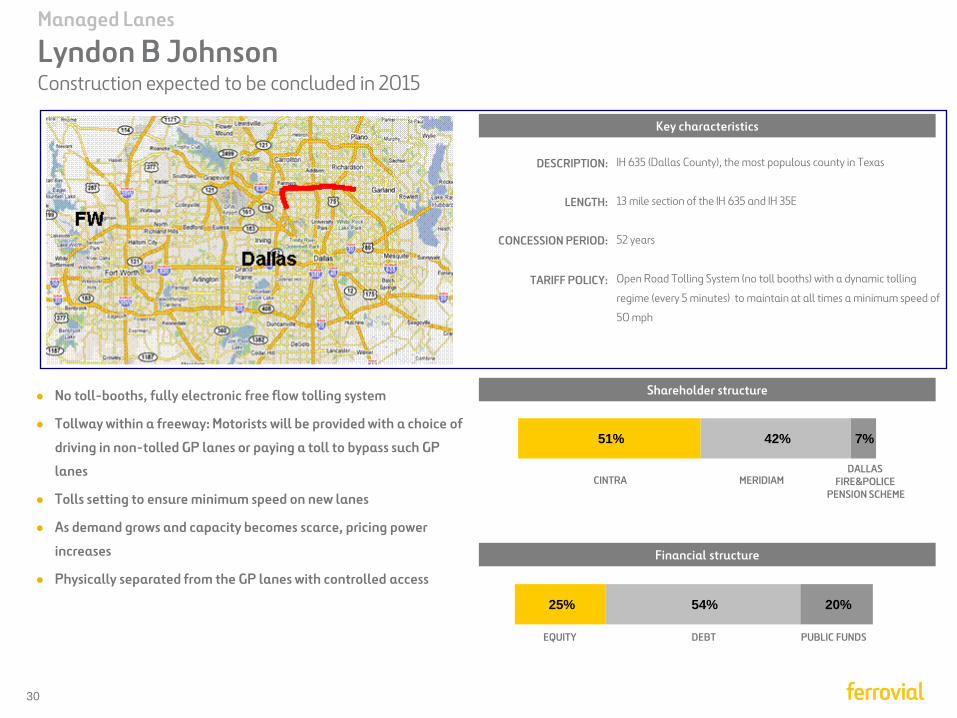
CINTRA MERIDIAM DALLAS
FIRE&POLICE PENSION SCHEME
Key characteristics
108Km Electronic toll
DESCRIPTION:
LENGTH:
CONCESSION PERIOD:
TARIFF POLICY:
IH 635 (Dallas County), the most populous county in Texas
13 mile section of the IH 635 and IH 35E
52 years
Open Road Tolling System (no toll booths) with a dynamic tolling
regime (every 5 minutes) to maintain at all times a minimum speed of
50 mph
● No toll-booths, fully electronic free flow tolling system
● Tollway within a freeway: Motorists will be provided with a choice of
driving in non-tolled GP lanes or paying a toll to bypass such GP
lanes
● Tolls setting to ensure minimum speed on new lanes
● As demand grows and capacity becomes scarce, pricing power
increases
● Physically separated from the GP lanes with controlled access
EQUITY DEBT PUBLIC FUNDS
Managed Lanes
Lyndon B Johnson Construction expected to be concluded in 2015
51% 42% 7%
25% 54% 20%
Shareholder structure
Financial structure
31
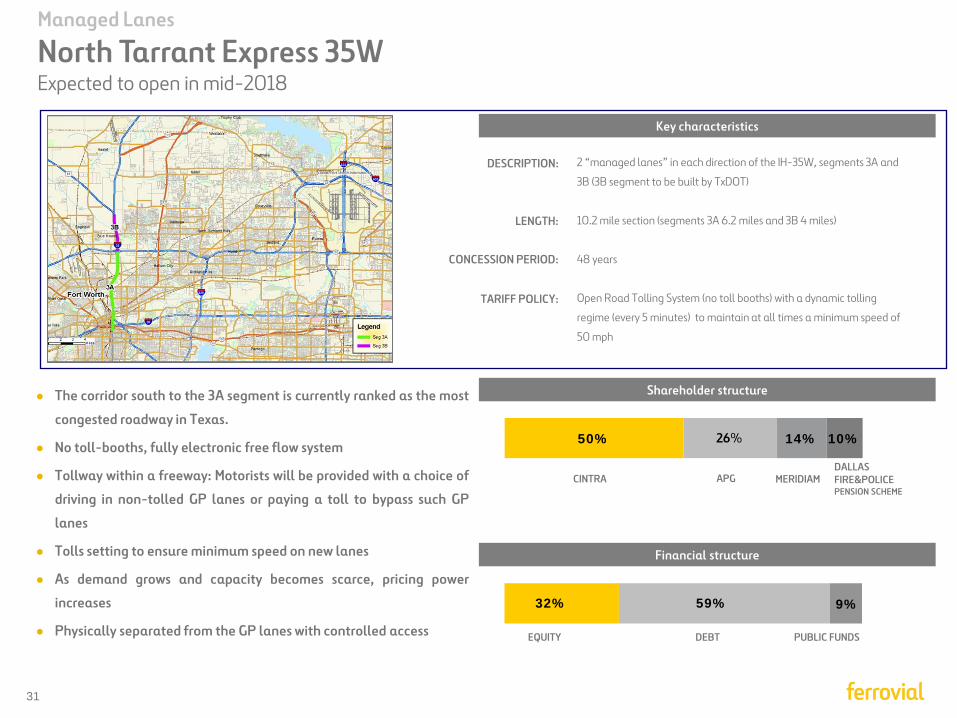
50% 14% 10%
CINTRA MERIDIAM DALLAS FIRE&POLICE PENSION SCHEME
DESCRIPTION:
LENGTH:
CONCESSION PERIOD:
TARIFF POLICY:
2 “managed lanes” in each direction of the IH-35W, segments 3A and
3B (3B segment to be built by TxDOT)
10.2 mile section (segments 3A 6.2 miles and 3B 4 miles)
48 years
Open Road Tolling System (no toll booths) with a dynamic tolling
regime (every 5 minutes) to maintain at all times a minimum speed of
50 mph
● The corridor south to the 3A segment is currently ranked as the most
congested roadway in Texas.
● No toll-booths, fully electronic free flow system
● Tollway within a freeway: Motorists will be provided with a choice of
driving in non-tolled GP lanes or paying a toll to bypass such GP
lanes
● Tolls setting to ensure minimum speed on new lanes
● As demand grows and capacity becomes scarce, pricing power
increases
● Physically separated from the GP lanes with controlled access
32% 59% 9%
EQUITY DEBT PUBLIC FUNDS
APG
Managed Lanes
North Tarrant Express 35W Expected to open in mid-2018
26%
Key characteristics
Shareholder structure
Financial structure
32
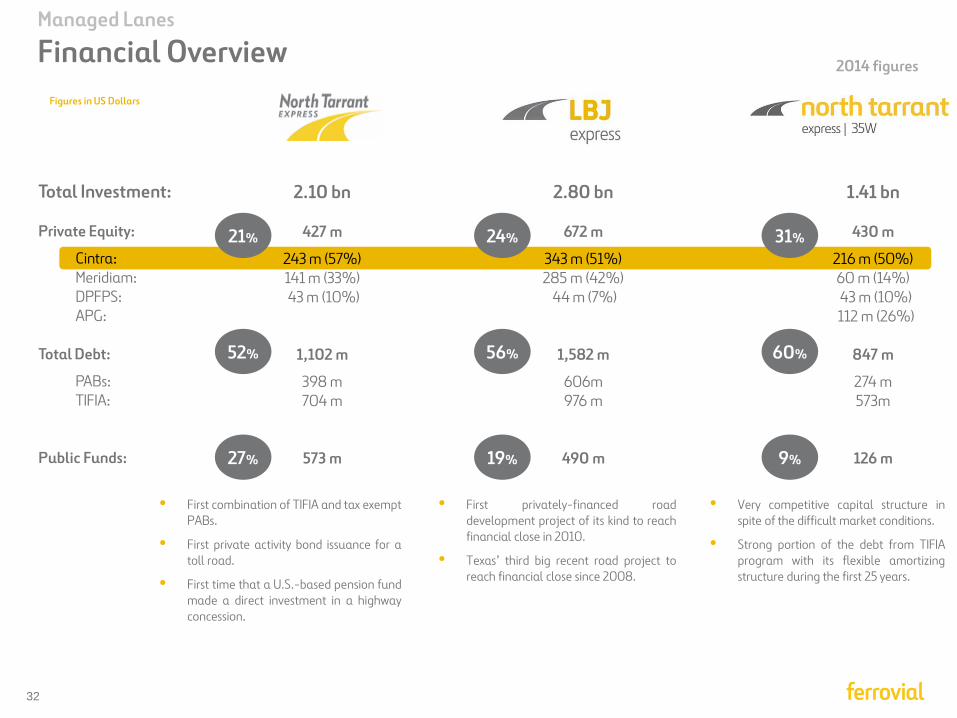
• First privately-financed road development project of its kind to reach financial close in 2010.
• Texas’ third big recent road project to reach financial close since 2008.
• First combination of TIFIA and tax exempt PABs.
• First private activity bond issuance for a toll road.
• First time that a U.S.-based pension fund made a direct investment in a highway concession.
21%
52%
27%
24%
56%
19%
Figures in US Dollars
Managed Lanes
Financial Overview
31%
60%
9%
• Very competitive capital structure in spite of the difficult market conditions.
• Strong portion of the debt from TIFIA program with its flexible amortizing structure during the first 25 years.
2.10 bn
427 m
243 m (57%) 141 m (33%) 43 m (10%)
1,102 m
398 m 704 m
573 m
2.80 bn
672 m
343 m (51%) 285 m (42%)
44 m (7%)
1,582 m
606m 976 m
490 m
1.41 bn
430 m
216 m (50%) 60 m (14%) 43 m (10%) 112 m (26%)
847 m
274 m 573m
126 m
Total Investment: Private Equity:
Cintra: Meridiam: DPFPS: APG:
Total Debt:
PABs: TIFIA:
Public Funds:
2014 figures

33
Ferrovial today:
1Q’15 Results
34
JUN’14 Var%
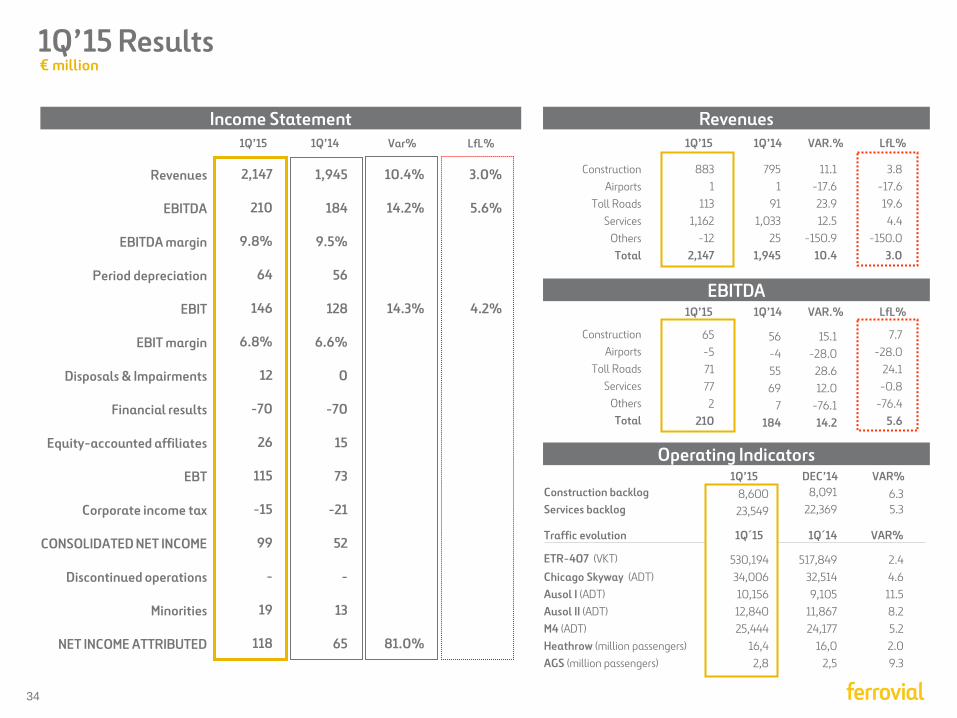
2,147
210
9.8%
64
146
6.8%
12
-70
26
115
-15
99
-
19
118
10.4%
14.2%
14.3%
81.0%
Construction Airports
Toll Roads Services
Others Total
883 1
113 1,162
-12 2,147
795 1
91 1,033
25 1,945
11.1 -17.6 23.9 12.5
-150.9 10.4
3.8 -17.6 19.6
4.4 -150.0
3.0
Construction Airports
Toll Roads Services
Others Total
65 -5 71 77
2 210
56 -4 55 69
7 184
15.1 -28.0
28.6 12.0
-76.1 14.2
7.7 -28.0
24.1 -0.8
-76.4 5.6
1Q’15 1Q’14 VAR.% LfL%
1,945
184
9.5%
56
128
6.6%
0
-70
15
73
-21
52
-
13
65
1Q’14
Construction backlog Services backlog
Traffic evolution
ETR-407 (VKT) Chicago Skyway (ADT) Ausol I (ADT) Ausol II (ADT) M4 (ADT) Heathrow (million passengers) AGS (million passengers)
VAR% 8,600 23,549
1Q´15
530,194 34,006 10,156 12,840 25,444
16,4 2,8
8,091 22,369
1Q´14
517,849 32,514 9,105
11,867 24,177
16,0 2,5
6.3 5.3
VAR%
2.4 4.6
11.5 8.2 5.2 2.0 9.3
1Q’15 DEC’14
LfL%
3.0%
5.6%
4.2%
1Q’15 Results
Revenues
EBITDA
EBITDA margin
Period depreciation
EBIT
EBIT margin
Disposals & Impairments
Financial results
Equity-accounted affiliates
EBT
Corporate income tax
CONSOLIDATED NET INCOME
Discontinued operations
Minorities
NET INCOME ATTRIBUTED
Income Statement Revenues
EBITDA
Operating Indicators
1Q’15 1Q’14 VAR.% LfL%
1Q’15
€ million

35
(1) Proportional: All EBITDA figures are aggregated in a proportional basis to the Ferrovial equity stake in each company or project (mainly ETR 407 toll road in Canada and UK airports).
Diversified portfolio
Services Construction Toll Roads Airports
Non Capital Intensive PROFIT GENERATION CASH GENERATION
Fully consolidated Method
€210Mn Proportional (1)
€389Mn
Capital Intensive LONG DURATION
LONG TERM VALUE
EBITDA
Services
Toll Roads
Construction
Airports
50% Spain
14% UK
17% US & Canada
18% RoW
25% Spain
41% UK
25% US & Canada
9% RoW
€ million 1Q’15 figures
Ex – Infrastructure Projects Infrastructure Projects
31%
37%
34%-2% 15%
22%
32%
31%
36
Disclaimer
This document may contain statements that constitute forward looking statements about the Company. These statements are
based on financial projections and estimates and their underlying assumptions, statements regarding plans, objectives and
expectations, which refer to estimates regarding, among others, future growth in the different business lines and the global
business, market share, financial results and other aspects of the activity and situation relating to the Company.
Such forward looking statements, by its nature, are not guarantees of future performance and involve risks and uncertainties, and
other important factors that could cause actual developments or results to differ from those expressed in these forward looking
statements.
Analysts and investors, and any other person or entity that may need to take decisions, or prepare or release opinions about the
securities issued by the Company, are cautioned not to place undue reliance on those forward looking statements which speak only
as of the date of this communication. They are all encouraged to consult the Company’s communications and periodic filings made
with the relevant securities markets regulators and, in particular, with the Spanish Securities Markets Regulator.