Ferrovial Integrated Annual Report 2015
176
-
Upload
ferrovial -
Category
Investor Relations
-
view
392 -
download
3
Transcript of Ferrovial Integrated Annual Report 2015


P.56-59
B
P.174-175
AConsolidated Financial Statements
P.90-173
Audit Report
I. MANAGEMENT REPORT
II. CONSOLIDATED FINANCIAL STATEMENTS
1 2 3
P.4-11 P.12-23 P.24-63
Ferrovial at a glance
1.1 What we do1.2 Ferrovial in figures1.3 Global presence
Strategy and value creation
2.1 Global strategy 2.2 Toll Roads2.3 Services2.4 Construction 2.5 Airports
Ferrovial 2015
3.1 Financial Capital: Business Performance 3.2 Human Capital: People, Health and Safety, Human Rights3.3 Intellectual Capital: Innovation 3.4 Environment and Natural Capital3.5 Industrial Capital: Supply Chain and Quality3.6 Capital Stock: Social Contribution and Responsible Fiscal Management
Risks4
P.66-71 P.72 P.73-89
Corporate Governance
5.1 Corporate Governance5.2 Remuneration Principles and Policies5.3 Board of Directors 5.4 Management Committee
Expected development of businesses 2016
Methodology for posting non-financial information7.1 Reporting principles7.2 GRI Indicators7.3 Annex to GRI Indicators7.4 Verification Report
5 6 7
1. The Management Report runs from page 4 to 89. It was drawn up by the Board of Directors on 25 February, 20162. The Consolidated Annual Financial Statements run from page 90 to 173 and were drawn up by the Board of Directors on 25 February, 2016.3. Additional reports: Annual Corporate Governance Report (forms part of the Management Report) and Annual Board of Directors’Remuneration Report (all available at www.ferrovial.com).4. Ferrovial has worked on an integrated model for reporting financial, social and environmental information, based on the “International Integrated Reporting Framework” from the International Integrated Reporting Committee (IIRC) and the CNMV “Guide for the preparation of management reports of listed companies”. Corporate Responsibility information is provided according to the principles of standard AA1000 and pursuant to version 4 of the Global Reporting Initiative (GRI) guide.
P.64-65

3LETTER FROM THE CHAIRMAN
Fellow shareholders:
Ferrovial ended 2015 in a good financial and business position, which allows it to look to 2016 and subsequent years with optimism. The company improved its key financials with respect to the previous year. Net profit amounted to 720 million euro in 2015 (compared with 402 million euro the previous year), revenues increased by 10.2%, EBITDA rose by 4.5% and operating cash flow, excluding projects, amounted to 889 million euro before taxes. Ferrovial ended the year with a net cash position of 1,514 million euro, excluding infrastructure project debt, and it does not have significant corporate debt maturities until 2018.
Ferrovial's results are the consequence of its strong business performance and the non-recurring revenues generated by the rotation of assets. In addition, the new record Services and Construction backlog—over 31,500 million euro—is a guarantee of future business. It is noteworthy that 81% of the Construction backlog and 73% of the Services backlog are in international markets. The company's business units obtained significant contracts, such as the Toowoomba toll road, in Australia; the Ruta del Cacao toll road, in Colombia; the I-285, in Atlanta; the new extension to 407 ETR, in Toronto and the Thames Tideway Tunnel, in London.
The company's two main infrastructure assets — 407 ETR and Heathrow Airport — performed strongly once again, with growth in revenues and EBITDA, with record traffic numbers and with excellent levels of customer satisfaction. The LBJ in Texas, the company's second managed lanes project, started operations in 2015, after the NTE opened to traffic in 2014. Traffic levels on both roads are encouraging.
Ferrovial enjoys a sound financial position and a level of liquidity that enables it to consider acquisition opportunities that may arise in the market. In December 2015, it made a takeover bid for the Australian services company Broadspectrum, a process that is ongoing at the time this report goes to press.
Once again, Ferrovial met the strict requirements to remain in the Dow Jones Sustainability Index, FTSE4Good and Carbon Disclosure Project index, reinforcing its commitment to corporate social responsibility and the environment. Additionally, its "Target Zero" initiative in the area of health and safety resulted in a substantial improvement in safety indices.
This performance enabled the company to remunerate shareholders satisfactorily where dividends plus share appreciation provided a total return of 31%.
2015 was another good year for Ferrovial and for its shareholders, clients and professionals. A year which evidenced the effectiveness of a strategy based on financial discipline and profitable growth focused on key markets such as North America, the United Kingdom, Poland, Australia, Colombia, Peru and Chile. As a result Ferrovial is a sounder and a more international company committed to operational excellence and innovation.
I would like to take this opportunity to thank the shareholders for placing their trust in Ferrovial and its professionals.
+10.2%9.7 B€
+4.5%1.0 B€
720 M€
1,514 M€
REVENUES
NET INCOME
EBITDA
NET CASH POSITION

MANAGEMENT REPORT

Pado
rnel
o Tu
nnel
. Zam
ora
(Spa
in)

6
2015 Management Report. Ferrovial S.A. and subsidiaries
Civilengineering
Promotion and operationof toll roads
Energy efficiency
Building
Comprehensivemaintenance ofsocial infrastructure
Waste treatment
Watertreatment
Air trafficmanagement
Ownership andmanagement
of airports
Comprehensiveservices to municipalities
Construction andmanagement of
Data Centers
Industrial construction
Urban and wastecollection services
Lighting
Construction ofrail and metro
Wastereuse
Comprehensivemanagementof gardens
Metro and trainservices
Infrastructure structuringand financing
Satellite-basedpayment system
Dynamic tolling
1. FERROVIAL AT A GLANCE
1.1 WHAT WE DO
6

XLS
Civilengineering
Promotion and operationof toll roads
Energy efficiency
Building
Comprehensivemaintenance ofsocial infrastructure
Waste treatment
Watertreatment
Air trafficmanagement
Ownership andmanagement
of airports
Comprehensiveservices to municipalities
Construction andmanagement of
Data Centers
Industrial construction
Urban and wastecollection services
Lighting
Construction ofrail and metro
Wastereuse
Comprehensivemanagementof gardens
Metro and trainservices
Infrastructure structuringand financing
Satellite-basedpayment system
Dynamic tolling

VOLUME OF PURCHASES (M€)
1,143 Services: 377 Construction: 767
MAIN PRODUCTSSteelConcreteBitumen
FuelEnergyHeavy/light-duty vehicles
CUSTOMER SATISFACTION
4 scale 1-5
1.2 FERROVIAL IN FIGURES
2015 Management Report. Ferrovial S.A. and subsidiaries
8
REVENUE (B€)
9.7 +10.2% compared to 2014
BACKLOG (M€)
31,531 Services: 22,800 Construction: 8,731
NET CASH (M€)
1,514 (Ex.Infra)
FLOW OF OPERATIONS (M€)
889 (Ex.Infra)
R+D PROJECTS CARRIED OUT
+100PROJECTS IN COLLABORATION WITH MIT
5R&D INVESTMENT (M€)
44TALENT (Training hours / employee)
22
Financial€ Intellectual
CARBON INTENSITY
-43.70%In relative terms (tCO2eq/m€)
(2009-2015)
WATER CONSUMPTION In 2015 Ferrovial developed a new
methodology for calculating the water footprint.
RENEWABLE ELECTRICITY CONSUMED
19% (100% at Amey)
WORKFORCE AT CLOSE OF YEAR (EMPLOYEES)
74,032 +7.2% compared to 2014
JOB ROTATION
3.2%EMPLOYEE ENGAGEMENT
84% Employee survey 2015
FREQUENCY RATE
-14.8%compared to 2014
COMMUNITY INVESTMENT (M€)
5 Australia, Canada, Colombia, Spain,
Ethiopia, USA, Ireland, Mexico, Mozambique, Nepal, Peru, Poland,
Portugal, United Kingdom, Senegal
BENEFICIARIES
808,281PROJECTS
395
Human
Social
Capital Capital Capital
Capital
Environmental Managementand Natural Capital
IndustrialCapital

9
22.9%
-7.2%
D14 J F M A M J J A S O N D15Source: Bloomberg
MARKETS HISTORICAL
+27%(2015)
2012 2013 2014 2015Close Price (€) 11.2 14.1 16.4 20.9Max. (€) 11.6 14.2 16.7 23.3Min. (€) 7.5 11.1 13.9 16.1VWAP (€) 9.4 12.8 15.6 19.9Daily avg. volume (M€) 42.6 48.2 42.5 55.0Daily avg. volume (M shares) 4.5 3.7 2.7 2.8Capitalization (M€) 8,215 10,317 12,029 15,270Outstanding (M shares) 733.5 733.5 732.4 732.2
HISTORICAL STOCK DATA
22.50 €86% of Ferrovial's share valuation comes from international activities.
FINANCIAL ANALYSTS
24 financial analysts had effective coverage of Ferrovial as of Dec 2015
SellHoldBuy
CONSENSUS TARGET PRICE
42%
8%
50%
CAPITALIZATION (B€)
15.3 TOTAL SHAREHOLDER RETURN
+31.4%CREDIT RATING
BBB
FERROVIAL
FERROVIAL
Ferrovial Chairman owns 20.3% of the share capital.As of 14th January 2016
OWNERSHIP STRUCTURE
BlackRock Free floatFounding family members
SHAREHOLDERS BY COUNTRY
SpainUnited Kingdom and IrelandNorthamericaRest of EuropeRest of the world
62%
3%
11%
7%
32%
29%
21%
35%
89% international
Source: IPREO (Sep. 2015)
SHAREHOLDER STRUCTURE
CAPITAL MARKET PERFORMANCE
FERROVIAL 2015 STANDARD & POOR'S AND FITCH
Share buyback Dividend
Dividends paid in 2014 and 2015 included a scrip dividend and sharebuyback program.
SHAREHOLDER REMUNERATION (M€)
+4.4%(2015/2014)
Source: Bloomberg
Ferrovial Eurostoxx-construction IBEX35
86%
17%2%
54%
27%23%
23%26%
17%
4%
21%
-7%
2013-2015
2015
2014
2013
AS OF 31ST DECEMBER 2015
AS OF 31ST DECEMBER 2015
2010 2011 2012 2013 2014 2015
235 265

Toll Roads Construction Services Airports
Australia
Ireland
Saudi Arabia
Oman
France Greece Portugal
Canada
USA
Colombia
Brazil
Chile
Qatar
United Kingdom
Spain
Poland
1.3 GLOBAL PRESENCE10
2015 Management Report. Ferrovial S.A. and subsidiaries

France Greece Portugal
11
0 20 40 60 80 1000 20 40 60 80 100
0 20 40 60 80 100
EMPLOYEES: 74,032
OPERATING CASHFLOW: 889 (EX INFRA) (M€) REVENUES: 9.7 (B€) EBITDA: 1.0 (B€)
7% 7%
13%
6%28%
39%
36% 9%
16%39%
0 20 40 60 80 1000 20 40 60 80 100
BACKLOG: 31,531 (M€) ASSETS: 25,384 (M€)
7,831
2,557 2,071 1,634
17,438
6,114
2,2501,227
4,335
11,458 38,062
20,798
2,4064,638
8,128
Spain United Kingdom USA and Canada Poland Others
Spain United Kingdom USA and Canada Poland Others
0 20 40 60 80 100
4%
22% 26%
16%32%
MAIN FIGURES: CONTRIBUTION BY COUNTRY
MAIN FIGURES: ABSOLUTE FIGURES BY COUNTRY

2. STRATEGY AND VALUE CREATION12
BUSINESS MODEL, VISION AND VALUES Ferrovial is one of the leading global providers of infrastructure and services to cities. Its business model is focused on the full infrastructure lifecycle: Design, Financing, Construction, Operation and Maintenance.
Ferrovial's vision is to shape the future through the development and operation of sustainable infrastructures and cities, while being committed to the highest level of safety, operational excellence and innovation. It aims to create value for society and for its costumers, investors and employees.
ENVIRONMENT
The current environment presents a number of opportunities and challenges that directly affect the infrastructure sector.
Opportunities Among others, we can highlight the following opportunities:
1. Population growth and urban concentration. The "global urbanization" continues and the United Nations forecast that more than 6 billion people will be living in big cities by 2045, which is equivalent to the entire global population in the year 2000.
This trend will increase demand for new social and transport infrastructure, as well as for services capable of addressing challenges such as traffic congestion and environmental sustainability.
2. Climate change and other environmental aspects. The fastest growing CO2 emissions in recent decades are those associated with passenger transport, generating around 25% of total global emissions. Cities and buildings generate more than 30% of global greenhouse gas emissions. Therefore, when developing infrastructure it is increasingly important to design environmentally-sustainable solutions, as well as to pursue energy efficiency.
3. Financial resources available. Governments find themselves with limited resources to address new infrastructure requirements, mainly due to budget constraints. This has paved the way for private capital to play a greater role in infrastructure projects.
4. Development of new technologies. Innovations around the "Internet of things" are increasingly present in the sector. New technologies applied to infrastructure construction, operation and
2015 Management Report. Ferrovial S.A. and subsidiaries
2.1 GLOBAL STRATEGY
INNOVATION ProgressTransformInspire
CORPORATE VALUES
Ferrovial
VALUE CREATION
Ferrovial creates value with an industrial approach in the global infrastructure cycle, fosusing on three differential capabilities:
■■ Managing risks and minimizing them at the different stages.
■■ Offering innovative solutions to its clients.■■ Generating operational efficiencies in projects.
This approach seeks to increase cash generation and profitability in construction and services contracts and to increase the value of infrastructure projects. The final objective is to crystallize the value in a greater flow of dividends or in the subsequent sale of assets.
Ferrovial's strategy is based on four pillars:■■ Profitable growth■■ Internationalization■■ Operational excellence and innovation■■ Financial discipline
Finally, Ferrovial considers that all its activities must be sustainable, from an economic point of view and from a social and environmental standpoint.
EXCELLENCE Efficiency ResultsReliability
RESPECT Safety CareProtect
INTEGRITY EthicsTransparency Responsibility
COLLABORATION TeamworkCooperateShare

Anexo. Ferrovial S.A. y Sociedades dependientes
13
services allow companies substantial opportunities to differentiate from competitors in terms of managing complex projects and offering unique solutions to clients.
5. Globalization. The increasing integration of economies around the world and the consequent growth of international trade will require more investment in transport infrastructure. This represents an international growth opportunity for infrastructure companies.
The combination of these five factors promises sustained market growth going forward. The World Economic Forum estimates that 3.7 trillion dollars will have to be invested in infrastructure annually. However, at the current pace the World Bank calculates that around one third of these investments will not be forthcoming. This will bring important opportunities for infrastructure companies, and Ferrovial is in a strong competitive position to capitalize them.
Challenges
The development of the infrastructure market is also set to pose a number of challenges and risks that warrant consideration:
1. The economic context. Investment decisions with regard to infrastructure projects are vital for the economic development of countries, and also have a significant impact on public finances.
Macroeconomic trends may directly affect the performance of contracts.
2. Increased competition. There has been increasing interest in infrastructure projects from funds due to the market liquidity and the need to secure long-term investment opportunities. Aditionally, there has been an increase in the number of construction firms or services companies that have benefited from significant infrastructure development in their own countries, and now grow at a global scale. Finally, there is a growing presence of technology companies in areas of infrastructure. The emergence of these new competitors may affect returns on new projects, an will require differentiation based on competitive advantages.
3. Complex projects with significant execution risks. Decisions made in initial project stages have a decisive impact on medium and long term profitability. Efficient risk management is therefore essential, from the contracting stage, partner selection, closing the offer, and to the execution stage.
4. Regulation and legal certainty. In many cases infrastructure development is dependent on governments, as these are normally regulated or publicly tendered activities. Actively managing regulatory issues is therefore key, as changes could potentially affect the evolution of projects and markets.
Ferro
vial S
ervic
es H
eado
ffice
. Mad
rid (S
pain
)

14
STRATEGY
Based on this business environment, Ferrovial develops its strategy with a focus on creating value for shareholders as well as for its customers, employees and society as a whole.
Ferrovial strategic priorites are as follows:
1. Profitable growth. Ferrovial combines organic growth -focusing on profitability- with selective acquisitions to complement the firm's competitive position and add to its capabilities.
To ensure this profitability, the industrial approach is considered essential, to develope complex projects and value-added services in the business lines in which the group operates (Services, Highways, Construction and Airports).
In the future the company may participate in new sectors or associated activities that generate synergies with existing businesses with the objective of developing a significant presence in the medium term, while maintaining the industrial approach.
2. Internationalization. The countries of interest are identified selectively based on a set of criteria that includes, among others, growth expectations, legal certainty and the existence
2015 Management Report. Ferrovial S.A. and subsidiaries
of developed financial markets. The company currently has a significant and stable presence in five countries: Spain, the United States, the United Kingdom, Canada and Poland.
The aim is to continue driving operations in these countries while also developing new markets. One example of a market where Ferrovial is building a stable presence is Australia, where it already manages services and construction contracts, and has recently won a toll road concession.
3. Operational excellence and innovation. These are key drivers for efficiently managing complex operations, developing outstanding solutions for clients and generating recurrent cash.
This priority is based on a number of key elements including:
■■ The capacity to manage complex projects and appropriate risk management, which are essential to ensuring higher returns. Managers constantly seek for alternative technical and operational solutions for optimal efficiency. This is supported by the Ferrovial team that has the necessary talent to maximize the value of projects and contracts.
■■ Innovation is a key driver of differentiation that allows business units to provide solutions to client needs and is used to generate sustainable competitive advantages.
Euro
scut
Aço
res (
Portu
gal)

Anexo. Ferrovial S.A. y Sociedades dependientes
15
■■ Quality is a hallmark of Ferrovial; it reflects a way of doing things that translates into increased satisfaction for customers and users of infrastructure and services, as well as greater value added for the company.
■■ Safety is a priority in all business areas. Active efforts are made at the senior management level and throughout the organization to optimize and improve safety for Ferrovial employees and for the users of its infrastructure.
■■ The focus on environmental issues is embodied in the development of projects and services aimed at reducing the carbon footprint. In addition, environmental issues are also a business opportunity for Ferrovial to leverage.
4. Financial discipline. This is a key differentiating factor in all of Ferrovial activities, and is implemented in a number of ways.
■■ ■Comprehensive cost control in all stages in each project.
■■ Tracking cash generation in contracts to optimize treasury levels at all levels of the organization.
■■ Asset rotation to crystallize the value of investments and fund future growth.
■■ Maintaining an "investment grade" corporate rating, to ensure low debt levels and competitive financing costs, and to ensure its capacity for sustainable growth.
■■ ■Finally in this section, a commitment to transparency with investors, shareholders, rating agencies and bondholders is also an important aspect. This helps to build trust and ensures permanent access to financial markets under optimal cost and time conditions.
Alongside these four pillars of the strategy, it is important to highlight the integrated approach that allows Ferrovial to participate in all stages of the infrastructure cycle. It therefore aligns the interests of the businesses that construct, maintain, promote and operate, thus minimizing risks and maximizing returns throughout the life of the contract.

16
2015 Management Report. Ferrovial S.A. and subsidiaries
0 20 40 60 80 100
ACTIVITY
Cintra is a world leader in the private development of transport infrastructure, both in terms of the number of contracts and the volume of investment, which in total exceeds 20 billion euros, running innovative projects and high quality standards. At year-end 2015 it managed a portfolio of 27 concessions totaling nearly 1,877 kilometers. The company is currently present in Canada, the United States, Spain, the United Kingdom, Portugal, Ireland, Greece, Colombia and Australia.
THE SCENARIO
The environment in which Cintra has developed its business on a global level, a high need for new infrastructure, including those that solve the problems of traffic congestion, resulting from the concentration of population in urban areas. These infrastructures require high funding, which, given the budgetary constraints in the public sector, are increasing the need for the private sector. Furthermore, competition is growing, mainly in projects that have already been built and mature ("brownfield") where the presence of infrastructure and pension funds is growing.
MANAGED INVESTMENT: 20.3 B€
MAIN ASSETS
Its main assets include:
407 ETR Toll Road. Toronto (Canada). This project, in which Ferrovial has a 43.23% stake, has developed the Free Flow tolling system that prevents users from having to stop at the entry and exit arches. These detect vehicles through license plate transmitting devices, calculate the route and manage billing. The concessionaire is free to modify the rates provided the traffic remains above a minimum level. Thus, the user pays a toll that is adjusted to the time saving offered by the highway.
Managed Lanes. Texas (USA). For the NTE and LBJ Texas highways, in which it holds a 56.7% and 51% stake, respectively, Ferrovial has refurbished the existing road and built innovative toll lanes without barriers. In these last lanes rates are dynamic and are adjusted according to the average speed or the number of vehicles using the expressway lanes, guaranteeing a minimum speed for drivers.
RISK REDUCTION OR DE-RISKING
The price we pay for a concession is determined by the internal rate of return (IRR) to which it is tendered, which is the result of adding to the risk-free rate a risk premium that takes into account the risks assumed by shareholders when they invest in the concession (construction, financing, operation and traffic, mainly). Based on this IRR, Cintra seeks to reduce or eliminate such risks as the concession progresses. This
decreases the risk premium demanded by the market on the valuation of assets, which in turn increases their value. This value creation process does not require the user volume to exceed the forecast, but rather fulfill what was initially estimated.
Management of financial risks seeks to adapt debt to the cash flow generation of the project with robust financial structures and the appropriate rating.
USACanadaSpainUK and IrelandRest of EuropeRest of world
2.2 TOLL ROADS
13%
7%
8%
21%
44%
CONCESSIONS
IN 9 COUNTRIES27 1,877
KILOMETERS OPERATING CASHFLOW (M€)
OF TOLL ROADS
7%
VALUE CREATIONThis is based on three pillars
■■ Reducing operating and financial risks (de-risking).■■ Realization of higher cash flows through the constant search for operational efficiency.■■ Renegotiation of concession contracts and/or financing in response to changes in their circumstances, or those of the financial markets.
The company's strategy is based on:
■■ Promoting new high-complexity construction projects ("greenfield"), while leveraging synergies with the construction business (Ferrovial Agroman) to meet customer needs.
■■ Crystallization of the value created by the rotation of mature assets.
Besides, the company is committed to society through the development of socially-responsible infrastructure.
26728% OF TOTAL CASHFLOW (EX-INFRA)

17NTE and LBJ Toll Roads. Texas (USA)Awarded in 2009, they began operating in 2014 and 2015, respectively, both ahead of schedule (nine months for the NTE and three months for the LBJ), having already consequently eliminated all risk related to construction. After a year of operation, the NTE has double-digit quarterly growth in traffic and revenue.
OPERATIONAL EXCELLENCE Cintra also focuses on increasing cash flows compared to the initial forecast through greater operational efficiency. To do this, best practices in all concessionaires are applied by incorporating the most advanced technology and seeking synergies with other toll roads managed by the company. The goal is to ensure user satisfaction while maximizing flows.
Big DataIn 2015 the enormous amount of information generated by the traffic that accesses our highways in Dallas began to be registered to, at a later stage and by using Big Data techniques, perfect the dynamic pricing algorithm for optimizing revenue that we have been developing in recent years.
New toll payment methodsAlso in 2015 a new development was completed, which is based on a mobile application with satellite technology. This will make it possible to pay without the need for the usual devices to pay the toll without stopping, or additional road infrastructure.
RENEGOTIATION OF CONTRACTS
Sometimes, as a result of either changing needs of the government over time or changes in the characteristics of the corridors where the infrastructure or changes in the situation of financial markets is implemented, concession contracts and/or financing are renegotiated. In these cases, Cintra proposes solutions to government bodies or financial institutions that, while solving their problems, improve the risk profile of the asset and/or cash flow generation for shareholders.
Agreements in PortugalMeeting the needs of the Portuguese State, after the troika bailout, in 2015 Cintra renegotiated the concession contracts in Portugal for the Norte Litoral and Algarve highways to replace demand risk by counterparty risk, resulting in assets with a lower risk profile.
HIGH-COMPLEXITY GREENFIELD PROJECTS Cintra primarily focuses its strategy on investment in "greenfield" projects as these are the ones in which Cintra and Ferrovial Agroman are more competitive because of their higher level of complexity and therefore the high potential to create value. The company is more competitive in such complex contracts, thanks to its expertise as a premium integral operator, backed by a 45-year track record in the industry.
Cintra's collaboration with Ferrovial Agroman in tenders generates two additional competitive advantages. On the one hand, the experience and value of the construction company's Technical Office makes it possible to optimize the design and thus improving construction prices for the client (i.e. being more competitive), while maintaining adequate profitability.
On the other, the two businesses are part of Ferrovial and thus both are aligned in seeking the best solution that minimizes the initial investment, operating costs and future maintenance, while maximizing revenue collection. This also helps to attract financial investors.
Toowoomba Highway. Queensland (Australia)
After only two years in the Australian market, Ferrovial managed to get a leading local financial partner to invite it to participate in the project. The consortium submitted, in 2015, the most competitive and profitable bid thanks to the combination of the financial capabilities of the Australian partner with Cintra's skills to negotiate supply and those of Ferrovial Agroman to offer an optimal constructive solution at the best price.
TURNOVER OF MATURE ASSETS After reducing risks during the de-risking process, the value created is crystallized by the sale of mature projects to other investors, channeling the proceeds toward investment in new assets that are more capable of creating value (higher risk premium).
Chicago Skyway. Illinois (USA)In November 2015 an agreement with a consortium of Canadian pension funds was announced for the sale of the Chicago Skyway for $2.836 billion. The operation will be finalized in 2016 and Ferrovial will receive about $269 million.
SOCIALLY-RESPONSIBLE INFRASTRUCTURES Due to its high complexity, innovation and efficiency, the projects developed by Cintra offer sustainable solutions that improve congestion in big cities, reduce pollution, decrease the number of accidents, raise user satisfaction and, ultimately, contribute substantially to improve the quality of life of people.
Reduction of emissions on the NTE and LBJ. Texas (USA)Thanks to efficient traffic management, Managed Lanes significantly reduce the amount of stopping and starting that cars are required to perform, thus relieving congestion in the metropolitan area of Dallas, one of the busiest areas of major urban growth in the U.S. They represent a sustainable solution that contributes indirectly to significantly reduce CO2 emissions.

2.3 SERVICES 18
2015 Management Report. Ferrovial S.A. and subsidiaries
REVENUE (B€)
66% INTERNATIONAL
4.9 22.8 289BACKLOG (B€) OPERATING CASHFLOW (EX-INFRA) (M€)
73% INTERNATIONAL 30% OF TOTAL
OFFERING OF SERVICES PROVIDED IN AN INTEGRATED MANNER
The company offers a wide range of services, such as consulting, building and infrastructure maintenance, energy efficiency and environmental services in various areas, including cities, transport and social infrastructure, industries, utilities and waste treatment infrastructure.
Its main clients include local governments, health and justice bodies and government officials in charge of public health and roads, railroads and airports, and utility companies in Spain and the United Kingdom.
Marqués de Valdecilla University Hospital. Santander (Spain)After completing the work in record time, during 2015 the new hospital has been equipped for the integrated delivery of 12 non-clinical services, and the transfer of all activities to the new infrastructure has been initiated. The Smart Hospital concept has therefore materialized, which combines innovation, operational excellence, the use of new technologies and a collaborative model of long-term strategic alliances.
ACTIVITY
Ferrovial Services is a benchmark in the operation, maintenance and management of facilities and public and private infrastructure. It performs all activities in the value chain, from consulting, design and operation, to the life cycle management of assets.
Ferrovial Services focuses its efforts on designing operational and efficient solutions through the pursuit of excellence, which make it possible to firstly meet the needs of citizens, and secondly, to encourage innovation and the professional and personal development of its employees.
With a total turnover of 4.9 billion euros, 34% of which was generated in Spain and 63% in the UK. Ferrovial Services figures among the top three service providers in both countries.
ENVIRONMENT
The environment in which Ferrovial Services operates is characterized by a growing population in cities, which is driving the demand for more specialized and higher-quality urban services. Furthermore, a decline in available financial resources and tighter budgetary controls at governments mean greater opportunities for the private sector, through innovative solutions. In addition, increasing social awareness for protecting the planet's resources has created new regulations with environmental objectives, for both public organization and private companies.
VALUE CREATION■■ Wide offering of services provided in an integrated manner.■■ Activity focused on managing asset to optimize their life cycle and profitability (“Asset Management”).■■ Focus on operational excellence and flexibility.■■ Development of innovative and proven solutions.■■ Selective acquisition of companies that makes it possible to develop new skills and provide additional services.
ASSET MANAGEMENT
Through a detailed study of the needs of each client, Ferrovial Services acquires a deep knowledge of its assets and helps it to take steps focused on improving operational efficiency and promoting the integration of services at each facility.
Tube Lines. London (United Kingdom) 2015 saw the achievement of the efficiency targets that were set out in the management contract of the assets in three lines (Jubilee, Northern and Picadilly) of the London Underground, which is in its final phase (Dec. 2017), at which time its achievement can be assessed. With the implementation of Asset Management, from 2003 to 2015 the number of lost customer hours has been reduced by 69%.
OPERATIONAL EXCELLENCE AND FLEXIBILITY
The pursuit of excellence and operational flexibility are essential capabilities to serve very large groups, which can produce numerous incidents and where service relevantly affects the quality of life of users.

19
United Utilities, Liverpool and Manchester (United Kingdom)
The maintenance of 76,000 kilometers of drainage and 42,000 kilometers of water infrastructure in Liverpool and Manchester is a contract in which flexibility is essential to serve more than seven million users, with more than 7,000 calls per week and more than 40,000 annual incidents. The provided solution has reduced the number of complaints and improved customer service to currently make it the company in the management of water and waste that is best rated by its users.
INNOVATIVE AND PROVEN SOLUTIONS
To cope with the new challenges of society and reduction of available resources, Ferrovial Services offers its customers new ways of working through effective and proven solutions developed through four competency centers formed by multidisciplinary teams of experienced experts with first-rate technical knowledge, integrators of the company's know-how and experience that operate transversely and apply the lessons learned from previous projects.
The Competence Centers design applications and enhancements through innovation that increase the level of service delivery, meet the needs of citizens and improve sustainability and the environment:
■■ Asset Management: Specialized in consulting, designand asset management. Its more than 3,000 engineers,consultants and line personnel seek to balance costs andrisks and prolong the life cycle of infrastructure.
■■ Cities: It develops programs, solutions and models forurban services, in collaboration with the cities and the mostadvanced urban agents (Public authorities and privatetechnology companies that put their efforts into developingthese services).
■■ Infrastructures: Focused on optimizing energy efficiencyservices, comprehensive facility management, infrastructure maintenance and utilities services. It also specializes incodification of standards and analysis of best practice.
■■ Environment: It offers full technical, administrative and legal support throughout the lifecycle of environmental assets:from the initial study, adapted design, tendering process,supervision during construction work and post-constructionassistance, to the research and development of solutions for waste management, treatment and recycling.
Waste Recycling: Energy from Waste
The company is committed to harnessing the latest technology to maximize recycling and energy recovery from waste, while minimizing its environmental impact. Ferrovial Services currently generates more than 130,000 MWh of electricity annually, as a result of the energy recovery of landfill biogas and biomethane processes. It has thus avoided the emission into the atmosphere of more than 970,000 tons of CO2 per year, which would be equivalent to removing 491,000 diesel cars from circulation for a year. In addition, it has various Solid Recovered Fuel (SRF) production plants in operation, which are prepared from non-hazardous waste for energy recovery.
Isle of Wight (United Kingdom)
This 25-year integrated waste management contract for the 140,000 inhabitants of the island has benefited from the experience of Ferrovial Services in several treatment plants in Spain. The company separates municipal waste from mixtures of recycled waste in the same facility and obtains finished products that are packaged and stored separately to prevent contamination between both products. It also provides high levels of recycling, with recovery rates of 6% for municipal waste and 80% for recycled mixtures.■
SELECTIVE ACQUISITIONS
Purchasing companies with complementary activities makes it possible to develop new skills and provide additional services. Ferrovial Services has proven experience in these types of processes, integrating the activities of acquired businesses and achieving significant synergies.
New acquisitions in Poland and United Kingdom
The acquisition of two companies in Poland (Amest Kamiensk and Pro EKO Natura) allows Ferrovial Services to increase its presence in the field of waste treatment, while expanding its commercial presence in the Central and South-West regions.
The acquisition of TPT UK, a strategic consulting and Asset Management company in the United Kingdom allows Ferrovial Services to increase its capabilities in the field of railroad transport, maximizing business opportunities and improving customer service.
Site
insp
ectio
n w
ork o
f Yor
kshi
re W
ater
(UK)

20
2015 Management Report. Ferrovial S.A. and subsidiaries
0 20 40 60 80 100
2.4 CONSTRUCTION
BACKLOGREVENUES (B€)
80% INTERNATIONAL
4.3 8.7 272BACKLOG (B€) OPERATING CASHFLOW (M€)
81% INTERNATIONAL 28% OF TOTAL CASHFLOW (EX-INFRA)
RISK MANAGEMENT
The construction business is characterized by large volumes and tight margins, all amid high levels of competition. Value creation is therefore driven by good risk management, seeking to minimize risk in the bidding and execution stage. Limiting potential errors is sought in the bidding phase by choosing countries with a sufficient level of physical and legal certainty, and in which Ferrovial has a stable presence. Projects with a high technical complexity are also selected, in which the differential factor is not only the price, and thus asserting Ferrovial Agroman's competitive advantages and technical management. The project managers also pay special attention to hiring, selecting partners and closing the offer, to avoid errors in the price, terms and conditions of the contract, which are difficult to solve in the execution phase
Crossrail, Thames Tideway and Northern Line Extension. London (United Kingdom)
In 2015 the implementation of the extension of the London Underground Northern Line begun, from Kennington Station in south London. Works include the construction of two new stations, Nine Elms and Battersea and a 6-kilometer tunnel.
Also in 2015, Ferrovial Agroman was selected to build the central section of the Thames Tideway Tunnel, which is a new tunnel of almost 13 kilometers that will join the London sewerage system avoiding the dumping of raw sewage into the River Thames and stopping the overflow from various points in the network.
These two new tunneling works, together with the work on Crossrail that has been running for several years and which crosses from east to west London with two tunnels and several stations, are being carried out successfully in the London Underground, which is one of the cities with real estate heritage and historic buildings with the highest value in the world. The fact that this work has been contracted is a good sign of confidence by the country's and local authorities in Ferrovial Agroman's control of risks, having nominated it to execute several tunnels with a high technical complexity.
ACTIVITY
Ferrovial Agroman is the division of the Ferrovial Group that carries out civil engineering, construction, water and industrial projects. It is internationally renowned for its design capacity and construction of exceptional projects of all kinds, and primarily for its major transport infrastructures. It has a stable presence in diverse strategic markets, most notably the United States, Spain, Canada, UK, Australia and Poland.
Its extensive experience is endorsed by having implemented more than 520 km of tunnels, 19,800 km of roads (including 4,300 km of highways) and 5,100 km of railroad lines (including 860 km of high-speed lines).
It also stands out for its commitment to safety and the environment, as proven for example by the various awards given to the design and
construction project of the North Tarrant Express Highway in United States (including the Best Safety Award from the prestigious Engineering News Record and the Globe Award from the American Road and Transportation Builders Association for environmental planning and relationship with the environment).
ENVIRONMENT
The market in which Ferrovial Agroman works is still affected by a significant reduction in activity in Spain that thanks to the company's strategic approach, has been offset by the favorable developments and good prospects throughout the rest of the countries in which Ferrovial operates. In any case the international market has an increasing level of competition from both global and local construction companies.
VALUE CREATION ■■ Risk management in tenders.■■ Specialization in unique buildings of high technical complexity.■■ Integrated approach with Highways,Airports and Services divisions, providing an overall solution to the customer.■■ Geographic growth based on selective criteria.■■ Financial discipline focused on cost controlsand cash generation.■■ Talent management.■■ Focus on quality, safety and reducing the environmental impact.
Civil workIndustrialEdification
81% 12%7%

21
UNIQUE AND COMPLEX WORKS
Ferrovial Agroman seeks to stand out, right from the design phase, backed by the proven experience of its Technical Office. The aim is to find optimal engineering solutions for both the client and the development of the project, both in the bidding phase and during its execution.
LBJ Toll Road. Texas (United States)
This highway was opened in 2015 (3 months ahead of schedule) and is an example of innovation and creating added value for the customer. In the bidding stage Ferrovial Agroman offered an alternative to the tunnel originally proposed by the Texas Department of Transportation. It developed a detailed traffic management plan that allowed Managed Lanes or barrier-less toll lanes to be created. This solution reduced both construction costs and construction risks significantly. Similarly, already in the execution phase, a new design of the intersection between the IH-635 and the Dallas North Tollway was proposed. This avoided additional expropriations and environmental permits. Without these innovations, the project probably would not have been financially feasible.
INTEGRATED APPROACH
Ferrovial Agroman's partnership with Cintra, Ferrovial Airports and Ferrovial Services optimizes managing risks between the manufacturer and concessionaire. Aligning the interests between the manufacturer and the operator of the infrastructure manages to maximize competitiveness in bids and facilitates achieving the Group's profitability objectives and also the project's cash management.
Extension of the 407 Highway East Phase 2. Toronto (Canada)Beltway in the city of Toowoomba. Queensland (Australia)Bucaramanga Toll Road. Santander (Colombia)
In such a competitive market like this, the success of the collaboration between Cintra and Ferrovial Agroman has resulted in the concession in 2015 of the three new major highway projects listed, which together represent more than 1.6 billion euros in investment in construction alone (at 100%). The keys to this achievement include: differential technical solutions with design optimizations and alternatives that were not raised by the customer, an optimal distribution of risks between the construction company and the concessionaire and the technical and financial contribution of Cintra.
SELECTIVE INTERNATIONALIZATION
Ferrovial Agroman keeps its international focus mainly on five countries where there is lack of infrastructure and capacity to finance reducing this deficit: United States, United Kingdom, Poland, Canada and Australia. Based on our strategy, we avoid bidding for smaller projects in new countries, keeping attention on the countries where we operate, unless these works offer an opportunity to enter a new market of interest and provide an important learning opportunity.
FINANCIAL DISCIPLINE AND COST CONTROL
For several years the company has had a much higher continuous return on sales than its main European competitors.
In Ferrovial Agroman's corporate culture cost control and planning of the work is essential and proprietary tools have been developed to control the degree of detail required, so that they are easy to monitor and audit. Similarly, the result of the work and the transformation of this operating result in the flow of operations is closely monitored.
In 2015 the prestigious multinational SAP granted Ferrovial Agroman the Silver SAP Quality Award for Business Transformation in Europe, Middle East and Africa, for the development and launch of the inSite system, the in-house tool used to manage the firm's projects financially and administratively as well as the technical and operational side. The system covers all processes involved in works, from the contract award to delivery to the client: sales and certification, planning and budgeting, procurement, warehouse management, production, finances and human resources.
TALENT MANAGEMENT
Ferrovial Agroman stands out for the experience and high professional value of its engineers, and has historically been able to retain the talent of its best professionals within the company. Ferrovial Agroman looks to generate experience in new hires and to manage to retain more young people by offering them attractive opportunities.
In 2015 the average seniority of the workforce is situated in seven years, with more than 15 years in the case of the management team.
QUALITY, SAFETY AND ENVIRONMENTAL IMPACT
Quality and Safety are always a priority for Ferrovial Agroman due to the demanding technical complexity of its projects.
To meet Ferrovial's goal of "zero accidents" (Target Zero), the company takes a variety of approaches to safety and implements innovative solutions (see the section on Health and Safety).
The commitment to the environment results in solutions that reduce the maximum impact of its activity, with several works having won awards in demanding markets such as the UK or US.
LBJ and NTE Toll Roads. Texas (United States)
In the LBJ project, finished in 2015, Ferrovial Agroman successfully completed, and in record time, reassessments under the National Environmental Policy Act (NEPA), the US environmental law.
The NTE Highway, was awarded in 2015 for its safety, been its accident rate less than one third of the US national average.

22
2015 Management Report. Ferrovial S.A. and subsidiaries
ACTIVITY
Ferrovial Airports encompasses all airport management activities at Ferrovial . The company, one of the leading private operators in the sector, operates four airports in the United Kingdom.
THE SCENARIO
The airport market is characterized as being a regulated market with very demanding frameworks. The environment today is characterized by a growth in air traffic worldwide. In addition, increased interest is observed and competition is intensifying via infrastructure and pension funds when investing in airport assets.
OPERATIONAL EXCELLENCE
In both Heathrow, a regulated airport, as well as Aberdeen, Glasgow and Southampton, unregulated airports, Ferrovial Airports seeks greater efficiency in operating costs and financial structure, developing innovative business solutions that improve the passenger experience and builds good business relationships with airlines.
HeathrowDuring 2015 the growth in non-aeronautical revenues at Heathrow made it possible to increase sales by 2.8% over the previous year, while the commitment to service quality and the continuous improvement of operations earned it the award by ACI Europe of the Best European Airport of the Year in the category of over 25 million passengers. The cost control effort is maintained with a small reduction in homogeneous costs. Operating expenses throughout the year include £50 million for the operation of the new T2 and the opening of the integrated bagagge facility in T3. This is offset in part by savings of around £30 million related to the early closure of T1.
VALUE CREATION■■ Efficient asset management, understood as:
■■ Continuous improvement of operating costs. ■■ Development of innovative business solutions that improve passenger satisfaction. ■■ ■Optimizing financing structure.
■■ Development of new projects offering a comprehensive service that includes the design, construction, financing and efficient operation of airports, leveraging the capabilities of our Construction and Services businesses and experience acquired in managing an asset such as Heathrow.
■■ Innovation to implement initiatives that reduce the environmental footprint and are responsive to the needs of community as part of airport operations.
Also during 2015 significant improvements were made in the integrated baggage system in Terminal 3 and the shopping area in Terminal 5 was transformed. The latter received three awards at the 2015 Skytrax World Airport Awards, including Best Airport Terminal in the World and the Best Shopping Area in an Airport.
Aberdeen, Glasgow and Southampton (AGS)In 2015 the three airports launched 23 new routes and began to serve 5 new airlines, key data on the growth of 5.1% in the number of passengers to reach 14 million. Aberdeen has inaugurated a parking lot and a passenger pick-up area, driving up unitary parking revenues by more than 7%. Glasgow was one of the fastest growing airports in terms of the number of passengers in Europe in 2015 according to ACI Europe. To offer the best service, Glasgow has remodeled its terminal to make it possible to handle 750,000 additional visitors per year.This facility also received numerous awards such as the Airport of the Year for the UK in the National Transport Awards, the Best Airport between 3 and 10 million passengers by the Airport Operators Association (AOA) and the Airport of the Year in Scotland in the Scottish Transport Awards.
2.4 AIRPORTS
MAIN ASSETS
Ferrovial is the largest shareholder and industrial partner in Heathrow Airport Holdings) HAH, Europe's biggest hub and one of busiest airports anywhere in the world, via a 25% stake in Heathrow Airport Holdings (HAH).
It also operates the unregulated airports of Aberdeen, Glasgow and Southampton (AGS), in which Ferrovial is an industrial partner with a 50% stake.
In total Ferrovial Airports handles 89 million passengers, 183 destinations and 80 airlines. 81% of passengers rate their experience at the four airports as either "Very good" or "Excellent", according to the Independent Airport Service Quality Survey conducted by Airport Council International (ACI).
PASSENGERS
MILLION89 132 183
DIVIDENDS RECEIVED (M€) HEATHROW DESTINATIONS
14% OF TOTAL CASHFLOW (EX-INFRA)

23
VALUE CREATION■■ Efficient asset management, understood as:
■■ Continuous improvement of operating costs.■■ Development of innovative business solutions that improve passenger satisfaction.■■ ■Optimizing financing structure.
■■ Development of new projects offering a comprehensive service that includes the design, construction, financing and efficient operation of airports, leveraging the capabilities of our Construction and Services businesses and experience acquired in managing an asset such as Heathrow.
■■ Innovation to implement initiatives that reduce the environmental footprint and are responsive to the needs of community as part of airport operations.
INTEGRATED APPROACH
The integrated approach with the Construction and Services businesses, together with the experience in management and financing capacity of Ferrovial Airports, generate unique capabilities in tenders that differentiate the company from other competitors such as infrastructure funds, pure airport operators or construction companies.
Tenders In 2015 Ferrovial Airports has been analyzing investment opportunities in various geographies, North America, Latin America and Europe.
REDUCTION OF ENVIRONMENTAL IMPACT
Ferrovial Airports is firmly committed to innovation, the sustainable growth of its facilities and addressing the needs of local communities.
The company has an ongoing relationship with the government to address infrastructure development needs.
HeathrowIn 2015 Heathrow received a plethora of awards for its efforts in innovation, such as the ACI Europe "Eco-innovation" award for reducing emissions. It also has a fleet of green vehicles recognized by Green Fleet Magazine as the best in the UK at a major corporation. Heathrow has also set up the world's largest employee car sharing program.
Finally in July 2015 the Davies Commission recommended the construction of a third runway at Heathrow Airport as the best option to address the increase in air traffic in the southeast of England. During 2016, Heathrow will continue to work with the British government to ratify this recommendation.
Heat
hrow
Airp
ort,
Lond
on. U
nite
d Ki
ngdo
m

Results January - December 2015. Ferrovial S.A. & subsidiaries
24 3. FERROVIAL 2015
3.1 FINANCIAL CAPITAL: BUSINESS PERFORMANCE A. GENERAL OVERVIEW
In operating terms, 2015 was notable for the traffic growth at infrastructure assets: toll roads in Europe, the US and Canada, as well as at Heathrow Airport and the regional airports in the UK (AGS).
The combined Construction and Services order book (including JVs) amounted to more than EUR31,500mn. Ferrovial was awarded some important contracts in reference markets (the US and Canada), as well as in new markets such as Australia, Colombia (Bucaramanga-Barrancabermeja-Yondó) and Slovakia (Bratislava beltway), the latter in January 2016.
Over the course of the year, the company disposed of mature assets:
In 4Q15, Ferrovial reached agreement with a consortium ofCanadian pension funds for the sale of the Chicago Skywaytoll motorway (55% owned by Cintra), which will imply USD269mn for Ferrovial pre-tax. This transaction is expected to be completed in 1Q16.
In 3Q15, Ferrovial reached agreement with the Dutch fundDIF for the sale of part of the M4 and M3 toll roads in Ireland for EUR61mn. This deal is expected to be completedin 1Q16.
In 2Q15, the creditors of the Indiana Toll Road formalised thesale of the concession to the Australian fund IFM Investors (for USD5,725mn), of which Ferrovial received USD50mn, asagreed.
In December, a bid was made for 100% of the shares in the Australian company Broadspectrum (formerly Transfield Services), for AUD1.35 per share in cash.
The group has taken advantage of the favourable economic environment to reduce its financing costs and extend its debt maturities.
A66 toll motorway Benavente-Zamora: EUR185mn 26-year bond issued, with an annual coupon of 3.169%.
407ETR: CAD150mn 30-year issuance with a coupon of3.3% and CAD500mn 31-year issuance at 3.83%.
Heathrow: issuance of GBP1,200mn, notably EUR750mn at 15years and 1.5%; and CAD500mn at 10 years with a coupon of3.25%.
Extension of Ferrovial’s line of liquidity to EUR1,250mn (vs.EUR750mn previously), at 5 years (2020) and a reduction inthe spread to 50bp, signed by 22 banks.
2015 saw the financial closing of:
Toowoomba Second Range Crossing, in Australia, with aninvestment of AUD1,100mn and an operating life of 25 years.
407 East Partial Extension Phase 2, in Canada, with aninvestment of CAD880mn and a duration of 30 years.
I-77, in North Carolina, with an investment of USD648mnand a duration of 50 years from the opening date.
The 407ETR toll motorway and Heathrow Airport increased their ordinary shareholder dividends vs. 2014. 407ETR paid CAD750mn vs. CAD730mn in 2014. HAH paid GBP300mn vs. GBP270mn in 2014. The UK regional airports paid the first dividend since their acquisition in 2014 (GBP60mn).
In 2015 Ferrovial executed its second Flexible Dividend programme, approved by the AGM in March. The first scrip dividend (May 2015, equivalent to the 2014 complementary dividend) amounted to EUR0.304 per share (+4.5%). The second (in November 2015, equivalent to the 2015 interim dividend) amounted to EUR0.398 per share (+4.5%). The group also implemented a share buy-back programme (11,783,954 shares which were subsequently cancelled), also approved by the AGM. Ferrovial also bought 760,990 treasury shares which are expected to be cancelled in 2016.
The net cash position, ex-infrastructure projects, closed 2015 at EUR1,514mn. Consolidated net debt stood at EUR4,542mn, including EUR6,057mn from concession projects (down from EUR7,862mn in 2014 thanks to the deconsolidation of the R4 and AP36 in Spain and the exit from the perimeter of the Irish toll roads and the Chicago Skyway due to reclassification as “assets held for sale”.
In 2015 revenues increased by +10.2% and EBITDA by +4.5%, supported by Toll roads (+30%), Construction (+13%), the good operating performance and the strength of sterling and the US dollar against the euro. Net profit increased by +79.1% in 2015 (EUR720mn).

Results January - December 2015. Ferrovial S.A. & subsidiaries
25
BUSINESS PERFORMANCE
Cintra: good traffic performance in all geographies, helped by the economic recovery and the lower price of oil: Canada (407ETR +3.3%), Spain (Ausol I +12.4%), Portugal (Azores +5.6%) and Ireland (M4 +7.2%). In the US, the NTE (Managed Lanes opened in October 2014) performed well; the complete opening of LBJ (Managed Lanes) inSeptember 2015, three months early; and higher traffic on the SH130(+15.7%).
Services: strong revenue growth continued (+11.3%), helped by the sterling appreciation (+4.2% in local currency terms). The order book remained at a record level at EUR22,800mn (including JVs).
Construction: significant improvement in revenues (+8.8%), EBITDA (+12.8%) and margins (9.2% vs 8.9% in 2014). Budimex posted double digit EBITDA and order book growth. The construction order book (+7.9%) reached EUR8,731mn, with notable projects such as the Thames Tideway Tunnel (UK), reconstruction of the I-285 (Georgia, US), a section of the S3 and S7 (Poland), the Extension II of the 407ETR (Canada), and the connectivity improvements at Northern Beaches Hospital (Australia).
Airports: Heathrow traffic (+2.2%) beat its own passenger records nearly every month in 2015, with more seats sold on larger aircraft and growth in traffic to Europe, US, Middle East and Latin America. Traffic at the UK regional airports rose by +5.1% (Glasgow +13%, Southampton -3%, Aberdeen -7%).
Operating strength of the equity-accounted assets: EBITDA +4.4% at HAH, +10.1% at AGS and +14.2% at 407ETR, in local currency terms.
BUSINESS PERFORMANCE
Dec-15 Dec-14 Var. Like-for-Like Revenues 9,701 8,802 10.2% 3.2% EBITDA 1,027 983 4.5% -4.2% EBIT(*) 770 738 4.3% -7.0% Net result 720 402 79.1% CASH FLOW EX-PROJECTS Operating cash flow 860 1,072 Investment -374 -581 Divestment 74 24
Net debt Dec-15 Dec-14 Net Debt Ex-Infra Projects 1,514 1,632 Total net debt -4,542 -6,230
Dec-15 Dec-14 Var. Construction Order book 8,731 8,091 7.9% Services Order book (incl JVs) 22,800 22,369 1.9%
Traffic Dec-15 Dec-14 Var. ETR 407 (VKT´ 000) 2,517,214 2,436,888 3.3% NTE (ADT) 25,553 19,845 28.8% Ausol I (ADT) 13,165 11,711 12.4% Ausol II (ADT) 15,402 13,989 10.1% M4 (ADT) 28,512 26,606 7.2% Heathrow (million pax.) 75.0 73.4 2.2% AGS (million pax.) 14.0 13.3 5.1%
* EBIT ex disposals & impairments

Results January - December 2015. Ferrovial S.A. & subsidiaries
26
B. TOLL ROADS
Dec-15 Dec-14 Var. Like-for-Like Revenues 513 432 18.9% 17.2% EBITDA 333 257 29.6% 25.6% EBITDA Margin 64.9% 59.5%
EBIT 250 182 37.3% 26.8% EBIT Margin 48.7% 42.2%
Revenue performance at the Toll Roads division was very positive in 2015 (+18.9%) due to the contribution from the NTE 1-2 (Managed Lanes opened in October 2014, and thus only made a contribution for one quarter in 2014 vs. a full year in 2015), and to the increased traffic on the main toll roads. In comparable terms, revenue growth reached +17.2%.
EBITDA growth was also strong (+29.6%). The EBITDA margin expanded to 64.9% vs. 59.5% in 2014.
Two new toll roads opened to traffic during the year: LBJ, in Texas (US), Managed Lanes, which fully opened to traffic on 10 September, and the A66 Benavente-Zamora (Spain), which opened on 12 May.
ASSETS IN OPERATION
Traffic performance
Traffic performance in 2015 was very positive on the majority of the Group’s toll roads, for both light and heavy vehicles. The main drivers of this trend were the economic recovery since the second half of 2014 (US, Canada, Spain, Portugal and Ireland), more favourable weather conditions than in 2014 and the lower price of oil compared to 2014.
By country:
In Canada the traffic on the 407ETR rose by +3.3%, with growth in both light (+3.2%) and heavy (+4.7%) vehicles, positively affected by the growth in both the local and the North American economy, the fall in the oil price and the increased congestion on alternative routes due
to roadworks. In the US, traffic growth was positive on the Texan toll roads as a reflection of the strength of the economy and the oil price remaining at low levels. This drove the traffic growth on the SH-130 (+15.7%), which is still in ramp-up phase and users are becoming increasingly familiar with the road and choosing to use it. Chicago Skyway (-3.3%) was negatively impacted by lane closures for maintenance work and by the end of roadworks on the alternative routes.
In Spain, the positive trend observed since the end of 2013 consolidated in 2015. The recovery in traffic accelerated over the course of the year as a consequence of an economy once again in expansive phase, the recovery in tourism in Spain in the summer months and very favourable weather for most of the year. All the corridors reported strong growth, and the toll roads recovered market share. Autema closed the year with cumulative growth of +8.1%, while Ausol I and II posted double-digit growth of +12.4% and +10.1%, respectively, while there was also an increase in congestion on the alternative route. The improvement in the economic outlook was especially reflected in heavy traffic, with growth outpacing that of light traffic in all cases.
The Portuguese concessions reported solid growth in light traffic all year, confirming the trend initiated in 2013, thanks to the recovery in the Portuguese economy. The good weather was of particular support on the Algarve, where traffic increased by +11.7% (this toll motorway has been classified as a financial asset since December 2015). In Azores, as well, the new low-cost airlines which started operations in the summer have given rise to a notable increase in traffic on the island, especially in the high season months, and full-year growth reached +5.6%.
In Ireland, traffic continued to grow, consistent with the performance observed since the negative trend inverted in the second quarter of 2013. As well as notable growth on the respective corridors, market share also increased substantially, closing the year with an increase of +7.2% on the M4. This growth reflects the continued improvement inthe Irish economy and in particular in the levels of employment inIreland.
Traffic Revenues EBITDA EBITDA Margin Net Debt 100% Global consolidation (€ million) Dec-15 Dec-14 Var. Dec-15 Dec-14 Var. Dec-15 Dec-14 Var. Dec-15 Dec-14 Dec-15 Share
INTANGIBLE ASSETS Chicago Skyway 39,973 41,332 -3.3% 81 62 30.2% 70 54 29.7% 86.6% 86.9% 0 55% SH-130 7,831 6,771 15.7% 27 19 47.8% 14 6 115.2% 49.4% 33.9% -1,213 65% NTE 25,553 19,845 28.8% 47 5 n.s. 34 2 n.s. 72.9% 34.2% -932 57% LBJ 12,861 6,776 89.8% 20 4 n.s. 10 -1 n.s. 50.7% -21.6% -1,297 51% Ausol I 13,165 11,711 12.4% 51 46 11.4% 41 36 13.0% 79.1% 78.0% -460 80% Ausol II 15,402 13,989 10.1% M4 28,512 26,606 7.2% 25 23 7.5% 17 16 7.2% 68.8% 69.0% 0 66% Azores 8,596 8,138 5.6% 23 22 5.8% 18 14 33.6% 80.6% 63.8% -326 89% FINANCIAL ASSETS Autema 88 92 -4.1% 79 82 -3.9% 89.9% 89.7% -604 76% M3 23 21 9.7% 18 16 10.7% 75.7% 75.0% 0 95% Norte Litoral 45 41 9.6% 39 34 12.0% 86.4% 84.6% -186 84% Algarve 35 46 -23.3% 30 42 -27.7% 85.3% 90.5% -150 85% Via Livre 14 14 4.4% 1 1 -0.5% 10.5% 11.0% 2 84%
In September 2015 the LBJ toll motorway was opened to traffic in its final configuration; until then only two small sections were open (which explains why there were data for this toll road in 2014).

Results January - December 2015. Ferrovial S.A. & subsidiaries
27
Traffic Revenues EBITDA EBITDA Margin Net Debt 100% Equity Consolidated (€ million) Dec-15 Dec-14 Var. Dec-15 Dec-14 Var. Dec-15 Dec-
14 Var. Dec-15 Dec-14 Dec-15 Share
INTANGIBLE ASSETS 407ETR (VKT'000) 2,517,214 2,436,888 3.3% 704 607 16.0% 590 503 17.3% 83.8% 82.9% -4,190 43% Central Greece 13,521 17,583 -23.1% 11 8 41.5% 4 5 -22.6% 35.7% 65.3% -347 33% Ionian Roads 24,236 23,650 2.5% 75 73 3.4% 47 52 -9.6% 62.9% 72.0% 58 33% Serrano Park 5 5 3.3% 3 3 -14.6% 53.0% 64.1% -44 50% FINANCIAL ASSETS A-66 Benavente Zamora 49 12 299.2% 20 12 64.0% 41.0% 99.9% -162 25%
FINANCIAL ASSETS
In the application of IFRIC 12, concession contracts can be classified in two ways: as either intangible assets or financial assets.
Intangible assets (where the operator assumes the traffic risk) are those where remuneration comprises the right to charge the corresponding tariffs depending on the level of use.
Financial assets are concession agreements where the remuneration comprises an unconditional contractual right to receive cash or other financial assets, either because the entity awarding the concession guarantees the payment of agreed sums, or because it guarantees that it will cover the shortfall between the sums received from the users of the public service and the said agreed amounts. In this type of contract, the demand risk is assumed by the entity awarding the concession.
The assets in operation classified as financial assets, which bear no traffic risk due to some kind of guarantee mechanism are Norte Litoral, Eurolink M3, Autema, ViaLivre, A66 and Algarve. The latter has been classified as a financial asset due to the fact that the renegotiation of the toll road contract was concluded in October 2015. Under this new agreement, the concession has changed to being payment for availability, which eliminates the traffic risk.
ASSETS UNDER DEVELOPMENT
Assets under construction
Global Consolidation (€ million)
Invested Capital
Pending committed
capital
Net Debt 100% Share
INTANGIBLE ASSETS 75 -222 -351 NTE 35W 74 -109 -290 50% I-77 1 -113 -61 50%
Equity Consolidated (€ million)
Invested Capital
Pending committed
capital
Net Debt 100% Share
FINANCIAL ASSETS 25 -66 -556 407-East Extension I 0 -11 -492 50% 407-East Extension II 0 -10 -100 50%
Ruta del Cacao 14 -45 15 40% Toowoomba 11 0 21 40%
NTE 35W: the financing was closed in September 2013 and the programme is advancing as scheduled (47.01% complete); opening is expected in mid-2018.
407 East Extension Phase I: Construction work started in March 2013 and is now 96.9% complete.
Financial closings
407 East Extension Phase II (Canada): The financing of the project was closed on 10 March, and comprised of the following:
A short-term bond for CAD264mn, maturing at the end of theconstruction period, at a cost of 1.713%.
A second long-term bond for CAD108mn, maturing in June2047, at a cost of 3.76%.
A revolving loan for CAD241mn, maturing at the end of theconstruction period, at a cost of 2.703%.
DBRS and Moody’s affirmed their rating of the project at A (low) and A3, respectively, with Stable Outlook.
Award: on 21 January 2015, Ferrovial through its subsidiary Cintra Infraestructuras, in a 50% consortium with CRH (Canada), was selected by Infrastructure Ontario and the Ontario Ministry of Transport as preferred bidder for the design, construction, financing and maintenance of the 407 East Extension Phase II toll road, which is to be extended towards the east, through the Greater Toronto area.
The 32km concession will have a life of 30 years from the date the first section opens to traffic, expected to be at end-2017. The project includes an extension of 22km, with two lanes in each direction, of the 407ETR, from Harmony Road (Oshawa), to the 35/115 toll road (Clarington) and a connection with the 401 toll road in a new 10km junction.
This project will be run under an explicit tolls format (like Phase I), under which the Ontario administration is responsible for fixing the tariffs and collecting the revenues, while the concession will be remunerated by means of an availability payment formula for the maintenance.
Cintra, together with CRH, will be responsible for the project development, while the design and construction will be carry out by Ferrovial Agroman and Dufferin.

Results January - December 2015. Ferrovial S.A. & subsidiaries
28
I-77 (North Carolina): Construction works started in November 2015.The financial closing took place earlier in the year, in May, and theinvestment was financed as follows:
Private Activity Bonds (PABs) for USD100mn, at 5%, andmaturities up to 2054.
A TIFIA loan for a total initial amount of USD189mn,maturing in 2053.
A contribution from the North Carolina Department ofTransport (NCDOT) amounting to USD94.7mn.
The total debt (PABs and TIFIA) has been rated BBB- by Fitch Ratings and BBB by DBRS.
Award: Ferrovial, in a consortium led by its subsidiary Cintra Infraestructuras, closed an agreement in June 2014 with the NCDOT for the design, construction, financing, operation and maintenance of the I-77 highway extension, for a total of USD648mn (c.EUR581mn). The concession has a duration of 50 years from the date it opens to traffic.
Cintra has a 50.1% stake in this project, having sold part of the capital in December 2015.
Toowoomba Second Range Crossing (Queensland, Australia): Ferrovial, in a consortium in which its subsidiary Cintra Infraestructuras participates, has been selected as Preferred Tenderer for the design, construction, financing, operation and maintenance of 41km of toll motorway in Toowoomba, Queensland. Cintra has a 40% stake in this project.
The project has a 25-year duration from the date it opens to traffic (estimated for end-2018) and implies an investment of AUD1.1bn.
The commercial and financing closing was reached in August 2015. The investment in the project will be financed as follows:
Bank debt of AUD395mn
Term: 4.5 years.
Equity of AUD44mn.
Government grants amounting to AUD650mn.
Project refinancings
A66 Benavente – Zamora: in May 2015, Cintra and its partners closed the refinancing of the Autovía de la Plata between Benavente and Zamora by means of issuing a EUR185mn bond with an annual coupon of 3.169% and a maturity of 26 years.
Other assets awarded
Bucaramanga-Barrancabermeja-Yondó (Colombia): Ferrovial, in a consortium led by its subsidiary Cintra Infraestructuras, has been awarded the design, construction, financing, operation and maintenance of 152km of the Bucaramanga-Barrancabermeja-Yondó motorway (Ruta del Cacao) in Colombia. The infrastructure will improve the connections between the east of the country and its most
important oil-producing areas. Cintra has a 40% interest in this project.
The concession has a duration of 25 years (with a possibility of a four-year extension) from the date of signature. Remuneration will be by availability payments, explicit tolls and toll revenues guaranteed by the administration.
The project has a total estimated investment of COP2.6bn, or around EUR880mn.
PROJECTS TENDERED
Ferrovial continues to monitor development activity in its target international markets (North America, Europe and Australia) to bid for toll motorway projects.
In Canada, Cintra has been prequalified to bid for the extension and expansion of the Highway 247 project in Toronto (Ontario) in 2016.
At a European level, on 7 December the Slovakian government selected Cintra’s as the most competitive bid for the D4-R7 Bratislava Beltway in Slovakia in consortium with the investment fund Macquarie and the Austrian company Porr. On 29 January the consortium was announced as Preferred Bidder, having completed the clarification phase. The estimated investment in this project amounts to some EUR1,010mn.
ASSETS SUBJECT TO INSOLVENCY PROCEEDINGS
Radial 4
On 14 September 2012, the Board of the Radial 4 agreed to request protection from its creditors through the courts. On 4 October 2012, this request for court-ordered insolvency proceedings was granted. As a result of this filing for insolvency, the standstill agreements with the creditor banks were terminated.
The asset was deconsolidated in December 2015. This deconsolidation gave rise to a capital gain of EUR77mn, with no cash impact, as a consequence of the release of provisions and a reduction in net debt of EUR644mn.
Ocaña - La Roda
In March 2015, a court order opened the liquidation process. At this point, the insolvency administrators appointed by the Court took control of the company, which was therefore no longer in Ferrovial’s hands, and it was deconsolidated from the group’s accounts with effect from 28 February 2015.
The impact: a reduction in net debt of EUR559mn and an accounting profit, with no cash impact, of EUR64mn, due to the reversal of impairments recognised in previous financial years in excess of the capital invested.
These deconsolidations (Radial 4 and Ocaña-La Roda) have taken place after having concluded that, given the evolution during 2015 of the insolvency proceedings in which they are immersed, Ferrovial does not have control of either asset, following the conditions set in NIIF 10.

Results January - December 2015. Ferrovial S.A. & subsidiaries
29
407ETR
Profit & loss account
(CAD million) Dec-15 Dec-14 Var. Revenues 1,002 888 12.9% EBITDA 840 736 14.2% EBITDA Margin 83.8% 82.9% EBIT 754 657 14.7% EBIT Margin 75.2% 74.1% Financial results -327 -355 7.8% EBT 427 303 41.1% Corporate income tax -116 -80 -45.3% NET INCOME 311 223 39.6% Contribution to Ferrovial equity accounted result (€) 82 54 50.2%
NB: subsequent to Ferrovial’s sale of a 10% stake in 2010, the toll motorway is now equity-accounted, as a reflection of the size of stake controlled by Ferrovial (43.23%).
The 407ETR reported significant revenue growth in 2015 (+12.9%) in local currency terms. This positive performance was mainly due to the tariff increase applied since February 2015, as well as the improvements in traffic affected the growth in the economy and the fall in the price of oil. The average revenues per journey increased by +8.9% vs. 2014.
The toll motorway also posted EBITDA growth of +14.2% at year-end, improving the EBITDA margin from 82.9% to 83.8%.
The financial result fell in 2015, including:
An increase in interest expenses (+CAD12.7mn) due to anincrease in debt, mainly to the issuance of CAD250mn in May2014, the issuance of CAD150mn in March and the refinancing of CAD500mn in May 2015.
Lower expenses (-CAD27mn, with no cash impact) due to lower inflation expectations. In addition, lower expenses of –CAD14mn for fair-value adjustments.
407ETR contributed EUR82mn to Ferrovial’s equity-accounted results (vs. EUR54mn in 2014) after the annual amortisation of the goodwill generated on the sale of a 10% stake in 2010, which will be written down over the life of the asset as a function of the expected traffic flows.
Dividends
At end-December 2015, 407ETR distributed dividends totalling CAD750mn (vs. CAD730mn in 2014). Of these, EUR242mn corresponded to Ferrovial (EUR224mn in 2014).
(CAD million) 2015 2014 2013 2012 Q1 187.5 175.0 100.0 87.5 Q2 187.5 175.0 130.0 87.5 Q3 187.5 175.0 200.0 87.5 Q4 187.5 205.0 250.0 337.5 TOTAL 750.0 730.0 680.0 600.0
Traffic
Traffic growth, in terms of total kilometres travelled, grew by +3.3% due to a +2.6% increase in the number of journeys and a +0.7% increase in the average distance travelled. Traffic mainly benefitted from the growth in the economy and the fall in the price of oil.
The record number of journeys on a single day was beaten on two occasions in 2015: on 26 June with a total of 460,389 and on 25 September with 460,458 journeys. The previous record was set in June 2011.
Net debt
At 31 December, 407ETR’s net debt stood at CAD6,296mn and had an average cost of 4.75%.
407ETR made various issuances during the year:
On 27 March, a CAD150mn bond issue (Senior Notes Series 15-A1). This issue matures on 27 March 2045 and has a coupon of3.30%.
On 11 May, a CAD500mn bond issue (Senior Notes, Series 15-A2). This issue matures on 11 May 2046 and has a coupon of3.83%. The issue is used for the cancellation of theCAD500mn (Senior Notes, Series 10-A1) maturing in June2015 and general corporate expenses.
After this issuance, 42% of the debt matures in more than 20 years. The next debt maturities are in 2016, and amount to CAD879mn. As of February 2016, CAD581mn have been refinanced (bank loan), CAD298mn remaining with maturity in 2016.
407ETR extended its existing lines of credit by CAD500mn. Of these, CAD300mn will be used to refinance the debt maturing at end-2016. The rest will be used for corporate purposes.
Credit rating
S&P: On 30 January 2015, the agency affirmed its rating at A (Senior Debt), A- (Junior Debt) and BBB (Subordinated Debt) with Stable Outlook.
DBRS: On 31 December 2015, the agency reaffirmed its rating A (Senior Debt), A low (Junior Debt) and BBB (Subordinated Debt).
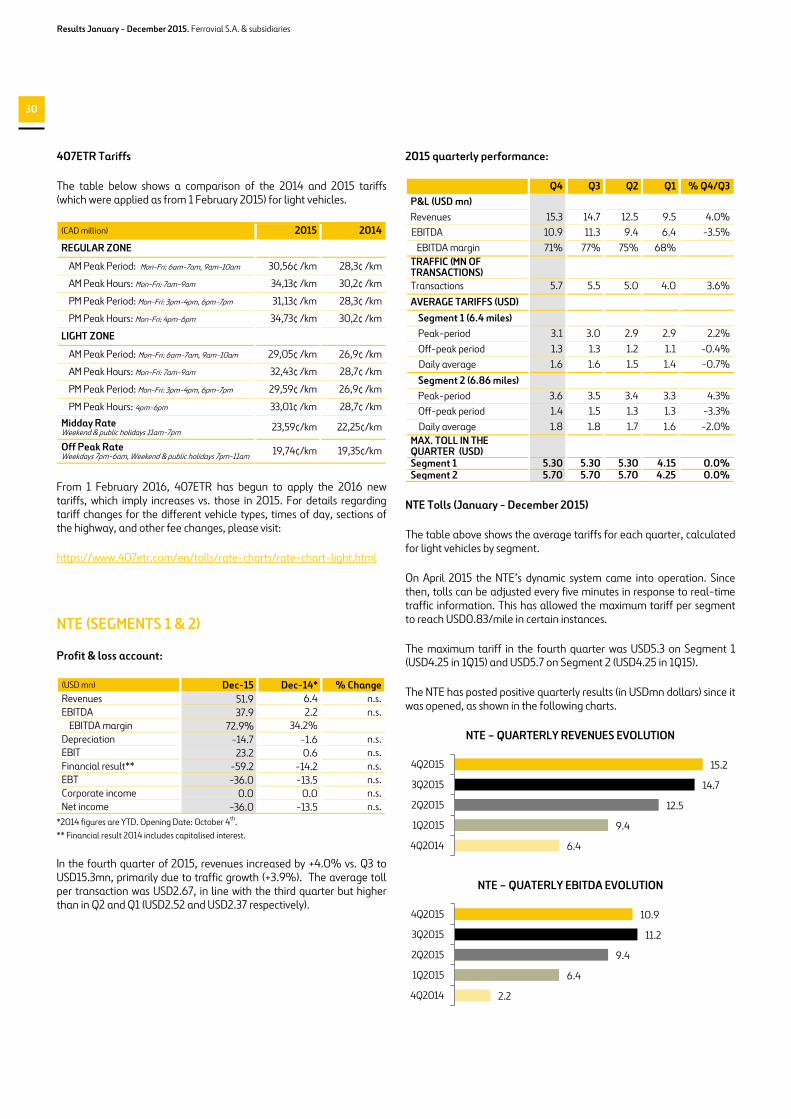
Results January - December 2015. Ferrovial S.A. & subsidiaries
30
407ETR Tariffs
The table below shows a comparison of the 2014 and 2015 tariffs (which were applied as from 1 February 2015) for light vehicles.
(CAD million) 2015 2014
REGULAR ZONE
AM Peak Period: Mon-Fri: 6am-7am, 9am-10am 30,56¢ /km 28,3¢ /km
AM Peak Hours: Mon-Fri: 7am-9am 34,13¢ /km 30,2¢ /km
PM Peak Period: Mon-Fri: 3pm-4pm, 6pm-7pm 31,13¢ /km 28,3¢ /km
PM Peak Hours: Mon-Fri: 4pm-6pm 34,73¢ /km 30,2¢ /km
LIGHT ZONE
AM Peak Period: Mon-Fri: 6am-7am, 9am-10am 29,05¢ /km 26,9¢ /km
AM Peak Hours: Mon-Fri: 7am-9am 32,43¢ /km 28,7¢ /km
PM Peak Period: Mon-Fri: 3pm-4pm, 6pm-7pm 29,59¢ /km 26,9¢ /km
PM Peak Hours: 4pm-6pm 33,01¢ /km 28,7¢ /km
Midday Rate Weekend & public holidays 11am-7pm 23,59¢/km 22,25¢/km
Off Peak Rate Weekdays 7pm-6am, Weekend & public holidays 7pm-11am 19,74¢/km 19,35¢/km
From 1 February 2016, 407ETR has begun to apply the 2016 new tariffs, which imply increases vs. those in 2015. For details regarding tariff changes for the different vehicle types, times of day, sections of the highway, and other fee changes, please visit:
https://www.407etr.com/en/tolls/rate-charts/rate-chart-light.html
NTE (SEGMENTS 1 & 2)
Profit & loss account:
(USD mn) Dec-15 Dec-14* % Change Revenues 51.9 6.4 n.s. EBITDA 37.9 2.2 n.s.
EBITDA margin 72.9% 34.2% Depreciation -14.7 -1.6 n.s. EBIT 23.2 0.6 n.s. Financial result** -59.2 -14.2 n.s. EBT -36.0 -13.5 n.s. Corporate income 0.0 0.0 n.s. Net income -36.0 -13.5 n.s.
*2014 figures are YTD. Opening Date: October 4th. ** Financial result 2014 includes capitalised interest.
In the fourth quarter of 2015, revenues increased by +4.0% vs. Q3 to USD15.3mn, primarily due to traffic growth (+3.9%). The average toll per transaction was USD2.67, in line with the third quarter but higher than in Q2 and Q1 (USD2.52 and USD2.37 respectively).
2015 quarterly performance:
Q4 Q3 Q2 Q1 % Q4/Q3 P&L (USD mn) Revenues 15.3 14.7 12.5 9.5 4.0%
EBITDA 10.9 11.3 9.4 6.4 -3.5% EBITDA margin 71% 77% 75% 68% TRAFFIC (MN OF TRANSACTIONS) Transactions 5.7 5.5 5.0 4.0 3.6% AVERAGE TARIFFS (USD)
Segment 1 (6.4 miles) Peak-period 3.1 3.0 2.9 2.9 2.2% Off-peak period 1.3 1.3 1.2 1.1 -0.4%
Daily average 1.6 1.6 1.5 1.4 -0.7% Segment 2 (6.86 miles) Peak-period 3.6 3.5 3.4 3.3 4.3% Off-peak period 1.4 1.5 1.3 1.3 -3.3%
Daily average 1.8 1.8 1.7 1.6 -2.0% MAX. TOLL IN THE QUARTER (USD) Segment 1 5.30 5.30 5.30 4.15 0.0% Segment 2 5.70 5.70 5.70 4.25 0.0%
NTE Tolls (January - December 2015)
The table above shows the average tariffs for each quarter, calculated for light vehicles by segment.
On April 2015 the NTE’s dynamic system came into operation. Since then, tolls can be adjusted every five minutes in response to real-time traffic information. This has allowed the maximum tariff per segment to reach USD0.83/mile in certain instances.
The maximum tariff in the fourth quarter was USD5.3 on Segment 1 (USD4.25 in 1Q15) and USD5.7 on Segment 2 (USD4.25 in 1Q15).
The NTE has posted positive quarterly results (in USDmn dollars) since it was opened, as shown in the following charts.
NTE – QUARTERLY REVENUES EVOLUTION
NTE – QUATERLY EBITDA EVOLUTION
15.2
14.7
12.5
9.4
6.4
4Q2015
3Q2015
2Q2015
1Q2015
4Q2014
10.9
11.2
9.4
6.4
2.2
4Q2015
3Q2015
2Q2015
1Q2015
4Q2014

Results January - December 2015. Ferrovial S.A. & subsidiaries
31
Traffic
NTE is still in the ramp-up phase, such that in 4Q15 it posted 5.7 million transactions, +42.5% more than in Q12015.
Net debt
The toll road’s net debt at 31 December 2015 reached USD1,012mn, with an average cost of 5.4%.
Awards
In 2015, the NTE has won the following awards:
2015 American Association of State Highway andTransportation Officials (AASHTO) TransComm Skills Award for NTE Grand Opening
2015 American Association of State Highway andTransportation Officials (AASHTO) America’s TransportationAwards national finalist
2015 Western Association of State Highway and TransportationOfficials (WASHTO) America’s Transportation Award for “UnderBudget”
2015 Engineering News Record (ENR) Best Project of the Year
ENR Best Safety Program award
Texas Quality Asphalt Pavement Award for OutstandingAchievement
2015 Texas Department of Transportation Journey toExcellence Award.
LBJ TOLL TOLL ROAD
Profit & loss account
(USD mn ) Dec-15 Dec-14 % Change
Revenues 22.0 5.4 n.s. EBITDA 11.1 -1.2 n.s.
EBITDA margin 50.7% -21.6%
The complete LBJ was opened to traffic on 10 September 2015 with its final configuration, having only two small segments of the toll road open before this date (which is the reason we see data for the toll road before its official opening day).
Quarterly data
Q4
TRAFFIC (MN OF TRANSACTIONS) Transactions 7.0 AVERAGE TARIFFS (USD) Segment 1 (3.6 miles)
Peak-period 2.0 Off-peak period 1.1 Daily average 1.2
Segment 2 (5.02 miles) Peak-period 2.1 Off-peak period 1.1 Daily average 1.3
Segment 3 (4.63 miles) Peak-period 2.2 Off-peak period 1.1 Daily average 1.3
MAX. TOLL IN THE QUARTER (USD) Segment 1 3.0 Segment 2 4.2 Segment 3 3.9
LBJ Tolls (September - December 2015)
The table above shows the average tariffs for the last quarter of 2015 calculated for light vehicles by segment.
The maximum tariff during the quarter was USD3.0 in Segment 1; USD4.2 in Segment 2; and USD3.9 in Segment 3.
Traffic
Since its first quarter with its full configuration operational, LBJ toll road reported 7 million transactions.
Net debt
Net debt at 31 December 2015 stood at USD1,409mn with an average cost of 5.5%.
Credit rating
The rating agencies have assigned the following credit ratings to LBJ’s debt:
PAB TIFIA
Moody’s Baa3
FITCH BBB- BBB-
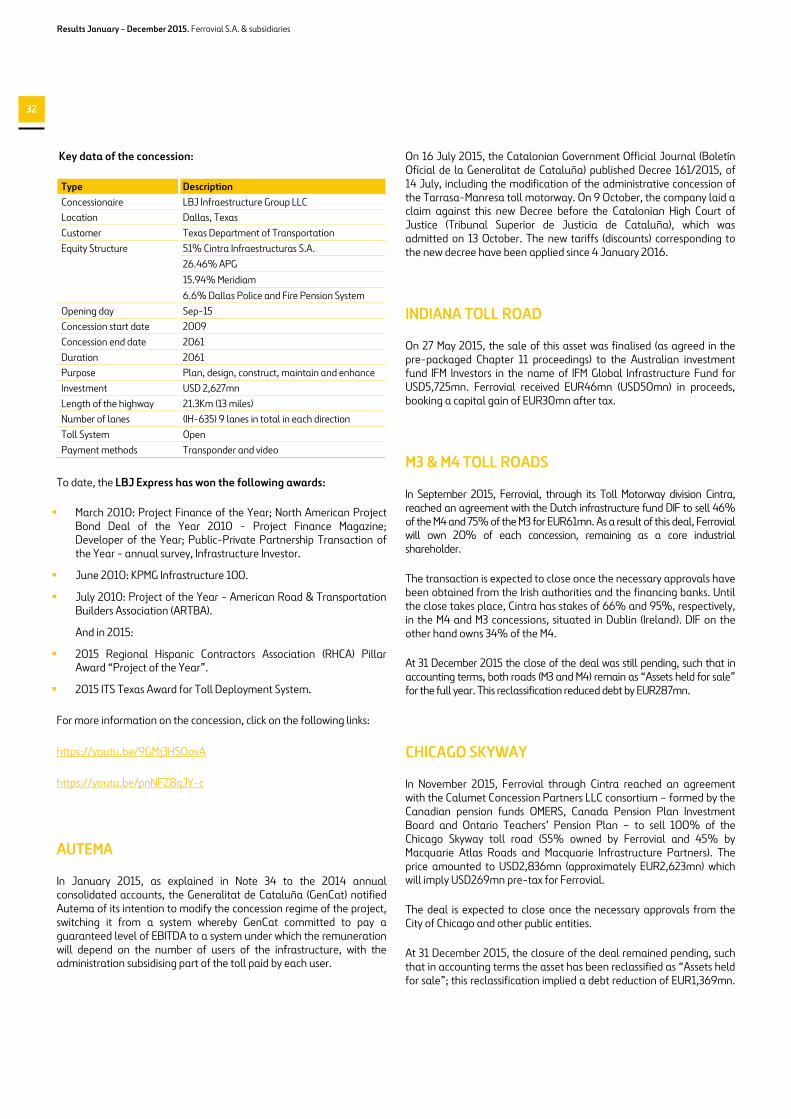
Results January - December 2015. Ferrovial S.A. & subsidiaries
32
Key data of the concession:
Type Description Concessionaire LBJ Infraestructure Group LLC Location Dallas, Texas Customer Texas Department of Transportation Equity Structure 51% Cintra Infraestructuras S.A. 26.46% APG 15.94% Meridiam 6.6% Dallas Police and Fire Pension System Opening day Sep-15 Concession start date 2009 Concession end date 2061 Duration 2061 Purpose Plan, design, construct, maintain and enhance Investment USD 2,627mn Length of the highway 21.3Km (13 miles) Number of lanes (IH-635) 9 lanes in total in each direction Toll System Open Payment methods Transponder and video
To date, the LBJ Express has won the following awards:
March 2010: Project Finance of the Year; North American Project Bond Deal of the Year 2010 - Project Finance Magazine; Developer of the Year; Public-Private Partnership Transaction of the Year - annual survey, Infrastructure Investor.
June 2010: KPMG Infrastructure 100.
July 2010: Project of the Year - American Road & Transportation Builders Association (ARTBA).
And in 2015:
2015 Regional Hispanic Contractors Association (RHCA) Pillar Award “Project of the Year”.
2015 ITS Texas Award for Toll Deployment System.
For more information on the concession, click on the following links:
https://youtu.be/9GMj3H5OovA
https://youtu.be/pnNFZ8qJY-c
AUTEMA
In January 2015, as explained in Note 34 to the 2014 annual consolidated accounts, the Generalitat de Cataluña (GenCat) notified Autema of its intention to modify the concession regime of the project, switching it from a system whereby GenCat committed to pay a guaranteed level of EBITDA to a system under which the remuneration will depend on the number of users of the infrastructure, with the administration subsidising part of the toll paid by each user.
On 16 July 2015, the Catalonian Government Official Journal (Boletín Oficial de la Generalitat de Cataluña) published Decree 161/2015, of 14 July, including the modification of the administrative concession of the Tarrasa-Manresa toll motorway. On 9 October, the company laid a claim against this new Decree before the Catalonian High Court of Justice (Tribunal Superior de Justicia de Cataluña), which was admitted on 13 October. The new tariffs (discounts) corresponding to the new decree have been applied since 4 January 2016.
INDIANA TOLL ROAD
On 27 May 2015, the sale of this asset was finalised (as agreed in the pre-packaged Chapter 11 proceedings) to the Australian investment fund IFM Investors in the name of IFM Global Infrastructure Fund for USD5,725mn. Ferrovial received EUR46mn (USD50mn) in proceeds, booking a capital gain of EUR30mn after tax.
M3 & M4 TOLL ROADS
In September 2015, Ferrovial, through its Toll Motorway division Cintra, reached an agreement with the Dutch infrastructure fund DIF to sell 46% of the M4 and 75% of the M3 for EUR61mn. As a result of this deal, Ferrovial will own 20% of each concession, remaining as a core industrial shareholder.
The transaction is expected to close once the necessary approvals have been obtained from the Irish authorities and the financing banks. Until the close takes place, Cintra has stakes of 66% and 95%, respectively, in the M4 and M3 concessions, situated in Dublin (Ireland). DIF on the other hand owns 34% of the M4.
At 31 December 2015 the close of the deal was still pending, such that in accounting terms, both roads (M3 and M4) remain as “Assets held for sale” for the full year. This reclassification reduced debt by EUR287mn.
CHICAGO SKYWAY
In November 2015, Ferrovial through Cintra reached an agreement with the Calumet Concession Partners LLC consortium – formed by the Canadian pension funds OMERS, Canada Pension Plan Investment Board and Ontario Teachers’ Pension Plan – to sell 100% of the Chicago Skyway toll road (55% owned by Ferrovial and 45% by Macquarie Atlas Roads and Macquarie Infrastructure Partners). The price amounted to USD2,836mn (approximately EUR2,623mn) which will imply USD269mn pre-tax for Ferrovial.
The deal is expected to close once the necessary approvals from the City of Chicago and other public entities.
At 31 December 2015, the closure of the deal remained pending, such that in accounting terms the asset has been reclassified as “Assets held for sale”; this reclassification implied a debt reduction of EUR1,369mn.

Results January - December 2015. Ferrovial S.A. & subsidiaries
33
C. SERVICES
Dec-15 Dec-14 Var. Like-for-Like Revenues 4,897 4,401 11.3% 4.2% EBITDA 312 387 -19.4% -26.4%
EBITDA Margin 6.4% 8.8% EBIT 173 260 -33.5% -40.4%
EBIT Margin 3.5% 5.9% EBITDA at Ferrovial % in equity accounted businesses
33 22 49.6% 35.1%
Order book 20,732 20,354 1.9% -1.6% JVs Order book 2,068 2,016 2.6% -1.9% Global Order book+JVs 22,800 22,369 1.9% -1.6%
Revenues increased by +11.3% vs. 2014, although part of this growth was generated by exchange-rate movements, especially sterling. Excluding FX impacts, sales growth would have been +4.2%. By business, Spain grew by +4.9%, the UK by +14.2% (+3% excluding FX); and in International, growth reached +35.8% (+32.9% excluding FX).
EBITDA stood at EUR312mn which implies a -19.4% fall vs. the previous year, in comparable terms, the fall was of -26.4%. EBITDA margin fell from 8.8% in 2014 to 6.4% in 2015. The EBITDA fall in 2015 was due to the negative -EUR110mn contribution from the Birmingham contract. Of this amount, EUR34mn correspond to the losses incurred in the year, and the rest of the loss (EUR76mn) include the possible impact from an unfavourable resolution of ongoing litigation and a revision of the contract’s profitability going forward.
The order book reached EUR22,800mn, +1.9% above 2014. Excluding the FX impact, the order book would have been -1.6% lower than in December 2014.
SPAIN
Dec-15 Dec-14 Var. Like-for-Like Revenues 1,677 1,599 4.9% 4.9% EBITDA 179 172 4.1% 3.7% EBITDA Margin 10.7% 10.7% EBIT 93 90 3.4% 2.6% EBIT Margin 5.6% 5.6% EBITDA at Ferrovial % in equity accounted businesses
5 5 2.6% 2.6%
Order book 5,815 6,392 -9.0% -9.0% JVs Order book 325 344 -5.5% -5.5% Global Order book+JVs 6,140 6,736 -8.8% -8.8%
The positive evolution vs. 2014 seen in revenues and margins in Spain continued vs. 2014. Revenues increased by +4.9% with notable contributions from new contracts awarded in 2014, such as waste collection in Madrid or maintenance at Orense Hospital, and the higher revenues from highway maintenance contracts. The EBITDA and EBIT margins remained in line with 2014.
The order book amounted to EUR6,140m (-8.8% vs. December). The order book contraction was due to a lower volume of new contracts during the year, reflecting the slowdown in public tendering in a year marked by various election processes.
Highlights during the quarter were the renewal of a maintenance contract for Airbus installations in Spain (EUR41mn, 5 years), and the award of a new contract for the management of a treatment plant in Es Milá in Menorca (EUR69mn, 25 years).
UK
Dec-15 Dec-14 Var. Like-for-Like Revenues 3,103 2,717 14.2% 3.0% EBITDA 122 210 -42.0% -49.7% EBITDA Margin 3.9% 7.7% EBIT 75 169 -55.8% -61.4% EBIT Margin 2.4% 6.2% EBITDA at Ferrovial % in equity accounted businesses
20 13 54.7% 39.5%
Order book 14,585 13,682 6.6% 1.2% JVs Order book 1,738 1,616 7.5% 2.1% Global Order book+JVs 16,323 15,298 6.7% 1.3%
In the UK, revenues were +14.2% higher than in December 2014. This growth was mainly due to sterling appreciation against the euro. Excluding this impact, revenue growth would have been +3%.
Amey’s results reflect a negative EBITDA contribution of EUR110mn on the infrastructure maintenance contract for Birmingham. This negative impact includes the losses incurred on from the contract during 2015 (EUR34mn) derived from over-costs in the capex phase, and the legal costs from the litigation with the City Council. The rest of the loss (EUR76mn) include the possible impact from an unfavourable resolution of said litigation and a revision of the contract’s profitability going forward.
During the last months of 2015, the local public entities market in the UK has continued registering a fall in volumes, as a consequence of budgetary pressures. This fall has been offset by higher consulting activity, especially in rail. These budgetary pressures on public entities are expected to continue through 2016, especially in maintenance and road conservation activities, impacting profitability on these contracts.
The order book reached EUR16,323mn, +6.7% higher than in December 2014. Excluding the FX impact, the order book increased by +1.3% vs. December. The highlights of the quarter include the award ofa contract with Scottish Water for the maintenance of water networks (EUR247mn, 6 years), and the extension of the highway maintenance contract for the County of Kent (EUR111mn, 2 years).

Results January - December 2015. Ferrovial S.A. & subsidiaries
34
INTERNATIONAL
Dec-15 Dec-14 Var. Like-for-Like Revenues 116 86 35.8% 32.9% EBITDA 11 5 113.2% 102.2% EBITDA Margin 9.5% 6.1% EBIT 4 0 n.s. n.s. EBIT Margin 3.9% 0.2% EBITDA at Ferrovial % in equity accounted businesses
9 5 80.6% 49.9%
Order book 332 279 18.8% 20.8% JVs Order book 5 56 -91.5% -92.4% Global Order book+JVs 336 335 0.4% -0.1%
The International business includes the activities of Ferrovial Servicios in countries other than Spain and the UK. Compared to 2014, the revenues from this business increased by +35.8%, and by +32.9% excluding the FX impact.
The strong revenue growth consolidated the positive contribution at the EBITDA level of this business area.
Performance was positive in all geographies: revenues in Poland raised to EUR30mn (+194% vs. 2014); in Chile EUR59mn (+19.7%); and in Portugal EUR26mn (+2.4%). As regards Qatar, which is consolidated by the equity method, the result amounted to EUR8mn vs. EUR5mn in 2014.
ORDER BOOK
The order book remained at record levels of EUR22,800mn, an increase of +1.9% vs. December 2014 (-1.6% excluding the FX impact).
By business area, in Spain the order book reached EUR6,140mn (-8.8%), affected by the slowdown in public tendering in a year marked by various election processes; in the UK, the order book reached EUR16,323mn (+6.7% vs. 2014, +1.3% in comparable terms); in International, the order book to December 2015 stood at EUR336mn (+0.4% vs. December 2014, -0.1% in comparable terms).
CORPORATE ACTIVITY
On 6 December 2015, Ferrovial Servicios made a public bid to acquire 100% of the shares in the Australian company Broadspectrum (the former Transfield Services) at price of AUD1.35/share in cash (a 59% premium over the closing price on the day before the bid), which would imply an AUD715mn investment (approximately EUR490mn).
Should the deal come to pass, it would give Ferrovial Services an entry into the Australian market via merger with a large services company present in different business segments. As well as in Australia, Broadspectrum has a presence in markets such as the US, Canada and Chile in sectors such as energy, mining, telecommunications and infrastructure management.
The bid is no guarantee of a deal, as it is subject to the final acceptance of at least 50.01% of the shareholders, as well as the approval of the Australian authorities, among other usual conditions.

Results January - December 2015. Ferrovial S.A. & subsidiaries
35
D. CONSTRUCTION
Dec-15 Dec-14 Var. Like-for-Like Revenues 4,287 3,942 8.8% 1.2% EBITDA 393 349 12.8% 2.3% EBITDA Margin 9.2% 8.9% EBIT 364 312 16.5% 5.0% EBIT Margin 8.5% 7.9% Order book 8,731 8,091 7.9% 3.8%
In 2015, the Construction division reported revenue growth of +8.8% (+1.2% in comparable terms), mainly due to the significant expansion of international activity (+14.6%), thanks to the combination of the growth at Budimex (+6.0% LfL) and the start of work in new geographies (Australia, Brazil and Middle East), which offset the decline at Webber (-20.2% comparable). International revenues represented 80% of the division’s revenues, which were very concentrated in Ferrovial’s traditional strategic markets; North America (32%), Poland (30%) and the UK (8%).
There was an improvement at the EBITDA level vs. 2014, mainly due to the high margins on contracts which are coming to an end in the US, together with a margin improvement at Budimex which was considerably stronger than its revenue growth.
BUDIMEX
Dec-15 Dec-14 Var. Like-for-Like Revenues 1,226 1,152 6.4% 6.0% EBITDA 68 55 23.5% 23.0% EBITDA Margin 5.6% 4.8% EBIT 63 50 26.5% 26.0% EBIT Margin 5.1% 4.3% Order book 1,974 1,426 38.5% 37.9%
The performance of this division was very positive in 2015, in a continuation of the trend seen in 2014. In comparable terms, we highlight the revenue growth (+6.0%, derived from improvements in execution of Residential and Non-residential Building works), as well as in the profitability of the business (+26.0%), mainly thanks to the continued pressure on cost of materials and subcontractor expenses.
The order book stood at EUR1,974mn, an increase of +37.9% in LfL terms vs. December 2014. 2015 was a record year for order intake at Budimex, at above EUR1,700mn, of which approximately 70% corresponds to Civil Works contracts under the New Highways Plan 2014-20.
WEBBER
Webber reported a drop in revenues in LfL terms (-20.2%) as a reflection of the completion of the NTE and LBJ projects. There was a considerable increase in profitability, to 13.8%, on the back of well-managed large concession projects that are now in their final phases, with the majority of their risks now satisfactorily mitigated.
Meanwhile, the order book remained at very similar levels to the previous year (-3.1% LfL terms), thanks to the high level of contract awards in the final quarter of 2015, which led to annual order intake of more than EUR500mn (more than 50% above 2014 in LfL terms).
Dec-15 Dec-14 Var. Like-for-Like Revenues 643 673 -4.5% -20.2% EBITDA 89 59 51.1% 25.0% EBITDA Margin 13.8% 8.7% EBIT 81 52 56.9% 29.6% EBIT Margin 12.6% 7.7% Order book 950 880 7.9% -3.1%
FERROVIAL AGROMAN
Dec-15 Dec-14 Var. Like-for-Like Revenues 2,419 2,116 14.3% 6.4% EBITDA 236 235 0.6% -8.4% EBITDA Margin 9.8% 11.1% EBIT 220 211 4.3% -6.0% EBIT Margin 9.1% 10.0% Order book 5,807 5,785 0.4% -3.2%
Revenue growth at Ferrovial Agroman reached +6.4% LfL, thanks to the contributions from new geographies, such as Australia, Brazil and the Middle East, and supported by ongoing sales in the company’s traditional markets.
Profitability remained at high levels, mainly due to the margins generated on the projects close to completion.
ORDER BOOK
Dec-15 Dec-14 Var. Civil work 7,079 6,345 11.6% Residential work 336 260 29.3% Non-residential work 707 732 -3.4% Industrial 610 755 -19.2% TOTAL 8,731 8,091 7.9%
The order book increased by +7.9% vs. December 2014 (+3.8% LfL).
The civil works segment continues to represent the majority of the order book (around 81%) and the company maintains very selective criteria when making bids. The international order book amounts to EUR7,040mn (+15.1%), considerably larger than the domestic order book: EUR1,691mn (-14.3% vs. 2014).
In 2015 the group was awarded important contracts in traditional markets, such as the Thames Tideway Tunnel (UK), Toowoomba (Australia), Northern Beaches Hospital Connectivity (Australia), 407ETR Phase 2 (Canada), I-285 (US), US290 Segment 5 (US), and the S7 Ostroda, S-7 Express Road Gdańsk and S3 Sulechow - Nowa Sol toll (Poland) toll roads.
After the close, on 29 January 2016 the consortium led by Ferrovial won the construction contract for the Bratislava beltway (Slovakia), with Ferrovial Agroman contributing to the design and construction (contributing approximately EUR560mn to the order book).

Results January - December 2015. Ferrovial S.A. & subsidiaries
36
E. AIRPORTS
The Airports division contributed EUR199mn to Ferrovial’s equity-accounted results (vs. EUR70mn in 2014).
HEATHROW
The contribution from HAH to Ferrovial’s equity-accounted results at the close of 2015 was EUR186mn, vs. EUR74mn at end-2014, with the difference fundamentally explained by the following impacts:
Higher amortisation (+19.2%; +GBP116mn), due to theimpact of the T2 opening, the increased depreciation on T1due to its closure in June, and the new integrated baggagefacility at T3.
The inclusion of a positive non-recurrent effect on HAHpension expenses of GBP237mn, with no cash impact, after an agreement with the unions, due to the changes in the pension plan; this made a positive contribution of EUR67mn toFerrovial’s net result).
The positive impact on the financial result of the mark tomarket of hedging instruments (a EUR39mn contribution toFerrovial’s net result).
The GBP91mn profit generated by the announcement of thetax cut in the UK (a EUR32mn contribution to Ferrovial’s netresult).
Traffic Heathrow SP
In 2015, the number of passengers at Heathrow reached 75 million, up by +2.2% vs. December 2014, beating the monthly traffic record practically on every month.
The traffic performance was mainly due to an increase in the number of seats as a consequence of larger aircraft (with an average number of seats per aircraft of 208.7 vs. 204.5 in 2014).
Load-factors reached 76.5%, in line with 2014.
Much of the traffic growth in the period was European, with over a million more passengers in 2015 than in 2014, mainly on the back of the increase in the number of seats offered by BA on short-haul flights.
Intercontinental traffic expanded by +1.4%, given the increased aircraft size (partly due to the larger number of A380s), the increase in the number of flights to North America (+1.7%); to the Middle East (+5.8%) reflecting both more flights as well as larger aircraft; to Latin America (+8.3%) due to Avianca’s new route to Colombia; and the AsiaPacific routes (+0.3%), thanks to the substantial growth in the routes to China and Hong Kong and the new flights to Vietnam.
Demand for increased capacity at Heathrow continues. Garuda Airlines of Indonesia moved its London operations from Gatwick to Heathrow, following in the footsteps of other airlines such as Vietnam Airlines and Air China.
Traffic performance by destination
(Million pax) Dec-15 Dec-14 Var. UK 5.1 5.3 -2.7% Europe 31.2 30.0 3.9% Long Haul 38.7 38.1 1.4% TOTAL 75.0 73.4 2.2%
Heathrow SP revenues
Revenue growth (+2.7%) was supported both by the increase in retail earnings (+8.4%) and the +1.0% increase in aeronautical revenues, driven by the traffic growth.
The average aeronautical revenues per passenger fell (-1.2%) to GBP22.67 (vs. GBP22.94 in 2014).
Revenue breakdown
(GBP million) Dec-15 Dec-14 Var. Like-for-Like Aeronautic 1,699 1,683 1.0% 1.0% Retail 568 524 8.4% 8.4% Others 498 485 2.8% 2.7% TOTAL 2,765 2,692 2.7% 2.7%
Retail earnings rose by +8.4%, mainly as a reflection of the good performance of the car parks (+8.1%), given the increased capacity (parking at T2 and the new 800-bay business parking at T5), as well as to the increase in the number of passengers. Catering services also expanded (+12.5%), as did the specialised stores (+6.4%), mainly due to the improvements at T5 and the good retail offering at T2. Of the specialised shops, note the double-digit growth in the luxury shops, which benefited from the opening of new space at T5 at the end of 2014, including firms such as Louis Vuitton, Cartier, Rolex, Fortnum & Mason, Bottega Veneta, Dior or Hermes.
Net retail earnings per passenger reached GBP7.58, or an increase of +6.2%.
The Other earnings line increased by +2.7% (LfL), due to higher earnings from supplies, higher rentals after the opening of T2, higher revenues from baggage and the greater variety of services offered by LHR Express, such as advance ticket purchases and promotional discounts (Kids go Free).
Traffic (Million pax) Revenues EBITDA EBITDA Margin
(GBP million) Dec-15 Dec-14 Var. Dec-15 Dec-14 Var. Dec-15 Dec-14 Var. Dec-15 Dec-14 Var.(pbs) Heathrow SP 75.0 73.4 2.2% 2,765 2,692 2.7% 1,605 1,559 3.0% 58.0% 57.9% 9
Exceptionals & adjs 2 0 n.a. 4 -19 n.a. n.a. n.a. n.a. Total HAH 75.0 73.4 2.2% 2,767 2,692 2.8% 1,608 1,541 4.4% 58.1% 57.2% 87

Results January - December 2015. Ferrovial S.A. & subsidiaries
37
Heathrow SP EBITDA
Heathrow SP’s adjusted EBITDA increased by +3.0% in 2015, vs. revenue growth of +2.7%. The EBITDA margin reached 58.0% (vs. 57.9% in 2014).
Cost control efforts remain in force, with a small reduction in LfL costs. Overall costs for 2015 reflect almost GBP20mn related to the incremental full year operation of T2 and, the start of T3 baggage facility operations offset by savings from the wind-down of T1. In addition, GBP23mn of costs were incurred by planning activities regarding the airport’s expansion.
User satisfaction
Heathrow was selected as the “Best Airport in Western Europe” for the first time in 2015, and “Best Airport for Shopping” for the sixth consecutive year. In addition, T5 was selected for the fourth consecutive year as “Best Airport Terminal” by Skytrax World Airport Awards.
Heathrow was also selected as “Best Airport in Europe” for the second time by Airport Council International.
User satisfaction reached record levels in 2015, with 81% of passengers rating their experience as “very good” or “excellent” (vs. 78% in 2014).
Regulatory aspects
Regulatory period: the regulatory period (Q6) began on 1 April 2014 and extends until 31 December 2018. The CAA approved an annual maximum increase in tariffs per passenger equivalent to RPI -1.5%.
Regulatory Asset Base (RAB): at end-December 2015, the RAB reached GBP14,921mn (vs. GBP14,860mn at end-December 2014).
Airports Commission: on 1 July 2015, the Airports Commission clearly and unanimously recommended a new plan for the north-west runway at Heathrow, as a means of solving the capacity problems in the UK. It recognised the role that Heathrow plays as the only hub airport and the only solution that can help the global growth of British companies.
At present, Heathrow has more than 80 long-haul connections and with the expansion, could support up to 40 new long-haul connections to emerging markets. The government will carry out an additional analysis of the environmental impacts, which is expected to be concluded in the summer of 2016.
HAH net debt
At 31 December 2015, the average cost of Heathrow’s external debt was 4.97% taking into account all the interest-rate, exchange-rate and inflation hedges (vs. 5.76% in December 2014).
(GBP million) Dec-15 Dec-14 Var. Loan Facility (ADI Finance 2) 498 497 0.1% Subordinated 916 898 2.1% Securitized Group 12,036 11,598 3.8% Other & adjustments -14 -16 -13.4%TOTAL 13,437 12,978 3.5%
The net debt figure is for FGP Topco, the parent company of HAH.
HAH PROFIT & LOSS ACCOUNT
(GBP million) Dec-15 Dec-14 Dec-15 Like-for-Like Revenues 2,767 2,692 2.8% 2.8% EBITDA 1,845 1,541 19.7% 4.4%
EBITDA margin % 66.7% 57.2% Depreciation 719 603 19.2% 19.2% EBIT 1,126 938 20.1% -5.1%
EBIT margin % 40.7% 34.8% Impairments & disposals 5 0 n.s. n.a. Financial results -571 -860 33.7% 5.1% EBT 560 77 n.s. -5.3% Corporate income tax -22 -24 8.1% 3.2% Result from discontinued operations 185 100.0% 100.0%
NET INCOME 538 238 125.9% -5.5% Contribution to Ferrovial equity accounted result (€) 186 74 150.5% -5.5%
HAH EBITDA
EBITDA at HAH increased by +19.7% to GBP1,845mn. This increase reflected the improvement in revenues based on traffic growth, cost-control efforts and – after an agreement with the unions – the inclusion of a positive non-recurrent impact on HAH’s pension expenses of GBP237mn, due to changes in the terms and conditions of the pension plan.
Depreciation
There was a significant increase (+19.2%) in depreciation in 2015 as a consequence of the depreciation of T2 after it was opened in 2014, the increased depreciation of T1 and the new integrated baggage facility at T3.
Financial result
The (+33.7%) improvement in the financial result was due to the positive performance vs. 2014 of both the mark to market of the company’s hedges (+GBP215mn) and of the financing result (+GBP75mn), which mainly reflected the lower costs of inflation-linked bonds and swaps (+GBP85mn vs. 2014).
Dividends
In 2015, HAH distributed an ordinary dividend of GBP300mn (EUR95mn of which attributable to Ferrovial), vs. an ordinary dividend of GBP270mn in 2014 (or GBP1,075mn including the extraordinary dividend on the sale of AGS and other non-recurrent dividends).

Results January - December 2015. Ferrovial S.A. & subsidiaries
38
UK REGIONAL AIRPORTS (AGS)
The AGS contribution to Ferrovial’s equity-accounted results at end-2015 amounted to EUR14mn.
AGS traffic
Traffic (million passengers)
(GBP million) Dec-15 Dec-14 Var. Glasgow 8.7 7.7 13.0% Aberdeen 3.5 3.8 -7.0% Southampton 1.8 1.8 -3.0%TOTAL NON REGULATED 14.0 13.3 5.1%
During 2015, the number of passengers in the regional airports rose to 14 million, an increase of +5.1%.
Traffic at Glasgow reached 8.7 million passengers (+13.0%), mainly due to the increased contribution from Ryanair, which completed its first full year of operations at the airport. The most important Ryanair routes were London and the main European cities where the airline has a base.
International traffic growth (+16.8%) was mainly driven by the increase in European traffic after the arrival of Ryanair in October 2014, the new routes and higher frequency of Wizz Air, increased capacity and load-factors at EasyJet and KLM, and increased frequency at Icelandair and Jet2.
Domestic traffic improved (+9.0%), mainly due to the introduction of Ryanair (London and Derry), the increased capacity on BA routes to London, offset by the reduction in capacity at EasyJet. As far as the rest of the domestic market is concerned, there was a notable improvement in load-factors at EasyJet (Bristol and Belfast).
Glasgow Airport has been recognised by ACI Europe (Airports Council International) as one of the fastest-growing airports in Europe in 2015.
Traffic at Aberdeen reached 3.5 million passengers (-7.0%). Traffic at this airport is very closely-linked to the Oil & Gas industry in the North Sea, and the oil price fell more than 30% during 2015 which led helicopter traffic, which services the oil rigs, fell -9.6%.
International traffic declined (-4.3%), mainly as a reflection of the loss of passengers on the Scandinavian routes (oil industry destinations),
the reduction in rotations to Frankfurt and Dublin and Air Baltic’s suspension of its route to Riga. This was partially offset by Wizz Air’s new routes to Warsaw and Geneva. Domestic traffic fell (-7.7%) for two main reasons: the readjustment of the routes to London as the competition between the four airlines offering services to this destination had given rise to overcapacity on this route in 2014, and the consolidation of routes carried out by BMI and Eastern as part of their restructuring.
Traffic at Southampton fell to 1.8 million passengers (-3.0%). The drop was due to Flybe’s consolidation of its routes to France as part of the airline’s restructuring process completed this year, and to the rationalisation of the overcapacity which had been created on the routes to Guernsey and Jersey by Flybe and Blue Islands.
Domestic traffic declined (-1.4%), mainly as a reflection of the weaker performance on the routes to Guernsey, Jersey, Glasgow, Edinburgh and Manchester, offset by the good performance of the routes to Leeds, Newcastle and Belfast. International traffic deteriorated (-5.6%), mainly due to the performance of the routes to Nice, Nantes, Brest, Paris Orly, Dublin and Geneva, which was partly offset by the new route to Bastia (Corsica) and the good performance of the routes to Antwerp and Düsseldorf.
AGS revenues & EBITDA
During 2015, the UK regional airports posted EBITDA growth of +10.1% vs. revenue growth of +4.0%, thanks to cost controls at Aberdeen (-7%) and Southampton (-4.1%). Note the significant (+21.9%) EBITDA growth at Glasgow Airport.
AGS net bank debt
At 31 December 2015, the net bank debt of the regional airports stood at GBP505mn.
AGS dividends
In 2015, the regional airports distributed ordinary dividends of GBP60mn, of which EUR38mn corresponded to Ferrovial.
AGS results
Revenues EBITDA EBITDA margin
(GBP million) Dec-15 Dec-14 Var. Dec-15 Dec-14 Var. Dec-15 Dec-14 Var. (pbs) Glasgow 103.8 95.4 8.8% 43.9 36.0 21.9% 42.3% 37.8% 453.5 Aberdeen 63.4 64.5 -1.7% 26.4 24.7 6.8% 41.7% 38.3% 333.3 Southampton 27.6 27.4 0.5% 8.1 7.2 13.6% 29.5% 26.1% 340.5 Corporate -4 n.a. n.a. n.a. n.a. TOTAL AGS 194.8 187.4 4.0% 74.8 67.9 10.1% 38.4% 36.3% 214.6

Results January - December 2015. Ferrovial S.A. & subsidiaries
39
F. BALANCE SHEET
Dec-15 Dec-14 Dec-15 Dec-14
FIXED AND OTHER NON-CURRENT ASSETS 16,821 19,426
EQUITY 6,541 6,021 Consolidation goodwill 1,885 1,982
Capital & reserves attrib to the Company´s equity
6,058 5,672
Intangible assets 234 223
Minority interest 483 349 Investments in infrastructure projects 8,544 10,757
DEFERRED INCOME 1,088 987
Property 15 6
Plant and Equipment 491 451
NON-CURRENT LIABILITIES 9,314 13,030 Equity-consolidated companies 3,237 3,317
Pension provisions 46 101
Non-current financial assets 755 856
Other non current provisions 838 1,378 Long term investments with associated companies 411 375
Financial borrowings 6,697 8,707
Restricted Cash and other non-current assets 261 405
Financial borrowings on infrastructure projects 5,320 7,331 Other receivables 83 76
Financial borrowings other companies 1,376 1,375
Deferred taxes 1,254 1,438
Other borrowings 171 202 Derivative financial instruments at fair value 406 395
Deferred taxes 1,124 1,310
Derivative financial instruments at fair value 438 1,332 CURRENT ASSETS 8,563 6,048
Assets classified as held for sale 2,418 2
CURRENT LIABILITIES 8,442 5,435 Inventories 387 357
Liabilities classified as held for sale 2,690 0
Trade & other receivables 2,455 2,244
Financial borrowings 1,385 1,368 Trade receivable for sales and services 1,821 1,716
Financial borrowings on infrastructure projects 1,297 1,276
Other receivables 499 454
Financial borrowings other companies 88 92 Taxes assets on current profits 135 74
Derivative financial instruments at fair value 259 100
Cash and other temporary financial investments 3,279 3,439
Trade and other payables 3,484 3,493 Infrastructure project companies 306 396
Trades and payables 1,996 1,940
Restricted Cash 36 59
Liabilities from corporate tax 138 56 Other cash and equivalents 270 337
Other non commercial liabilities 1,350 1,497
Other companies 2,973 3,043
Trade provisions 622 475 Derivative financial instruments at fair value 23 5
TOTAL ASSETS 25,384 25,473
TOTAL LIABILITIES & EQUITY 25,384 25,473
G. CONSOLIDATED PROFIT & LOSS ACCOUNT
Before Fair value Adjustments
Fair value Adjustments Dec-15
Before Fair value
Adjustments
Fair value Adjustments Dec-14
REVENUES 9,701 9,701 8,802 8,802 Other income 9 9 8 8 Total income 9,709 9,709 8,810 8,810 COGS 8,683 8,683 7,828 7,828 EBITDA 1,027 1,027 983 983 EBITDA margin 10.6% 10.6% 11.2% 11.2% Period depreciation 256 256 244 244 EBIT (EX DISPOSALS & IMPAIRMENTS) 770 770 738 738 EBIT margin 7.9% 7.9% 8.4% 8.4% Disposals & impairments 185 -54 131 0 5 5 EBIT 955 -54 901 738 5 743 EBIT margin 9.8% 9.3% 8.4% 8.4% FINANCIAL RESULTS -498 -138 -637 -421 44 -377 Financial result from financings of infrastructures projects -463 -463 -373 -373 Derivatives, other fair value adjustments & other financial
-12 -188 -200 -11 -9 -20
Financial result from ex infra projects -35 -35 -33 -33 Derivatives, other fair value adjustments & other ex infra
12 49 61 -4 53 49
Equity-accounted affiliates 275 37 312 159 -20 138 EBT 732 -155 577 476 28 504 Corporate income tax 25 30 54 -138 -14 -152 NET INCOME FROM CONTINUED OPERATIONS 757 -126 631 338 15 352 Net income from discontinued operations CONSOLIDATED NET INCOME 757 -126 631 338 15 352 Minorities 33 56 89 49 0 50 NET INCOME ATTRIBUTED 790 -70 720 387 15 402

Results January - December 2015. Ferrovial S.A. & subsidiaries
40
Revenues
Dec-15 Dec-14 Var. Like-for-Like Construction 4,287 3,942 8.8% 1.2% Airports 8 9 -9.7% -9.7% Toll Roads 513 432 18.9% 17.2% Services 4,897 4,401 11.3% 4.2% Others -6 18 -133.9% -133.5% TOTAL 9,701 8,802 10.2% 3.2%
EBITDA
Dec-15 Dec-14 Var. Like-for-Like Construction 393 349 12.8% 2.3% Airports -13 -12 -1.3% -1.3% Toll Roads 333 257 29.6% 25.6% Services 312 387 -19.4% -26.4% Others 1 2 -59.8% n.s. TOTAL 1,027 983 4.5% -4.2%
Depreciation
Depreciation was higher than last year (+5.2% LfL) at EUR256mn.
EBIT (before impairments and fixed asset disposals)
Dec-15 Dec-14 Var. Like-for-Like Construction 364 312 16.5% 5.0% Airports -13 -13 -1.3% -1.2% Toll Roads 250 182 37.3% 26.8% Services 173 260 -33.5% -40.4% Others -4 -3 -11.0% -97.0% TOTAL 770 738 4.3% -7.0%
For the purposes of analysis, all the commentaries refer to EBIT before impairments and disposal of fixed assets.
Impairments and fixed asset disposals
Impairments and fixed asset disposals amounted to EUR131mn in 2015 (vs. EUR5mn in 2014), mainly including:
The capital gain corresponding to Ferrovial on the sale of the Indiana Toll Road, which amounted to +EUR46mn.
The positive impact of the deconsolidation of the Ocaña–La Roda and R-4 toll roads of +EUR140mn on the reversal of the accumulated losses, neither with any cash impact.
A provision charged at Autema (-EUR55mn).
Financial result
Dec-15 Dec-14 Var. Infrastructure projects -463 -373 -24.0% Ex infra projects -35 -33 -8.6% Net financial result (financing) -498 -406 -22.8% Infrastructure projects -200 -20 n.s. Ex infra projects 61 49 25.7% Derivatives, other fair value adj & other financial result -139 28 n.s.
FINANCIAL RESULT -637 -377 -68.6%
Financial expenses increased by EUR259mn in 2015 vs. 2014, as a combination of the following impacts:
In the financing result (additional expense of EUR92mn): mainly due to higher financing expenses on infrastructure projects, mainly reflecting the entry into operation of the US toll roads (NTE 1-2 and LBJ which accounted for additional costs of EUR43mn and EUR27mn respectively), and lower capitalised interest.
In the fair value adjustments result (EUR167mn higher financial expense): principally due to the project element, specifically derivatives at Ausol and SH-130, assets which are being refinancing that have not passed the effectiveness test (EUR186mn of additional financial expense with no cash impact). This impact was partly offset by the earnings at the parent company level on its equity swap hedges linked to remuneration plans (EUR46mn), due to the rise in the share price in 2015 (the year-end closing price on 31 December was EUR20.86/share vs. EUR16.43/share in December 2014). At year-end 2015, the number of shares covered amounted to 5,587,754 million.
Equity-accounted results
Dec-15 Dec-14 Var. Construction -3 -12 76.2% Services 31 20 51.5% Toll Roads 84 60 41.5% Airports 199 70 183.5% TOTAL 312 138 125.6%
Note the good operating performance of the principal equity-accounted assets. EBITDA growth at the 407ETR toll motorway was +14.2%, at HAH +19.7% (+4.4% in pro-forma terms) and +10.1% at the regional airports.
At the net level, the equity-accounted companies made a contribution of EUR312mn after tax (vs. EUR138mn in 2014). Heathrow’s contribution of EUR186mn after tax was a particular highlight (vs. the EUR74mn last year), boosted by non-recurrent non-cash impacts of the changes in the terms and conditions of the pension plan, hedging and a lower tax rate in the UK (which totalled EUR138mn). The contribution from AGS amounted to EUR14mn).
Taxation
The Profit & Loss account for the year recognises an inflow for corporate tax of EUR54mn, when the earnings before tax was EUR577mn. This figure is derived from a series of specific elements that distort the calculation of the effective tax rate:
The important weight in the earnings before tax of the equity-accounted result (EUR312mn), which is booked net of tax.
The result of the deconsolidation of the Madrid R4 and Ocaña- La Roda toll roads, which corresponds to the reversal of past losses on which no tax impact was recognised, such that nor is there a tax impact on the reversal.
Activation of tax credits in the US due to the impact of the sale of the ITR and Chicago Skyway.
On a cash basis, Ferrovial’s consolidated cash flow statement shows a payment of EUR61mn.

Results January - December 2015. Ferrovial S.A. & subsidiaries
41
Net result
The net result stood at EUR720mn (up from EUR402mn in December 2014). This result was affected by a series of one-offs, the most important of which include:
Desconsolidation of Ocaña-La Roda and R4 (+EUR140mn)
Non-recurrent items at HAH (+EUR138mn): pension adjustments, tax rate and derivatives.
One-off fiscal impacts (+EUR175mn)
Sale of Indiana Toll Road (+EUR30mn)
Fair value adjustmentsof derivatives (-EUR55mn): mainly due to the impact of derivatives at SH-130 and Ausol (-EUR87mn), partially offset by the positive impact of the equity swaps (+EUR33mn).
Provision registered for Autema (-EUR55mn).
The total impact of these one-offs amounted to EUR373mn.
H. NET DEBT & RATING
NET DEBT
The net cash position, excluding infrastructure projects, stood at EUR1,514mn at 31 December (vs. EUR1,632mn in December 2014), not including the cash inflow for the disposals of the Chicago (USD269mn) or the Irish (EUR61mn) roads.
In 2015, no amounts for discounts from factoring or the German method were included, which at year-end 2014 amounted to EUR118mn. In 2015 no payments were received from the Supplier Payment Plan, vs. EUR75mn collected in 2014 (EUR49mn at the Construction division and EUR26mn at Services).
During the year, Ferrovial made investments, excluding infrastructure projects, for a net total of EUR300mn vs. EUR557mn in 2014, which included the investment in the acquisition of 50% of AGS).
In terms of dividend payments, the company used EUR532mn for Ferrovial’s shareholder remuneration, including the share buy-back and scrip dividends vs the 510mn of 2014. Additionally EUR40mn were paid to minority shareholders of Ferrovial’s subsidiaries (EUR30mn in 2014).
Meanwhile, the figure for dividends received from projects amounted to EUR477mn, of which EUR267mn corresponded to Toll Roads, EUR132mn to Airports and EUR78mn to Services.
Project net debt stood at EUR6,057mn (vs. EUR7,862mn in December 2014). This net debt includes EUR351mn related to toll roads under construction (NTE 35W & I-77).
Project net debt contracted considerably during 2015 (by -EUR1,806mn), mainly due to the following positive impacts:
The deconsolidation of the Ocaña-la Roda (EUR560mn) and R4 (EUR644mn) toll roads.
The reclassification as “assets held for sale” of the Irish toll roads (EUR287mn) and the Chicago Skyway (EUR1,369mn).
And the positive pre-tax operating cash flow generated during the period (EUR349mn).
The above was partially offset by the negative FX impact of euro weakness (EUR498mn) and the investment cash flow during the year (EUR556mn) in the construction of these toll roads.
The group’s net consolidated debt at 31 December 2015 stood at EUR4,542mn (vs. EUR6,230mn in December 2014).
Dec-15 Dec-14 NCP ex-infrastructure projects 1,514 1,632
Toll roads -5,518 -7,509 Others -539 -353
NCP infrastructure projects -6,057 -7,862 TOTAL NET CASH POSITION -4,542 -6,230
Dec-15 Dec-14 Gross financial debt -8,083 -10,079
Gross debt ex-infrastructure -1,465 -1,471 Gross debt infrastructure -6,618 -8,608
Gross Cash 3,540 3,848 Gross cash ex-infrastructure 2,973 3,103 Gross cash infrastructure 567 745
TOTAL NET FINANCIAL POSITION -4,542 -6,230
CREDIT RATING
On 17 June 2015, Standard & Poor’s affirmed Ferrovial’s rating at BBB with Stable Outlook. In July 2015, Fitch Ratings affirmed Ferrovial’s rating at BBB /Stable /F3.
Agency Rating Outlook S&P BBB Estable FITCH BBB Estable
DEBT MATURITIES EX-PROJECTS
Year Corporate debt maturities 2016 34 2017 10 2018 502 2019 9 2020 12 2021 - 2030 830 2031 - 2040 8 2041 - 2050 0

Results January - December 2015. Ferrovial S.A. & subsidiaries
42
I. SHAREHOLDER REMUNERATION
2014-2015 DIVIDEND
The company held its AGM on 27 March 2015. The AGM approved two capital increases, by means of the issuance of new ordinary shares, with no issue premium, of the same class and series as those at present in circulation, charged to reserves. These increases form part of the shareholder remuneration system known as the “Ferrovial Flexible Dividend”, which the company introduced in 2014, and which replaces the traditional complementary dividend payment for 2014 and the 2015 interim dividend. The purpose of this programme is to offer all the company’s shareholders the option, at their choice, of receiving free new shares in the company, thus with no alteration to its policy of paying its shareholders in cash, as they can alternatively opt to receive a cash payment by means of selling the free rights that they receive, pro rata to their existing holdings, to the company, or in the market.
The first of the scrip issues (equivalent to the 2014 complementary dividend) took place in May 2015, with the following result:
The price at which Ferrovial guaranteed to buy the rights was fixed at EUR0.304 gross per right.
The number of rights required to receive one new share was 66.
The holders of 47.82% of the rights opted to have new shares in Ferrovial, which involved the issue of 5,306,164 new shares (0.72% of the outstanding shares prior to the capital increase).
The holders of 52.18% of the rights opted to receive cash. Ferrovial bought 382,182,272 rights (for a gross amount of EUR116,183,410.69).
At the Board Meeting held on 29 October 2015, the terms of the second scrip issue (equivalent to the 2015 interim dividend) were set, and the issue had the following result:
The price at which Ferrovial guarantees to buy the rights was fixed at EUR0.398 gross per right.
The number of rights required to receive one new share was 57.
The holders of 48.68% of the rights opted for new Ferrovial shares, which involved the issuance of 6,299,690 new shares (0.85% of the capital prior to the capital increase).
The holders of 51.32% of the rights opted to receive cash. Ferrovial acquired 378,612,938 rights (for a gross amount of EUR150,687,949.32).
SHARE BUY-BACK AND CANCELLATION
The AGM held in March similarly approved a capital reduction by means of the buy-back and subsequent cancellation of own shares. The programme is intended to enhance the company’s shareholder remuneration policy by means of increasing the earnings per share.
As established at the AGM, the buy-back programme ended on 18 November 2015 with a total of 11,783,954 own shares acquired (within the limits set of EUR250mn or 18 million shares).
Subsequently, the company reduced capital by EUR2,356,790.80, by means of cancelling treasury stock of 11,783,954 shares.
In addition to the above-mentioned share buy-back programme, in 4Q15 the company bought 760,990 own shares which are expected to be cancelled during 2016.
At 31 December 2015, Ferrovial’s capital stood at EUR146,442,214.80, fully subscribed and paid up. The capital comprises 732,211,074 ordinary shares of one single class and a nominal value of twenty eurocents (EUR0.20) each.
J. SHAREHOLDING STRUCTURE
In August 2015, Portman Baela, S.L. and Karlovy, S.L., transferred all the capital that they held in Ferrovial to their associates (transaction described in more detail in the Annex on page 24, Relevant Events. After this transaction, the previous shareholder agreement regarding Ferrovial, S.A. has been dissolved.
In events after the close, on 13 January 2016, UBS Limited sold a block of 30,387,965 shares in Ferrovial S.A., representing approximately 4.15% of the capital, on the orders of Siemprelara S.L., at EUR19.07/share, which were placed with qualified investors. Additionally, on 21 January 2016, Mr. Leopoldo del Pino y Calvo-Sotelo gave notice of his resignation as Director of the Ferrovial’s Board.
After the above-mentioned transactions and as filed with the CNMV, the significant shareholdings in Ferrovial S.A. are now as follows:
Rijn Capital BV, (company controlled by Rafael del Pino y Calvo-Sotelo): 20.3%
Menosmares, S.L.U., (company controlled by María del Pino y Calvo-Sotelo): 8.2%
Siemprelara S.L.U., (company controlled by Leopoldo del Pino y Calvo-Sotelo): 4.2%
Soziancor, S.L.U., (company controlled by Joaquin del Pino y Calvo-Sotelo): 2.5%

Results January - December 2015. Ferrovial S.A. & subsidiaries
43
K. CONSOLIDATED CASH FLOW
Dec-15 Ex-infrastructure projects Cash Flow
Infrastructure projects Cash Flow Adjustments Total Cash Flow
EBITDA 580 447 1,027 Dividends received 477 -78 399 Working capital variation (account receivables, account payables and others) -168 -67 -234
Operating flow (before taxes) 889 380 -78 1,191 Tax payment -29 -31 -61 Tax return from previous exercises Operating Cash Flow 860 349 -78 1,130 Investments -374 -556 92 -839 Divestments 74 74 Investment cash flow -300 -556 92 -765 Activity cash flow 560 -208 13 366 Interest flow -35 -309 -344 Capital flow from Minorities -1 212 -92 119
Scrip dividend -267 -267 Treasury share repurchase -265 -265
Ferrovial shareholder remuneration -532 -532 Other shareholder remmuneration for subsidiary minorities -40 -83 78 -44
Forex impact -23 -498 -521 Variation of Bridge Loans (project financing) Other debt movements (non cash) -47 2,691 2,644 Financing cash Flow -678 2,014 -13 1,322 Net debt variation -118 1,806 1,688 Net debt initial position 1,632 -7,862 -6,230 Net debt final position 1,514 -6,057 -4,542
Dec-14 Ex-infrastructure projects Cash Flow
Infrastructure projects Cash Flow Adjustments Total Cash Flow
EBITDA 594 388 982 Dividends received 615 -33 582 Working capital variation (account receivables, account payables and others) -138 18 0 -120
Operating flow (before taxes) 1,071 406 -33 1,444 Tax payment -42 -20 -62 Tax return from previous exercises 42 42 Operating cash flow 1,072 386 -33 1,425 Investment -581 -365 77 -870 Divestment 24 -13 11 Investment cash flow -557 -365 63 -859
Activity cash flow 514 21 30 566
Interest flow -30 -263 -293 Capital flow from Minorities 1 121 -63 59
Scrip dividend -275
Treasury share repurchase -235
Ferrovial shareholder remuneration -510 -510 Other shareholder remmuneration for subsidiary minorities -30 -41 33 -38
Forex impact 85 -518 -433 Variation of Bridge Loans (project financing) -14 -14 Other (non-cash) -60 -155 0 -215 Financing Cash Flow -557 -856 -30 -1,444
Net debt variation -43 -835 0 -878 Net debt initial position 1,675 -7,027 -5,352 Net debt final position 1,632 -7,862 0 -6,230

Results January - December 2015. Ferrovial S.A. & subsidiaries
44
CASH FLOW EX-INFRASTRUCTURE PROJECTS
Operating cash flow ex-projects
Operating cash flow ex-infrastructure projects by segment in 2015 vs. 2014 is shown in the following table:
Operating cash flow Dec-15 Dec-14 Construction 272 236 Services 289 302 Dividends from Toll roads 267 255 Dividends from Airports 132 341 Other -70 -62 Operating flow (before taxes) 889 1,071 Tax payment -29 0 TOTAL 860 1,072
The ‘Other’ line includes the operating flow corresponding to the Corporation, the parent companies of Airports and Toll Roads and Real Estate as well as remuneration systems linked to the shares of the Airports, Toll Roads and Corporation.
The 2014 cash flow included EUR75mn received under the Supplier Payment Plan (EUR49mn at Construction and EUR26mn at Services).
The breakdown of the Construction and Services flow is shown below:
Construction Dec-15 Dec-14 EBITDA 393 349 EBITDA from projects 13 14 EBITDA Ex projects 380 335 Settlement from completed works (provisions & others) -111 -67
Adjusted EBITDA 269 267 Changes in factoring -118 -41 Ex Budimex Working Capital -9 -36 Budimex Working Capital 130 46 OPERATING CASH FLOW BEFORE TAXES 272 236
Services Dec-15 Dec-14 EBITDA 312 387 EBITDA from projects 74 66 EBITDA Ex projects 237 321 Dividends received 78 19 Pensions payments UK -19 -18 Ex UK Working Capital 58 24 UK Working Capital -66 -45 Operating Cash Flow before Taxes 289 302 EBITDA 312 387
The breakdown by business area for the Services division is shown in the following table:
Spain UK Rest of Services Services
EBITDA Ex-infrastructure 120 106 12 237
Dividends 61 13 5 78 Pension scheme payments 0 -19 0 -19
Working capital 52 -66 6 -8 OP. CASH FLOW EX-TAXES 233 33 23 289
The working capital variation at the Construction and Services divisions was a positive +EUR113mn in 2015, vs. a negative -EUR11mn in 2014.
Working capital detail Dec-15
Construction working capital 120 Services working capital -8
Construction & Services WC 113 Changes in factoring -118 Settlement from completed works (provisions & others) -111
Pensions payments UK -19 Remuneration in shares & other -32 Total Working Capital -168
At Toll Raods, the operating cash flow in 2015 includes EUR267mn from dividends paid and capital reimbursed by the infrastructure concession companies, as reflected in the table below.
Dividends and Capital reimbursements Dec-15 Dec-14 ETR 407 242 224 Irish toll roads 7 8 Portuguese toll roads 17 12 Greek toll roads 0 0 Spanish toll roads 0 2 Other 0 8 TOTAL 267 255
Dividends from Airports (EUR132mn) correspond to dividends received from HAH and the regional airports. In 2014, the HAH dividend (EUR341mn) included the extraordinary dividend for the sale of the regulated airports (EUR214mn) and an extraordinary dividend (EUR43mn).
Airports Dec-15 Dec-14 HAH 95 341 AGS 38 -

Results January - December 2015. Ferrovial S.A. & subsidiaries
45
Investment cash flow ex-projects
The following table shows the breakdown by business segment of the investment cash flow excluding infrastructure projects, separating in each case the outflows for investments made and the inflows from disposals:
Dic-15 Investment Divestment Investment Cash Flow Construction -46 16 -30 Services -207 0 -207 Toll roads -120 58 -62 Airports 0 0 0 Others -1 0 -1 TOTAL -374 74 -300
Dic-14 Investment Divestment Investment Cash Flow Construction -37 5 -32 Services -107 14 -92 Toll roads -79 0 -79 Airports -359 -2 -361 Others -1 7 6 TOTAL -581 24 -557
Important elements of the investment flow were the capital increases at Toll Roads, reflecting the investments made in capital for the infrastructure projects, mainly at the US toll roads under construction, as well as in Australia (Toowoomba, EUR11mn) and Colombia (Ruta del Cacao, EUR14mn), and at Services (projects in the UK). The most notable of these were the equity contributions for the Birmingham contracts (-EUR32mn) and the Ministry of Justice (-EUR14mn), as well as the investment in material fixed assets, principally at Services (in Spain).
The following table shows Cintra’s capital investments in the infrastructure projects.
Equity investment in toll roads Dec-15 Dec-14 LBJ -41 -12 NTE -3 -32 NTE 35W -44 -17 SH-130 0 -2 Spanish toll roads -3 -10 Portuguese toll roads -3 -4 Greek toll roads 0 0 Others -25 -2 TOTAL -119 -78
In terms of disposals in 2015, the most important was Cintra’s sale of ITR for EUR46mn.
Financing flow ex-projects
The financing flow includes:
Shareholder remuneration: -EUR532mn for Ferrovial shareholders (which includes the cash payment of the scrip dividend of -EUR266mn and the share buy-back of -EUR265mn, as well as the dividend payment to subsidiary minorities of –EUR40mn.
Net interest payments during the year (-EUR35mn).
FX impact (-EUR23mn), derived from the operating cash of the businesses outside the euro zone and the foreign currency positions held as hedges against future investments, net of the settlement of foreign-currency derivatives. The flow does not include in the variation in the net cash position the market value of the hedging instruments (+EUR16mn).
Other non-flow debt movements (-EUR41mn), which include the accounting movements in debt that do not affect cash flow, mainly from unpaid accrued interest.
CASH FLOW INFRASTRUCTURE PROJECT
Project operating cash flows
In terms of the operating flow of the infrastructure concession-holding companies, these basically reflect inflows at the companies in operation, although they also include the VAT payments and refunds corresponding to those still in the construction phase.
The table below shows the breakdown of the operating cash flow for infrastructure projects.
Dec-15 Dec-14 Toll roads 295 300 Other 53 87 OPERATING FLOW 349 386
Project investment cash flow
The following table shows the breakdown of the investment cash flow for the infrastructure projects, mainly outflows corresponding to capex investments during the year.
Investment cash flow Dec-15 Dec-14 LBJ -183 -314 North Tarrant Express -31 -270 North Tarrant Express 35W -255 -76 SH-130 -2 -2 Portuguese toll roads -3 -2 Spanish toll roads -15 -7 Chicago -4 -2 Other -42 -4 TOTAL TOLL ROADS -535 -677 Other -152 -94 PROJECTS TOTAL -687 -771 Equity Subsidy 131 406 TOTAL INVESTMENT CASH FLOW (PROJECTS) -556 -365

Results January - December 2015. Ferrovial S.A. & subsidiaries
46
In terms of the investment cash flow, note the important investment in concession assets under construction at Toll Roads during 2015, particularly in the US (LBJ, NTE Extension, and I-77).
Project financing cash flow
The financing cash flow reflects the dividend payments and capital repayments made by the concession companies to their shareholders, as well as the outflows for capital increases received by these companies. In the case of the concessions consolidated by global integration, these correspond to 100% of the amounts paid out and received by the concession companies, irrespective of the size of stake held by the group. No dividends or capital repayments from the equity-accounted companies are included.
The interest cash flow corresponds to the interest paid by the concession companies, as well as other commissions and costs that are closely related to financing themselves. The cash flow for these items corresponds to the interest expense relative to the period, as well as any other concept that implies a direct variation in net debt in the period.
Interest Cash Flow Dec-15 Dec-14 Spanish toll roads -65 -64 US toll roads -152 -118 Portuguese toll roads -42 -40 Other toll roads -15 -14 TOTAL TOLL ROADS -274 -237 Other -35 -26 TOTAL -309 -263
Additionally, the financing cash flow includes the impact of exchange-rate movements on the foreign-currency denominated debt, which in 2015 was –EUR498mn, fundamentally derived from the appreciation of the US dollar vs. the euro, which has had a significant impact on net debt at the US toll roads.
Finally, the heading ‘Other non-cash movements in debt’ includes the items that imply a variation in accounting debt, but which do not imply any real cash movement; note the drop in debt due to the deconsolidations carried out during the financial year (R4 and Ocaña-la Roda), and also due to the reclassification of “assets as held for sale” (Chicago Skyway and Irish toll roads).
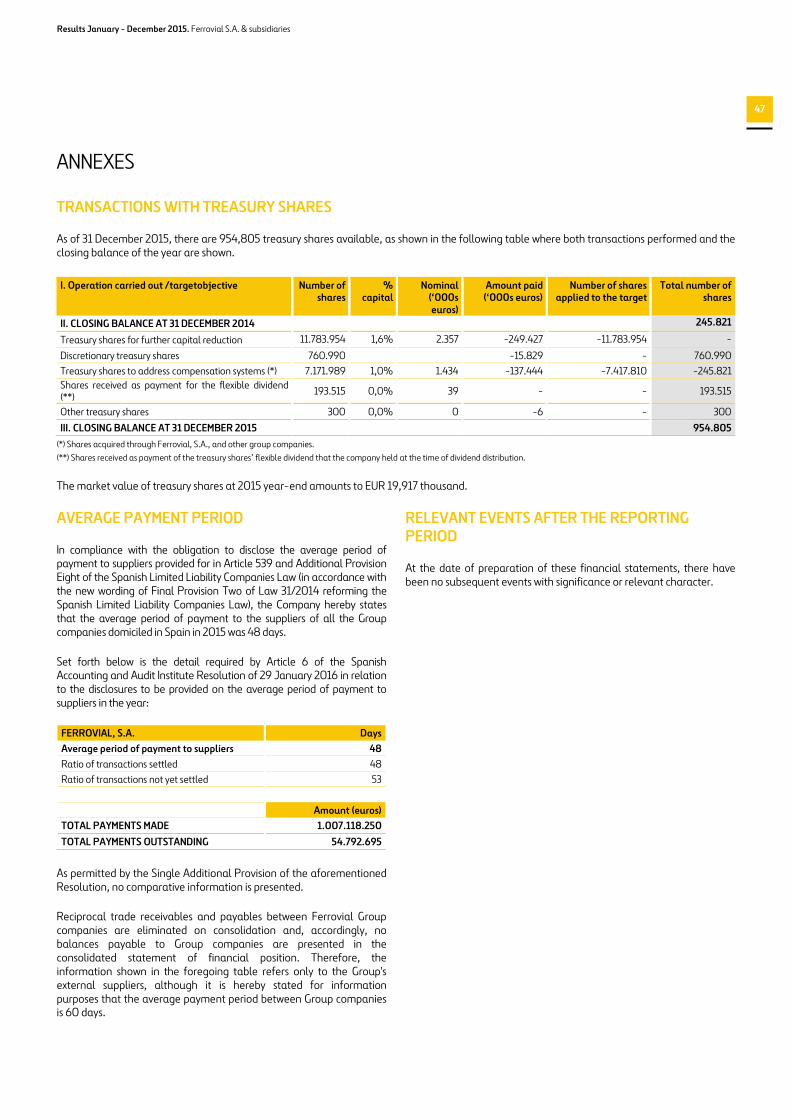
Results January - December 2015. Ferrovial S.A. & subsidiaries
47
ANNEXES
TRANSACTIONS WITH TREASURY SHARES
As of 31 December 2015, there are 954,805 treasury shares available, as shown in the following table where both transactions performed and the closing balance of the year are shown.
I. Operation carried out /targetobjective Number of shares
% capital
Nominal (‘000s euros)
Amount paid (‘000s euros)
Number of shares applied to the target
Total number of shares
II. CLOSING BALANCE AT 31 DECEMBER 2014 245.821
Treasury shares for further capital reduction 11.783.954 1,6% 2.357 -249.427 -11.783.954 -
Discretionary treasury shares 760.990 -15.829 - 760.990 Treasury shares to address compensation systems (*) 7.171.989 1,0% 1.434 -137.444 -7.417.810 -245.821 Shares received as payment for the flexible dividend (**) 193.515 0,0% 39 - - 193.515
Other treasury shares 300 0,0% 0 -6 - 300 III. CLOSING BALANCE AT 31 DECEMBER 2015 954.805
(*) Shares acquired through Ferrovial, S.A., and other group companies. (**) Shares received as payment of the treasury shares’ flexible dividend that the company held at the time of dividend distribution.
The market value of treasury shares at 2015 year-end amounts to EUR 19,917 thousand.
AVERAGE PAYMENT PERIOD
In compliance with the obligation to disclose the average period of payment to suppliers provided for in Article 539 and Additional Provision Eight of the Spanish Limited Liability Companies Law (in accordance with the new wording of Final Provision Two of Law 31/2014 reforming the Spanish Limited Liability Companies Law), the Company hereby states that the average period of payment to the suppliers of all the Group companies domiciled in Spain in 2015 was 48 days.
Set forth below is the detail required by Article 6 of the Spanish Accounting and Audit Institute Resolution of 29 January 2016 in relation to the disclosures to be provided on the average period of payment to suppliers in the year:
FERROVIAL, S.A. Days Average period of payment to suppliers 48 Ratio of transactions settled 48 Ratio of transactions not yet settled 53 Amount (euros) TOTAL PAYMENTS MADE 1.007.118.250 TOTAL PAYMENTS OUTSTANDING 54.792.695
As permitted by the Single Additional Provision of the aforementioned Resolution, no comparative information is presented.
Reciprocal trade receivables and payables between Ferrovial Group companies are eliminated on consolidation and, accordingly, no balances payable to Group companies are presented in the consolidated statement of financial position. Therefore, the information shown in the foregoing table refers only to the Group's external suppliers, although it is hereby stated for information purposes that the average payment period between Group companies is 60 days.
RELEVANT EVENTS AFTER THE REPORTING PERIOD
At the date of preparation of these financial statements, there have been no subsequent events with significance or relevant character.

48
2015 Management Report. Ferrovial S.A. and subsidiaries
3.2 HUMAN CAPITAL48
TALENT, DIFFERENTIAL LEARNING
Ferrovial offers its employees a project that encourages them to excel every day and differentiated learning in decision-making and assuming controlled risks.
In turn the company fosters a reliable and collaborative work environment that is valued by analysts and recognized in the most prestigious indices such as the Dow Jones Sustainability Index and the certified Top Employers.
Differential Learning: Total investment in training involves 0.22% of Ferrovial's total revenue, which represents an investment per employee of close to 300 euros and an average of 22 hours per employee. Created in 2007, the Ferrovial Corporate University has since become a center of excellence for placing value on key competencies such as the focus on results and the internationalization of the business. More than 4,000 participants passed through its doors in 2015, 15% of which came from outside Spain.
A. PEOPLE
CONTRIBUTION TO VALUE CREATION Operational excellence and innovation as pillars of Ferrovial's strategy and value creation differential would not be possible without a team that is characterized by their talent and commitment to these goals. Furthermore, the internationalization of the company needs talent to be brought wherever Ferrovial capabilities are keys to success.
Development plan: Ferrovial offers a professional development plan that guarantees equal opportunity based on merit.
Quality of leadership: The company assures leadership continuity with succession planning. 284 successors have been identified to cover 139 critical positions defining a coverage ratio that is higher than 2. The processes for identifying talent have 960 participants.
Collaborative Culture: Ferrovial develops tools for sharing information and recognizing people who want to contribute and learn to be internal models. 96% of employees declare to understand how their work contributes to achieving the organization's objectives.They all share their knowledge through the internal social network called Coffee (Collaboration for Ferrovial Employees), reaching 995,783 visits.
BY BUSINESS
BY COUNTRY NEW RECRUITMENTS
<30 years 30-45 years >45 years
SpainUK USA and CanadaPolandOther
BY CATEGORY
Manual Workers Clerical Professionals Managers
WORKFORCE
74,03270%MALE
30%FEMALE
AVERAGE WORKFORCE
71,784
41.9 AVERAGE AGE1 42.88.5 YEARS OF SENIORITY1 8.4
77% PERMANENT CONTRACT 81%87% MANAGERS 13%2.5% TURNOVER 0.7%67% NEW HIRES 33%
OUR EMPLOYEE PROFILE
1 The data provided corresponds to 61% of the workforce.2 Others includes the the Corporation (0.5%) and Airports (0.1%) workforce
80%
28%
37%
35%
5%
14%1%
51%
28%
6%3%
12%
Servicies (77%)
Construction (21%) Toll Roads (1%) Others2 (1%)
77%
1% 1%
21%
0 20 40 60 80 100
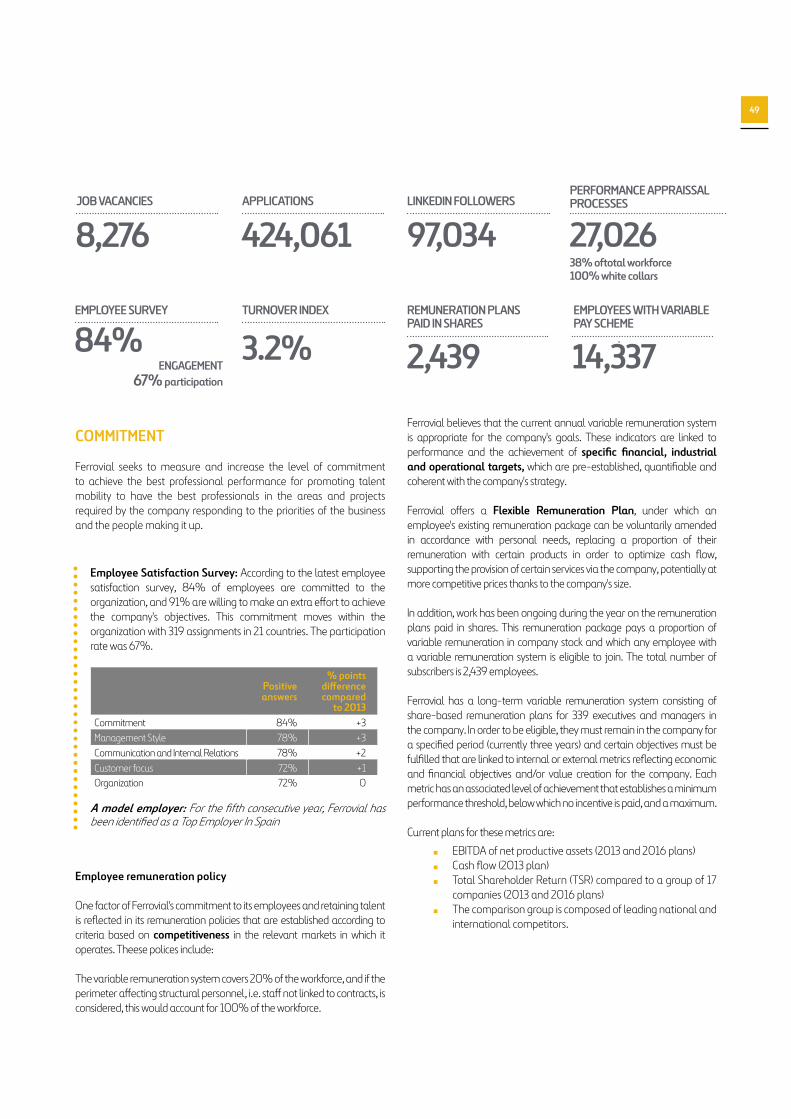
49
Ferrovial believes that the current annual variable remuneration system is appropriate for the company's goals. These indicators are linked to performance and the achievement of specific financial, industrial and operational targets, which are pre-established, quantifiable and coherent with the company's strategy.
Ferrovial offers a Flexible Remuneration Plan, under which an employee's existing remuneration package can be voluntarily amended in accordance with personal needs, replacing a proportion of their remuneration with certain products in order to optimize cash flow, supporting the provision of certain services via the company, potentially at more competitive prices thanks to the company's size.
In addition, work has been ongoing during the year on the remuneration plans paid in shares. This remuneration package pays a proportion of variable remuneration in company stock and which any employee with a variable remuneration system is eligible to join. The total number of subscribers is 2,439 employees.
Ferrovial has a long-term variable remuneration system consisting of share-based remuneration plans for 339 executives and managers in the company. In order to be eligible, they must remain in the company for a specified period (currently three years) and certain objectives must be fulfilled that are linked to internal or external metrics reflecting economic and financial objectives and/or value creation for the company. Each metric has an associated level of achievement that establishes a minimum performance threshold, below which no incentive is paid, and a maximum.
Current plans for these metrics are:
■■ EBITDA of net productive assets (2013 and 2016 plans)■■ Cash flow (2013 plan)■■ Total Shareholder Return (TSR) compared to a group of 17
companies (2013 and 2016 plans) ■■ The comparison group is composed of leading national and
international competitors.
Positive answers
% points difference compared
to 2013Commitment 84% +3Management Style 78% +3Communication and Internal Relations 78% +2Customer focus 72% +1Organization 72% 0
COMMITMENT Ferrovial seeks to measure and increase the level of commitment to achieve the best professional performance for promoting talent mobility to have the best professionals in the areas and projects required by the company responding to the priorities of the business and the people making it up.
Employee Satisfaction Survey: According to the latest employee satisfaction survey, 84% of employees are committed to the organization, and 91% are willing to make an extra effort to achieve the company's objectives. This commitment moves within the organization with 319 assignments in 21 countries. The participation rate was 67%.
A model employer: For the fifth consecutive year, Ferrovial has been identified as a Top Employer In Spain
Employee remuneration policy
One factor of Ferrovial's commitment to its employees and retaining talent is reflected in its remuneration policies that are established according to criteria based on competitiveness in the relevant markets in which it operates. Theese polices include:
The variable remuneration system covers 20% of the workforce, and if the perimeter affecting structural personnel, i.e. staff not linked to contracts, is considered, this would account for 100% of the workforce.
8,276 424,061
ENGAGEMENT 67% participation
TURNOVER INDEXEMPLOYEE SURVEY REMUNERATION PLANS PAID IN SHARES
EMPLOYEES WITH VARIABLE PAY SCHEME
84% 3.2% 2,439 14,337
38% oftotal workforce100% white collars
PERFORMANCE APPRAISSAL PROCESSESLINKEDIN FOLLOWERS
27,02697,034JOB VACANCIES APPLICATIONS

50
2015 Management Report. Ferrovial S.A. and subsidiaries
TARGET ZERO In July 2015 the Ferrovial Board of Directors updated its corporate Occupational Health and Safety policy, which concerns all company activities globally, including all business areas and their subsidiaries.
This policy seeks to "create environments that are free from risks for everyone, every day," guided by the conviction that any accident can be avoided. This vision actually sets a desired goal of "Target Zero", to which all executives and the more than 71,000 employees of the company are committed.
The purpose of creating a totally risk free environment also includes infrastructure users and citizens who interact with workspaces, safeguarding the public from any exposure to risks arising from Ferrovial's activities.
The main lines of action are set out below:
Proper organization, at the highest executive level
The highest executive level of Ferrovial oversees functions and responsibilities for health and safety, for which it has created the figure of a corporate director who reports directly to a member of the Management Committee. For ever area, the person responsible is part of the respective Business Committee.
Implementation of management systems in all business lines
Ferrovial is committed to the progressive extension of standardized management systems. At present they are implemented and verified by third parties in different countries and business areas of Ferrovial.
B. HEALTH AND SAFETY
A strict system of inspection and monitoring in the workplaceThe conditions of all Ferrovial work centers are subject to a thorough monitoring by the Health and Safety department in every business and subsidiaries of the company in the world. The company has sufficient resources in order to maintain a good level of monitoring and control over safety conditions in the workplace. During 2015 a total of 53,610 health and safety inspections and audits were conducted in its workplaces.
iAuditor in "Amey" (UK) As part of its "Target Zero" objectives, Amey implemented iAuditor, which is a simple and efficient tool to design custom inspection formats.
This significantly reduces the administrative procedure in writing inspection reports. The application rates questions by category and easily imports images for inspection criteria. Once completed, the report can be emailed as a PDF or Microsoft file.
The results are loaded into Airweb, the Amey reporting system, where the consistency of reports makes it possible to identify trends faster.
Since the implementation of iAuditor the number of inspections has almost tripled, leading to greater control of the formats facilitates any updates that are required in case of future changes in legislation and/or standards adhered to.
The company also conducted a detailed investigation not only of the accidents that took place but also of those near misses that have not yet incurred any personal injury, and can serve to learn lessons to avoid future accidents.
CONTRIBUTION TO VALUE CREATION Safety is a key factor in achieving operational excellence. Ferrovial works every day to create environments that are risk free for everyone, including users of infrastructure and services. There are two principles that govern the actions in this area: the objective of "Target Zero" and that any accident can be avoided.
-14.8% -5.8%54.4%Compared to the sector (2)
-10% inc./contractors. More than 173 million hours worked
+18.3%
HEALTH AND SAFETY TRAINING HOURS
852,976+46%
RISK ASSESSMENTS AND SECURITY PLANS
7,184 HEALTH AND SAFETY INSPECTIONS AND AUDITS
-7%53,610
FREQUENCY RATE (1) SEVERITY RATE (3)
1,344 EMERGENCY PLANS
+33%1. Interannual variation of the index which includes the number of accidents leading to days lost that occur during working hours, for every million hours worked 2. Source: statistics on work accidents and occupational illnesses. Ministry of Employment and Social Security (Spain)3. Interannual variation of the index which includes the number of accidents leading to days lost that occur during working hours, for every million hours worked

51
and safety officer assigned to work at the weekly SAFE meetings where actions to be implemented to improve the security of the work are defined.
Occupational Road Safety PlanIn September 2015 Ferrovial signed a collaboration agreement with the Spanish Foundation for Traffic Safety (Fesvial), to minimize "in itinere" and "in mission" accidents. Fesvial is a benchmark in Spain in the area of road safety; trustees of the Foundation include the Ministries of Interior, Employment and Health of Spain and Madrid City Council. In the first phase, this collaboration has resulted in the development of a Road Safety Plan for the Group, to develop a framework of Safe and Sustainable Mobility for Ferrovial employees.
Commitment to innovation
Ferrovial is convinced that new standards for performance, technology and safety measures can be developed through innovation that contribute to the aspirational goal of "Target Zero". Among the main priorities in innovation, discussed in the next chapter of this report, is the application of technologies in the area of safety.
Health and Safety Global Meeting: in 2015 Ferrovial held the first edition of the H&S Global Meeting at the headquarters of its corporate university. This event brought together employees worldwide with responsibilities in managing occupational health and safety. The meeting served to discuss updating the Health and Safety policy for the entire company, pooling the projects being developed, highlighting examples of good practice and analyzing the measurement of results.
Implementation of minimum safety standards
Some minimum security requirements apply in the Construction area in all works in all countries. Following this philosophy, safety requirements will be defined at group level which will be applied in all workplaces in all business areas.
Training for workers
Ferrovial has spent years increasing its training efforts on occupational health and safety to progressively engage workers in the common goal of creating workplaces free of hazards.
SAFE: The SAFE (Safety Awareness for Employees Ferrovial) pilot project that has been implemented successfully in various Ferrovial Agroman projects seeks to involve all employees in improving health and safety.
It affects executives, who demonstrate leadership in safety through specific safety leadership visits, middle managers, who are appointed leaders and make SAFE observations as well as manual workers, who based on their experience in the workplace, conduct proposals for improvement in working conditions and/or implemented safety measures.
These situations detected, along with those identified in the inspections carried out by the health and safety department, are jointly analyzed by the site manager, security leaders and health
Seve
rn Tr
en W
ater
Con
tract
. Uni
ted
King
dom

52
2015 Management Report. Ferrovial S.A. and subsidiaries
C. HUMAN RIGHTS
In 2014 Ferrovial approved its Human Rights Policy in order to raise awareness of these issues throughout the company, while senior management ensures compliance. This policy is coherent with the Code of Business Ethics, the principles of the United Nations Global Compact, the Universal Declaration of Human Rights, the OECD Guidelines for Multinational Enterprises and the International Labor Organization (ILO) regulations.
The Code of Business Ethics provides that "all actions undertaken by the company and its employees shall scrupulously respect the Human Rights and Civil Liberties enshrined in the Universal Declaration of Human Rights."
As a signatory of the Global Compact, Ferrovial is committed to supporting and respecting the protection of fundamental rights such as freedom of association and collective bargaining, elimination of forced or compulsory labor, eradication of child labor and the abolition of discrimination.
Ferrovial is involved in the new National Plan for Business and Human Rights, which came into force in 2014, seeking to establish a series of human rights measures, policies, processes and controls that should be adopted by companies.
MINIMIZE RISKS The company performs thorough checks to ensure respect for human rights throughout the value chain.
Responsible management of the supply chain
The company promotes among its providers adherence and compliance with the Global Compact Principles, as well as other corporate responsibility principles: Health and Safety, Quality and the Environment.
Risk management
The global corporate risk management system (FRM) covers risks derived from human rights violations. The area of risks includes those resulting from improper or poor functioning of the procedures to ensure the ethical principles governing the company’s relationship with its employees.
MAXIMIZE CONTROLS
Labor unions and collective bargaining
In each country where it operates Ferrovial guarantees workers’ rights, such as the right to strike, freedom of association and the right to collective bargaining by appointed workers’ representatives and unions. Virtually all Ferrovial employees are protected by collective labor regulations in different countries and 93% of the workforce is attached to collective agreements.
One noteworthy aspect is the framework agreement signed with the International Federation of Building and Wood Workers, FECOMA (Fedeación de Construcción, Madera y Afines) and MCA (Madera, Construcción y Afines) with around 350 labor unions representing around 12 million members in 135 countries. This is an agreement to respect and promote the principles enshrined in the Universal Declaration of Human Rights, the ILO Tripartite Declaration, the OECD guidelines for multinational companies and the United Nations' Global Compact.
Equality and non-discrimination
As a business, social and legal principle, Ferrovial is a supporter of diversity and complies with current legislation on equal opportunities.
Commitment to disadvantaged groups
The company has signed several agreements with Adecco Foundation, Family Plan and Integra Foundation, among others, for the integration of people with disabilities who face the risk of social exclusion.
The fact Ferrovial joined the Business Network for a Society Free of Gender Violence reinforces the company's commitment to raise awareness and promote the employment of women who are victims of abuse.
Workplace Harassment: In 2015 the company updated its Procedure for the Prevention of Workplace Bullying, Sexual Harassment and/or Gender-based Harassment. The approach is founded on the Code of Business Ethics and also draws on the stipulations of Organic Law 3/2007, passed by the Spanish government on March 22, 2007, to guarantee effective equality between men and women, and to protect employees from potential situations of gender-based harassment in the workplace. This procedure guarantees the right to the privacy and confidentiality of the subjects discussed and the persons involved.
Training and awareness
Ferrovial is committed to raising awareness within its sphere of influence, as well as promoting knowledge and good practices. All Code of Ethics courses at executive and management level include a module on Human Rights.
An on-line training course was introduced in 2010 on the Code of Ethics. So far, 4,282 training hours have been given on the subject to 11,289 employees. Ferrovial capitalizes on its involvement in international forums and training programs to raise awareness of the need for the private sector to take a role in the protection of human rights. Evidence of this was the appointment of Ferrovial as the Secretary of the Executive Committee of Forética in 2012 and its involvement on the Executive Committee of the Global Compact Network
CONTRIBUTION TO VALUE CREATION Ferrovial is committed to minimizing risks and maximizing controls to ensure that Human Rights are respected throughout the organization and its supply chain.

53
3.3 INTELLECTUAL CAPITAL: INNOVATION
CONTRIBUTION TO VALUE CREATION Innovation is a key driver of the company to meet the challenges of society and the needs of customers, in its commitment to operational efficiency and the search for competitive and differentiating solutions in the priority areas of research.
STRATEGY CULTURE
R+D PROJECTS CARRIED OUT R+D INVESTMENTS (1) (M€)
PROJECTS IN COLLABORATION WITH MIT (2)
+100 44 5
OVERVIEW OF THE INNOVATION PROCESS
(2) Massachusets Institute of Technology
PROCESS
Articulated by a Committee made up of innovation managers of business units and chaired by the Chief Information Officer and Innovation Officer, which defines the priority areas of research and coordinates through a dashboard of indicators.
Once a business challenge is identified, a project is structured that is supported in an open ecosystem made up of government innovation agencies, research centers, large enterprises, technical offices and internal competition centers and startups.
Promoted by senior management (Innovation Days), promoted by middle management (SUMMA University), and built by employees (Zuritanken; in 2015 the winning ideas from the 2014 edition are being implemented).
PRIORITY AREAS OF RESEARCH
Toll Roads
The main business lines include the optimization of traffic models, new payment methods, models to relate to and offer services to users, and solutions that increase operational effectiveness.
Big Data for traffic models: It is a project that involves building models based on telephone data and positioning, in order to make more accurate traffic predictions. It will be useful in tendering processes and to know more about users' mobility needs.
Cities
Projects are developed to meet the needs of the cities of the future. They are aimed at cutting costs and improving the quality of life of the population, by guaranteeing sustainable economic development.
Urban laboratory projects have been started up in several cities, like in Madrid, Santander (Spain) and Sheffield (United Kingdom). These projects have promoted cutting-edge solutions such as "Madrid Smart Parking", "Revive" and "The Urban Solutions Project", to improve urban mobility in a more sustainable and efficient way.
In 2015, Ferrovial Services was a Global Partner of the Barcelona Smart City Expo World Congress and joined the Smart City Sectorial Forum in Spain, and the All-Party Parliamentary Group for Smart Cities, in the United Kingdom.
Energy Efficiency With the aim of reducing greenhouse gas emissions, helping to reduce energy costs and anticipating future regulations, projects are being developed in energy efficiency maintenance, monitoring, auditing and optimization for buildings, reducing power consumption in public lighting, and expert energy management systems.
Light for GLASS: The project uses Google Glass, Google's electronic glasses, for infrastructure maintenance, in order to optimize client and citizen satisfaction. This project is being implemented in the lighting contract in Torrejón de Ardoz, managed by Ferrovial Services.
Waste Recycling In response to concerns regarding climate change and environmental sustainability, projects are underway to recover energy from waste, both as a partial substitute for conventional fossil fuels and as a solution to treat or eliminate the growing volumes of waste generated by the consumer society, as well as recovering materials from this waste.
All the plastic that citizens put in the bin is reused in the treatment plants managed by Ferrovial to be turned into raw materials to make new objects.
(1) This amount includes 849,995€ related to the colaboration with MIT. Amount considered R+D Investments and community investment.

54
2015 Management Report. Ferrovial S.A. and subsidiaries
Circular Economy: Ferrovial uses many elements for its activities (like barriers, cones, tape and street furniture) made out of plastic that can be produced using recycled materials. Ferrovial Agroman and Ferrovial Services, together with two specialized companies, are developing a project to manufacture all these elements using their own recycled plastic for internal consumption.
Innovative Construction
Execution of projects that improve the productivity and environmental sustainability of construction activity in all of its areas.
WPP (Warning Presence of People): A project to stop accidents in tunnels, where the interaction between man and machine is more complex. It combines sensor technologies (wearable devices) with localization in confined areas to produce a system of proximity warnings and alerts.
e-Tunnel: A project that is being implemented in the Padornelo tunnel in Spain, to measure air quality in tunnels in real time, with signals and alarms to prevent possible accidents caused by the inhalation of noxious gases.
Water
Energy and process optimization, both in the field of seawater desalination by reverse osmosis and in the purification of waste waters. For this, innovative technologies are incorporated and existing water treatment processes are improved, while new ones are developed.
Ferroaqua: A technology has been developed and implemented which improves the administration of water treatment plants, as it manages operational and water quality parameters in a centralized way and in real time.
Airports
The lines of research focus on the optimization of real-time integrated management of the various assets and resources through sensor technologies or portable devices (wearables), improving the passenger experience within the airport, as well as the development of new business models and services.
Insider Navigation: An augmented reality application for mobile devices that facilitates passenger movement within the airport right to the boarding gate, while also providing passengers with services and commercial offerings.
StandWatch: Solution that records snow removal work through wearable technology, using smart watches and cloud-based services.
Ligh
t for
Gla
ss P
roje
ct, M
adrid
. Spa
in

55
3.4 ENVIRONMENT AND NATURAL CAPITAL
CONTRIBUTION TO VALUE CREATION Ferrovial is aware of its responsibility to address climate change and is firmly committed to reducing the environmental impact of all its activities. It also drives generating new ideas and business models, to offer its clients innovative solutions with a lower impact.
-43.70% -28%IN ABSOLUTE TERMS(2009-2015)
IN RELATIVE TERMS (tCO2eq/M€) (2009-2015)
COMPARABLE TERMS (2014-2015)
RECYCLED WASTE (t)
+58%100% AT AMEY
RENEWABLE ELECTRICITY CONSUMED
19%REDUCTION OF CO2 EMISSIONS CO2
GREENHOUSE GAS EMISSIONS (SCOPE 1 & 2 & 3 & BIOMASS) IN ABSOLUTE TERMS, BY TYPE OF SOURCE
REDUCTION OF ENVIRONMENTAL IMPACT Ferrovial's commitment to the environment has four priority objectives:
Carbon Footprint Reduction
Many of the company's activities are closely associated with some of the main man-made sources of carbon emissions. For Ferrovial it is key to know how to respond to the challenges and opportunities that climate change poses in the short, medium and long term. The company has therefore maintained ambitious emission reduction targets (21.3% against 2009 levels) in relative terms (tCO2eq/€M), reductions that are comfortably achieved every year.
For 2015, a reduction of 11.61% was established in relative terms compared to the baseline year. This would mean maintaining Scope 1&2 emissions and energy and electricity consumption at the same level as in 2009, despite an increase of 13.1% in turnover.
Thus, the 2015 target, in terms comparable to turnover, is to reduce scope 1&2 emissions in absolute terms by 93,698 tCO2eq against 2009, of which 81,508 tCO2eq and 12,190 tCO2eq would be scope 1 and 2 respectively.
During the financial year the target was achieved, with emissions cut by 223,300 tCO2eq against the baseline year.
To meet this commitment, Ferrovial has developed and implemented action plans, both general and specific to each business area:
Total Emissions Verified
4,240,266 tCO2eq
Scope 1 495,305
tCO2eq
Fugitive: 135 tCO2eq
Mobile: 201,973 tCO2eq
Stationary: 140,398 tCO2eq
Diffuse: 152,799 tCO2eq
Machinery: 134,669 tCO2eq
Electricity: 87,871 tCO2eq
Fuel and energy related activities: 163,221 tCO2eq
Waste generated in operations: 261,947 tCO2eq
Use of product: 844,645 tCO2eq
Other: 2,387,277 tCO2eq
Heating: 5,729 tCO2eq
Scope 287,871 tCO2eq
Scope 3 3,657,090
tCO2eq

56
2015 Management Report. Ferrovial S.A. and subsidiaries
56
Managing vegetation of the Northern Power electricity grid. United Kingdom
■■ ■Inclusion of energy efficiency criteria in purchasing and service subcontracting; purchase of electricity from certified renewable sources; use of alternative fuels; and more alternative vehicles
■■ Sustainable Mobility Strategy for Ferrovial employees. All corporate offices in Spain and the United Kingdom have mobility plans.
■■ Improved energy efficiency in both industrial vehicle and passenger car fleets.
■■ The development of technology and processes to optimize levels of emissions avoided.
■■ Incorporation of energy efficiency measures in corporate office buildings.
■■ Drive toward buying electricity from renewable sources. This has entailed that 100% of the electricity purchased by Amey comes from renewable sources.
Since 2009, Ferrovial has reduced its emissions in relative terms by 43.70%, which is much higher than the goal set for 2020. In absolute terms it has reduced more than 28%.
For more information on Carbon Footprint, (visit http://www.ferrovial.com/en/our-commitment/quality-environment/climate-strategy/carbon-footprint-management/).
Monitoring water footprint
In 2015, the "Water Footprint" project was carried out to develop a methodology for the calculation and reporting of water consumption and associated discharge. In addition, risks and opportunities related to water were analyzed. The scope of this project covers all group companies on which it has operational control.
The methodology for calculating the Water Footprint is specific to Ferrovial and has been developed based on the principles of "The Water Footprint Assessment Manual" (WFM) and the "Global Water Tool" (GWT) and GRI-G4. These indices consider aspects such as water stress in the country, impact on water resources, impact on water quality and access to water. The impact on this resource is quantified in this way.
Ferrovial Water Footprint consists of three indices:
Business Water Index (BWI) related to water consumption and discharge carried out in Ferrovial activities.
Water Treatment Index (WTI) related to the impact water treatment activity (WWTP, Wastewater Treatment Plant; IWWTP, Industrial Wastewater Treatment Plant; DWTP, Drinking Water Treatment Plan; and SDP Seawater Desalinating Plant) has on the resource.
Water Access Index (WAI) related to water supply projects in Social Action programe.
It is currently being implemented and the first data will be obtained for 2016.
Business Water Index
Water Treatment Index
Water Access Index
NEW WATER FOOTPRINT METHODOLOGY
BWI
WTI
WAI

57
restrictions due to protected fauna; 19 were located in Protected Natural Areas; and 12 had high-quality watercourses nearby.
In 2015 the drafting of the Guide to buying wood in collaboration with the WWF (World Wildlife Fund) was completed. This guide presents a number of tools and methodologies to follow to ensure different levels of guarantee of origin offered by a product as well as information about the regulation around this raw material and its derivatives, which is clear from the point of view of sustainability.
Reducing the environmental impact caused by the activity
A substantial increase was observed in the rate of recycled waste in comparable terms bur also in absolut terms, thanks to the increase of the reporting scope in the Construction division with seven new geographies. Its maintains compliance with the objective of increasing the recycling rate of 5% per annum.
RECYCLED WASTE
2015 2014 2013Total (t) 1,071,021 540,289 97,840
GENERATION OF NEW BUSINESS IDEAS
The company leverages its participatory role in the most important global forums on climate change, energy transition and the loss of biodiversity to anticipate trends in these areas and identify new opportunities and business models.
In particular, it works to improve energy efficiency in buildings, intelligent management of cities, the challenges of the circular economy, biodiversity markets, mobility of low emissions, waste treatment and energy production from it ("energy from waste"). Thus, new ideas are already generating business and sustainable value for Ferrovial, or will do so in the very near future.
Biodiversity and Natural Capital As part of the “Ferrovial, Natural Capital” program, the company carries out several biodiversity projects, aimed both at assessing and mitigating the impact on natural spaces or ecosystems that are affected by its activity, and also at anticipating market trends and, if applicable, making the most of any opportunities that arise.
In 2015 Ferrovial worked with several scientific institutions (Massachusetts Institute of Technology and Rey Juan Carlos University in Madrid) to develop a corporate methodology to measure the company's impact on biodiversity. The aim is to have a contrasted evaluation method in 2016 for all of the company's activities, which will serve as a tool when making decisions, incorporating the criterion of "No Net Loss of Biodiversity».
The company also continues to work in the area of ecological restoration of habitats affected by the construction and operation of its infrastructure. Ferrovial has been working with several scientific organizations for over a decade and this has enabled the company to gain a lot of knowledge in this field. Thanks to this, as part of the Spanish Companies and Biodiversity Initiative, the company is taking part in a public-private partnership project with the Biodiversity Foundation and the Spanish Ministry of Agriculture, Food and the Environment.
As for emerging biodiversity markets, Ferrovial has explored various offsetting mechanisms that exist on the market, including the development of a pilot project in Spain that finished in 2015. Ferrovial is currently following the development of new legal frameworks in countries like Spain and the UK.
Ferrovial Agroman has had a specific procedure in place for several years that is used to quantitatively evaluate risks associated to protected areas or areas of high ecological value, and has been implementing measures to offset and control environmental impacts.
In 2015, the Group worked on 21 projects which were under an Environmental Impact Statement (or equivalent figures, according to each country's legal framework). In 14 of these projects there were
Shore proteccion works in Jaroslawiec (Poland).

58
2015 Management Report. Ferrovial S.A. and subsidiaries
3.5 INDUSTRIAL CAPITAL
Ferrovial has a Global Procurement Policy with mandatory principles that must be complied with before, during and after each purchase. Throughout the process the principle of integrity will take precedence, founded on the Code of Business Ethics and Corporate Responsibility policies, pursuing a long-time relationship with suppliers. In some businesses there are specific procurement policies that supplement and develop the corporate policies.
The Global Procurement Committee, headed up by Ferrovial's CIO (Chief Information Officer) and comprised of the purchasing heads for each business area, coordinates and controls the company's procurement. It aims to capitalize on synergies between businesses, generate savings, share good practices and improve global procurement.
CODES OF ETHICS All employees who purchase things or hire suppliers are bound by a Buyers' Code of Ethics that establishes general guidelines, pursuing rigorous, ethical and efficient relationships. This complements the Code of Business Ethics and is applicable to all staff working in the Purchasing Departments of said divisions, who are provided with due training and are required to comply with the same. The company includes a Corporate Responsibility Clause in contracts which establishes the following commitments from suppliers in this sense.
Ferrovial also controls and monitors its suppliers' quality. It considers several factors, such as product quality, occupational health and safety
A. SUPPLY CHAIN
BY BUSINESS BY COUNTRY
Services Toll roads Construction
38%
58%
4%
SpainUK USPolandOther
21%
11%
7%
49%
12%
CONTRIBUTION TO VALUE CREATION Ferrovial manages its purchases through a comprehensive policy, which maximizes operational efficiency in supplies by using new technologies. In parallel, the company requires its suppliers to be aligned with the company's principles in terms of safety and sustainability, in compliance with its Code of Business Ethics and Corporate Responsibility Policies.
FEATURED PRODUCTS
SteelConcreteBitumen
FuelEnergyHeavy/light-duty vehicles
NUMBERS OF SUPPLIERS: 64,740
Energy reabilitation.Málaga (Spain)

5959
compliance and environmental conduct. An incident is deemed to have occurred when the average evaluation score fails to meet the requirements established in parameters. A “rejected supplier” is a supplier that incurs three incidents within a single year, or one serious incident.
CLASSIFICATION OF SUPPLIERS BY CORPORATE RESPONSIBILITY In 2012, as part of the goals of the Strategic Corporate Responsibility Plan, a system was introduced to classify high-risk suppliers in terms of corporate responsibility, based on product and country of origin, founded on the principles of the Global Compact and FTSE4Good standards.
The majority of purchases are made in countries like Spain, Unitrd Kinkdom, United States and Canada, or in countries with medium/high income levels (according to the World Bank), like Poland. Periodical analyses in the company's businesses enable Ferrovial's supply chain to be classified as having a low risk.
In major international construction projects the risk arising from subcontracting is limited in a large number of suppliers by means of joint ventures with local partners.
Fuel, Energy and VehiclesThe company has expanded its electric and hybrid vehicle fleet in order to optimize fuel consumption, and this in turn has enabled it to reduce expenses.
In the field of energy, the company tries to purchase renewable energy and include energy efficiency measures to reduce consumption. Traditional fuel is also being replaced with less contaminating natural gas such as diesel.
As for vehicles, those with a lower consumption and lower emissions are sought in the bidding documents for fleet leasing. In collaboration with the Competence Center for Cities and the businesses' Innovation Centers, work is being carried out on adapting heavy vehicles to be hybrid and electric.
Technological Innovation
Innovation and technology are key players in the improvement of the supply chain. In this sense, tools have been developed in Construction and Services for the global management of suppliers and purchases, quality monitoring and order centralization. Construction has started using a program called Insite, while Services has an automated system where, based on the product category or its price, the orders are centralized in the Procurement Department or placed with suppliers with framework agreements negotiated previously.
Construction is finalizing the implementation of its international Insite program, while Services, which already has its own tool in the UK, has started to implement it in Portugal.
Was
te co
llect
ion,
Mai
a. P
ortu
gal

60
2015 Management Report. Ferrovial S.A. and subsidiaries
CERTIFIED ACTIVITIES
The contracts executed by all Ferrovial's business areas include quality and environment systems. These systems are mainly certified to ISO 9001 and 14001 standards. In 2015 the average percentage of activities run with quality and environmental certifications stood at 91% and 90% respectively. All contracts that are not included under certified systems are governed by quality and environment systems.
All systems are internally audited by teams of qualified auditors. There have been 1,895 internal quality and environment audits (42% more than the previous year) and 7,480 production sites were audited, more than double that in 2014. The advisory visits to implement management systems and technical consultations totaled 2,330.
Ferrovial uses these IT platforms and internal procedures to help its line personnel, managers and decisors to have access to and know about all current legislation and regulations. These platforms reach all the phases of the lifecycle of infrastructure and services developed and managed by Ferrovial, including all the aspects relating to quality, environment and safety.
The Normateca platform currently manages a total of 21,392 technical regulations in the fields of safety, quality and environment, with 511 new regulations being updated every year. Ambienteca, however, has a total of 1,935 legal provisions, of which 19 were incorporated over the last year.
There are also other certified systems in compliance with different regulations, like the following:
■■ Standard ISAE 3410 “Assurance Engagements on GHG Statements".
■■ “Integrated Management System PAS 99” and “Specification PAS for composted materials and Quality Compost”.
■■ UNE-EN 12899-1:2009; UNE 135332:2005; UNE 166002; UNE 179002; ISO 50001:2011; ISO 22000, ISO 39001, BS 1100, AQAP 2110:2009, ISO 27001:2013, EMAS and Madrid Excelente.
84%
84%
71%
55%
99%
99%
91%
90%
83%
83%
82%
81%
74%
65%75
%
61%
100
%
100
%
100
%
99%
91%
90%
90%
88%
ISO 9001 ISO 14001
B. QUALITY
2013 2014 2015 2013 2014 2015
CUSTOMER SERVICE AND RESPONSE All Ferrovial's businesses have internal procedures that establish a methodology for detecting, identifying, recording and monitoring complaints made by clients and users of products or services provided by the company worldwide. Claims that are recorded are processed and analyzed, to offer the most suitable response and to establish actions to improve.
The Ferrovial Quality, Prevention & Environment Department handles any complaints submitted by clients to Ferrovial that are not satisfactorily addressed by the business areas and that demand a solution. In 2015, Ferrovial companies as a whole received a total of 1,964 complaints from clients and users. Of these, 99% were closed within the year. Just one had to be managed by the corporate Quality Department.
All business areas conduct regular surveys to gauge client and user expectations and their satisfaction levels. Cintra, for example, carries out surveys among toll road users using forms, website, emails and phone calls, as well as focus groups for specific issues. The results are evaluated to identify strong points and implement improvements.
All Ferrovial's business areas and companies have put in place channels for clients and users to express their opinions, ask questions and file complaints. These are sometimes included in after-sale departments, customer service departments or call centers, and even by directly contacting the managers or people in charge of the projects and contracts.
The corporate department gives those who are interested a specific address for complaints, comments and questions: [email protected].
Construction Infrastructure Services MEDIA
CONTRIBUTION TO VALUE CREATION Operational excellence requires the highest quality, so Ferrovial certifies all its activities through management systems in accordance with international quality and environment standards respectively and establishes effective processes of customer services and response.
CERTIFIED ACTIVITY
2015
2014
2013
4.0
4.0
4.1
CUSTOMER SATISFACTION(Scale 1-5)

6161
3.6 SOCIAL CAPITAL A. SOCIAL ACTION
As an infrastructure manager, Ferrovial plays a fundamental role in the promotion of the UN's new Agenda for Sustainable Development (2015-2030). Because of the nature of its business, the company is a key player when it comes to reducing geographical imbalances: it contributes to the advance and development of communities and countries in which it operates, because it generates employment, fosters purchases from local suppliers, pays tax locally, and transfers skills, knowledge, innovation and technology.
SOCIAL INFRASTRUCTURE PROGRAM
Ferrovial bases its investment in the community on an model that is fully coherent with its larger strategy and business model. In this sense, since 2011 Ferrovial has been developing its "Social Infrastructure" program – an international cooperation program that involves building water and sanitation infrastructure in Africa and Latin America.
The company has contributed toward achieving the UN's Millennium Development Goals (2000-2015), specifically target 7.c: “Halve, by 2015, the proportion of the population without sustainable access to safe drinking water and basic sanitation.”
In order to carry out the projects, Ferrovial creates sustainable alliances with several NGOs. The projects are managed equally by the Joint Commission, made up of the same number of representatives appointed by Ferrovial and the NGO. The Commission usually meets at least four times a year to make sure that the initiative is developing correctly.
Ferrovial does not only fund these projects, but it is also a stakeholder in the cooperation work. Its engineers and water infrastructure and treatment experts voluntarily give up a week of their vacation time and another week that the company gives them to spend 15 days in the field, working and sharing their knowledge in the projects.
Every initiative is geared toward being sustainable, both economically and institutionally, and is based on the self-management of the communities that receive the support. A multiplying effect is also sought, by sharing experience and good practices in social investment via forums and working groups, providing an example to other institutions.
CONTRIBUTION TO VALUE CREATION Ferrovial creates value for society by reducing territorial imbalance in those places where it operates, carrying out a social infrastructure program and collaborating with NGOs in other initiatives.
COMMUNITY INVESTMENT
COMMUNITY SUPPORT PROJECTS
395 5 (1) 808,281 (2)
SOCIAL INVESTMENT IN THE COMMUNITY (M€)
BENEFICIARIES IN SOCIAL PROJECTS
Education and young people Health and social welfareEconomic developmentEnvironment Arts and cultureOther
MoneyTimeIn kind
SpainUnited KingdomUSA and Canada Latin AmericaRest of the world
0 20 40 60 80 1000 20 40 60 80 1000 20 40 60 80 100
29%
7%
11%
9%
7% 37%
22%
21%
85%
8%
7%
39%
8%10%
(1) This amount includes 849,995€ related to the colaboration with MIT. Amount considered R+D Investments and community investment. (2) This figure corresponds to a 40% of social action projects that were carried out voluntarily and 24% of the investment cost. The figure has been estimated based on the most accurate information as of the date of this Report

62
2015 Management Report. Ferrovial S.A. and subsidiaries
In 2015, Ferrovial carried out four projects as part of its Social Infrastructure Program, with an investment of 450,000 euros and benefitting 7,962 people.
■■ Municipality of Marinilla, Colombia: Reinforcement of San Bosco aqueduct by building a treatment plant.
■■ Municipality of Alto Larán, Peru: Drinking water services and health education for vulnerable families.
■■ Colonias Ampliación Chocano and Mezquite, Mexico: Implementation of a drinking water system to guarantee supply to the population.
■■ Woredas de Bolosso Sore and Soddo Zuriya, Ethiopia: improved access to safe water within 30 minutes walking distance for 7,200 people.
Three projects submitted to the 2015 program were selected, which will be implemented over 2016 in the districts of Buyende in Uganda, El Salado in Colombia and Paccha in Peru.
OTHER INITIATIVES
Juntos Sumamos
Ferrovial has been carrying out this program since 2005. Employees decide to contribute a monthly amount to a social project and the company doubles the amount donated.
Special "Juntos Sumamos" program: Thanks to a special edition of the program and the collaboration of four NGOs (Intermón Oxfam, Acción contra el Hambre, Red Cross and Unicef), the company and its employees supported victims of the earthquake in Nepal on 25 April last year. 113,264 euros were raised for this cause. The employees voted and Ferrovial donated the amount raised by donors and matched the amount.
Ferrovial received 192 collaboration proposals from different NGOs in 2015. Following an analysis of the technical aspects of said programs - the organizations' solvency and transparency levels - six projects were shortlisted. Employees then voted to choose four winners: ASION, building a rehabilitation center for children with cancer; Entrecultras, promoting the socio-
economic inclusion of refugees in Addis Ababa (Ethiopia); Vicente Ferrer Foundation, project to build 20 homes for particularly underprivileged families; World Vision Foundation, project to set up an inclusive children's education center in the Machareti municipality (Bolivia).
Social Action Program in Spain
In Spain, Ferrovial is dedicated to supporting the refurbishment and repurposing of NGO centers, to help alleviate the impact had by the financial crisis on society's underprivileged groups.
Supporting culture
The company sponsors several cultural institutions in Spain, including the Guggenheim Museum, Liceu theater in Barcelona and Teatro Real in Madrid.
Heritage conservation
Ferrovial is strongly committed to Spanish heritage and culture, and helps to restore it. Some of the projects in this area include the Conservation and Restoration of the Roman Theater in Malaga, Conservation and Restoration of the Main Church in Casares, and Construction of the Reina Sofía School of Music in Madrid.
Supporting disadvantaged groups
Amey and Duke of Edinburgh (DofE) have an agreement to develop a new alliance called "Strategic association to support the DofE strategy to reach disadvantaged young people". This alliance focuses on improving life opportunities and employability of thousands of young people at risk of exclusion. The program is developed in five areas in the UK: Staffordshire, Birmingham, Liverpool, Sheffield and Wales.
Supporting education and young people
In the US, Ferrovial sponsors several educational projects like "After School Matters", "Black Creativity Gala" and "Illinois Military Families Fund", in Chicago; and "National Math and Science Initiative" in Texas, to help young people further their studies in science, technology, math and engineering .
Ferrovial's volunteers working in the company water projects.

63
B. RESPONSIBLE TAX CONTRIBUTION
As part of development of the Code of Business Ethics, in 2010 the Ferrovial Board of Directors approved the company's adhesion to the Spanish Tax Agency's Good Taxation Practices Code. Three years later, the company extended these standards to all activities worldwide under its own Policy of Compliance and Good Practices in Taxation.
Finally, in February 2015 the company's Board of Directors took yet another step forward by approving the strategy detailed in the Ferrovial Tax Policy document, which complies with the stipulations of Article 529 b under the Spanish Corporations Act.
These policies translate into the following commitments and guidelines:
1. Ferrovial complies with its fiscal obligations in all countries where it operates, managing taxes via a professional, efficient, transparent, cooperative and sensible approach.
a) Compliance: Ferrovial undertakes to pay the correct amount of tax as it becomes due, in accordance with the laws of each country where Ferrovial operates.
b) Professionalism: The Ferrovial Tax Advisory Department, a global and centralized department comprised of specialists in the field, manages the firm's taxes and associated risks. As and when necessary, this department is supported by independent consultants from prestigious tax consulting firms.
c) Efficiency: As well as strictly complying with the law and always pursuing legitimate business activities, Ferrovial oversees fiscal aspects in a manner coherent with its business strategy, seeking to comply with its objectives and to optimize value for shareholders.
d) Transparency: Ferrovial provides full information that tax authorities might require in the appropriate form. The company does not make use of any companies domiciled in tax havens or other non-transparent jurisdictions, except when a given activity - for example a specific construction project - is irredeemably connected with such jurisdictions. In such cases the company will provide full information to the competent authorities regarding the project, what activities are performed, the financial results of the same and employees involved, all in accordance with current legislation.
e) Cooperation: Ferrovial sustains good relations with tax authorities and manages tax matters in a proactive manner in order to avoid any kind of conflict.
f) Sustainability: Ferrovial has procedures and policies in place to manage fiscal risks. The company evaluates the same prior to implementing any transaction that involves fiscal planning.
g) Participation: Ferrovial is indirectly involved in legislative proceedings, contributing its international knowledge of how other jurisdictions handle tax matters.
h) Market price: All transfers of goods and services between Ferrovial companies are subject to market conditions established between independent parties. The prices established are considered normal for the market and must reflect the true nature of each transaction.
2. Ferrovial has practices in place to undermine relevant fiscal risks and prevent any conduct that may be conducive to risks.
Following the recommendations of the Good Taxation Practices Code:
i) It promotes measures to prevent and reduce significant fiscal risks.ii) It seeks to reduce conflicts deriving from differing interpretations of
regulations, harnessing instruments established in tax legislation such as consulting with fiscal authorities before the fact, and reaching prior understanding agreements.
iii) It works with the competent tax administrations to detect potential fraudulent tax practices in any market where Ferrovial operates, seeking to prevent and eradicate them.
iv) It provides all information and documentation requested by tax authorities as quickly and as completely as possible.
v) It makes use of all opportunities offered by the contradictory nature of inspection procedures, strengthening agreements with tax authorities in any procedural stage where feasible.
An inspection by the Spanish Tax Agency's Inspection Department was completed in 2015, corresponding to fiscal years 2007 to 2011. This inspection concerned corporate tax, VAT and withholdings on personal income tax, income from professional work and income generated by movable capital. "Actas con Acuerdo" (settlements with the taxpayer to reduce administrative penalties) and "Actas de Conformidad" (in which the adjustment is confirmed), were signed, which have not involved settlement of Ferrovial's tax liability.
3. Ferrovial's Board of Directors takes an active role in overseeing the company's tax matters.
In compliance with Article 529 b of the Spanish Corporations Act, the Ferrovial Board of Directors performs those fiscal duties that may not be delegated to another body. These include approving a control and management policy for fiscal risks, as well as any operations that carry particular risk.
As part of preparing the company's annual accounts, the Board of Directors was informed of the fiscal policies adopted over the course of the year by the company. It was also informed of the effective degree of compliance with commitments laid out in the Code of Good Practices in Taxation, having observed the practices stated in the annex of the same as far as possible, as agreed at the Major Corporation Forum on November 2, 2015. The company's Annual Corporate Governance Report will reflect this compliance.
The company's Board of Directors, via the Chairman, CEO and senior executives, ensures that Ferrovial adheres to principles and good practices with respect to taxation.
CONTRIBUTION TO VALUE CREATION Prudent, responsible, efficient and transparent management represents an essential element of value creation at Ferrovial.

64
2015 Management Report. Ferrovial S.A. and subsidiaries
4. RISKS
CONTRIBUTION TO VALUE CREATION Ferrovial is exposed to a variety of risks inherent to the activity and the countries where it operates. The company identifies and assesses these risks and implements timely control measures to mitigate their probability of occurrence and/or potential impact, according to the strategic objectives set. In addition, thanks to an effective and efficient management of certain risks, it is possible to identify new business opportunities.
MAIN RISKS
The main risks to the success of Ferrovial's strategy, and therefore its ability to create value, are related to some of the inherent risks in the markets where it operates. These include:
1. Increased competition in the markets in which Ferrovial operates that may affect the profitability and value creation in activities focused on long-term projects with significant execution risks.
The financial crisis in emerging economies, triggered by slowing growth and a progressive decline in commodity prices, has undermined demand for infrastructure in these regions. This has entailed greater risk of concentration of competitors in the rest of the international market, with subsequent pressure on prices and margins.
In order to mitigate said risk, the company conducts a study of the competitive climate in target regions, it has a procedure in place to approve investments and divestments, while establishing limits on the acceptable risk by activities and project types. Once an investment decision has been made, risks are monitored for the lifetime of each
project in order to identify any new risks well in advance.
2. Economic stagnation and tax consolidation: the impact that these conditions may have on the ability of public investment.
The potential macroeconomic deterioration in countries where Ferrovial operates and fiscal consolidation policies in the same, leading to a decline in investment capacity at public sector bodies and lower confidence among private investors. This may drive down both demand and margins, as well as lead to increased conflicts with clients.
This risk is mitigated by a strategy of selective internationalization in those geographies with high legal certainty and in which socio-economic stability and tax regulation is expected, specifically focused on five countries: Spain, United States, United Kingdom, Canada and Poland.
Additionally, the company conducts continued analysis of business opportunities by activity and geographical area, helping to predict changes and/or declines in demand.
* Strategic prioritiesPlease note: The closer a risk is to the diagram's center, the higher its relative importance. The circled areas indicate tolerance levels. Risk events that threaten several strategic priorities have been placed in the section with the highest relative importance.
Strategic risksRisks related to the market and the environment in which each business operates; those derived from applicable regulations and legislation; those derived from alliances with partners; and those associated with the company's own organization and its relationships with external agents.
Compliance risksRisks associated with changes to financial data, access to the financial markets, cash management, the reliability of financial information and tax-related risks.
Breach of third-party contracts
Contractual disputes
Regulatory amendments Tougher financial market conditions
Non-compliance with legislation
Counterparty insolvency
Exchange rates
FINANCIAL DISCIPLINE*
PROFITABLE GROWTH*
OPERATIONAL EXCELLENCE*
INTERNATIONALIZATION*
Interest ratesLiquidity
Inflation
Disasters
Service quality
Environmental damages
Workplace conflicts
Political factors
Fraud/Corruption
Competitive pressures
Economic stagnation and tax consolidation
Cyber-attack
RISK EVENT MATRIX (RESIDUAL ASSESSMENT)
Financial risksRisks associated with compliance with obligations linked to applicable legislation, contracts with third parties and obligations self-imposed by companies, mostly via their codes of ethics and conduct.
Operational risksRisks associated with product processes, service provision and the generation of revenue and expense. Particular attention is paid to risks linked with inadequate or delayed service provision to customers and users, as well as to occupational risks and others.

65Throughout 2015 certain cases have been revealed that demonstrate the importance of this type of risk for Ferrovial's activity.
Consequently, the number of litigations increased in some markets in which the company operates as a result of budgetary restrictions and some of our clients needing to curb costs. In the note in the financial statements on litigations the main outstanding cases are detailed. These include the dispute with Birmingham City Council in the United Kingdom, in which Ferrovial has taken the necessary legal defense measures to enforce its contractual rights and the administrative litigation undertaken by the "Autopista Terrassa Manresa" concession for the restoration of the economic and financial balance, damaged as a result of the change in the concession scheme approved by the Generalitat of Catalonia in July 2015.
3. Some of the activities carried out by Ferrovial may be affected by changes that alter the legal and regulatory framework under which the company operates, and that affect the firm's ability to manage and monetize its business.
The company continuously monitors the regulatory and legislative procedures that affect the company's activity, with a view to predicting possible changes, appropriately managing the same and capitalizing on any opportunities.
It is noteworthy that Ferrovial evaluates and monitors any emerging risks that might negatively affect its ability to meet strategic targets, in order to adapt its strategy sufficiently in advance. Among others include natural disasters or those caused by human action, terrorism in all its forms, humanitarian crises, anti-globalization and protectionist political movements to reduce international investment and jeopardize free competition, occurrence of technological obsolescence, etc.
It is finally noteworthy that as well as the aforementioned risks, the context of economic, social and political uncertainty that currently exists globally can increase the relevance of some risks that are currently considered unlikely or irrelevant.
FINANCIAL RISK
Section 5.4. of the Consolidated Financial Statements describes Ferrovial’s level of exposition and management in relation to the most relevant financial risk events: interest rates, exchange rates, share price, liquidity and credit. Said analysis is performed distinguishing those policies applied to companies developing infrastructure projects and the rest of companies, in those cases where the difference is relevant.
EFFECTIVE RISK MANAGEMENT: FERROVIAL RISK MANAGEMENT (FRM)
Ferrovial has a risk identification and assessment process in place, called Ferrovial Risk Management (FRM), supervised by the Board of Directors and the Management Committee (M.C.), and which is implemented in all of the group's business areas.
This process allows us to identify, in good time, and to assess the risk events based on their probability of occurrence and their potential impact on strategic business objectives, including the potential impact on corporate reputation, in order to take management measures and more suitable assurance based on the nature and location of the risk.
The identified risk events are assessed based on common metrics. This assessment takes place both before the specific control measures for mitigating risks (inherent), either the impact or probability of occurrence, and after (residual). In addition to determining the relative importance of each risk event in the risk matrix, the efficiency of risk control measures may be evaluated.
For more information, see the E section of the Annual Corporate Governance Report.
BOARD OF DIRECTORS/ MANAGEMENT COMMITTEE
Strategic Targets
CONTROL MEASURESPolicies and covers
RISK TOLERANCERPI - Tolerance lebels
STRATEGY
RESIDUAL RISKReporting
ProjectsCountries
Clients
Partners Financial Stucture
...
FERROVIAL RISK MANAGEMENT Identification/Assessment of Risks (Impact - Likelihood)
StrategyOperation
ComplianceFinance
RISK APPETITERISK FACTORS
>>
>
>
>
>>
FERROVIAL RISK MANAGEMENT

66
2015 Management Report. Ferrovial S.A. and subsidiaries
5. CORPORATE GOVERNANCE
In compliance with commercial law, the Annual Corporate Governance Report (ACGR) forms part of this management report. It was drawn up by the Board of Directors and has been filed with the Spanish Securities Commission. The ACGR details all Corporate Governance aspects at Ferrovial. Without prejudice to the foregoing, below is a summary of the key elements of corporate governance at Ferrovial.
ETHICS AND TRANSPARENCY: NEWS The following corporate governance events from 2015 are particularly noteworthy, due to their impact on ethics and transparency:
■■ Update to the Crime Prevention Protocol to adjust the catalog of banned conducts following the latest reforms to the Spanish penal code in terms of criminal responsibility for legal entities. With this same intention, the Board of Directors approved a crime prevention model.
■■ Appointment of a Compliance Officer and Compliance Committee.
■■ Launch of a new organizational procedure aimed at guaranteeing the reliability of financial information and monitoring its efficient functioning, based on a new IT tool (Projecto Diana).
■■ Publication of new reports on the website, including reports on the functioning of the Appointments and Remunerations Committee and associated operations.
ETHICS AND TRANSPARENCY: OTHER RELATED ELEMENTS Likewise, Ferrovial has a Code of Business Ethics (www.ferrovial.com) in place, updated in 2014, applicable to all group companies, employees and executives as they go about their duties, and which includes a specific commitment to compliance with certain applicable laws. The following are among the included areas:
■■ Relations with the public sector: Ferrovial is committed to maintaining open and honest communications with its government partners.
■■ Anti-corruption laws: Ferrovial requires compliance with all laws against bribery. This is bolstered by the new Anti-Corruption Policy approved by the company in 2014.
■■ Use of privileged information: Those employees that are subject to the Internal Rules of Conduct of Ferrovial and its group of companies with respect to securities markets may not buy or sell (on their own behalf or on the behalf of a related person), and may not recommend to third parties that they acquire or sell, shares in Ferrovial, its subsidiaries or any other company listed on any securities market by using privileged information.
■■ Anti-money laundering law: Employees must comply with all legislation against money laundering, doing business only with partners who have solid reputations and receive funds only from legitimate sources.
■■ Accurate accounts and records: Ferrovial subsidiaries across the world must implement accounting practices that ensure accurate accounts and record keeping.
The company has set up a Complaints Box. This was set up in 2009 to complement other internal channels. The aim is to ensure compliance with the Code of Ethics and internal procedures and protocols, and to report irregularities, non-compliance and any unethical or illegal conduct. The channel may be used by the public via the corporate website. All correspondence will be treated in full confidentiality, and may be submitted anonymously or by name. In 2015 a total of 45 complaints were filed, 15 of which were anonymous and 30 made by name.
All reports are investigated by the Complaints Box Managing Committee, which includes the Director of Internal Audits and the General Director of Human Resources. The Committee meets at least once a month, except when a report warranting immediate attention is received.
Likewise, Ferrovial has a Corporate Procedure in place to Protect the company's business Assets and Prevent Fraud. TThis document was updated in 2012 to prevent any conduct likely to entail any loss of those business assets or damage the company.
18%
29%
2%
13%
18%
20%11%
65%
2%
22%
REPORTS RECEIVED IN 2015
Intranet Internet Mailbox Other
RECEPTION
Harassment Working conditions Appropriation Third-party commitments Conflicts of interest Unrelated issues
ISSUE
5.1 CORPORATE GOVERNANCE
CONTRIBUTION TO VALUE CREATION Ferrovial's corporate governance procedures represent a guarantee of full integrity. This is understood to mean ethical, transparent and responsible behavior toward shareholders, employees and all operators or stakeholders affected by the company's activities. This principle is key to ensuring profitable business and long-term sustainability, and to avoid abusing the trust that shareholders and other stakeholders place in the company.

67
OTHER NEWS: CORPORATE GOVERNANCE
■■ Adapting Board of Directors regulations to legislative amendments and recommendations under the new code of good governance for listed companies.
■■ ■■Total or partial Compliance with the majority (57 of 59) of recommendations under the New Code of Good Governance for listed companies.
■■ ■■ 2015 also saw other corporate policies approved:■■ Fiscal Policy and a Fiscal Risk Control and Management
Policy.■■ ■Health and Safety Policy*.■■ Director Appointments policy*.■■ ■■Remuneration Policy for Directors, which will be
submitted for approval at the Annual General Meeting.
* These policies are available at www.ferrovial.com.
FUNCTIONING OF GOVERNING BODIES The ACGR details how the group's management bodies and the decision-making process work, with emphasis on the roles of the Annual General Meetings and Board of Directors as the company's most senior management bodies.
Ferrovial observes the standards and principles of domestic and international best practices in relation to Good Corporate Governance, as adapted to the company's nature, structure and evolution.
Board of Directors
The Board performs its duties with unity of purpose and independent judgment. It treats all shareholders in the same position equally, and works in the social interest, with the same understood to mean securing a profitable business that is sustainable in the long term, supporting its continuity and seeking optimal economic value for the company.
Executive Committee
The committee been delegated all powers corresponding to the Board of Directors, except those powers that cannot be delegated for legal or statutory reasons.
Among other aspects, it monitors the performance of key business indicators and operations underway at Ferrovial.
Appointments and Remunerations Committee
The main duties, other than those attributed by law, are described below, representing the adoption of recommendations under the new good code of good governance for listed companies:
■■ Proposing basic terms for senior management contracts.■■ Ensuring that all non-executive board members have
sufficient time to duly perform their duties.■■ Ensuring compliance with the Remuneration Policy
established by the company.■■ Verifying information on remuneration for executives and
senior management contained in the various corporate documents, including the Annual Report on Director Remuneration.
■■ Ensure that any conflicts of interest do not impair the independence of the advice provided to the Commission.
Audit and Control Committee
The main duties, other than those attributed by law, are described below, representing the adoption of recommendations under the new good code of good governance for listed companies:
■■ Supervising the generation and presentation of mandatory financial information, and ensuring that the Board seeks to present accounts to the Annual General Meeting without any limitations or qualifications in the audit report.
■■ Ensuring that the company and the accounts auditor adhere to rules governing the provision of services other
Annual General Meeting.
Board of Directors
Executive Committee
Audit and Control
Committee
Appointments and Remunerations
Committee
1The interested party sends the complaint to the box
Anonymous or notanonymous
The issue is rejected
It is accepted
The interested party receives acknowledgment if it is not anonymous
2The managing committee decides whether the communication is rejected or accepted
3It is analyzed and required actions are established
4The managing committee informs the interested party in writing if it is not anonymous
FUNCTIONING OF THE WHISTLEBLOWING CHANNEL
BOX
CORPORATE GOVERNANCE STRUCTURE

68
2015 Management Report. Ferrovial S.A. and subsidiaries
than auditing, limits on the concentration of auditor services and other general regulations concerning the independence of account auditors.
■■ Ensure that the remuneration of the auditor of accounts does not compromise quality or independence.
■■ Receiving regular information on activities from the Internal Audit Department.
■■ Establishing and supervising a system that allows employees to confidentially and, if possible and deemed appropriate, anonymously report any irregularities with potentially serious implications that may be identified at Ferrovial, particularly regarding financial and accounting matters.
■■ Supervising compliance with internal Corporate Governance and conduct standards on share markets, and proposing improvements.
MAJORITY OF INDEPENDENT DIRECTORS ON THE AUDIT AND CONTROL COMMITTEE.
ALL INDEPENDENT DIRECTORS ON THE APPOINTMENTS AND REMUNERATION COMMITTEE
BOARD OF DIRECTORS EVALUATION CONDUCTED BY INDEPENDENT EXPERTS AT LEAST EVERY 3 YEARS
Vice-ChairmanSantiago BergarecheIndependent Director
Vice-ChairmanJoaquín AyusoExternal Director
CEOÍñigo MeirásExecutive Director
DirectorLeopoldo del Pino * External Proprietary Director
DirectorJuan ArenaIndependent Director
DirectorMaría del PinoExternal Proprietary Director
DirectorSantiago Fernández ValbuenaIndependent Director
DirectorJosé Fernando Sánchez-JuncoIndependent Director Lead Director
DirectorJoaquín del Pino External Proprietary Director
DirectorHoward L. LanceIndependentDirector
DirectorÓscar Fanjul MartínIndependent Director
ChairmanRafael del Pino Executive and Proprietary Director
12members
1lead director
39.7%voting rights assigned to the
Board of Directors
5meetings of the Audit
and Control Committee in 2015
30%female representation target on the Board by
2020
3 yearsre-election of Directors
50%independent directors
98.6%board attendance
to total votes
* On January 21, 2016 Leopoldo del Pino resigned from the Board of Directors.
COMMITTEES: Executive Committee Audit and Control Committee Appointments and Remunerations Committee

69
remuneration and medium-/long-term remuneration are linked.
Applicable regulations.
Market data:■■ Ferrovial follows the market's best remuneration practices
and refers to studies by prestigious firms.
INTERNAL REGULATIONS OF FERROVIAL
■■ Remuneration for External Directors shall be determined so as to adequately compensate them for the dedication required by the position without comprising their independence.
■■ Remuneration formulas involving the delivery of shares, options, share-linked instruments or instruments linked to the Company's performance shall only apply to Executive Directors.
■■ The Board will draw up an annual report on the remuneration of its Directors, in compliance with applicable regulations. This report will be sent and submitted for advisory vote at the Shareholders' Annual Meeting, as a separate item on the agenda.
Board and Senior Management remuneration policy follows Ferrovial's general principles of remuneration.
The principles of this policy are as follows: creating of long-term value, transparency, attracting and retaining the best professionals, achieving goals responsibly, and a reasonable balance between fixed remuneration components and variable components. For further information, Annual board of Directors’ Remuneration Report is available via www.ferrovial.com
EXECUTIVE DIRECTORS' REMUNERATION: CRITERIA Breakdown of remuneration into fixed and variable elements. Alignment with Ferrovial's objectives through:
■■ Periodic involvement in plans linked to this activity and connected with achieving profitability metrics.
■■ In some cases, recognition of a deferred remuneration item.■■ No assumption of pension obligations.
Linking the variable elements with the achievement of corporate objectives
■■ The objectives established in the Strategic Plan, which make it possible, for example, to define metrics to which annual variable
5.2 REMUNERATION PRINCIPLES AND POLICIES
CONTRIBUTION TO VALUE CREATION Regarding Board and Senior Management remuneration, Ferrovial is following the company's general principles of remuneration, as well as the market's best practices, and refers to studies by prestigious firms, applicable regulations and its own internal regulations.
Executive Directors Remuneration (thousand €)
Fixed remu-neration
Variable remune-ration
Share option/award schemes (1)
Others(2) Total
Rafael del Pino y Calvo-Sotelo
1,335 2,034 2,323 6 5,698
Joaquín Ayuso García (3) 0 0 3,685 31 3,716
Íñigo Meirás Amusco 1,100 1,837 5,798 3 8,738
TOTAL 2,435 3,871 11,806 40 18,152
Senior Management Remuneration (thousand €) 2015
Fixed remuneration 5,006
Variable remuneration 5,431
Share option/award schemes 14,614
Others (1) (2) 1,945
TOTAL 26,996
(1) In March 2015, since the agreed conditions had been complied with in full, a number of shares equivalent to the units allocated in 2012 were delivered, after the relevant withholdings had been performed. The CNMV was notified on 18 March 2015.(2) Iñigo Meirás exercised 538,000 in 2015.(3) Joaquín Ayuso exercised 409,600 in 2015. This 2008 Share Option Plan, to which he retains entitlement, was awarded to him when he was an executive director.
(1) Termination of one senior executive (an amount not exempt from personal income tax). (2) In addition to this it includes insurance premiums and payments received for being on the Boards of other subsidiaries
VARIABLE REMUNERATION OF EXECUTIVE DIRECTORSREMUNERATION OF THE CHAIRMAN AND CEO
Sourse: Towers WatsonFerrovial is compared with the IBEX-35 and pays the average remuneration of the Group
400,000150,000
BOARD OF NON-EXECUTIVE DIRECTORS' REMUNERATION
350,000200,00050,0000 250.000100,000 300,000
FIXED TARGET VARIABLE REMUNERATION
125% 225%VARIABLE MAXIMUM VARIABLE
REMUNERATIONL/T INCENTIVE 2012 GRANT
22% 35% 43%
0-25%il 50-75%il 25-50%il 75-90%il
Percentil 25 Percentil 75 Percentil 90Mediana

70
2015 Management Report. Ferrovial S.A. and subsidiaries
ChairmanRafael del Pino Executive and Proprietary Director MS Civil Engineer (Universidad Politécnica de Madrid, 1981). MBA (MIT Sloan School of Management, 1986).Chairman of Ferrovial since 2000 and CEO since 1992. Chairman of Cintra from 1998 to 2009. Member of MIT Corporation, Board of Zurich Insurance Group, International Advisory Board of IESE and MIT Energy Initiative, and European Advisory Board of Harvard Business School and MIT Sloan School of Management.Former Member of the Board of Banesto and Uralita.
Vice-ChairmenSantiago BergarecheIndependent Director Degree in Economics and Law (Universidad Comercial de Deusto). 1st Vice-Chairman of the Ferrovial Group and member of the Board of Directors since 1999. Joined Ferrovial in 1995 as Chairman of Agroman. In February 1999, after the merger of Ferrovial and Agroman, appointed CEO of Ferrovial. Chairman of Vocento; Vice-Chairman of Nmás1 Dinamia, S.A.; Director of Maxam Corp Holding, S.L. and Deusto Business School; Trustee of the Fundación Casa Ducal de Medinaceli. Former Managing Director of Banco Bilbao Vizcaya Argentaria (BBVA); Chairman of Metrovacesa and of Cepsa.
Joaquín AyusoExternal Director Degree in Civil Engineering (Universidad Politécnica de Madrid). Director of Ferrovial since 2002. Joined Ferrovial in 1982; appointed Managing Director of Construction in 1992. CEO of Ferrovial Agroman from 1999 to 2002. Former CEO of Ferrovial and Vice-Chairman of Cintra from 2002 to 2009. Director of Bankia, National Express Group and Hispania Activos Inmobiliarios; member of the Advisory Board of the Instituto Universitario de Investigación en Estudios Norteamericanos Benjamin Franklin and A.T. Kearney for Spain and Portugal. Former Director of Holcim España, S.A.
CEOÍñigo MeirásExecutive Director Degree in Law (Universidad Complutense de Madrid); MBA (IE Business School). CEO of Ferrovial since 2009. Joined Ferrovial in 1992; former Managing Director of Autopista del Sol and Director of Toll Roads at Cintra. CEO of Ferrovial Services from 2000 to 2007; later appointed CEO of Ferrovial Airports. Previously worked at Holcim Group and Carrefour Group.
DirectorsJuan ArenaIndependent Director PhD in Industrial Engineering (ICAI), Degree in Business Administration (ICADE), Degree in Psychology, Diploma in Tax Studies and AMP (Harvard Business School). Director of Ferrovial since 2000. Director of Laboratorios Almirall, Everis, Meliá Hotels International and Panda; Chairman of the Advisory Board of Consulnor and Marsh; member of the Advisory Board of Spencer Stuart, the Professional Council of ESADE, the European Advisory Board of Harvard Business School and UBS Bank; member of the Board of Directors of Deusto Business School; Senior Lecturer of the Harvard Business School (2009-2010). Former CEO and Chairman of Bankinter; Director of TPI, Dinamia and Prisa.
María del PinoExternal Proprietary Director Degree in Economics and Business Administration (Universidad Complutense de Madrid); Management Development Program (IESE). Director of Ferrovial since 2006. Chairman of the Rafael del Pino Foundation; Rotating Chairman / Vice-Chairman of the Board of Directors of Casa Grande de Cartagena, S.L.U.; Member of the Board of Trustees of the Princess of Asturias; Trustee of the Codespa Foundation and of the Fundación Científica de la Asociación Española contra el Cáncer. Former member of the Governing Board of the Asociación para el Progreso de la Dirección.
Santiago Fernández ValbuenaIndependent Director Degree in Economics (Universidad Complutense de Madrid); PhD and Master’s Degree in Economics (Northeastern University, Boston). Director of Ferrovial since 2008. Since 2012 Director of Telefónica, S.A. Former Chairman of Telefónica Latinoamérica; Chief Strategy, Finance and Corporate Development Officer at Telefónica; Managing Director of Société Générale Valores and Head of Equities at Beta Capital; Professor of Applied Economics at the Universidad Complutense and Professor at IE Business School.
José Fernando Sánchez-JuncoIndependent Director Lead Director Degree in Industrial Engineering (Universidad Politécnica de Barcelona). ISMP Graduate at Harvard Business School. Member of the State Corps of Industrial Engineers. Director of Ferrovial since 2009. Director of Cintra from 2004 to 2009. Chairman and Managing Director of Maxam Group. Former Managing Director of Industrias Siderometalúrgicas y Navales and Managing Director of Industry at the Ministry of Industry and Energy.
Joaquín del Pino External Proprietary Director Degree in Economics and Business Administration; MBA (IESE). Director of Ferrovial since 2015 (and has represented the Director Karlovy, S.L. of Ferrovial since 2010, reelected in 2013). Rotating Chairman / Vice-Chairman of the Board of Directors of Casa Grande de Cartagena, S.L.U.; legal representative of Soziancor, S.L.U., Chairman of the Board of Directors of Pactio Gestión, SGIIC, S.A.U.; and Trustee of the Rafael del Pino Foundation and the Plan España Foundation.Former Director of Banco Pastor.
Leopoldo del Pino * External Proprietary Director Graduate in Civil Engineering (Politécnica University, Madrid); MBA from INSEAD. Director of Ferrovial since 2015 (and has represented the Director Portman Baela, S.L. of Ferrovial since 2010, reelected in 2013).Executive Chairman of Estacionamientos Iberpark, S.A. and member of International Advisory Board of INSEAD. Among his previous positions are: Executive Vice-Chairman of Empark and Vice-Chairman of its Executive Committee; Director and member of the Executive Committee of Ebro Foods; Country Manager for Spain and member of the Management Committee of Cintra; Chairman of Ausol, Autema, Autopista Madrid Levante, Autopista Alcalá O’Donnell, Esli and ANERE; Vice-Chairman of ASESGA, Autopista Trados 45 and EULSA; Director of SMASSA, AUSSA and EGUISA; Managing Director of Cintra Aparcamientos and Dornier; Managing Director of Industry, Energy and Mining in the Madrid Regional Government.
Howard L. LanceIndependent Director Bachelor of Science degree in Industrial Engineering from Bradley University. Master of Science degree in Management from Krannert School of Management, Purdue University. Director of Ferrovial since 2014. Executive Advisor to The Blackstone Group; Chairman of Summit Materials, Inc. and Emdeon, Inc. Former Chairman, President and CEO of Harris Corporation; former member of the Board of Stryker, Inc. and former member of the Board of Eastman Chemical Company.
Óscar Fanjul Independent Director Professor of Economic Theory on leave of absence.Director of Ferrovial since 2015. Vice-Chairman of Omega Capital; Director of LafargeHolcim, Marsh & McLennan Companies and Acerinox; Trustee of the Foundation of Friends of the Prado Museum, of the Center for Monetary and Financial Studies (Bank of Spain) and of the Aspen Institute (Spain). Former founding Chairman and CEO of Repsol; Chairman of Hidroeléctrica del Cantábrico; non-executive Chairman of NH Hoteles and Deoleo; Director of Unilever, BBVA, London Stock Exchange and Areva.
Secretary Santiago Ortiz Vaamonde Spanish State Attorney; PhD in Law (Universidad Complutense de Madrid). General Counsel and Secretary of the Board of Directors of Ferrovial since 2009. Former partner at Cuatrecasas and Ramón y Cajal law firms, in charge of Trial Law and Public and Regulatory Law; Agent of the Kingdom of Spain before the Court of Justice of the European Union; professor at the Diplomatic School and the Carlos III University.
COMM
ITTE
ES:
Exec
utive
Com
mitt
eeAu
dit a
nd C
ontro
l Com
mitt
eeAp
poin
tmen
ts an
d Re
mun
erat
ions
Com
mitt
ee
5.3 BOARD OF DIRECTORS
* On January 21, 2016 Leopoldo del Pino resigned from the Board of Directors.

71
1 Íñigo MeirásCEOGraduate in Law and MBA from the IE Business School. He joined Ferrovial in 1992 and was Managing Director of the Autopista del Sol and Director of Toll Road for Cintra until November 2000. Between 2000 and 2007 he headed the expansion of Ferrovial Services as Managing Director, later as CEO, and in 2007 he was appointed CEO of Ferrovial Airports. He held the position of Managing Director of Ferrovial between April and October 2009, when he became CEO.
2 Alejandro de la JoyaCEO of Ferrovial AgromanHe is a Civil Engineer. He joined the company in 1991. He has developed his career working in Spain, Morocco, Italy, Portugal and later in Poland (Budimex) as Director. In 2005 he held the post of Foreign Business Director and from 2007 Director of International Construction. In 2008 he was appointed CEO of Ferrovial Agroman.
3 Enrique Díaz-RatoCEO of CintraGraduate in Civil Engineering and Economic Sciences, and MBA from the EOI. He joined Ferrovial in 2001 as Managing Director of Cintra Chile. In 2004 he was appointed General Manager of the 407 ETR Toll Road in Toronto, Canada and since April 2006 he held the position of Director of Toll Roads for the United States, Canada, Chile and Ireland. In July 2006 he was named CEO of Cintra.
4 Álvaro EchánizCEO of Ferrovial FISA(Real Estate division)He holds a degree in Business Studies. He joined Ferrovial with the takeover of Agroman, a company in which he held the position of Chief Financial Officer. He was formerly Chief Financial Officer of Cintra between 1998 and 2002. He was later appointed Chief Executive Officer of FISA, Ferrovial’s Real Estate division.
5 María Dionis Managing Director of Human ResourcesGraduate in Psychology from Complutense University of Madrid and Master’s Degree in Human Resources Management from the University of Maryland. Before joining Ferrovial, she developed her professional career in companies such as Andersen Consulting, Watson Wyatt, Soluziona and Getronics Iberia. She joined Ferrovial in April 2006, as Director of Human Resources Development. In May 2010 she became Director of Human Resources and Communication of the Services Division, and since June 2015 has served as Managing Director of Human Resources.
6 Federico FlórezChief Information and Innovation Officer (CIIO)Graduate in Naval Engineering; Master's Degree in Business Administration and IT Management, PAD IESE, INSEAD Advanced Management Program. Diplomas in Senior Management from Harvard, MIT and Cranfield. He has developed his career in companies such as IBM, Alcatel and Telefónica. He was also CIO of the Bank of Spain. In April 2008 he was appointed Chief Information Officer.
7 Jorge GilCEO of Ferrovial AirportsDegree in Business and Law from ICADE University. CEO of Ferrovial Airports and member of the Board of Directors of Heathrow Airport Holdings since December 2012. He joined Ferrovial in 2001 through Cintra, where he led the Department of Corporate and Business Development, working as CEO of the 407 ETR, Chicago Skyway and Indiana Toll Road highways. In 2010 he was appointed Capital Markets and Finance Director of Ferrovial. He began his career at The Chase Manhattan Bank, working in Corporate Finance and M&A.
8 Ernesto López MozoChief Financial Officer (CFO)Civil Engineer (Polytechnical University of Madrid) and MBA from The Wharton School of The University of Pennsylvania. In 2009 he was appointed Chief Financial Officer of Ferrovial. Previously, he held various management positions at Grupo Telefónica, JP Morgan and Banco Santander. He also worked in civil works prior to obtaining his MBA degree.
9 Santiago OlivaresCEO of Ferrovial ServicesGraduate in Industrial Engineering from ICAI and an MBA from MIT. He joined Ferrovial in 2002 as the Business Development Director for the Services Division. He later became the Director of the international area of this division. In May 2007 he was appointed CEO of Ferrovial Services.
10 Santiago Ortiz VaamondeGeneral CounselSpanish State Attorney; PhD in Law (Universidad Complutense de Madrid). General Counsel and Secretary of the Board of Directors of Ferrovial since 2009. Former partner at Cuatrecasas and Ramón y Cajal law firms, in charge of Trial Law and Public and Regulatory Law; Agent of the Kingdom of Spain before the Court of Justice of the European Union; professor at the Diplomatic School and the Carlos III University.
11 María Teresa PulidoDirector of Corporate StrategyGraduate in Economics from Columbia University and an MBA from MIT. She has vast experience in the field of strategic consulting (McKinsey) and also in investment banking and private banking (in banks such as Citigroup, Deutsche Bank and Bankers Trust). Member of MIT's Sloan EMSAEB Board. Joined Ferrovial in April 2011, as Director of Corporate Strategy. Since July 2014 she has been a member of the Management Committee of Ferrovial Group.
5.4 MANAGEMENT COMMITTEE4
811
10
53
6
7
1
9
2

72
2015 Management Report. Ferrovial S.A. and subsidiaries
6. ANTICIPATED BUSINESS PERFORMANCE IN 2016
In line with the strategy and the opportunities and risks discussed in Chapter 2 of this report, Ferrovial made a forecast about the development of its activities in 2016 in each business area.
SERVICES The international financial situation of the markets in which Ferrovial Services operates differs between countries. In any of them there can be both situations of uncertainty and slowdown in public activities, as well as the emergence of new opportunities.
United Kingdom: The announced slowdown in activities and decreased budgets of local governments may adversely affect the volume of services contracted. However, there are opportunities for infrastructure consulting, an area in which Ferrovial Services has major capabilities differentiating it from other competitors. Equally important is the stability in the utilities which are subject to a regulatory cycle. The water sector is currently managed through 18 regional monopolies and an opening in the market is expected beginning in 2017. The energy sector is being privatized and presents significant opportunities. In 2016, the lawsuit with the City of Birmingham due to differences in the interpretation of the contract on the scope of activities in the investment phase is expected to be resolved.
Spain: The municipal elections held in May 2015 and the December general elections have slowed the bidding processes.
There are, moreover, significant opportunities in the private sector due to the tendency to outsource those auxiliary services that are not part of their core business.
Other markets: Solid sales growth in Portugal, Poland, Chile and Qatar is expected, because they are markets in which Ferrovial Services has a minor presence as yet.
TOLL ROADS The predictable behavior of the highways in operation during 2016 will depend on macroeconomic developments in the countries or States where the assets are located and their impact on traffic volumes and revenues.
The process of rotation of mature assets will be marked by the completion of agreements for the sale of the Chicago Skyway and the highways in Ireland.
In 2016 the startup of the 407 EDG (Extension I) project in Canada is expected, as is the start of work on recently awarded projects (I-77 in North Carolina in the US, Toowoomba in Australia and Ruta del Cacao in Colombia).
Also, it is expected that talks will continue with lenders in those projects in which restructuring agreements are being negotiated (SH-130 in Texas, USA and Euroscut Azores in Portugal).
CONSTRUCTION During 2016 it is expected that construction revenues will remain stable, with a slight increase due to increased international activity which will offset a further decline in activity in Spain.
Spain: In 2016 a reduction in activity due to market instability as a result of strong competition and the 2015 election results, both national and local, is expected. The contracting focus will remain selective, prioritizing return on sales volume.
USA and Canada: Upon completion in 2015 of the LBJ highway in Texas several months early, the construction of major highways such as the NTE Texas Extension, I-77 in North Carolina or the 407 EDG in Canada will continue in 2016. It is also expected that work will begin on I-285 in Georgia, in which Ferrovial was designated preferred bidder.
Poland: Revenue will increase thanks to increased contracting registered in 2014 and 2015 for highway projects associated with the new framework of European funds. Results are also expected from the increase in government railroads and the increased activity in industrial construction.
United Kingdom: Increased activity supported by the planned projects in the new infrastructure plan of the British Government is expected. Added to this is the recent award of the Thames Tideway Tunnel, while continuing the implementation of other major projects such as the expansion of the Northern Line of the London Underground.
Australia: In 2015 the implementation of the first major contract for Ferrovial Agroman started, the section of the Pacific Highway from Warrell Creek to Nambucca Heads. In 2016 an increase is expected thanks to the award, together with Cintra, of the Toowoomba highway and Northern Beaches Hospital Connectivity, projects that confirm Ferrovial as a leading company in the country.
Other markets: Ferrovial Agroman is analyzing various complex infrastructure projects to be tendered in 2016 in regions with a stable presence such as Latin America (Chile, Colombia, Brazil, Peru or Mexico) and the Middle East and other countries with specific opportunities. So it was in 2015 with the designation as preferred bidder for the Bucaramanga - Barrancabermeja highway in Colombia or D4R7 in Slovakia.
AIRPORTS In 2016 Ferrovial Airports expects to definitively consolidate operations at the airports of Aberdeen, Glasgow and Southampton under the umbrella of AGS. On the other hand, HAH will continue to work with the British government and seek the support of politicians, chambers of commerce, business associations and local communities for the expansion of Heathrow to be the option chosen to increase airport capacity in the country for its decisive contribution to boost the British economy. In addition, Ferrovial Airports will continue its bidding activity through participation in projects in France, the US and Brazil, among others.

73
7.1 REPORTING PRINCIPLES Ferrovial presents its economic, social and environmental information following the principles of the Conceptual Framework for the preparation of the composite report of the International Integrated Reporting Council (IIRC).
For the seventh year, the Corporate Responsibility Report has applied the principles of the AA1000 standard, a key tool for aligning information presented in the report with the expectations of its stakeholders and materiality of the company. The report follows version 4 of the Global Reporting Initiative (GRI) Guidelines with self-declaration “Comprehensive" according to the requirements of the GRI Guidelines.
Ferrovial's consideration of the principles related to the content of the report is developed in the specific sections on materiality and commitment to stakeholders. For further information on the AA1000 standard and the GRI Guidelines, see page 82 of the GRI Indicators section
SCOPE OF THE INFORMATION Ferrovial comprises the parent company, Ferrovial, SA and its subsidiaries and associated companies. For reporting non-financial information, all those companies in which Ferrovial has control are included. Control is understood to mean more than 50% participation. In these cases, 100% of the information is reported. For detailed information on the companies included consult the scope of the Annual Accounts. (Annex)
Likewise, following the indications of the GRI guidelines, version G4, Ferrovial will provide information on all indicators and material aspects "external to the organization" to the fullest extent possible, provided that said information is of sufficient quality and always on a separate basis. Ferrovial considers that the most significant impacts are those relating to the 407 ETR highway in Canada and HAH in the United Kingdom.
CONSOLIDATION PROCESS Since 2007 Ferrovial has employed a system for reporting and consolidating corporate responsibility information (non-financial reporting). This system helps improve the quality of the information and facilitates internal and external reporting. This process allows work on two levels, by business and geographically, to obtain the necessary information across the data.
TRACEABILITY The consolidation criteria applied has not changed from previous years. All the companies reported their indicators on corporate responsibility as of December 2015. The data (396 indicators) is introduced from the source (123 companies) by the responsible parties (182 users), through a validation process and internal control to be consolidated and verified by a third party.
REFORMULATION OF THE INFORMATION Changes in the scope of consolidation in 2015 were not significant with respect to 2014. However, the text of the report indicates when a specific indicator from previous years has been modified or shows changes affecting the comparability of information.
STAKEHOLDERS Ferrovial is committed to transparent reporting to the market, by implementing continuous improvements to its communication channels with all stakeholders, on the basis of innovative corporate information that includes not only financial aspects but also takes into account environmental and social conduct.The company considers a stakeholder to be any individual or social group with a legitimate interest in and who are affected by the company’s current or future activities. This definition includes both internal stakeholders that form part of the value chain of the company (shareholders, employees, investors, customers and suppliers) considered as partners in the development of the business, as well as external stakeholders (administration, governments, media, analysts, businesses, labor unions, third sector and society in general), starting with the local communities in which the company operates. This relationship is dynamic, because the climate in which the company operates is changing more rapidly than ever. Ferrovial's business is highly dependent on relationships with governments in the countries in which it operates.
Ferrovial holds positions of decision in bodies that boost corporate responsibility both nationally and internationally, such as Fundación SERES, Forética, Spanish Global Compact Network, Spanish Quality Association (AEC). In 2015, Ferrovial participated in the creation of the Spanish Group for Green Growth and the Advisory Group to promote the new sustainable development goals of the United Nations. The relations with each stakeholder are detailed in www. ferrovial.com
MATERIAL ISSUES Ferrovial considers relevant any issue that may have a substantial influence on the evaluations and decisions of stakeholders, affecting its ability to address existing needs without compromising future generations.
Ferrovial updates its materiality matrix every two years, a period appropriate to the nature of its activities. Furthermore, there is a Strategic Corporate Responsibility Plan (Plan 20.16) whose objectives are linked to the outcome of the materiality analysis.
The process consists of three phases:
■■ The main trends and the most important sustainable practices in the sector are identified and their relevance is established by experts. This generates the basic version of the materiality matrix.
■■ The risk matrix is prepared internally according to the different types: strategic, operational, compliance and financial identifying key risk events that might threaten Ferrovial's reputation. This matrix allows evaluation of data obtained in the previous stage and refinement of the scores.
■■ The opinions of specific stakeholders are sought through perception surveys on issues that are important to Ferrovial. The external stakeholders selected should be people who
7. METHODOLOGY FOR PUBLICATION OF NON-FINANCIAL INFORMATION
DATA imput(at source)
Verification Consolidation
123 companies 182 users396 indicators
Internal control Total consolidation
CompanyBusinessCountry
BusinessCountry
> > >

74
2015 Management Report. Ferrovial S.A. and subsidiaries
know the company well and have contact with various internal managers. Employees and stakeholders receive the same weighting when evaluating the results.
The most relevant issues are reflected in the matrix, classified by maturity (how much attention Ferrovial and the sector give to a specific issue) and relevance (importance allocated by opinion leaders to corporate responsibility issues).
STRATEGIC CORPORATE RESPONSIBILITY PLAN (2014-2016) The Plan has been approved by the Board of Directors and established in the Corporate Responsibility Committee, which meets quarterly. It is chaired by the Director of Communications and Corporate Responsibility and consists of the heads of the different corporate areas (Risks, Human Resources, Innovation, Environment and the General Secretary’s Office) and by a manager from each business unit. The role of the Committee is to monitor the plan, which includes specific actions for each of the six lines of activity. The Chair of the Corporate Responsibility Committee reports annually to the Board of Directors.
The Plan 20.16, in effect until 2016 and updated every three years, includes the issues of concern to investors, assessments of the main sustainability indices and a review of good practices in the sector. The plan is based on the materiality matrix agreed to with the internal stakeholders and representatives from all corporate areas. It was subsequently endorsed via the external stakeholder perception survey. All this served to define the six areas and strategic lines in terms of CR.
Corporate GovernanceEthics and IntegrityPeopleEnvironmentInnovation
Relevance
Material issues for FerrovialG
E
S
N
Mat
urity
2
1
3
4
1517
18
6
125
10
81114
916
13
19
7
Sustainable Issues (S): Issues with high maturity and high relevance. These are issues widely discussed by opinion leaders and that have high maturity levels among companies of the sector.General Issues (G): Issues with high maturity and low relevance. These are issues generally dealt with by companies, but rarely mentioned by opinion leaders.Emerging Issues (E): Issues with low relevance and low maturity. For example, issues just beginning to be discussed by opinion leaders and that will gradually be adopted by companies.Necessary issues (N): These are issues widely discussed by opinion leaders, but with low maturity levels among companies. This quadrant is where the "quick wins" to establish sustainability leadership are to be found.
1 Leading the sector on sustainability issues .............................................................................M2 Developing innovative projects ...............................................................................................M3 Maintaining collaboration agreements with research centers ...............................................M4 Having specific policies on ethics and integrity issues ...............................................................I5 Developing a sustainable construction strategy .....................................................................M6 Eco-efficiency ............................................................................................................................I7 Climate change .........................................................................................................................I8 Water footprint ..........................................................................................................................I9 Make channels of communication available to customers and establish complaint
resolution processes ................................................................................................................M10 Establishing a methodology for evaluating suppliers based on risk ......................................M11 Having programs to respond to spill emergencies ....................................................................I12 Including suppliers in the company's corporate responsibility policy .....................................M13 Having policies and management systems to ensure that products/services do not
pose a risk to customer health, safety, integrity or privacy .....................................................M14 Having procedures and protocols in place for handling, use and storage
of hazardous substances ...........................................................................................................I15 Having a specific corporate governance policy ........................................................................I16 Having a purchasing policy .......................................................................................................I17 Publishing policies on ethics and integrity issues ....................................................................M18 Having communication channels for reporting unethical practices .......................................M19 Having a corporate policy on health and safety of the employees ..........................................I
M: MixedI: InternalE: External Scope
Areas Lines of Action
Corporate Governance
Transparency in the information provided to the market.Activity in the securities market.Organizational improvements in government bodies.
Ethics and Integrity
Codes of Conduct.Human Rights.Supply Chain.
People
Attracting and retaining talent.Training and Development.Occupational Health and Safety.Diversity and Equal Opportunities.
EnvironmentClimate Change.Eco-efficiency.Biodiversity.
SocietyCommunity.Social Footprint.Volunteering.
Innovation Sustainable R&D.Support for Entrepreneurship.
PLAN 20.16
CORPORATE RESPONSIBILITY POLICY
Ferrovial understands corporate responsibility to mean a voluntary commitment to participate in the economic, social and environmental development of communities in which it operates. This policy is founded on the principles of the Global Compact and internationally accepted agreements and resolutions, the content of which cover corporate responsibility issues.
It is the Ferrovial Board of Directors' responsibility to uphold the corporate responsibility principles that the organization has voluntarily committed to. The Corporate Policy is available in www.ferrovial.com

75
7.2 GRI - G4 INDICATORSGENERAL STANDARD DISCLOSURES GRI G4
STRATEGY AND ANALYSIS Page Revision
G4-1 Provide a statement from the most senior decision-maker of the organization (such as CEO, chair, or equivalent senior position) about the relevance of sustainability to the organization and the organization’s strategy for addressing sustainability. 3 4
G4-2 Provide a description of key impacts, risks, and opportunities. 6-7, 12-13, 64-65 4
ORGANIZATIONAL PROFILE Page Revision
G4-3 Report the name of the organization. Note 1.1 of 2015 Annual Consolidated Financial Statements 4
G4-4 Report the primary brands, products, and services. 16- 23 4
G4-5 Report the location of the organization’s headquarters. Note 1.1 of 2015 Annual Consolidated Financial Statements 4
G4-6 Report the number of countries where the organization operates, and names of countries where either the organization has significant operations or that are specifically relevant to the sustainability topics covered in the report. 10-11 4
G4-7 Report the nature of ownership and legal form. Note 1.1 of 2015 Annual Consolidated Financial Statements 4
G4-8 Report the markets served (including geographic breakdown, sectors served, and types of customers and beneficiaries). 10-11 4
G4-9
Report the scale of the organization, including: - Total number of employees - Total number of operations - Net sales (for private sector organizations) or net revenues (for public sector organizations) - Total capitalization broken down in terms of debt and equity (for private sector organizations) - Quantity of products or services provided
8-11 4
G4-10
Report the total number of employees by employment contract and gender.b. Report the total number of permanent employees by employment type and gender.c. Report the total workforce by employees and supervised workers and by gender.d. Report the total workforce by region and gender.e. Report whether a substantial portion of the organization’s work is performed by workers who are legally recognized as self-employed, or by individuals other than employees or supervised workers, including employees and supervised employees of contractors.f. Report any significant variations in employment numbers (such as seasonal variations in employment in the tourism or agricultural industries).
48 4 (3)
G4-11 Report the percentage of total employees covered by collective bargaining agreements. 52 4
G4-12 Describe the organization’s supply chain. See appendix. 4
G4-13 Report any significant changes during the reporting period regarding the organization’s size, structure, ownership, or its supply chain. Note 1.1.3 of 2015 Annual Consolidated Financial Statements 4
Commitments to external initiatives
G4-14 Report whether and how the precautionary approach or principle is addressed by the organization. 64-65 4
G4-15 List externally developed economic, environmental and social charters, principles, or other initiatives to which the organization subscribes or which it endorses.
informeanualintegrado2015.ferrovial.com/en
G4-16
List memberships of associations (such as industry associations) and national or international advocacy organizations in which the organization: - Holds a position on the governance body - Participates in projects or committees - Provides substantive funding beyond routine membership dues - Views membership as strategic
informeanualintegrado2015.ferrovial.com/en
IDENTIFIED MATERIAL ASPECTS AND BOUNDARIES Page Revision
G4-17 a. List all entities included in the organization’s consolidated financial statements or equivalent documents.b. Report whether any entity included in the organization’s consolidated financial statements or equivalent documents is not covered by the report.
73Appendix II of 2015 Annual Consolidated Financial Statements
4
G4-18 a. Explain the process for defining the report content and the Aspect Boundaries.b. Explain how the organization has implemented the Reporting Principles for Defining Report Content. 73-74 4
G4-19 List all the material Aspects identified in the process for defining report content. 74 4
G4-20 For each material Aspect, report the Aspect Boundary within the organization. 74 4
G4-21 For each material Aspect, report the Aspect Boundary outside the organization. 74 4
G4-22 Report the effect of any restatements of information provided in previous reports, and the reasons for such restatements. 73 4
G4-23 Report significant changes from previous reporting periods in the Scope and Aspect Boundaries. 73 4
STAKEHOLDER ENGAGEMENT Page Revision
G4-24 Provide a list of stakeholder groups engaged by the organization. informeanualintegrado2015.ferrovial.com/en
G4-25 Report the basis for identification and selection of stakeholders with whom to engage. 73 4
G4-26 Report the organization’s approach to stakeholder engagement, including frequency of engagement by type and by stakeholder group, and an indication of whether any of the engagement was undertaken specifically as part of the report preparation process.
73-74informeanualintegrado2015.ferrovial.com/en
G4-27 Report key topics and concerns that have been raised through stakeholder engagement, and how the organization has responded to those key topics and concerns, including through its reporting. Report the stakeholder groups that raised each of the key topics and concerns. 74 4
REPORT PROFILE Page Revision
G4-28 Reporting period (such as fiscal or calendar year) for information provided. Fiscal Year 2015 4
G4-29 Date of most recent previous report (if any). Fiscal Year 2014 4
G4-30 Reporting cycle (such as annual, biennial). Annual 4
G4-31 Provide the contact point for questions regarding the report or its contents. Back cover 4
GRI CONTENT INDEX
G4-32a. Report the ‘in accordance’ option the organization has chosen.b. Report the GRI Content Index for the chosen option.c. Report the reference to the External Assurance Report, if the report has been externally assured.
73Assurance Report
ASSURANCE
G4-33
a. Report the organization’s policy and current practice with regard to seeking external assurance for the report.b. If not included in the assurance report accompanying the sustainability report, report the scope and basis of any external assurance provided.c. Report the relationship between the organization and the assurance providers.d. Report whether the highest governance body or senior executives are involved in seeking assurance for the organization’s sustainability report.
88-89

76
2015 Management Report. Ferrovial S.A. and subsidiaries
GOVERNANCE Page Revision
G4-34 Report the governance structure of the organization, including committees of the highest governance body. Identify any committees responsible for decision-making on economic, environmental and social impacts.
67-68Annual Corporate GovernanceReport 2015, Section C.
4
G4-35 Report the process for delegating authority for economic, environmental and social topics from the highest governance body to senior executives and other employees.
74Annual Corporate GovernanceReport 2015, Section C.
4
G4-36 Report whether the organization has appointed an executive-level position or positions with responsibility for economic, environmental and social topics, and whether post holders report directly to the highest governance body.
74Annual Corporate GovernanceReport 2015, Section C.
4
G4-37 Report processes for consultation between stakeholders and the highest governance body on economic, environmental and social topics. If consultation is delegated, describe to whom and any feedback processes to the highest governance body. 74 4
G4-38 Report the composition of the highest governance body and its committees.67-68Annual Corporate GovernanceReport 2015, Section C.
4
G4-39 Report whether the Chair of the highest governance body is also an executive officer (and, if so, his or her function within the organization’s management and the reasons for this arrangement).
Annual Corporate Governance Report 2015, Section C.1.2 and C.1.3
G4-40 Report the nomination and selection processes for the highest governance body and its committees, and the criteria used for nominating and selecting highest governance body members.
67Annual Corporate Governance Report 2015, Section C.1.19
4
G4-41 Report processes for the highest governance body to ensure conflicts of interest are avoided and managed. Report whether conflicts of interest are disclosed to stakeholders.
Annual Corporate Governance Report 2015, Section D.6 4
HIGHEST GOVERNANCE BODY'S ROLE IN SETTING PURPOSE, VALUES AND STRATEGY
G4-42 Report the highest governance body’s and senior executives’ roles in the development, approval, and updating of the organization’s purpose, value or mission statements, strategies, policies, and goals related to economic, environmental and social impacts. 67 4
HIGHEST GOVERNANCE BODY'S COMPETENCIES AND PERFORMANCE EVALUATION
G4-43 Report the measures taken to develop and enhance the highest governance body’s collective knowledge of economic, environmental and social topics.
The Board of Directors is informed annually regarding environmental management issues for the company, as well as regarding monitoring of the corporate responsibility strategic plan. Furthermore, the Board, directly or via its committees, remains abreast of a series of issues on which it is required to make decisions. These include approving policies on a wide range of issues. In 2015, a series of good conduct policies was approved such as: Fiscal Policy and a Fiscal Risk Control and Management Policy; Health and Safety Policy; Director Appointments Policy;■■Remuneration Policy for Directors, which will be submitted for approval at the Annual General Meeting. Annual Corporate Governance
G4-44
a. Report the processes for evaluation of the highest governance body’s performance with respect to governance of economic, environmental and social topics. Report whether such evaluation is independent or not, and its frequency. Report whether such evaluation is a self-assessment.b. Report actions taken in response to evaluation of the highest governance body’s performance with respect to governance of economic, environmental and social topics, including, as a minimum, changes in membership and organizational practice.
Annual Corporate Governance Report 2015, Section from C.1.19 to C.1.21
4 (2)
HIGHEST GOVERNANCE BODY'S ROLE IN RISK MANAGEMENT
G4-45
a. Report the highest governance body’s role in the identification and management of economic, environmental and social impacts, risks, and opportunities. Include the highest governance body’s role in the implementation of due diligence processes.b. Report whether stakeholder consultation is used to support the highest governance body’s identification and management of economic, environmental and social impacts, risks, and opportunities.
67-68Annual Corporate Governance Report 2015, Section E
4
G4-46 Report the highest governance body’s role in reviewing the effectiveness of the organization’s risk management processes for economic, environmental and social topics. 4
G4-47 Report the frequency of the highest governance body’s review of economic, environmental and social impacts, risks, and opportunities. 4
HIGHEST GOVERNANCE BODY'S ROLE IN SUSTAINABILITY REPORTING
G4-48 Report the highest committee or position that formally reviews and approves the organization’s sustainability report and ensures that all material Aspects are covered. Board of Directors 4
HIGHEST GOVERNANCE BODY'S ROLE IN EVALUATING ECONOMIC, ENVIRONMENTAL AND SOCIAL PERFORMANCE
G4-49 Report the process for communicating critical concerns to the highest governance body. 74 4
G4-50 Report the nature and total number of critical concerns that were communicated to the highest governance body and the mechanism(s) used to address and resolve them. 74 4
REMUNERATION AND INCENTIVES
G4-51a. Report the remuneration policies for the highest governance body and senior executives.b. Report how performance criteria in the remuneration policy relate to the highest governance body’s and senior executives’ economic, environmental and social objectives.
Annual Board of Directors’Remuneration Report
G4-52 Report the process for determining remuneration. Report whether remuneration consultants are involved in determining remuneration and whether they are independent of management. Report any other relationships which the remuneration consultants have with the organization.
Annual Board of Directors’Remuneration Report
G4-53 Report how stakeholders’ views are sought and taken into account regarding remuneration, including the results of votes on remuneration policies and proposals, if applicable.
Annual Board of Directors’Remuneration Report
G4-54 Report the ratio of the annual total compensation for the organization’s highest-paid individual in each country of significant operations to the median annual total compensation for all employees (excluding the highest-paid individual) in the same country. See appendix
G4-55Report the ratio of percentage increase in annual total compensation for the organization’s highest-paid individual in each country of significant operations to the median percentage increase in annual total compensation for all employees (excluding the highest-paid individual) in the same country.
See appendix
ETHICS AND INTEGRITY Page Revision
G4-56 Describe the organization’s values, principles, standards and norms of behavior such as codes of conduct and codes of ethics. 12,52, 66-67 4
G4-57 Report the internal and external mechanisms for seeking advice on ethical and lawful behavior, and matters related to organizational integrity, such as helplines or advice lines. 66-67 4
G4-58 Report the internal and external mechanisms for reporting concerns about unethical or unlawful behavior, and matters related to organizational integrity, such as escalation through line management, whistleblowing mechanisms or hotlines. 66-67 4

77SPECIFIC BASIC CONTENT GRI G4
Material issues identified on the materiality matrix, in the 20.16 Plan and the risks map.
Indicator Page/Direct reference Scope Revision
Economic dimension
Economic performance
Profitable growthTransparency in the information provided to the marketActivity in the securities market
G4-EC1 Direct economic value generated and distributed. See appendix. Ferrovial 4
G4-EC2 Financial implications and other risks and opportunities for the organization's activities due to climate change.
Risks and opportunities are disclosed in the Carbon Disclosure Project report, which is publicly-available on the CDP website. Information for 2015 will be made available during 2016.
Ferrovial 4 (1)
G4-EC3 Coverage of the organization's defined benefit plan obligations.
Note 6.2 of 2015 Annual Consolidated Financial StatementsNote 6.6 of 2015 Annual Consolidated Financial Statements
Ferrovial 4
G4-EC4 Financial assistance received from government. Note 6.4. of 2015 Annual Consolidated Financial Statements Ferrovial 4
Presence in the market
"Establishing a methodology for evaluating suppliers based on riskDiversity and equal opportunitiesSupply chain"
G4-EC5 Ratios of standard entry level wage by gender compared to local minimum wage at significant locations of operation.
The relationship between entry level wage and the local minimum wage in relevant countries is as follows:Spain: 1,15United Kingdom: 1United States: 1,38Poland: 1Chile:1,04
Ferrovial 4
G4-EC6 Proportion of senior management hired from the local community at significant locations of operation.
In 2015, the proportion of senior management hired from the local community was 93%. Ferrovial 4 (3)
Indirect economic consequences
Social footprintCommunityCorporate Volunteering
G4-EC7 Development and impact of infrastructure investments and services supported. 61-62 Ferrovial 4
G4-EC8 Significant indirect economic impacts, including the extent of impacts. 61-62 Ferrovial 4
Purchasing practices
Supply chain G4-EC9 Proportion of spending on local suppliers at significant locations of operation.
In 2015, the proportion of spending on local suppliers has been higher than 95% Ferrovial 4(4)
Environmental dimension
Materials
Developing a sustainable construction strategy.Eco-efficiency.Having procedures and protocols in place for handling, use and storage of hazardous substances
G4-EN1 Materials used by weight or volume. See appendix. Según nota 4 (5)
G4-EN2 Percentage of materials used that are recycled input materials. See appendix. Ferrovial 4 (6)
Energy
Eco-efficiency.Climate change.Leading the sector on sustainability issues
G4-EN3 Energy consumption within the organization. See appendix. Ferrovial 4(7)
G4-EN4 Energy consumption outside of the organization.Energy use from consumption of fuels, electricity and losses due to electricity transport stood at 2,124,729.84 GJ.
Ferrovial 4(7)
G4-EN5 Energy intensity. Energy intensity stood at 821.79 GJ/net revenues. Ferrovial 4(7)
CRE1 Building energy intensity. Not applicable, as this indicator is associated with real estate, which does not represent a significant activity for Ferrovial.
G4-EN6 Reduction of energy consumption. Energy consumption increased 8.01% compared to 2014. Ferrovial 4(7)
G4-EN7 Reductions in energy requirements of products and services. 55 Ferrovial 4 (1)
Water
Water footprint
G4-EN8 Total water withdrawal by source. See appendix. Ferrovial 4 (7) (8)
G4-EN9 Water sources significantly affected by withdrawal of water.
Water withdrawal requires an authorization whereby the volume of water withdrawn is restricted. It must always be below the maximum limits established by the competent authority. This is why it is considered that, in accordance with these authorizations, the water withdrawn by Ferrovial does not affect the hydric resource significantly.
Ferrovial 4 (1)
G4-EN10 Percentage and total volume of water recycled and reused. The consumption of recycled and reused water stood at 876,856 m3 Ferrovial 4 (7) (9)
CRE2 Building water intensity. Not applicable, as this indicator is associated with real estate, which does not represent a significant activity for Ferrovial.
Biodiversity
Biodiversity
G4-EN11Operational sites owned, leased, managed in, or adjacent to, protected areas and areas of high biodiversity value outside protected areas.
57 Ferrovial Agroman and Cintra 4
G4-EN12Description of significant impacts of activities, products, and services on biodiversity in protected areas and areas of high biodiversity value outside protected areas.
57 Ferrovial Agroman 4
G4-EN13 Habitats protected or restored. 57 Ferrovial 4
G4-EN14Total number of IUCN Red List species and national conservation list species with habitats in areas affected by operations, by level of extinction risk.
See appendix.
Cintra Infraestructuras, Amey UK, Ferrovial Agroman, SA, Ferrovial US Corp, Ferrovial Agromán Australia, Ferrovial Agroman Portugal.
4
Emissions

78
2015 Management Report. Ferrovial S.A. and subsidiaries
SPECIFIC BASIC CONTENT GRI G4
Material issues identified on the materiality matrix, in the 20.16 Plan and the risks map.
Indicator Page/Direct reference Scope Revision
Climate changeEnvironmental damagesLeading the sector on sustainability issues
G4-EN15 Direct greenhouse gas (GHG) emissions (Scope 1). 55 (See appendix.) Ferrovial 4 (7) (9)
G4-EN16 Energy indirect greenhouse gas (GHG) emissions (Scope 2). 55 (See appendix.) Ferrovial 4 (7) (9)
G4-EN17 Other indirect greenhouse gas (GHG) emissions (Scope 3). 55 (See appendix.) Según nota 4 (7) (10)
G4-EN18 Greenhouse gas (GHG) emissions intensity. The greenhouse gas (GHG) emissions intensity stood at 60.77 tCO2/INCN. See appendix. Ferrovial 4 (7)
CRE3 Greenhouse gas emissions intensity from buildings.Not applicable, as this indicator is associated with real estate, which does not represent a significant activity for Ferrovial.
CRE4 Greenhouse gas emissions intensity from new construction and redevelopment activity.
Not applicable as this indicator is associated with real estate, which is not a significant activity for Ferrovial.
G4-EN19 Reduction of greenhouse gas (GHG) emissions. 55-56 Ferrovial 4
G4-EN20 Emissions of ozone-depleting substances (ODS). See appendix. Ferrovial 4
G4-EN21 NOX, SOX, and other significant air emissions. See appendix. Ferrovial 4 (7) (11)
Effluent and waste
Having programs to respond to spill emergenciesEnvironmental damage
G4-EN22 Total water discharge by quality and destination.
In 2015, the total wastewater discharge stood at 829.660,77 m3. This information is not comparable with previous years due to changes in the water footprint calculation methodology.
Ferrovial 4 (12, 13)
G4-EN23 Total weight of waste by type and disposal method. 55 and appendix. Ferrovial 4 (7) (9) (14)
G4-EN24 Total number and volume of significant spills. In 2015, there were no spills that have undergone significant penalty. Ferrovial 4 (15)
G4-EN25
Weight of transported, imported, exported, or treated waste deemed hazardous under the terms of the Basel Convention Annex I, II, III, and VIII, and percentage of transported waste shipped internationally.
Not reported. Ferrovial NV
G4-EN26Identity, size, protected status, and biodiversity value of water bodies and related habitats signifcantly affected by the organization's discharges of water and runoff.
57 Ferrovial Agroman 4 (1)
Degradation, contamination and soil remediation
Non-material. CRE5Land and other assets remediated and in need of remediation for the existing or intended land use according to applicable legal designations.
Not reported. Ferrovial NV
Products and services
Developing a sustainable construction strategy.
G4-EN27 Extent of impact mitigation of environmental impacts of products and services. See appendix. Ferrovial 4 (1)
G4-EN28 Percentage of products sold and their packaging materials that are reclaimed by category.
The company's activities do not include the production of goods sold with packaging. Ferrovial 4
Regulatory compliance
Non-compliance with legislation G4-EN29Monetary value of significant fines and total number of non-monetary sanctions for non-compliance with environmental laws and regulations.
The total amount of fines paid in the year due to breach of environmental legislation stood at € 87,970.04. This amount does not include associated civil liability (compensation).Note 6.5 of 2015 Annual Consolidated Financial Statements
Ferrovial 4
Transport
Climate change G4-EN30Significant environmental impacts of transporting products and other goods and materials for the organization's operations, and transporting members of the workforce.
The most significant impact caused by the transport of products, materials and persons are greenhouse gas emissions caused by the same. Said emissions are included in Scope 3 under the "Business travel" and "Upstream transportation and distribution" categories.
Ferrovial 4
General
Eco-efficiency Climate Change G4-EN31 Total environmental protection expenditures and investments
by type.
Total environmental investment and spending in 2015 stood at 65,037,898 € breaking down into the following main items:- Environmental Responsibility Insurance: 696,196 €- Waste Management: 10,424,174 €- Certifications: 250,279 €- Training: 316,297 €- Personnel expenses: 19,964,704 €- Investment in equipment: 29,561,796 €- Various projects: 3,824,452 €
Ferrovial 4
Environmental evaluation of suppliers
Having a purchasing policy.Establishing a methodology for evaluating suppliers based on risk.Including suppliers in the company's corporate responsibility policy
G4-EN32 Percentage of new suppliers that were screened using environmental criteria. 59 Ferrovial 4 (1)
G4-EN33 Significant actual and potential negative environmental impacts in the supply chain and actions taken.
In Construction, the negative environmental impacts had by the supply chain are evaluated, identifying potential risks and substandard work. The measures adopted range from expulsion from the project and/or rejection of the supplier, to warnings that improvements are required in less serious cases.
Ferrovial 4
Environmental claim procedures
Not reported. G4-EN34 Number of grievances about environmental impacts filed, addressed, and resolved through formal grievance mechanisms. Not reported. Ferrovial NV
Social dimension

79SPECIFIC BASIC CONTENT GRI G4
Material issues identified on the materiality matrix, in the 20.16 Plan and the risks map.
Indicator Page/Direct reference Scope Revision
LABOR PRACTICES AND DIGNITY OF LABOR
Employment
Attracting and retaining talent.Diversity and equal opportunities.
G4-LA1 Total number and rates of new employee hires and employee turnover by age group, gender and region.
48See appendix. Ferrovial 4 (3) (16)
(17)
G4-LA2Benefits provided to full-time employees that are not provided to temporary or part-time employees, by significant locations of operation.
Social benefits are offered equally to full-time employees and part-time employees. In some cases, employees need to have held their posts for at least one year to be eligible for certain social benefits.
Ferrovial 4 (17)
G4-LA3 Return to work and retention rates after parental leave, by gender.
Ferrovial does not consider this a risk, as the countries where it operates have protectionist legislation in place for such matters. Such information is therefore not subject to specific managerial procedures.
Ferrovial 4 (1)
Relations between staff and management
Human Rights G4-LA4 Minimum notice periods regarding operational changes, including whether these are specified in collective agreements.
Ferrovial complies with the advance notice periods established in labor legislations or those enshrined, if applicable, in the collective agreements pertinent to each business, with no corporate advance notice periods having been established.
Ferrovial 4 (1)
Health and safety in the workplace
Occupational health and safety.Having a corporate policy on employeehealth and safety
G4-LA5Percentage of total workforce represented in formal joint management-worker health and safety committees that help monitor and advise on occupational health and saftey programs.
See appendix. Ferrovial 4
CRE6Percentage of the organization operating in verified compliance with an internationally recognized health and safety management system.
See appendix. Ferrovial 4 (3)
G4-LA6Type of injury and rates of injury, occupational diseases, lost days, and absenteeism, and total number of work-related fatalities, by region and by gender.
50See appendix. Ferrovial 4 (17)
(18) (19)
G4-LA7 Workers with high incidence or high risk of diseases related to their occupation.
Risk of developing occupational diseases is detected through risk assessments conducted by the Safety and Health Department and controlled through the health surveillance, where relevant relevant protocols according to the risk exposure of the workers are defined and applied.
Ferrovial 4 (1)
G4-LA8 Health and safety topics covered in formal agreements with trade unions.
The agreements in this matter covered with the trade-union organizations are developed through sector agreements that specifically regulate matters such areas as training and information, collective protection, work teams, etc.
Ferrovial 4
Training and education
Training and development
G4-LA9 Average hours of training per year per employee by gender, and by employee category. 48 Ferrovial 4 (18)
(20)
G4-LA10Programs for skills management and lifelong learning that support the continued employability of employees and assist them in managing career endings.
All training and development programs are aimed at improving the employability of the candidate. In the case of early retirement or restructuring plans (e.g. redundancy packages), specific training plans may be negotiated as part of other outplacement plans.
Ferrovial 4(1)
G4-LA11Percentage of employees receiving regular performance and career development reviews, by gender and by employee category.
49 Ferrovial 4 (18) (20)
Diversity and equal opportunities
Diversity and equal opportunities G4-LA12Composition of governance bodies and breakdown of employees per employee category according to gender, age group, minority group membership, and other indicators of diversity.
48Annual Corporate GovernanceReport 2015, Section C.
Ferrovial 4 (20) (21)
Equal remuneration between women and men
Diversity and equal opportunities G4-LA13 Ratio of basic salary and remuneration of women to men by employee category, by significant locations of operation.
Company management, in particular the Remuneration and Benefits Department, monitors compliance with confidentiality requirements and ensures that its remuneration policy is compliant with internal and external equality standards.
Ferrovial 4(2)
Continuous evaluation of supplier labor practices
Having a purchasing policy.Establishing a methodology for evaluating suppliers based on risk.Including suppliers in the company's corporate responsibility policy
G4-LA14 Percentage of new suppliers that were screened using labor practices criteria. 59 Ferrovial 4 (1)
G4-LA15 Significant actual and potential negative impacts for labor practices in the supply chain and actions taken.
As for occupational health and safety practices, incidents range from non-compliance with employee training requirements, improper maintenance of machinery, failure to provide the required safety documentation and breach of instructions given by the project manager. The measures taken range from expulsion from the project and/or rejection of the supplier, to warnings that improvements are required in less serious cases.
Ferrovial 4 (1)
Labor practices claim procedures
Having communication channels for reporting unethical practices G4-LA16 Total number of incidents of discrimination and corrective actions
taken. 66 Ferrovial 4(22)
HUMAN RIGHTS

80
2015 Management Report. Ferrovial S.A. and subsidiaries
SPECIFIC BASIC CONTENT GRI G4
Material issues identified on the materiality matrix, in the 20.16 Plan and the risks map.
Indicator Page/Direct reference Scope Revision
Investment
Human Rights
G4-HR1Total number and percentage of significant investment agreements and contracts that include human rights clauses or that underwent human rights screening.
52There were no significant investment agreements in 2015 that included human rights clauses.
Ferrovial 4(1)
G4-HR2Total hours of employee training on human rights policies or procedures concerning aspects of human rights that are relevant to operations, including the percentage of employees trained.
52 España 4
Non-discrimination
Codes of conductHuman rightsDiversity and equal opportunitiesHaving specific policies on ethics and integrity issues
G4-HR3 Total number of incidents of discrimination and corrective actions taken. 66 Ferrovial 4(22)
Freedom of association and collective bargaining
Human rightsWorkplace conflicts G4-HR4
Operations and suppliers identified in which the right to exercise freedom of association and collective bargaining may be violated or at significant risk, and measures taken to support these rights.
52 Ferrovial 4
Child labor
Human rights G4-HR5Operations and suppliers identified as having significant risk for incidents of child labor, and measures taken to contribute to the effective abolition of child labor.
52 Ferrovial 4
Forced labor
Human rights G4-HR6
Operations and suppliers identified as having significant risk for incidents of forced or compulsory labor, and measures to contribute to the elimination of all forms of forced or compulsory labor.
52 Ferrovial 4
Security measures
Human rights G4-HR7Percentage of security personnel trained in the organization's human rights policies or procedures that are relevant to operations.
Security guards at Ferrovial offices are hired via a company that certifies that said personnel have received the due training.
Ferrovial Headquaters 4 (1)
Rights of the indigenous population
Human rightsCommunity G4-HR8 Total number of incidents of violations involving rights of
indigenous peoples and actions taken.No incidents involving the violation of the rights of indigenous populations were recorded in 2015. Ferrovial 4
Evaluation
Human rights G4-HR9 Total number and percentage of operations that have been subject to human rights reviews or impact assessments.
During 2015 Ferrovial did not conduct any specific studies to evaluate any impact on human rights issues. Ferrovial 4
Evaluation suppliers in terms of human rights
Having a purchasing policy.Establishing a methodology for evaluating suppliers based on risk.Including suppliers in the company's corporate responsibility policy
G4-HR10 Percentage of new suppliers that were screened using human rights criteria. 59 Ferrovial 4 (1)
G4-HR11 Significant actual and potential negative human rights impacts in the supply chain and actions taken.
On the social front, incidents of non-compliance in the provision of documentation and failure to pay their own suppliers are also evaluated. The measures taken range from expulsion from the project and/or rejection of the supplier, to warnings that improvements are required in less serious cases.
Ferrovial 4
Human rights claim procedures
Having communication channels for reporting unethical practices G4-HR12 Number of grievances about impacts on society filed, addressed,
and resolved through formal grievance mechanisms. 66 Ferrovial 4 (22)
SOCIETY
Local communities
Social footprint.Community.
G4-SO1 Percentage of operations with implemented local community engagement, impact assessments, and development programs. 61-62 Ferrovial 4 (1)
G4-SO2 Operations with significant actual and potential negative impacts on local communities.
61-62 No situations were identified in 2015 in which Ferrovial's activities have had any significant negative impacts on local communities.
Ferrovial 4 (1)
CRE7 Number of persons voluntarily and involuntarily displaced and/or resettled by development, broken down by project.
No such operations with these kinds of impacts on local communities were detected in 2015. Ferrovial 4
Combatting corruption
Having specific policies on ethics and integrity issues.Fraud/Corruption
G4-SO3 Total number and percentage of operations asessed for risks related to corruption and the significant risks identified. 66, 67 Ferrovial 4 (1)
G4-SO4 Communication and training on anti-corruption policies and procedures. 52 Spain 4
G4-SO5 Confirmed incidents of corruption and actions taken. 66 Ferrovial 4 (1)

81SPECIFIC BASIC CONTENT GRI G4
Material issues identified on the materiality matrix, in the 20.16 Plan and the risks map.
Indicator Page/Direct reference Scope Revision
Public policy
Publishing policies on ethics and integrity issuesHaving a specific corporate governance policy
G4-SO6 Total value of political contributions by country and recipient/beneficiary.
Ferrovial's Code of Ethics indicates the approval levels that all payments to third parties must be subject to, and states that Ferrovial forbids bribing of authorities and civil servants, and prohibits its employees from making any kind of undue payments to third parties, or giving to or receiving from third parties any undue payments, presents, gifts or favors that are not regular market practices, or which, by reason of their value, characteristics or circumstances, may reasonably be considered to alter the commercial, administrative or professional relations of its companies.
Ferrovial 4 (2)
Unfair competition practices
Non-compliance with legislation G4-SO7 Total number of legal actions for anti-competitive behavior, anti-trust, and monopoly practices and their outcomes.
Ferrovial has undergone two Sanctions (one of them appealed) and a surveillance proceeding by the National Competition Commission.Note 6.3 of 2015 Annual Consolidated Financial StatementsNote 6.5 of 2015 Annual Consolidated Financial Statements
Ferrovial 4
Regulatory compliance
Non-compliance with legislation G4-SO8Monetary value of significant fines and total number of non-monetary sanctions for non-compliance with laws and regulations.
Note 6.3 of 2015 Annual Consolidated Financial StatementsNote 6.5 of 2015 Annual Consolidated Financial Statements
Ferrovial 4
Evaluation of social repercussions of suppliers
Having a purchasing policy.Establishing a methodology for evaluating suppliers based on risk.Including suppliers in the company's corporate responsibility policy
G4-SO9 Percentage of new suppliers that were screened using criteria for impacts on society. 59 Ferrovial 4 (1)
G4-SO10 Significant actual and potential negative impacts on society in the supply chain and actions taken.
58-59On the social front, incidents of non-compliance in the provision of documentation and failure to pay their own suppliers are also evaluated. The measures taken range from expulsion from the project and/or rejection of the supplier, to warnings that improvements are required in less serious cases.
Ferrovial 4
Social impact claim procedures
Having communication channels for reporting unethical practices G4-SO11 Number of grievances about impacts on society filed, addressed,
and resolved through formal grievance mechanisms. 68 Ferrovial 4 (22)
RESPONSIBILITY WITH REGARD TO PRODUCTS
Health and safety of clients
Having policies and management systems to ensure that products/services do not pose a risk to customer health, security, integrity or privacy
G4-PR1 Percentage of significant product and service categories for which health and safety impacts are assessed for improvement. 53-54 Ferrovial 4 (1)
G4-PR2Total number of incidents of non-compliance with regulations and voluntary codes concerning the health and safety impacts of products and services during their life cycle, by type of outcomes.
By 31 December 2015, Ferrovial has open 31 claims due to such incidents.Note 6.3 of 2015 Annual Consolidated Financial StatementsNote 6.5 of 2015 Annual Consolidated Financial Statements
Ferrovial 4
Labelling of products and services
Service qualityHaving policies and management systems to ensure that products/services do not pose a risk to customer health, security, integrity or privacy.Making channels of communication available to customers and complaint resolution proceduresNon-compliance with legislation
G4-PR3
Type of product and service information required by the organization's procedures for product and service information and labeling, and percentage of significant product and service categories subject to such information requirements.
60 Ferrovial 4 (1)
G4-PR4Total number of incidents of non-compliance with regulations and voluntary codes concerning product and service information and labeling, by type of outcomes.
There were not infringements identified in this area. Ferrovial 4
G4-PR5 Results of surveys measuring customer satisfaction. 60
Edytesa, Ditecpesa, Tecpresa, Ferrovial Agroman, Ferrovial Servicios España, Amey, Cintra
4
CRE8 Type and number of sustainability certification, rating and labeling schemes for new construction, management, occupation and redevelopment.
See appendix. Ferrovial 4
Marketing Communication
Non-compliance with legislation
G4-PR6 Sale of banned or disputed productsNote 6.3 of 2015 Annual Consolidated Financial Statements Note 6.5 of 2015 Annual Consolidated Financial Statements
Ferrovial 4
G4-PR7Total number of incidents of non-compliance with regulations and voluntary codes concerning marketing communications, including advertising, promotion, and sponsorship, by type of outcomes
Due to Ferrovial's nature and operations, the company does not market products or services that are prohibited, questioned or the subject of social debate.
Ferrovial 4

82
2015 Management Report. Ferrovial S.A. and subsidiaries
SPECIFIC BASIC CONTENT GRI G4
Material issues identified on the materiality matrix, in the 20.16 Plan and the risks map.
Indicator Page/Direct reference Scope Revision
Client privacy
Service qualityHaving policies and management systems toensure that products/services do not pose a risk to customer health, security,integrity or privacy
G4-PR8 Total number of substantiated complaints regarding breaches of customer privacy and losses of customer data
No claims were received in 2015 regarding breaches of privacy or the mishandling of customers' personal information.
Ferrovial 4
Regulatory compliance
Non-compliance with legislation G4-PR9Monetary value of significant fines for non-compliance with laws and regulations concerning the provision and use of products and services
Note 6.3 of 2015 Annual Consolidated Financial StatementsNote 6.5 of 2015 Annual Consolidated Financial Statements
Ferrovial 4
(1) Reported qualitatively.(2) Only information about the existing Policy is given.(3) No information about contractors and sub-contractors is included.(4) Locally-hired non-centralized suppliers are classified as local suppliers. Percentage of local suppliers is reported,but not the proportion of expending.(5) Information about paper purchased by the group is reported; timber purchased in Ferrovial Agroman UK, Amey, Budimex and FB Serwis-Polonia; tropical timber purchased in Ferrovial Agroman SA; and the most relevant material consumed by Construction Division (concrete), Amey (asphalt), and Budimex (cement).(6) Recycled materials used in construction, maintenance and services are not reported.(7) 2015 data includes estimations according to the best available information at the time of preparing this report, subsequently its level of accuracy is limited.(8) Only information regarding water withdrawal from municipal water supplies and water purchased from a third parties is reported. Main consumptions have been estimated on the basis of the water consumption average price.(9) The review of this information has consisted of checking the gathering process of the data reported by the different companies of the group and the analysis of trends in comparison with the previous year.(10) Scope 3 emissions for 2014 have been re-calculated based on the best information available in 2015. This update reduced the figure by 65,99%.(11) Emissions data for NOx, SOx and other significant emissions to the air correspond to direct energy and electricity consumption.(12) Water discharge information was calculated based on standard indicators of water discharge of certain activities published by various sources. Therefore, this information does not represent real measurements of water discharge.(13) The quality and destination of water discharges is not reported.(14) Not broken down by disposal method.(15) Information about total volume of spills is not reported.(16) The employee turnover refers only to the number of employees who voluntarily leave the organization.(17) Not broken down by country or region.(18) Not broken down by gender.(19) Information concerning contractors is only included in the calculation of the overall variation frequency index. This information is partial and estimated, thus not representative. The review of this information has consisted of checking the gathering process of the data reported by the different companies of the group.(20) Not broken down by professional category.(21) Not broken down by age group, minority group membership and other indicators of diversity.(22) Information about complaints received through the Corporative Whistleblowing Channel in Spain is given.
REPORTING PRINCIPLES
AA1000 StandardThe standard is based on three fundamental principles:- Inclusiveness: This principle analyzes whether the company has identified and understood the relevant aspects of its sustainable performance and presents sufficient information in terms of quality and quantity. For more information, please refer to the “Material Issues” section in this chapter.- Materiality: The information must be the information required by the stakeholders. In other words, it ensures disclosure of all those material aspects whose omission or distortion could influence its stakeholders’ decisions or actions. For more information, please refer to the GRI-G4 Indicators Table.- Responsiveness: This report includes the information relating to Ferrovial’s response to stakeholder expectations.
GRI4 GuidelinesGRI Guidelines Principles
- Establishing report contents:• Materiality: Aspects that reflect the significant social, environmental and economic impacts had by the organization or those that could have a substantial influence on stakeholder decisions.• Stakeholder engagement: Identifying stakeholders and describing in the report how their expectations and interests have been addressed.• Sustainability context: Presenting the company’s performance within the broader context of sustainability.• Completeness: Coverage should enable stakeholders to assess the performance of the reporting organization.
- Establishing the quality of the report:• Balance: The report must reflect both the positive and the negative aspects of the company’s performance.• Comparability: Stakeholders should be able to compare the information over time and with other companies.• Accuracy: The published information must be accurate and detailed.• Clarity: The information must be presented in a way that is clear and accessible to everyone.• Reliability: The information must be of high quality and it should establish the company’s materiality.
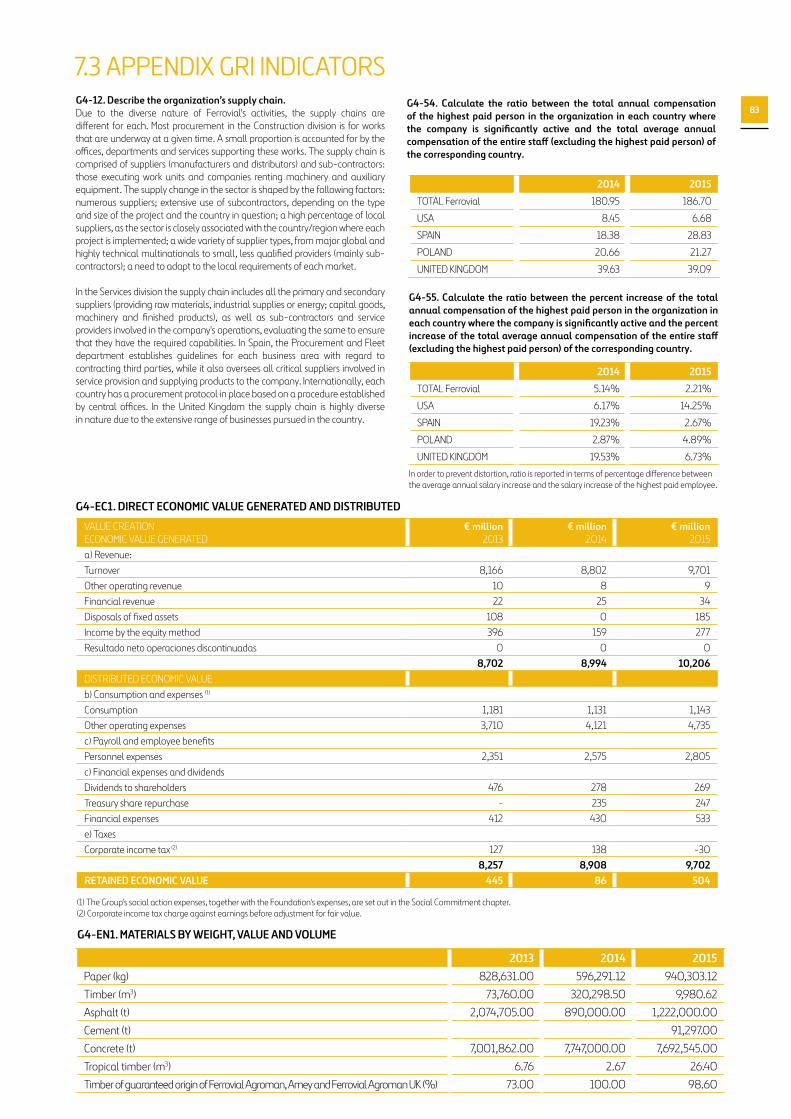
83
7.3 APPENDIX GRI INDICATORS G4-12. Describe the organization’s supply chain. Due to the diverse nature of Ferrovial's activities, the supply chains are different for each. Most procurement in the Construction division is for works that are underway at a given time. A small proportion is accounted for by the offices, departments and services supporting these works. The supply chain is comprised of suppliers (manufacturers and distributors) and sub-contractors: those executing work units and companies renting machinery and auxiliary equipment. The supply change in the sector is shaped by the following factors: numerous suppliers; extensive use of subcontractors, depending on the type and size of the project and the country in question; a high percentage of local suppliers, as the sector is closely associated with the country/region where each project is implemented; a wide variety of supplier types, from major global and highly technical multinationals to small, less qualified providers (mainly sub-contractors); a need to adapt to the local requirements of each market.
In the Services division the supply chain includes all the primary and secondary suppliers (providing raw materials, industrial supplies or energy; capital goods, machinery and finished products), as well as sub-contractors and service providers involved in the company's operations, evaluating the same to ensure that they have the required capabilities. In Spain, the Procurement and Fleet department establishes guidelines for each business area with regard to contracting third parties, while it also oversees all critical suppliers involved in service provision and supplying products to the company. Internationally, each country has a procurement protocol in place based on a procedure established by central offices. In the United Kingdom the supply chain is highly diverse in nature due to the extensive range of businesses pursued in the country.
G4-54. Calculate the ratio between the total annual compensation of the highest paid person in the organization in each country where the company is significantly active and the total average annual compensation of the entire staff (excluding the highest paid person) of the corresponding country.
G4-EC1. DIRECT ECONOMIC VALUE GENERATED AND DISTRIBUTED
G4-55. Calculate the ratio between the percent increase of the total annual compensation of the highest paid person in the organization in each country where the company is significantly active and the percent increase of the total average annual compensation of the entire staff (excluding the highest paid person) of the corresponding country.
2014 2015
TOTAL Ferrovial 180.95 186.70
USA 8.45 6.68
SPAIN 18.38 28.83
POLAND 20.66 21.27
UNITED KINGDOM 39.63 39.09
2014 2015
TOTAL Ferrovial 5.14% 2.21%
USA 6.17% 14.25%
SPAIN 19.23% 2.67%
POLAND 2.87% 4.89%
UNITED KINGDOM 19.53% 6.73%
VALUE CREATIONECONOMIC VALUE GENERATED
€ million2013
€ million2014
€ million2015
a) Revenue:Turnover 8,166 8,802 9,701Other operating revenue 10 8 9Financial revenue 22 25 34Disposals of fixed assets 108 0 185Income by the equity method 396 159 277Resultado neto operaciones discontinuadas 0 0 0
8,702 8,994 10,206DISTRIBUTED ECONOMIC VALUEb) Consumption and expenses (1)
Consumption 1,181 1,131 1,143Other operating expenses 3,710 4,121 4,735c) Payroll and employee benefitsPersonnel expenses 2,351 2,575 2,805c) Financial expenses and dividendsDividends to shareholders 476 278 269Treasury share repurchase - 235 247Financial expenses 412 430 533e) TaxesCorporate income tax (2) 127 138 -30
8,257 8,908 9,702RETAINED ECONOMIC VALUE 445 86 504
(1) The Group's social action expenses, together with the Foundation's expenses, are set out in the Social Commitment chapter. (2) Corporate income tax charge against earnings before adjustment for fair value.
G4-EN1. MATERIALS BY WEIGHT, VALUE AND VOLUME
2013 2014 2015Paper (kg) 828,631.00 596,291.12 940,303.12
Timber (m3) 73,760.00 320,298.50 9,980.62
Asphalt (t) 2,074,705.00 890,000.00 1,222,000.00
Cement (t) 91,297.00
Concrete (t) 7,001,862.00 7,747,000.00 7,692,545.00
Tropical timber (m3) 6.76 2.67 26.40
Timber of guaranteed origin of Ferrovial Agroman, Amey and Ferrovial Agroman UK (%) 73.00 100.00 98.60
In order to prevent distortion, ratio is reported in terms of percentage difference between the average annual salary increase and the salary increase of the highest paid employee.

84
2015 Management Report. Ferrovial S.A. and subsidiaries
G4-EN2. PERCENTAGE OF MATERIALS USED THAT ARE RECYCLED MATERIALS
2013 2014 2015Percentage of paper with FSC seal 32% 38% 62.15%
Percentage of recycled paper 40% 36% 31.70%
G4-EN3. INTERNAL ENERGY CONSUMPTION
2013 2014 2015
Fuels used by stationary and mobile sources (total) (GJ)
Diesel 4,375,311.03 4,014,658.47 3,864,022.94
Fuel oil 17,856.57 90,487.73 75,709.34
Gasoline 314,437.24 326,871.24 244,814.45
NG 2,234,349.98 1,786,842.66 2,514,034.67
LPG 4,277.35 969.86 1,022.28
Propane 2,673.20 10,192.16 7,969.02
Coal 86,252.30 206,180.13
Consumption of energy acquired, by primary sources (GJ)
Coal 729,385.00 706,067.12 759,019.18
Diesel 124,347.00 121,260.00 120,163.86
Gas 749,889.00 623,985.86 630,100.40
Biomass 48,384.00 51,758.49 67,724.79
Waste 10,934.00 9,928.77 12,112.65
Other 349,147.00 346,846.98 448,336.57
Electricity consumption from non-renewable sources (kWh)
Services 73,677,253.00 62,882,917.84 66,673,099.00
Construction 143,157,389.36 139,870,131.36 115,801,962.95
Toll Roads 28,302,112.88 30,517,690.86 33,775,483.76
Corporate 1,344,562.00 1,231,267.00 1,270,943.00
Electricity consumption from renewable sources (Kwh)
Services 18,524,301.70 25,797,308.00 27,120,283.00
Construction 38,007,908.80 13,462,171.00 25,582,309.03
Toll Roads 0.00 0.00 0.00
Corporate 0.00 0.00 0.00
ENERGY PRODUCED (GJ) 2012 2013 2014 2015
Electricity produced by biogas recovery 493,857 520,751 482,034 415,569
Thermal energy produced by biogas recovery 134,060 187,632 136,964 241,604
Electricity generated at water treatment plants 23,494 106,124 114,192 157,595
Electricity generated at thermal sludge drying plants 264,626 142,376 13,617 32,637
TOTAL 916,037 956,883 746,808 847,405
G4-EN8. TOTAL WATER CAPTURE BY SOURCE
2013 2014 2015
Consumption of reused water (m3) 1,933,592 1,751,878 6,630,637.8*
* not comparable with previous years due to methodology

85G4-EN14. TOTAL NUMBER OF IUCN RED LIST SPECIES AND NATIONAL CONSERVATION LIST SPECIES WITH HABITATS INAREAS AFFECTED BY OPERATIONS, BY LEVEL OF EXTINCTION RISK.
Nº
Species (Scientific names)
IUCN Red List species
Libro Rojo de las Aves (ES)
Catálogo Nacional
de Especies Amenazadas (ES)
Libro Rojo de los Invertebrados
de España
Birds of Conservation
Concern in Ireland (BoCCI3)
Livro Vermelho dos Vertebrados
de Portugal
1 Oxyura leucocephala Endangered Endangered Endangered
2 Chersophilus duponti Endangered
3 Chlidonias níger Endangered
4 Coscinia romeii Endangered
5 Numenius arquata “Red Status”
6 Motacilla cinerea “Red Status”
7 Pluvialis apricaria “Red Status”
8 Anthus pratensis “Red Status”
9Austropotamobius
pallipes Endangered
10 Caretta caretta Endangered Endangered
11 Nyctalus azoreum EndangeredCritically
Endangered
14Margaritifera margaritifera Endangered
15 Canis lupus Endangered
16 Salmo SalarCritically
Endangered
17
White Clawed Crayfish (Austropotamobius
pallipes) Endangered
2009(Base Year) 2013 2014 2015
Budimex 47,665 62,394 55,749 59,529
Cadagua 63,221 48,107 27,960 19,294
Ferrovial-Agromán 74,934 50,255 70,368 75,536
Webber 52,194 30,263 30,629 30,796
Ferrovial Corporación 896 638 781 704
Cintra 15,684 14,287 15,045 17,671
Amey 147,608 130,563 128,927 95,132
Ferrovial Servicios 404,274 258,244 250,855 284,514
TOTAL tCO2eq 806,476 594,752 580,315 583,176
G4-EN15. DIRECT GREENHOUSE GAS (GHG) EMISSIONS (Scope 1).G4-EN16.ENERGY INDIRECT GREENHOUSE GAS (GHG) EMISSIONS (Scope 2).
G4-EN17. OTHER INDIRECT GREENHOUSE GAS (GHG) EMISSIONS (Scope 3). Below are the activities, products and services subject to scope 3 calculations:• Purchased goods and services: Includes emissions related to the life cycle of materials bought by Ferrovial that have been used in products or services offered by the company. This includes emissions derived from the purchase of paper, wood, water and other significant materials (concrete in the construction division, asphalt in Amey and cement in Budimex).
• Capital goods: Includes all upstream emissions (i.e. cradle-to-gate) from the production of capital goods bought or acquired by the company in the year, according to information included in 2015 Consolidated Financial Statements.Fuel and energy related activities: This section includes the energy required for producing the fuel and electricity consumed by the company and electricity lost during transport.• Upstream transportation and distribution: Includes emissions from the transport and distribution of the main products acquired over the year.
Biogenic CO2 (tCO2eq) 2009(Base Year) 2013 2014 2015
Cadagua 1,191 50,170 53,339 52,143
Ferrovial Services 33,108 44,569 43,672 29,553
34,299 94,728 97,010 81,696

86
2015 Management Report. Ferrovial S.A. and subsidiaries
2009(Base year) 2013 2014 2015
Business travel 403 7,015 11,271 9,900
Capital Goods 648,426 672,295 607,931
Employee commuting 819 1,379 1,547
End of life treatment of sold products 53,617 171,155 23,130
Fuel and energy related activities 164,332 147,894 163,221
Purchased goods and services 593,438 750,808 601,164
Upstream leased 1,728 1,022 2,009 0.00
Upstream transportation and distribution 461,333 451,359 492,843
Use of sold product 669,249 732,877 844,645
Waste generated in operations 306,389 221,378 261,947
Investments 814,108 629,635 650,761 650,761
TOTAL tCO2eq 816,239 3,535,276 3,813,186 3,657,090
2012 2013 2014 2015
EMISSIONS AVOIDED BY SORTING AND BIOGAS CAPTURE
Greenhouse gas avoided by sorting (t CO2 eq) 343,907 338,093 491,507 525,627
Greenhouse gas avoided by biogas capture (t CO2 eq) 628,857 935,316 953,942 889,483
EMISSIONS AVOIDED THROUGH POWER GENERATION
In landfills (t CO2eq) 43,394 45,563 40,932 37,718
At water treatment plants (t CO2eq) 23,913 20,624 10,332 16,681
EMISSIONS PREVENTED BY PURCHASING ELECTRICITY FROM RENEWABLE SOURCES
Electricity bought from third parties (t CO2eq) 12,938 20,379 17,338 23,156
TOTAL 1,053,009 1,359,976 1,514,051 1,492,665
Use of coolants (kg) FM 100 HFC227ea R22 R407C R410A
Amey 3.00 62.00
G4-EN19. REDUCTION OF GREENHOUSE GAS (GHG) EMISSIONS
EN20. EMISSIONS OF OZONE DEPLETING SUBSTANCES
G4-EN21. NOx. SOx AND OTHER SIGNIFICANT ATMOSPHERIC EMISSIONS
• Waste generated in operations: Emissions under this heading are linked to waste generated by the company’s activities reported in 2015.• Business travel: Includes emissions associated with business travel: train, plane and taxi, reported by the main travel agency that the group works with in Spain.• Employee commuting: This includes emissions from journeys made by employees commuting from their homes to central offices in Spain.• Investments:This calculates emissions linked to investments in British airports. Data for 2015 is not available as of the report release date, and therefore emission figures for 2014 are used.
• Use of sold products: Ferrovial calculates emissions generated by use of land transport infrastructure managed by Cintra.• End of life treatment of sold products: This category includes emissions from the elimination of waste generated at the end of the useful lives of products sold by Ferrovial in the reporting year. Only emissions derived from products reported in the “purchased goods and services” category are taken into account.• Upstream leased assets: Includes emissions related to the consumption of electricity at client buildings where maintenance and cleaning services, as well as consumption anagement, are provided by Amey.
G4-EN18. INTENSITY OF GHG EMISSIONS tCO2eq / M€
2009 (Base year) 2013 2014 2015 Reduction 15vs14 Reduction 15vs09
107.94 73.84 66.53 60.77 -8.66 -43.70
NOx (Tn) CO (Tn) COVNM (Tn) SOx (Tn) Partículas (Tn)
Emissions from boilers 107.34 42.70 10.38 142.65 28.05
Emissions caused by motor vehicles 733.06 1,004.67 140.31 0.00 97.33
Emissions caused by electricity 27.65 11.61 0.23 42.75 2.34
Emissions caused by mobile equipment used in construction works
2,020.48 4,542.30 490.64 100.68

87
G4-EN23. TOTAL WEIGHTING OF WASTE. BY TYPE AND TREATMENT METHOD (m3)
2013 2014 2015
Waste produced from construction and demolition 10,882,869.00 1,182,554.78 2,353,518.92
Total soil from excavation 20,199,553.00 9,446,621.55 21,284,729.00
Topsoil reused 12,910.00 989,773.00 440,204.00
Material sent to landfill outside the worksite 3,102,299.00 1,751,227.88 4,984,918.00
Materials reused at worksite 6,812,610.00 6,176,211.39 5,910,889.00
Materials sent to other worksite or authorized landfill 5,375,738.00 6,830,360.30 9,698,718.00
LA5. PERCENTAGE OF TOTAL WORKFORCE REPRESENTED IN FORMAL JOINT MANAGEMENT-WORKER HEALTH AND SAFETY COMMITTEES THAT HELP MONITOR AND ADVISE ON OCCUPATIONAL HEALTH AND SAFTEY PROGRAMS.
CRE6.PERCENTAGE OF THE ORGANIZATION OPERATING IN VERIFIED COMPLIANCE WITH AN INTERNATIONALLY RECOGNIZED HEALTH AND SAFETY MANAGEMENT SYSTEM.
LA6. TYPE OF INJURY AND RATES OF INJURY, OCCUPATIONAL DISEASES, LOST DAYS, AND ABSENTEEISM, AND TOTAL NUMBER OF WORK-RELATED FATALITIES, BY REGION AND BY GENDER.
2013 2014 2015
Percentage of total workforce represented in formal joint management-worker health and safety committees 55 59 68
2013 2014 2015
Percentage of the organization operating in verified compliance with an internationally recognized health and safety management system 66 80 80
2013 2014 2015
Frequency Rate 20.00
Severity Index 0.43
Absenteeism rate 5.16
G4-EN27. DEGREE OF MITIGATION OF THE ENVIRONMENTAL IMPACT HAD BY PRODUCTS AND SERVICESCRE8. Type and number of certifications, classifications and labelling systems regarding the sustainability of new constructions, management, occupation and reconstruction.Over 2015 work was performed on the following projects seeking to obtain certification:
LA1. NUMBER AND RATE OF HIRINGS AND AVERAGE EMPLOYEE ROTATION, BROKEN DOWN BY AGE GROUP, GENDER AND REGIONThe total number of new hires in 2015 stood at 18,860, which corresponds to a total hiring rate of 25.48% of the workforce as of the year-end. The breakdown by gender and age group is as follows:
The turnover average rate for 2015 broken down by gender and age is as follows:
Location Description Certification
Barcelona Library rehabilitation LES CORTS - VIDRE Certificación BREEAM
Madrid
Building of logistics distribution platform in plots P1.1.1 y 2 of the SUNP Northwest sector of
Torrejon de Ardoz, Madrid. Certificación LEED
Men Women
Under 30 4.99% 2.04%
Between 30 and 45 6.48% 3.04%
Over 45 5.61% 3.32%
Men Women
Under 30 0.80% 0.20%
Between 30 and 45 1.00% 0.30%
Over 45 0.60% 0.20%

88
2015 Management Report. Ferrovial S.A. and subsidiaries
7.4 VERIFICATION REPORT

89

90
2015 Management Report. Ferrovial S.A. and subsidiaries
CONSOLIDATED FINANCIAL STATEMENTS

91
2015 Consolidated Financial Statements. Ferrovial, S.A. and Subsidiaries
92
CONTENTS
A CONSOLIDATED STATEMENTS OF FINANCIAL POSITION FOR 2015 AND 2014 93B CONSOLIDATED STATEMENTS OF PROFIT OR LOSS FOR 2015 AND 2014 94C CONSOLIDATED STATEMENTS OF COMPREHENSIVE INCOME FOR 2015 AND 2014 95D CONSOLIDATED STATEMENTS OF CHANGES IN EQUITY FOR 2015 AND 2014 96E CONSOLIDATED STATEMENTS OF CASH FLOWS FOR 2015 AND 2014 97F NOTES TO THE CONSOLIDATED FINANCIAL STATEMENTS FOR 2015 98 SECTION 1: SCOPE OF CONSOLIDATION AND BASIS OF PRESENTATION: 1.1 COMPANY ACTIVITIES AND SCOPE OF CONSOLIDATION 991.2 ASSETS AND LIABILITIES CLASSIFIED AS HELD FOR SALE 1001.3 BASIS OF PRESENTATION AND ACCOUNTING POLICIES 1001.4 EXCHANGE RATES 1061.5 SEGMENT REPORTING 106
SECTION 2: PROFIT FOR THE YEAR: 2.1 OPERATING INCOME 107
2.2 MATERIALS CONSUMED AND OTHER OPERATING EXPENSES 108
2.3 STAFF COSTS 108
2.4 PROFIT FROM OPERATIONS BEFORE IMPAIRMENT AND NON-CURRENT ASSET DISPOSALS 108
2.5 IMPAIRMENT AND NON-CURRENT ASSET DISPOSALS 108
2.6 FINANCIAL RESULT 109
2.7 SHARE OF PROFITS OF COMPANIES ACCOUNTED FOR USING THE EQUITY METHOD 110
2.8 INCOME TAX AND DEFERRED TAXES 110
2.9 LOSS ATTRIBUTABLE TO NON-CONTROLLING INTERESTS 113
2.10 NET EARNINGS PER SHARE 113
SECTION 3: NON-CURRENT ASSETS: 3.1 GOODWILL AND ACQUISITIONS 114
3.2 INTANGIBLE ASSETS 117
3.3 INVESTMENTS IN INFRASTRUCTURE PROJECTS 118
3.4 PROPERTY, PLANT AND EQUIPMENT 120
3.5 INVESTMENTS IN ASSOCIATES 121
3.6 NON-CURRENT FINANCIAL ASSETS 125
SECTION 4: WORKING CAPITAL: 4.1 INVENTORIES 126
4.2 CURRENT TRADE AND OTHER RECEIVABLES 126
4.3 CURRENT TRADE AND OTHER PAYABLES 127
4.4 DISCLOSURES ON CONSTRUCTION AND OTHER CONTRACTS (PERCENTAGE OF COMPLETION) 128
SECTION 5: CAPITAL STRUCTURE AND FINANCING: 5.1 EQUITY 131
5.2 NET CASH POSITION 135
5.3 CASH FLOW 140
5.4 MANAGEMENT OF FINANCIAL RISKS AND CAPITAL 141
5.5 DERIVATIVE FINANCIAL INSTRUMENTS AT FAIR VALUE 144
SECTION 6: OTHER DISCLOSURES: 6.1 DEFERRED INCOME 147
6.2 PENSION PLAN DEFICIT 147
6.3 PROVISIONS 148
6.4 OTHER PAYABLES 149
6.5 CONTINGENT LIABILITIES, CONTINGENT ASSETS, OBLIGATIONS AND COMMITMENTS 149
6.6 REMUNERATION OF THE BOARD OF DIRECTORS 155
6.7 SHARE-BASED PAYMENT 158
6.8 RELATED PARTY TRANSACTIONS 159
6.9 CONFLICTS OF INTEREST 162
6.10 FEES PAID TO AUDITORS 162
6.11 EVENTS AFTER THE REPORTING PERIOD 162
6.12 COMMENTS ON THE APPENDICES 162
SECTION 7: EXPLANATION ADDED FOR TRANSLATION TO ENGLISH

2015 Consolidated Financial Statements. Ferrovial, S.A. and Subsidiaries
93
A. CONSOLIDATED STATEMENTS OF FINANCIAL POSITION AS AT 31 DECEMBER 2015 AND
Translation of consolidated financial statements originally issued in Spanish and prepared in accordance with the regulatory financial reporting framework applicable to the Group in Spain (see Sections 1 and 7). In the event of a discrepancy, the Spanish-language version prevails.
Assets (millions of euros) Notes 2015 2014
Non-current assets 16,821 19,426
Goodwill arising on consolidation 3.1 1,885 1,982 Intangible assets 3.2 234 223 Investments in infrastructure projects 3.3 8,544 10,757 Intangible asset model 3.3 6,957 9,290 Financial asset model 3.3 1,587 1,467
Investment property 15 6 Property, plant and equipment 3.4 491 451 Investments in associates 3.5 3,237 3,317 Non-current financial assets 3.6 755 856 Long term loans to associates 411 375 Restricted cash relating to infrastructure projects and other financial assets 261 405 Other receivables 83 76
Deferred tax assets 2.8 1,254 1,438 Non-current derivative financial instruments at fair value 5.5 406 395 Current assets 8,563 6,048
Assets classified as held for sale 1.2 2,418 2 Inventories 4.1 387 357 Current income tax assets 2.8 135 74 Current trade and other receivables 4.2 2,320 2,170 Trade receivables for sales and services 1,821 1,716 Other current receivables 499 454
Cash and cash equivalents 5.2 3,279 3,439 Infrastructure projects 306 396 Restricted cash 36 59 Other cash and cash equivalents 270 337
Excluding infrastructure projects 2,973 3,043 Current derivative financial instruments at fair value 5.5 23 5 TOTAL ASSETS 25,384 25,473
Equity and liabilities (millions of euros) Notes 2015 2014
Equity 5.1 6,541 6,021
Equity attributable to the shareholders 6,058 5,672
Equity attributable to non-controlling interests 483 349
Deferred income 6.1 1,088 987
Non-current liabilities 9,314 13,030
Pension plan deficit 6.2 46 101 Long-term provisions 6.3 838 1,378 Borrowings 5.2 6,697 8,707 Debt securities and bank borrowings of infrastructure projects 5,320 7,331 Debt securities and borrowings excluding infrastructure projects 1,376 1,375
Other payables 6.4 171 202 Deferred tax liabilities 2.8 1,124 1,310 Derivative financial instruments at fair value 5.5 438 1,332 Current liabilities 8,442 5,435
Liabilities classified as held for sale 1.2 2,690 0 Borrowings 1,385 1,368 Debt securities and bank borrowings of infrastructure projects 1,297 1,276 Bank borrowings excluding infrastructure projects 88 92
Derivative financial instruments at fair value 5.5 259 100 Current income tax liabilities 138 56 Current trade and other payables 4.3 3,346 3,437 Trade payables 1,996 1,940 Customer advances and amounts billed in advance for construction work 887 1,013 Other current payables 464 484
Operating provisions and allowances 6.3 622 475 TOTAL EQUITY AND LIABILITIES 25,384 25,473 The intangible assets, property, plant and equipment and investment property used in infrastructure projects are included under “Investments in Infrastructure Projects”. The accompanying Notes 1.1 to 7 are an integral part of the consolidated statement of financial position as at 31 December 2015.

2015 Consolidated Financial Statements. Ferrovial, S.A. and Subsidiaries
94
B. CONSOLIDATED STATEMENTS OF PROFIT OR LOSS FOR 2015 AND 2014
Translation of consolidated financial statements originally issued in Spanish and prepared in accordance with the regulatory financial reporting framework applicable to the Group in Spain (see Sections 1 and 7). In the event of a discrepancy, the Spanish-language version prevails.
(*) Relating to gains and losses arising from changes in the fair value of derivatives and other financial assets and liabilities (see Note 5.5), asset impairment (see Note 2.5) and the impact of the two items on “Share of Profits of Companies Accounted for Using the Equity Method” (see Note 2.7).
2015 2014
(Millions of euros) Notes Before fair
value adjustments
(*) Fair value adjustments
Total 2015 Before fair
value adjustments
(*) Fair value adjustments
Total 2014
Revenue 9,701 0 9,701 8,802 0 8,802
Other operating income 9 0 9 8 0 8
TOTAL OPERATING INCOME 2.1 9,709 0 9,709 8,810 0 8,810
Materials consumed 1,143 0 1,143 1,131 0 1,131
Other operating expenses 4,735 0 4,735 4,121 0 4,121
Staff costs 2.3 2,805 0 2,805 2,575 0 2,575
TOTAL OPERATING EXPENSES 8,683 0 8,683 7,828 0 7,828
Gross profit from operations 1,027 0 1,027 983 0 983
Depreciation and amortisation charge 256 0 256 244 0 244
Profit from operations before impairment and non-current asset disposals
770 0 770 738 0 738
Impairment and non-current asset disposals 2.5 185 -54 131 0 5 5
Profit from operations 955 -54 901 738 5 743
Financial result on financing -463 0 -463 -373 0 -373
Result on derivatives and other financial results -12 -188 -200 -11 -9 -20
Financial result of infrastructure projects -474 -188 -662 -384 -9 -393
Financial result on financing -35 0 -35 -33 0 -33
Result on derivatives and other financial results 12 49 61 -4 53 49
Financial result excluding infrastructure projects -24 49 26 -37 53 16
Financial result 2.6 -498 -138 -637 -421 44 -377
Share of profits of companies accounted for using the equity method 3.5 275 37 312 159 -20 138
Consolidated profit before tax 732 -155 577 476 28 504
Income tax 2.8 25 30 54 -138 -14 -152
Consolidated profit from continuing operations 757 -126 631 338 15 352
Net profit from discontinued operations 0 0 0 0 0 0
Consolidated profit for the year 757 -126 631 338 15 352
Loss for the year attributable to non-controlling interests 33 56 89 49 0 50
Profit for the year attributable to the Parent 790 -70 720 387 15 402
Net earnings per share attributable to the Parent (Basic / Diluted) 0.98/0.98 0.55/0.55
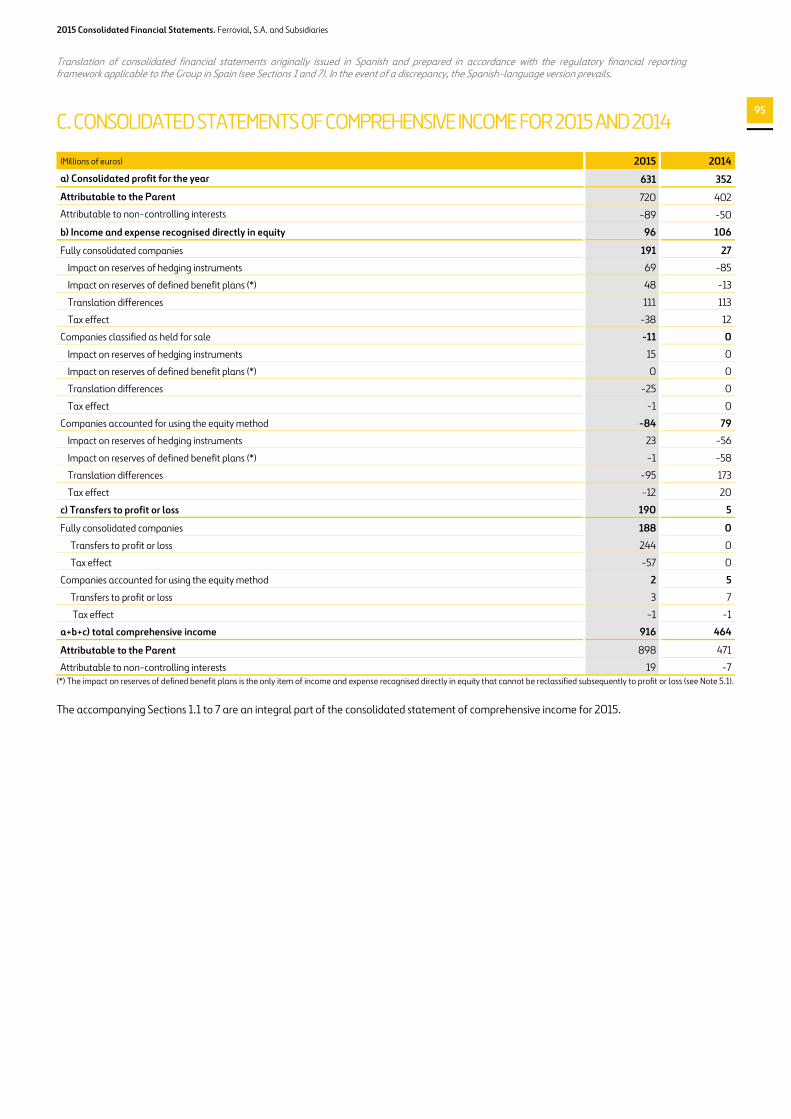
2015 Consolidated Financial Statements. Ferrovial, S.A. and Subsidiaries
95
C. CONSOLIDATED STATEMENTS OF COMPREHENSIVE INCOME FOR 2015 AND 2014
Translation of consolidated financial statements originally issued in Spanish and prepared in accordance with the regulatory financial reporting framework applicable to the Group in Spain (see Sections 1 and 7). In the event of a discrepancy, the Spanish-language version prevails.
(*) The impact on reserves of defined benefit plans is the only item of income and expense recognised directly in equity that cannot be reclassified subsequently to profit or loss (see Note 5.1).
The accompanying Sections 1.1 to 7 are an integral part of the consolidated statement of comprehensive income for 2015.
(Millions of euros) 2015 2014
a) Consolidated profit for the year 631 352
Attributable to the Parent 720 402
Attributable to non-controlling interests -89 -50
b) Income and expense recognised directly in equity 96 106
Fully consolidated companies 191 27
Impact on reserves of hedging instruments 69 -85
Impact on reserves of defined benefit plans (*) 48 -13
Translation differences 111 113
Tax effect -38 12
Companies classified as held for sale -11 0
Impact on reserves of hedging instruments 15 0
Impact on reserves of defined benefit plans (*) 0 0
Translation differences -25 0
Tax effect -1 0
Companies accounted for using the equity method -84 79
Impact on reserves of hedging instruments 23 -56
Impact on reserves of defined benefit plans (*) -1 -58
Translation differences -95 173
Tax effect -12 20
c) Transfers to profit or loss 190 5
Fully consolidated companies 188 0
Transfers to profit or loss 244 0
Tax effect -57 0
Companies accounted for using the equity method 2 5
Transfers to profit or loss 3 7
Tax effect -1 -1
a+b+c) total comprehensive income 916 464
Attributable to the Parent 898 471
Attributable to non-controlling interests 19 -7
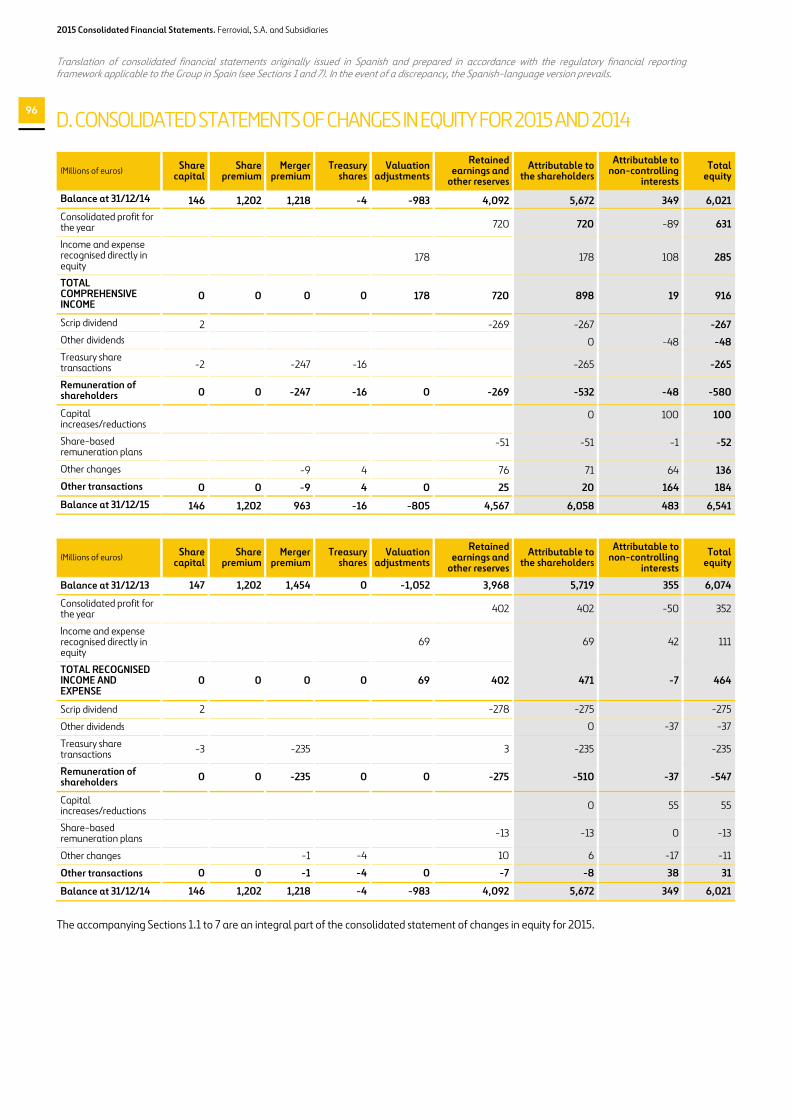
2015 Consolidated Financial Statements. Ferrovial, S.A. and Subsidiaries
96
D. CONSOLIDATED STATEMENTS OF CHANGES IN EQUITY FOR 2015 AND 2014
Translation of consolidated financial statements originally issued in Spanish and prepared in accordance with the regulatory financial reporting framework applicable to the Group in Spain (see Sections 1 and 7). In the event of a discrepancy, the Spanish-language version prevails.
The accompanying Sections 1.1 to 7 are an integral part of the consolidated statement of changes in equity for 2015.
(Millions of euros) Share capital
Share premium
Merger premium
Treasury shares
Valuation adjustments
Retained earnings and other reserves
Attributable to the shareholders
Attributable to non-controlling
interests
Total equity
Balance at 31/12/14 146 1,202 1,218 -4 -983 4,092 5,672 349 6,021
Consolidated profit for the year 720 720 -89 631
Income and expense recognised directly in equity
178 178 108 285
TOTAL COMPREHENSIVE INCOME
0 0 0 0 178 720 898 19 916
Scrip dividend 2 -269 -267 -267
Other dividends 0 -48 -48
Treasury share transactions -2 -247 -16 -265 -265
Remuneration of shareholders 0 0 -247 -16 0 -269 -532 -48 -580
Capital increases/reductions
0 100 100
Share-based remuneration plans
-51 -51 -1 -52
Other changes -9 4 76 71 64 136
Other transactions 0 0 -9 4 0 25 20 164 184
Balance at 31/12/15 146 1,202 963 -16 -805 4,567 6,058 483 6,541
(Millions of euros) Share capital
Share premium
Merger premium
Treasury shares
Valuation adjustments
Retained earnings and other reserves
Attributable to the shareholders
Attributable to non-controlling
interests
Total equity
Balance at 31/12/13 147 1,202 1,454 0 -1,052 3,968 5,719 355 6,074
Consolidated profit for the year 402 402 -50 352
Income and expense recognised directly in equity
69 69 42 111
TOTAL RECOGNISED INCOME AND EXPENSE
0 0 0 0 69 402 471 -7 464
Scrip dividend 2 -278 -275 -275
Other dividends 0 -37 -37
Treasury share transactions -3 -235 3 -235 -235
Remuneration of shareholders
0 0 -235 0 0 -275 -510 -37 -547
Capital increases/reductions 0 55 55
Share-based remuneration plans -13 -13 0 -13
Other changes -1 -4 10 6 -17 -11
Other transactions 0 0 -1 -4 0 -7 -8 38 31
Balance at 31/12/14 146 1,202 1,218 -4 -983 4,092 5,672 349 6,021

2015 Consolidated Financial Statements. Ferrovial, S.A. and Subsidiaries
97
E. CONSOLIDATED STATEMENTS OF CASH FLOWS FOR 2015 AND 2014
Translation of consolidated financial statements originally issued in Spanish and prepared in accordance with the regulatory financial reporting framework applicable to the Group in Spain (see Sections 1 and 7). In the event of a discrepancy, the Spanish-language version prevails.
(Millions of euros) Notes 2015 2014
Net profit attributable to the Parent 720 402
Adjustments for: 307 581
Non-controlling interests -89 -50
Tax -54 152
Result of companies accounted for using the equity method -312 -138
Financial result 637 377
Impairment and gains or losses on non-current asset disposals -131 -5
Depreciation and amortisation charge 256 244
Income taxes paid -61 -19
Change in working capital (receivables, payables and others) -234 -120
Dividends from infrastructure project companies received 399 582
Cash flows from operating activities 5.3 1,130 1,425
Investments in property, plant and equipment and intangible assets -177 -115
Investments in infrastructure projects -556 -365
Acquisitions of companies/capital contribution in companies accounted for using the equity method -106 -390
Long-term restricted cash 85 -29
Divestment of infrastructure projects 0 0
Divestment/Sale of companies 74 11
Cash flows from investing activities 5.3 -680 -888
Cash flows before financing activities 450 537
Capital proceeds from non-controlling interests 119 59
Scrip dividend -267 -275
Acquisition of treasury shares -265 -235
Remuneration of shareholders -532 -510
Dividends paid to non-controlling shareholders of investees -44 -38
Other changes in shareholders’ equity 0 0
Cash flows from shareholders and non-controlling interests -457 -489
Interest paid -354 -310
Interest received 10 16
Increase in borrowings 837 827
Decrease in borrowings -580 -314
Change in borrowings held for sale 0 0
Cash flows from financing activities 5.3 -544 -269
Change in cash and cash equivalents 5.2 -94 268
Cash and cash equivalents at beginning of year 3,439 3,070
Cash and cash equivalents at end of year 3,279 3,439
Effect of foreign exchange rate changes on cash and cash equivalents 36 -101
Change in cash and cash equivalents held for sale 30 0
The accompanying Sections 1.1 to 7 are an integral part of the consolidated statement of cash flows for 2015.

2015 Consolidated Financial Statements. Ferrovial, S.A. and Subsidiaries
98
F. NOTES TO THE CONSOLIDATED FINANCIAL STATEMENTS FOR 2015
Translation of consolidated financial statements originally issued in Spanish and prepared in accordance with the regulatory financial reporting framework applicable to the Group in Spain (see Sections 1 and 7). In the event of a discrepancy, the Spanish-language version prevails.
SECTION 1: BASIS OF PRESENTATION AND SCOPE OF CONSOLIDATION
This section presents the information considered important to know prior to reading the consolidated financial statements of Ferrovial.
BASIS OF PRESENTATION
The consolidated financial statements of Ferrovial were prepared in accordance with the IFRSs adopted by the European Union. The accounting policies applied are disclosed in Note 1.3 of this section.
In 2015 there were no changes in accounting policies or new standards applied that had a significant effect.
COMPANY ACTIVITIES
The disclosures presented in these consolidated financial statements include most notably because of their importance those relating to the distinction between infrastructure project companies and non-infrastructure project companies (see Note 1.1.2 for a definition). Also noteworthy are those relating to the Group's two main assets, the 25% ownership interest in HAH, which owns Heathrow Airport, and the 43.23% ownership interest in the company that owns the ETR 407 toll road in Toronto, Canada.
CHANGES IN THE SCOPE OF CONSOLIDATION AND
ASSETS AND LIABILITIES HELD FOR SALE:
In 2015 the toll road concession operators R-4 Madrid-Ocaña and AP-36 Ocaña La Roda were excluded from the Group's scope of consolidation (see Note 1.1.3). Also, the assets and liabilities of the Chicago Skyway Concession toll road and the Irish toll roads (M4-M6 and M3), for which initial sale agreements were entered into in 2015, were reclassified to "Assets Classified as Held for Sale" and "Liabilities Classified as Held for Sale, respectively (see Note 1.2). At the date of preparation of these Financial Statements, these contracts are still in the process of closing.
The principal impact on the consolidated financial statements of these transactions is the decrease in "Borrowings" and "Investments in Infrastructure Projects" in the statement of financial position.
The detail by company is as follows:
Also, the exclusion from consolidation of the R4 Madrid Ocaña and AP36 Ocaña La Roda toll roads had an effect on profit or loss of EUR 77 million and EUR 64 million, respectively, but did not have any effect on cash.
USE OF JUDGEMENTS AND ESTIMATES
This section includes the main estimates made by Ferrovial when measuring its assets, liabilities, income, expenses and obligations (see Note 1.3.4).
EXCHANGE RATES
Although Ferrovial's functional currency is the euro, a significant portion of its activities is carried on in countries outside the eurozone, its exposure including most notably that to the US dollar, the Canadian dollar, the pound sterling and the Polish zloty. In 2015 there was a significant drop in the value of the euro against those currencies, with the exception of the Canadian dollar, as the value of the euro has been appreciated against this currency. This factor is important for the purpose of being able to understand the changes in these consolidated financial statements. Note 1.4 of this section contains a detail of the changes in the exchange rates used and, in addition, it details the exchange rate effect in the Notes in which such effect is material.
Company Borrowings Investments in infrastructure
projects
Irish toll roads -316 -442
R-4 Madrid Ocaña -654 -1,282 AP36 Ocaña La Roda -570 -479 Chicago Skyway -1,483 -1,647 TOTAL -3,023 -3,850

2015 Consolidated Financial Statements. Ferrovial, S.A. and Subsidiaries
99
1.1. BASIS OF PRESENTATION, COMPANY
ACTIVITIES AND SCOPE OF CONSOLIDATION
1.1.1. Basis of presentation
The consolidated financial statements are presented in accordance with the regulatory financial reporting framework applicable to the Group and, accordingly, present fairly the Group's equity, financial position and results. The regulatory framework consists of International Financial Reporting Standards (IFRSs), as established by Regulation (EC) no. 1606/2002 of the European Parliament and of the Council of 19 July 2002.
1.1.2. Company activities
Ferrovial comprises the Parent, Ferrovial, S.A., and its subsidiaries, which are detailed in Appendix II. Its registered office is in Madrid, at calle Príncipe de Vergara 135.
Through these companies, Ferrovial engages in the following lines of business, which are its reporting segments pursuant to IFRS 8:
� Construction: design and performance of all manner of public and private works, including most notably the construction of public infrastructure.
� Services: maintenance and upkeep of infrastructure, facilities and buildings; waste collection and treatment; and rendering of other kinds of public services.
� Toll roads: development, financing and operation of toll roads.
� Airports: development, financing and operation of airports.
For a more detailed description of the various areas of activity in which the consolidated Group conducts its business operations, please consult the Group's website: www.ferrovial.com.
For the purpose of understanding these consolidated financial statements, it should be noted that a part of the activity carried on by the Group's business divisions consists of the performance of infrastructure projects, primarily in the toll road and airport areas, but also in the construction and services fields.
These projects are conducted through long-term arrangements with public authorities under which the concession operator, in which the Group generally has an ownership interest together with other shareholders, finances the construction or upgrade of public infrastructure, mainly with borrowings secured by the cash flows from the project and with the shareholders' capital contributions, and subsequently maintains the infrastructure. The investment is recovered by means of the collection of tolls or regulated charges for the use of the infrastructure or through amounts paid by the grantor public authority based on the availability for use of the related asset. In most cases the construction and subsequent maintenance of the infrastructure is subcontracted by the concession operators to the Group's Construction and Services Divisions.
From the accounting standpoint, most of these arrangements fall within the scope of application of IFRIC 12.
Accordingly, and in order to aid understanding of the Group’s financial performance, these consolidated financial statements present separately the impact of projects of this nature in “Investments in Infrastructure Projects” (distinguishing between those to which the
intangible asset model is applied and those to which the financial asset model is applied), and, mainly, the net cash position and the cash flow disclosures, in which the cash flows called “other companies”, which comprises the flows generated by the construction and services businesses, the dividends from the capital invested in infrastructure projects and investments in or divestments of the share capital of these projects, is presented separately from the cash flows of the infrastructure projects, which include the flows generated by the related concession operators.
It is also important to highlight that two of the Group's main assets are its 25% ownership interest in Heathrow Airport Holdings (HAH), the company that owns Heathrow Airport in London (UK), and its 43.23% ownership interest in ETR 407, the concession operator of the ETR 407 toll road in Toronto (Canada), which have been accounted for using the equity method since 2011 and 2010, respectively. In order to provide detailed information on the two companies, Note 3.5 on investments in companies accounted for using the equity method includes information relating to the changes in the two companies' balance sheets and statements of profit or loss, and this information is completed in other Notes with data considered to be of interest.
1.1.3. Changes in the scope of consolidation
The main change in the scope of consolidation in 2015 was the exclusion therefrom of the Spanish toll road concession operators R4 Madrid Ocaña and AP 36 Ocaña La Roda. These companies were excluded as it was considered that as a result of the evolution in 2015 of the insolvency proceedings in which they are involved control is not held over the investees as defined in IFRS 10. The evolution of the insolvency proceedings and the conclusions drawn therefrom regarding whether or not the "control" conditions are met are analysed in Note 6.5, Litigation.
As a result of this loss of control, Ferrovial recognised in its consolidated financial statements for 2015 a gain of EUR 140 million (AP 36: EUR 64 million and R4: EUR 77 million), with no cash inflow, relating to the reversal of the losses that had been recognised in prior years in relation to these concessions over and above the amount of the capital invested and the guarantees provided. After recognising this gain, the cumulative loss recognised in relation to the ownership interests in these projects amounted to EUR 53 million and EUR 220 million, respectively, equal to the capital invested and the guarantees provided since the commencement of the two projects. In addition, the assets and liabilities of these companies were excluded from consolidation for EUR 494 million and EUR 1,325 million, respectively, including borrowings of EUR 570 million and EUR 654 million, respectively.
Also, in July an agreement was reached for the sale of 39.9% of the ownership interest in the company responsible for the implementation of the I-77 toll road project in North Carolina (US), thereby reducing the retained interest to 50.1%. This transaction gave rise to a gain of EUR 13 million, which was recognised directly in reserves since although the ownership interest was reduced control over the investee was not lost.
In addition, in relation to the companies accounted for using the equity method, on 27 May 2015 the sale of ITR Concession Company LLC, the Indiana Toll Road concession operator, was completed. The selling price for the 50% owned by Ferrovial was EUR 46 million (USD 50 million), with a gain recognised for the same amount, since an impairment loss had previously been recognised for the entire carrying amount of the ownership interest.
Also, in the Services Division there were scantly material acquisitions of two companies in Poland and another in the UK for an aggregate amount of EUR 29 million.

2015 Consolidated Financial Statements. Ferrovial, S.A. and Subsidiaries
100
1.2. ASSETS AND LIABILITIES CLASSIFIED AS HELD
FOR SALE
In the last few months of 2015 two sale agreements were entered into in connection with the ownership interests in projects in the Toll Roads Division:
� On 15 September an agreement was signed for the sale of majority ownership interests in the operators of two concessions in Ireland, namely M4-M6 (46%) and M3 (75%), for a total price of EUR 61 million. Following the sale of these holdings, non-controlling interests of 20% will be held in the two projects.
� Also, on 13 November an agreement was entered into for the sale of the entire ownership interest (55%) in the Chicago Skyway toll road in the US for a share price of USD 261 million (EUR 234 million).
At 31 December 2015, neither of the agreements had been implemented, since authorisation was pending, and control was held over both investees at that date. At the date of preparation of these financial statements, both agreements are in the process of final closing.
As a result of these sale agreements, the assets and liabilities associated with these companies were classified under "Assets Classified as Held for Sale" and "Liabilities Classified as Held for Sale", respectively.
The detail of the impact of this reclassification is as follows:
Assets Chicago Skyway
Irish toll roads
Total
Investments in infrastructure projects 1,647 442 2,089 Restricted cash and cash and cash equivalents 113 30 143
Other assets 129 58 187
TOTAL ASSETS 1,889 529 2,418
Liabilities Chicago Skyway
Irish toll roads
Total
Borrowings 1,483 316 1,799 Derivative financial instruments at fair value 667 43 710
Other liabilities 33 148 181
TOTAL LIABILITIES 2,183 507 2,690
1.3 ACCOUNTING POLICIES
1.3.1. New accounting standards
1.3.1.a) New standards, amendments and interpretations adopted by the European Union mandatorily applicable for the first time in 2015.
The amendments to IAS 19, Defined Benefit Plans: Employee Contributions and Improvements to IFRSs, 2010-2012 cycle and 2011-2013 cycle became effective in the European Union on 1 January 2015, none of which has a significant impact on the consolidated financial statements for the year that began on 1 January 2015.
1.3.1.b) New standards, amendments and interpretations mandatorily applicable in annual reporting periods subsequent to 2015:
The new standards, amendments and interpretations approved by the IASB but not yet mandatorily applicable that might have an effect on the Group are as follows:
Of all these standards and amendments, the only ones that might have a significant impact on the Group's consolidated financial statements are IFRS 15 and IFRS 9, which are scheduled to become effective on 1 January 2018 and the impact of which is currently being analysed.
1.3.2. Basis of consolidation
In 2015 and 2014 the reporting dates of the separate financial statements of all the companies included in the scope of consolidation were either the same as, or were temporarily brought into line with, that of the Parent.
As indicated above, the consolidated Group applied the consolidation criteria in accordance with IFRSs as adopted by the European Union (EU-IFRSs).
In this connection, set forth below is a detail of only those consolidation criteria adopted by the consolidated Group in preparing these financial statements with respect to which there is an option permitted by IFRSs or, as the case may be, on the basis of the specific nature of the industry in which it operates:
� The contracts that are undertaken through unincorporated temporary joint ventures (UTEs) or similar entities that meet the IFRS 11 requirements for being classified as “joint operations” are proportionately consolidated. It is considered that in these cases of joint control, the venturers have direct control over the assets, liabilities, income and expenses, and joint and several responsibility for the obligations, of these entities. Operations of this nature contributed to the consolidated Group assets, profits and sales of EUR 499 million, EUR 4 million and EUR 987 million, respectively, in 2015 (2014: EUR 695 million, EUR 108 million and EUR 861 million, respectively). Some of these entities could be
New standards, amendments and interpretations
Obligatory application in annual
reporting periods beginning on or after:
Not yet approved for use in the EU
IFRS 9 Financial Instruments 1 January 2018
IFRS 15 Revenue from Contracts with Customers, including a change in the effective date
1 January 2018
Annual improvements 2012-2014 cycle 1 January 2016
Amendments to IFRS 10 and IAS 28
Sale or Contribution of Assets between an Investor and its Associate or Joint Venture
1 January 2016
Amendments to IAS 27
Equity Method in Separate Financial Statements 1 January 2016
Amendments to IFRS 11
Accounting for Acquisitions of Interests in Joint Operations
1 January 2016
Amendments to IAS 16 and IAS 38
Clarification of Acceptable Methods of Depreciation and Amortisation
1 January 2016
Amendments to IAS 1 Disclosure Initiative 1 January 2016

2015 Consolidated Financial Statements. Ferrovial, S.A. and Subsidiaries
101
considered significant to the Group, due to exceeding 0.5% of consolidated sales:
o 407 East Extension is the organization responsible of the design and construction of the highway 407 East in Toronto, Canada. 50% owned by Ferrovial, this entity contributes in EUR 148 million to consolidated Group sales.
o Lagan Ferrovial JV, a company owned 80% by Ferrovial Group, performs design work and construction of Scottish motorways M8 , M73 and M74 in the corridor from Edinburgh to Glasgow. It provides a consolidated group sales of EUR 122 million.
o Bam Ferrovial Kier JV, similar to a joint venture in the UK (without own legal personality), carries out tunnels , structure, finishes and mechanical and electrical installations of the station Farringdon in London , as well as the construction of access tunnels and stations Bond Steet and Tottenham , both within the Crossrail project . 33.34% owned by Ferrovial Group, this entity provides EUR 95 million to consolidated Group sales in 2015.
o Flo JV, owned 50 % by the Group, is the company responsible for the construction of the Nothern Line Extension, and the Thames Tideway Tunnel Central , subway and sewers of London, respectively. It provides consolidated sales of EUR 53 million.
o Warrell Creek to Nambucca is the consortium between Ferrovial and Acciona selected to design and build a 19.5 kilometer stretch of the Pacific Highway in New South Wales, Australia. This collaboration, in which Ferrovial Group has a 50 %, provides a consolidated group sales of EUR 49 million.
� The companies over which Ferrovial, S.A. exercises a significant influence or joint control in cases which do not meet the requirements in IFRS 11 for being classified as "joint operations" are accounted for using the equity method. A breakdown of the companies accounted for under this method can be found in Note 3.5.
� Intra-Group balances and transactions are eliminated on consolidation. However, the transactions recognised in the statement of profit or loss in relation to construction contracts performed by the Construction Division for infrastructure project concession operators are not eliminated on consolidation, since contracts of this kind are treated as construction contracts under which the Group performs work for the concession grantor or regulator in exchange for the right to operate the infrastructure under the terms pre-established by the grantor or regulator. The grantor or regulator thus controls the asset from inception and grants the above-mentioned right in exchange for the work performed, and, therefore, the conclusion may be reached that at Group level the work is performed for third parties. This is in line with IFRIC 12. The non-elimination of these transactions had an impact of EUR 93 million on the consolidated statement of profit or loss, after taxes and non-controlling interests (2014: EUR 59 million). The detail of the transactions not eliminated on the basis of the foregoing is shown in Note 6.8, Related party transactions.
Appendix II contains a list of subsidiaries and associates.
1.3.3. Accounting policies applied to each item in the consolidated statement of financial position and consolidated statement of profit or loss
In line with the disclosures in Note 1.3.2 above, set forth below is a detail of only those accounting policies adopted by the consolidated Group in preparing these consolidated financial statements with respect to which there is an option permitted by IFRSs or, as the case may be, on the basis of the specific nature of the industry in which it operates or of its materiality.
1.3.3.1. Property, plant and equipment, investment property and intangible assets
� Subsequent to initial recognition, the items included under “Intangible Assets”, “Investment Property” and “Property, Plant and Equipment” are measured at cost less any accumulated depreciation or amortisation and any accumulated impairment losses.
� The Group uses the straight-line method to calculate the depreciation and amortisation charge for the assets included under “Intangible Assets”, “Investment Property” and “Property, Plant and Equipment”, except in the case of certain machinery in the construction business, which is depreciated using the diminishing balance method.
The consolidated companies depreciate their various items of property, plant and equipment basically within the following ranges of years of useful life:
1.3.3.2. Investments in infrastructure projects
This line item includes the investments in infrastructure made by infrastructure concession operators within the scope of IFRIC 12 (mainly toll roads).
The assets acquired by the concession operator to provide the concession services but which do not form part of the infrastructure (vehicles, furniture, computer hardware, etc.) are not included in this line item because they are not returned to the concession grantor. Assets of this nature are classified under “Property, Plant and Equipment” and are depreciated over their useful life, using a method that reflects their economic use.
IFRIC 12 intangible asset model
This chapter includes those projects whose remuneration consist of the right to charge the corresponding rates according to the level of use of the public service.
All initial investments relating to the infrastructure that is subsequently returned to the grantor, including compulsory purchase costs and borrowing costs capitalised during construction, are amortised on the basis of the expected pattern of consumption applicable in each case
Years of useful life
Buildings and other structures 10-50
Machinery, fixtures and tools 2-25
Furniture 2-15
Transport equipment 3-20
Other items of property, plant and equipment 2-20

2015 Consolidated Financial Statements. Ferrovial, S.A. and Subsidiaries
102
(normally forecast vehicle numbers in the case of toll roads) over the term of the concession.
The investments contractually agreed on at the start of the concession on a final and irrevocable basis for being made at a later date during the term of the concession, and provided they are not investments made to upgrade infrastructure, are considered to be initial investments. For investments of this nature, an asset and an initial provision are recognised for the present value of the future investment, applying a discount rate to calculate the present value that is equal to the cost of the borrowings associated with the project. The asset is amortised based on the pattern of consumption over the entire term of the concession and the provision is increased by the related interest cost during the period until the investment is made.
Where a payment is made to the grantor to obtain the right to operate the concession, this amount is also amortised based on the pattern of consumption over the concession term.
A provision is recognised systematically for replacement investments over the period in which the related obligations accrue, which must have been set up in full by the time the replacement becomes operational. The provision is recognised on the basis of the pattern of consumption over the period in which the obligation arises, on a time proportion basis.
Infrastructure upgrade investments are those that increase the infrastructure's capacity to generate revenue or reduce its costs. In the case of investments that will be recovered over the concession term, since the upgrade investments increase the capacity of the infrastructure, they are treated as an extension of the right granted and, therefore, they are recognised in the consolidated statement of financial position when they come into service. They are amortised as from the date on which they come into service based on the difference in the pattern of consumption arising from the increase in capacity. However, if, on the basis of the terms and conditions of the concession, these investments will not be offset by the possibility of obtaining increased revenue from the date on which they are made, a provision is recognised for the best estimate of the present value of the cash outflow required to settle the obligations related to the investment that will not be offset by the possibility of obtaining increased revenue from the date on which the investments are made. The balancing item is a higher acquisition cost of the intangible asset.
In the case of the proportional part of the upgrade or increase in capacity that is expected to be recovered through the generation of increased future revenue, the general accounting treatment used for investments that will be recovered in the concession term will be applied.
The main assumptions used in relation to these arrangements correspond to vehicle number and replacement investment estimates, which are updated each year by technical departments.
Set forth below is a detail of the main toll road concessions in force to which the intangible asset model is applied, showing their duration, their status and the accounting method applied:
Toll road concessions accounted for using the intangible asset model:
Concession operator Country
Concession term (years)
Status First year of
concession (*) Accounting method
Skyway Concession (1) US 99 Operating 2005 FC
SH 130 Concession US 50 Operating 2012 FC
NTE Mobility Partners, LLC US 52 Operating 2014 FC
NTE Mobility Partners Seg 3 LLC (2)
US 43 Construction 2013 FC
LBJ Express US 52 Operating 2014 FC I-77 Mobility Partners LLC (3)
US 50 Construction 2014 FC
M-203 Alcalá O'Donnell Spain 30 Construction 2005 FC
Autopista del Sol Spain 55 Operating 1999 FC
Euroscut Azores Portugal 30 Operating 2011 FC
Eurolink Motorway Operations (1)
Ireland 30 Operating 2005 FC
Nea Odos Greece 30 Operating 2007 Eq. Central Greece Greece 30 Operating 2008 Eq. (*) First year of the concession (if in operation) or year of commencement of construction (if at the construction phase). (1) Reclassified to “Assets Classified as Held for Sale” and “Liabilities Classified as Held for Sale” (see Note 1.2). (2) The concession term is 43 years from the commencement of operation services, scheduled for 2018. (3) The concession term is 50 years from the completion of the construction work, estimated at 44 months from the reporting date. The ETR-407 concession was not included in this table as that company does not apply IFRIC 12. Eq: Entities accounted by using the equity method. FC: Full consolidation
Other concession arrangements accounted for using the intangible asset model:
In addition to the toll road concessions shown in the foregoing table, there are other arrangements to which the IFRIC 12 intangible asset model is applied, including most notably a concession of the Services Division held through Autovía de Aragón Sociedad Concesionaria, S.A. for the rehabilitation and subsequent maintenance of a stretch of the Nacional II road in Spain. The main contracts of the Services Division are as follows:
Concession operator Country Concession
term
First year of concession
(*)
Accounting method
Autovía Aragón Spain 19 years 2007 FC
Servicios Urbanos de Murcia
Spain 20 years 2011 FC
PlanAlto Beirao Portugal 25 years 2006 FC
Ecoparc Can Mata (1) Spain 14 years 2011 FC
Gesmat (1) Spain 20 years 2012 FC (1) Bifurcated models (intangible asset / financial asset).
Infrastructure project receivables - IFRIC 12
This line item includes the service concession arrangements related to infrastructure in which the consideration consists of an unconditional contractual right to receive cash or another financial asset, either because the grantor guarantees to pay the operator specified or determinable amounts or because it guarantees to pay the operator the shortfall between amounts received from users of the public service and specified or determinable amounts. Therefore, these are concession

2015 Consolidated Financial Statements. Ferrovial, S.A. and Subsidiaries
103
arrangements in which demand risk is borne in full by the grantor. In these cases, the amount due from the grantor is accounted for as a loan or receivable under assets in the consolidated statement of financial position.
To calculate the amount due from the grantor, the value of the construction, operation and/or maintenance services provided and the interest implicit in arrangements of this nature are taken into consideration.
Revenue from the services (mainly construction and maintenance) provided in each period increases the amount of the related receivables with a credit to sales. The interest on the consideration for the services provided also increases the amount of the receivables with a credit to sales. Amounts received from the grantor reduce the total receivable with a charge to cash.
This interest is accounted for in accordance with IAS 18, Revenue. Under IAS 18, revenue is the gross inflow of economic benefits during the period arising in the course of the ordinary activities of an entity when those inflows result in increases in equity. In this regard, it can be considered that the interest income from concessions of this type should be classified as revenue, since it forms part of the ordinary concession activity and is earned on a regular and periodic basis.
At 31 December 2015, the interest recognised as revenue amounted to EUR 227 million (31 December 2014: EUR 185 million). Also, the borrowing costs associated with the financing of concessions to which the financial asset model is applied amounted to EUR 87 million in 2015 (2014: EUR 77 million).
Set forth below is a detail of the main toll road concessions in force to which the financial asset model is applied, showing their duration, their status and the accounting method applied:
Toll road concessions accounted for using the financial asset model
Concession operator Country Concession term (years)
Status First year
concession (*)
Accounting method
Autopista Terrasa Manresa Spain 50 Operating 1989 FC
Auto-Estradas Norte Litoral Portugal 30 Operating 2006 FC
Autoestrada do Algarve, S.A. Portugal 30 Operating 2004 FC
Eurolink M3 (6) Ireland 45 Operating 2010 FC A66 Benavente - Zamora Spain 30 Construction 2015 Eq.
A-334 Autovía del Almanzora Spain 30 Design 2012 Eq.
407 East Extension (1) Canada 30 Construction 2012 Eq.
Scot Roads Partnership Project Limited M8 (5)
UK 30 Construction 2014 Eq.
Blackbird Infrastructure Group (2) (407 East Phase 2)
Canada 30 Construction 2015 Eq.
Nexus Infr. Unit Trust (Toowoomba) (3)
Australia 25 Construction 2015 Eq.
Ruta del Cacao S.A.S
Colombia 20 Construction 2015 Eq.
(1) The concession term is 30 years from the completion of the construction work, scheduled for June 2016. (2) The concession term is 30 years from the completion of the construction work, scheduled for December 2019. (3) The concession term is 25 years from the completion of the construction work, scheduled for December 2018. (4) The concession term is 20 years from the completion of the construction work, scheduled for June 2021.
(5) The concession term is 30 years from the completion of the construction work, scheduled for September 2017. 20% through Cintra Infraestructuras y 20% through Amey Group (Services Division) (6) Reclassified to “Assets Classified as Held for Sale” and “Liabilities Classified as Held for Sale” (see Note 1.2).
Other concession arrangements accounted for using the financial asset model:
The other arrangements to which the financial asset model is applied relate to the Services and Construction Divisions.
Following is a detail of the most significant concession arrangements of the Construction Division:
Concession operator Country
Concession term (years)
First year of concession (*)
Accounting method
Concesionaria de Prisiones Lledoners Spain 32 2008 FC
Conc. Prisiones Figueras, S.A.U. Spain 32 2011 FC
Depusa Aragón, S.A. Spain 25 2015 FC Aparcamiento Budimex Poland 30 years and
4 months 2012 FC
Urbicsa Ciudad de la Justicia Barcelona España 35 2003 Eq
As regards the Services Division, the most significant arrangements are as follows:
Concession operator Country Concess. term Status First year
concession Acc. method
CTR Oris Spain 16 years 1 2014 FC
Juan Grande Spain 18 years 3 2014 Prop.
Salto del Negro Spain 16 years 3 2014 Prop.
Smart Hospital Cantabria Spain 20 years 3 2014 Eq.
Toll Road IM08 DDS Poland 6 years 2014 FC
AmeyCespa WM East UK 28 years 1 2008 FC
AmeyCespa MK SPV UK 18 years 2 2013 FC
Amey (IOW) SPV Ltd UK 25 years 3 2015 FC
Madrid Calle 30 Spain 35 years 1 2005 Eq.
Integrated Bradford Spv One Ltd
UK 27 years 1 2006 Eq.
Integrated Bradford Spv Two Ltd
UK 27 years 1 2009 Eq.
Amey Lagan Roads Ltd UK 30 years 1 2007 Eq.
Amey Lighting Norfolk Limited
UK 25 years 1 2007 Eq.
E4D&G Project Co Ltd UK 32 years 1 2008 Eq.
Amey Belfast Schools Partnership Pfi Co Ltd
UK 31 years 1 2008 Eq.
The Renfrewshire Schools Partnership Ltd
UK 33 years 1 2005 Eq.
Amey Birmingham Highways Ltd
UK 25 years 2 2010 Eq.
Amey Highways Lighting Manchester Limited
UK 25 years 1 2004 Eq.
Amey Highways Lighting Wakefield Limited
UK 25 years 1 2003 Eq.
Services Support A&S Ltd UK 30 years 1 2004 Eq.
Sheffield PFI UK 25 years 2 2012 Eq.
AmeyCespa (AWRP) SPV Ltd
UK 29 years 2 2014 Eq.
(*) 1: Operating; 2: Construction; 3: Construction / Operating

2015 Consolidated Financial Statements. Ferrovial, S.A. and Subsidiaries
104
1.3.3.3. Other items in the consolidated statement of financial position and consolidated statement of profit or loss
Cash and cash equivalents of infrastructure projects: Restricted cash (Note 5.2)
“Cash and Cash Equivalents - Infrastructure Project Companies - Restricted Cash” includes short-term, highly liquid investments assigned to the financing of certain infrastructure projects, the availability of which is restricted under the financing contracts as security for certain obligations relating to the payment of debt principal and interest and to the maintenance and operation of the infrastructure.
Fair value measurement
The Group only uses fair value measurements in the case of derivative financial instruments. In such measurements, the credit risk of the parties to the related agreement is taken into account. The impact of credit risk will be recognised in profit or loss, except when the derivatives qualify as effective hedges, in which case they will be recognised in reserves. The Group uses appropriate measurement techniques based on the circumstances and on the volume of inputs available for each item, attempting to maximise the use of relevant observable inputs and avoiding the use of unobservable inputs. The Group establishes a fair value hierarchy that categorises the inputs to valuation techniques used to measure fair value into the following three levels:
� Level 1: quoted prices for identical assets or liabilities.
� Level 2: inputs other than quoted prices that are observable for the asset or liability, either directly or indirectly.
� Level 3: unobservable market inputs for the asset or liability.
As indicated in Note 5.5, Derivative financial instruments at fair value, all the Group's derivative financial instruments fall into Level 2.
Non-refundable grants related to assets
Non-refundable grants related to assets are measured at the amount granted under "Deferred Income" (see Note 6.1) in the consolidated statement of financial position, and are taken to profit or loss gradually in proportion to the period depreciation on the assets financed with these grants and are recognised under "Depreciation and Amortisation Charge". From the cash flow standpoint, the amount of the grants collected in the year is presented as a reduction of the amount of the investments made.
Trade payables
"Trade Payables" includes the balances payable to suppliers under reverse factoring arrangements with banks.
These balances are classified as trade payables and the related payments as cash flows from operating activities, since the payments are made to the banks in the same periods as those agreed on with the suppliers in the operating cycle of the business, with no additional deferral or special guarantees to secure the payments to be made.
1.3.3.4 Revenue recognition
Set forth below are specific details of the methods applied to recognise revenue in each of the segments in which Ferrovial operates.
Construction business
Construction business revenue is recognised in accordance with IAS 11, whereby revenue and associated costs are recognised in the statement of profit or loss by reference to the stage of completion of the contract activity at the end of the reporting period, provided that the outcome of the construction contract can be estimated reliably (stage of completion). Any expected loss on the construction contract is recognised as an expense immediately.
The Group habitually conducts surveys of the work performed, which is made possible in practice by the existence in all the contracts of a definition of all the units of output and the price at which each unit is to be billed. There are budgeting tools for monitoring variances. At the end of each month, the units executed in each contract are measured and the output for the month is recognised as revenue. Contract costs are recognised on an accrual basis, and the costs actually incurred in completing the units of output are recognised as an expense and those that might be incurred in the future have to be allocated to the project units completed. In certain jurisdictions in which the policy applied in accordance with generally accepted practice is to recognise revenue on the basis of the stage of completion measured in terms of the costs incurred, the proportion that contract costs incurred bear to the estimated total contract costs is used to determine the revenue to be recognised, by reference to the margin for the entire term of the contract.
In exceptional cases, where it is not possible to estimate the margin for the entire contract, the total costs incurred are recognised and sales that are reasonably assured with respect to the completed work are recognised as contract revenue, subject to the limit of the total contract costs incurred.
Changes to the initial contract require the customer’s technical and financial approval prior to the issue of billings and collection of the amounts relating to additional work. The Group does not recognise revenue from such additional work until approval is reasonably assured and the revenue can be measured reliably. The costs associated with these additional units of output are recognised when incurred. If the changes become subject to a dispute taken to arbitration or before the courts, no additional revenue is recognised and the revenue previously recognised only continues to be recognised if there is a legal report that supports the high probability of recovering the amount in dispute.
Unlike the method used to recognise contract revenue, the amounts billed to the customer are based on achievement of the various milestones established in the contract and on acknowledgement thereof by the customer, which takes the form of a contractual document called "certificate of completion" ("progress billings"). Thus, the amounts recognised as revenue for a given year do not necessarily coincide with the amounts billed to or certified by the customer. In contracts for which the amount of revenue recognised exceeds the amount billed or certified, the difference is recognised in an asset account called “Amounts to be Billed for Work Performed” under “Trade Receivables for Sales and Services”, while in contracts for which the amount of revenue recognised is less than the amount billed or certified, the difference is recognised in a liability account called “Amounts Billed in Advance for Construction Work” under “Trade Payables”.
Initial contract costs incurred in the formalisation of the principal contract, costs of moving plant to the contract site, costs incurred in design, technical assistance and studies, building insurance costs, perimeter fencing costs and other initial contract costs are recognised as prepaid expenses. These costs are initially recognised as inventories

2015 Consolidated Financial Statements. Ferrovial, S.A. and Subsidiaries
105
provided that it is probable that they will be recovered in the future and they are recognised in profit or loss based on actual production with respect to estimated production under each contract. Otherwise, the costs are taken directly to the statement of profit or loss.
Late-payment interest arising from delays in the collection of billings is recognised when it is probable that the interest will be collected and its amount can be measured reliably, and is recognised as a financial result.
Due to the very nature of contracts of this kind, and as can be inferred from the preceding paragraphs, the main factors affecting revenue and cost recognition are subject to significant judgements and estimates, such as the expected outcome of the contract, the amount of costs to be incurred at the end of the construction work, the measurement of work completed in the period and the reasonableness of the recognition of a variation in the initial contract. All these judgements and estimates are made by the persons in charge of performing the construction work, are subsequently reviewed at the various levels of the organisation, and are submitted to controls designed to ensure the consistency and reasonableness of the criteria applied.
Toll Road business
The arrangements included in this line of business are accounted for in accordance with IFRIC 12, which provides for the classification of the assets assigned to such arrangements on the basis of the intangible asset model and the financial asset model (bifurcated arrangements can also exist) (see Note 1.3.3.2).
Service business
In general, the revenue from contracts involving various tasks and unit prices is recognised in the statement of profit or loss when the services are provided, in accordance with IAS 18, Revenue. In the case of long-term contracts with a single payment or annual payments, in which the flow of collections does not correspond to the accrual of the services provided, revenue and costs are recognised by reference to the stage of completion, established in both the aforementioned IAS 18 and in IAS 11, Construction Contracts, on the basis of the costs incurred as a percentage of the total estimated costs and in accordance with the policies established in the section on the Construction business.
Lastly, it should be noted that the revenue from certain contracts that fall within the scope of IFRIC 12 is recognised as described in Note 1.3.3.2.
1.3.4. Accounting estimates and judgements
In the consolidated financial statements for 2015 estimates were made to measure certain of the assets, liabilities, income, expenses and obligations reported herein. These estimates relate basically to the following:
� Estimates to define the methods for accounting for investees, including most notably in 2015 those relating to the R4 Madrid Ocaña and AP36 Ocaña La Roda toll roads, discussed in detail in Note 1.1.3 and 6.5.1.a
� The assessment of possible legal contingencies (see Note 6.5, Contingent liabilities, contingent assets, obligations and commitments and Note 6.3, Provisions).
� The estimates taken into consideration when recognising the results of contracts by reference to the stage of completion in the Construction and Services segments in relation to the
projected final result to be obtained from the contract, the expenses to be incurred at the end of the contract, measurement of the contract work performed in the period or the reasonableness of recognising revenue from a change to the initial contract. All these judgements and estimates are made by the persons in charge of performing the construction work or services contracts, are subsequently reviewed at the various levels of the organisation, and are submitted to controls designed to ensure the consistency and reasonableness of the criteria applied (see Note 1.3.3.5 on revenue recognition in the Construction and Services businesses).
� Estimates regarding derivatives valuation and the related expected flows vinculated with them, in order to define the existence of hedging (see Note 5.5 Derivatives financial instruments)
� The assessment of possible impairment losses on certain assets (see Note 3.1, Goodwill, and Note 3.5, Investments in associates).
� Business performance projections affecting the estimate of recovery of tax credits and their possible recoverability ( see Note 2.8 fiscal situation).
� Estimates taking into account the future vehicle numbers on toll roads for the purpose of preparing financial information for toll roads pursuant to IFRIC 12 (see Note 3.3, Investments in infrastructure projects; and Note 6.3, Provisions).
� The assumptions used in the actuarial calculation of pension and other obligations to employees (see Note 6.2, Pension plan deficit).
� The measurement of stock options and share award plans (see Note 6.7, Share-based payment).
Although these estimates were made using the best information available at 31 December 2015 on the events analysed, events that take place in the future might make it necessary to change these estimates. Changes in accounting estimates would be applied prospectively in accordance with the requirements of IAS 8.
1.3.5. Disclosures
It should also be noted that in preparing these consolidated financial statements the Group omitted any information or disclosures which, not requiring disclosure due to their qualitative importance, were considered not to be material in accordance with the concept of materiality defined in the IFRS Conceptual Framework.

2015 Consolidated Financial Statements. Ferrovial, S.A. and Subsidiaries
106
1.4. EXCHANGE RATES
As indicated above, Ferrovial carries out transactions outside the eurozone through various subsidiaries. The exchange rates used to translate their financial statements for their inclusion in the consolidated Group's consolidated financial statements are as follows:
� Items in the balance sheets (exchange rates at 31 December 2015 and at 31 December 2014 for the comparative figures):
Year-end exchange rate 2015 2014 Change 15/14 (*)
Pound sterling 0.7375 0.7766 -5.04%
US dollar 1.0866 1.21 -10.20%
Canadian dollar 1.5026 1.4054 6.92%
Polish zloty 4.2659 4.2826 -0.39%
Chilean peso 769.98 734.06 4.89% (*) A negative change represents a depreciation of the euro against the reference currency and a positive change represents an appreciation.
� Items in the statements of profit or loss and statements of cash flows (cumulative average rates at 31 December 2015 and at 31 December 2014 for the comparative figures):
Average exchange rate 2015 2014 Change 15/14 (*)
Pound sterling 0.7237 0.8023 -9.79%
US dollar 1.1032 1.3209 -16.48%
Canadian dollar 1.4233 1.4624 -2.67%
Polish zloty 4.1800 4.1954 -0.37%
Chilean peso 727.7625 756.3258 -3.78% (*) A negative change represents a depreciation of the euro against the reference currency and a positive change represents an appreciation. See Note 5.4 for an explanation of how foreign currency risk is managed. That Note also discloses the exchange rate effect on the Notes in which this risk is material.
1.5. SEGMENT REPORTING
The statements of financial position and statements of profit or loss by business segment, for both 2015 and for the comparative period, are shown in Appendix III.
Additionally other sections of this report also contains a breakdown by segment of the sections where this information is material or is required by accounting legislation.

2015 Consolidated Financial Statements. Ferrovial, S.A. and Subsidiaries
107
SECTION 2: PROFIT FOR THE YEAR
This section comprises the Notes relating to the profit for the year.
Net profit for the year amounted to EUR 720 million, up 79.1% on 2014 (EUR 402 million).
This increase is affected by a series of non-recurring results related mainly to divestments, derivatives and taxes, per the following breakdown, and which are explained in more detail in the Notes indicated in the table:
Regardless of these non-recurring impacts, both sales (+10.2%) and profit from operations (+4.3%) were up on 2014. Excluding the impact of the exchange rate, the related changes were 3.1% and -3.4%, respectively, (see the Directors' Report for a detailed explanation of the changes by business division).
2.1. OPERATING INCOME
The detail of the Group's operating income at 31 December 2015 is as follows:
“Revenue” includes the financial consideration for the services provided by the concession operators that apply the financial asset model, amounting to EUR 227 million (2014: EUR 185 million), as described in Note 1.3.3.3.
“Other Operating Income” includes the impact of the grants related to income received in 2015 amounting to EUR 9 million (2014: EUR 8 million).
The detail, by segment, of revenue in 2015 and 2014 is as follows:
31/12/15
(Millions of euros) External sales
Inter-segment sales
Total Change 15/14
Construction 3,561 726 4,287 9%
Toll roads 511 3 513 19%
Airports 8 1 8 -10%
Services 4,891 6 4,897 11%
Other and adjustments 77 -84 -6 -134%
TOTAL 9,048 652 9,701 10%
2014
(Millions of euros) External sales
Inter-segment sales
Total
Construction 3,099 843 3,942 Toll roads 428 4 432 Airports 9 1 9 Services 4,396 6 4,401 Other and adjustments 62 -45 18 TOTAL 7,993 809 8,802
The inter-segment sales that are not eliminated in the Group's consolidated financial statements are the sales made by the Construction Division to the infrastructure concession operators, as discussed in Notes 1.3.2 and 6.8.
The detail of sales, by geographical area, is as follows:
(Millions of euros) 2015 2014 Change 15/14 Spain 2,694 2,709 -15 UK 3,471 3,030 441 US 1,385 1,310 75 Canada 173 100 73 Poland 1,263 1,203 60 Other 714 451 263 TOTAL 9,701 8,802 899
2015 non-recurring impacts Profit before tax
Net profit
Impact of financial derivatives (Note 2.6) -140 -55
Divestment, exclusion from consolidation and impairment of infrastructure projects (Note 2.5)
131 116
Non-recurring impacts, Heathrow (Note 2.7) 138 138
Change in income tax estimate (Note 2.8) 0 157
Other impacts 17 18
TOTAL 145 373
(Millions of euros) 2015 2014
Revenue 9,701 8,802
Other operating income 9 8
TOTAL OPERATING INCOME 9,709 8,810

2015 Consolidated Financial Statements. Ferrovial, S.A. and Subsidiaries
108
2.2. MATERIALS CONSUMED AND OTHER
OPERATING EXPENSES
“Materials Consumed” includes mainly the raw materials used and the changes in inventories in 2015.
“Other Operating Expenses” includes mainly services rendered by third parties under subcontracting arrangements and independent professional services.
The sum of these headings increased by EUR 625 million from EUR 5,253 million at 31 December 2014 to EUR 5,878 million at 31 December 2015. This increase is explained basically by the changes in exchange rates, which gave rise to an impact of EUR 396 million.
2.3. STAFF COSTS
The detail of “Staff Costs” is as follows:
(Millions of euros) 2015 2014 Change
Wages and salaries 2,286 2,116 170 Social security costs 459 417 42 Pension plan contributions 5 5 0 Share-based payment 18 16 2 Other employee benefit costs 37 20 16 TOTAL 2,805 2,575 230
The 9% increase in staff costs in 2015 is in line with the growth in activity and the expansion of the workforce.
The detail of the number of employees at 31 December 2015 and 2014, by professional category and gender, is as follows:
31/12/15
Men Women Total Change 15/14
Executive directors 2 0 2 0% Senior executives 11 2 13 8% Executives 365 53 418 -7% University and further education college graduates
7,910 2,618 10,528 12%
Clerical staff 1,254 2,854 4,108 11% Manual workers and unqualified technicians 42,396 16,567 58,963 6%
TOTAL 51,938 22,094 74,032 7%
31/12/14
Men Women Total Change 14/13
Executive directors 2 0 2 0%
Senior executives 11 1 12 0%
Executives 382 67 449 3%
University and further education college graduates
7,147 2,281 9,428 6%
Clerical staff 1,123 2,573 3,696 3%
Manual workers and unqualified technicians 39,675 15,826 55,501 4%
TOTAL 48,340 20,748 69,088 4.6%
The average number of employees, by business division, for the two periods is as follows:
31/12/15
Men Women Total Change
Construction 13,430 1,795 15,225 2,160 Toll roads 610 289 899 -12 Airports 15 10 25 -8 Services 36,123 19,025 55,148 1,612 Other 277 210 487 64 TOTAL 50,455 21,329 71,784 3,816
31/12/14 Men Women Total
Construction 11,528 1,537 13,065 Toll roads 606 305 911 Airports 22 11 33 Services 35,146 18,390 53,536 Other 231 192 424 TOTAL 47,533 20,435 67,968
2.4. PROFIT FROM OPERATIONS BEFORE
IMPAIRMENT AND NON-CURRENT ASSET DISPOSALS
Profit from operations before impairment and non-current asset disposals at December 2015 amounted to EUR 770 million (December 2014: EUR 738 million, representing an increase of 4% with respect to 2014.
The Directors' Report provides a detailed analysis of the changes in this heading by business.
2.5. IMPAIRMENT AND NON-CURRENT ASSET
DISPOSALS
The detail of the main gains and losses relating to impairment and disposals is as follows:
Gains and losses recognised in 2015:
The net gains corresponding to impairment and disposals in 2015 amounted to EUR 131 and relate mainly to the following:
� Exclusion from consolidation of the ownership interest in the Madrid Levante and R4 Madrid Sur toll roads, with an impact of EUR 64 million and EUR 77 million, respectively (see Note 1.1.2, Changes in the scope of consolidation). This result does not have an impact on cash. After recognising this gain, the accumulated loss recognised in relation to the ownership interests in these projects amounted to EUR -53 million and EUR -220 million, respectively, equal to the capital invested and the guarantees provided since the commencement of the two projects.
� Gain on the sale of the ownership interest (50%) in the ITR Indiana toll road (EUR 46 million), which until then had been accounted for using the equity method (see Note 1.1.2).

2015 Consolidated Financial Statements. Ferrovial, S.A. and Subsidiaries
109
� Impairment of the goodwill allocated to the Tarrasa Manresa toll road (AUTEMA) amounting to EUR -55 million (see Note 3.1.2).
The impact of these transactions on the net profit after non-controlling interests and tax is very similar to that on the profit before tax since the result of excluding the Madrid Levante and R4 Madrid Sur toll roads from consolidation arose from losses recognised in prior periods that did not generate any tax deductibility and the impairment losses on the goodwill of Autema are not tax deductible.
In 2014 only EUR 5 million were recognised in this connection.
Impact on profit before tax
(Millions of euros) Before fair value
adjustments
Fair value adjustments
Total 2015
Impact on net profit
or loss
Madrid Levante 64 0 64 64
R4 Madrid Sur 77 0 77 77 Autema 0 -55 -55 -55 Indiana Toll Road 46 0 46 30 Other -1 1 -1 0 Impairment and gains and losses on non-current asset disposals
185 -54 131 116
2.6. FINANCIAL RESULT
The table below shows the detail of the changes in the financial result from 2014 to 2015. The result of infrastructure projects is presented separately from the result of non-infrastructure project companies and in each of them a further distinction is made between the financial result on financing -which includes the finance costs on bank borrowings and bonds, and the returns on financial assets and loans granted- and the financial result on derivatives and other items, which includes the impact of the fair value measurement of ineffective hedges and other income and expenses not related to financing.
(Millions of euros) 2015 2014 Change
Finance income on financing 1 1 -50% Finance costs on financing -463 -374 24%
Financial result on financing of infrastructure projects -463 -373 24%
Result on derivatives (*) -188 -9 1919% Other financial results -12 -11 7%
Other financial results of infrastructure projects -200 -20 877% Total financial result of infrastructure projects -662 -393 68%
Finance income on financing 21 24 -12% Finance costs on financing -56 -56 0%
Financial result on financing excluding infrastructure projects -35 -33 9%
Result on derivatives (*) 49 53 -7% Other financial results 12 -4 -385%
Other financial results excluding infrastructure projects 61 49 26%
Total financial result excluding infrastructure projects 26 16 60%
FINANCIAL RESULT -637 -377 69%
(*) Included in the “Fair Value Adjustments” column in relation to the financial result in the consolidated statement of profit or loss for a total amount of EUR -138 million.
The financial result on the financing of the infrastructure a)project companies: in 2015 amounted to EUR -463 million (31 December 2014: EUR -373 million). Of this net result, EUR -463 million relate to these companies’ borrowing costs, which were offset slightly by the interest earned on cash and cash equivalent and non-current financial asset balances (mainly restricted cash) amounting to EUR 1 million. The financial result on financing also includes the effect of capitalised borrowing costs relating to construction projects, the detail being as follows:
Financial result on financing of infrastructure projects (Millions of euros)
2015 2014
Accrued finance income and costs -523 -461 Borrowing costs capitalised during the construction period 60 88
Finance costs and income recognised in profit or loss -463 -373
Other financial results of infrastructure projects: includes the b)result on derivatives and other fair value adjustments, primarily as a result of ineffective derivatives, including most notably the discontinuation of the hedges qualifying for hedge accounting of the SH-130 (EUR -139 million) and Autopista del Sol (EUR -48 million) toll roads (see Note 5.5., Derivatives). The other financial results include exchange differences and other results considered to be of a financial nature but not directly related to financing.
The financial result on financing excluding infrastructure c)projects in 2015 amounted to EUR -35 million (31 December 2014: EUR -33 million), corresponding to borrowing costs (EUR -56 million) net of the interest obtained mainly from financial investments (EUR 21 million).
Other financial results excluding infrastructure projects d)include the impact of derivatives and other fair value adjustments relating mainly to the impact of the derivatives considered to be ineffective, including most notably the equity swaps arranged by the Group to hedge the impact on equity of the share option plans (see Note 6.6.7), with a positive impact in 2015 of EUR 46 million due to the increase in the share price. Other financial results excluding infrastructure projects include other items such as the cost of bank guarantees and late-payment interest.
The detail of other financial results excluding infrastructure projects at 31 December 2015 is as follows:
Other financial results excluding infrastructure projects (Millions of euros)
2015 2014 Change 15/14
Cost of guarantees -34 -33 -1
Late-payment interest 20 30 -10 Interest on loans to companies accounted for using the equity method 25 0 25
Other 1 -1 2
TOTAL 12 -4 16

2015 Consolidated Financial Statements. Ferrovial, S.A. and Subsidiaries
110
2.7. SHARE OF PROFITS OF COMPANIES
ACCOUNTED FOR USING THE EQUITY METHOD
The share of the net profit of companies accounted for using the equity method in 2015 amounted to EUR 312 million (2014: EUR 138 million). The detail of the most significant companies is as follows:
Result of companies accounted for using the equity method (Millions of euros)
2015 2014
HAH 186 74
407 ETR 82 54
Other 44 10
TOTAL 312 138
In 2015 HAH's results include most notably the non-recurring impacts relating to fair value adjustments, pensions and taxes amounting to EUR 138 million. Note 3.5 provides greater detail on the results of these companies.
2.8. INCOME TAX AND DEFERRED TAXES
2.8.1. Explanation of the income tax expense for the year and the applicable tax rate
Although the statement of profit or loss for the year includes an income tax benefit amounting to EUR 54 million giving a profit before tax is EUR 577 million, there are certain extraordinary effects that distort the calculation of the effective tax rate. Adjusting these effects, the effective tax rate supported by the results of the Group's business activities stands at 31%, as explained below:
-The income tax benefit of EUR 54 million includes a benefit arising from the change in estimate of prior years' taxes amounting to EUR 157 million due basically to the recognition of tax losses in the US because the impact of the sales transactions of the ITR Indiana toll road recognised in 2015 and of the Chicago Skyway toll road -completed in February 2016- made it possible to use tax losses that had not been recognised in prior years because they would have been recovered at very long term.
Excluding this impact, the income tax expense would be EUR 103 million.
-The profit before tax is also affected by certain items which do not give rise to the recognition of a tax affect and, there, must be adjusted in order to calculate the effective rate. These impacts are:
� The result of companies accounted for using the equity method (EUR 312 million) which, pursuant to accounting legislation, are presented net of the related tax effect.
� Results arising from consolidation with no tax impact, derived from accounting consolidation criteria which do not have any tax implications and which in turn correspond to the following (EUR 66 mllion):
- Losses of fully consolidated companies in the US at which the tax asset is recognised solely at the percentage of ownership these companies are taxed under the pass-through tax rules; the shareholders of these companies are the taxpayers, at the percentage of ownership that they hold therein. The adjustment in this connection would be EUR 119 million.
- Profits arising from the exclusion from consolidation of the R4 Madrid Sur (EUR -77 million) and Madrid Levante (EUR -64 million) toll road projects, which as indicated in Section 2.5 corresponds to the reversal of losses recognised in the past, i.e. losses for which no related tax effect was recognised, and therefore, the reversal of such does not give rise to any tax effect either, as well as the losses generated by these companies in 2015 amounting to EUR 33 million.
- Impairment of goodwill of Autema amounting to EUR 55 million which did not give rise to a deductible tax expense.
� Adjusting these items gives a profit before tax of EUR 331 million, which compares to the tax expenses of EUR 103 million, and gives rise to an effective tax rate of 31%. The following table presents the detail of reconciliation explained for 2015 and 2014:
2015 (Millions of euros) Spain UK US Other
countries Total
Profit/Loss before tax 191 230 -8 164 577
Result of companies accounted for using the equity method
-3 -215 0 -94 -312
Results arising from consolidation with no tax impact
-53 0 119 0 66
Taxable profit/Tax loss 135 15 111 70 331
Current income tax expense 57 -11 -128 27 -54
Change in estimate of prior years' taxes -29 8 172 7 157
Adjusted tax expense 28 -4 44 34 103
Effective rate applicable to taxable profit 21% n.a. 40% 48% 31%
Effective tax rate of the country 28% 20% 35%
26%
The difference between the 31% real effective rate and the 26% nominal rate is caused by certain items that are not tax deductible, mainly losses in international contracts amounting to EUR 64 million taxable and EUR 13 million tax credit .

2015 Consolidated Financial Statements. Ferrovial, S.A. and Subsidiaries
111
2014 (Millions of euros) Spain UK US Other
countries Total
Profit before tax 85 233 3 183 504
Result of companies accounted for using the equity method
-7 -80 0 -52 -138
Results arising from consolidation with no tax impact
53 0 70 0 123
Taxable profit 131 153 73 131 489
Current income tax expense 65 19 30 38 152
Change in estimate of prior years' taxes -28 10 1 5 -12
Adjusted tax expense 36 29 32 44 140
Effective rate applicable to taxable profit 28% 19% 43% 33% 29%
Effective tax rate of the country 30% 22% 35% 28%
The breakdown of the income tax expense for 2015 and 2014, differentiating between current tax, deferred tax and changes in estimates of prior years' taxes, is as follows:
(Millions of euros) 2015 2014
Current income tax expense -54 152
Current tax expense 307 101
Deferred tax expense -205 40
Change in estimate of prior years' taxes -157 12
It should be noted that the current income tax expense includes that relating to the US companies amounting to EUR 230 million, which did not give rise to any tax payable since it will be offset by tax assets not used in prior years. Therefore, the tax payable in 2016 regarding 2015 profit, is estimated at EUR 77 million, and this amount is recognised in the tax-related line items. The difference between this EUR 77 million and the net balance between items recognized under “Current tax assets” (+EUR 175 million) and “Current tax liabilities” balance (-EUR 138 million) corresponds to amounts billed in advance throughout 2015.
2.8.2. Changes in deferred tax assets and liabilities
The detail of the changes in the deferred tax assets and deferred tax liabilities in 2015 is as follows:
Assets (Millions of euros)
Balance at
01/01/15
Transfers
Change in estimate of prior years’ taxes
Charge/Credit to
profit or loss
Charge/ Credit to equity
Exchange rate effect
and other
Balance at
31/12/15
Deferred tax assets
Tax assets 731 -26 236 -377 0 36 600 Differences between tax and accounting income and expense recognition methods
394 22 12 28 -2 4 459
Deferred tax assets arising from valuation adjustments
300 -113 5 67 -100 14 173
Other 13 4 0 6 0 0 23 TOTAL 1,438 -113 253 -276 -102 53 1,254
Liabilities (Millions of euros)
Balance at 01/01/15
Transfers
Change in estimate of prior years’ taxes
Charge/ Credit to profit or loss
Charge/
Credit to
equity
Exchange rate effect and other
Balance at
31/12/15
Deferred tax liabilities
Deferred tax liabilities relating to goodwill
194 1 0 -2 0 4 197
Differences between tax and accounting income and expense recognition methods
951 -110 104 -255 -86 132 735
Deferred tax liabilities arising from valuation adjustments
90 1 -1 7 6 0 104
Other 75 -4 1 -1 17 2 89 TOTAL 1,310 -113 104 -251 -63 138 1,124
The main changes derive from the following items:
-Adjustments to estimates of previous years that substantially derive from extraordinary impacts on income tax as discussed in Note 2.8.1
-Charge/Credit to profit or loss resulting from tax bases consumed in the United States in relation to the sale of ITR highway and its associated deferred taxes.
The deferred tax assets and liabilities recognised at 31 December 2015 arose mainly from:
a) Tax assets
These relate to tax assets which have not yet been deducted by the Group companies. This item does not include all the existing tax assets, but rather only those that, based on the Group's projections, are expected to be able to be used before they expire. The balance recognised totalled EUR 600 million, of which EUR 567 million related to recognised tax losses and the remainder to unused tax credits.
The detail of the total tax loss carryforwards, distinguishing between the maximum tax asset and the tax asset recognised based on the projected recoverability thereof, is as follows:
Country Tax loss
carryforwards Last years for offset
Maximum tax asset
Tax asset recognised
Spanish consolidated tax group
706 No expiry date
177 177
Rest of Spain 26 No expiry date
6 1
US consolidated tax group 938 2025-2034 404 375
Other 299 2016-No expiry date
76 14
TOTAL 1,969 663 567
Additionally, Ferrovial had unused double taxation, reinvestment and other tax credits of EUR 203 million at 31 December 2015 (2014: EUR 192 million), of which EUR 33 million have been recognised.
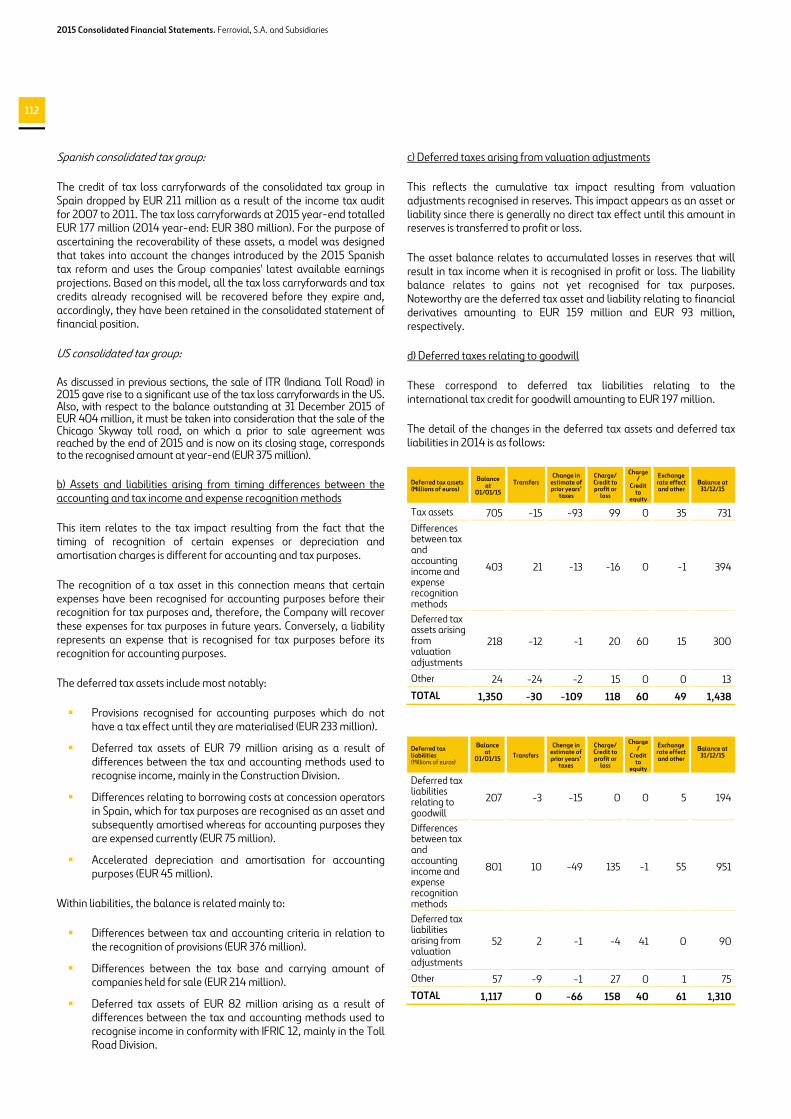
2015 Consolidated Financial Statements. Ferrovial, S.A. and Subsidiaries
112
Spanish consolidated tax group:
The credit of tax loss carryforwards of the consolidated tax group in Spain dropped by EUR 211 million as a result of the income tax audit for 2007 to 2011. The tax loss carryforwards at 2015 year-end totalled EUR 177 million (2014 year-end: EUR 380 million). For the purpose of ascertaining the recoverability of these assets, a model was designed that takes into account the changes introduced by the 2015 Spanish tax reform and uses the Group companies' latest available earnings projections. Based on this model, all the tax loss carryforwards and tax credits already recognised will be recovered before they expire and, accordingly, they have been retained in the consolidated statement of financial position.
US consolidated tax group:
As discussed in previous sections, the sale of ITR (Indiana Toll Road) in 2015 gave rise to a significant use of the tax loss carryforwards in the US. Also, with respect to the balance outstanding at 31 December 2015 of EUR 404 million, it must be taken into consideration that the sale of the Chicago Skyway toll road, on which a prior to sale agreement was reached by the end of 2015 and is now on its closing stage, corresponds to the recognised amount at year-end (EUR 375 million).
b) Assets and liabilities arising from timing differences between the accounting and tax income and expense recognition methods
This item relates to the tax impact resulting from the fact that the timing of recognition of certain expenses or depreciation and amortisation charges is different for accounting and tax purposes.
The recognition of a tax asset in this connection means that certain expenses have been recognised for accounting purposes before their recognition for tax purposes and, therefore, the Company will recover these expenses for tax purposes in future years. Conversely, a liability represents an expense that is recognised for tax purposes before its recognition for accounting purposes.
The deferred tax assets include most notably:
� Provisions recognised for accounting purposes which do not have a tax effect until they are materialised (EUR 233 million).
� Deferred tax assets of EUR 79 million arising as a result of differences between the tax and accounting methods used to recognise income, mainly in the Construction Division.
� Differences relating to borrowing costs at concession operators in Spain, which for tax purposes are recognised as an asset and subsequently amortised whereas for accounting purposes they are expensed currently (EUR 75 million).
� Accelerated depreciation and amortisation for accounting purposes (EUR 45 million).
Within liabilities, the balance is related mainly to:
� Differences between tax and accounting criteria in relation to the recognition of provisions (EUR 376 million).
� Differences between the tax base and carrying amount of companies held for sale (EUR 214 million).
� Deferred tax assets of EUR 82 million arising as a result of differences between the tax and accounting methods used to recognise income in conformity with IFRIC 12, mainly in the Toll Road Division.
c) Deferred taxes arising from valuation adjustments
This reflects the cumulative tax impact resulting from valuation adjustments recognised in reserves. This impact appears as an asset or liability since there is generally no direct tax effect until this amount in reserves is transferred to profit or loss.
The asset balance relates to accumulated losses in reserves that will result in tax income when it is recognised in profit or loss. The liability balance relates to gains not yet recognised for tax purposes. Noteworthy are the deferred tax asset and liability relating to financial derivatives amounting to EUR 159 million and EUR 93 million, respectively.
d) Deferred taxes relating to goodwill
These correspond to deferred tax liabilities relating to the international tax credit for goodwill amounting to EUR 197 million.
The detail of the changes in the deferred tax assets and deferred tax liabilities in 2014 is as follows:
Deferred tax assets (Millions of euros)
Balance at
01/01/15
Transfers
Change in estimate of prior years’ taxes
Charge/ Credit to profit or loss
Charge/
Credit to
equity
Exchange rate effect and other
Balance at 31/12/15
Tax assets 705 -15 -93 99 0 35 731 Differences between tax and accounting income and expense recognition methods
403 21 -13 -16 0 -1 394
Deferred tax assets arising from valuation adjustments
218 -12 -1 20 60 15 300
Other 24 -24 -2 15 0 0 13
TOTAL 1,350 -30 -109 118 60 49 1,438
Deferred tax liabilities (Millions of euros)
Balance at
01/01/15
Transfers
Chenge in estimate of prior years’ taxes
Charge/ Credit to profit or loss
Charge/
Credit to
equity
Exchange rate effect and other
Balance at 31/12/15
Deferred tax liabilities relating to goodwill
207 -3 -15 0 0 5 194
Differences between tax and accounting income and expense recognition methods
801 10 -49 135 -1 55 951
Deferred tax liabilities arising from valuation adjustments
52 2 -1 -4 41 0 90
Other 57 -9 -1 27 0 1 75
TOTAL 1,117 0 -66 158 40 61 1,310

2015 Consolidated Financial Statements. Ferrovial, S.A. and Subsidiaries
113
2.8.3. Years open to tax audit
The criteria that the tax authorities might adopt in relation to the years open for review could give rise to contingent tax liabilities which cannot be objectively quantified. It is considered that any possible material tax contingencies were adequately provisioned at year-end.
There are currently no tax audits in progress since in 2015 the tax audit in Spain of income tax, VAT, withholdings from salary income and withholdings from income from movable capital for 2007 to 2011 was completed. Assessments were mainly signed on an agreed and an uncontested basis which, although they reduced the credit of tax loss carry forwards as discussed in Note 2.8.2 a) above, did not result in a tax debt for Ferrovial. Also, notification was received of the initiation of penalties enforcement proceedings due to the incorrect reporting of tax losses, which it is estimated could give rise to a tax debt payable in 2016 of EUR 7 million.
2.8.4. Tax regime applicable to Ferrovial, S.A.
Ferrovial, S.A. has filed consolidated tax returns since 2002. The companies composing the consolidated tax group together with Ferrovial, S.A. in 2015 are shown in Appendix II. Also, in 2014 the Company opted to be taxed under the tax regime provided for in Articles 107 and 108 of Spanish Income Tax Law 27/2014, of 27 November. Since the application of that tax regime affects the taxation of possible dividends or gains obtained by the Company's shareholders, attached as Appendix II to these consolidated financial statements is a note describing the tax treatment applicable to the shareholders, together with information on the taxable profits obtained by Ferrovial, S.A. that the shareholders should be aware of for the purpose of applying that regime.
2.9. LOSS ATTRIBUTABLE TO
NON-CONTROLLING INTERESTS
In 2015 the loss attributable to non-controlling interests amounted to EUR 89 million (December 2014: EUR 50 million).
The detail of the main profit or loss items by company at 31 December 2015 is as follows:
(Millions of euros) 2015 2014 Change 15/14
% non-controlling interests
Budimex Group -23 -18 -5 40.9% Autopista R4 Madrid Sur 13 13 0 45.0% Autopista Madrid Levante 2 11 -9 46.3%
Autopista del Sol 8 3 5 20.0% Autop. Terrasa Manresa -11 -12 1 23.7% SH-130 Concession Company 73 21 53 35.0%
Skyway Concession Co. 28 22 6 45.0% LBJ Infraestructure Group 20 10 10 49.0%
NTE Mobility Partners 14 4 10 43.3% Other companies -35 -5 -31 TOTAL 89 50 39
2.10. NET PROFIT AND EARNINGS PER SHARE
The calculation of basic earnings per share attributable to the Parent is as follows:
(Millions of euros) 2015 2014
Net profit attributable to the Parent (millions of euros) 720 402
Weighted average number of shares outstanding (thousands of shares) 735,635 736,550
Less average number of treasury shares (thousands of shares) -3,775 -2,831
Average number of shares to calculate basic earnings per share 731,860 733,719
Basic earnings per share (euros) 0.98 0.55
Diluted earnings per share: at 31 December 2015 and 2014, the Group did not have any dilutive potential ordinary shares, since no convertible debt instruments were issued and the share-based or stock option remuneration plans discussed in Note 6.7 will not give rise to any capital increases at the Group, as explained in that Note. Consequently, no dilutive impact is envisaged when employee rights under the plans are exercised.
The detail by geographical area is as follows:
(Millions of euros) 2015 2014 (%) 15/14
Spain 139 11 128
UK 241 225 16
US 232 34 198
Canada 70 64 6
Poland 15 25 -10
Other 22 42 -20
TOTAL 720 402 318
The earnings by business segment are shown in Appendix III.

2015 Consolidated Financial Statements. Ferrovial, S.A. and Subsidiaries
114
SECTION 3: NON-CURRENT ASSETS
This section includes the Notes on non-current assets in the consolidated statement of financial position, excluding deferred tax assets (Section 2) and financial derivatives (Section 4).
The main components of the non-current assets at 31 December 2015 at Ferrovial are goodwill arising on consolidation (EUR 1,885 million) which represents 7% of total assets, “Investments in Infrastructure Projects” (EUR 8,544 million), accounting for 34% of total assets (see Note 3.3) and investments in associates (see Note 3.5), amounting to EUR 3,237 million (relating mainly to the investments in HAH and 407ETR), accounting for 13% of total assets (see Note 3.1).
As regards the changes in goodwill, there was a decrease of EUR 100 million, due mainly to the impairment recognised in 2015 in relation to the goodwill of Autema (EUR -55 million) and the reclassification to "Assets Classified as Held for Sale" of the amount allocated to the Chicago Skyway toll road (EUR -121 million), the two effects being partially offset by the changes in the exchange rate.
The decrease in investments in infrastructure projects with respect to 2014 was due mainly to the exclusion from the scope of consolidation of various infrastructure project companies, which was offset by the exchange rate effect and the investments made in the year:
The decrease of EUR 75 million in investments in associates was due largely to the dividends paid amounting to EUR 337 million, mainly by HAH and ETR407, and to the effect of the exchange rate mainly as a result of the fall in the value of the Canadian dollar (EUR -95 million), partially offset by the share of the profits of those companies (EUR 312 million).
3.1. GOODWILL AND ACQUISITIONS
The table below details the changes in goodwill in 2015:
(Millions of euros)
Balances at
31/12/14
Changes in
the scope of
consolidation
Impairment
losses Exchange
rate effect Balances at
31/12/15
Services 1,430 3 0 50 1,483
Amey 962 3 0 51 1,016 Services Spain 433 0 0 0 433 Other 36 0 0 -1 35 Construction 184 0 0 13 197
Webber 115 0 0 13 128 Budimex 69 0 0 0 69 Toll Roads 369 -121 -55 12 205
Euroscut Algarve 15 0 0 0 15
Ausol 70 0 0 0 70 Autema 175 0 -55 0 120 Chicago Skyway 109 -121 0 12 0
TOTAL 1,983 -118 -55 75 1,885
3.1.1. Changes in 2015
The main changes goodwill in 2015 were due to:
� The reclassification to "Assets Classified as Held for Sale" of the goodwill allocated to Chicago Skyway, since an agreement had been reached to sell the entire ownership interest (55%) in that company, as indicated in Note 1.1.2, Changes in the scope of consolidation, for EUR 121 million.
� The impairment of the goodwill allocated to the Tarrasa Manresa toll road (AUTEMA) amounting to EUR 55 million.
� The changes in the value of the euro against the pound sterling and the US dollar indicated in Note 1.4 increased goodwill by EUR 75 million, of which EUR 51 correspond to the goodwill allocated to Amey.

2015 Consolidated Financial Statements. Ferrovial, S.A. and Subsidiaries
115
3.1.2. Goodwill impairment tests
A. Services Division goodwill (Amey, Ferrovial Services Spain and Steel):
Methodology and discount rate
The goodwill of Amey and Ferrovial Services Spain, amounting to EUR 1,016 million and EUR 433 million, respectively, at 31 December 2015 (31 December 2014: EUR 962 million and EUR 433 million, respectively), is tested for impairment by using cash flow projections for a five-year period. The residual value is based on the cash flow for the last year projected, provided this represents a normalised cash flow and the growth rate applied in no case exceeds the estimated long-term growth rate for the market in which each company operates. Other Services goodwill, EUR 35 million, comprises the goodwill generated by the acquisition of the Chilean services from the mining company Steel, for EUR 26.6 million. The impairment test was conducted in a similar way to that described above.
Cash flows are discounted using a rate based on the weighted average cost of capital (WACC) for assets of this nature. In order to value companies, Ferrovial uses a risk-free rate usually taking as a reference a ten-year sovereign bond based on the location of the company in question and a market premium of 5.5%, based on studies of historical long-term premiums demanded (mainly Dimson and Marsh & Staunton). As regards the risk-free interest rate, it should be noted that the Company considers that the current rate for sovereign bonds in some countries may be artificially low. For the impairment tests the risk-free interest rate used is a normalised rate of 2.56% for the UK (Amey) and 2.68% for Spain (Ferrovial Services Spain), which entails an upward adjustment with respect to the rate for sovereign bonds at 31 December 2015 of 60 basis points in the UK and 91 basis points in Spain. The risk-free interest rate used in Chile is 4.66% (same as the Chilean ten years sovereign bond). Additionally, in order to reflect each company’s exposure, portfolios of comparable companies were selected to obtain unlevered betas. The betas obtained were compared with other sources habitually used by analysts and investment banks (Barra Beta, Bloomberg, etc.).
The discount rates (WACC) used to perform the impairment test are 6.8% in the UK and 6.9% in Spain (compared to the rates of 7.3% and 7.6%, respectively, used in 2014). The WACC used in Steel impairment test is 8.8% (compared to 8.2% used in 2014).
Main factors that affect the valuation and performance compared with 2014 and budget
The projected flows are based on the latest estimates approved by the Company, which take into account recent historical data. The main factors that affect the cash flow projections of the Services Division are revenue forecasts and the projected revenue margins. These projections are based on four basic components:
a) The existing backlog, which offers certainty of a high percentage of revenue in the coming years. The backlog in 2015 remained at a level similar to that of 2014 in the UK, while in Spain it fell by 9%, due to a lower volume of contracts awarded as a result of the drop in public tenders in a year market by several elections.
b) Winning new contracts, which is calculated by applying a success rate (based on historical company data and market prospects) to the estimate of the contracts for which bids will be submitted in the coming years.
c) The estimate of future margins, which are based on the company's historical margins adjusted by certain factors that might affect the markets in the future. In 2015 the EBITDA margin of the Services Division fell by more than 19%, due largely to the negative
contribution of the Birmingham contract, from 8.8% in 2014 to 6.4% in 2015.
In the case of the UK, excluding the Birmingham contract impact and other extraordinary factors, the margin would remain in line with the preceding year. However, Amey's business plan includes more conservative prospects compared to the 2014 impairment test. In 2015 the profit from operations of Ferrovial Services Spain was in line with the budget estimates (used as the starting point for the impairment test model for 2014) and with the EBITDA margin for 2014 (10.7%). The business plan envisages the consolidation of the increase in margins achieved up to the present.
d) The perpetuity growth rate (“g”), based on the prospects of the markets and industries in which the Company operates. The assumption used in all cases is 2%, which is similar to the long-term inflation rates projected in the three cases.
Impairment test results
The value of Amey resulting from application of this impairment test model is 234% higher than its carrying amount (2014: 376%). In the case of Ferrovial Services Spain, the positive difference is 66% (2014: 39%). The value of Steel obtained from the impairment test model is 18% higher than its carrying amount.
Sensitivity analysis
Sensitivity analyses are performed on this goodwill, mainly in relation to the gross profit from operations, the discount rate and the perpetuity growth rate, so as to ensure that possible changes in the estimate do not have an impact on the possible recovery of the goodwill recognised.
A pessimistic scenario was used with a perpetuity growth rate of 1% (instead of 2%) and a reduction in the gross profit from operations of 100 basis points. The valuation disclosed in this scenario evidences a buffer over the carrying amount of 129% in the case of Amey, 33% in the case of Ferrovial Services Spain, and no buffer in the case of Steel.
On this basis, the valuation disclosed would equal the carrying amount if the reduction in the margin with respect to the base case was of 357 basis points for Amey and 316 basis points for Ferrovial Services Spain, thereby leaving the assumption of perpetuity growth (“g”) at 1%.
Lastly, it should be stated that in the case of both Amey and Ferrovial Servicios España in a scenario maintaining the margins but assuming a zero perpetuity growth rate (as compared with 2% in the base case), there would be no impairment.
B. Construction Division goodwill (Webber and Budimex):
Methodology and discount rate
The goodwill of Webber and Budimex amounted to EUR 128 million and EUR 69 million, respectively, at 31 December 2015 (31 December 2014: EUR 115 million and EUR 69 million, respectively).
The impairment test methodology used for Webber was similar to that described above for the Services companies and included a discount rate (WACC) of 8.2% (same rate in 2014) and a perpetuity growth rate of 2% (same rate in 2014). The risk-free interest rate used to calculate the foregoing WACC is 2.27%, in line with the rate of the ten-year US bond at 31 December 2015.
In the case of Budimex, since it is listed on the Warsaw Stock Exchange, the goodwill was tested for impairment by ascertaining whether the closing market price of the Budimex share was higher than its carrying

2015 Consolidated Financial Statements. Ferrovial, S.A. and Subsidiaries
116
amount plus the allocated goodwill. The test did not evidence the existence of any impairment.
Main factors that affect the valuation and performance compared with 2014 and budget
The projected flows are based on the latest estimates approved by the company, which take into account recent historical data. The main factors that affect the cash flow projections of Webber are revenue forecasts and the projected operating margins. These projections are based on four basic components, similar to those described in the preceding section on Services (the existing backlog, the obtainment of new contracts, the estimate of future margins and the perpetuity growth rate). It should be noted that the projected operating margins are lower than the historical margins of recent years, in line with average margins in the industry. The perpetuity growth rate used was 2%, which is similar to long-term inflation forecasts for the US without considering actual economic growth.
As regards the achievement of the business plan projections, it should be mentioned that in 2015 Webber surpassed the operating profit in the budget that served as the starting point for the impairment test of 2014. The EBITDA margin improved from 8.7% in 2014 to 13.8% in 2015.
Impairment test results
The value of Webber resulting from application of this impairment test model is 26% higher than its carrying amount.
The quoted market price of the Budimex share at 31 December 2015 was 393% higher than its carrying amount.
Sensitivity analysis
A sensitivity analysis was performed on Webber’s goodwill, particularly in relation to the profit from operations, the discount rate and the perpetuity growth rate, so as to ensure that possible changes in the estimate do not have an impact on the possible recovery of the goodwill recognised.
Specifically, a pessimistic scenario was taken into consideration with a perpetuity growth rate of 1% and a reduction in the profit from operations of 50 basis points. The value disclosed in this scenario evidences a buffer of 13% over the carrying amount.
On this basis, the valuation disclosed would equal the carrying amount if the reduction in the margin with respect to the base case was of 153 basis points, thereby leaving the assumption of perpetuity growth (“g”) at 1%.
Lastly, it should be stated that in a scenario maintaining the margins but assuming a zero perpetuity growth rate (compared to 2%), there would be no impairment.
In Budimex, due to the buffer of the quoted market price over the carrying amount, the company believes that there is no evidence of impairment.
C. Toll Road Division goodwill:
Methodology and discount rate
The goodwill of the Toll Road business at 31 December 2015 amounted to EUR 205 million (31 December 2014: EUR 369 million). This goodwill arose on the merger transaction performed in 2009 by Ferrovial, S.A. and Cintra, S.A., and corresponds to the acquisition of the percentage of ownership of the non-controlling shareholders of Cintra. The goodwill arising on the difference between the acquisition price of the aforementioned ownership interest and the carrying amount thereof was allocated by calculating the difference between the fair value of the main shareholdings in concession operators held by Cintra, S.A. at that time and the carrying amount thereof, adjusted by the percentage acquired.
The recoverable amount of the toll roads was calculated as the higher of fair value less estimated costs to sell and value in use. The recoverable amount of concession operators with an independent financial structure and limited duration was calculated by discounting the cash flows expected to be received by shareholders until the end of the concession term. The Group considers that value in use must be obtained using models that cover the entire concession term, as the assets are in different phases of investment and growth and there is sufficient visibility to use a specific economic and financial plan for each phase during the concession term. Therefore, no residual value is considered to exist in these valuations. The projections were updated based on the historical evolution and specific features of each asset, using long-term modelling tools to estimate traffic, extraordinary maintenance, etc.
To calculate the discount rates, shown in the table below, a normalised risk-free rate usually referenced to a 30-year bond, taking into account the location of each concession operator, a beta coefficient reflecting the company's leverage and risk, and a market premium of 5.5%, is used. The table below shows the discount rate used for each asset in 2015 and 2014.
Discount rate (cost of equity or Ke) 2015 2014
Autema 7.9% 7.2%
Algarve 7.6% 9.3%
Ausol 8.1% 8.5%
Main factors that affect the valuation and performance compared with 2014 and budget
The main factor that affects the cash flow projections of the toll roads are revenue forecasts. These projections differ depending on whether the operator bears the demand risk (in which case the intangible asset model is used) or whether the grantor bears the demand risk and makes payments for capacity availability (in which case the financial asset model is used). If the operator bears the demand risk, its revenue depends on traffic volumes and toll prices. In turn, the tolls depend on inflation or any other index established under the concession arrangement with regard to toll updates. Among the toll roads with goodwill, Ausol is the only one to which the intangible asset model is applied. Algarve and Autema are governed by concession arrangements in which the demand risk is assumed in full by the grantor and, therefore, the financial asset model is applied.
Traffic projections are prepared using long-term modelling tools that take into account data from public (or external) sources and the expected performance of the asset based on the historical evolution of traffic. Firstly, the expected growth of vehicles in the corridor is

2015 Consolidated Financial Statements. Ferrovial, S.A. and Subsidiaries
117
estimated, which depends on the growth in the population and car ownership (it should be noted that the growth of heavy vehicles usually evolves in line with that of national GDP). Once the traffic in the corridor has been estimated, the level of toll road capture is calculated.
Valuation projections and models begin with the budget for the following year approved by management. Any variances in traffic volumes in the year under way are taken into consideration when the initial budget and the long-term projections are reviewed. By way of illustration, it should be noted that actual revenue of toll roads to which goodwill was allocated in 2015 outperformed the budget in all cases.
In 2015 Ausol's revenue grew by 11.4% compared with 2014 and 10.9% compared with the budget.
In the case of Algarve and Autema, projects classified as financial assets, since payments predetermined by the grantor are involved, the only uncertainties relate to counterparty credit risk and possible penalties arising from the service.
Impairment test results
In the case of Ausol and Algarve, the measurements evidence that their fair value is 254% and 81%, respectively, above their carrying amount (compared with 126% and 73%, respectively, in 2014).
In 2015 Autema recognised impairment of goodwill amounting to EUR 55 million. The impairment loss was recognised as a result of the possible impact of the change of concession arrangement for the toll road approved by the Catalonia Autonomous Community Government through Decree 161/2015, which was appealed by the company as it considered that there are no legal grounds for this decision, as described in Note 6.5.1., Contingent liabilities and litigation. On the basis of the Company's legal position, the scenario assumed for the calculation of impairment takes into consideration that after winning litigation the amounts collectible will be received progressively over the coming years based on the previous concession arrangement. After recognising this impairment loss, the net value of the assets and liabilities relating to this investment is close to zero.
Sensitivity analysis
In the case of Ausol, a pessimistic scenario was built taken into consideration around 10-15% revenues reduction. The value disclosed in this scenario evidence a buffer of 136% over the carrying amount.
Since Algarve is a toll road where payments are made for availability, discount rate sensitivity analyses were conducted. If the 2014 rate (9.3%) is considered, 170 basis points above the 2015 rate, the buffer with respect to the carrying amount would be almost 60%.
3.2. INTANGIBLE ASSETS
At 2015 year-end, the balance of intangible assets other than infrastructure projects amounted to EUR 234 million (2014 year-end: EUR 223 million) and, therefore, there were no significant variations.
“Intangible Assets” includes basically contractual rights that arose from the acquisition of certain companies in the Services segment; specifically:
� Valuation of the backlog and customer relationships of Enterprise (UK) for EUR 101 million (31 December 2014: EUR 104 million).
� Rights relating to arrangements other than those falling within the scope of IFRIC 12 amounting to EUR 100 million at 31 December 2014 (31 December 2014: EUR 87 million), the most significant of which being those arising in 2005 as a result of the management and technical assistance agreement with the London Underground, and the right arising in 2010 to operate a waste treatment plant in the UK as a consequence of acquiring Donarbon.
The Group also recognised computer software under this heading amounting to EUR 25 million (31 December 2014: EUR 21 million).
No impairment losses were recognised or reversed in relation to these assets in 2015.

2015 Consolidated Financial Statements. Ferrovial, S.A. and Subsidiaries
118
3.3. INVESTMENTS IN INFRASTRUCTURE PROJECTS
3.3.1. Intangible asset model
(Millions of euros) Balance at
01/01/15
Total
addition
s
Total
dispos
als
Changes in
the scope of
consolidation
and transfers
Exchange
rate
effect
Balances
at
31/12/15
Spanish toll roads 2,615 4 -13 -1,813 0 793
US toll roads 6,098 725 0 -1,763 704 5,764
Other toll roads 982 0 -3 -595 0 384
Investment in toll roads 9,695 729 -16 -4,171 704 6,941
Accumulated amortisation -575 -60 3 384 -14 -261
Impairment losses -144 0 0 116 0 -28
Net investment in toll roads 8,976 631 -13 -3,671 728 6,651
Investment in other infrast.projects
453 16 0 16 0 485
Amortisation - Other infrast.projects
-139 -26 0 -14 0 -179
Total net investment - Other infrast.projects
314 -10 0 2 0 306
TOTAL INVESTMENT 10,147 745 -16 -4,154 704 7,426
Total amortisation and impairment losses
-858 -86 3 485 -14 -469
Total net investment 9,290 660 -13 -3,669 690 6,957
The most significant changes in 2015 were as follows:
Exchange rate fluctuations resulted in an increase of EUR 690 million (2014: decrease of EUR 748 million) in the balance of these assets, the full amount of which was attributable to the change in the euro/US dollar exchange rate at the US toll roads.
As regards the investments in Spanish toll roads excluding the exchange rate effect, the most significant impact related to the changes in the scope of consolidation in relation, on the one hand, to the exclusion from consolidation of the AP36 Ocaña La Roda and R4 Madrid Ocaña toll roads, whose concession assets amount to EUR 535 million and EUR 1,334 million, respectively (EUR 479 million and EUR 1,282 million, respectively, net of amortisation) (see Note 1.1.3, Changes in the scope of consolidation). This led to the elimination of the impairment losses associated with these toll roads amounting to EUR 118 million.
The most significant impact in relation to the US toll roads arose from the transfer of the concession assets of the Skyway Concession Company LLC toll road to "Assets Classified as Held for Sale" (see Note 1.1) for EUR 1,763 million (EUR 1,647 million net of amortisation). Also, there were significant increases in the assets of the following toll roads: North Tarrant Express (EUR 72 million -2014: EUR 379 million-), North Tarrant Express Extension (EUR 256 million -2014: EUR 69 million-) and LBJ (EUR 362 million -2014: EUR 455 million-). The total investment in these toll roads includes a balance at 31 December 2015 of EUR 575 million (2014: EUR 1,236 million) relating to property, plant and equipment in the course of construction.
As regards the other toll roads, the concession assets of the Irish toll road Eurolink Motorway Operation (M4-M6), Ltd. was transferred for a total of EUR 332 million (EUR 260 million net of amortisation). Also, in October 2015 the renegotiation of the Autoestrada do Algarve toll road contract with the Portuguese Government was completed. Under the new agreement, the concession will be governed by an availability payment arrangement and, therefore, the demand risk is eliminated and the accounting treatment changes to that of the financial asset model (see Note 2.5.3). This gave rise to a transfer of EUR 263 million (EUR 175 million net of amortisation) to the concessions accounted for using the financial asset model (see Note 3.3.2).
“Investment in Other Infrastructure Projects” includes concession arrangements awarded to the Services Division that are classified as intangible assets under IFRIC 12, basically those relating to Autovía de Aragón Sociedad Concesionaria, S.A., with a net investment of EUR 138 million (2014: EUR 148 million) and various integral waste treatment plants located in Spain, mainly in Barcelona, Toledo and Murcia (Ecoparc de Can Mata, S.L.U. , Gestión Medioambiental de Toledo, S.A. and Servicios Urbanos de Murcia, S.A.) among others, amounting to EUR 101 million (2014: EUR 162 million).
“Impairment Losses” includes the estimated impairment losses on arrangements to which no goodwill has been allocated. These possible impairment losses were calculated using the method indicated in Section 3.1.
In the case of the infrastructure project companies, all their concession assets have been pledged as security for the existing borrowings (see Note 5.2). The borrowing costs capitalised in this connection in 2015 are detailed in Note 2.6.
The changes in these assets in 2014 were as follows:
(Millions of euros) Balance at
01/01/14
Total
additions
Total
disposals
Changes in
the scope of
consolidation
and transfers
Exchange
rate effect
Balances
at
31/12/14
Spanish toll roads 2,608 11 -5 0 0 2,615
US toll roads 4,439 902 -1 0 758 6,098
Other toll roads 980 2 0 0 0 982
Investment in toll roads 8,027 915 -6 0 758 9,695
Accumulated amortisation -504 -57 0 0 -14 -575
Impairment losses -162 0 7 11 0 -144
Net investment in toll roads
7,362 858 1 11 744 8,976
Investment in other infrast.projects
390 43 -1 21 0 453
Amortisation - Other infrast.projects
-114 -23 1 -4 0 -139
Total net investment - Other infrastructure projects
277 20 0 17 0 314
TOTAL INVESTMENT 8,418 958 -7 21 758 10,147
Total amortisation and impairment losses
-779 -80 8 7 -14 -858
Total net investment 7,639 878 1 28 744 9,290

2015 Consolidated Financial Statements. Ferrovial, S.A. and Subsidiaries
119
3.3.2. Financial asset model
The changes in the years ended 31 December 2015 and 2014 were as follows:
Changes (Millions of euros)
2015 infrastructure project
receivables
2014 infrastructure
project receivables
Beginning balance 1,467 1,341
Additions 386 229 Disposals -286 -83 Transfers and other 12 -27 Changes in the scope of consolidation 0 0
Exchange rate effect 7 8 Ending balance 1,586 1,467
Note: balances presented net of allowances.
In relation to transfers and other movements in 2015, on the one hand there was a decrease of EUR -182 million in relation to the assets classified as held for sale of the Eurolink Motorway Operation (M3), Ltd. toll road. (see Note1.1.), and on the other, the assets of the Autoestrada do Algarve, S.A. were transferred to this heading for a total of EUR 175 million (see Note 3.3.1. above).
Also, the change in the Autema project's concession regime introduced by the Catalonia Autonomous Community Government should be noted in relation to this financial asset (see Note 6.5). As indicated in the aforementioned Note, the Company considers that this change infringed the rule of law and appealed against the Decree in which the change was approved. Since it is considered that there are very sound legal arguments to win the appeal, it was resolved to retain the project recognised as a financial asset. An impairment test was performed with respect to the goodwill that had been allocated to this project, and a loss of EUR 55 million was recognised (see Note 3.1.2). Based on the same assumptions as those used to calculate the impairment test on the goodwill, it was concluded that there was no impairment of the financial asset recognised at year-end.
Balances at 31/12/15 Balances at 31/12/14
Concession operator Country Concession
term (years)
First year of concession
Long-term account
receivable
Short-term account
receivable
Total 2015
Long-term account
receivable
Short-term account
receivable
Total 2014
(Note 4.2) (Note 4.2)
Autopista Terrasa Manresa, S.A. Spain 50 1986 552 39 591 544 38 582
Auto-Estradas Norte, S.A. Portugal 30 2001 291 48 339 279 52 331
Autoestrada do Algarve, S.A. Portugal 30 2001 155 40 194 0 0 0
Eurolink M3 Ireland 45 2007 0 0 0 206 31 237
Toll roads 998 126 1,124 1,029 120 1,149
Concesionaria de Prisiones Lledoners Spain 32 2008 70 1 71 72 1 73
Concesionaria de Prisiones Figueras Spain 32 2011 116 3 120 120 4 124
Depusa Aragón Spain 25 2015 (*) 3 0 3 0 0 0
Budimex Parking Wrocław Poland 30 2012 11 0 11 11 0 11
Construction 200 5 204 202 5 207
Hospital de Cantabria Spain 20 2006-2013 79 3 83 37 7 44
Waste treatment plants in Spain Spain 15-22 2010-2012 58 12 70 43 12 55
Waste treatment plants in the UK UK 18-28 2008-2013 252 0 252 156 0 156
Services 389 15 404 236 20 255
TOTAL GROUP 1,586 146 1,732 1,467 145 1,611
(*) Year in which concession was granted.

2015 Consolidated Financial Statements. Ferrovial, S.A. and Subsidiaries
120
3.4. PROPERTY, PLANT AND EQUIPMENT
The changes in “Property, Plant and Equipment” in the consolidated statement of financial position were as follows:
Changes in 2015 (Millions of euros)
Land and buildings
Plant and machinery
Other fixtures, tools and furniture
Total
Investment: Balance at 01/01/15 162 844 637 1,643
Additions 6 72 86 165 Disposals -5 -70 -40 -115 Changes in the scope of consolidation and transfers
4 -3 -10 -8
Exchange rate effect 6 15 2 23 Balances at 31/12/15 174 859 675 1,707
Accumulated depreciation and impairment losses at 01/01/15
-35 -672 -485 -1,192
Depreciation charge for the year -8 -63 -42 -113
Disposals 1 55 29 84 Changes in the scope of consolidation and transfers
-3 6 6 10
Exchange rate effect -1 -9 -2 -12 Impairment losses on property, plant and equipment
0 0 6 6
Balances at 31/12/15 -47 -682 -488 -1,217
Carrying amount at 31/12/15 127 176 187 490
The most significant changes in 2015 were as follows:
Additions:
Of the total additions, amounting to EUR 165 million, the most significant arose at the Services Division amounting to EUR 117 million in relation to the investments made in the expansion of the capacity of landfills, the installation of new waste transfer and treatment facilities and the renewal of cleaning, transport equipment and luminaires associated with contracts in force. Also, in the Construction Division, acquisitions totalling EUR 43 million were made in relation to specific construction machinery.
In addition, in 2015 the change in value of the euro against the US dollar and pound sterling increased the balance of property, plant and equipment by EUR 23 million.
Disposals or reductions:
The property, plant and equipment disposals and reductions amounted to EUR 115 million, due largely to the write-off of fully depreciated or obsolete items, which did not have a material effect on the consolidated statement of profit or loss. Specifically, EUR 30 million were derecognised at the Construction Division and EUR 83 at the Services Division.
Other disclosures relating to property, plant and equipment:
The property, plant and equipment not used in operations are not material with respect to the ending consolidated balances. Impairment losses on other items of property, plant and equipment total EUR 61 million (2014: EUR 67 million), associated mainly with the Services Division.
The Group has taken out insurance policies to cover the possible risks to which its property, plant and equipment are subject and the claims that might be filed against it for carrying on its business activities. These policies are considered to adequately cover the related risks.
The property, plant and equipment in the course of construction amounts to EUR 21 million (2014: EUR 12 million), corresponding in full to the Services Division.
The balance of “Property, Plant and Equipment” at 31 December 2015 includes EUR 126 million (2014: EUR 110 million) relating to the carrying amount of Services Division assets (associated with a landfill in the UK amounting to EUR 101 million and Cespa, S.A. amounting to EUR 14 million) that have been pledged as security for bank borrowings.
The detail, by business segment, of the additions to property, plant and equipment is as follows:
(Millions of euros) 2015 2014
Construction 43 28 Toll Roads 5 3 Services 117 75 TOTAL 165 106
Changes in 2014 (Millions of euros)
Land and buildings
Plant and machinery
Other fixtures, tools and furniture
Total
Investment: Balance at 01/01/14
151 816 626 1,593
Additions 10 48 48 106
Disposals -2 -31 -37 -69
Changes in the scope of consolidation and transfers
-3 -7 -3 -13
Exchange rate effect 6 18 3 27
Balances at 31/12/14 162 844 637 1,643
Accumulated depreciation and impairment losses at 01/01/14
-30 -623 -457 -1,110
Depreciation charge for the year -5 -61 -46 -113
Disposals 1 24 24 49
Changes in the scope of consolidation and transfers
1 -1 0 -1
Exchange rate effect -1 -11 -2 -14
Impairment losses on property, plant and equipment
0 0 -3 -3
Balances at 31/12/14 -35 -672 -485 -1,192
Carrying amount at 31/12/14
127 172 152 451

2015 Consolidated Financial Statements. Ferrovial, S.A. and Subsidiaries
121
3.5. INVESTMENTS IN ASSOCIATES
The detail of the investments in companies accounted for using the equity method at 2015 year-end and of the changes therein in 2015 is shown in the table below. Due to their significance, the investments in 407 ETR (43.23%) and Heathrow Airport Holdings (HAH) (25%) are presented separately.
2015 (Millions of euros) HAH
(25%) 407 ETR (43.23%)
Other Total
Balance at 31/12/14 1,062 2,188 66 3,317
Share of profit 186 82 44 312
Dividends received and equity reimbursed -90 -228 -19 -337
Exchange differences 41 -133 -2 -95
Other 14 0 26 40
Balance at 31/12/15 1,213 1,909 116 3,237
The changes in "Investments in Associates" were due mainly to the distribution of dividends, partially offset by the share of the profit for the year (EUR 312 million), and the depreciation in value of the euro against the pound sterling and its appreciation with respect to the Canadian dollar, which had a net negative effect of EUR 95 million.
In view of the importance of the investments in HAH and 407 ETR, set forth below is a detail of the balance sheets and income statements of these two companies, adjusted to bring them into line with Ferrovial's accounting policies, together with comments on the changes therein in 2015.
Also, since both ownership interest were remeasured when control was lost, pursuant to IAS 28.40 and subsequent paragraphs, the possible existence of indications of impairment is assessed on an annual basis.
3.5.1. Information relating to HAH
a. Impairment test
It is important to note in relation to the measurement of this asset that the various transactions involving shares of this company carried out in recent years are an indication that the asset has not become impaired. Specifically, in the most recent sale transaction of 8.65% of HAH, carried out by Ferrovial in 2013, the sale price was 27% higher than the current consolidated carrying amount, and 8% higher if the effect of the sale of Glasgow, Southampton and Aberdeen Airports is adjusted.
The trend was also positive in 2015, highlights being the fact that traffic and gross profit from operations were 1.5% and 18.7%, respectively, higher than the 2015 budget used as the first year of the impairment test in 2014 and that the RAB grew by 0.4% in the year to stand at GBP 14,921 million. Also, traffic and gross profit from operations stood at 2.2% and 19.7%, respectively, above the figures obtained in 2014.
Despite this, and because the gain recognised when control was lost was allocated mainly to goodwill, the investment was tested for impairment.
The main assumptions used to measure this asset for impairment testing purposes were as follows:
� The most recent business plan approved by the company was considered. This plan is based on the 5.35% return on assets established by the regulator for the current five-year period, (Q6: 2014-2018) representing an annual price reduction of -1.5% (“x” factor) + inflation (RPI) until December 2018.
� In compliance with IAS 36.44, possible plans to increase the capacity of Heathrow airport (third runway project) were not taken into account. However, it should be noted that the Commission designated by the British government to analyse to options to increase capacity (the Davies Commission) issued its report on 1 July 2015, in which it recommended the construction of a third runway at Heathrow as the best option to increase airport capacity in the UK. This report is not binding and the British government has not yet taken a decision in this regard.
� The value of the investment was calculated by discounting the future cash flows per the business plan, using the adjusted present value (APV) method until 2048 and exit multiple for that year. The unlevered discount rate (Ku) is approximately 7% (similar to that in 2014) and the tax shield generated by the debt is discounted at the cost of the debt.
The result of the valuation is higher than the carrying amount. Also, sensitivity tests were performed on the main variables (discount rate, long-term inflation and exit multiple) and in all cases the amount of the valuation exceeds the carrying amount.
Also, it should be noted that the average valuation of this made by the stock market analysts that follow Ferrovial (more than 20 analysts) is 35% more than its carrying amount.
Based on the internal valuations performed and those of the analysts, on the positive evolution of the asset in the year and on the references of the most recent transactions performed by third parties, it was concluded that there were no indications of impairment in the year.
b. Changes in the balance sheet and statement of profit or loss 2015-2014
In view of the importance of this investment, following is a detail of the balance sheet and statement of profit or loss for this group of companies, adjusted to bring them into line with Ferrovial's accounting policies, together with comments on the changes therein in 2015.
The balance sheet figures shown relate to the full balances of HAH and are presented in pounds sterling. The exchange rates used in 2015 are EUR 1=GBP 0.73749 (2014: GBP 0.7766) for the balance sheet figures and EUR 1=GBP 0.72374 (2014: GBP 0.8023) for the statement of profit or loss.

2015 Consolidated Financial Statements. Ferrovial, S.A. and Subsidiaries
122
Balance sheet
HAH (100%) GBP Million 2015 2014 Change 15/14
Non-current assets 16,431 16,433 -2
Goodwill 2,753 2,753 0
Investments in infrastructure projects
13,347 13,460 -112
Non-current financial assets 31 26 5
Pension plan surplus 104 0 104
Deferred tax assets 0 0 0
Financial derivatives 173 172 2
Other non-current assets 23 23 -1
Current assets 996 774 222
Trade and other receivables 775 426 349
Financial derivatives 0 2 -2
Cash and cash equivalents 210 336 -126
Other current assets 11 10 1
TOTAL ASSETS 17,428 17,207 220
Equity 1,255 978 277
Non-current liabilities 14,729 14,860 -131
Provisions for pensions 28 228 -200
Borrowings 12,661 12,385 276
Deferred tax liabilities 922 896 26
Financial derivatives 1,103 1,334 -231
Other non-current liabilities 15 17 -2
Current liabilities 1,444 1,369 75
Borrowings 986 929 57
Trade and other payables 358 412 -54
Financial derivatives 90 1 89
Other current liabilities 10 26 -16
TOTAL LIABILITIES 17,428 17,207 220
� Equity
At 31 December 2015, equity amounted to GBP 1,255 million, up GBP 277 million from the year ended 31 December 2014. In addition to the profit for the period of GBP 538 million, the main noteworthy changes are the positive impact of GBP 36 million recognised in reserves relating to effective derivatives and to pension plans, and the dividends paid to shareholders amounting to GBP -300 million.
25% of the equity of the investee does not correspond to the carrying amount of the investment, since the carrying amount also includes the amount of the gain arising from the remeasurement at fair value of the investment retained following the sale of a 5.88% ownership interest in HAH in October 2011. The gain was recognised as an addition to goodwill. Therefore, in order to obtain the carrying amount at Ferrovial, it would be necessary to increase the 25% of the shareholders’ equity presented above (GBP 314 million) by the amount of the aforementioned gain (GBP 581 million), giving a total of GBP 895 million which, translated at the year-end exchange rate (EUR 1 = GBP 0.73749), gives the investment of EUR 1,213 million.
� Borrowings
The borrowings of HAH (current and non-current) amounted to GBP 13,647 million at 31 December 2015, an increase of GBP 333 million with respect to 31 December 2014 (31 December 2014: GBP 13,314 million). This increase was due mainly to the effect of:
- A bond issue of GBP 1,021 million, private placements of GBP 150 million and drawdown of GBP 125 million against the Heathrow Finance term facility.
- Redemption of bonds amounting to GBP -660 million, repayment of GBP -78 million of the Heathrow Finance Facility loan and repayment of GBP -39 million of the EIB loan.
- Decrease of GBP -187 million as a result of the fair value adjustments and the exchange rate effect.
� Derivative financial instruments at fair value
The notional principal amount of HAH's derivatives portfolio at 31 December 2015 totalled GBP 12,743 million, including interest rate derivatives (IRSs) with a notional amount of GBP 2,963 million, cross currency swaps (GBP 4,364 million) and index-linked securities (ILSs) (GBP 5,416 million).
The change in the net value (asset/liability position) of these financial instruments gave rise to a GBP 142 million decrease in liabilities in the year. The main impacts relate to:
- Cash settlements (net payments) of GBP 179 million
- Accrual of borrowing costs (result on financing) of GBP -53 million
- Fair value adjustments to these instruments (fair value-related result) of GBP -53 million, due mainly to the index linked swaps, interest rate swaps and cross currency swaps (although the latter are partially offset by the fair value adjustments of the cross currency swaps associated with these financial instruments)
- Effect on reserves of GBP 70 million in relation to effective hedges
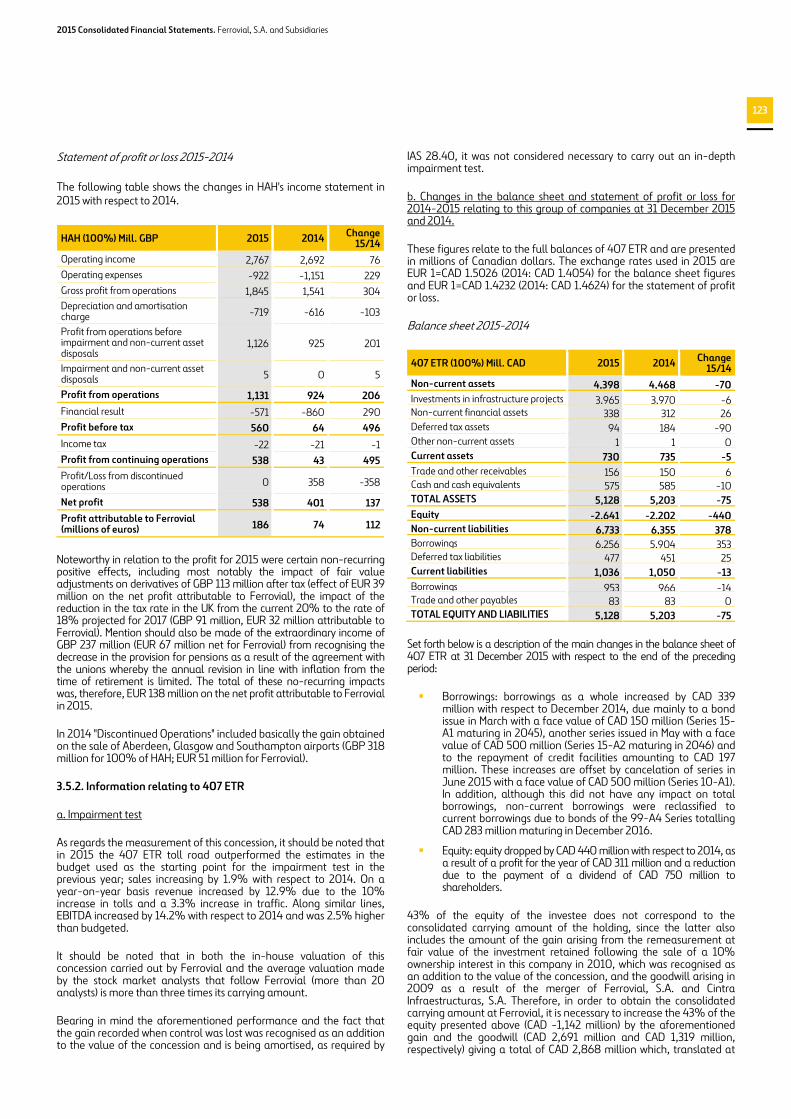
2015 Consolidated Financial Statements. Ferrovial, S.A. and Subsidiaries
123
Statement of profit or loss 2015-2014
The following table shows the changes in HAH's income statement in 2015 with respect to 2014.
HAH (100%) Mill. GBP 2015 2014 Change 15/14
Operating income 2,767 2,692 76 Operating expenses -922 -1,151 229 Gross profit from operations 1,845 1,541 304 Depreciation and amortisation charge -719 -616 -103
Profit from operations before impairment and non-current asset disposals
1,126 925 201
Impairment and non-current asset disposals 5 0 5
Profit from operations 1,131 924 206
Financial result -571 -860 290 Profit before tax 560 64 496
Income tax -22 -21 -1 Profit from continuing operations 538 43 495
Profit/Loss from discontinued operations 0 358 -358
Net profit 538 401 137
Profit attributable to Ferrovial (millions of euros) 186 74 112
Noteworthy in relation to the profit for 2015 were certain non-recurring positive effects, including most notably the impact of fair value adjustments on derivatives of GBP 113 million after tax (effect of EUR 39 million on the net profit attributable to Ferrovial), the impact of the reduction in the tax rate in the UK from the current 20% to the rate of 18% projected for 2017 (GBP 91 million, EUR 32 million attributable to Ferrovial). Mention should also be made of the extraordinary income of GBP 237 million (EUR 67 million net for Ferrovial) from recognising the decrease in the provision for pensions as a result of the agreement with the unions whereby the annual revision in line with inflation from the time of retirement is limited. The total of these no-recurring impacts was, therefore, EUR 138 million on the net profit attributable to Ferrovial in 2015.
In 2014 "Discontinued Operations" included basically the gain obtained on the sale of Aberdeen, Glasgow and Southampton airports (GBP 318 million for 100% of HAH; EUR 51 million for Ferrovial).
3.5.2. Information relating to 407 ETR
a. Impairment test
As regards the measurement of this concession, it should be noted that in 2015 the 407 ETR toll road outperformed the estimates in the budget used as the starting point for the impairment test in the previous year; sales increasing by 1.9% with respect to 2014. On a year-on-year basis revenue increased by 12.9% due to the 10% increase in tolls and a 3.3% increase in traffic. Along similar lines, EBITDA increased by 14.2% with respect to 2014 and was 2.5% higher than budgeted.
It should be noted that in both the in-house valuation of this concession carried out by Ferrovial and the average valuation made by the stock market analysts that follow Ferrovial (more than 20 analysts) is more than three times its carrying amount.
Bearing in mind the aforementioned performance and the fact that the gain recorded when control was lost was recognised as an addition to the value of the concession and is being amortised, as required by
IAS 28.40, it was not considered necessary to carry out an in-depth impairment test.
b. Changes in the balance sheet and statement of profit or loss for 2014-2015 relating to this group of companies at 31 December 2015 and 2014.
These figures relate to the full balances of 407 ETR and are presented in millions of Canadian dollars. The exchange rates used in 2015 are EUR 1=CAD 1.5026 (2014: CAD 1.4054) for the balance sheet figures and EUR 1=CAD 1.4232 (2014: CAD 1.4624) for the statement of profit or loss.
Balance sheet 2015-2014
407 ETR (100%) Mill. CAD 2015 2014 Change 15/14
Non-current assets 4,398 4,468 -70
Investments in infrastructure projects 3,965 3,970 -6 Non-current financial assets 338 312 26 Deferred tax assets 94 184 -90 Other non-current assets 1 1 0 Current assets 730 735 -5
Trade and other receivables 156 150 6 Cash and cash equivalents 575 585 -10 TOTAL ASSETS 5,128 5,203 -75
Equity -2,641 -2,202 -440
Non-current liabilities 6,733 6,355 378
Borrowings 6,256 5,904 353 Deferred tax liabilities 477 451 25 Current liabilities 1,036 1,050 -13
Borrowings 953 966 -14 Trade and other payables 83 83 0 TOTAL EQUITY AND LIABILITIES 5,128 5,203 -75
Set forth below is a description of the main changes in the balance sheet of 407 ETR at 31 December 2015 with respect to the end of the preceding period:
� Borrowings: borrowings as a whole increased by CAD 339 million with respect to December 2014, due mainly to a bond issue in March with a face value of CAD 150 million (Series 15-A1 maturing in 2045), another series issued in May with a face value of CAD 500 million (Series 15-A2 maturing in 2046) and to the repayment of credit facilities amounting to CAD 197 million. These increases are offset by cancelation of series in June 2015 with a face value of CAD 500 million (Series 10-A1). In addition, although this did not have any impact on total borrowings, non-current borrowings were reclassified to current borrowings due to bonds of the 99-A4 Series totalling CAD 283 million maturing in December 2016.
� Equity: equity dropped by CAD 440 million with respect to 2014, as a result of a profit for the year of CAD 311 million and a reduction due to the payment of a dividend of CAD 750 million to shareholders.
43% of the equity of the investee does not correspond to the consolidated carrying amount of the holding, since the latter also includes the amount of the gain arising from the remeasurement at fair value of the investment retained following the sale of a 10% ownership interest in this company in 2010, which was recognised as an addition to the value of the concession, and the goodwill arising in 2009 as a result of the merger of Ferrovial, S.A. and Cintra Infraestructuras, S.A. Therefore, in order to obtain the consolidated carrying amount at Ferrovial, it is necessary to increase the 43% of the equity presented above (CAD -1,142 million) by the aforementioned gain and the goodwill (CAD 2,691 million and CAD 1,319 million, respectively) giving a total of CAD 2,868 million which, translated at

2015 Consolidated Financial Statements. Ferrovial, S.A. and Subsidiaries
124
the year-end exchange rate (EUR 1 = CAD 1.5026), gives the investment of EUR 1,909 million.
Statement of profit or loss 2015-2014
The following table shows the changes in the income statement of 407 ETR in the year ended 31 December 2015 with respect to 2014:
407 ETR (100%) Mill. CAD 2015 2014 Change 15/14
Operating income 1,002 888 115 Operating expenses -162 -152 -10 Gross profit from operations 840 736 104 Depreciation and amortisation charge -86 -78 -8 Profit from operations 754 657 97 Financial result -327 -355 28 Profit before tax 427 303 124 Income tax -116 -80 -36 Net profit 311 223 88
The main change in the statement of profit or loss relates to "Profit from Operations" (USD +115 million) as a result of the increase in toll rates.
3.5.3. Other associates
The detail of the other associates showing their consolidated carrying amount and main data required by IFRIC12, is shown in Appendix II.
The changes in 2015 in the investments in these companies were as follows:
2015 (Millions of euros) Other
Balance at 31/12/14 66
Share of profits 44
Dividends received and equity reimbursed -19
Exchange differences -2
Other 26
Balance at 31/12/15 116
The main company included in this balance is AGS Airports, which owns Aberdeen, Glasgow and Southampton airports. The carrying amount of AGS is EUR 323 million, the aggregate of the investment of EUR 9 million and the value of the participating loan recognised at EUR 314 million (see Note 3.6, Non-current financial assets).
The share of the profits includes most notably the contribution of the joint ventures of Amey (EUR 15 million), the parent company of Aberdeen, Glasgow and Southampton airports (AGS) (EUR 14 million), 407 East Development (EUR 7 million), FMM Company (EUR 7 million) and other associates (EUR 1 million).
Also, the dividends received relate to the Services Division, arising mainly from the joint ventures of Amey, from FMM Company and from Calle 30. The other impacts relate principally to investments in new projects of the Toll Roads Division (Towoomba Toll Road in Australia amounting to EUR 11 million, Ruta del Cacao in Colombia amounting to EUR 3 million and others amounting to EUR 3 million) and the Construction Division (EUR 2 million).
In addition to the companies mentioned above, there are other associates with a carrying amount of zero. Regarding this obligations and under IAS 28, the Group has a provision registered in Long term Provisions chapter, amounting EUR 9 million EUR (see Note 6.3).
3.5.4. Other disclosures relating to companies accounted for using the equity method
There are no significant restrictions on the capacity of associates to transfer funds to the Parent in the form of dividends, debt repayments or advances other than such restrictions as might arise from the financing agreements of those associates or from their own financial situation, and there are no contingent liabilities relating to associates that might ultimately be assumed by the Group.
The most significant companies accounted for using the equity method in which the ownership interest is below 20% are Madrid Calle 30 and Amey Ventures Investment Limited (AVIL). The equity method is used because, although Ferrovial only has an indirect ownership interest of 10%, it has the power to appoint one member of the Board of Directors in the two cases and retains the capacity to block important decisions in matters that are not of a protective nature.
There are no significant companies in which the ownership interest exceeds 20% that are not accounted for using the equity method.
The guarantees granted by Group companies to companies accounted for using the equity method are detailed in Note 6.5.
The changes in this heading in the consolidated statement of financial position in 2014 were as follows:
2014 (Millions of euros) HAH
(25%) 407 ETR (43.23%)
Other Total
Balance at 31/12/13 1,261 2,260 41 3,562
Changes in ownership interest 0 0 0 0
Share of profit 74 54 10 138
Dividends received and equity reimbursed -341 -216 -9 -566
Exchange differences 81 90 2 173
Elimination of profits or losses with associates 51 -51 0
Other -63 0 74 10
Balance at 31/12/14 1,062 2,188 66 3,317

2015 Consolidated Financial Statements. Ferrovial, S.A. and Subsidiaries
125
3.6. NON-CURRENT FINANCIAL ASSETS
The changes in “Non-Current Financial Assets” in the year ended 31 December 2015 were as follows:
Changes in 2015 (Millions of euros)
Long term loans to associates
Restricted cash relating to
infrastructure projects and
other financial assets
Other long-term accounts receivable
Total
Balance at 01/01/15
375 405 76 856
Additions 24 114 51 189 Disposals 0 -126 -9 -135 Transfers and other -4 -162 -18 -184 Exchange rate effect 16 31 -17 30 Balance at 31/12/15
411 261 83 755
Note: balances presented net of allowances.
� “Long term loans to Associates” includes mainly the loan granted to AGS amounting to EUR 314 million; participating loans to associates amounting to EUR 38 million (2014: EUR 38 million) and other ordinary loans to associates totalling EUR 58 million (2014: EUR 21 million).
� “Restricted Cash Relating to Infrastructure Projects and Other Financial Assets” relates primarily to deposits made at toll road concession operators, the use of which is limited to certain purposes established in the concession arrangement, such as payment of future investments or operating expenses and debt servicing. The Note on Net cash position provides details of the main balances and changes recognised in relation to this heading.
� Lastly, “Other Receivables” includes:
- Trade accounts receivable from public-sector customers, which had been renegotiated at long term, amounting to approximately EUR 75 million (2014: EUR 62 million), associated mainly with the Services Division.
- Long-term deposits and guarantees amounting to EUR 8 million (December 2014: EUR 7 million).
The changes in these items in 2014, for information purposes, were as follows:
Changes in 2014 (Millions of euros)
Long term loans to associates
Restricted cash relating to
infrastructure projects and
other financial assets
Other long-term accounts
receivable Total
Balance at 01/01/14
71 377 91 539
Additions 1 67 21 89
Disposals -5 -71 -40 -116
Transfers -8 0 5 -3
Changes in the scope of consolidation
310 0 -5 305
Exchange rate effect 6 32 5 43
Balance at 31/12/14
375 405 76 856

2015 Consolidated Financial Statements. Ferrovial, S.A. and Subsidiaries
126
SECTION 4: WORKING CAPITAL
This section contains the Notes on current trade and other receivables (see Note 4.2), current trade and other payables (see Note 4.3) and inventories (see Note 4.1).
The net balance of these items (assets – liabilities) is a liability balance of EUR 639 million. Excluding the exchange rate effect and the changes in the scope of consolidation, the liability balance is reduced by EUR 155 million, due largely to the changes in the balance of “Current Trade and Other Payables” (EUR 157 million), which include most notably the decrease in the balance of “Amounts Billed in Advance for Construction Work” due to the construction work completed in the year, which is partially offset by the increase in the balance of “Customer Advances”.
Dec. 2014
Exchange rate effect
Changes in the scope of
consolidation Other
Dec. 2015
Inventories 357 8 0 22 387 Current trade and other receivables 2,170 51 123 -24 2,320
Current trade and other payables -3,437 -84 18 157 -3,346
TOTAL -909 -25 141 155 -639
This section includes also (see Note 4.4) the disclosures relating to the contracts performed by the Construction and Services Divisions which are measured by reference to the stage of completion (see Note 1.3.3.4). It is important to analyse the disclosures relating to contracts of this nature, particularly in relation to the differences between the billings made and the revenue recognised in the year.
(Millions of euros) Dec. 14 Exchange rate effect
Other Dec. 15
Amounts to be billed for work performed (Note 4.2-a) 751 27 -4 775
Amounts billed in advance for construction work -774 -31 256 -549
Contracts accounted for by reference to the stage of completion, net
-23 -4 252 226
Retentions (Note 4.2-a) 59 1 15 75
Advances -178 0 -62 -240 Amount net of advances and retentions
-119 1 -47 -165
The changes in the year related to the aforementioned decrease in amounts billed in advance for construction work and increase in customer advances.
4.1. INVENTORIES
The detail of inventories at 31 December 2015 and 2014 is as follows:
Balance at
31/12/15
Balance at
31/12/14
Change
15/14
Commercial inventories 246 203 43 Raw materials and other supplies 98 104 -6
Precontract expenses and general fixtures 43 50 -7
TOTAL 387 357 30
Of the commercial inventories recognised at 31 December 2015, EUR 215 million relate to the Real Estate business in Poland (2014: EUR 168 million) whose variation during the year (EUR 43 million) corresponds mainly to land purchase.
EUR 70 million of raw materials and other supplies relate to the Construction Division, mainly at its subsidiaries, in the US and Canada, amounting to EUR 46 million (2014: EUR 44 million), and Budimex, amounting to EUR 13 million (2014: EUR 15 million). In addition, at the end of 2015, EUR 27 million had been recognised in relation to the Services Division, mainly at its subsidiary Amey amounting to EUR 25 million (2014: EUR 27 million).
Lastly, as regards precontract expenses and general fixtures, at 31 December 2015 EUR 42 million had been recognised, mainly in respect of the Construction Division (2014: EUR 46 million).
4.2. CURRENT TRADE AND OTHER RECEIVABLES
The detail of "Current Trade and Other Receivables" at 31 December 2015 and 2014 is as follows:
(Millions of euros) Dec. 14
Exchange rate
effect
Changes in the scope of
consolidation Other Dec. 15
Trade receivables for sales and services
1,716 44 132 -71 1,821
Other receivables 454 8 -8 46 499
TOTAL RECEIVABLES
2,170 51 123 -24 2,320
a) Trade receivables for sales and services
The detail of “Trade Receivables for Sales and Services” at 31 December 2015 and 2014 is as follows:
(Millions of euros) Dec. 14 Exchange
rate effect
Changes in the scope of
consolidation Other Dec. 15
Trade receivables 1,212 16 132 -106 1,253
Amounts to be billed for work performed
751 27 0 -4 775
Retentions 59 1 0 15 75
Allowances -306 -1 0 24 -283 TRADE RECEIVABLES FOR SALES AND SERVICES
1,716 44 132 -71 1,821

2015 Consolidated Financial Statements. Ferrovial, S.A. and Subsidiaries
127
“Trade Receivables for Sales and Services” increased by EUR 105 million from EUR 1,716 million at 31 December 2014 to EUR 1,821 million at 31 December 2015. The impact of the changes in the scope of consolidation, EUR 132 million, relates to the account payable by the Construction Division to the concession operator R4 Madrid Ocaña, an item that until 2014 has been eliminated, since the counterparty was a Group company, and which is now included in the consolidated statement of financial position because the concession operator was excluded from consolidation (see Note 1.1.3). This amount is fully provisioned.
Excluding this impact and the exchange rate effect, “Trade Receivables for Sales and Services” fell by EUR 71 million, due largely to collections by the Construction Division.
It should be noted that at 31 December 2014 a total of EUR 118 million had been deducted from “Trade Receivables for Sales and Services” relating to assets derecognised as a result of factoring arrangements at the Construction Division, since it was considered that they met the conditions stipulated in IAS 39.20 regarding the derecognition of financial assets. At 31 December 2015, no amount had been deducted in this connection.
Following is a detail, by type of debtor, of the main trade receivables.
Construction Services Other and
adjustments Total
Public sector 321 49% 668 55% 13 n/a 1,003 55%
Private-sector customers 196 30% 484 40% 1 n/a 681 37%
Group companies and associates
144 22% 72 6% -78 n/a 138 8%
TOTAL 661 100% 1,224 100% -63 n/a 1,821 100%
This detail shows that 55% of the Group's customers are public authorities and the rest are private-sector customers.
In order to manage credit risk relating to private customers, the Group has implemented pre- and post-contracting measures. Pre-contracting measures include the consultation of debtor registers, ratings, solvency studies, etc., while post-contracting measures during the execution of construction work include the follow-up of contractual incidents and non-payment events, etc.
The changes in operating provisions and allowances were as follows:
Changes in provisions and allowances (millions of euros)
2015 2014
Beginning balance 306 317 Changes in the scope of consolidation 0 0 Amounts charged to profit or loss -9 -5 Charges for the year 22 20 Reversals -31 -26
Amounts used -15 -9 Exchange rate effect -1 -1 Transfers and other 0 -3 Ending balance 283 306
Group management considers that the carrying amount of trade receivables approximates their fair value.
b) Other receivables
The detail of “Other Receivables” at 31 December 2015 and 2014 is as follows:
(Millions of euros) Dec. 14
Exchange rate
effect
Changes in the scope of
consolidation Other Dec. 15
Advances to suppliers 105 4 0 25 134
Sundry accounts receivable
114 3 3 -7 113
Infrastructure project receivables
145 0 0 1 146
Receivable from public authorities
90 0 -11 27 107
OTHER RECEIVABLES
454 8 -8 46 499
“Sundry Accounts Receivable” includes mainly receivables not relating to normal business activities amounting to EUR 68 million (at December 2014: EUR 78 million). There are no items included in the change that are material taken individually.
Also, “Accounts Receivable Relating to Infrastructure Projects” includes current financial assets arising from the application of IFRIC 12 relating mainly to amounts receivable from public authorities in return for services rendered or investments made under a concession arrangement, as detailed in Note 3.3.2. The main changes in this line item were due to the inclusion of the balances of the current account receivable of Euroscut do Algarve as a result of the change from the intangible asset model to the financial asset model described in that Note, which was partially offset by the reclassification of the balance of Eurolink M3 to “Assets Classified as Held for Sale”.
Lastly, “Receivable from Public Authorities” includes tax receivables from public authorities other than income tax receivables.
4.3. CURRENT TRADE AND OTHER PAYABLES
The detail of "Current Trade and Other Payables" at 31 December 2015 and 2014 is as follows:
(Millions of euros) Dec. 14
Exchange rate
effect
Changes in the scope of
consolidation Other Dec. 15
Trade payables 1,940 46 -3 13 1,996
Amounts billed in advance for construction work and advances from customers
1,013 31 0 -157 887
Other non-trade payables
484 7 -15 -12 464
TRADE AND OTHER PAYABLES
3,437 84 -18 -157 3,346

2015 Consolidated Financial Statements. Ferrovial, S.A. and Subsidiaries
128
a) Trade payables
The detail of the trade payables at 31 December 2015 and 2014 is as follows:
(Millions of euros) Dec. 14
Exchange rate
effect
Changes in the scope of
consolidation Other Dec. 15
Trade payables 1,453 44 -3 30 1,524
Trade payables sent for reverse factoring
267 0 0 -16 251
Retentions made from suppliers
220 3 0 -1 221
TRADE PAYABLES
1,940 46 -3 13 1,996
"Trade Payables" increased by EUR 13 million with respect to 31 December 2014, excluding the exchange rate effect and the changes in the scope of consolidation. This change arose mainly in the Services business in the UK.
"Trade Payables" includes the balances payable to suppliers sent for reverse factoring (see Note 1.3.3.4 in Accounting policies) amounting to EUR 251 million (31 December 2014: EUR 267 million).
The carrying amount of the trade payables approximates their fair value.
b) Disclosure obligation in relation to payments to suppliers provided for in Additional Provision Three of Law 15/2010
In compliance with the obligation to disclose the average period of payment to suppliers provided for in Article 539 and Additional Provision Eight of the Spanish Limited Liability Companies Law (in accordance with the new wording of Final Provision Two of Law 31/2014 reforming the Spanish Limited Liability Companies Law), the Company hereby states that the average period of payment to the suppliers of all the Group companies domiciled in Spain in 2015 was 48 days.
Set forth below is the detail required by Article 6 of the Spanish Accounting and Audit Institute Resolution of 29 January 2016 in relation to the disclosures to be provided on the average period of payment to suppliers in the year:
2015 Days
Average period of payment to suppliers 48
Ratio of transactions settled 48 Ratio of transactions not yet settled 53
Amount (euros)
Total payments made 1,007,118,250 Total payments outstanding 54,792,695
As permitted by the Single Additional Provision of the aforementioned Resolution, no comparative information is presented.
Reciprocal trade receivables and payables between Ferrovial Group companies are eliminated on consolidation and, accordingly, no balances payable to Group companies are presented in the consolidated statement of financial position. Therefore, the information shown in the foregoing table refers only to the Group's
external suppliers, although it is hereby stated for information purposes that the average payment period between Group companies is normally 30 days.
c) Amounts Billed in Advance for Construction Work and advances from customers.
This paragraph refers to:
- the amounts billed in advance in Services and Construction Division, regarding construction contracts and certain services contracts recognised by reference to the stage of completion pursuant to IAS 11, as described in Note 1.3.3. and 4.4.
- advances received from customers, amounting to EUR 337 million (31 December 2014: EUR 239 million), of which EUR 97 million (31 December 2014: EUR 61 million) relate to advances received by Real Estate activity in Poland; and EUR 240 million (31 December 2014: EUR 178 million) relate to advances received by Construction and Services divisions, concerning contracts registered by reference to the stage of completion pursuant to IAS 11, as described in Note 4.4.
d) Other non-trade payables
The detail of “Other Non-Trade Payables” is as follows:
(Millions of euros) Dec. 14
Exchange rate
effect
Changes in the scope of
consolidation Other Dec. 15
Remuneration payable 154 2 0 -5 151
Other accounts payable to public authorities
235 5 -1 14 253
Other payables 94 0 -13 -21 60
OTHER NON-TRADE PAYABLES
484 7 -15 -12 464
“Remuneration Payable” relates to the employee remuneration earned but not paid during the year amounting to EUR 151 million. Also, “Other Accounts Payable to Public Authorities” includes tax payables other than income tax, mainly VAT and employer social security taxes.
4.4. INFORMATION ON CONSTRUCTION CONTRACTS
AND OTHER CONTRACTS UNDER WHICH THE
RELATED REVENUE AND COSTS ARE RECOGNISED
BY REFERENCE TO THE STAGE OF COMPLETION
Contract revenue associated with construction contracts and certain services contracts is recognised by reference to the stage of completion pursuant to IAS 11, as described in Note 1.3.3. summarising the main accounting policy.
As indicated in that Note, the difference between the revenue recognised and the amounts actually billed to the customer is analysed systematically on a contract-by-contract basis. If the amount billed is lower than the revenue recognised, the difference is recognised as an asset under “Trade Receivables for Sales and Services - Amounts to Be Billed for Work Performed” (see Note 4.2), whereas if the amount of revenue recognised is lower than the

2015 Consolidated Financial Statements. Ferrovial, S.A. and Subsidiaries
129
amount billed, a liability is recognised under “Current Trade and Other Payables - Amounts Billed in Advance for Construction Work”.
Also, in certain construction contracts "advances" are agreed upon that are paid by the customer when work is commenced on the contract, the balance of which is offset against the various progress billings as the contract work is performed (these balances are recognised under “Trade Payables” in liabilities in the consolidated statement of financial position - see Note 4.3-a).
In contrast to the advances, in certain contracts the customer retains a portion of the price to be paid in each progress billing to guarantee the satisfaction of certain obligations under the contract. These "retentions" are not reimbursed until the contract is definitively settled (these balances are recognised under “Trade Receivables for Sales and Services” in assets in the consolidated statement of financial position (see Note 4.2).
Unlike “Amounts to Be Billed for Work Performed” and “Amounts Billed in Advance for Construction Work”, the "advances" and "retentions" are balances that will have an impact on future cash flows, since in the case of the "advances" a lower amount will be collected in the future as the advances are discounted from the progress billings, whereas the "retentions" will give rise to higher collections in the future, since the customer will reimburse the related amounts as and when the contract work is settled.
The detail of the amounts recognised in this connection at 31 December 2015 and 2014 is as follows:
(Millions of euros) Dec. 14 Exchange rate effect
Other Dec. 15
Amounts to be billed for work performed (Note 4.2-a) 751 27 -4 775
Amounts billed in advance for construction work -774 -31 256 -549
Contracts accounted for by reference to the stage of completion, net
-23 -4 252 226
Retentions (Note 4.2-a) 59 1 15 75
Advances -178 0 -62 -240 Amount net of advances and retentions
-119 1 -47 -165
The decrease in amounts billed in advance for construction work, excluding the exchange rate effect and the impact of changes in the scope of consolidation (EUR 256 million) was due to construction contracts completed in the year.
Lastly, there was an increase of EUR 62 million in the advances received in 2015 as a result of new contract awards in the International business.

2015 Consolidated Financial Statements. Ferrovial, S.A. and Subsidiaries
130
SECTION 5: CAPITAL STRUCTURE AND FINANCING
The Notes in this section describe the changes in the financial structure of Ferrovial as a result of variations in equity (see Note 5.1) and in its net cash position (see Note 5.2), taken to be the balance of cash and cash equivalents net of the financial debt, bank borrowings and debt securities, making a distinction between non-infrastructure project companies and infrastructure projects. They also describe the Group's exposure to main financial risks and the policies for managing them (Note 5.4), and the derivatives arranged in connection with that policies (see Note 5.5).
The equity attributable to the shareholders (Note 5.1) remained in line with 2014, and the increase in the net profit was offset by the increase in shareholder remuneration in the year.
Equity attributable to the shareholders (millions of euros)
Beginning Balance at 31/12/14 5,672
Net profit 720
Recognised income and expense 178
Shareholder remuneration -532
Other 20
Ending Balance at 31/12/15 6,058
At 31 December 2015, Ferrovial's non-infrastructure project companies had a positive net cash position of EUR 1,514 million, similar to that at December 2014 (EUR 1,632 million). This variation is analised through the cash flow (Note 5.3), where it is shown that the Group has generated cash flows from operating and investing activities that made it possible to increase shareholder remuneration by 4%.
This net cash position made it possible to amply achieve the objective of maintaining an investment grade rating, where the company considers a relevant metric the maintenance of a maximum ratio, for non-infrastructure projects, of net debt (gross debt less cash) to gross profit from operations (EBITDA) plus dividends from projects of 2:1. Ferrovial's rating remains unchanged at BBB.
There was a significant drop in the borrowings of infrastructure projects, due largely to the exclusion from consolidation of the AP36 Ocaña La Roda and R4 Madrid Ocaña toll roads, and the reclassification of the liabilities of Chicago Skyway and the Eurolink M4 M6 and M3 toll roads in Ireland to "Liabilities Classified as Held for Sale".

2015 Consolidated Financial Statements. Ferrovial, S.A. and Subsidiaries
131
5.1. EQUITY
The detail of the main impacts net of taxes that affected the changes in equity in 2015 and which explain the changes in equity in the period from December 2014 to December 2015 is as follows:
2015 Attributable
to the shareholders
Attributable to non-
controlling interests
Total equity
Equity at 31/12/14 5,672 349 6,021
Consolidated profit for the year 720 -89 631
Income and expense recognised at fully consolidated companies
146 45 191
Impact on reserves of hedging instruments 45 3 48
Impact on reserves of defined benefit plans 31 0 31
Translation differences 70 42 111 Income and expense recognised in equity, held for sale
1 -12 -11
Impact on reserves of hedging instruments 10 5 14
Impact on reserves of defined benefit plans 0 0 0
Translation differences -8 -17 -25 Income and expense recognised in equity Companies accounted for using the equity method
-84 0 -84
Impact on reserves of hedging instruments 14 0 14
Impact on reserves of defined benefit plans -4 0 -4
Translation differences -95 0 -95 Amounts transferred to profit or loss, fully consolidated companies
113 75 188
Amounts transferred to profit or loss, companies accounted for using the equity method
2 0 2
Total income and expense recognised 898 19 916
Scrip dividend/Dividends -267 -48 -315
Treasury share transactions -265 0 -265 Remuneration of shareholders -532 -48 -580
Capital increases/reductions 0 100 100
Share-based payment -51 -1 -52
Other changes 71 64 136
Other transactions 20 164 184
EQUITY AT 31/12/15 6,058 483 6,541
Following is a description of the main changes in shareholders’ equity in 2015, which gave rise to an increase of EUR 386 million in equity attributable to the shareholders.
The profit for the year attributable to the Parent totalled EUR 720 million.
The income and expense recognised in equity relate to:
� Hedging instruments: recognition of the changes in value of the effective portion of derivatives qualifying for hedge accounting (see Note 5.5), the impact of which was EUR 45 million (net of taxes) attributable to the Parent in the case of the fully consolidated companies, EUR 10 million in those held for sale and EUR 14 million in the case of the companies accounted for using the equity method (mainly Heathrow Airport Holdings). The total impact for the Parent Company due to this concept amounts to EUR 69 million.
� Defined benefit plans: this item includes the impact on equity of actuarial gains and losses arising from adjustments and changes to the Group’s defined benefit plan assumptions, as described in Note 6.2, which had a total impact for the Parent of EUR 27 million net of taxes (EUR 31 million at fully consolidated companies (Amey) and EUR -4 million at the companies accounted for using the equity method (HAH/AGS)).
� Translation differences: The currencies in which Ferrovial has the greatest exposure in terms of its equity (mainly the Canadian dollar and the pound sterling), as detailed in Note 5.4, performed in opposite ways in 2015. The depreciation of the Canadian dollar gave rise to translation losses of EUR -141 million. However, the appreciation of the pound sterling and the US dollar gave rise to translation gains of EUR 91 million and EUR 22 million, respectively. The impact of the other currencies was EUR -5 million. Of the total change under this heading for the Parent (EUR -33 million), EUR -95 million relate to companies accounted for using the equity method (primarily 407 ETR and Heathrow Airports Holdings) and EUR 62 million to fully consolidated companies and those held for sale.
� Amounts transferred to profit or loss: this relates to the transfer to profit or loss from reserves of the gains or losses on derivatives of Autopista del Sol (EUR 32 million), Autopista SH-130 (EUR 81 million) (fully consolidated) and Autopista A66 Benavente Zamora (EUR 2 million) (accounted for using the equity method), amounting a total impact of EUR 115 million. These concession operators are currently involved in debt refinancing processes in which the projected flows relating to the borrowings are not expected to match those envisaged in the initial design of the derivatives, which therefore interrupted the corresponding hedging relationships.
Remuneration of shareholders:
� Scrip dividend: for the second successive year, the shareholders at the Annual General Meeting of Ferrovial, S.A. held on 27 March 2015 approved a flexible shareholder remuneration scheme, whereby the shareholders can freely choose to receive newly issued shares of the Company by subscribing a capital increase against reserves or an amount in cash through the transfer to the Company (if they had not done so through the market) of the bonus issue rights corresponding to the shares held by them. As a result of this resolution, in 2015 two capital increases were performed with the following characteristics:
- in May 2015 5,306,164 new shares were issued with a charge to reserves at a par value of EUR 0.20 per share, representing a capital increase of EUR 1 million, and EUR 116 million of bonus shares were purchased, representing a payment per share of EUR 0.304.
- in November 2015 6,299,690 new shares were issued with a charge to reserves at a par value of EUR 0.20 per share, representing a capital increase of EUR 1

2015 Consolidated Financial Statements. Ferrovial, S.A. and Subsidiaries
132
million, and EUR 151 million of bonus shares were purchased, representing a payment per share of EUR 0.398.
- The amount recognised in this connection in the foregoing table was EUR -267 thousand.
� Acquisition of treasury shares: the shareholders at the Annual General Meeting of Ferrovial, S.A. held on 27 March 2015 approved a treasury share purchase plan the objective of which was a subsequent capital reduction through the retirement thereof. This transaction is described in Note 5.1-a and 5.1-c below, having an negative impact of EUR 265 million in Equity.
Other transactions:
� Capital increases corresponding to non-controlling interests: increase of EUR 100 million in the equity attributable to non-controlling interests, principally at Cintra's US companies LBJ, NTE 1-2, NTE 3A-3B and I-77 Mobility Partners.
� Share-based payment amounting to EUR -51 million, as discussed in section d) Share-based payment.
Following is an explanation of each of the equity items presented in the consolidated statement of changes in equity:
a) Share capital
At 31 December 2015, the share capital amounted to EUR 146,442,214.80 million and had been fully subscribed and paid. The share capital is represented by 732,211,074 ordinary shares of a single class and with a par value of twenty euro cents (EUR 0.20) per share. The changes in 2014 detailed in the table below relate to the capital increase and reduction transactions described in the preceding paragraph:
Shares Number Par value
Beginning balance 732,389,174 146,477,834.80
Scrip dividend 11,605,854 2,321,170.80
Capital reduction -11,783,954 -2,356,790.80
ENDING SHARES 732,211,074 146,442,214.80
At 31 December 2015, the only company with an ownership interest of over 10% was Rijn Capital BV, with 20.212% of the shares. This company is controlled by the Chairman of the Company's Board of Directors Rafael del Pino y Calvo Sotelo. The shares of the Parent are traded on the Spanish Stock Market Interconnection System (SIBE) and on the Spanish Stock Exchanges and all carry the same voting and dividend rights.
b) Share premium and merger premium
At 31 December 2015, the Company's share premium amounted to EUR 1,202 million, and the merger premium, which arose as a result of the merger of Grupo Ferrovial S.A. with Cintra Concesiones de Infraestructuras de Transporte, S.A. (currently Ferrovial, S.A.) in 2009, totalled EUR 963 million. Both line items are considered to be unrestricted reserves.
c) Treasury shares
At 31 December 2014, 245,821 treasury shares were held. The following changes took place in 2015:
I. TRANSACTION
PERFORMED /
OBJECTIVE
NUMBER OF
SHARES
NUMBER OF
SHARES APPLIED
TO THE OBJECTIVE
TOTAL NUMBER
OF SHARES
II. CLOSING BALANCE AT
31 DECEMBER 2014
245,821
Treasury shares for further capital reduction
11,783,954 -11,783,954 -
Discretionary treasury shares
760,990 - 760,990
Treasury shares to address compensation systems
7,171,989 -7,417,810 -245,821
Shares received as payment for the flexible dividend
193,515 - 193,515
Other treasury shares 300 - 300
III. CLOSING BALANCE AT
31 DECEMBER 2015FINAL
31 DIC. 2015
954,805
- The shareholders at the Annual General Meeting of Ferrovial, S.A. held on 27 March 2015 approved a treasury share purchase plan for a maximum amount of EUR 250 million the objective of which was a subsequent capital reduction through the retirement thereof. As a result of this resolution, 11,783,954 treasury shares were purchased in 2015 at an average price of EUR 21.2 per share, representing a total disbursement of EUR 249 million; subsequently it was resolved to reduce capital by the same number of shares, which entailed a decrease in the share capital amounting to EUR 2 million, having appropriated the difference between the two amounts (EUR -247 thousand) to unrestricted reserves (merger premium).
- Also, 760,990 treasury shares were acquired as a discretional treasury share acquisition for EUR 16 million. The Board of Directors intends to propose to the shareholders at the Annual General Meeting of Ferrovial S.A., when it is convened, the application to a further reduction in share capital.
- As described in detail in section d) below, in 2015 7,171,899 treasury shares were acquired in order to implement various share-based payment schemes, for which 7,417,810 shares were used, representing a net change of -245,821 shares.
- Lastly, in order to implement the various resolutions relating to the aforementioned scrip dividend, 193,815 shares were received.
Following those changes, at 31 December 2015 there were 954,805 treasury shares with a fair value, based on the market price at year-end, of EUR 16 million.
d) Share-based payment
In addition to the transactions discussed in section c) above, in 2015 a total of 7,171,989 treasury shares were acquired, representing 0.98% of the share capital and with a total par value of EUR 1.4 million, under share-based remuneration schemes, and 7,417,810 shares were used for this purpose. Those 7,417,810 shares relate to:

2015 Consolidated Financial Statements. Ferrovial, S.A. and Subsidiaries
133
- 6,022,774 shares were acquired and subsequently sold in connection with the share option plans executed in the year. These transactions had an effect of EUR -35.8 million on equity.
- 1,073,600 shares were acquired and subsequently delivered in order to implement the performance-based share-based remuneration plans (see Note ) that expired in the year. These acquisitions had an effect of EUR -16 million on equity.
The remaining 321,436 shares relate mainly to shares delivered under a remuneration plan that enables certain employees to receive a portion of their variable remuneration in the form of Ferrovial shares up to a maximum amount of EUR 12,000 per employee (Plan 12,000).
The total impact on equity of these remuneration schemes in 2015 amounted to EUR -51 million and relates to the aforementioned changes, net of the increase in shareholders’ equity of EUR +18 million as the balancing item for the expense recognised in the year in relation to the vesting of the performance-based share-based remuneration plan and of a negative impact on shareholders’ equity of EUR –32 million arising from the personal income tax withholdings relating to the performance-based share-based remuneration plans that vested in the year.
It should be noted, as discussed in Note 5.5, that the Company has arranged equity swaps in order to hedge against the possible impact on equity resulting from the exercise of the share-based remuneration schemes. These instruments gave rise to cash inflows of EUR 38 million and the changes in the fair value thereof had an impact on the financial result of EUR 46 million.
e) Valuation adjustments
“Valuation Adjustments” in the consolidated statement of changes in equity, the balance of which at 31 December 2015 was EUR -805 million, includes mainly the cumulative amount in reserves of the valuation adjustments made to derivatives (EUR -708 million), pension plans (EUR -359 million) and translation differences (EUR -32 million).
As regards the requirements of IAS 1 in relation to the disclosure of “income and expense recognised directly in equity”, it is important to note that the only items that under the related accounting legislation may not be transferred in a future period to profit or loss are the valuation adjustments relating to pension plans.
f) Retained earnings and other reserves
This line items includes prior years’ retained earnings and other reserves totalling EUR 5,399 million (2014: EUR 4,902 million). The other reserves include restricted reserves of the Parent, relating mainly to the legal reserve of EUR 29 million.
g) Proposed distribution of profit
It is planned for the Board of Directors to propose to the Company’s duly convened Annual General Meeting that the profit of FERROVIAL, S.A. be distributed as follows:
Profit of FERROVIAL, S.A. (euros) 132,875,229.80
Distribution (euros)
To voluntary reserves (euros) 132,875,229.80
The legal reserve has reached the legally required minimum.

2015 Consolidated Financial Statements. Ferrovial, S.A. and Subsidiaries
134
h) Non-Group companies with significant ownership interests in subsidiaries
At 31 December 2015, the non-controlling interests with holdings of 10% or more in the share capital of the most significant fully consolidated Group companies were as follows:
Ferrovial Group Subsidiary Non-Group % Non-Group shareholder
Construction
Budimex S.A. 41% Listed company Services Gestión Medioambiental de Toledo, S.A. 40% Consorcio de Servicios Públicos Medioambientales de la Provincia de Toledo Smart Hospital Cantabria, S.A. 15% Siecsa Construcción y Servicios, S.A. Ingeniería Ambiental Granadina, S.A. 20% Granada Municipal Council Ecoparc del Mediterrani, S.A. 32%-20% Urbaser - Tractament i Selecció de Residus, S.A. Toll roads
Autopista del Sol, C.E.S.A. 20% Unicaja Autopista Terrassa-Manresa, S.A. 23.72% Acesa (Autopista Concesionaria Española, S.A.) Eurolink Motorway Operation N4/N6 Ltd. 34% DIF Infra 3 M4 Ireland Ltd. Inversora de Autopistas de Levante, S.L. 40%-5% Sacyr Concesiones, S.L.- Kutxa Inversora de Autopistas del Sur, S.L. 35%-10% Sacyr Concesiones, S.L. – Inversiones Corporativas, S.A.
LBJ Infrastructure Group Holding LLC 26.4576%-15.9424-6.6% LBJ Blocker (APG)- Meridiam Infrastrucuture S.a.r.l. (MI LBJ)- Dallas Police and Fire Pension System
NTE Mobility Partners Holding, LLC 33.33%-10% Meridiam Infrastructure S.a.r.l. - Dallas Police and Fire Pension System
NTE Mobility Partners SEG 3 Holding LLC 13.94%-10%-25.96% Meridiam Infrastructure NTE 3A/3B LLC - Dallas Police and Fire Pension System - NTE Segments 3 Blocker, Inc. (APG)
NTE Mobility Partners SEG 2-4 LLC 25% Meridiam Infrastructure S.a.r.l. SH 130 Concession Company, LLC 35% Zachry Toll Road 56 LLP Skyway Concession Company Holding LLC 45% MIG Chicago Holdings LLC
I-77 Mobility Partners Holding LLC 29.90%-10%-10% GCM Investments - Aberdeen Infrastructures Investments Interstate 77 LLC - John Laing
The main changes in "Equity Attributable to Non-Controlling Interests" in 2015 were as follows:
Company Balance at 31/12/14
Profit or loss
Derivatives Translation differences
Dividends Capital increase
Other impacts
Balance at 31/12/15
Budimex 46 23 0 0 -16 0 0 54 Gestión Mediambiental de Toledo -1 0 0 0 0 0 0 -1 SMART Hospital Cantabria 0 0 0 0 0 0 0 1 Ingeniería Ambiental Granadina 3 1 0 0 0 0 0 4 Ecoparc del Mediterrani 6 1 0 0 -1 0 0 6 Autopista del Sol -3 -8 0 0 0 0 8 -3 Autopista Terrasa Manresa 137 11 1 0 0 0 0 149 Eurolink Motorway Operation (N4-N6) -6 1 1 0 0 0 -1 -4 Autopista Madrid Levante -52 -2 0 0 0 0 54 0 Autopista R4 Madrid-Sur -3 -13 0 0 0 0 15 0 LBJ Infrastructure Group 198 -20 0 24 0 46 0 248 NTE Mobility Partners 134 -14 0 15 0 3 0 138 NTE Mobility Partners Segments 3 LLC 29 -1 0 4 0 52 0 84 NTE Mobility Partners Segments 2-4 0 0 0 0 0 0 0 0 SH-130 Concession Company -13 -73 0 -2 0 0 67 -21 SCC Holding LLC. -70 -3 0 -8 0 0 0 -81 Skyway Concession Co. LLC. -75 -25 3 -9 0 0 0 -106 I-77 Mobility Partners 0 -2 0 0 0 0 -6 -7 Other 19 35 3 1 -27 -1 -8 22 TOTAL 349 -89 8 25 -44 100 135 483
Worthy of note, in addition to the changes arising from the profit or loss for the year, derivatives, translation differences, dividends and capital increases, the impact of the exclusion from consolidation in the year of Autopista (and Inversora) R4 Madrid Sur (EUR 15 million) and Autopista (and Inversora) Madrid Levante (EUR 54 million). As described in Note 1.1.3, Changes in the scope of consolidation, these companies were excluded from the scope of consolidation as it was considered that as a result of the evolution in 2015 of the insolvency proceedings in which they are involved control is not held over the investees as defined in IFRS 10.
Also, the column "Other Impacts" reflects the portion attributable to non-controlling interests of the accumulated reserves relating to derivatives of Autopista SH-130 following the aforementioned interruption of the hedge accounting for those instruments.

2015 Consolidated Financial Statements. Ferrovial, S.A. and Subsidiaries
135
5.2. NET CASH POSITION
In order to present an analysis of the Group's net debt position, the following table contains a breakdown of the net cash position, distinguishing between infrastructure project companies and the other companies. The net cash position is understood to be the balance of items included in cash and cash equivalents (including short-term restricted cash) and long-term restricted cash of infrastructure projects, less current and non-current borrowings (bank borrowings and bonds).
Net cash position 2015
Bank borrowings
/Bonds
Cash and cash
equivalents and
restricted cash
Net borrowing position
Intra-Group balances
Total
Non-infrastructure project companies
-1,464 2,973 1,509 6 1,514
Infrastructure projects -6,618 567 -6,051 -6 -6,057
TOTAL -8,082 3,540 -4,542 0 -4,542
5.2.1. Infrastructure projects
a) Cash and cash equivalents and restricted cash
Infrastructure project financing agreements occasionally impose the obligation to arrange certain restricted accounts to cover short-term or long-term obligations relating to the repayment of the principal or interest on the borrowings and to infrastructure maintenance and operation.
Restricted cash is classified as short-term or long-term depending on whether it must remain restricted for less than or more than one year. In any event, these funds are invested in highly-liquid financial products earning floating interest. The type of financial product in which the funds may be invested is also restricted by the financing agreements or, where no restrictions are stipulated, the decision is made on the basis of the Group’s policy for the placement of cash surpluses.
Short-term balances are recognised under “Cash and Cash Equivalents” in the consolidated statement of financial position whereas long-term balances are included in “Financial Assets”.
There was a net decrease of EUR -121 million in long- and short-term restricted cash with respect to December 2014, of which EUR -113 million relate to Skyway Concession Co. Llc, and EUR -7 million correspond to the Irish toll roads (M4-M6) classified as held for sale (see Note 1.1).
The other cash and cash equivalents relate to bank accounts and highly-liquid investments subject to interest rate risk.
b) Infrastructure project borrowings
b.1) Breakdown by project, significant changes in the year and main characteristics of the borrowings
Following is a breakdown of the borrowings by project, distinguishing between bonds and bank borrowings, short- and long-term, and of the changes in the year.
31/12/15 Change 15/14
(Millions of euros) Bonds Bank
borrowings Total Bonds
Bank borrowings
Total
Non-current maturities 1,353 3,967 5,320 -956 -1,055 -2,011
US toll roads 1,256 2,069 3,325 -955 -361 -1,317 Spanish toll roads
654 654 0 -490 -490
Portuguese toll roads 97 620 718 -1 -45 -46
Other toll roads
0 0 0 -309 -309
Construction
140 140 0 -3 -3
Services 484 484 0 155 155
Current maturity 1 1,297 1,297 0 22 21
Spanish toll roads
470 470 0 -728 -728
US toll roads 735 735 0 735 735
Other 1 92 92 0 15 15
TOTAL 1,354 5,264 6,618 -957 -1,033 -1,990
31/12/14
(Millions of euros) Bonds Bank
borrowings Total
Non-current maturities 2,309 5,022 7,331
US toll roads 2,211 2,430 4,642
Spanish toll roads
1,144 1,144
Portuguese toll roads 98 666 764
Other toll roads
309 309
Construction
144 144
Services 329 329
Current maturity 1 1,275 1,276
Spanish toll roads
1,198 1,198
US toll roads
Other 1 77 78
TOTAL 2,310 6,297 8,608
Infrastructure project borrowings decreased by EUR -1,990 million with respect to December 2014, due mainly to the following:
� The reclassification of the borrowings associated with the Chicago Skyway and the Irish toll roads (M3 and M4-M6) to liabilities classified as held for sale (see Note 1.1) amounting to EUR -1,483 million and EUR -316 million, respectively.
� The exclusion from consolidation of the borrowings associated with the Ocaña La Roda toll road and R4 Madrid Ocaña amounting to EUR -1,224 million (see Note 1.1).

2015 Consolidated Financial Statements. Ferrovial, S.A. and Subsidiaries
136
� Additional drawdowns against the borrowings already arranged at the end of 2014 amounting to EUR 494 million, of which EUR 89 million relate to the I-77 Mobility Partners toll road, EUR 83 million to the LBJ toll road, EUR 64 million to NTE Extension, EUR 64 million to SH-130 and EUR 47 million to North Tarrant Express. Also, EUR 86 million were drawn down in relation to the Milton Keynes waste treatment plant (Amey) and EUR 69 million to the Murcia plant.
� Increase in borrowings as a result of the depreciation of the euro against the US dollar (see Note 1.4), which increased the value of the borrowings by EUR 539 million at 31 December 2015.
The main characteristics of the borrowings of each of the projects are summarised as follows:
US toll roads:
SH-130
This project's borrowings comprise syndicated bank financing in two tranches: tranche A of USD 686 million to finance a portion of the construction work, which had been drawn down in full at 31 December 2015 and has final maturity in 2038 (6-month LIBOR of 0.357%+1.65%); and tranche B of USD 35 million to provide liquidity, which has been drawn down in full (6-month LIBOR of 0.357%+1.65%). SH-130 also has a TIFIA (Transportation Infrastructure Finance and Innovation Act) debt tranche of USD 550.9 million, drawn down in full at 31 December 2013 (USD 430 million of principal and USD 120.9 million of interest added to the principal), to finance part of the construction work, with final maturity in 2047 (fixed interest rate: 4.46%). Also, this concession operator has an interest rate derivative associated with bank borrowings with a notional amount of USD 711.6 million and fixed interest rates of between 5.17% and 5.22%, which matures in 2038. The fair value of the derivative arranged (recognised under derivative financial instruments, see Note 5.5) was EUR -141 million at year-end.
As indicated in the consolidated financial statements for 2014, due to the lower-than-forecast traffic levels, at the end of that year the company is currently involved in a process aimed at restructuring its debt, as a result of which it reached a waiver agreement with the banks whereby payment of the outstanding interest was deferred until January 2016. On expiry, the waiver agreement was renewed until 29 February 2016, with the terms and conditions of the remainder of the debt remaining unchanged, except for the addition of the accrued interest to the debt principal. Therefore, the negotiations in progress continued. Based on this situation, the debt was classified as a current liability (except for the TIFIA loans) and the associated derivative is considered to qualify for hedge accounting, with a negative impact on profit or loss of USD 153.0 million (see Note 2.6).
North Tarrant Express Managed Lanes – NTE
This project is financed through a USD 400 million issue of Private Activity Bonds (PABs) with final maturity in 2039 (USD 60 million bearing fixed interest at 7.50% with final maturity in 2031 and USD 340 million bearing fixed interest at 6.875% with final maturity in 2039). It also has a TIFIA loan granted by the US Federal Government, drawn down in full at 31 December 2015, with a repayment profile of 35 years from the entry into service of the infrastructure, the outstanding balance of which amounts to USD 726.1 million (USD 650.0 million of principal and USD 76.1 million of interest added to the principal). This loan bears interest at a fixed rate of 4.52% and has final maturity in 2050.
NTE Mobility Partners Seg 3 LLC
In September 2013 the financial close of the concession arrangement for the extension of the North Tarrant Express (NTE) toll road in Texas was achieved. The borrowings for this project were structured through the issue of USD 274 million of Private Activity Bonds (PABs), maturing at 25 and 30 years (7.00% fixed interest on USD 128 million and 6.75% fixed interest on USD 146 million), and a TIFIA loan of USD 531 million bearing a fixed rate of 3.84%, against which USD 70.3 million had been drawn down at 31 December 2015 (USD 69.8 million of principal and USD 0.5 million of interest added to the principal), with final maturity in 2054.
LBJ
This concession operator is financed through a USD 615 million issue of PABs with final maturity in 2040 (7.00% fixed interest on USD 473 million, of which USD 418.9 million have final maturity in 2040 and USD 54.5 million in 2034; and 7.50% fixed interest on USD 142 million, of which USD 91 million have final maturity in 2032 and USD 51 million in 2033). LBJ also has a TIFIA loan of USD 850 million granted by the US Federal Government with a repayment profile of 35 years from the entry into service of the infrastructure, against which USD 951.5 million had been drawn down at 31 December 2015 (USD 850.0 million of principal and USD 101.5 million of interest added to the principal). This loan bears interest at a fixed rate of 4.22% and has final maturity in 2050.
I-77 Mobility Partners
This concession operator is financed through a USD 100 million issue of PABs (5.00% fixed interest), of which USD 7 million have final maturity between 2026 and 2030, USD 13 million have final maturity in 2037 and 80 million have final maturity in 2054. It also has a TIFIA loan of USD 189 million at a fixed rate of 3.04% with final maturity in 2053 against which no amount had been drawn down at year-end.
Spanish toll roads:
Ausol I and II
The debt is structured in two syndicated loans: (i) AUSOL I, with a notional amount of EUR 348.4 million; and (ii) AUSOL II, with a notional amount of EUR 121.9 million, both maturing in 2016 and bearing interest at 6-month EURIBOR of 0.062%3.50%. Also, Ausol has a derivative with a notional amount of EUR 246.1 million and a fixed interest rate of 3.7975%, which matures in 2022, registered in Derivatives Financial Instruments epigraph, with a total value of EUR 48 million (see Note 5.5). The company is currently refinancing its borrowings, and plans to issue a fixed-rate bond in the coming months.
Pending the completion of the refinancing, the borrowings were retained in current liabilities and the derivative was not considered to qualify for hedge accounting at year-end as it was planned to issue a fixed-rate bond, which had a negative impact of EUR 47.6 million on profit or loss.
Cintra Inversora Autopistas de Cataluña / A. Terrasa Manresa
Following the refinancing transaction in 2008 through a syndicated structuring arrangement, the company is now financed through a credit facility with a tranche A and a tranche B with limits of EUR 300 million and EUR 316 million, respectively, both bearing interest at 6-month EURIBOR of 0.050%+1.40%. Both tranches have been drawn down in full and have final maturity in 2035. The company has also

2015 Consolidated Financial Statements. Ferrovial, S.A. and Subsidiaries
137
been granted a liquidity line of EUR 80 million, against which it has drawn down EUR 42.8 million (bearing interest at 6-month EURIBOR of 0.050%+1.40%). It should also be noted that this company has a derivative with a notional amount of EUR 606 million, a guaranteed interest rate of 4.735% and maturity in 2035. The fair value of the derivative arranged (recognised under derivative financial instruments, see Note 5.5) was EUR -303.4 million at year-end. Additionally, as mentioned in Note 5.5, Autema has a derivative contract to hedge the variability of income through inflation swap, whereby a CPI of 2.50% per annum is fixed. The valuation of this derivative at year-end 2015 amounted to 355 million euros and has a notional value of 51 million euros.
Portuguese toll roads:
Euroscut Algarve
This company has structured debt in two tranches secured by Syncora Guarantee Inc., one of which comprises bonds totalling EUR 101 million with final maturity in 2027 (bearing 6.40% fixed interest) and the other comprises EIB borrowings of EUR 89.6 million with final maturity in 2025 (bearing 6.50% fixed interest).
Euroscut Azores
Syndicated bank financing with final maturity in 2033, against which EUR 342.7 million had been drawn down at 31 December 2015 (bearing interest at 6-month EURIBOR of 0.050%+0.80%). In relation to these borrowings, the concession operator has arranged a derivative with a notional amount of EUR 296.0 million, a guaranteed fixed interest rate of 4.115% and maturity in 2033. The fair value of the derivative arranged (recognised under derivative financial instruments, see Note 5.5) was EUR -87.7 million at year-end.
Auto-Estradas Norte Litoral
Financing structure based on a syndicated loan for an outstanding amount of EUR 241.7 million, with final maturity in 2026 (bearing interest at 6-month EURIBOR of 0.0625%+1.25%). In addition, the concession operator has a derivative with a notional amount of EUR 173.7 million and a fixed interest rate of 3.69%, which matures in 2026. The fair value of the derivative arranged (recognised under derivative financial instruments, see Note 5.5) was EUR -33 million at year-end.
b.2) Maturities by currency and fair value of infrastructure project borrowings
Currency Fair value
2015 Fair value
2014
Carrying amount
2015 2016 2017 2018 2019 2020
2021 and subsequent
years
Total maturities
Infrastructure project bonds
1,605 2,539 1,354 0 1 3 5 6 1,364 1,379
TOLL ROADS 1,605 2,539 1,354 0 1 3 5 6 1,364 1,379
USD 1,507 2,440 1,256 0 0 0 0 0 1,278 1,278
EUR 98 99 98 0 1 3 5 6 86 101
Bank borrowings of infrastructure projects
5,264 5,264 5,264 547 42 198 64 70 4,422 5,343
TOLL ROADS
4,593 4,593 4,593 502 28 41 44 50 3,998 4,662
USD 2,804 2,804 2,804 0 0 1 2 2 2,854 2,859
EUR 1,790 1,790 1,790 502 28 40 42 48 1,144 1,803 CONSTRUCTION
147 147 147 5 2 2 2 2 136 148
EUR 147 147 147 5 2 2 2 2 136 148
SERVICES
524 524 524 40 12 155 18 19 288 532
GBP 209 209 209 2 3 141 1 1 66 214
EUR 315 315 315 38 9 14 17 18 222 318
TOTAL BORROWINGS OF INFRASTRUCTURE PROJECTS
6,869 7,803 6,618 548 42 201 68 76 5,786 6,722
The differences between the total maturities of bank borrowings and the carrying amounts of the debt at 31 December 2015 are explained mainly by the difference between the nominal values and the carrying amounts of the debts, as certain adjustments are made in accordance with applicable accounting legislation (basically accrued interest payable and the application of the amortised cost method). The debt maturities do not include interest. The fair value reflected in the table above is calculated as follows:
� For fixed-rate bonds, subject to changes in value due to fluctuations in market interest rates: since they are quoted in an active market, the related market value is used.
� For fixed-interest bank borrowings, also subject to changes in value due to fluctuations in rates: future cash flows are discounted using a market interest rate, calculated using an internal valuation model.
� Lastly, for floating-rate bank borrowings: no significant differences are deemed to exist between the fair value of the borrowings and their carrying amount and, therefore, the carrying amount is used.

2015 Consolidated Financial Statements. Ferrovial, S.A. and Subsidiaries
138
b.3) Information on credit limits and credit drawable for infrastructure projects
Set forth below is a comparative analysis of borrowings not drawn down at year-end:
2015 (Millions of euros) Debt limit
Amount drawn down
Amount drawable
Carrying amount of
debt
Toll roads 6,497 6,041 456 5,947
US toll roads 4,562 4,138 424 4,059 Spanish toll roads 1,161 1,129 32 1,124 Other toll roads 775 775 0 764 Construction 169 148 21 147 Services 568 532 36 524 TOTAL BORROWINGS 7,234 6,722 512 6,618
2014 (Millions of euros)
Debt limit
Amount drawn down
Amount drawable
Carrying amount of
debt
Toll roads 8,756 8,195 561 8,118
US toll roads 5,204 4,705 499 4,652 Spanish toll roads 2,368 2,350 18 2,342 Other toll roads 1,184 1,140 44 1,124 Construction 149 149 0 148 Services 499 354 145 341 TOTAL BORROWINGS 9,405 8,699 706 8,608
The differences between the total bank borrowings drawn down and the carrying amount of the related debt at 31 December 2015 are explained mainly by the difference between the nominal values and carrying amounts of the debts, as certain adjustments are made in accordance with applicable accounting standards (especially accrued interest payable and the application of the amortised cost method).
Of the EUR 512 million drawable (31 December 2014: EUR 706 million), EUR 424 million relate mainly to amounts not drawn down against borrowings that were obtained to finance toll roads under construction in the US. It should be noted that this drawable amount is associated exclusively with the projects, based on the nature and performance thereof, as discussed below.
b.4) Guarantees and covenants for project borrowings
The borrowings classified as project borrowings are without recourse to the shareholders of the projects or with recourse limited to the guarantees provided. The guarantees provided by subsidiaries of Ferrovial in connection with the borrowings of these projects are described in Note 6.5, Contingent liabilities. Bridge loans granted to infrastructure project companies prior to subsequent capital increases to be subscribed by the shareholders and guaranteed in full by the latter (equity bridge loans) are classified as borrowings of non-infrastructure project companies (see Note 5.5.2. below).
At 31 December 2015, all the toll road concession operators were achieving the significant covenants in force, except for:
� SH-130. As indicated in point b.1 above, the waiver agreement relating to the payment of interest on the borrowings was renewed until February 2016, with the terms and conditions of the remainder of the debt remaining unchanged. Therefore, the negotiations in progress continued.
5.2.2. Net cash position excluding infrastructure projects
a) Borrowings of non-infrastructure project companies
a.1) Breakdown between current and non-current borrowings, changes in the year and main characteristics
2015 Change 15/14
(Millions of euros) Non-
current maturities
Current maturity
Total Non-
current maturities
Current maturity
Total
Corporate debt 0 0 0 0 0 0
Bonds 1,298 28 1,327 0 0 0
Project finance bridge loans 15 0 15 1 0 1
Other 63 59 123 -5 4 -1
TOTAL BORROWINGS EX-INFRASTRUCTURE PROJECTS
1,376 88 1,464 -4 4 -1
2014
(Millions of euros) Bonds Bank
borrowings Total
Corporate debt 0 0 0
Bonds 1,298 29 1,327
Project finance bridge loans 14 0 14
Other 63 63 126 TOTAL BORROWINGS EX-INFRASTRUCTURE PROJECTS 1,375 92 1,467
Corporate debt, bonds and bridge loans for projects
The borrowings excluding infrastructure projects comprise mainly three corporate bonds issued on 30 January 2013, 29 May 2013 and 9 July 2014 for nominal amounts of EUR 500 million (coupon of 3,375%), EUR 500 million (coupon of 3,375%) and EUR 300 million (coupon of 2,5%), respectively, and maturing in 2018, 2021 and 2024, respectively (see paragraph a.2 a below).
The project finance bridge loans of EUR 15 million relate to the financing of the Amey’s Milton Keynes waste treatment plant, which is considered to constitute recourse borrowings, since it is guaranteed by the shareholders.
Other
The borrowings shown under “Other” relate mainly to bank loans and finance leases of the Services Division (EUR 49 million and EUR 44 million, respectively) (2014: EUR 42 million and EUR 39 million, respectively) and of the Construction Division (EUR 38 million and EUR 6 million, respectively) (2014: EUR 27 million and EUR 6 million, respectively).

2015 Consolidated Financial Statements. Ferrovial, S.A. and Subsidiaries
139
a.2) Maturities by currency and fair value of borrowings excluding infrastructure projects
Borrowings Currency Fair value
2015 Carrying
amount 2015 2016 2017 2018 2019 2020
2021 and subsequent
years
Total maturities
Corporate debt and bonds 1,390 1,327 0 0 500 0 0 800 1,300
EUR 1,390 1,327 0 0 500 0 0 800 1,300
Other 138 138 34 10 2 9 12 37 104
EUR 57 57 16 9 0 0 0 3 29
GBP 56 56 16 0 0 1 6 27 50
PLZ 16 16 1 0 0 1 4 8 15
CLP 9 9 0 0 2 6 2 0 10
TOTAL BORROWINGS EXCLUDING INFRASTRUCTURE PROJECTS
1,528 1,464 34 10 502 9 12 837 1,404
The differences between the total maturities of bank borrowings and the carrying amounts of the debt at 31 December 2015 are explained mainly by the difference between the nominal values and carrying amounts of the debts, as certain adjustments are made in accordance with applicable accounting legislation (basically accrued interest payable and the application of the amortised cost method).
The fair value of bank borrowings excluding infrastructure projects coincides with the related carrying amount because the borrowings are tied to floating market interest rates and, therefore, changes in the benchmark interest rates do not affect their fair value.
Since the corporate bonds are fixed-interest bonds traded on an active market, their fair value was taken to be the market price at the analysis date. In addition, interest rate derivatives with a notional amount of EUR 250 million were arranged in relation to these bonds, as mentioned in Note 5.5.
Based on the aforementioned criteria, the estimated total fair value of bank borrowings and bonds excluding infrastructure projects was EUR 1,530 million at 31 December 2015 (31 December 2014: EUR 1,561 million).
The 2016 maturities amount to EUR 34 million and relate mainly to borrowings associated with Amey Group companies totalling EUR 16 million. The debt maturities do not include interest.
a.3) Information on credit limits and drawable credit
Set forth below is a comparative analysis of borrowings not drawn down at year-end:
2015
(Millions of euros) Debt limit
Amount drawn down
Amount drawable
Consolidated debt
Corporate debt 2,560 1,300 1,260 1,327
Other 404 104 300 140
TOTAL BORROWINGS 2,964 1,404 1,560 1,466
2014
(Millions of euros) Debt limit
Amount drawn down
Amount drawable
Consolidated debt
Corporate debt 2,051 1,301 750 1,327
Other 314 113 201 140
TOTAL BORROWINGS 2,365 1,414 951 1,467
The differences between total bank borrowings and the carrying amount thereof at 31 December 2015 are explained mainly by the difference between the nominal values and carrying amounts of the debts, as certain adjustments are made in accordance with applicable accounting standards.
The drawable balance of the corporate debt includes the increase the limit of the working capital credit line of EUR 510 million, which has not yet been drawn down, maturing in 2020.
a.4) Corporate rating
The financial rating agencies Standard & Poor's and Fitch issued their opinion on the credit rating of Ferrovial's corporate debt at December 2014, which was assigned ratings of BBB and BBB, respectively, with a stable outlook, and, therefore, came under the “investment grade” category.
b) Cash and cash equivalents of non-infrastructure project companies
The method used to classify cash and cash equivalents at both short and long term is the same as that applied in the financial statements for 2014. The cash and cash equivalents correspond to bank accounts and highly liquid investments subject to interest rate risk. The changes therein are analysed in Note 5.3, Cash flow.
Also, at 31 December there were certain restricted accounts totalling EUR 84 million made up mainly of EUR 37 million at the Corporate Division associated with certain equity swaps and EUR 41 million at the Real Estate Division associated with the developments in progress of Budimex.

2015 Consolidated Financial Statements. Ferrovial, S.A. and Subsidiaries
140
5.3. CASH FLOW
The consolidated statement of cash flows was prepared in accordance with IAS 7. This Note provides an additional breakdown in this connection. This breakdown is based on internal criteria established by the Company for business purposes, which in certain cases differ from the provisions of IAS 7. The main criteria applied are as follows:
� In order to provide a clearer explanation of the cash generated, the Group separates cash flows into “Cash Flows Excluding Infrastructure Projects” where infrastructure project concession operators are treated as financial assets and the investments in the capital of these companies are therefore included in cash flows from investing activities and the yields from the investments (dividends and capital reimbursements) are included in cash flows from operating activities, and “Cash Flows of Infrastructure Projects”, consisting of cash flows from the operating and financing activities of infrastructure project concession operators. The column “eliminations” in the table below shows the eliminations of investments and dividends aforementioned.
� The treatment given to interest received on cash and cash equivalents differs from that in the statement of cash flows prepared in accordance with IAS 7, since this interest is included in cash flows from financing activities as a reduction of the amount recognised under “Interest Cash Flows”.
� These flows endeavour to present the changes in the net cash position as the net amount of borrowings, cash and cash equivalents and restricted cash. This method also departs from that established in IAS 7, which explains the changes in cash and cash equivalents.
� Cash flows from operating activities are presented starting with EBITDA. Analysing the extent to which the given result is turned into cash through the “variation in working capital” which reflects the variation of the balance sheet not only in the current trade receivables and payables, but also in other items that has impact in the cash flow from operating activities. A detailed analysis of the evolution of cash flow from operating activities and working capital by divisions is presented in the director´s report.
December 2015 (millions of euros) Cash flow excluding
infrastructure projects Cash flow of infrastructure
projects Eliminations Consolidated cash flow
EBITDA 580 447 0 1.027 Dividends received 477 0 -78 399 Change in working capital (recivables, payables and other) -168 -67 0 -234
Cash flows from operating activities before tax
889 380 -78 1.191
Taxes paid in the year -29 -31 0 -61 Cash flows from operating activities 860 349 -78 1.130
Investments -374 -556 92 -839 Disposals 74 0 0 74 Cash flows from investing activities -300 -556 92 -765
Cash flows from operating and investing activities
560 -208 13 366
Interest cash flows -35 -309 0 -344 Capital proceeds from non-controlling interests -1 212 -92 119
Scrip dividend -267 0 0 -267 Treasury share purchase -265 0 0 -265 Remuneration of shareholders -532 0 0 -532 Dividends paid to non-controlling shareholders of investees -40 -83 78 -44
Exchange rate effect -23 -498 0 -521 Changes in bridge loans (project financing) 0 0 0 0 Other changes in borrowings (not giving rise to cash flows) -47 2,691 0 2,644
Cash flows from financing activities -678 2,014 -13 1,322
Change in net cash position -118 1,806 0 1,688
Opening position 1,632 -7,862 0 -6,230 Final position 1,514 -6,057 0 -4,542

2015 Consolidated Financial Statements. Ferrovial, S.A. and Subsidiaries
141
December 2014 (millions of euros)
Cash flow excluding infrastructure projects
Cash flow of infrastructure projects
Eliminations Consolidated cash flow
EBITDA 594 388 0 983 Dividends received 615 0 -33 582 Change in working capital (receivables, payables and other) -138 18 0 -120
Cash flows from operating activities before tax
1,071 406 -33 1,444
Taxes paid in the year -42 -20 0 -62 Taxes paid in previous year - devolution 42 0 0 42 Cash flows from operating activities 1,072 386 -33 1,425
Investments -581 -365 77 -870 Disposals 24 0 -13 11 Cash flows from investing activities -557 -365 63 -859
Cash flows from operating and investing activities
-514 21 30 566
Interest cash flows -30 -263 0 -293 Capital proceeds from non-controlling interests 1 121 -63 59
Scrip dividend -275 0 0 -275 Treasury share purchase -235 0 0 -235 Remuneration of shareholders -510 0 0 -510 Dividends paid to non-controlling shareholders of investees -30 -41 33 -38
Exchange rate effect 85 -518 0 -433 Changes in bridge loans (project financing) -14 0 0 -14 Other changes in borrowings (not giving rise to cash flows) -60 -155 0 -215
Cash flows from financing activities -557 -856 -30 -1.444
Change in net cash position -43 -835 0 -878
Opening position 1,675 -7,027 0 -5,352 Final position 1,632 -7,862 0 -6,230
The directors’ report includes detailed disclosures on the changes in cash flows.
5.4. MANAGEMENT OF FINANCIAL RISKS AND CAPITAL
The Group’s activities are exposed to a variety of financial risks, particularly interest rate risk, foreign currency risk, credit risk, inflation, liquidity risk and equity risk.
Following are the policies established by Ferrovial to manage each one of these risks, information about the Group's exposure to each of them and an analysis of the sensitivity to a change in the various variables.
a. Interest rate
a.1 Management of Interest rate risk
Ferrovial's business is subject to economic cycles and interest rate risk management is taken into consideration. When interest rates are low, these levels are guaranteed in the future at non-infrastructure project level. At infrastructure project level, the banks and rating agencies require a higher percentage of fixed-rate debt. These strategies are achieved by issuing fixed-rate debt or by arranging hedging financial derivatives, a detail of which is provided in Note 5.5, Derivative financial instruments at fair value. The aim of these hedges is to optimise the finance costs borne by the Group.
a.2 Exposure to interest rate risk
The accompanying table shows a breakdown of the Group’s debt, indicating the percentage of the debt that is considered to be hedged (either by a fixed rate or by derivatives). Not all the assets are hedged (the case of cash and cash equivalents, and long-term restricted cash associated with the debt).
2015
Borrowings (Millions of euros)
Total gross debt
% of debt hedged
Net debt exposed
to interest rate risk
Impact on results of + 100 b.p.
Non-infrastructure project companies 1,465 78% 324 3
Toll roads (*) 5,947 92% 466 5
Construction 147 93% 11 0
Services 524 94% 33 0
Infrastructure projects companies
6,618 92% 510 5
TOTAL BORROWINGS 8,083 90% 834 8
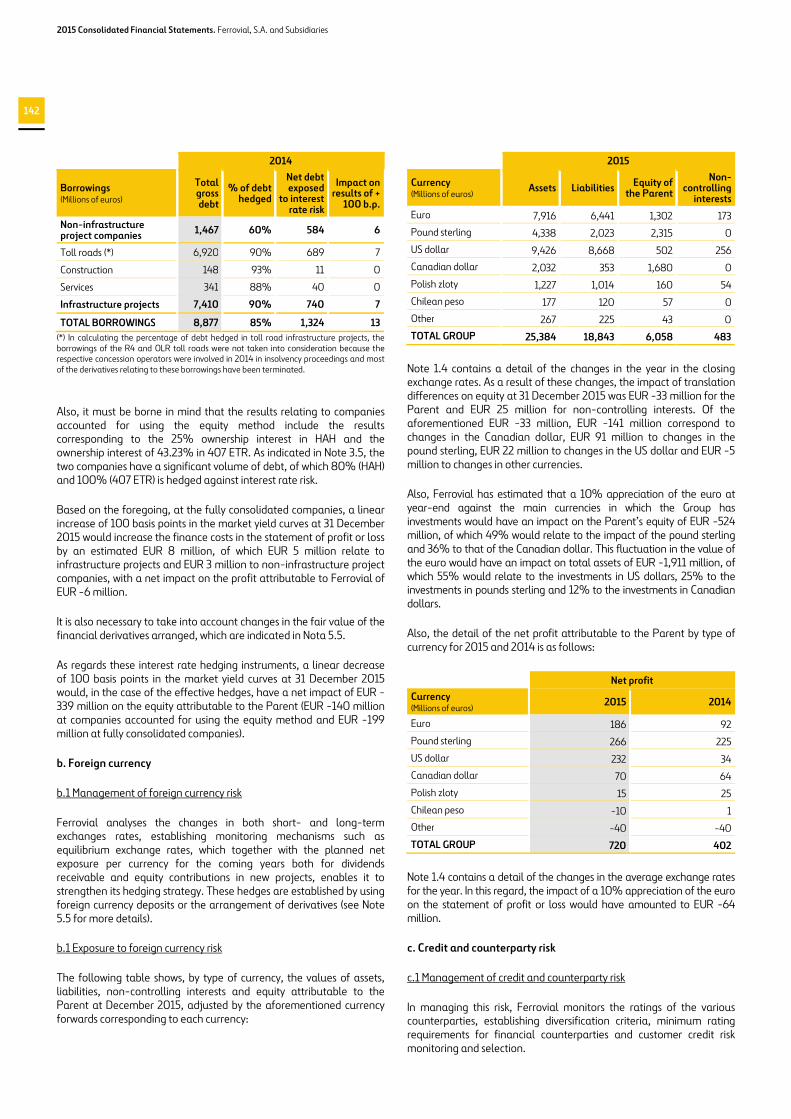
2015 Consolidated Financial Statements. Ferrovial, S.A. and Subsidiaries
142
2014
Borrowings (Millions of euros)
Total gross debt
% of debt hedged
Net debt exposed
to interest rate risk
Impact on results of + 100 b.p.
Non-infrastructure project companies
1,467 60% 584 6
Toll roads (*) 6,920 90% 689 7
Construction 148 93% 11 0
Services 341 88% 40 0
Infrastructure projects 7,410 90% 740 7
TOTAL BORROWINGS 8,877 85% 1,324 13
(*) In calculating the percentage of debt hedged in toll road infrastructure projects, the borrowings of the R4 and OLR toll roads were not taken into consideration because the respective concession operators were involved in 2014 in insolvency proceedings and most of the derivatives relating to these borrowings have been terminated.
Also, it must be borne in mind that the results relating to companies accounted for using the equity method include the results corresponding to the 25% ownership interest in HAH and the ownership interest of 43.23% in 407 ETR. As indicated in Note 3.5, the two companies have a significant volume of debt, of which 80% (HAH) and 100% (407 ETR) is hedged against interest rate risk.
Based on the foregoing, at the fully consolidated companies, a linear increase of 100 basis points in the market yield curves at 31 December 2015 would increase the finance costs in the statement of profit or loss by an estimated EUR 8 million, of which EUR 5 million relate to infrastructure projects and EUR 3 million to non-infrastructure project companies, with a net impact on the profit attributable to Ferrovial of EUR -6 million.
It is also necessary to take into account changes in the fair value of the financial derivatives arranged, which are indicated in Nota 5.5.
As regards these interest rate hedging instruments, a linear decrease of 100 basis points in the market yield curves at 31 December 2015 would, in the case of the effective hedges, have a net impact of EUR -339 million on the equity attributable to the Parent (EUR -140 million at companies accounted for using the equity method and EUR -199 million at fully consolidated companies).
b. Foreign currency
b.1 Management of foreign currency risk
Ferrovial analyses the changes in both short- and long-term exchanges rates, establishing monitoring mechanisms such as equilibrium exchange rates, which together with the planned net exposure per currency for the coming years both for dividends receivable and equity contributions in new projects, enables it to strengthen its hedging strategy. These hedges are established by using foreign currency deposits or the arrangement of derivatives (see Note 5.5 for more details).
b.1 Exposure to foreign currency risk
The following table shows, by type of currency, the values of assets, liabilities, non-controlling interests and equity attributable to the Parent at December 2015, adjusted by the aforementioned currency forwards corresponding to each currency:
2015
Currency (Millions of euros) Assets Liabilities
Equity of the Parent
Non-controlling interests
Euro 7,916 6,441 1,302 173
Pound sterling 4,338 2,023 2,315 0
US dollar 9,426 8,668 502 256
Canadian dollar 2,032 353 1,680 0
Polish zloty 1,227 1,014 160 54
Chilean peso 177 120 57 0
Other 267 225 43 0
TOTAL GROUP 25,384 18,843 6,058 483
Note 1.4 contains a detail of the changes in the year in the closing exchange rates. As a result of these changes, the impact of translation differences on equity at 31 December 2015 was EUR -33 million for the Parent and EUR 25 million for non-controlling interests. Of the aforementioned EUR -33 million, EUR -141 million correspond to changes in the Canadian dollar, EUR 91 million to changes in the pound sterling, EUR 22 million to changes in the US dollar and EUR -5 million to changes in other currencies.
Also, Ferrovial has estimated that a 10% appreciation of the euro at year-end against the main currencies in which the Group has investments would have an impact on the Parent’s equity of EUR -524 million, of which 49% would relate to the impact of the pound sterling and 36% to that of the Canadian dollar. This fluctuation in the value of the euro would have an impact on total assets of EUR -1,911 million, of which 55% would relate to the investments in US dollars, 25% to the investments in pounds sterling and 12% to the investments in Canadian dollars.
Also, the detail of the net profit attributable to the Parent by type of currency for 2015 and 2014 is as follows:
Net profit
Currency (Millions of euros) 2015 2014
Euro 186 92
Pound sterling 266 225
US dollar 232 34
Canadian dollar 70 64
Polish zloty 15 25
Chilean peso -10 1
Other -40 -40
TOTAL GROUP 720 402
Note 1.4 contains a detail of the changes in the average exchange rates for the year. In this regard, the impact of a 10% appreciation of the euro on the statement of profit or loss would have amounted to EUR -64 million.
c. Credit and counterparty risk
c.1 Management of credit and counterparty risk
In managing this risk, Ferrovial monitors the ratings of the various counterparties, establishing diversification criteria, minimum rating requirements for financial counterparties and customer credit risk monitoring and selection.

2015 Consolidated Financial Statements. Ferrovial, S.A. and Subsidiaries
143
c.2 Exposure to credit and counterparty risk
The Group’s main financial assets exposed to credit risk or counterparty risk are as follows:
2015 2014
Change 15/14
Investments in financial assets (1) 991.36 1,132.80 -141.44
Non-current financial assets 2,341.26 2,323.60 17.66
Financial derivatives, net (liability) -267.48 -1,031.50 764.02
Trade and other receivables 2,434.93 2,244.00 190.93 (1) Included in "Cash and Cash Equivalents".
d. Liquidity risk
d.1 Management of liquidity risk
The Group has established the necessary mechanisms that reflect the cash generation and need projections, in order to guarantee solvency, in relation to both short-term collections and payments and obligations to be met at long term.
d.2 Exposure to liquidity risk
Non-infrastructure project companies
At 31 December 2015, cash and cash equivalents amounted to EUR 2,973 million (2014: EUR 3,103 million). Also, at that date undrawn credit lines totalled EUR 1,560 million (2014: EUR 951 million).
Infrastructure projects
At 31 December 2015, total cash and cash equivalents (including short-term restricted cash) amounted to EUR 306 million (2014: EUR 396 million). Also, at that date, undrawn credit lines amounted to EUR 512 million (2014: EUR 706 million), which were arranged mainly to cover committed investment needs.
e. Equity risk
Ferrovial is exposed to the risk relating to the evolution of its share price. This exposure arises specifically in equity swaps used to hedge against risks of appreciation of share-based remuneration schemes, the detail of which is shown in Note 5.5.
Since these swaps are not classified as hedging derivatives, their market value has an impact on profit or loss and, accordingly, a EUR 1 increase/decrease in the Ferrovial share price would have a positive/negative impact of EUR 4 million on the net profit of Ferrovial.
f. Inflation risk
Most of the revenue from infrastructure projects is associated with prices tied directly to inflation. This is the case of the prices of both the toll road concession contracts and the HAH airports accounted for using the equity method.
Therefore, an increase in inflation would increase the value of the assets of this nature.
Unlike the company's assets, from the accounting standpoint the derivatives arranged at HAH the objective of which is to convert fixed-rate borrowings into index-linked debt are measured at fair value through profit or loss, since they are considered to be ineffective derivatives. In this regard, an increase of 100 b.p. throughout the inflation curve would have an effect on the net profit attributable to Ferrovial (in proportion to its percentage of ownership) of EUR -150 million.
Also, in the case of the toll road concession operator Autema, there is a derivative tied to inflation that is deemed to qualify for hedge accounting, in which an increase of 100 b.p. throughout the inflation curve would have an effect on reserves of EUR -110 million.
g. Capital management
The Group aims to achieve a debt-equity ratio that makes it possible to optimise costs while safeguarding its capacity to continue managing its recurring activities and the capacity to continue to grow through new projects in order to create shareholder value.
Ferrovial's objective with regard to financial debt is to maintain a low level of indebtedness, excluding infrastructure project debt, such that it can retain its investment grade credit rating. In order to achieve this target it has established a clear and adequate financial policy in which a relevant metric refers to a maximum ratio, for non-infrastructure projects, of net debt (gross debt less cash) to gross profit from operations plus dividends from projects of 2:1.
At 31 December 2015, the net cash position was positive (assets higher than liabilities) and, therefore, the difference with respect to the maximum debt-equity ratio established is very significant. For the purpose of calculating this ratio, "net debt excluding infrastructure projects" is defined in Note 5.2 and "gross profit from operations plus dividends" is the profit from operations before impairment losses, disposals and depreciation and amortisation of the Group companies other than infrastructure concession operators, plus the dividends received from infrastructure projects.

2015 Consolidated Financial Statements. Ferrovial, S.A. and Subsidiaries
144
5.5. DERIVATIVE FINANCIAL INSTRUMENTS AT FAIR VALUE
a) Breakdown by type of derivative, changes, maturities and main features
The table below includes a detail of the fair values of the derivatives arranged at 31 December 2015 and 2014, as well as the maturities of the notional amounts to which the derivatives relate (maturities of notional amounts are shown as positive figures and already-arranged future increases are presented as negative amounts):
Fair value Notional maturities
Type of instrument (Millions of euros)
Balances at 31/12/15
Balances at 31/12/14
2016 2017 2018 2019 2020 and
subsequent years
TOTAL
ASSET BALANCES 430 400 1,362 -2 -2 -3 311 1,666
Index linked swaps, Toll Roads 355 351 -2 -2 -2 -3 61 51
Interest rate swaps, Corporate 15 17 0 0 0 0 250 250
Equity swaps (*) 43 30 74 0 0 0 0 74
Exchange rate derivatives, Corporate 7 1 694 0 0 0 0 694
Other derivatives 11 0 597 0 0 0 0 597
LIABILITY BALANCES 697 1,431 193 56 50 53 2,177 2,529
Interest rate swaps, Toll Roads 613 1,318 18 17 24 27 1,899 1,984
Exchange rate derivatives, Corporate 0 22 0 0 0 0 0 0
Other derivatives 84 91 175 39 26 26 278 545
NET BALANCES (LIABILITY) -267 -1,031 1,555 54 47 50 2,489 4,195
The cash flows composing the fair value of the derivatives mature as follows:
Fair value Cash flow maturities
Type of instrument (Millions of euros)
Balances at
31/12/15
Balances at
31/12/14 2016 2017 2018 2019
2020 and subsequent
years TOTAL
ASSET BALANCES 430 400 70 12 12 13 323 430
Index linked swaps, Toll Roads 355 351 6 8 10 11 320 355
Interest rate swaps, Corporate 15 17 4 3 3 2 3 15
Equity swaps (*) 43 30 43 0 0 0 0 43
Exchange rate derivatives, Corporate 7 1 7 0 0 0 0 7
Other derivatives 11 0 11 0 0 0 0 11
LIABILITY BALANCES 697 1,431 113 91 82 72 340 697
Interest rate swaps, Toll Roads 613 1,318 85 78 71 63 315 613
Exchange rate derivatives, Corporate 0 22 0 0 0 0 0 0
Other derivatives 84 91 28 12 11 9 25 84
NET BALANCES (LIABILITY) -267 -1,031 -43 -79 -69 -59 -17 -267
(*) The items indicated are the main derivatives arranged by the Group that do not qualify for hedge accounting, as explained in this Note.
Following is a description of the main types of derivatives and of the most significant changes therein in 2015:
Toll Road Division derivatives
Interest rate swaps, Toll Roads
In order to hedge the interest rate risk in toll road infrastructure projects, the concession holders have arranged interest rate hedges on the projects’ debt, establishing a fixed or increasing interest rate for a total notional amount of EUR 1,984 million at 31 December 2015.
Overall, the fair value of these hedges increased from EUR -1,318 million at 31 December 2014 to EUR -613 million in 2015, due largely to the reclassification of the derivatives of Chicago Skyway, Eurolink M3 and Eurolink N4/N6 to assets and liabilities held for sale for EUR 710
million and to the slight rise in long-term interest rates in the eurozone.
In general, since these derivatives are considered to be effective, the changes in their fair value are recognised in reserves, with a positive impact of EUR 67 million (EUR 47 million attributable to the Parent, after tax and non-controlling interests). Also, it should be noted that EUR 244 million were transferred to profit or loss relating to the accumulated reserves corresponding to the derivatives of Autopista SH-130 and Autopista del Sol (EUR 113 million in reserves attributable to the Parent). The hedging relationships of these swaps were interrupted in 2015 as a result of the refinancing processes to which they are subject, in which it is expected that the terms of the new debt arranged are substantially different from those considered in the initial design of the derivatives.
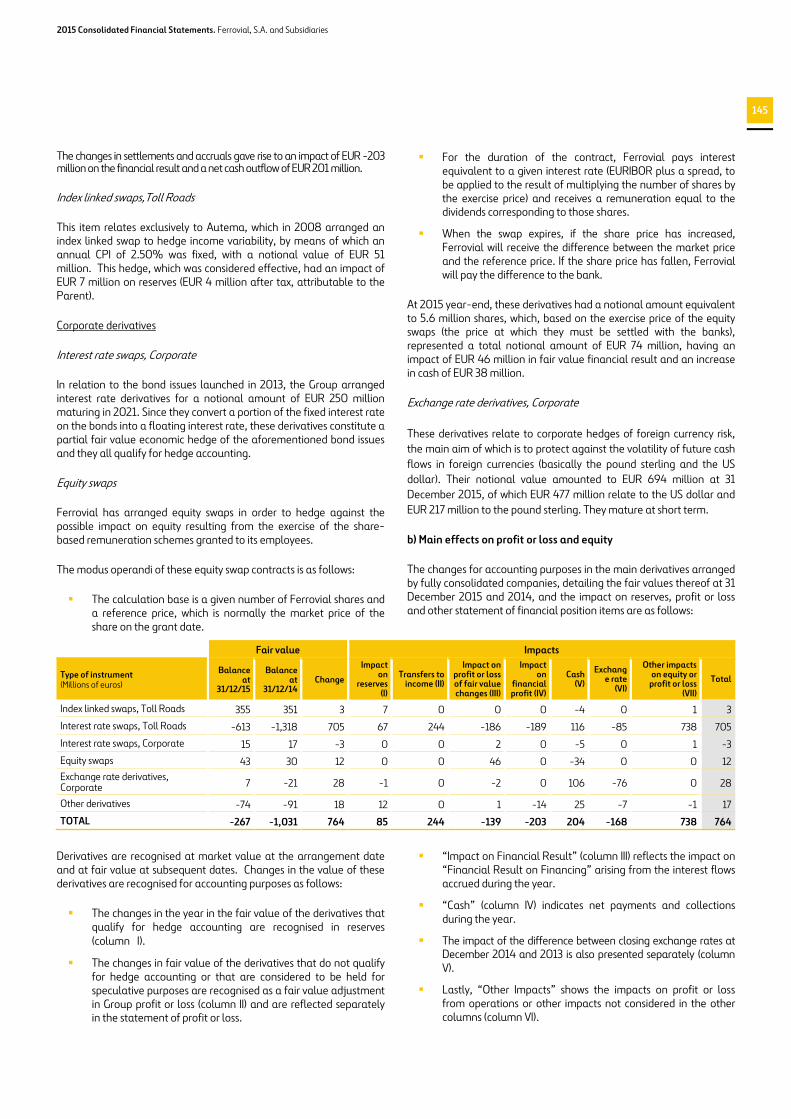
2015 Consolidated Financial Statements. Ferrovial, S.A. and Subsidiaries
145
The changes in settlements and accruals gave rise to an impact of EUR -203 million on the financial result and a net cash outflow of EUR 201 million.
Index linked swaps,Toll Roads
This item relates exclusively to Autema, which in 2008 arranged an index linked swap to hedge income variability, by means of which an annual CPI of 2.50% was fixed, with a notional value of EUR 51 million. This hedge, which was considered effective, had an impact of EUR 7 million on reserves (EUR 4 million after tax, attributable to the Parent).
Corporate derivatives
Interest rate swaps, Corporate
In relation to the bond issues launched in 2013, the Group arranged interest rate derivatives for a notional amount of EUR 250 million maturing in 2021. Since they convert a portion of the fixed interest rate on the bonds into a floating interest rate, these derivatives constitute a partial fair value economic hedge of the aforementioned bond issues and they all qualify for hedge accounting.
Equity swaps
Ferrovial has arranged equity swaps in order to hedge against the possible impact on equity resulting from the exercise of the share-based remuneration schemes granted to its employees.
The modus operandi of these equity swap contracts is as follows:
� The calculation base is a given number of Ferrovial shares and a reference price, which is normally the market price of the share on the grant date.
� For the duration of the contract, Ferrovial pays interest equivalent to a given interest rate (EURIBOR plus a spread, to be applied to the result of multiplying the number of shares by the exercise price) and receives a remuneration equal to the dividends corresponding to those shares.
� When the swap expires, if the share price has increased, Ferrovial will receive the difference between the market price and the reference price. If the share price has fallen, Ferrovial will pay the difference to the bank.
At 2015 year-end, these derivatives had a notional amount equivalent to 5.6 million shares, which, based on the exercise price of the equity swaps (the price at which they must be settled with the banks), represented a total notional amount of EUR 74 million, having an impact of EUR 46 million in fair value financial result and an increase in cash of EUR 38 million.
Exchange rate derivatives, Corporate
These derivatives relate to corporate hedges of foreign currency risk, the main aim of which is to protect against the volatility of future cash flows in foreign currencies (basically the pound sterling and the US dollar). Their notional value amounted to EUR 694 million at 31 December 2015, of which EUR 477 million relate to the US dollar and EUR 217 million to the pound sterling. They mature at short term.
b) Main effects on profit or loss and equity
The changes for accounting purposes in the main derivatives arranged by fully consolidated companies, detailing the fair values thereof at 31 December 2015 and 2014, and the impact on reserves, profit or loss and other statement of financial position items are as follows:
Fair value Impacts
Type of instrument (Millions of euros)
Balance at
31/12/15
Balance at
31/12/14 Change
Impact on
reserves (I)
Transfers to income (II)
Impact on profit or loss of fair value changes (III)
Impact on
financial profit (IV)
Cash (V)
Exchange rate (VI)
Other impacts on equity or profit or loss
(VII)
Total
Index linked swaps, Toll Roads 355 351 3 7 0 0 0 -4 0 1 3
Interest rate swaps, Toll Roads -613 -1,318 705 67 244 -186 -189 116 -85 738 705
Interest rate swaps, Corporate 15 17 -3 0 0 2 0 -5 0 1 -3
Equity swaps 43 30 12 0 0 46 0 -34 0 0 12 Exchange rate derivatives, Corporate 7 -21 28 -1 0 -2 0 106 -76 0 28
Other derivatives -74 -91 18 12 0 1 -14 25 -7 -1 17
TOTAL -267 -1,031 764 85 244 -139 -203 204 -168 738 764
Derivatives are recognised at market value at the arrangement date and at fair value at subsequent dates. Changes in the value of these derivatives are recognised for accounting purposes as follows:
� The changes in the year in the fair value of the derivatives that qualify for hedge accounting are recognised in reserves (column I).
� The changes in fair value of the derivatives that do not qualify for hedge accounting or that are considered to be held for speculative purposes are recognised as a fair value adjustment in Group profit or loss (column II) and are reflected separately in the statement of profit or loss.
� “Impact on Financial Result” (column III) reflects the impact on “Financial Result on Financing” arising from the interest flows accrued during the year.
� “Cash” (column IV) indicates net payments and collections during the year.
� The impact of the difference between closing exchange rates at December 2014 and 2013 is also presented separately (column V).
� Lastly, “Other Impacts” shows the impacts on profit or loss from operations or other impacts not considered in the other columns (column VI).

2015 Consolidated Financial Statements. Ferrovial, S.A. and Subsidiaries
146
c) Derivative measurement methods
All the Group’s derivative financial instruments and other financial instruments carried at fair value are included in LEVEL 2 of the fair value measurement hierarchy, since although they are not quoted on regulated markets, the inputs on which their fair values are based are observable, either directly or indirectly.
Although the fair value measurements are performed by the Company using an internally developed valuation tool, in any event they are compared against the valuations received from the counterparty banks, on a monthly basis.
Equity swaps are measured as the sum of the difference between the market price of the share on the calculation date and the unit settlement price agreed at inception, multiplied by the number of shares under the contract, and the present value of the finance cost agreed upon in the contract.
The other instruments are measured by quantifying the net future cash inflows and outflows, discounted to present value, with the following specific features:
� Interest rate swaps: these future cash flows with floating reference rates are estimated by using current market assessments of the time value of money; and each flow is updated using the market zero-coupon rate in accordance
with the settlement period and currency in question at the measurement date.
� Index linked swaps: the future cash flows are estimated by projecting the future behaviour implicit in the market curves on the measurement date, for both reference interest rates and reference inflation rates. As in the cases described above, the flows are discounted using the discount rates obtained at the measurement date for each flow settlement period and currency.
Lastly, credit risk, which pursuant to IFRS 13 was included in the measurement of derivatives, is estimated as follows:
With regard to the cash flows payable by the banks, as a general rule the credit risk premium applicable to the bank's credit rating is considered.
With regard to the cash flows payable by the Group company itself, if that company has a rating, the credit risk premium attributable to that rating is considered. If the Group company does not have a rating, the company's solvency ratios are analysed and, based on public information on rating methods, a hypothetical rating level is determined and, therefore, the corresponding risk premium. This risk premium could be modified in the future in the event of a substantial change in the company's solvency position.

2015 Consolidated Financial Statements. Ferrovial, S.A. and Subsidiaries
147
SECTION 6: OTHER DISCLOSURES
This section includes other notes required under the applicable legislation.
Of particular note due to its importance is Note 6.5, Contingent liabilities and investment commitments, in which the main lawsuits that affect the Group companies are described (see Note 6.5.1), including most notably in 2015 the evolution of the insolvency proceedings of the R4 and AP36 Ocaña La Roda toll roads, and the guarantees provided (Note 6.5.2), with particular emphasis on the guarantees provided by non-infrastructure project companies on behalf of infrastructure project companies.
The changes in liabilities other than current liabilities and borrowings, such as pension obligations (see Note 6.2) and provisions (see Note 6.3), are also analysed.
6.1. DEFERRED INCOME
The balance of “Deferred Income” totalled EUR 1,088 million at the end of 2015 (2014: EUR 987 million), of which EUR 1,078 million correspond to grants related to assets received from the infrastructure concession grantors, primarily in the Toll Roads Division (EUR 1,056 million) and in the Services Division (EUR 21 million).
The main change in 2015 took place at LBJ Infraestructure Group and NTE Mobility Partner, subsidiaries of Cintra in the US, which received additional grants in 2015 amounting to EUR 94 million and EUR 24 million, respectively, offset by a decrease of EUR 126 million as a result of reclassifying the grants received by the Irish Eurolink Motorway M4-M6 toll road to liabilities held for sale.
There was also an increase of EUR 96 million at the US companies due to the appreciation of the US dollar with respect to the euro.
These grants related to assets are recognised in profit or loss over the periods and in the proportions in which depreciation expense on those assets is recognised. The impact of these grants on cash flows is presented as a reduction of cash flows from investing activities.
6.2. PENSION PLAN DEFICIT
This line item reflects the deficit relating to pension and other employee retirement benefit plans, including both defined benefit and defined contribution plans. The provision recognised in the consolidated statement of financial position at 31 December 2015 amounted to EUR 46 million (31 December 2014: EUR 101 million). Of this amount, EUR 44 million (31 December 2014: EUR 99 million) relate to defined benefit plans of the Amey Group in the UK.
Amey Group defined benefit plans (Millions of euros) 2015 2014
Liability recognised in consolidated statement of financial position
Obligation at end of year 999 1,003
Fair value of plan assets at end of year 955 904
AMEY GROUP PENSION PLAN DEFICIT 44 99
The Amey Group has nine defined benefit plans covering a total of 6,562 employees and ten defined contribution plans covering 13,201 employees. The most significant changes in 2015 that led to a EUR 55 million improvement in the deficit were as follows:
� An impact of EUR +47 million arising from actuarial gains and losses which decreased the pension plan deficit (a decrease in the related liability) recognised in equity: In relation to the
obligations, there was an improvement in the actuarial assumptions used due mainly to the increase in the expected return on the assets and the discount rate. More details are provided in section a) of this Note.
� Contributions of EUR +24 million made by the Company to the pension plans, which reduced the pension plan deficit (a decrease in the related liability). The ordinary contributions amounted to EUR 5 million, while the extraordinary contributions aimed at improving the pension plan deficit totalled EUR 19 million.
� A negative impact of EUR -10 million on profit or loss, which increased the pension plan deficit (an increase in the related liability), as detailed in section b) of this Note.
� A negative impact of EUR -6 million due to the exchange rate effect, giving rise to an increase in the deficit.
Also, although they did not have any effect on the pension plan deficit, there were curtailments and settlements as a result of the payment of obligations to employees, which therefore reduced the related obligation at year-end and gave rise to a reduction of the same amount in the plan assets. In 2015 these curtailments and settlements totalled EUR 35 million.
a) Actuarial gains and losses recognised in reserves
The effects of changes in the actuarial assumptions relating to the defined benefit pension plans of the Amey Group are recognised directly in equity and are summarised (before taxes) in the following table:
Amey Group defined benefit plans (Millions of euros) 2015 2014
Actuarial gains/losses on obligations -66 -69 Actuarial gains/losses on plan assets due to the difference between the expected return at the beginning of the year and the actual return
18 56
IMPACT ON EQUITY RECOGNISED -47 -13
The main actuarial assumptions used to calculate the defined benefit pension plan obligations are summarised as follows:
Amey Group defined benefit plans Main assumptions 2015 2014
Salary increase 2.40% 2.40%
Discount rate 3.90% 3.60%
Expected inflation rate 3.15% 3.10%
Expected return on assets 3.90% 3.60%
Mortality (years) 86-93 86-91

2015 Consolidated Financial Statements. Ferrovial, S.A. and Subsidiaries
148
The mortality assumptions used by the Amey Group to calculate its pension obligations are based on the actuarial mortality tables, with an estimated life expectancy of between 86 and 93 years.
The defined benefit pension plan assets stated at their fair value for 2015 and 2014 are summarised as follows:
Amey Group defined benefit plans (Millions of euros) 2015 2014
Plan assets (fair value)
Equity instruments 370 317
Debt instruments 511 358
Buildings 61 56
Cash and other 13 173
TOTAL PLAN ASSETS 955 904
b) Impact on profit or loss
The detail of the impact of the defined benefit pension plans on profit or loss is as follows:
Amey Group defined benefit plans (Millions of euros) 2015 2014
Impact on profit or loss before tax
Current service cost -5 -6 Interest cost -38 -39 Expected return on plan assets 35 35 Other -1 14
TOTAL AMOUNT RECOGNISED IN PROFIT OR LOSS -10 3
c) Complete actuarial reviews
The Amey Group performs complete actuarial valuations every three years, depending on the plan, having completed the most recent reviews of all the plans in 2013 and 2014.
Based on these reviews, the extraordinary contributions to be made in the coming years have been reduced.
For 2016 the ordinary contributions agreed upon with the trustees amount to EUR 6 million. Also, the extraordinary contributions will be reduced from EUR 19 million in 2015 to EUR 18 million in 2016.
d) Sensitivity analysis
Set forth below is a sensitivity analysis showing the impact on profit or loss and on equity of a change of 50 basis points in the discount rate.
Annual impact on profit
or loss Annual impact on
equity
Amey Group defined benefit plans Sensitivity analysis discount rate (+ / - 50 b.p.)
Before tax After tax Before tax After tax
+ 50 b.p. 4 3 83 66 - 50 b.p. -4 -3 -95 -76
6.3. PROVISIONS
The provisions recognised by the consolidated Group are intended to cover the risks arising from its various operating activities. They are recognised using the best estimates of the existing risks and uncertainties and their possible evolution.
This Note provides a breakdown of all the items composing “Long-Term Provisions” and “Operating Provisions and Allowances” in liabilities in the consolidated statement of financial position. In addition to these items, there are other impairment losses and allowances that are presented as a reduction of certain asset line items and which are disclosed in the Notes relating to those specific assets.
The changes in the long- and short-term provisions presented separately in liabilities in the consolidated statement of financial position were as follows:
Provision for
landfills
Provision for compulsory purchases
Provision for replacements and upgrades pursuant to
IFRIC 12
Provisions for
litigation and taxes
Provisions for other
long-term risks
Total long-term
provisions
Short-term
provisions Total
Balance at 1 January 2015 100 497 170 451 162 1,378 475 1,853
Changes in the scope of consolidation and reclassifications to held for sale
6 -459 -95 0 0 -547 2 -545
Charges for the year: 10 0 39 45 77 171 237 408
Profit from operations 7 0 32 41 77 157 237 395
Financial result 3 0 7 3 0 13 0 13
Reversals: -3 0 -15 -70 -32 -120 -121 -241
Profit from operations -3 0 -12 -58 -32 -105 -121 -225
Financial result 0 0 -3 0 0 -3 0 -3
Income tax 0 0 0 -12 0 -12 0 -12
Increase/(Decrease) charged/(credited) to concession infrastructure
0 -8 0 0 0 -8 0 -8
Transfers and other 1 0 2 -11 -31 -44 22 -23
Exchange differences 0 0 3 0 3 7 7 14
Balance at 31 December 2015 113 30 99 416 179 837 622 1,459
Following is a description of the nature and amounts of the main provisions recognised:

2015 Consolidated Financial Statements. Ferrovial, S.A. and Subsidiaries
149
Provision for landfills
“Provision for Landfills” contains the estimated cost of landfill closure and post-closure activities relating to the landfills operated by the Ferrovial Services business in Spain and UK. The provision is calculated based on a technical estimate of the consumption to date of the total capacity of the respective landfills.
Provision for compulsory purchases
The provision for compulsory purchases recognised by the Spanish toll roads, totalling EUR 30 million (31 December 2014: EUR 497 million). The decrease in this heading was due primarily to the exclusion from consolidation of the R4 Madrid Ocaña toll road (31 December 2014: EUR 452 million) and the AP36 Ocaña La Roda toll road (31 December 2014: EUR 7 million). Also, the provision for compulsory purchases recognised by Autopista del Sol decreased by EUR 8 million due to the updating of the estimates made.
Provision for replacements and upgrades pursuant to IFRIC 12
This line item includes the provisions for investments in replacements established by IFRIC 12 (see Note 2.5.2). The balance of this heading decreased by EUR 70 million from EUR 170 million at December 2014 to EUR 99 million at 31 December 2015. This decrease was due primarily to the exclusion from consolidation of the R4 Madrid Ocaña (EUR 31 million) and AP36 Ocaña La Roda (EUR 22 million) toll roads; as well as the reclassification to held for sale of the Chicago Skyway toll road (EUR 34 million) and the change in the Autostrada do Algarve toll road to the financial asset model (EUR 8 million).
Provisions for litigation and taxes
This line item includes:
� Provisions to cover the possible risks resulting from litigation in progress, amounting to EUR 170 million (31 December 2014: EUR 175 million).
� Provisions for taxes (EUR 246 million; 31 December 2014: EUR 277 million) relating to local or central government duties, income taxes and other taxes due to the varying interpretations that can be made of the tax legislation in the various countries in which the Group operates.
Provisions for other long-term risks
This line item includes the provisions recognised to cover certain long-term risks other than those attributable to litigation or taxes, such as third-party liability resulting from the performance of contracts, guarantees provided with enforcement risk and other similar items, which amounted to EUR 179 million at 31 December 2015 (31 December 2014: EUR 162 million).
Short-term provisions
These relate mainly to the Construction Division, consisting of provisions for construction work completion, site removals and losses amounting to EUR 493 million (2014: EUR 416 million).
6.4. OTHER NON-CURRENT LIABILITIES
“Non-Current Liabilities - Other Payables” includes mainly the following:
� The participating loans granted by the State to several infrastructure project concession operators amounting to EUR 153 million (31 December 2014: EUR 151 million), of which EUR 103 million relate to the Toll Roads Division, EUR 39 million to the Services Division and EUR 11 million to the Construction Division.
� Long-term deposits and guarantees amounting to EUR 8 million (31 December 2014: EUR 22 million). The change in the balance in 2015 was due mainly to the exclusion from consolidation of the Madrid Sur and Ocaña La Roda toll roads, which gave rise to a decrease of EUR 19 million.
� Long-term trade payables of the Services Division in the UK, amounting to EUR 11 million (31 December 2014: EUR 11 million).
6.5. CONTINGENT LIABILITIES, CONTINGENT ASSETS, OBLIGATIONS AND COMMITMENTS
6.5.1. Litigation
In carrying on its activities the Group is subject to possible contingent liabilities of varying kinds. These contingent liabilities lead to lawsuits or litigation in relation to which a provision is recognised based on the best estimate of the foreseeable disbursements required to settle the obligation. Therefore, it is not expected that any significant liabilities will arise, other than those for which provisions have already been recognised, that might represent a material adverse effect.
The detail of the most significant litigation, in terms of amount, in the Group's various business divisions is as follows:
a) Litigation in relation to the Toll Road business
Status of the insolvency proceedings of the AP 36 Ocaña-La Roda and Radial 4 Madrid-Ocaña toll roads
Main events in 2015
a) AP 36 Ocaña-La Roda toll road
In 2015 significant developments took place in the insolvency proceedings initiated in relation to the concession operator and the holder of the shares of the concession operator. Specifically:
On 23 January Spanish government lawyers representing Seittsa, entity fully owned by Spanish Government, submitted an arrangement proposal to the Commercial Court, which included the following main matters:
� Establishing a global proposal with the aim of providing a solution to all the toll road concession operators which were involved in the same situation. In fact, the validity of the proposal was subject to it being accepted by all the concession operators, which include not only the AP 36 toll road, but also the concession operator of the Radial 4 Madrid-Ocaña toll road.
� Seittsa would become the concession operator of all the administrative concessions relating to the affected toll roads
� Seittsa would assume these concession operators’ debts to third parties although with certain debt reductions made on the nominal amount thereof. Specifically, a write-off of all the debt payable to shareholders and a reduction of 50.99% of the debt payable to banks, as well as other terms and conditions relating to the deferral of the related payments were proposed.

2015 Consolidated Financial Statements. Ferrovial, S.A. and Subsidiaries
150
In practice, the solution proposed would have resulted in the shareholders not recovering any of the capital invested in the projects.
On 24 February 2015 the competent commercial court dismissed in a court order the arrangement proposal submitted by the Spanish government lawyers and approved the following measures:
� Not to admit the arrangement proposals for consideration due to irremediable defects.
� To render null and void the arrangement phase in the insolvency proceeding and open the liquidation phase, thereby cancelling the creditors’ meeting that was scheduled for 4 March 2015.
� To suspend the management disposal powers of the concession operators and their sole shareholder, thereby transferring the management and administration of both companies to the insolvency managers as a result of the removal of the Board of Directors.
The Spanish government lawyers filed an appeal against the aforementioned court order, which was admitted for consideration by the commercial court on 31 July 2015 (notified on 4 September). In the aforementioned appeal, the Spanish government lawyers refuted the arguments of the court and insisted upon the application of the arrangement proposal of Seittsa as the only solution to the situation of the affected companies.
On 21 September, certain of the affected creditor banks submitted their respondent's notice against the Spanish government lawyers' appeal. In the respondent's notice they alleged that the viability plan upon which Seittsa's proposal was based was unachievable and that the only viable alternative was the liquidation of the companies through payment of the Governmental Liability ("Responsabilidad Patrimonial de la Administración -RPA-") by the Spanish State.
At the date of preparation of these consolidated financial statements, the Madrid Provincial Appellate Court had not handed down a decision on the aforementioned appeal.
b) Radial 4 toll road
Unlike the case of the AP 36 toll road, the status of the insolvency proceedings relating to the Radial 4 toll road is quite different as they are at the stage where preparation of the list of creditors is under discussion and the claims relating to the company are still being determined in the initial phase of the insolvency proceedings. This delay is justified in part because of the complexity of the compulsory purchase process in this case, compared to the AP 36 toll road, and because of the prudence of the competent court in advancing with the proceeding while it awaits a definitive solution becoming clear in similar proceedings regarding the privileged nature of the loans granted by the banks.
However, despite no significant progress being made in this proceeding, in 2015 Ferrovial was informed, by way of the AP 36 toll road proceeding, of the government's ultimate position reflected in the arrangement proposal of Seittsa, and the position of certain creditor banks in various projects, in order to prevent the signing of the arrangement proposal and instead enter in a liquidation process by means of the enforcement of the RPA.
The current situation of both projects and the implications on the obligation to include them in the Group's consolidated financial statements
� Status of the projects
From an economic standpoint and on the basis of the information provided to us in 2015, we can conclude that currently there are only two possible outcomes of the insolvency proceedings; either the government's proposal is successful by means of the arrangement proposed by Seittsa, a scenario in which the shareholders would not recover any of their investment, or the position of certain banks succeeds, which would result in the liquidation of the concession operators by means of the RPA mechanism, a scenario in which the shareholders would not recover the investment made since the sum of the amount of the RPA guaranteed together with the other realisable assets under the concession arrangement is, in both cases, less than the debts of the companies to the creditors and, accordingly, there would be no remainder for the shareholders. Specifically, in the case of the Radial 4 toll road the RPA amounts to EUR 700 million and the other realisable assets amount to EUR 13 million, which would give rise to a total realisable value of EUR 713 million compared to a total debt of EUR 1,273 million that includes mainly the nominal value of borrowings amounting to EUR 654 million and EUR 438 million of outstanding debt related to the compulsory purchases performed. Also, in the case of the AP 36 toll road, the realisable assets amount to EUR 464 million, which include mainly EUR 449 million related to the RPA. Total debt amounts to EUR 604 million, the main component of which is financial debt (a nominal amount of EUR 585 million).
Furthermore, neither are there any outstanding payment obligations for the shareholders besides the amounts already paid and the only additional guarantee for the capital invested is the guarantee relating to the R4 toll road amounting to EUR 14 million, which has been correctly provisioned and, therefore, it could be concluded that currently the shareholders of both projects are not exposed to possible additional profits which might arise from the resolution of the insolvency proceedings or additional losses other than the capital and the guarantees for which provisions have been recognised.
� Implications on the obligation to include both infrastructure projects in the consolidated financial statements
IFRS 10 defines the existence of control for the purposes of consolidating the financial statements of an investee in the consolidated financial statements. IFRS 10.5 provides for three conditions that must all be met in order to be able to conclude that there is a relationship of control and, therefore, an obligation to consolidate the investee. These three conditions are as follows:
1-Power over the investee, which involves the ability to appoint the majority of the entity's governing body or controlling how decisions are made in another way.
2-Exposure to variable returns from its involvement with the investee.
3-The ability to use the aforementioned power over the investee to affect the amount of the investor’s returns.
If any of the three conditions are not met, there is no obligation to consolidate the investee.
In light of the preceding analysis, it can be concluded that in both cases, and following the events of 2015 (see foregoing sections) the two infrastructure projects do not satisfy conditions 2 and 3 above, as there is no real exposure to variable returns from the involvement with the investee (the two solutions would not affect the exposure of the shareholders' capital) and also there is no real ability to use the aforementioned power over the investee to affect the amount of the investor’s returns.

2015 Consolidated Financial Statements. Ferrovial, S.A. and Subsidiaries
151
With respect to condition 1, in the case of the AP 36 toll road the circumstance giving rise to deconsolidation is clearly met because in 2015 the Board of Directors was dismissed and the insolvency managers were appointed as the only directors in their capacity as liquidators, and in the case of the R4 toll road, although the directors appointed by the shareholders are maintained formally in their office, their decision-making authority is subject to severe and enduring restrictions as the insolvency managers have to authorise or agree to any action of the directors, whose capacity is also limited due to the pledge to the banks of the concession operator's shares, as such pledge requires the consent of the banks if the directors were to make decisions which might affect the guarantee.
On the basis of the foregoing, considering that there are no guarantees or lawsuits that have not been provided for in relation to these projects, and as indicated in Note 1.1.2 to these consolidated financial statements, control over these infrastructure projects has been deemed to have been lost and both have been deconsolidated.
c) Autopista Terrasa Manresa (Autema):
As indicated in Note 34, Events after the reporting period, to the consolidated financial statements for 2014, in January 2015 the Catalonia Autonomous Community Government notified Autema of its intention to change the concession regime of the project established under Decree 137/1999 from a regime under which the Catalonia Autonomous Community Government undertook to pay the concession operator the difference between the tolls collected and the operating surplus established in the Economic and Financial Plan to a system whereby the remuneration earned by the concession operator will depend on the number of the infrastructure's users, with the Catalonia Autonomous Community Government subsidising a portion of the toll paid by the users. On 14 July the Catalonia Autonomous Community Government officially published Decree 161/2015 which included the amendment to the toll road concession arrangement. The company considers that there are sound arguments to conclude that the Catalonia Autonomous Community Government, on issuing Decree 121/2015, clearly exceeded the limits of the power to amend the arrangements. Accordingly, the company filed an appeal against the aforementioned Decree at the High Court of Catalonia.
As a result of the amendment to the concession regime and taking into consideration the solid legal position against this amendment, classification of this concession as a financial asset has been maintained. However, the test for impairment on goodwill has been revised and an impairment loss of EUR 55 million was recognised on the basis of the assumptions described in Note 3.1.2.
d) M-203 toll road:
On 24 April 2014, the concession operator filed a claim at the Madrid High Court requesting the termination of the concession arrangement due to a breach by the grantor and the annulment of the penalties imposed on the concession operator. Following the submission of the defence by the Autonomous Community Government of Madrid, and following the submission of evidence, the lawsuit proceedings were concluded awaiting judgment. On 12 February 2015 a judgment was received upholding in full the appeal for judicial review filed, i.e. ruling in favour of the termination of the concession arrangement requested by the concession operator and rendering null and void the order imposing penalties handed down on 6 August 2013. A cassation appeal has been filed by the Autonomous Community Government of Madrid against this judgment.
At 31 December 2015, the carrying amount of this asset was EUR 46 million, net of an impairment loss of EUR 16 million. The aforementioned carrying amount is the amount that the Company considers to be recoverable from the Government adjusted for the risk of enforcement of certain guarantees provided in relation to this project (see Note 6.5.2).
e) I-77 toll road, North Carolina (US):
I-77 Mobility Partners LLC and the North Carolina Department of Transportation (“NCDOT”) are subject to a joint lawsuit in a proceeding which seeks to annul the comprehensive agreement entered into by I-77 Mobility Partners LLC and NCDOT relating to an access toll road to Charlotte under a managed-lane regime. The claims of the claimants were dismissed by the judge on 8 January 2016. The period in which the claimants can file an appeal is currently open. If this appeal succeeds the impact would be to annul the concession arrangement currently granted to I-77, which would give rise to a right to indemnification for any damage and losses for the concession operator. The investment in this infrastructure project in which an ownership interest of 50.1% is held is EUR 2 million at 31 December 2015.
b) Litigation relating to the Construction business
The Group's Construction Division is involved in various lawsuits relating primarily to possible defects in the construction of completed projects and claims for third-party liability.
The provisions recognised in relation to these risks at 31 December 2015 totalled EUR 161 million (2014: EUR 163 million) and relate to a total of approximately 148 lawsuits. The most significant litigation, in terms of amount, in this business area is as follows:
o Muelle del Prat: this corresponds to a claim relating to the construction project for the new container terminal at the Port of Barcelona. The work was performed by Ferrovial Agroman as part of an unincorporated temporary joint venture (UTE) with other companies. The claim -for an amount of EUR 97 million- was lodged by the Port of Barcelona in September 2011 against all the companies involved in the performance of the project and arose as a result of the damage caused by an accident during construction work. A judgment was handed down in 2013 partially upholding the claim filed by the customer, ordering the defendants jointly and severally to pay EUR 20.9 million plus interest. In the first six months of 2014 the insurance companies partially covered the payment of the aforementioned judgment. An appeal was filed against the uncovered portion by the members of the unincorporated temporary joint venture, but at 2015 year-end no judgment had been handed down in this connection.
o Arbitration in relation to the construction project for Warsaw airport: this corresponds to a claim filed against the UTE made up of Ferrovial Agroman and Budimex in relation to the termination of the contract to construct Terminal 2 of Warsaw Airport. In 2007 the customer executed the guarantee provided amounting to EUR 13.5 million and filed a claim against the construction joint venture for a total of EUR 67 million. In turn, the construction joint venture filed claims against the customer for the unlawful execution of the guarantee and for uncollected amounts totalling EUR 54.5 million. In September 2012, after the favourable award of the Arbitration Court (confirmed in 2013 by the Supreme Court), the customer returned the executed guarantee and paid the interest accrued from when the

2015 Consolidated Financial Statements. Ferrovial, S.A. and Subsidiaries
152
guarantee was executed. The Arbitration Court has not yet handed down an award on the core issue.
c) Litigation relating to the Services business
With respect to the Services business in the UK, the main litigation in 2015 relates to the agreement entered into by Amey and Birmingham City Council for the refurbishment and maintenance of various infrastructures over a period of 25 years. With respect to the aforementioned litigation, on 9 July 2015 the first decision of an adjudicator was handed down in the dispute resolution process (adjudication) provided for in the agreement, which declared that the scope of the works in the initial investment phase should have been much broader than that undertaken and that the parties should initiate a process to analyse, determine and quantify the additional works to be performed. On 18 August Amey filed an appeal against this decision as it considered that there were solid legal grounds to substantiate that the initial decision was incorrect. A decision on the appeal is expected to be handed down in the first half of 2016. At the end of the year it is considered that the risks relating to the dispute have been sufficiently covered in these consolidated financial statements.
With respect to the Services business in the UK, the process to settle the Services contract with Cumbria County Council (CCC) should be also noted. As a result of the termination of the contract in 2012, Amey claimed GBP 27.2 million from the customer and, in answer to the claim, CCC filed a counterclaim for GBP 22.4 million. In November 2013, Amey instigated a court proceeding in this connection which will foreseeably be resolved in 2016. The total value of Amey’s claim is GBP 27 million and there is a counterclaim from CCC amounting to GBP 19 million.
With respect to the Services business in Spain, the main lawsuit in which the Company was involved at 31 December 2015 related to a resolution of the Spanish National Market and Competition Commission issued on 15 January 2015 imposing a penalty on Cespa Group companies and Cespa, G.R. and other companies from the waste management and urban cleaning industry for participating in a market share agreement. In particular, the penalty imposed on Cespa, S.A. and Cespa, G.R. amounted to EUR 13.6 million. The National Appellate Court had not handed down a judgment at 31 December 2015 in connection with the appeal filed by the Group on 11 March 2015 against the enforcement proceedings of the Spanish National Markets and Competition Commission. In the opinion of the company's legal advisers, there are robust arguments to challenge the judgment and, accordingly, on the basis of such arguments, the Group decided not to recognise any type of provision in this connection.
d) Tax litigation
As indicated in Note 6.3. the Group companies recognise provisions for taxes due to the varying interpretations that can be made of the tax legislation in the different countries in which the Group operates.
e) Other litigation
In addition to the litigation discussed above, of particular note are certain claims that have been filed by Promociones Habitat, S.A. in relation to the guarantees provided under the agreement for the purchase of Ferrovial Inmobiliaria, S.A. These claims are currently pending resolution or payment and a provision for the amount thereof has been duly recognised in the financial statements.
6.5.2. Guarantees
a) Bank guarantees and performance bonds issued by insurance companies and sureties
In carrying on its activities the Group is subject to possible contingent liabilities -uncertain by nature- relating to the liability arising from the performance of the various contracts that constitute the activity of its business divisions.
In order to cover the aforementioned liability, the Group has provided bank guarantees and performance bonds issued by insurance companies and sureties. At 31 December 2015, the balance provided amounted to EUR 4,827 million (2014: EUR 4,620 million).
The following table contains a breakdown by business area.
(Millions of Euros) 2015 2014
Construction 3,106 3,074 Toll roads 290 177 Services 925 994 Airports 8 28 Other 499 348 TOTAL 4,827 4,620
The most significant items are the guarantees relating to Construction (EUR 3,106 million) and Services (EUR 925 million), which cover the liability of correct performance in construction or services contracts involving Group companies. The beneficiaries of these guarantees are the customers under the contracts, mainly public authorities, private customers and investees holding infrastructure projects.
It should be noted that, in certain cases, these liabilities are not covered by bank guarantees or performance bonds issued by insurance companies or sureties, but by guarantees granted by Group companies different from the ones that perform the contract. Moreover, a portion of these risks is covered by insurance policies such as third party liability or construction defect insurance policies.
Finally, of the total amount of the Group's bank guarantees listed in the above table, EUR 392 million secure its commitments to invest in the capital of infrastructure projects, as mentioned in Note 6.5.3.
b) Guarantees provided by Group companies to other companies in the Group
As mentioned previously, in general there are guarantees provided among Group companies to cover third-party liability claims arising from contractual, commercial or financial relationships.
Although these guarantees do not have an effect on the consolidated Group, there are guarantees provided by non-infrastructure project companies to infrastructure project companies (see Note 1.1.2.) that, due to the classification of project borrowings as being without recourse, are worth to be mentioned (see Note b.1. on Contingent Capital Guarantees).
Other noteworthy guarantees have also been provided to companies accounted for using the equity method (see Note b.2.).
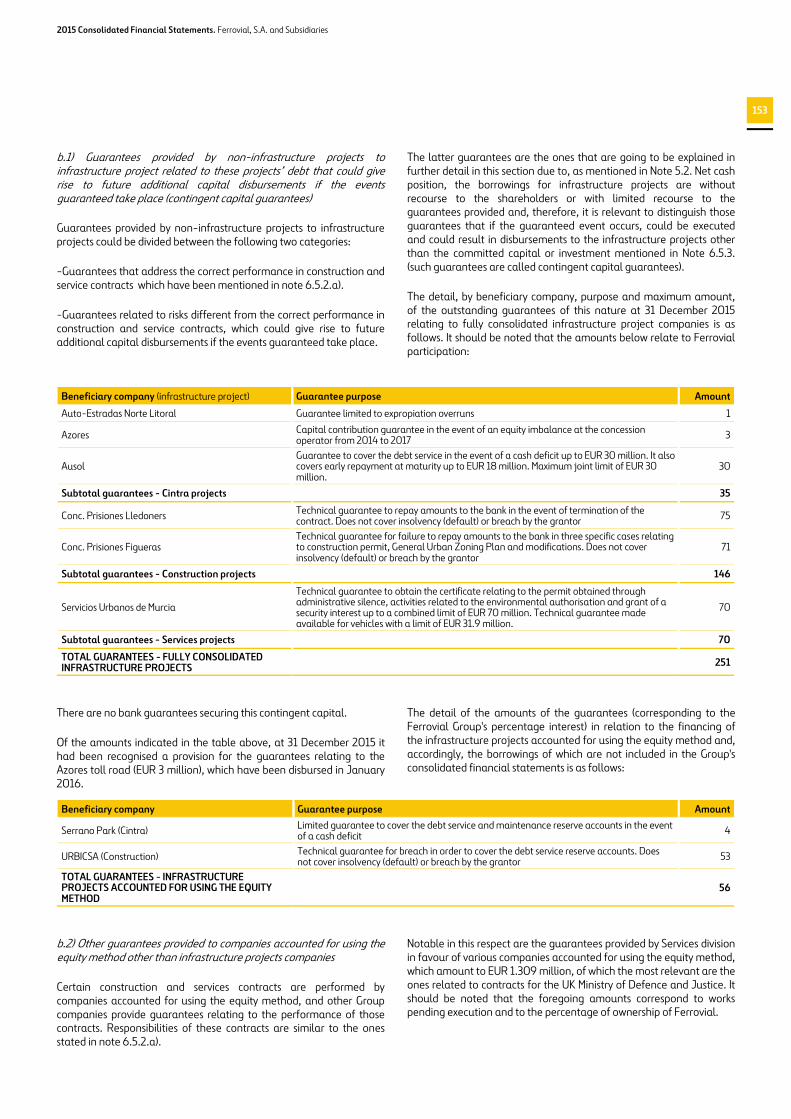
2015 Consolidated Financial Statements. Ferrovial, S.A. and Subsidiaries
153
b.1) Guarantees provided by non-infrastructure projects to infrastructure project related to these projects’ debt that could give rise to future additional capital disbursements if the events guaranteed take place (contingent capital guarantees)
Guarantees provided by non-infrastructure projects to infrastructure projects could be divided between the following two categories:
-Guarantees that address the correct performance in construction and service contracts which have been mentioned in note 6.5.2.a).
-Guarantees related to risks different from the correct performance in construction and service contracts, which could give rise to future additional capital disbursements if the events guaranteed take place.
The latter guarantees are the ones that are going to be explained in further detail in this section due to, as mentioned in Note 5.2. Net cash position, the borrowings for infrastructure projects are without recourse to the shareholders or with limited recourse to the guarantees provided and, therefore, it is relevant to distinguish those guarantees that if the guaranteed event occurs, could be executed and could result in disbursements to the infrastructure projects other than the committed capital or investment mentioned in Note 6.5.3. (such guarantees are called contingent capital guarantees).
The detail, by beneficiary company, purpose and maximum amount, of the outstanding guarantees of this nature at 31 December 2015 relating to fully consolidated infrastructure project companies is as follows. It should be noted that the amounts below relate to Ferrovial participation:
Beneficiary company (infrastructure project) Guarantee purpose Amount
Auto-Estradas Norte Litoral Guarantee limited to expropiation overruns 1
Azores Capital contribution guarantee in the event of an equity imbalance at the concession operator from 2014 to 2017 3
Ausol Guarantee to cover the debt service in the event of a cash deficit up to EUR 30 million. It also covers early repayment at maturity up to EUR 18 million. Maximum joint limit of EUR 30 million.
30
Subtotal guarantees - Cintra projects 35
Conc. Prisiones Lledoners Technical guarantee to repay amounts to the bank in the event of termination of the contract. Does not cover insolvency (default) or breach by the grantor 75
Conc. Prisiones Figueras Technical guarantee for failure to repay amounts to the bank in three specific cases relating to construction permit, General Urban Zoning Plan and modifications. Does not cover insolvency (default) or breach by the grantor
71
Subtotal guarantees - Construction projects 146
Servicios Urbanos de Murcia
Technical guarantee to obtain the certificate relating to the permit obtained through administrative silence, activities related to the environmental authorisation and grant of a security interest up to a combined limit of EUR 70 million. Technical guarantee made available for vehicles with a limit of EUR 31.9 million.
70
Subtotal guarantees - Services projects 70
TOTAL GUARANTEES - FULLY CONSOLIDATED INFRASTRUCTURE PROJECTS 251
There are no bank guarantees securing this contingent capital.
Of the amounts indicated in the table above, at 31 December 2015 it had been recognised a provision for the guarantees relating to the Azores toll road (EUR 3 million), which have been disbursed in January 2016.
The detail of the amounts of the guarantees (corresponding to the Ferrovial Group's percentage interest) in relation to the financing of the infrastructure projects accounted for using the equity method and, accordingly, the borrowings of which are not included in the Group's consolidated financial statements is as follows:
Beneficiary company Guarantee purpose Amount
Serrano Park (Cintra) Limited guarantee to cover the debt service and maintenance reserve accounts in the event of a cash deficit 4
URBICSA (Construction) Technical guarantee for breach in order to cover the debt service reserve accounts. Does not cover insolvency (default) or breach by the grantor 53
TOTAL GUARANTEES - INFRASTRUCTURE PROJECTS ACCOUNTED FOR USING THE EQUITY METHOD
56
b.2) Other guarantees provided to companies accounted for using the equity method other than infrastructure projects companies
Certain construction and services contracts are performed by companies accounted for using the equity method, and other Group companies provide guarantees relating to the performance of those contracts. Responsibilities of these contracts are similar to the ones stated in note 6.5.2.a).
Notable in this respect are the guarantees provided by Services division in favour of various companies accounted for using the equity method, which amount to EUR 1.309 million, of which the most relevant are the ones related to contracts for the UK Ministry of Defence and Justice. It should be noted that the foregoing amounts correspond to works pending execution and to the percentage of ownership of Ferrovial.

2015 Consolidated Financial Statements. Ferrovial, S.A. and Subsidiaries
154
c) Assets pledged as collateral
The assets pledged as collateral are described in the notes as follows:
� Pledges of property, plant and equipment, see Note 3.4.
� Pledges of deposits or restricted cash, see Note 5.2.
d) Guarantees received from third parties
At 31 December 2015, Ferrovial had received guarantees from third parties totalling EUR 860 million, mainly in the Construction Division in relation to the fulfilment of certain rights held mostly by the Ferrovial Agroman companies in the United States (EUR 661 million), the Budimex Group (EUR 83 million) and the other construction companies (EUR 106 million).
6.5.3. Commitments
As described in Note 1.1, the infrastructure projects carried out by the Group are performed through long-term contracts where the concession operator is a company in which the Group has interests, either alone or together with other partners, and the borrowings necessary for financing the project are allocated to the project itself, without recourse to the shareholders or with recourse limited to the guarantees provided, under the terms set forth in Note 5.2. From the management viewpoint, therefore, Ferrovial takes into account only the investment commitments relating to the capital of the projects, since the investment in the assets is financed by the borrowings of the projects themselves.
a) Investment commitments
The investment commitments of the Group in relation to the capital of its projects are as follows:
(Millions of Euros) 2016 2017 2018 2019 2020 2021 and
subsequent years
TOTAL
Investments in fully consolidated infrastructure projects
103 66 119 0 0 21 309
Toll roads 84 64 118 0 0 21 287 Services 18 0 1 0 0 0 18
Construction 1 2 0 0 0 0 3 Investments in infrastructure projects accounted for using the equity method
75 28 38 0 10 0 152
Toll roads 49 21 0 0 10 0 81
Services 26 7 38 0 0 0 71 Total investments infrastructure projects
178 94 157 0 10 21 460
At 31 December 2015, the total investment commitments amounted to EUR 460 million (2014: EUR 555 million). The decrease in investment commitments is related to the disbursements in 2015 related to toll road projects in United States and realized investments in the Services Division.
As indicated in 6.5.2.-a), a portion of these commitments, amounting to EUR 392 million, are secured by bank guarantees. Also, the guarantees mentioned in Note b-.1) include EUR 37 million relating to contingent capital, payment of which is considered probable.
It should be noted that, although it is not included in the commitments in the table above , in relation to I- 77, Ferrovial is guaranteeing the investment commitments of one partner amounting to 70 million euros. In return for granting this guarantee, if the partner fails to meet its disbursement, its participation will be diluted in proportion to the investment not paid out.
There are also property, plant and equipment purchase commitments totalling EUR 92 million (2014: EUR 185 million) which relate mainly to the acquisition of machinery or the construction of treatment plants in the Services Division, and EUR 28 million relating to the purchase of companies corresponding basically to the acquisition of the remaining 30% of the Chilean company Steel for EUR 15 million, for which provisions have been recognised. The schedule of the commitments of the Services Division is as follows:
(Millions of euros) 2016 2017 2018 2019 2020 2021 and
subsequent years
TOTAL
Acquisition of property, plant and equipment
57 12 12 2 2 7 92
Acquisition of companies 23 1 1 2 0 1 28
TOTAL SERVICES 80 13 13 4 2 8 120
It should be noted that the foregoing commitments of the Services Division are not secured by bank guarantees.
Lastly, it should be noted that on 6 December 2015, Ferrovial, through Ferrovial Servicios, launched a takeover bid for all the shares of the Australian company Broadspectrum for a cash price of AUD 1.35 per share, which would give rise to an investment of AUD 715 million (approximately EUR 490 million). The bid is subject to the acquisition of a minimum percentage of 50.01% of the share capital of Broadspectrum and other terms and conditions habitual in this type of bid. No bank guarantees were provided in relation to this takeover bid and the period for acceptance of the bid ends on 7 March 2016.
b) Commitments under operating and finance leases
The expense recognised in relation to operating leases in the income statement for 2015 totals EUR 376 million (2014: EUR 299 million).
The future total minimum lease payments for non-cancellable operating leases are shown below:
2015 (Millions of euros)
Corporate Construction Toll roads Services Airports Total
Within one year 4 59 3 21 0 87
Between one and five years
13 80 3 22 0 118
After five years 0 21 0 19 0 40
Lessee 18 160 6 62 0 245

2015 Consolidated Financial Statements. Ferrovial, S.A. and Subsidiaries
155
2014 (Millions of euros)
Corporate Construction Toll roads Services Airports Total
Within one year 4 21 3 40 0 68
Between one and five years
15 21 4 69 0 108
After five years 3 1 0 9 0 12
Lessee 22 42 7 117 0 189
The Group does not have any significant commitments as a lessor under operating leases.
c) Environmental commitments
Any operation designed mainly to prevent, reduce or repair damage to the environment is treated as an environmental activity.
Costs incurred to protect and improve the environment are taken to the income statement in the year in which they are incurred, irrespective of when the resulting monetary or financial flow takes place.
Provisions for probable or certain environmental liability, litigation in progress and indemnities or other outstanding obligations of undetermined amount not covered by insurance policies are recorded when the liability or obligation giving rise to the indemnity or payment arises. These provisions include most notably the provisions for landfill closure discussed in Note 6.3, the balance of which at 31 December 2015 was EUR 113 million (31 December 2013: EUR 100 million).
6.6. REMUNERATION OF THE BOARD OF DIRECTORS
6.6.1. Bylaw-stipulated directors’ remuneration
Under the Company’s current remuneration scheme, regulated by Article 56 of its bylaws, the shareholders at the General Meeting determine the total annual remuneration for all the members of the Board of Directors, establishing a fixed remuneration component plus a component for attending the various meetings of the Board and of its various committees. The remuneration is linked solely to the directors' level of responsibility and dedication, thereby ensuring their independence and commitment at long term.
On the same date as that on which these consolidated financial statements were authorised for issue, the Board of Directors prepared and made available to the shareholders the Annual Report on Directors' Remuneration referred to in Article 541 of the Spanish Limited Liability Companies Law. That Report describes in greater detail matters relating to the Company's remuneration policy and contains an overview of how the remuneration policy was applied in 2015 and a detail of the individual remuneration earned by each of the directors in 2015.
The table below shows the itemised bylaw-stipulated emoluments of the members of the Board of Directors earned in 2015 and 2014. This table does not include the remuneration received by the executive directors for discharging their executive functions at the Company, which is detailed in Note 6.6.2. It should be noted that “Remainder” included in the table for 2014 relates to the variable remuneration earned until June 2014 under the previous remuneration system.
2015
Director (a) (Thousands of euros)
Fixed remuneration
Attendance fees
Supplementary fixed
remuneration (1)
Total
Rafael del Pino y Calvo-Sotelo
35 112 92 239 Santiago Bergareche Busquet 35 66 81 181 Joaquín Ayuso García 35 67 58 159 Iñigo Meirás Amusco 35 56 46 137 Juan Arena de la Mora 35 66 46 147 María del Pino y Calvo-Sotelo 35 54 46 135 Santiago Fernández Valbuena
35 50 46 131 José Fernando Sánchez-Junco Mans
35 64 46 145 Joaquín del Pino y Calvo-Sotelo (since 29/10/15)
6 12 8 26 Joaquín del Pino y Calvo-Sotelo (since 29/10/15)
6 12 8 26
Howard Lance (since 18/10/14) 35 30 46 111
Oscar Fanjul Martín (since 31/07/15) 15 19 19 53
Jaime Carvajal Urquijo (until 30/07/15)
20 47 27 94 Portman Baela, S.L. (until 09/09/15)
24 31 32 87 Karlovy, S.L. (until 29/10/15) 29 24 38 91
TOTAL 415 708 638 1,762
(1) The supplementary fixed remuneration is bylaw-stipulated remuneration paid in a single payment after the year-end, the amounts in 2015 being EUR 92 thousand for the Chairman of the Board; EUR 80.5 thousand for the First Deputy Chairman; EUR 57.5 thousand for the Second Deputy Chairman; and EUR 46 thousand for the other Board members. If because there are more meetings than initially envisaged or for any other reason the amount of the attendance fees added to that of the fixed components exceeds the total maximum amount of remuneration for Board membership established for the year in question, the difference is deducted from the amount of the supplementary fixed remuneration proportionally for each director on the basis of his or her position on the Board. (1) Fixed remuneration + adjusted supplementary fixed remuneration from 1 July 2014. (2) Remainder from 1 January to 30 June 2014. (a) Period in office. Full year, unless otherwise stated.
2014
Director (a) (Thousands of euros)
Fixed remuneration (1)
Attendance fees
Remainder (2)
Total
Rafael del Pino y Calvo-Sotelo 75 127 46 248
Santiago Bergareche Busquet
70 68 40 178 Joaquín Ayuso García 60 64 28 152 Íñigo Meirás Amusco 55 61 23 139 Jaime Carvajal Urquijo 55 60 23 137 Portman Baela, S.L. 55 55 23 132 Juan Arena de la Mora 55 71 23 148 María del Pino y Calvo-Sotelo
55 64 23 141 Santiago Fernández Valbuena
55 37 23 115 José Fernando Sánchez-Junco Mans 55 64 23 141
Karlovy, S.L. 55 44 23 121
Gabriele Burgio (until 16/12/14) 52 59 23 133
Howard Lance (from 18/12/14) 3 6 0 9
TOTAL 698 779 319 1,795

2015 Consolidated Financial Statements. Ferrovial, S.A. and Subsidiaries
156
6.6.2. Individual remuneration of the executive directors
a) Remuneration earned in 2015 and 2014
The two executive directors in 2015 earned the following remuneration for discharging their functions, in addition to the remuneration discussed in the preceding section. It also includes information on the Second Deputy Chairman who, although in 2015 and 2014 did not discharge executive functions, exercised share options granted to him in 2008 when he was an executive director.
2015 (Thousands of euros)
Remuneration of executive
directors
Fixed
remuneration
Variable
remuneration
Relating to
boards of other
subsidiaries
Exercise
of share
options (2)
Life insurance
premiums Share plans (1) Total 2015
Rafael del Pino y Calvo-Sotelo 1,335 2,034 0 0 6 2,323 5,698
Joaquín Ayuso García (3) 0 0 31 3,685 0 0 3,716
Iñigo Meirás Amusco 1,100 1,837 0 3,475 3 2,323 8,738
TOTAL 2,435 3,871 31 7,160 9 4,646 18,152
(1) In March 2015, since the agreed conditions had been complied with in full, a number of shares equivalent to the units allocated in 2012 were delivered, after the relevant withholdings had been performed. The CNMV was notified on 18 March 2015. (2) Iñigo Meirás exercised 538,000 in 2015. (3) Joaquín Ayuso exercised 409,600 in 2015. This 2008 Share Option Plan, to which he retains entitlement, was awarded to him when he was an executive director.
The information on 2014 is as follows:
2014 (Thousands of euros)
Remuneration of executive directors
Fixed remuneration
Variable remuneration
Relating to boards of other
subsidiaries
Exercise of share options
Life insurance premiums
Share plans (1) Total 2014
Rafael del Pino y Calvo-Sotelo 1,175 2,128 0 0 6 2,054 5,363
Joaquín Ayuso García (2) 0 0 5 1,372 0 0 1,377
Íñigo Meirás Amusco 970 1,910 0 132 3 2,054 5,070
TOTAL 2,145 4,038 5 1,505 9 4,109 11,810
(1) In March 2014, since the agreed conditions had been complied with in full, a number of shares equivalent to the units allocated in 2011 were delivered, after the relevant withholdings had been performed. The CNMV was notified on 18 March 2014. (2) Joaquín Ayuso exercised his rights to the 2008 Share Option Plan. This plan, to which he retains entitlement, was awarded to him when he was an executive director.
b) Share-based payment systems
The detail of the outstanding share option plans and performance-related share award plans for executive directors at 31 December 2015 is as follows:
Share option plans Executive directors Situation at 31/12/15
Share options No. of
equivalent shares
Exercise price (euros) Share capital
Rafael del Pino y Calvo-Sotelo 2008 Plan 1,179,600 1,179,600 11.69 0.16% Joaquín Ayuso García 2008 Plan 200,000 200,000 11.69 0.03%
Íñigo Meirás Amusco 2008 Plan 20,000 20,000 11.69 0.00%
Performance-related share award plan Executive directors Situation at 31/12/15
Units No. of voting rights % of voting power
Rafael del Pino y Calvo-Sotelo
2013 Allocation 104,650 104,650 0.01%
2014 allocation 78,500 78,500 0.01%
2015 allocation 69,800 69,800 0.01%
Íñigo Meirás Amusco
2013 allocation 104,650 104,650 0.01%
2014 allocation 78,500 78,500 0.01%
2015 allocation 69,800 69,800 0.01%
The general characteristics of the two plans are detailed in Note 6.7, Share-based payment.

2015 Consolidated Financial Statements. Ferrovial, S.A. and Subsidiaries
157
6.6.3. Remuneration of the members of the Board of Directors due to membership of other managing bodies of Group companies or associates
The directors of Ferrovial S.A. Joaquín Ayuso García and Howard Lee Lance are in turn members of the managing bodies of other Group companies or associates and received EUR 31 thousand each in this connection in 2015 (2014: EUR 5 thousand corresponding to Joaquín Ayuso García).
6.6.4. Pension funds and plans or life insurance premiums
As in 2014, no contributions were made in 2015 to pension plans or funds for former or current members of the Company’s Board of Directors or for directors of Ferrovial, S.A. who are members of other boards of directors and/or senior executives of Group companies or associates. Similarly, no obligations in this connection were acquired in 2015.
As regards life insurance premiums, the Company has insurance policies covering death (for which premiums totalling EUR 9 thousand were paid in 2015; EUR 9 thousand in 2014), of which the executive directors are beneficiaries. No life insurance premiums were paid for the directors of Ferrovial, S.A. who are members of other boards of directors and/or senior executives of Group companies or associates.
6.6.5. Advances and loans
At 31 December 2015, no advances or loans had been granted by the Company to the directors in their capacity as such or as members of other boards of directors and/or as senior executives of Group companies or associates.
6.6.6. Remuneration of senior executives
The joint remuneration earned by the Company’s senior executives in 2015 was as follows:
Remuneration of senior executives (Thousands of euros) 2015 2014
Fixed remuneration 5,006 4,472
Variable remuneration 5,431 5,360
Performance-based share award plan 8,626 7,691 Exercise of share options and/or other financial instruments (see description) 5,988 3,080
Remuneration as members of managing bodies of other Group companies, jointly controlled entities or associates
\29 21
Contributions to pension funds or plans, or related obligations [-] [-]
Insurance premiums 17 15
Other (1) 1,899
TOTAL 26,996 20,639
(1) Termination of one senior executive (an amount not exempt from personal income tax), amount covered by collective insurance savings mentioned in note 6.6.7.
The aforementioned remuneration corresponds to the following posts: General Secretary, Chief Financial Officer, General Director of HR, General Director of Construction, General Director of Real Estate, General Director of Services, General Director of Airports, General Director of Toll Roads, General Director of Information Systems and Innovation, Director of Internal Audit, Director of Communications and Corporate Responsibility and Director of Corporate Strategy. This does not include remuneration for senior executives who were also
executive directors, which was addressed in Note 6.6.2.
The Company has also introduced a flexible remuneration system called the Flexible Remuneration Plan, which provides employees with the possibility of voluntarily modifying their remuneration package based on their personal needs, replacing a portion of their remuneration with the award of certain payments in kind. These products include a group life and retirement-related savings insurance plan. Participants may request that a portion of their gross annual remuneration be paid by the Company in the form of a premium for a group life and retirement-related savings insurance policy. In this connection, the senior executives requested contributions of EUR 153 thousand from the Company, instead of the equivalent remuneration shown in the foregoing table (2014: EUR 103 thousand).
6.6.7. Other disclosures on remuneration
The agreements between the Company and senior executives, including one executive director, specifically provide for the right to receive the indemnities referred to in Article 56 of the Workers’ Statute in the event of unjustified dismissal.
At 31 December 2015, additional rights had been established in the contract of one senior executive.
In order to encourage loyalty and long-service, a deferred remuneration scheme was recognised for twelve senior executives, including one executive director. The scheme consists of extraordinary remuneration that will only be paid when one of the following circumstances occurs:
� Removal of the senior executive by mutual agreement upon reaching a certain age.
� Unjustified dismissal or termination by the Company at its discretion without any justification for dismissal, prior to the senior executive reaching the age initially agreed upon, if the amount of this remuneration exceeds that resulting from applying the Workers' Statute.
� The death or disability of the senior executive.
To cover this incentive, each year the Company makes contributions to a group savings insurance policy, of which the Company is both policy-holder and beneficiary. These contributions are quantified on the basis of a certain percentage of the total monetary remuneration of each senior executive. The contributions made in 2015 amounted to EUR 2,259 thousand (2014: EUR 1,947 thousand), of which EUR 496 thousand correspond to executive directors.
Individuals are occasionally hired to hold executive positions, mainly from abroad, in areas unrelated to senior management. The contracts of these individuals include certain clauses that provide for indemnities in the event of unjustified dismissal.

2015 Consolidated Financial Statements. Ferrovial, S.A. and Subsidiaries
158
6.7. SHARE-BASED PAYMENT
a) Share option plan
Until 2008 Ferrovial used a remuneration system based on the
delivery of share options. The share option plans outstanding at 31
December 2015 were as follows:
Participants Approval
date
Exercise
deadline
Exercise
price
Outstanding
options
2015
Senior executives 08 - Ferrovial
26/04/08 25/04/16 EUR
11.69 1,627,600
NUMBER OF SHARES AT END OF YEAR 1,627,600
These share option plans include the plans described above in Note 6.6 on remuneration of executive directors and senior executives.
All the share option plans include a three-year vesting period as from the grant date followed by a five-year exercise period, provided that certain minimum returns on consolidated equity or certain ratios of returns on productive assets are achieved.
The changes in the Company's share option plans in 2015 and 2014 are summarised as follows:
2015 2014
Number of options at beginning of year 8,153,024 13,866,644
Plans granted 0 0
Shares surrendered and other -76,750 -173,600
Plans expired -242.400 -3.061400
Options exercised -6,206,274 -2,478,620
Number of options at end of year 1,627,600 8,153,024
Options executed during 2015 exercise have had an impact in equity of EUR -36 million. Additionally, equity swaps amounting to EUR 46 million have been exercised, with a positive impact in cash of EUR 34 million (see Note 5.5, Derivative Financial Instruments).
Since the aforementioned plans are in the exercise period, they do not give rise to staff costs on a regular basis.
b) Performance-based share option plan
On 19 December 2012, the Board of Directors approved a three-year remuneration plan consisting of the delivery of shares of Ferrovial, S.A. The total number of shares that can be granted annually under the plan may not exceed 1,900,000, representing 0.26% of Ferrovial, S.A.'s share capital and will be linked to at least three years’ service at the Company (barring special circumstances) and the achievement during this period of ratios calculated on the basis of EBITDA as a percentage of net productive assets, to cash flows from operating activities and to total shareholder return in relation to a comparable group. There were 3,844,520 shares outstanding under this second plan at 31 December 2015.
The changes in the aforementioned remuneration schemes in 2015 and 2014 are summarised as follows:
2015 2014
Number of shares at beginning of year 4,451,888 5,200,825
Plans granted 1,132,766 1,282,811
Plans settled -1,674,439 -1,893,350
Shares surrendered and other -40,321 -112.904
Shares exercised -25,374 -25,494
Number of shares at end of year 3,844,520 4,451,888
These share award plans include the plans described above in Note 6.6. on remuneration of executive directors and senior executives.
In 2015 the staff costs recognised in relation to these remuneration systems amounted to EUR 18 million (2014: EUR 16 million), with a credit to equity.
These plans were measured as futures and, therefore, the value of the shares and the foreseeable dividends up to the delivery date is discounted to the value of the shares at the grant date, using a rate of return equal to the average cost of borrowings over the share award period. These plans are equity settled and, therefore, they are measured when granted and the initially calculated value thereof is not re-estimated. The related amounts are recognised under “Staff Costs” with a credit to reserves.
In 2015, plans have been settled equal to 1.7 million shares. These plans had a negative impact of EUR -20 million on cash relating to the payment of shares net of taxes and EUR -12 million on personal income tax withholdings, which had a negative impact of EUR -32 million on equity.
By last, the Board of Directors approved a new three-year remuneration plan consisting of the award of shares of Ferrovial, S.A. The annual cost of the plan may not exceed EUR 22 million and will be linked to at least three years’ service at the Company (barring special circumstances) and the achievement during this period of ratios calculated on the basis of:
i) EBITDA / average earning assets (it represents 70% of the total). The maximum incentive for the granting of 2016, will be achieved if the average of this ratio at the end of the three years´ cycle exceeds 10.5% (it will not be achieved if it is below 9%) ii) Total shareholder return in relation to a comparable group (it represents 30% of the total). The maximum incentive for the granting of 2016 will be achieved if after three years the situation of Ferrovial regarding the comparison group is among the top 5; and it will not be remunerated if the situation of Ferrovial is below the median of the comparable group.
The assignment of the shares will take place in the first quarter of 2016. With respect to the executive directors, this plan will be submitted to the Annual General Meeting for its approval.

2015 Consolidated Financial Statements. Ferrovial, S.A. and Subsidiaries
159
6.8. RELATED PARTY TRANSACTIONS
Approval of transactions. Disclosures on related party transactions
The regulation the transactions that may be performed by Ferrovial or its Group companies and the directors or persons related thereto is provided for in:
� Article 229.1 a) of the Consolidated Spanish Limited Liability Companies Law. This obliges directors as a general rule, to refrain from performing transactions with the Company, due to the existence of a conflict of interest.
� Section 1 h) of Article 529 ter of the Consolidated Spanish Limited Liability Companies Law and Article 38.3 t) of the bylaws. These provisions confer on the Board of Directors -on a non-delegable basis- subject to a report from the Audit and Control Committee, the approval of the transactions that the Company or Group companies perform with the directors, in the terms and conditions envisaged in Law, or shareholders, individually or together with others, of a significant ownership interest, including the shareholders represented on the Board of Directors of the Company or other companies that form part of the same group or with persons related to them.
However, Article 230.2.2 of the Spanish Limited Liability Companies Law confers the competence to authorise such transactions on the Annual General Meeting if the value of the transaction exceeds 10% of company assets.
� -Article 529 ter.1 h) of the Consolidated Spanish Limited Liability Companies Law states that only the transactions that simultaneously have the following three characteristics shall be exempt from such approval: a) they are performed by virtue of agreements whose terms and conditions are standardised and are applied en masse to a large number of customers; b) they are performed, in general, at prices or tariffs established by the party that acts as the supply of the good or service in question; and c) the amount thereof does not exceed 1% of the company's annual revenue.
� Article 38 of the Board of Directors Regulations transposes this legal provision. The aforementioned Article also states that in the case of ordinary transactions involving the Company and its subsidiaries, the general approval of the Board of Directors will suffice.
As regards the disclosures on related party transactions, the following provisions must be taken into consideration:
� Article 229.3 of the Spanish Limited Liability Companies Law and Article 37.3 of the Board of Directors Regulations, which require that any situation of conflict of interest that the directors might have must be disclosed in the notes to the financial statements; including, inter alia, the transactions discussed in the first paragraph above.
� Article 1.1 of Ministry of Economy and Finance Order EHA/3050/2004, of 15 September, on information on related parties that must be disclosed by entities that issue securities listed on official secondary markets, which requires the inclusion in the half-yearly financial reports of quantified information on all the transactions performed by a company with related parties.
� Lastly, Article 3.1 of the aforementioned Order considers related party transactions to be any transfers of resources, services or obligations between related parties regardless of whether or not there is any consideration.
Related party transactions
The transactions with related parties carried out in 2015 in the ordinary course of business of the Company and of the Group, which were performed on an arm's length basis, are disclosed below.
Where the profit or loss from a transaction cannot be stated, as it pertains to the entity or individual supplying the related good or service, the transaction has been marked with an asterisk (*).
a) Significant shareholders.
The following table contains a breakdown of the transactions carried out in 2015 with significant shareholders, with members of the “controlling family group” existing until August 2015 (1): (except for the natural persons who are in turn directors or representatives of directors of the Company, the information on whom is included in the following section) or entities related through shareholdings to persons from the “controlling family group”.

2015 Consolidated Financial Statements. Ferrovial, S.A. and Subsidiaries
160
Transactions with significant shareholders 2015 2014
Name/ Company name
Ferrovial Group company
Nature of transaction
Type of transaction Amount Profit or
loss Balance Amount Amount Amount
Members of “controlling family group” / entities related to them
Ferrovial Agroman, S.A. / subsidiaries Commercial Construction and
renovation work 268 202 7 37 49 0
Ferrovial Servicios, S.A. / subsidiaries Commercial
Integrated management of services at Madrid offices
355 53 18 449 67 133
Ferrovial Servicios, S.A. / subsidiaries Commercial Integrated management
of services 1 0 0 2 0 1
(1) Through a relevant event communication sent to the Spanish National Securities Market Commission (CNMV) on 4 August 2015 (no. 227311), the markets were informed of the communications received by the Company, for their immediate announcement: firstly, from its main shareholder, Portman Baela, S.L. and from its parent, Karlovy, S.L., in relation to the sale of the entire ownership interest in the share capital of FERROVIAL to its direct and indirect shareholders; second, from its shareholder Rijn Capital BV in relation to the settlement of the future sale of shares of FERROVIAL and the return of the securities loan granted in the framework of the aforementioned sale arranged by Rijn Capital BV with Mediobanca ‒ Banca di Credito Finanziario S.p.A.; and third, from Menosmares, S.L.U., Rijn Capital BV, Soziancor, S.L.U. and Siemprelara, S.L.U. in relation to the ultimate ownership interest of their controlling shareholders in the share capital of FERROVIAL.
b) Transactions with directors, senior executives and related companies
The transactions performed with the Company’s directors, representatives of directors and senior executives in 2015 are shown below. The table also includes the transactions performed with companies considered to be related to the foregoing (if they were so considered during a portion of the year, the transactions performed in that period are indicated):
TRANSACTIONS WITH DIRECTORS, SENIOR EXECUTIVES AND RELATED COMPANIES (1 of 2) (Thousands of euros) 2015 2014
Name/ Company name
Ferrovial Group company
Nature of transaction
Type of transaction Amount Profit or
loss Balance Amount
Profit or loss
Balance
Rafael del Pino y Calvo-Sotelo
Ferrovial Servicios, S.A. / subsidiaries Commercial Maintenance, cleaning and
gardening services 16 1 8 16 2 2
Ferrovial Agroman / subsidiaries Commercial Construction and renovation
work 53 4 105 211 9 105
María del Pino y Calvo-Sotelo
Ferrovial Agroman / subsidiaries Commercial Real estate renovation 4 0 0 1 0 0
Rafael del Pino y Calvo-Sotelo
Ferrovial Agroman / subsidiaries Commercial Construction and renovation
work 53 2 0 0 0 0
Álvaro Echániz
Ferrovial Agroman / subsidiaries Commercial Real estate renovation (-) (-) (-) 4 0 0
Joaquín Ayuso García
Ferrovial Agroman / subsidiaries Commercial Real estate renovation 4 0 0 3 0 0
Spanish public airports and aviation agency (Aena)
Ferrovial Group companies Commercial Lease of real estate and
maintenance material 53 (*) 2 28 (*) -3
Ferrovial Servicios, S.A. / subsidiaries Commercial
Provision of maintenance, waste collection and gardening services
1,786 64 0 1,522 103 1,600
Ferrovial Agroman / subsidiaries Commercial Construction work (-) (-) (-) 1,397 0 0
Almirall Laboratorios
Ferrovial Servicios, S.A. / subsidiaries Commercial Provision of waste collection
services 8 1 2 12 2 3
Aviva Ferrovial Group companies Commercial Arrangement of insurance
policies 2,259 (*) 0 1,962 (*) 0
Maxam Europe and group companies
Ferrovial Agroman / subsidiaries Commercial Receipt of supplies of
explosives and detonators 816 (*) -87 266 (*) 35
Everis and group companies
Ferrovial Servicios, S.A. / subsidiaries Commercial Receipt of communication
services 835 (*) -54 674 (*) 0
Asea Brown Bovery
Ferrovial Group companies Commercial
Receipt of equipment repair, upkeep and maintenance services
240 (*) -9 1,396 (*) -179
(*) No profit or loss is stated as the relevant amount pertains to the entity or person providing the service.

2015 Consolidated Financial Statements. Ferrovial, S.A. and Subsidiaries
161
TRANSACTIONS WITH DIRECTORS, SENIOR EXECUTIVES AND RELATED COMPANIES (2 of 2) (Thousands of euros) 2015 2014
Name/ Company name
Ferrovial Group company
Nature of transaction
Type of transaction Amount Profit or
loss Balance Amount Profit or loss Balance
Telefónica and group companies
Ferrovial Group companies Commercial Receipt of telecommunications
services 20,509 (*) -1,882 23,963 (*) -1,691
Corporate Commercial Rebilling of cancellation costs 1,938 0 1,336 1,545 0 0
Ferrovial Agroman / subsidiaries Commercial Construction and renovation
work 77 466 0 298 539 276
Ferrovial Servicios, S.A. / subsidiaries Commercial Provision of maintenance and
waste collection services 3,035 402 1,121 3,381 439 1,143
Marsh and group companies
Ferrovial Group companies Commercial Receipt of consultancy and
insurance services 1,719 (*) -123 (-) (-) (-)
Meliá Hotels and group companies
Ferrovial Group companies Commercial Receipt of hotel and catering
services 2 (*) -1 3 (*) -1
Ferrovial Servicios, S.A. / subsidiaries Commercial Provision of maintenance and
waste collection services 92 6 30 46 3 17
Ferrovial Agroman / subsidiaries Commercial Construction and renovation
work 10,750 -367 8,059 0 0 0
Bankia Ferrovial Group companies Commercial Receipt of financial services 1,235 (*) 0 (-) (-) (-)
Ferrovial Group companies Commercial Financing agreements
Guarantee 295,300 (*) 295,300 266,800 (*) 0
Ferrovial Group companies Commercial Interest received 66 66 0 30 30 0
Ferrovial Group companies Commercial Payment of interest 5,698 (*) 0 8,482 (*) 0
Ferrovial Group companies Commercial Balance drawn down against
guarantee facilities 132,700 (*) 132,700 208,800 (*) 208,800
Ferrovial Group companies Commercial Transactions with derivatives 11,078 (*) 0 10,322 (*) 0
Ferrovial Servicios, S.A. / subsidiaries Commercial Provision of maintenance
services 8 1 5 51 3 17
Bankinter Ferrovial Group companies Commercial Receipt of financial services 17 (*) 0 (-) (*) (-)
Ferrovial Group companies Commercial Payment of interest 1,189 (*) 0 15 (*) 0
Ferrovial Group companies Commercial Interest received 317 317 0 9 9 0
Ferrovial Group companies Commercial Balance drawn down against
guarantee facilities 3,000 (*) 3,000 100 (*) 100
Ferrovial Group companies Commercial Financing agreements 7,100 (*) 0 11,500 (*) 0
Ferrovial Servicios, S.A. / subsidiaries Commercial Provision of maintenance
services 168 6 35 88 10 45
Bimaran Ferrovial Agroman / subsidiaries Commercial Construction and renovation
work 282 191 0 (-) (-) (-)
Fundación Seres Corporate Commercial Donation 18 (*) 0 18 (*) 0
Lafarge Holcim Ferrovial Agroman / subsidiaries Commercial Purchase of cement 8,844 (*) -545 (-) (*) (-)
La Rioja Alta Ferrovial Servicios, S.A. / subsidiaries Commercial Receipt of food services 1 (*) 0 0 (*) 0
Panda Security Ferrovial Agroman / subsidiaries Commercial Receipt of IT services 4 (*) 0 4 (*) 0
Summit Ferrovial Agroman / subsidiaries Commercial Acquisition of tools and
electrical material 2 (*) 0 (-) (*) (-)
Zurich Insurance
Ferrovial Group companies Commercial Arrangement of insurance
policies 7,774 (*) 2 178 (*) 0
Ferrovial Servicios, S.A. / subsidiaries Commercial Lease of offices 300 (*) -6 442 (*) -9
Ferrovial Servicios, S.A. / subsidiaries Commercial Provision of maintenance and
cleaning services 9 1 8 33 2 10
The information on remuneration and loans to directors and senior executives may be consulted in Note 6.6.

2015 Consolidated Financial Statements. Ferrovial, S.A. and Subsidiaries
162
c) Intra-Group transactions
Set forth below is information on transactions between Ferrovial, S.A. companies which, in all cases forming part of their ordinary businesses as regards purpose and conditions, were not eliminated on consolidation for the following reason.
As explained in detail in Note 1.3.2, the balances and transactions relating to construction work performed by the Construction Division for the Group's infrastructure concession operators are not eliminated on consolidation since, at consolidated level, contracts of this type are classed as construction contracts in which the work -to the extent that it is completed- is deemed to be performed for third parties, as the ultimate owner of the work is the grantor both from a financial and legal viewpoint.
In 2015 Ferrovial’s Construction Division billed those concession operators for EUR 439,532 thousand (2014: EUR 637,212 thousand) for work performed and related advance payments and, in this respect, recognised sales totalling EUR 652,303 thousand (2014: EUR 808,536 thousand).
In 2015 the profit from these transactions attributable to Ferrovial, S.A.’s holdings in the concession operators in question and not eliminated on consolidation, net of taxes and non-controlling interests, was EUR 93,359 thousand. In 2014 it was EUR 58,722 thousand.
6.9. CONFLICTS OF INTEREST
In accordance with the legislation in force (Article 229 of the Spanish Limited Liability Companies Law), there were no direct or indirect conflicts of interest with the Company, without prejudice to the related party transactions disclosed in the notes to the consolidated financial statements or, where applicable, to the resolutions relating to matters of remuneration or appointments.
6.10. FEES PAID TO AUDITORS
Pursuant to Spanish Audit Law 12/2010, of 30 June, following is a disclosure of the total fees relating to the “audit services” and “other consultancy services” provided by the auditors of the 2015 and 2014 financial statements of the Group companies, including both the principal auditor of Ferrovial, S.A. and the other auditors of all its investees, both in Spain and abroad.
“Fees for Audit Services” includes the following items:
� “Audit Services” relates to strictly statutory audit services.
� “Audit-Related Services” relates to services other than statutory audit services which by law or by regulation can only be provided by the Company's auditor, such as the review of financial information in bond issues and services which due to their nature are normally provided by the Company's auditor, such as the review of tax returns.
The total of “Other Consultancy Services” provided by the principal auditor represented 11% of the total fees for audit services in 2015.
Principal auditor (Millions of euros) 2015 2014
Fees for audit services 5.0 4.4
Audit services 4.6 3.8
Audit-related services 0.4 0.6
Other consultancy services 0.6 0.8
6.11. EVENTS AFTER THE REPORTING PERIOD
At the date of preparation of these financial statements, there have been no subsequent events with significance or relevant character.
6.12. APPENDICES

2015 Consolidated Financial Statements. Ferrovial, S.A. and Subsidiaries
163
In 2014 Ferrovial opted to be taxed under the regime established currently in Articles 107 and 108 of the Spanish Income Tax Law, of 27 November, (“LIS”), which became applicable from 1 January 2014 and, consequently, all of 2015.
Under this tax regime:
1. Dividends and capital gains obtained by Ferrovial arising from ownership interests in non-resident operating companies (which represent at least 5% of the share capital of these companies or which were acquired for more than EUR 20 million) are exempt from income tax if the requirements provided for in Article 21 of the Spanish Income Tax Law (“exempt income”) are fulfilled.
2. The dividends paid by Ferrovial with a charge to the aforementioned “exempt income”, or to income arising from permanent establishments abroad to which the exemption provided for in Article 22 of the Spanish Income Tax Law is applicable are treated as follows:
(i) Where the recipient is a non-resident shareholder in Spain (and does not operate through tax havens or by means of a permanent establishment in Spain), dividends are not subject to withholdings or taxation in Spain.
(ii) Where the recipient is an entity subject to Spanish income tax, the dividends received shall give rise to the exemption in order to avoid double taxation of dividends of resident entities included in Article 21 of the Spanish Income Tax Law (“exempt income”), if the requirements provided for in the aforementioned law are met.
(iii) Where the recipient is a natural person resident in Spain subject to personal income tax, the dividends received shall be considered savings income and the tax credit for the avoidance of double taxation in Spain may be taken in accordance with the terms of the Personal Income Tax Law, with respect to the taxes paid abroad by Ferrovial.
In 2015 all of the dividends paid by Ferrovial were paid out of "exempt income".
3. The capital gains obtained by the shareholders of Ferrovial arising from the transfer of their ownership interests in the Company are treated as follows:
(i) Where the shareholder is a non-resident in Spain (and does not operate through tax havens or a permanent establishment in Spain) the portion of the capital gain that relates to the reserves recognised by Ferrovial with a charge to the aforementioned “exempt income” or to changes in value attributable to Ferrovial's investments in non-resident entities that meet the requirements to be able to apply the foreign income exemption established in Articles 21 and 22 of the Spanish Income Tax Law shall be deemed not subject to taxation in Spain.
(ii) Where the shareholder is an entity subject to Spanish income tax with an ownership interest in Ferrovial that meets the requirement (5% ownership interest in the share capital or that the acquisition cost of the ownership interest exceeds EUR 20 million and it has been held for one year), the exemption provided for in Article 21 of the Spanish Income Tax Law may be applied.
(iii) Where the shareholder is a natural person resident in Spain subject to personal income tax, it shall pay tax on the capital gain obtained in accordance with the standard income tax rules.
The amount of exempt income pursuant to Article 21 and 22 of the Spanish Income Tax Law obtained by Ferrovial in 2015 and the related tax paid abroad is as follows (in euros):
a) Exemption for foreign source dividends and income
a.1 Exemption for foreign source dividends
Ferrovial, S.A. 463,404
Hellas Toll dividend 463,404
TOTAL 463,404
a.2. Exemption for income of permanent establishments abroad
No income were obtained from permanent establishments abroad susceptible to apply the exemption.
b) Exemption for foreign source capital gains
No capital gains were obtained to which the exemption included in Article 21 of the Spanish Income Tax Law is applicable because (i) either the sales were made between Group companies and were eliminated on preparation of the consolidated tax return, (ii) or they were reported in corporate restructuring transactions which opted for the tax neutrality regime provided for in Article 76 et seq of the Spanish Income Tax Law.
Nevertheless, the capital gains that would have been reported for tax purposes had these regimes not been not applicable (consolidated tax group or tax neutrality) are as follows:
b.1 Elimination of capital gains for intra-group sales of foreign companies
Ferrovial, S.A. -73,944
TOTAL -73,944
b.2 Deferred capital gains arising in corporate restructuring processes:
Ferrovial, S.A. 3,304,500,185 TOTAL 3,304,500,185
In order to enable the shareholders of Ferrovial to adopt the aforementioned tax regime, the Company performed a market assessment at the end of the year of its ownership interests (held directly and indirectly through investments in other entities that have adopted this special tax regime) in non-resident entities and permanent establishments abroad that meet the requirements to be able to apply the foreign source income exemption established in Articles 21 and 22 of the Spanish Income Tax Law.
The result of this assessment means that these assets represent 88,70% of the total market value of Ferrovial. At 31 December 2014, this percentage amounted to 88.70%.
APPENDIX I

2015 Consolidated Financial Statements. Ferrovial, S.A. and Subsidiaries
164
Taxation of Ferrovial’s scrip dividend
In 2015 Ferrovial S.A. implemented two shareholder remuneration schemes under a framework known as the “Ferrovial Scrip Dividend”, which provide the Company’s shareholders with the free choice of (i) receiving newly issued bonus shares of the Company; (ii) transferring in the market the bonus issue rights corresponding to the shares held by them; or (iii) receiving a cash amount through the transfer to Ferrovial of the aforementioned bonus issue rights.
Set forth below are the main tax implications of these schemes, based on the tax legislation in force in Spain except for Navarre and the Basque Country and on the interpretation made by the Spanish Directorate-General of Taxes in its response to several requests for a binding rulings.
Delivery of new shares: for tax purposes, the delivery of new shares is considered to be a delivery of bonus shares and, therefore, does not constitute income for the purposes of personal income tax, income tax or non-resident income tax, regardless of whether or not the recipients of these shares act through a permanent establishment in Spain. The delivery of new shares is not subject to withholdings or pre-payments. The acquisition cost, both of the new shares and the shares to which they correspond, will be the result of distributing the total cost of acquisition for tax purposes of the portfolio by the number of shares; both the original shares and the bonus shares that correspond to them. The age of the bonus shares will be the age that corresponds to the shares that gave rise to them. Consequently, in the event of their subsequent transfer, the income obtained will be calculated by reference to this new value.
Sale to the market of the bonus issue rights: if the shareholders sell their bonus issue rights to the market, the amount obtained will not be subject to withholdings or pre-payments and will be subject to the tax rules indicated below (until 2017):
a) In the case of personal income tax and non-resident income tax applicable to shareholders without a permanent establishment in Spain, the amount obtained on the sale to the market of the bonus issue rights is subject to the same rules established in tax legislation for pre-emption rights. Consequently, the amount obtained on the sale of the bonus issue rights reduces the acquisition cost for tax purposes of the shares which give rise to such rights, pursuant to Article 37.1.a) of Personal Income Tax Law 35/2006, of 28 November, and pursuant to Final Provision Six of Law 26/2014, of 27 November, amending Personal Income Tax Law 35/2006, of 28 November, the Consolidated Spanish Non-Resident Income Tax Law approved by Legislative Royal Decree 5/2004, of 5 March, and other tax legislation. Therefore, if the amount obtained on the sale of the bonus issue rights is higher than the acquisition cost of the shares which gave rise to them, the difference is considered to be a capital gain for the seller in the tax period in which this occurs; all of the foregoing without prejudice to the potential application to non-resident income tax payers not operating through a permanent establishment in Spain of the tax
treaties entered into by Spain to which they could be entitled or to the exemptions that may be applicable to them under Spanish domestic law.
b) In the case of income tax and non-resident income tax applicable to shareholders operating through a permanent establishment in Spain, taxes will be paid in accordance with applicable accounting standards and, as appropriate, with the special tax rules applicable to the shareholders subject to the aforementioned taxes, to the extent that a complete business cycle has been completed.
Sale to Ferrovial of the bonus issue rights: lastly, if the holders of bonus issue rights decide to avail themselves of the Ferrovial Purchase Commitment, the tax regime applicable to the amount obtained on the sale to Ferrovial of the bonus issue rights received in their capacity as shareholders will be as follows:
(i) if the shareholder is a natural person resident for tax purposes in Spain or a legal entity that does not satisfy the requirements to apply the exemption provided for in Article 21 of Spanish Income Tax Law 27/2014, the applicable tax regime shall be the regime which applies to the dividends paid directly in cash and, therefore, the amount obtained will be subject to the corresponding withholding tax;
(ii) if the shareholder is a natural person or legal entity not resident for tax purposes in Spain or a tax haven, and does not operate through a permanent establishment in Spain, the amount obtained shall not be subject to taxation in Spain pursuant to Chapter XIII of Title VII of Spanish Income Tax Law 27/2014, and, therefore, shall not be subject to withholding tax. In these cases, for this regime to apply the shareholder shall be required to evidence its tax residence by providing the corresponding certificate issued by the tax authorities in question;
(iii) if the shareholder is a legal entity resident in Spain for tax purposes or, if it is not a tax resident but operates through a permanent establishment in Spain and satisfies the requirements for the application of the exemption provided for in Article 21 of Spanish Income Tax Law 27/2014, the amount obtained shall be exempt from taxation in Spain and, therefore, shall not be subject to withholding tax.
It should be borne in mind that the taxation scenarios of the various options relating to the scheme known as the “Ferrovial Scrip Dividend” set out above do not explain all the possible tax consequences. Accordingly, the shareholders should consult their tax advisers on the specific tax effect of the proposed scheme and pay attention to any changes that could take place, both in in-force legislation and in the criteria of the interpretation thereof, as well as the particular circumstances of each shareholder or holder of bonus issue rights.

165
2015 Consolidated Annual Statements. Ferrovial S.A. and subsidiaries
APPENDIX II SUBSIDIARIES (fully consolidated companies) (Millions of euros)
Company Parent % of ownership
Net cost of the
ownership interest
Auditor
CORPORATE SPAIN (Registered office: Madrid, Spain) Ferrovial Inversiones, S.A. (a) Ferrovial, S.A. (a) 100% 0 Betonial, S.A. (a) Ferrovial, S.A. (a) 99% 32 Ferrovial Agroman S.A. (a) Ferrovial, S.A. (a) 100% 711 n
Can-Am, S.A. (a) Ferrovial, S.A. (a) 100% 2 Frin-Gold, S.A. (a) Ferrovial, S.A. (a) 99% 0 Inversiones Trenza, S.A. (a) Ferrovial, S.A. (a) 100% 1 Promotora Ibérica de Negocios, S.A. (a) Ferrovial, S.A. (a) 99% 0 Ferrovial Aeropuertos España S.A. (a) Ferrovial, S.A. (a) 99% 9 n
Ferrovial Emisiones, S.A. (a) Ferrovial, S.A. (a) 99% 0 n
Triconitex, S.L. (a) Ferrovial, S.A. (a) 100% 5 Ferrofin, S.L. (a) (i) Ferrovial, S.A. (a) 86% 1,577 n
Ferrovial Corporación, S.A. (a) Ferrovial, S.A. (a) 100% 5 n
Autovía de Aragón, S.C., S.A. (a) (ii) Ferrovial, S.A. (a) 15% 3 n
Cintra Infraestructuras, S.E. (a) Ferrovial, S.A. (a) 100% 1,521 n
Ferrovial Servicios, S.A.U. (a) Ferrovial, S.A. (a) 100% 264 n
Ferrovial Internacional, S.L.U. (a) Ferrovial, S.A. (a) 100% 5,560 n
Ferrovial FISA, S.L. (a) Ferrovial, S.A. (a) 100% 31 Temauri, S.L. (a) Ferrovial, S.A. (a) 100% 0 Tetabomoa, S.A. (a) Ferrovial, S.A. (a) 100% 0 Teraoui, S.A. (a) Ferrovial, S.A. (a) 100% 0 Cintra Infraestructuras España, S.L. (a) Ferrovial, S.A. (a) 99% 0 n
Grimalinvest, S.L. (a) Ferrovial, S.A. (a) 100% 14 LUXEMBOURG: Luxembourg Kripton Ra, S.A. (a) Ferrovial, S.A. (a) 100% 4 UNITED KINGDOM (Registered office: Oxford, United Kingdom ) Ferrocorp UK Limited Ferrovial, S.A. (a) 100% 1 Ferrovial International LTD. (a) Ferrovial Internacional S.L.U. (a) 100% 2.392 n
IRELAND (Registered office: Dublin, Ireland ) Alkes Reinsurance Ltd. Ferrovial, S.A. (a) 100% 3 CONSTRUCTION SPAIN (Registered office: Madrid, Spain) Ferrovial Agroman, S.A. (a) Ferrovial, S.A. (a) 100% 711 n
Ferrovial Conservación, S.A. (a) Ferrovial Agroman, S.A. (a) 99.0% 20 n
Aplicación de Recursos Naturales, S.A. (a) Ferrovial Agroman, S.A. (a) 100.0% 0 Autovía de Aragón Sociedad Concesionaria, S.A. (a) (ii) Ferrovial Agroman, S.A. (a) 25.0% 5 Encofrados Deslizantes y Técnicas Especiales, S.A. (a) Ferrovial Agroman, S.A. (a) 99.1% 2
Cadagua, S.A. (a) Ferrovial Agroman, S.A. (a) 100.0% 50 n
Compañía de Obras Castillejos, S.A. (a) Ferrovial Agroman, S.A. (a) 100.0% 8 n
Ditecpesa, S.A. (a) Ferrovial Agroman, S.A. (a) 100.0% 1 n
Norvarem, S.A.U. (a) Ferrovial Agroman Internacional, S.L.U. (a) 100.0% 141 nTécnicas del Pretensado y Servicios Auxiliares, S.A. (a)
Encofrados Deslizantes y Técnicas Especiales, S.A. (a) 100.0% 3 n
Concesionaria de Prisiones Lledoners, S.A. (a) Ferrovial Agroman, S.A. (a) 100.0% 16 n
Urbaoeste, S.A. (a) Ferrovial Agroman, S.A. (a) 99.0% 0 Concesionaria de Prisiones Figueras S.A.U. (a) Ferrovial Agroman, S.A. (a) 100.0% 11 n
Ferrrovial Railway, S.A. (a) Ferrovial Agroman, S.A. (a) 98.8% 0
Ferrrovial Railway, S.A. (a) Técnicas del Pretensado y Servicios Auxiliares, S.L. (a) 1.2% 0
Ferrovial Medio Ambiente y Energía, S.A. (a) Ferrovial Agroman, S.A. (a) 99.0% 1 Depusa Aragón S.A. (a) Ferrovial Agroman, S.A. (a) 42.3% 1 n
Depusa Aragón S.A. (a) Cadagua, S.A. (a) 51.7% 1 n
MEXICO (Registered office: Mexico DC, Mexico) Cadagua Ferrovial Industrial México Cadagua, S.A. (a) 75.1% 0 n
Cadagua Ferrovial Industrial México Ferrovial Medio Ambiente y Energía, S.A. (a) 24.9% 0 n
Ferrovial Agroman Mexico Ferrovial Agroman International, Ltd. (a) 100.0% 2 INDIA (Registered office: New Delhi, India) Cadagua Ferrovial India Pr Ltd. (a) Cadagua, S.A. (a) 95.0% 0 n
Cadagua Ferrovial India Pr Ltd. (a) Ferrovial Medio Ambiente y Energía, S.A. (a) 5.0% 0 PUERTO RICO (Registered office: Puerto Rico) Ferrovial Agroman, LLC Ferrovial Agroman Internacional, S.L.U. (a) 100.0% 6 n
POLAND (Registered office: Warsaw, Poland)
Tecpresa Techniniki Sprezan Técnicas del Pretensado y Servicios Auxiliares, S.L. (a) 70.0% 0 n
Tecpresa Techniniki Sprezan Budimex, S.A 30.0% 0 n
SPV-BN 1 Sp. z o.o. Budimex Nieruchomości Sp. z o.o. 100.0% 0 Poznańskie Przedsiębiorstwo Inwestycyjne Sp. z o.o. Budimex Nieruchomości Sp. z o.o. 100.0% 0
Mostostal Kraków S.A. Budimex S.A. 100.0% 3 n
Elektromontaż Warszawa S.A. Elektromontaż Poznań S.A. 50.7% 0 n
Elektromontaż Import Sp. z o.o. Elektromontaż Poznań S.A. 50.7% 0 Elektromontaż Poznań S.A. Budimex S.A. 92.3% 9 n
Instal Polska Sp. z o.o. Elektromontaż Poznań S.A. 50.7% 0 n
Budimex, S.A. Valivala Holding B.V. 59.1% 98 n
FBSerwis, S.A. (iii) Budimex, S.A. 49.00% 5 n
Budimex Kolejnictwo S.A. Budimex S.A. 100.0% 1 n
Budimex Parking Wrocław Sp. z o.o. Budimex S.A. 100.0% 1 n
Budimex Nieruchomości Sp. z o.o. Budimex S.A. 100.0% 155 n
Budimex Budownictwo Sp. z o.o. Budimex S.A. 100.0% 0 n
CHILE (Registered office: Santiago de Chile, Chile) Constructora Agroman Ferrovial Ltda. Ferrovial Agroman Emp. Const. Ltda. 97.2% 0 n
Constructora Agroman Ferrovial Ltda. Ferrovial Agroman Chile S.A. 2.8% 0 n
Ferrovial Agroman Chile S.A. Ferrovial Agroman Emp. Const. Ltda. 100.0% 10 n
Ferrovial Agroman Emp. Const. Ltda. Ferrovial Internacional, S.L.U (a) 100.0% 11 n
CANADA (Registered office: Canada) Ferrovial Agroman Canada Inc Constco Holdings B.V. 100.0% 0 n
NETHERLANDS (Registered office: Amsterdam, the Netherlands) Constco Holdings B.V. Ferrovial Agroman Internacional, S.L.U. (a) 100.0% 0 Valivala Holdings, B.V. Ferrovial Agroman Internacional, S.L.U. (a) 100.0% 141 UNITED STATES (Registered office: Houston, Texas, USA) Webber Management Group, LLC Norvarem S.A.U. (a) 100.0% 41 n
Webber, LLC Ferrovial US Construction Corp 100.0% 76 n
Webber Barrier Sevices, LLC Webber, LLC 100.0% 6 n
Bluebonnet Constractors, LLC Ferrovial Agromán Texas, LLC 60.0% 0 n
Bluebonnet Constractors, LLC DBW Construction, LLC 40.0% 0 n
Trinitry Infraestructure, LLC Ferrovial Agromán Texas, LLC 60.0% 0 n
Trinitry Infraestructure, LLC DBW Construction, LLC 40.0% 0 n
DBW Construction, LLC Webber, LLC 100.0% 0 n
Central Texas Mobility Constructors, LLC Webber LLC 55.0% 0 n
UNITED STATES (Registered office: Nebraska, USA) Southern Crushed Concrete, LLC Norvarem S.A.U. (a) 100.0% 88 n
UNITED STATES (Registered office: Austin Texas, USA) Ferrovial Agroman Texas, LLC Ferrovial Agromán US Corp. 100.0% 0 n
Ferrovial Agroman 56, LLC Ferrovial Agromán Texas, LLC 100.0% 0 n
UNITED STATES (Registered office: Chesterton, USA) Ferrovial Agroman Indiana, LLC Ferrovial Agroman US Corp 100.0% 0 n
UNITED STATES (Registered office: Virginia, USA) US 460 Mobility Partners LLC Ferrovial Agroman Southeast LLC 70.0% 0 n
UNITED STATES (Registered office: Wilmington-Newcastle, USA) Ferrovial Agroman US Corp Ferrovial US Construction Corp 100.0% 98 n
Ferrovial US Construction Corp Ferrovial Holding US Corp 100.0% 174 n
UNITED STATES (Registered office: Fort Worth Texas, USA) North Tarrant Infrastructure LLC Ferrovial Agroman Texas LLC 75.0% 0 n
North Tarrant Infrastructure LLC DBW Construction, LLC 25% 0 n
UNITED STATES (Registered office: Atlanta, USA) Ferrovial Agroman Southeast, LLC Ferrovial Agroman US Corp 100.0% 0 n
Company Parent % of ownership
Net cost of the
ownership interest
Auditor
UNITED STATES (Registered office: Wilmington-Newcastle, USA) Sugar Creek Construction LLC Ferrovial Agromán Southeast, LLC 70.0% 0 n
IRELAND (Registered office: Clondalkin, Ireland)Ferrovial Agroman Ireland, Ltda. Ferrovial Agroman Ltd holding UK 100.0% 8 n
NORTHERN IRELAND (Registered office: Northern Ireland) Ferrovial Agromán Irlanda del Norte, Ltda. Ferrovial Agromán Ireland Ltda. 100.0% 0 n
UNITED KINGDOM (Registered office: London, United Kingdom) Ferrovial Agroman Reino Unido Ltd. Ferrovial Agroman Holding UK 100.0% 24 n
Ferrovial Agroman Ltda. Holding Reino Unido Ferrovial Agroman International, Ltd. (a) 100.0% 49 n
Ferrovial Agroman International Ltd. (a) Ferrovial International Ltd. (a) 100,0% 216 n
Cadagua Al Ghubrah Cadagua, S.A. (a) 100.0% 5 n
GERMANY (Registered office: Cologne, Germany) Budimex Bau GmbH Budimex S.A. 100.0% 0 AUSTRALIA (Registered office: New Zealand, Australia) Ferrovial Agroman New Zeland Limited Ferrovial Agroman Australia PTY Ltd 100.0% 2 AUSTRALIA (Registered office: Sydney, Australia) Ferrovial Agroman Australia PTY LTD Ferrovial Agroman Holding UK 100.0% 18 n
BRAZIL (Registered office: Sao Paulo, Brazil) Ferrovial Agromán Ltda Brasil Ferrovial Agroman International, Ltd. (a) 99.0% 7 n
SAUDI ARABIA Ferrovial Agroman Company Compañía de Obras Castillejos, S.A. (a) 5.0% 0 n
Ferrovial Agroman Company Ferrovial Agroman, S.A. (a) 95.0% 1 n
AIRPORTS SPAIN (Registered office: Madrid, Spain) Ferrovial Aeropuertos Internacional S.A.U. (a) Ferrovial Internacional S.L.U. (a) 100.0% 127 n
Ferrovial Aeropuertos España S.A. (a) Ferrovial S.A. (a) 99.0% 9 n
CHILE (Registered office: Santiago de Chile, Chile) Aeropuerto Cerro Moreno Soc. Concesionaria S.A. Ferrovial Aeropuertos Internacional S.A.U. (a) 100% 0 n
Ferrovial Aeropuertos Chile Spa Ferrovial Airports International Ltd. (a) 100% 0 n
NETHERLANDS (Registered office: Amsterdam, the Netherlands) Hubco Netherlands B.V. Ferrovial Airports International Ltd. (a) 100.0% 783 n
Faero Latam B.V. Ferrovial Aeropuertos Internacional S.A.U. (a) 100.0% 0 n
UNITED KINGDOM (Registered office: London, United Kingdom) Faero UK Holding Limited Hubco Netherlands B.V. 100.0% 288 n
UNITED KINGDOM (Registered office: Oxford, United Kingdom) Ferrovial Airports International Ltd. (a) Ferrovial International Ltd. (a) 100,0% 2.024 n
TOLL ROADS SPAIN (Registered office: Madrid, Spain) Cintra Infraestructuras, S.E. (a) Ferrovial, S.A. (a) 100.0% 1,521 n
Cintra Infraestructuras Internacional S.L.U. (a) Ferrovial Internacional, S.L.U. (a) 100.0% 2,704 n
Autopista del Sol, C.E.S.A (a) Cintra Infraestructuras, S.E. (a) 80.0% 199 nCintra Inversora Autopistas de Cataluña, S.A. (a) Cintra Infraestructuras, S.E. (a) 100.0% 0 n
Inversora Autopistas de Cataluña, S.A. (a) Cintra Inversora Autopistas de Cataluña, S.A. (a) 100.0% 0 n
Autopista Terrasa Manresa, S.A (a) Inversora Autopistas de Cataluña, S.A. (a) 76.3% 445 n
Cintra Inversiones, S.L. (a) Cintra Infraestructuras, S.E. (a) 100.0% 318 n
Cintra Servicios de Infraestructura, S.A. (a) Cintra Infraestructuras, S.E. (a) 100.0% 16 n
Cintra Autopistas Integradas, S.A. (a) Cintra Infraestructuras, S.E. (a) 100.0% 0 M-203 Alcalá-O'Donnell (a) Cintra Infraestructuras, S.E. (a) 100.0% 58 n
PORTUGAL (Registered office: Vila Do Conde, Portugal) Via Livre, S.A. Cintra Infraestructuras, S.E. (a) 84.0% 0 n
Auto-Estradas Norte, S.A. Cintra Infraestructuras, S.E. (a) 84.0% 67 PORTUGAL (Registered office: Azores, Portugall) Euroscut Azores S.A. Cintra Infraestructuras, S.E. (a) 89.2% 0 n
PORTUGAL (Registered office: Loulé, Portugal) Autoestrada do Algarve, S.A. Cintra Infraestructuras, S.E. (a) 85.0% 23 n
NETHERLANDS (Registered office: Amsterdam, the Netherlands) Algarve International B.V. Cintra Infraestructuras, S.E. (a) 85.0% 0 n
407 Toronto Highway B.V. Cintra Global Holding, Ltd 100.0% 2,664 POLAND (Registered office: Warsaw, Poland) Autostrada Poludnie, S.A Cintra Infraestructuras, S.E. (a) 93.6% 1 n
CANADA (Registered office: Ontario, Canada) 4352238 Cintra Canada Inc. 407 Toronto Highway B.V. 100.0% 0 n
Blackbird Maintenance 407 Cintra GP 407 Toronto Highway B.V. 100.0% 0 Blackbird INF. 407 Cintra 407 Toronto Highway B.V. 100.0% 0 IRELAND (Registered office: Co. Kildare, Ireland) Eurolink Motorway Operation (M4-M6), Ltd. Cintra Infraestructuras Internacional, S.L.U. (a) 66.0% 0 n
Financinfrastructures Ltd. Cintra Global Holding, Ltd 100.0% 65 n
Cinsac, Ltd Cintra Infraestructuras Internacional, S.L.U. (a) 100.0% 0 n
Eurolink Motorway Operation (M3), Ltd. Cinsac, Ltd 95.0% 0 n
UNITED STATES (Registered office: Wilmington, USA) Ferrovial Holding US Corp Cintra Infraestructuras, S.E. (a) 100.0% 675 Cintra I-77 Mobility Partners LLC Cintra Holding US Corp 100% 2 I-77 Mobility Partners Holding LLC Cintra I-77 Mobility Partners LLC 50.1% 1 I-77 Mobility Partners LLC I-77 Mobility Partners Holding LLC 50.1% 2 UNITED STATES (Registered office: Texas, USA) Cintra Holding US Corp Ferrovial Holding US Corp 100.0% 512 Cintra Texas Corp. Cintra Holding US Corp 100.0% 0 Cintra US Services, LLC Cintra Texas Corp 100.0% 0 Cintra LBJ, LLC Cintra Holding US Corp 100.0% 315 LBJ Infraestructure Group Holding. LLC Cintra LBJ, LLC 51.0% 315 LBJ Infraestructure Group LBJ Infraestructure Group Holding, LLC 100.0% 618 n
Cintra NTE, LLC Cintra Holding US Corp 100.0% 222 NTE Mobility Partners Holding , LLC Cintra NTE, LLC 56.7% 222 NTE Mobility Partners , LLC NTE Mobility Partners Holding,LLC 100.0% 392 n
NTE Mobility Partners Segment 2 - 4 LLC Cintra NTE, LLC 75.0% 0 Cintra Toll Services, LLC Cintra Holding US Corp 100% 0 Cintra Texas 56, LLC Cintra Holding US Corp 100.0% 35 SH-130 Concession Company, LLC Cintra Texas 56, LLC 65.0% 207 n
Cintra NTE Mobility Partners Seg 3 LLC Cintra Holding US Corp 100.0% 89 NTE Mobility Partners Seg 3 Holding LLC Cintra NTE Mobility Partners Seg 3 LLC 50.1% 89 NTE Mobility Partners Seg 3 LLC NTE Mobility Partners Seg 3 Holding LLC 100.0% 179 n
UNITED STATES (Registered office: Chicago Ilinois, USA) Cintra Skyway LLC Cintra Holding US Corp 100.0% 217 SCC Holdings LLC Cintra Skyway LLC 55.0% 233 n
Skyway Concession Co.LLC SCC Holding LLC 100.0% 515 n
UNITED STATES (Registered office: Indiana, USA)
Cintra ITR LLC (iv) Cintra Holding US Corp / Cintra Texas Corp 49% / 1% 0
AUSTRALIA (Registered office: Sydney, Australia) Cintra Developments Australia PTY Ltd. Cintra UK 100.0% 0 COLOMBIA (Registered office: Bogota, Colombia) Cintra Infraestructuras Colombia S.A.S Cintra Global Holding, Ltd 100.0% 1,214 UNITED KINGDOM (Registered office: Oxford, United Kingdom) Cintra UK Cintra Global Holding, Ltd 100.0% 3 Cintra Uk I-77 Limited Cintra Infraestructuras, S.E. (a) 100.0% 2 Cintra Toowoomba Limited (a) Cintra UK 100.0% 3 Cintra Global Holding, Ltd (a) Cintra Infraestructuras Internacional S.L.U (a) 100.0% 2,870 n
SERVICES SPAIN (Registered office: Madrid, Spain) Ferrovial Servicios, S.A. (a) Ferrovial S.A. (a) 99.90% 5,560,13 n
Ferroser Servicios Auxiliares, S.A. (a) Ferrovial Servicios S.A. (a) 99.50% 9,78 n
Ferroser Infraestructuras, S.A. (a) Ferrovial Servicios S.A. (a) 99.98% 18,50 n
Andaluza de Señalizaciones S.A. (a) Ferroser Infraestructuras, S.A. (a) 100.00% 1,03 nAutovía de Aragón Sociedad Concesionaria, S.A. (a) (ii) Ferroser Infraestructuras, S.A. (a) 60.00% 11,32 n
The participation percentage and the net cost of the ownership interest correspond to the present values of the “Parent Company” over the “Company”.

166Company Parent % of
ownershipNet cost
of the ownership
interest
Auditor
FerroFin, S.L. (a) Ferrovial Servicios S.A. (a) 0.77% 14,61 n
FerroFin, S.L. (a) Compañía Española de Servicios Públicos Auxiliares, S.A. (a) 0.003% 0,06 n
Sitkol, S.A. (a) Compañía Española de Servicios Públicos Auxiliares, S.A. (a) 100.00% 4,83
Empresa Mixta Almendralejo, S.A. Compañía Española de Servicios Públicos Auxiliares, S.A. (a) 51.00% 0,13
Gestión Medioambiental de Toledo, S.A. Compañía Española de Servicios Públicos Auxiliares, S.A. (a) 60.00% 7,68 n
Albaida Residuos, S.L. (a) Cespa Gestion Residuos S.A (a) 100.00% 5,49 n
Técnicas Medioambientales Avanzadas, S.L. Albaida Residuos, S.L. (a) 55.00% 0,22 Tratamiento de Residuos Medioambientales, S.L. Albaida Residuos, S.L. (a) 54.99% 0,00
Ayora Gestión Biogas, S.L (a) Compañía Española de Servicios Públicos Auxiliares, S.A. (a) 80.00% 0,00 n
Ecoparc de Can Mata, S.L. (a) Compañía Española de Servicios Públicos Auxiliares, S.A. (a) 100.00% 11,00 n
Cespa Servicios Urbanos de Murcia, S.A. (a) Compañía Española de Servicios Públicos Auxiliares, S.A. (a) 100.00% 10,06 n
Compañía Española de Servicios Públicos Auxiliares, S.A. (a) Ferrovial Servicios S.A. (a) 100.00% 560,90 n
Cespa Jardinería S.A. (a) Compañía Española de Servicios Públicos Auxiliares, S.A. (a) 100.00% 6,58 n
Reciclaje y compostaje Piedra Negra, S.A. Cespa Gestion Residuos S.A (a) 100.00% 6,87 n
Cespa Gestion Residuos S.A (a) Compañía Española de Servicios Públicos Auxiliares, S.A. (a) 100.00% 87,19 n
Contenedores Reus S.A (a) Cespa Gestion Residuos S.A (a) 75.50% 0,00 nCespa Gestión Tratamientos de Residuos, S.A. (a) Cespa Gestion Residuos S.A (a) 100.00% 20,60 n
Ingenieria Ambiental Granadina S.A. (a) Compañía Española de Servicios Públicos Auxiliares, S.A. (a) 81.00% 2,61 n
Econenergia Can Mata AIE Cespa Gestion Residuos S.A (a) 70.00% 0,14 n
Econenergia Can Mata AIE Compañía Española de Servicios Públicos Auxiliares, S.A. (a) 30.00% 0,05 n
Tratamiento de Residuos y Energias Valencianas S.A Cespa Gestion Residuos S.A (a) 55.00% 0,88
Oñeder S.A Cespa Gestion Residuos S.A (a) 51.61% 0,00 n
SMART Hospital Cantabria, S.A. (a) Ferrovial Servicios S.A. (a) 85.00% 8,43 Ecoparc del Mediterrani, S.A Cespa Gestion Residuos S.A (a) 48.00% 2,52 nCompanya Especial de Recuperacions i Recondicionaments. S.L (a) Cespa Gestion Residuos S.A (a) 81.06% 0,00
PORTUGAL (Registered office: Lisbon, Portugal) Ferrovial Serviços, SA Ferrovial Servicies International Ltd 100.00% 23,08 n
Citrup, Lda Ferrovial Serviços, SA 70.00% 0,22 n
Ferrovial Serviços - Ecoambiente, ACE Ferrovial Serviços, SA 60.00% -Sopovico Soc. Port. Vías de Com- Cons. Infraestructuras Ferrovial Serviços, SA 100.00% 1,40 n
UNITED KINGDOM (Registered office: Oxford, United Kingdom) Amey UK Plc (a) Ferrovial Internacional, S.L.U. (a) 100.00% 606,01 n
Amey Holdings Limited Amey UK plc 100.00% 0,00 n
Amey plc Amey UK Plc (a) 100.00% - n
TPI Holdings Limited Amey OW Limited 100.00% -Transportation Planning International Limited TPI Holdings Limited 100.00% -Amey Airports Ltd Amey plc 100.00% -Amey Building Ltd Amey plc 100.00% -Amey Community Ltd Amey plc 100.00% - n
Amey Construction Ltd Amey plc 100.00% - n
Amey Datel Ltd Amey OW Ltd 100.00% -Amey Facilities Partners Ltd Comax Holdings Ltd 100.00% -Amey Fleet Services Ltd Amey plc 100.00% - n
Amey Group Information Services Ltd Amey plc 100.00% - n
Amey Group Services Ltd Amey plc 100.00% - n
Amey Highways Ltd Amey plc 100.00% - n
Amey Investments Ltd Amey plc 100.00% - n
Amey IT Services Ltd Amey plc 100.00% - n
Amey LG Ltd Amey plc 100.00% - n
Amey LUL 2 Ltd Amey Tube Ltd 100.00% - n
Amey Mechanical & Electrical Services Ltd Amey Community Limited 100.00% - n
Amey OW Group Ltd Amey plc 100.00% -Amey OW Ltd Amey OW Group Ltd 100.00% - n
Amey OWR Ltd Amey OW Group Ltd 100.00% - n
Amey Programme Management Ltd Amey plc 100.00% - n
Amey Rail Ltd Amey plc 100.00% - n
Amey Railways Holding Ltd Amey plc 100.00% -Amey Roads (North Lanarkshire) Ltd Amey LG Ltd 66.67% -Amey Services Ltd Amey plc 100.00% - n
Amey Technology Services Ltd Amey plc 100.00% -Amey Tramlink Ltd Amey Technololgy Services Ltd 100.00% -Amey Tube Ltd JNP Ventures Ltd 100.00% -Amey Ventures Asset Holdings Ltd Amey Investments Ltd 100.00% - n
Amey Ventures Ltd Amey plc 100.00% - n
Amey Ventures Management Services Ltd Amey Investments Ltd 1 - n
Amey Wye Valley Ltd Amey LG Ltd 80.00% - n
Comax Holdings Ltd Amey plc 100.00% - n
JNP Ventures 2 Ltd Amey Tube Ltd 100.00% -JNP Ventures Ltd Amey Ventures Ltd 100.00% -Sherard Secretariat Services Ltd Amey plc 100.00% - n
Wimco Ltd Amey Railways Holding Ltd 100.00% -Amey Public Services LLP Amey LG Ltd 66.67% - n
Nationwide Distribution Services Limited Amey LG Ltd 100.00% - n
AmeyCespa (MK) ODC Limited AmeyCespa Limited 100.00% - n
Amey Consulting USA, Inc. Amey OW Limited 1 - n
Amey Consulting Australia Pty Limited Amey OW Limited 1 - n
AmeyCespa (AWRP) Holding Co Limited Amey Ventures Asset Holdings Limited 100.00% -AmeyCespa (AWRP) SPV Limited AmeyCespa (AWRP) Holding Co Limited 100.00% -A.R.M. Services Group Limited Enterprise Holding Company No 1 Limited 100.00% - n
Access Hire Services Limited Enterprise Managed Services Limited 100.00% - n
Accord Asset Management Limited Accord Limited 100.00% - n
Accord Consulting Services Limited Accord Limited 100.00% - n
Accord Environmental Services Limited Accord Limited 100.00% -Accord Leasing Limited Accord Limited 100.00% -Accord Limited Enterprise plc 100.00% - n
Accord Network Management Limited Accord Asset Management Limited 100.00% -Arkeco Environmental Services Limited MRS Environmental Services Limited 100.00% -Brophy Enterprise Limited Brophy Grounds Maintenance Limited 100.00% - n
Brophy Grounds Maintenance Limited Enterprise Public Services Limited 100.00% - n
Byzak Limited Globemile Limited 100.00% -CCMR Limited Enterprise Holding Company No 1 Limited 100.00% -Countrywide Property Inspections Limited Durley Group Holdings Limited 100.00% -CRW Maintenance Limited Enterprise Holding Company No 1 Limited 100.00% -Datamerse Limited Durley Group Holdings Limited 100.00% -Durley Group Holdings Limited Enterprise Holding Company No 1 Limited 100.00% -Enterprise (AOL) Limited Accord Limited 100.00% - n
Enterprise (ERS) Limited Trinity Group Holdings Limited 100.00% -
Company Parent % of ownership
Net cost of the
ownership interest
Auditor
Enterprise (Venture Partner) Limited Enterprise Holding Company No 1 Limited 100.00% - n
Enterprise Building Services Limited Enterprise Holding Company No 1 Limited 100.00% - n
Enterprise Consulting and Solutions Limited Enterprise Holding Company No 1 Limited 100.00% -
Enterprise Foundation (ETR) Limited Enterprise Holding Company No. 1 Ltd (Member only) 100.00% -
Enterprise Holding Company No.1 Limited Enterprise plc 100.00% - nEnterprise Lighting Services Limited Enterprise Holding Company No 1 Limited 100.00% -Enterprise Maintenance Services Limited First Claims Response (Mcr) Limited 100.00% -Enterprise Managed Services (BPS) Limited Enterprise Managed Services Limited 100.00% - n
Enterprise Managed Services (E&CS) Limited Enterprise Managed Services Limited 100.00% - n
Enterprise Managed Services Limited Enterprise Utility Services Limited 100.00% - n
Enterprise plc Amey plc 100.00% - n
Enterprise Power Services Limited Enterprise Managed Services Limited 100.00% - n
Enterprise Public Services Limited Enterprise Holding Company No 1 Limited 100.00% - n
Enterprise Transport Services Limited Accord Limited 100.00% -Enterprise Utility Services (DCE) Limited Enterprise Holding Company No 1 Limited 100.00% -Enterprise Utility Services (Holdings) Limited Enterprise Holding Company No 1 Limited 100.00% -Amey Utility Services Limited ARM Services Group Limited 100.00% - n
Enterprisekeepmoat Limited Accord Limited 100.00% -First Claims Response (Manchester) Limited Enterprise Holding Company No 1 Limited 100.00% -First Claims Response Limited First Claims Response (Mcr) Limited 100.00% -Fleet and Plant Hire Limited Enterprise Managed Services Limited 100.00% - n
Globemile Limited Enterprise Managed Services Limited 100.00% -Haringey Enterprise Limited Accord Limited 100.00% -Heating and Building Maintenance Company Limited Enterprise Holding Company No 1 Limited 100.00% - n
Hillcrest Developments (Yorkshire) Limited Durley Group Holdings Limited 100.00% -ICE Developments Limited Enterprise Holding Company No 1 Limited 100.00% -J J McGinley Limited Enterprise Holding Company No 1 Limited 100.00% - n
JDM Accord Limited Accord Limited 100.00% -Lancashire Enterprises (Europe) Limited Enterprise Holding Company No 1 Limited 100.00% -MRS Environmental Services Limited Enterprise Holding Company No 1 Limited 100.00% - n
MRS St Albans Limited MRS Environmental Services Limited 100.00% -Prism Research Limited Enterprise Holding Company No 1 Limited 100.00% -Rhoburt Street Lighting Limited Enterprise Public Services Limited 100.00% -Schofield Lothian Group Limited Accord Limited 100.00% -Trinity Group Holdings Limited Enterprise Holding Company No 1 Limited 100.00% -TSG Services Limited Trinity Group Holdings Limited 100.00% -W.M.Y. Consulting Limited Enterprise Holding Company No 1 Limited 100.00% -Enterprise Business Solutions 2000 Limited Enterprise Holding Company No 1 Limited 90.00% -Enterprise Islington Limited Accord Limited 99.00% -EnterpriseManchester Partnership Limited Enterprise Managed Services Limited 80.00% - n
Slough Enterprise Limited Accord Environmental Services Limited 99.00% - n
Enterprise Fleet Limited Enterprise Managed Services Limited 54.50% -AmeyCespa Ltd Amey LG Ltd 50.00% - n
AmeyCespa Ltd Cespa UK S.A. 50.00% - n
AmeyCespa (East) Holdings Limited AmeyCespa Ltd 100.00% - n
AmeyCespa (East) Limited AmeyCespa (East) Holdings Limited 100.00% - n
AmeyCespa Services (East) Limited AmeyCespa (East) Limited 100.00% - n
AmeyCespa WM (East) Limited AmeyCespa Services (East) Limited 100.00% nAllerton Waste Recovery Park Interim SPV Limited AmeyCespa Limited 100.00% -
Novo Community Limited Amey Community Ltd 1 - n
AmeyCespa (AWRP) ODC Limited AmeyCespa Limited 1 - n
Amey (IOW) SPV Ltd Amey Ventures Asset Holdings Limited 50.00% -Amey Consulting LLC Amey OW Limited 0 - Travel Point Trading Limited Amey OWR Limited 1 - n
Amey Finance Services Limited Amey plc 1 - AmeyCespa (MK) SPV Limited AmeyCespa (MK) Holding Co Limied 100.00% -Cespa Ventures Ltd. Cespa UK S.A. 100.00% - n
Cespa UK S.A. Compañía Española de Servicios Públicos Auxiliares S.A 100.00% - n
UNITED KINGDOM (Registered office: Guernsey, United Kingdom) Amey Insurance Company PCC Ltd Amey plc 100.00% - n
UNITED KINGDOM (Registered office: Delaware, USA) AmeyWebber LLC Novo Community Limited 100.00% - UNITED KINGDOM (Registered office: Newcastle, USA) Amey Consulting USA, Inc. Amey OW Limited 100.00% - UNITED KINGDOM (Registered office: Glasgow, Scotland) Byzak Contractors (Escocia) Limited Byzak Limited 100.00% -C.F.M Building Services Limited (Escocia registered) Enterprise Managed Services Limited 100.00% - n
UNITED KINGDOM (Registered office: Oxford, United Kingdom) Ferrovial Services International Ltd. (a) Ferrovial International Ltd. (a) 100,00% 44 n
AUSTRALIA (Registered office: Melbourne, Australia) Amey Consulting Australia Pty Limited Amey OW Limited 100.00% -CHILE (Registered office: Santiago de Chile, Chile) Grupisa Chile, S.A. Ferrovial Servicios, S.A. (a) 66.00% 0,00 n
Ferrovial Servicios Chile, S.L. Ferrovial Services International, Ltd (a) 99.90% 7,57 n
Ferrovial Servicios Chile, S.L. Ferroser Infraestructuras, S.A. 0.10% 0,00 n
Steel Ingeniería, S.A. Ferrovial Servicios Chile, S.L. 100.00% 31,84 n
Ferrovial Servicios Salud, S.L Ferrovial Servicios, S.A. (a) 100.00% 0,00 n
POLAND (Registered office: Warsaw, Poland) FBSerwis, S.A. (iii) Ferrovial Services International, Ltd (a) 51.00% 12,52 n
Fbserwis Dolny Śląsk Sp. z o.o. FBSerwis, SA 100.00% 5,80 n
FBSerwis A zoo SPV FBSerwis, S.A 100.00% 0,04 n
FBSerwis B zoo SPV FBSerwis, S.A 100.00% 0,04 n
MOROCCO (Registered office: Tangier, Morocco)
Cespa Nadafa SARL Compañía Española de Servicios Públicos Auxiliares S.A. (a) 98.76% 0,00
Cespa Nadafa SARL Cespa Gestion Residuos S.A (a) 0.74% 0,00 IRELAND (Registered office: Warsaw, Poland) Landmille, Ltd. Ferrovial Internacional, S.L.U. (a) 100.00% 579,02 n
COLOMBIA (Registered office: Bogota, Colombia) Ferrovial Servicios Colombia SAS Ferrovial Services International, Ltd (a) 100.00% 0,00 n
Ferrovial Servicios Públicos Colombia SAS ESP Ferrovial Services International, Ltd (a) 99.95% 0,00 Ferrovial Servicios Públicos Colombia SAS ESP Ferrovial Servicios, S.A. (a) 0.01% 0,00
Ferrovial Servicios Públicos Colombia SAS ESP Cespa Compañía Española de Servicios Públicos S.A. (a) 0.01% 0,00
Ferrovial Servicios Públicos Colombia SAS ESP Cespa Gestion Residuos S.A (a) 0.01% 0,00 Ferrovial Servicios Públicos Colombia SAS ESP Ferroser Infraestructuras, S.A. (a) 0.01% 0,00 Ferrovial Servicios Públicos Colombia SAS ESP Ferrovial Servicios Colombia SAS 0.01% 0,00 REAL ESTATE SPAIN (Registered office: Madrid, Spain) Grimalinvest S.L. (a) Ferrovial, S.A. (a) 100% 14,14 Ferrovial FISA, S.L. (a) Ferrovial, S.A. (a) 100.0% 30,50 Vergarapromoinvest, S.L. (a) Ferrovial FISA S.L. (a) 99.7% 0,00
n Deloitte n BDO n Deloitte Polska Sp. z o.o. Sp. k. n BDO LLP n Baker Tilly
(i) The remaining percentage is owned by Ferrovial Agromán, S.A. 13,649, Ferrovial Servicios S.A. 0.773%, Ferrovial FISA, S.L 0.002% and Cespa S.A. 0.003% (ii) The remaining percentage is owned by Ferrovial Agromán, S.A. (25%) Ferrovial S.A. 15% and Ferrovial Servicios S.A. 60% (ii) The remaining percentage is owned by Ferrovial Services International Ltd 51% and Budimex S.A. 49%(iv) The remaining percentage is owned by Ferrovial Agroman US Corp 44%, Cintra Holding US Corp 49%, Webber LLC. 6% and Cintra Texas Corp 1% (a) Belong to the tax group of Ferrovial, S.A. and subsidiaries

167
2015 Consolidated Annual Statements. Ferrovial S.A. and subsidiaries
APPENDIX II ASSOCIATES (companies accounted for using the equity method) (Millions of euros)
Company Parent % of ownership Equity-account-ed value Assets Liabilities Revenue Profit/Loss Auditor
CONSTRUCTION SPAIN Investments in associates Ferrovial Agroman (*): Ferrovial Agroman, S.A. between 22% and 50.0% 3 404 322 41 2 Boremer, S.A. Cadagua, S.A. 50.00% 0 16 20 2 -2 n
Sociedad Concesionaria BAIO Ferrovial Agroman, SA 50.00% 2 4 0 0 -0Tecnológica Lena, S.L. Ferrovial Agroman, SA 50.00% 0 0 1 0 -0 Via Olmedo Pedralba, S.A. Ferrovial Agroman, SA 25.20% 0 14 13 3 -0 n
Urbs ludex Caudidicus, S.A. Ferrovial Agroman, SA 22.00% 0 369 288 36 4 n
POLAND Investments in associates Budimex (*): Budimex, S.A. between 26.3% and 30% 1 3 1 2 0PPHU Promos Sp. z o.o. Budimex SA 26.3% 0 3 1 2 0 Tecpresa Sp. z o.o. w likwidacji Budimex SA 30.0% 0 0 0 0 -0 OMAN Muscat City Desalination Company SAOC Cadagua Al Ghubrah 10.0% 4 280 241 20 -15 n
International Water Treatment LLC Cadagua, S.A. 37.5% 0 21 60 43 -4 n
Muscat City Desalination O&M CO LLC Cadagua, S.A. 7.0% 0 2 2 0 0 n
AIRPORTS UNITED KINGDOM FGP Topco Limited (*) Hubco Netherlands B.V. 25.00% 1,213 26,780 21,929 3,824 743 n
AGS Airports Holdings Limited Faero UK Holding Limited 50.00% 9 1,641 1,620 269 27 n
TOLL ROADS SPAIN Serrano Park, S.A. Cintra Infraestructuras, S.E. 50.00% -7 101 108 5 -4 n
A-334 Autovía del Almanzora Cintra Infraestructuras, S.E. 23.75% 1 7 1 1 -0 n
A66 Benavente - Zamora Cintra Infraestructuras, S.E. 25.00% 10 216 178 49 -15 n
Bip & Drive S.A. Cintra Infraestructuras, S.E. 25.00% 2 12 2 16 -2 CANADA 407 International Inc/ 407 East Development GGP: 4352238 Cintra Canada Inc. between 43.23% / 50.0% 1,920 4,368 6,103 1,072 233 407 International Inc. 4352238 Cintra Canada Inc. 43.23% 1,909 3,413 5,171 704 219 n
407 East Development Group General Partnership Cintra 407 East Development Group Inc. 50.00% 11 692 669 246 14 n
OMR and R407 East Develpment Group General Partnership Cintra OM&R 407 East Development Group Inc 50.00% 1 4 1 4 2 n
Blackbird Maintenance 407 GP (a) Blackbird Maintenance 407 Cintra GP 50.00% 0 0 0 0 0 Blackbird Inf. 407 GP (a) Blackbird Inf. 407 Cintra 50.00% -1 259 262 118 -2 GREECE Nea Odos, S.A. (ii) Ferrovial,S.A. 21.40% 0 826 751 75 0 n
Central Greece Motorway (ii) Ferrovial,S.A. 21.40% 0 1,039 974 11 0 n
Hellas Tolls, S.A. Ferrovial,S.A. 33.3% 0 4 5 3 -1 UNITED KINGDOM - Scot Roads Partnership Holdings LTD Cintra UK 20.00% 0 0 - - - n
Scot Roads Partnership Finance LTD Scot Roads Partnership Holdings LTD 20.00% 0 337 337 - - n
Scot Roads Partnership Project LTD Scot Roads Partnership Holdings LTD 20.00% 0 336 336 - - n
AUSTRALIA - Nexus Infraestructures Unit Trust (a) Cintra Toowoomba LTD 40.00% 12 28 8 75 -0 n
COLOMBIA - Ruta del Cacao (a) Cintra Infraestructuras Colombia 40.0% 3 31 25 0 -1 n
SERVICES SPAIN Investments in associates Servicios (*): between 9.23% and 50.00% 22 864 860 196 66 Nevasa Sitkol, S.A. 49.00% 0 18 18 4 0 n
Concesionaria Madrid Calle 30 S.A. Empresa de Mantenimiento y Explotación M-30 10.00% 12 592 592 124 55 n
Ingenieria Urbana S.A. Cespa, S.A. 35.00% 4 18 18 5 1 n
Empresa de Mantenimiento y Explotación M-30 S.A. Ferrovial Servicios, S.A. 50.00% 0 210 210 30 11 n
Aetec, S.A. Ferroser Infraestructuras, S.A. 9.23% 0 1 1 0 -0 Necropolis de Valladolid Sitkol, S.A. 49.00% 4 7 3 1 0 n
FerroNats Air Traffic Services, S.A. Ferrovial Servicios, S.A. 50.00% 2 7 7 13 2 n
Novalis Medioambiente S.A. Cespa Gestion Residuos S.A. 50.00% -0 4 4 2 -0 Nora, S.A. Compañía Española de Servicios Públicos Auxiliares S.A 40.00% 1 7 7 9 0 n
Vialnet Vic., S.L. Compañía Española de Servicios Públicos Auxiliares S.A 49.00% 0 1 1 2 0 n
Recollida de Residuos D´Osona S.L Compañía Española de Servicios Públicos Auxiliares S.A 45.00% 1 3 3 7 0 Valdedominguez 2000, S.A. Compañía Española de Servicios Públicos Auxiliares S.A 20.00% -1 14 14 3 -3 n
PORTUGAL Investments in associates Ferrovial Serviços, SA (*) between 20.00% and 45.00% 1 26 25 8 -0Valor Rib Industrial Residuos, Lda Ferrovial Serviços, SA 45.00% 1 5 4 1 -0 Ecobeirão, SA Ferrovial Serviços, SA 20.00% 0 20 20 6 0 n
Ferrovial Servicios, Egeo Tecnologia e Ambiente, Amândio Carvalho & Gabriel Couto, ACE Ferrovial Serviços, SA 35.00% 0 1 1 0 0 UNITED KINGDOM Investments in associates - Amey (*): 2%/50.00% 32 560 -540 595 13 GEO Amey PECS Limited Amey Community Limited 50.00% 0 18 -19 56 1 n
Amey Ventures Investments Ltd Amey Investments Ltd 9.97% 0 6 -6 0 -0 n
AHL Holdings (Manchester) Ltd Amey Ventures Investments Ltd 5.00% 0 2 -2 0 -0 n
Amey Highways Lighting (Manchester) Ltd AHL Holdings (Manchester) Ltd 5.00% 0 0 0 0 0 n
AHL Holdings (Wakefield) Ltd Amey Ventures Investments Ltd 5.00% 0 1 -1 0 0 n
Amey Highways Lighting (Wakefield) Ltd AHL Holdings (Wakefield) Ltd 5.00% 0 0 0 0 0 n
ALC (Superholdco) Ltd Amey Ventures Investments Ltd 5.00% 0 14 -10 20 6 n
ALC (FMC) Ltd ALC (Superholdco) Ltd 5.00% 0 0 0 0 0 n
ALC (Holdco) Ltd ALC (Superholdco) Ltd 5.00% 0 0 0 0 0 n
ALC (SPC) Ltd ALC (Holdco) Ltd 5.00% 0 0 0 0 0 n
Amey Belfast Schools Partnership Holdco Ltd Amey Ventures Investments Ltd 10.00% 0 15 -15 1 -0 n
Amey Belfast Schools Partnership PFI Co Ltd Amey Belfast Schools Partnership HoldCo Ltd 10.00% 0 0 0 0 0 n
Amey Birmingham Highways Holdings Ltd Amey Ventures Asset Holdings Ltd 33.33% 0 125 -129 28 -1 n
Amey Birmingham Highways Ltd Amey Birmingham Highways Holdings ltd 33.33% 0 0 0 0 0 n
Amey FMP Belfast Strategic Partnership Holdco Ltd Amey Ventures Management Services Ltd 10,00% 0 1 -1 5 0 n
Amey FMP Belfast Strategic Partnership SP Co Ltd Amey FMP Belfast Schools Partnership Holdco Ltd 10,00% 0 0 0 0 0 n
Amey Lagan Roads Holdings Ltd Amey Ventures Investments Ltd 5.00% 0 19 -20 1 -0 n
Amey Lagan Roads Financial plc Amey Lagan Roads Holdings Ltd 5.00% 0 0 0 0 0 n
Amey Lagan Roads Ltd Amey Lagan Roads Holdings Ltd 5.00% 0 0 0 0 0 n
Amey Lighting (Norfolk) Holdings Ltd Amey Ventures Investments Ltd 10.00% 0 5 -4 1 0 n
Amey Lighting (Norfolk) Ltd Amey Lighting (Norfolk) Holdings Ltd 10.00% 0 0 0 0 0 n
E4D & G HOLDCO Ltd Amey Ventures Investments Ltd 4.25% 0 13 -13 1 0 n
E4D & G Project Co Ltd E4D & G Holdco Ltd 4.25% 0 0 0 0 0 n
EduAction (Waltham Forest) Ltd (IP) Amey plc 50.00% 0 0 0 0 0 Integrated Bradford Hold Co One Ltd Amey Ventures Investments Ltd 6.52% 0 0 0 0 0 n
Integrated Bradford Hold Co One Ltd Integrated Bradford LEP Ltd 50.00% 0 0 0 0 0 n
Integrated Bradford PSP Ltd (IP) Amey Ventures Asset Holdings Ltd 6.00% 0 0 0 0 0 n
Integrated Bradford Hold Co Two Ltd Amey Ventures Asset Holdings Ltd 40.00% 0 23 -23 5 0 n
Integrated Bradford LEP Ltd Integrated Bradford PSP Ltd 40.00% 0 0 0 0 0 n
Integrated Bradford LEP Fin Co One Ltd Integrated Bradford LEP Ltd 6.52% 0 0 0 0 0 n
Integrated Bradford SPV One Ltd Integrated Bradford Hold Co One Ltd 6.00% 0 0 0 0 0 n
Integrated Bradford SPV Two Ltd Integrated Bradford Hold Co Two Ltd 50.00% 0 0 0 0 0 n
RSP (Holdings) Ltd Amey Ventures Investments Ltd 35.00% 0 0 0 0 0 n
The Renfrewshire Schools Partnership Ltd RSP (Holdings) Ltd 3.50% 0 0 0 0 0 n
Services Support (Avon & Somerset) Holdings Ltd Amey Ventures Investments Ltd 2.00% 0 2 -2 0 0 n
Services Support (Avon & Somerset) Ltd Services Support (Avon & Somerset) Holdings Ltd 2.00% 0 0 0 0 0 n
Amey Hallam Highways Holdings Limited Amey Ventures Asset Holdings Ltd 33.33% 0 85 -86 54 -0 n
The participation percentage and the consolidated equity-accounted value correspond to the contribution of each company to the group´s consolidated financial statements.

168
(i) Information on auditor not available (Ii) Participation of Ferrovial S.A. It remains at 33% but political rights correspond to 21.4%. GEK Holding Real Estate Construction SA 57.2% and ACS 21.4% (political rights).(*) Relate to all the investments in associates and the assets, liabilities, revenue and profit/loss correspond to the total aggregate figures. (*) Company header ADI Finance 1 and 2 which in turn held 100% participation on Heathrow Holdco Ltd (HAH).
n Deloitte n BDO n HLB Lebrija Álvarez y Cía S.C. n Valdés, García, Marín & Martínez, Llp n Deloitte Polska Sp. z o.o. Sp. k. n BDO LLP n Mohinder Puri & Company n HBD Accountancy Services n Baker Tilly n In-House
n Ernst & Young n Deloitte LLP n KPMG LLP n KPMG n Gabinete Técnico de Auditoria y Consultoria, S.A. n VIR Audit n Martins Pereira, João Careca & Associados, SROC, Lda. n Grant Thornton n HBD Accountancy Servicesn PWC
Company Parent % of ownership Equity-account-ed value Assets Liabilities Revenue Profit/Loss Auditor
Amey Hallam Highways Limited Amey Hallam Highways Holdings Ltd 33.33% 0 0 0 0 0 n
Carillion Amey Limited Enterprise Managed Services Limited 49.90% 0 45 -38 153 0 n
Carillion Amey (Housing Prime) Limited Enterprise Managed Services Limited 33.30% 0 10 -4 58 0 n
Leighton Boral Amey Qld Pty Limited Amey Consulting Australia Pty Limited 20.00% 0 3 -2 18 1 Leighton Boral Amey NSW Pty Limited Amey Consulting Australia Pty Limited 22.20% 0 1 -1 5 0 Keolis Amey Docklands Limited Amey Rail Limited 30.00% 0 9 -5 37 2 AmeyCespa (AWRP) Holding Co Limited Amey Ventures Asset Holdings Ltd 16.67% 0 34 -34 16 0 n
AmeyCespa (AWRP) SPV Limited AmeyCespa (AWRP) Holding Co Limited 16.67% 0 0 0 0 0 n
Scot Roads Partnership Holdings Limited Amey Ventures Asset Holdings Ltd 20.00% 0 52 -52 31 0 n
Scot Roads Partnership Project Limited Scot Roads Partnership Holdings Limited 20.00% 0 0 0 0 0 n
Scot Roads Partnership Finance Limited Scot Roads Partnership Holdings Limited 20.00% 0 0 0 0 0 n
MTCNovo Ltd Novo Community Limited 50.00% 0 0 4 65 4 The Thames Valley Community Rehabilitiation Company Ltd MTCNovo Ltd 50.00% 0 0 0 0 0 The London Community Rehabilitiation Company Ltd MTCNovo Ltd 50.00% 0 0 0 0 0 The Liverpool Joint Catholic and Church of England Academies Trust Member only (not for profit company) N/A 0 0 0 0 0 n
AmeyWebber LLC Amey OW Limited 50.00% 0 0 0 3 -0 AmeyCespa (MK) Holding Co Limited Amey Ventures Asset Holdings Ltd 50.00% 0 77 -76 37 0 n
AmeyCespa (MK) SPV Limited AmeyCespa (MK) Holding Co Limited 50.00% 0 0 0 0 0 n
QATAR Investments in associates Ferrovial Servicios (*): 49.0% 13 48 48 113 15 n
Ferrovial Qatar LLC Ferrovial Servicios, S.A. 49.0% 3 12 12 14 2 n
FMM Company LLC Ferrovial Servicios, S.A. 49.0% 9 36 36 99 14 n
REAL ESTATE SPAIN Promociones Hábitat (i) Ferrovial FISA, S.A. 20.00% 0 0 0 0 0
Total equity-accounted value 3,237

2015 Consolidated Financial Statements. Ferrovial, S.A. and Subsidiaries
169
The Company's Board of Directors analyses the performance of the Group mainly from a business perspective. From this perspective, the Board assesses the performance of the Construction, Toll Roads, Airports and Services segments. Set forth below are the consolidated statements of financial position and consolidated statements of profit or loss for 2015 and 2014, broken down by business segment. The “Other” column includes the assets and/or liabilities and income and/or expenses of the companies not assigned to any of the business segments, including most notably the Parent, Ferrovial, S.A., and its smaller subsidiaries, the current Polish real estate business, and inter-segment adjustments.
Segment statement of financial position: 2015 (millions of euros)
Assets Construction Toll roads Airports Services Other Total
Non-current assets 856 11,300 1,515 3,049 96 16,816
Goodwill 197 205 0 1,483 0 1,885
Intangible assets 5 5 0 221 2 234
Investments in infrastructure projects 203 7,878 0 692 -229 8,544
Investment property 6 0 0 0 10 15
Property, plant and equipment 111 16 0 352 10 491
Investments in associates 7 1,940 1,222 69 0 3,237
Non-current financial assets 24 274 286 143 27 755
Deferred tax assets 304 633 6 88 219 1,249
Non-current derivative financial instruments at fair value 0 349 0 0 58 406
Current assets 4,002 3,900 963 1,870 -2,187 8,548
Assets classified as held for sale 0 2,418 0 0 0 2,418
Inventories 131 9 0 29 218 387
Current income tax assets 16 36 3 16 49 120
Current trade and other receivables 810 488 13 1,390 -380 2,320
Cash and cash equivalents 3,044 937 948 431 -2,081 3,279
Receivable from Group companies 1,353 612 931 75 -2,971 0
Other 1,691 326 17 355 890 3,279
Current derivative financial instruments at fair value 1 11 0 4 7 23
TOTAL ASSETS 4,858 15,200 2,478 4,919 -2,091 25,364
Equity and liabilities Construction Toll roads Airports Services Other Total
Equity 1,245 3,752 2,437 1,561 -2,455 6,541
Equity attributable to the shareholders 1,254 3,336 2,437 1,546 -2,515 6,058
Equity attributable to non-controlling interests -8 416 0 15 60 483
Deferred income 1 1,056 0 30 0 1,088
Non-current liabilities 478 6,007 0 1,707 1,113 9,304
Pension plan deficit 2 0 0 44 0 46
Long-term provisions 189 172 0 326 151 838
Borrowings 160 4,696 0 1,030 810 6,697
Payable to Group companies 2 0 0 485 -488 0
Other 157 4,696 0 545 1,298 6,697
Other borrowings 11 105 0 55 0 171
Deferred tax liabilities 98 667 0 198 152 1,115
Derivative financial instruments at fair value 17 367 0 54 0 438
Current liabilities 3,134 4,385 41 1,620 -749 8,431
Liabilities classified as held for sale 0 2,690 0 0 0 2,690
Borrowings 43 1,307 43 384 -392 1,385
Payable to Group companies 9 55 43 312 -419 0
Other 34 1,253 0 72 27 1,385
Current derivative financial instruments at fair value 13 247 0 0 0 259
Income tax liabilities 49 -23 -3 7 98 128
Current trade and other payables 2,536 164 1 1,127 -464 3,364
Operating provisions and allowances 493 0 0 102 10 604
TOTAL EQUITY AND LIABILITIES 4,858 15,200 2,478 4,919 -2,091 25,364
APPENDIX III - SEGMENT REPORTING

2015 Consolidated Financial Statements. Ferrovial, S.A. and Subsidiaries
170
Segment statement of financial position: 2014 (millions of euros)
Assets Construction Toll roads Airports Services Other Total
Non-current assets 752 14,484 1,379 2,779 32 19,426
Goodwill 184 369 0 1,430 0 1,982
Intangible assets 5 7 0 206 5 223
Investments in infrastructure projects 205 10,375 0 564 -387 10,757
Investment property 5 0 0 0 0 6
Property, plant and equipment 97 20 0 323 10 451
Investments in associates 6 2,198 1,057 56 0 3,317
Non-current financial assets 17 416 315 103 6 856
Deferred tax assets 233 747 6 97 355 1,438
Non-current derivative financial instruments at fair value 0 353 0 0 42 395
Current assets 4,000 1,091 693 1,918 -1,655 6,048
Assets classified as held for sale 1 0 0 2 0 2
Inventories 139 11 0 31 176 357
Current income tax assets 20 28 0 12 14 74
Current trade and other receivables 946 278 9 1,304 -367 2,170
Cash and cash equivalents 2,894 771 685 569 -1,480 3,439
Receivable from Group companies 1,334 368 409 67 -2,178 0
Other 1,560 403 276 501 699 3,439
Current derivative financial instruments at fair value 0 4 0 0 1 5
TOTAL ASSETS 4,751 15,576 2,072 4,697 -1,623 25,473
Equity and liabilities Construction Toll roads Airports Services Other Total
Equity 1,072 3,291 1,956 1,406 -1,704 6,021
Equity attributable to the shareholders 1,085 2,998 1,956 1,396 -1,763 5,672
Equity attributable to non-controlling interests -13 293 0 10 59 349
Deferred income 3 956 0 28 0 987
Non-current liabilities 568 9,645 95 1,616 1,106 13,030
Pension plan deficit 2 0 0 99 0 101
Long-term provisions 188 717 0 321 152 1,378
Borrowings 166 6,859 0 883 800 8,707
Payable to Group companies 2 0 0 498 -500 0
Other 164 6,859 0 385 1,300 8,707
Other borrowings 11 140 29 51 -29 202
Deferred tax liabilities 181 679 67 200 183 1,310
Derivative financial instruments at fair value 20 1,251 0 62 0 1,332
Current liabilities 3,109 1,684 20 1,647 -1,024 5,435
Liabilities classified as held for sale 0 0 0 0 0 0
Borrowings 27 1,326 20 397 -402 1,368
Payable to Group companies 9 65 17 339 -430 0
Other 18 1,261 2 58 28 1,368
Current derivative financial instruments at fair value 1 68 0 8 22 100
Income tax liabilities 43 -64 -12 30 59 56
Current trade and other payables 2,622 354 12 1,153 -704 3,437
Operating provisions and allowances 416 0 0 58 0 475
TOTAL EQUITY AND LIABILITIES 4,751 15,576 2,072 4,697 -1,623 25,473
The detail of total assets by geographical areas:
(Millions of euros) 2015 2014 Change Spain 6,124 7,771 -1,647 UK 4,305 4,037 267 US 9,426 7,966 1,461 Canada 2,032 2,277 -245 Poland 1,227 1,022 205 Other 2,249 2,400 -151 TOTAL 25,364 25,473 -109

2015 Consolidated Financial Statements. Ferrovial, S.A. and Subsidiaries
171
Segment statement of profit or loss: 2015 (millions of euros)
2015 Construction Toll roads Airports Services Other Total
Revenue 4,287 513 8 4,897 -6 9,701 Other operating income 2 0 0 7 0 9 Total operating income 4,290 513 8 4,904 -6 9,709 Materials consumed 765 3 0 377 -2 1,143
Other operating expenses 2,452 110 15 2,221 -64 4,735 Staff costs 679 67 6 1,994 59 2,805 Total operating expenses 3,896 180 21 4,592 -7 8,683 Gross profit from operations 393 333 -13 312 1 1,027
Depreciation and amortisation charge 30 83 0 139 5 256 Profit from operations before impairment and non-current asset disposals 364 250 -13 173 -4 770 Impairment and disposals of non-current assets 4 131 0 -1 -4 131 Profit from operations 368 382 -13 172 -8 901
Financial result on financing -9 -427 0 -27 0 -463 Result on derivatives and other financial results 0 -195 0 -4 0 -200 Financial result of infrastructure projects -9 -622 0 -31 0 -662
Financial result on financing 26 17 9 -28 -61 -35Result on derivatives and other financial results -3 -12 24 -7 58 61 Financial result excluding infrastructure projects 24 5 34 -34 -2 26 Financial result 14 -617 34 -66 -2 -637
Share of profits of companies accounted for using the equity method -3 84 199 31 0 312 Consolidated profit before tax 380 -151 220 137 -10 577
Income tax -111 222 -4 -3 -49 54 Consolidated profit from continuing operations 269 71 216 134 -60 631
Net profit from discontinued operations 0 0 0 0 0 0
Consolidated profit for the year 269 71 216 134 -60 631
Loss for the year attributable to non-controlling interests -52 144 0 -1 -2 89 Profit for the year attributable to the Parent 217 215 216 134 -62 720
Segment statement of profit or loss: 2014 (millions of euros)
2014 Construction Toll roads Airports Services Other Total
Revenue 3,942 432 9 4,401 18 8,802 Other operating income 2 0 0 6 0 9 Total operating income 3,943 432 9 4,408 18 8,811 Materials consumed 777 3 0 337 14 1,131 Other operating expenses 2,208 111 16 1,839 -52 4,122 Staff costs 610 61 6 1,845 54 2,575 Total operating expenses 3,595 175 22 4,020 16 7,828 Gross profit from operations 349 257 -12 387 2 983 Depreciation and amortisation charge 37 75 0 128 5 244 Profit from operations before impairment and non-current asset disposals 312 182 -13 260 -3 738 Impairment and disposals of non-current assets 0 7 0 -2 0 5 Profit from operations 312 189 -13 258 -3 743
Financial result on financing -9 -345 0 -19 0 -373 Result on derivatives and other financial results 0 -8 0 -12 0 -20 Financial result of infrastructure projects -9 -353 0 -31 0 -393 Financial result on financing 26 5 13 -12 -64 -33 Result on derivatives and other financial results 6 -4 1 -9 56 49 Financial result excluding infrastructure projects 31 2 14 -22 -9 16 Financial result 22 -352 14 -53 -9 -377
Share of profits of companies accounted for using the equity method -12 60 70 20 0 138 Consolidated profit before tax 322 -103 71 226 -12 504
Income tax -112 8 1 -24 -24 -152Consolidated profit from continuing operations 210 -95 72 202 -37 352
Net profit from discontinued operations 0 0 0 0 0 0 Consolidated profit for the year 210 -95 72 202 -37 352
Loss for the year attributable to non-controlling interests -17 69 0 0 -3 50 Profit for the year attributable to the Parent 192 -25 72 202 -39 402

2015 Consolidated Financial Statements. Ferrovial, S.A. and Subsidiaries
172
SECTION 7: EXPLANATION ADDED FOR TRANSLATION TO ENGLISH
These consolidated financial statements are presented on the basis of the regulatory financial reporting framework applicable to the Group (see Note 2.1). Certain accounting practices applied by the Group that conform with that regulatory framework may not conform with other generally accepted accounting principles and rules.

173
ISSUE OF THE FINANCIAL STATEMENTSThe foregoing pages contain the consolidated financial statements –the balance sheet, income statement, statement of changes in equity, statement of cash flows and notes to the financial statements- and the consolidated management report of Ferrovial, S.A. for the year ended 31 December 2015, which was issued by the Company’s Board of Directors at the meeting held in Madrid on 25 February 2016 and which, pursuant to Article 253 of the Spanish Capital Companies Act, the directors attending sign below.
The Secretary of the Board of Directors states for the record that the Director Mr. Howard L. Lance has not signed this document because of his absence due to unavoidable professional commitments.
_________________________________
Mr. Santiago Ortiz Vaamonde
Secretary of the Board of Directors
_________________________________ _________________________________
Mr. Rafael del Pino y Calvo-Sotelo Mr. Santiago Bergareche Busquet
Chairman Vice-Chairman
_________________________________ _________________________________
Mr. Joaquín Ayuso García Mr. Íñigo Meirás Amusco
Vice-Chairman Managing Director
_________________________________ _________________________________
Mr. Juan Arena de la Mora Ms. María del Pino y Calvo-Sotelo
Director Director
_________________________________ _________________________________
Mr. Santiago Fernández Valbuena Mr. José Fernando Sánchez-Junco Mans
Director Director
_________________________________ _________________________________
Mr. Joaquín del Pino y Calvo-Sotelo Mr. Howard L. Lance
Director Director
_________________________________
Mr. Óscar Fanjul Martín
Director

174
B. AUDIT REPORT

175
2015 Management Report. Ferrovial S.A. and subsidiaries
Ferrovial Corporación, S.A.
Príncipe de Vergara, 135
28002 Madrid
Tel. +34 91 586 25 00
Fax +34 91 586 26 77
Airports (Ferrovial Airports)
C/Quintanavides. n,º 21 Edificio 5
Parque Vía Norte
28050 Madrid
Tel. +34 91 768 66 00
Toll Roads (Cintra)
Plaza Manuel Gómez Moreno, 2
Edificio Alfredo Mahou
28020 Madrid
Tel. +34 91 418 56 00
Fax +34 91 555 12 41
Services (Ferrovial Services)
C/Quintanavides. n,º 21 Edificio 5
Parque Vía Norte
28050 Madrid
Tel. +34 91 338 83 00
Fax +34 91 388 52 38
Construction (Ferrovial Agroman)
Ribera del Loira, 42
Parque Empresarial Puerta de las Naciones
28042 Madrid
Tel. +34 91 300 85 00
Fax +34 91 300 88 96
Shareholder Relations Office
Príncipe de Vergara, 135
28002 Madrid
Tel. +34 91 586 2565
For more information on any aspects of
the Annual Report:
Communications & Corporate
Responsibility Department
Príncipe de Vergara, 135
28002 Madrid
www.ferrovial.com
© Ferrovial, S.A. 2015. All rights reserved.
Prepared and produced by Ferrovial’s Communications and Corporate Responsibility Department.
Design: gosban consultora de comunicación