For personal use only - ASX · 2016 2021 ion Bank Debt Senior Notes 1,158 (29) 55 1,184 0 500 1,000...
30
© 2011 Boart Longyear. All rights reserved. TM 1 © 2009 Boart Longyear. All rights reserved. BOART LONGYEAR – 1H 2011 PERFORMING TO PLAN AUGUST 2011 © 2011 Boart Longyear. All rights reserved. Craig Kipp - CEO Joe Ragan - CFO Jay Clement - IR For personal use only
Transcript of For personal use only - ASX · 2016 2021 ion Bank Debt Senior Notes 1,158 (29) 55 1,184 0 500 1,000...

© 2011 Boart Longyear. All rights reserved.
TM
1
© 2009 Boart Longyear. All rights reserved.
BOART LONGYEAR – 1H 2011
PERFORMING TO PLAN
AUGUST 2011 © 2011 Boart Longyear. All rights reserved.
Craig Kipp - CEO Joe Ragan - CFO Jay Clement - IR
For
per
sona
l use
onl
y

TM
© 2011 Boart Longyear. All rights reserved.
2
IMPORTANT NOTICE AND DISCLAIMER
• This presentation has been prepared by Boart Longyear Limited, ABN 49 123 052 728 (Boart Longyear or the
Company). It contains general information about the Company’s activities as at the date of the presentation. It is
information given in summary form and does not purport to be complete. The distribution of this presentation in
jurisdictions outside Australia may be restricted by law, and you should observe any such restrictions.
• This presentation is not, and nothing in it should be construed as, an offer, invitation or recommendation in respect of
securities, or an offer, invitation or recommendation to sell, or a solicitation of an offer to buy, securities in any
jurisdiction. Neither this document nor anything in it shall form the basis of any contract or commitment. This
presentation is not intended to be relied upon as advice to investors or potential investors and does not take into
account the investment objectives, financial situation or needs of any investor. All investors should consider such
factors in consultation with a professional advisor of their choosing when deciding if an investment is appropriate.
• The Company has prepared this presentation based on information available to it, including information derived from
public sources that have not been independently verified. No representation or warranty, express or implied, is
provided in relation to the fairness, accuracy, correctness, completeness or reliability of the information, opinions or
conclusions expressed herein.
• This presentation includes forward-looking statements within the meaning of securities laws. Any forward-looking
statements involve known and unknown risks and uncertainties, many of which are outside the control of the Company
and its representatives. Forward-looking statements may also be based on estimates and assumptions with respect to
future business decisions, which are subject to change. Any statements, assumptions, opinions or conclusions as to
future matters may prove to be incorrect, and actual results, performance or achievement may vary materially from any
projections and forward-looking statements.
• Due care and attention should be undertaken when considering and analysing the financial performance of the
Company.
• All references to dollars are to United States currency unless otherwise stated.
For
per
sona
l use
onl
y

© 2011 Boart Longyear. All rights reserved.
TM
3
33
74
0
50
100
1H 2010 1H 2011
98
165
0
100
200
1H 2010 1H 2011
685
959
0
500
1000
1H 2010 1H 2011
• 40% Global Growth: Both businesses, all regions
• New Products: Market share increases
1H 2011 - RESULTS SUMMARY (US $M)
Revenue
EBITDA
• Pricing and margin recovery
• Excellent cost control – Lower SG&A percentage
• Increased dividend by 129%: 2.1 to 4.8 cents
• 13.5% ROE1
Net Profit After Tax (NPAT)
12% 16%
1. Average 1H Equity
5% 8%
14% 17%
For
per
sona
l use
onl
y

© 2011 Boart Longyear. All rights reserved.
TM
4
TECHNOLOGY LEADERSHIP
• Technology and safety upgrades
• More metres per person
• In front of expected demand through 2012:
• Rigs
• Labour
1H 2011 • 55 new rigs
• 29 decom. rigs
26 net adds
7UMX & 9UMX
Diamond Bits
Patents
Awarded Trademarks Patent
Applications
1H 2011
Roller Latch
Underground Head
Assembly
Surface Rock Drill &
Blast Rods
Reverse Circulation Rig
Rock Drill &
Blast Bits
Rod Lifter
Split Tube Loader
FY 2011 Est. • 80 new rigs
• 53 decom. rigs
27 net adds
For
per
sona
l use
onl
y

© 2011 Boart Longyear. All rights reserved.
TM
5
50
101
0
25
50
75
100
125
1H 2010 1H 2011
250 300
0
100
200
300
400
2016 2021U
S$ m
illio
n
Bank Debt Senior Notes
1,158 (29) 55 1,184
0
500
1,000
1,500
Dec2010
Decoms Adds Jun 2011
0%
50%
100%
150%
200%
1H 2010 1H 2011
EXECUTING GROWTH STRATEGY
Manufacturing: Capacity
Rig Upgrades: Capacity & Productivity
CAPEX: Supporting Growth
Through the Cycle Capital Structure
Rig Count
Rod Capacity (Indexed to 2010)
Debt Maturity
CAPEX
US
$ m
illio
n
For
per
sona
l use
onl
y

TM Company confidential – unauthorized use or distribution prohibited
© 2011 Boart Longyear. All rights reserved.
6
Mine Site - Northern Canada
FINANCIAL OVERVIEW
© 2011 Boart Longyear. All rights reserved.
For
per
sona
l use
onl
y
© 2011 Boart Longyear. All rights reserved.
TM
7
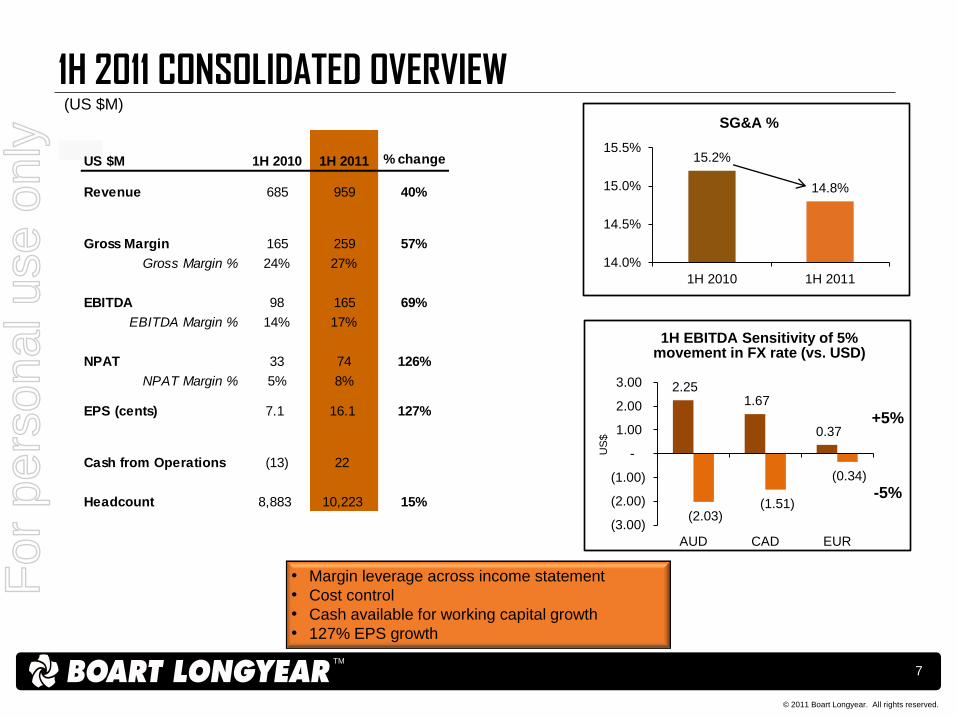
• Margin leverage across income statement
• Cost control
• Cash available for working capital growth
• 127% EPS growth
1H 2011 CONSOLIDATED OVERVIEW (US $M)
US $M 1H 2010 1H 2011 % change
Revenue 685 959 40%
Gross Margin 165 259 57%
Gross Margin % 24% 27%
EBITDA 98 165 69%
EBITDA Margin % 14% 17%
NPAT 33 74 126%
NPAT Margin % 5% 8%
EPS (cents) 7.1 16.1 127%
Cash from Operations (13) 22
Headcount 8,883 10,223 15%
15.2%
14.8%
14.0%
14.5%
15.0%
15.5%
1H 2010 1H 2011
SG&A %
1H EBITDA Sensitivity of 5% movement in FX rate (vs. USD)
+5%
-5%
2.25 1.67
0.37
(2.03) (1.51)
(0.34)
(3.00)
(2.00)
(1.00)
-
1.00
2.00
3.00
AUD CAD EUR
US
$
For
per
sona
l use
onl
y

TM Company confidential – unauthorized use or distribution prohibited
© 2011 Boart Longyear. All rights reserved.
8
685
165 59 49
959
1H 2010 Volume / Mix Price FX 1H 2011
Revenue Bridge (US $M)
1H 2011 CONSOLIDATED OVERVIEW
98
59
59 (32)
(35)
9 7
165
1H 2010 Volume / Mix Price SG&A Material / LabourInflation
FX Other 1H 2011
EBITDA Bridge
For
per
sona
l use
onl
y

© 2011 Boart Longyear. All rights reserved.
TM
9
• Positives: Pricing and Productivity
• Challenges: Some inflation margin erosion and labour availability
• Selective on Pricing, Terms, and Locations
• Ramp up costs continue
DRILLING SERVICES
Drilling Services
US $M 1H 2010 1H 2011 % change
Revenue 511 682 33%
EBITDA 91 129 42%
EBITDA Margin % 18% 19%
91
54 24 (31)
(15) 6
129
1H 2010 Pricing Volume / Mix Material /LabourInflation
SG&A Fx 1H 2011
(US
$ M
)
(US $M)
For
per
sona
l use
onl
y
© 2011 Boart Longyear. All rights reserved.
TM
10
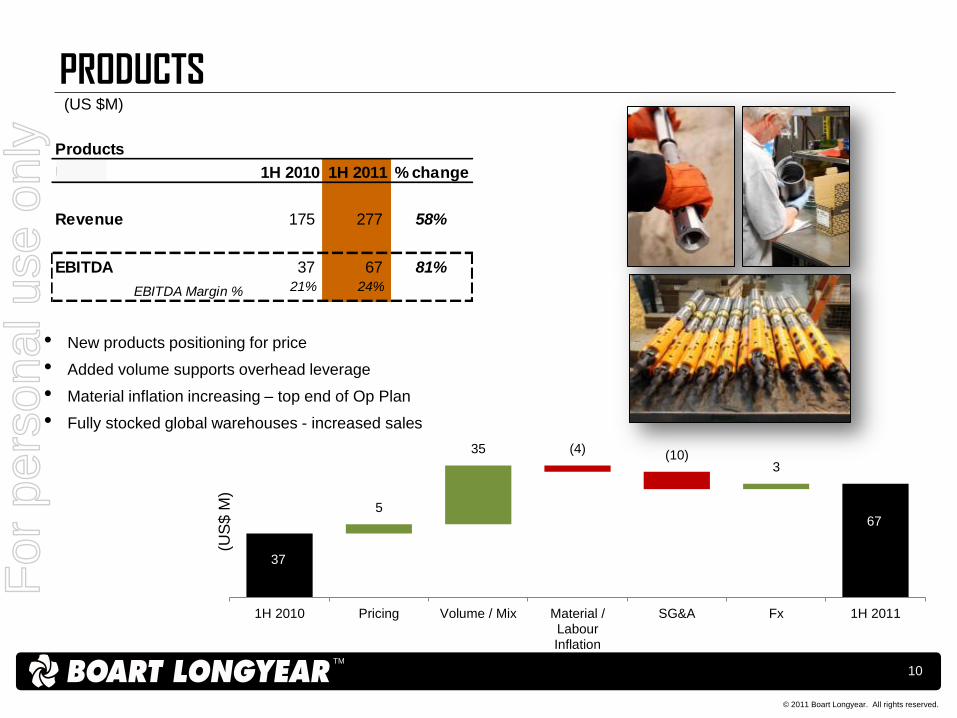
PRODUCTS
Products
US $M 1H 2010 1H 2011 % change
Revenue 175 277 58%
EBITDA 37 67 81%
EBITDA Margin % 21% 24%
• New products positioning for price
• Added volume supports overhead leverage
• Material inflation increasing – top end of Op Plan
• Fully stocked global warehouses - increased sales
37
5
35 (4) (10) 3
67
1H 2010 Pricing Volume / Mix Material /LabourInflation
SG&A Fx 1H 2011
(US
$ M
)
(US $M)
For
per
sona
l use
onl
y

© 2011 Boart Longyear. All rights reserved.
TM
11
1H 2011: CASH AND DEBT
1H 2011 Net Debt Bridge
1H 2011 Cash Flow Cash flow and capital
structure supporting growth
(US $M)
95
85
152 (130)
(101)
(16) (16)
69
0
50
100
150
200
250
300
350
Cash BalanceDec 2010
Net Borrowings Cash from Operations(before WC)
Working Capital CAPEX Dividends Other Cash BalanceJun 2011
154
267 (165) 130
10 8
101 16
13
-
50
100
150
200
250
300
Net DebtDec 2010
WorkingCapitalChange
EBITDA Net CashInterest
Cash Tax CAPEX Dividends Other Net DebtJun 2011
For
per
sona
l use
onl
y

© 2011 Boart Longyear. All rights reserved.
TM
12
1.2x
0.0x
0.5x
1.0x
1.5x
2.0x
2.5x
3.0x
3.5x
4.0x
1
Gro
ss D
eb
t /
EBIT
DA
16.4x
0.0x
2.0x
4.0x
6.0x
8.0x
10.0x
12.0x
14.0x
16.0x
18.0x
1
EBIT
DA
/ In
tere
st
250 300
0
50
100
150
200
250
300
350
2012 …… 2016 …… 2021
DEBT (PRO-FORMA JUNE 2011)
Revolver Covenant
Compliance
3.5x Max.
Leverage
Interest Cover
3.0x Min.
Interest Cover
Through the Cycle Capital Structure
Senior Notes
(New – March 2011)
Debt Maturity – New 2011 Capital Structure
Bank Debt
(New - July 2011)
1. 2X Trough EBITDA, assumes $50M cash
(US $M)
• Over US$200M undrawn • Staggered maturities • All IPO debt facilities now retired
For
per
sona
l use
onl
y

© 2011 Boart Longyear. All rights reserved.
TM
13
2011 GROWTH “ORGANIC” SPEND
17%
21%
13%
49%
0%
20%
40%
60%
80%
100%
120%
2011 - $210 million
New Rigs & Upgrades
Rig Rebuilds
Technology
Mfg. Capacity
Fleet Optimisation • More metres per shift • More metres per rig, per person • Safety upgrades
Drive ROI Performance • New drilling technologies driving productivity • New geographies – Products & Services • Adding manufacturing and drilling capacity
Drilling Services
Products and
Corporate
Technology • New product development (R&D) • Global IT systems
Rebuild • Rebuild rigs after ~ 5 years
Mfg. capacity • Manufacturing, outsourcing,
warehousing and distribution
(US $M)
For
per
sona
l use
onl
y

© 2011 Boart Longyear. All rights reserved.
TM
14
74
22
0
10
20
30
40
50
60
70
80
NPAT Dividend
DIVIDEND PAYMENT
30% Payout Ratio
35% Franked
1H 2011 (US $M)
Record Date: 9 September 2011
Payment Date: 7 October 2011
2.1
3.4
4.8
1H 2010 2H 2010 1H 2011
Dividend History (US cents)
For
per
sona
l use
onl
y
TM Company confidential – unauthorized use or distribution prohibited
© 2011 Boart Longyear. All rights reserved.
15
© 2011 Boart Longyear. All rights reserved.
MARKET OVERVIEW
© 2011 Boart Longyear. All rights reserved.
For
per
sona
l use
onl
y

© 2011 Boart Longyear. All rights reserved.
TM
16
Air Quality • Replacing Solvent-based paints • Reducing emissions
Energy Efficiency • Installed high efficiency compressors • Rigs utilizing Tier 3 & 4 Diesel Engines
Waste Minimization • Waste tracking programs • Recycling carbon & scrap metal waste
40%
45%
50%
55%
60%
65%
70%
75%
80%
OPERATIONS – STRONG UNDERLYING TRENDS
Products: • Capacity available through 2012 • Higher inventory levels in warehouse: Readiness to serve • Backlog stabilising: Faster delivery times (orders = shipments) Services: • Controlled growth:
• Allowing proper driller training (safety) • Optimising contracts: Key clients, larger sites, terms • 2011 forecast: 75% to 80% rig utilisation
• Expanding to meet demand through 2012 – rigs & labour
0%
50%
100%
150%
200%
250%
300%
350%
Drilling Products Order Backlog (Indexed to Jan-09)
Products Services M&E1 Drilling Services Rig Utilisation2
1. Minerals & Energy (M&E) 2. Rig utilisation is defined as % of total fleet either operating or assigned
• Backlog up 27% vs. Dec 2010 • Strong utilisation throughout 1H 2011
75% - 80%
Environmental Sustainability (1H 2011 Focus)
For
per
sona
l use
onl
y

© 2011 Boart Longyear. All rights reserved.
TM
17
1.8 2.4 3.2 4.2 4.9
3.5 5.4
- - - - - - - -
1.0 1.5
2.4
3.6
5.2
2.6
3.5
- - - - - - -
0.8
1.2
1.7
3.2
3.7
- - - - -
3.6
5.0
7.3
11.0
13.9
8.0
11.5
14.0
19.0
20.4 19.3
17.1 18.0
20.8
22.5
2004 2005 2006 2007 2008 2009 2010 2011 2012 2013 2014 2015 2016 2017 2018
Gold Exploration Spend Base Metal Exploration Spend Other Exploration Spend Future Projections
Equity raisings by Juniors**
OUTLOOK - 2011
*Source: 2004 – 2010 Metals Economics Group; 2011 – 2018 McKinsey Analysis
Total worldwide nonferrous exploration spend ($ Billions)*
• Potential record 2011 exploration spend • YTD 2011 utilisation rates: As planned • Inflation challenges:
• Labor & material • High end of 2011 op plan
• Junior capital raising in 1H 2011: Very strong • YTD price increases: As planned • Focused on shareholder value: Not utilisation
GFC
*
**Source: Thomson ONE. Junior Miners are defined as mining sector companies with market cap of less than US$500mm at the time of raising.
Exploration spend rising as expected
Juniors entering markets as expected
$-
$500
$1,000
$1,500
$2,000
$2,500
$3,000
$3,500
$4,000
$4,500
$5,000
Dec-0
4
Ma
r-05
Jun
-05
Se
p-0
5
Dec-0
5
Ma
r-06
Jun
-06
Se
p-0
6
Dec-0
6
Ma
r-07
Jun
-07
Se
p-0
7
Dec-0
7
Ma
r-08
Jun
-08
Se
p-0
8
Dec-0
8
Ma
r-09
Jun
-09
Se
p-0
9
Dec-0
9
Ma
r-10
Jun
-10
Se
p-1
0
Dec-1
0
Ma
r-11
Jun
-11
(in
mil
lio
ns
US
D)
ASX TSX-V TSX London AIM OTC Other
For
per
sona
l use
onl
y

© 2011 Boart Longyear. All rights reserved.
TM
18
GOLD: PRODUCTION VS. RESOURCES
*Sources: Metals Economics Group, Kitco
Continued drilling anticipated – gold reserves not being replenished
$-
$200
$400
$600
$800
$1,000
$1,200
$1,400
$1,600
$1,800
-
20
40
60
80
100
120
140
160
180
200
1997 1998 1999 2000 2001 2002 2003 2004 2005 2006 2007 2008 2009 2010 2011
Ave
rag
e p
ric
e o
f g
old
(U
SD
/ o
z.)
Go
ld m
ine
d a
nd
dis
co
ve
red
(m
illi
on
oz.)
World mine production Resources in discoveries 3-year average Gold price
Data not
Available
For
per
sona
l use
onl
y

© 2011 Boart Longyear. All rights reserved.
TM
19
Exploration Products
23%
Surface Core Drilling 39%
Rotary Drilling 17%
Production 46%
Exploration 26%
Development 20%
Non-Mining
8%
Gold 40%
Copper 21%
Nickel 8%
Iron 8%
Other Metals 6%
Energy 1%
Environmental 5% Other
11%
Major 80%
Junior 12%
Non-Mining
8%
Total Company 1H 2011 Revenue - Products and Services
1H 2011 Drilling Service Revenue by Stage
1H 2011 Drilling Service Revenue by Commodity
DIVERSIFIED END MARKET EXPOSURE – 1H 2011
Over 20% of total revenue comes from
non-exploration
Gold, Copper, Nickel, and
Iron: >75% of revenue
Production mining is almost 50% of drilling
service revenue
1H 2011 Drilling Service Revenue by Customer Type
Focused on key clients
Percussive Products
6%
Percussive Drilling 2%
Underground Drilling
8% Non-Mining Drilling
5%
For
per
sona
l use
onl
y

TM
© 2011 Boart Longyear. All rights reserved.
20
INCREASING GLOBAL ENFORCEMENT
USA Foreign
Corrupt
Practices Act
UK Bribery Act
Canada
Corruption of
Foreign Public
Officials Act
Australia
Criminal Code
Registered to do
Business
Pay All Taxes
Ethical Business Partners
Proper Import
Procedures
No Improper Payments
Visas and Work
Permits
Investing resources to ensure…
For
per
sona
l use
onl
y

TM
© 2011 Boart Longyear. All rights reserved.
21
2H 2011 – KEY METRICS Total Company Pricing (indexed to 2H 2008)
Total Company Inflation vs. Op Plan
100% -5%
-5%
-3% 2%
6% 95%
80%
85%
90%
95%
100%
105%
2H 2008 1H 2009 2H 2009 1H 2010 2H 2010 1H 2011 Current
2011Op Plan
Labour Material Mitigation 2011Forecast
Starting second year of re-pricing
Ge
ne
ric
BL
Y T
ren
ds
For
per
sona
l use
onl
y

© 2011 Boart Longyear. All rights reserved.
TM
22
2011 GUIDANCE
*Note: Guidance assumes normal seasonality in November and December and constant fx.
Upside to Guidance:
• Pricing and margins continue
to accelerate?
• Global rig demand?
• On-going exploration demand?
• Commodity pricing?
• New product adaption?
Risk to Guidance:
• Global economic disruption?
• Fx (Stronger US$)?
• China slowdown?
• Inflation (labour, material)?
• Labour availability?
US $M 2010 ActualPrevious
GuidanceNEW
GuidanceYOY %
change
Revenue 1,476 1,750 1,900 29%
EBITDA 222 300 330 49%EBITDA Margin % 15% 17% 17%
200 50%CAPEX 140 210
(US $M)
For
per
sona
l use
onl
y

© 2011 Boart Longyear. All rights reserved.
TM
23
2012 – PLANNING FOR THE FUTURE
*Source: 2011 – 2018 McKinsey Analysis
“Through the Cycle” Capital Structure
Expand: New Geographies, Drilling Types, and Products
Invest in Global Compliance
Hire and Train New Employees
14.0
19.0 20.4
2011 2012 2013
Projected Future M.E.G. Spend*
(in billions USD)
Remaining flexible –
maintaining variable structure For
per
sona
l use
onl
y

TM Company confidential – unauthorized use or distribution prohibited
© 2011 Boart Longyear. All rights reserved.
24
© 2009 Boart Longyear. All rights reserved.
Pilbara – Western Australia
APPENDIX
© 2011 Boart Longyear. All rights reserved.
For
per
sona
l use
onl
y

TM Company confidential – unauthorized use or distribution prohibited
© 2011 Boart Longyear. All rights reserved.
25
BASIS OF PREPERATION
• Financial information has been extracted from underlying financial report data which
has been prepared in accordance with A-IFRS
• All financial figures are reported in US$
• Earnings per share computations reflect the weighted average number of fully paid
ordinary shares issued by Boart Longyear and outstanding as at 30 June 2011
(455,958,822 shares) and 30 June 2010 (458,449,150 shares)
For
per
sona
l use
onl
y

TM Company confidential – unauthorized use or distribution prohibited
© 2011 Boart Longyear. All rights reserved.
26
INCOME STATEMENT Extract from the Boart Longyear 1H 2011 Report – periods ended 30 June
Half-year Half-year
ended ended
30 June 2011 30 June 2010
Note US$'000 US$'000
Continuing operations
Revenue 958,765 685,411
Cost of goods sold (699,827) (520,645)
Gross margin 258,938 164,766
Other income 4 3,111 1,498
General and administrative expenses (115,763) (84,956)
Selling and marketing expenses (25,955) (19,417)
Other expenses 4 (7,653) (11,337)
Operating profit 112,678 50,554
Interest income 2,410 1,626
Finance costs 5 (9,375) (4,416)
Profit before taxation 105,713 47,764
Income tax expense (31,630) (15,053)
Profit for the period attributable
to equity holders of the parent 74,083 32,711
Earnings per share
Basic earnings per share 16.2 cents 7.1 cents
Diluted earnings per share 16.2 cents 7.1 cents
Other comprehensive income (loss)
Profit for the period attributable to equity holders of the parent 74,083 32,711
Exchange differences arising on translation of foreign operations 26,624 (22,985)
Gains on cash f low hedges recorded in equity 193 272
Transfer to profit or loss on cash f low hedges 137 -
Income tax on income and expense recognised directly through equity (71) (96)
Other comprehensive income (loss) for the period, net of tax 26,883 (22,809)
Total comprehensive income for the period attributable
to equity holders of the parent 100,966 9,902
For
per
sona
l use
onl
y

TM Company confidential – unauthorized use or distribution prohibited
© 2011 Boart Longyear. All rights reserved.
27
BALANCE SHEET - ASSETS Extract from the Boart Longyear 1H 2011 Report – periods ended 30 June
30 June 31 December
2011 2010
Note US$'000 US$'000
Current assets
Cash and cash equivalents 68,631 94,944
Trade and other receivables 6 399,367 276,836
Inventories 376,668 283,115
Current tax receivable 17,724 21,705
Prepaid expenses and other assets 25,600 17,965
Defined benefit plan asset 7 20,373 -
Total current assets 908,363 694,565
Non-current assets
Property, plant and equipment 482,615 439,446
Goodw ill 8 302,310 297,408
Other intangible assets 8 112,293 106,295
Deferred tax assets 149,886 147,322
Other assets 1,090 1,918
Defined benefit plan asset 7 - 20,335
Total non-current assets 1,048,194 1,012,724
Total assets 1,956,557 1,707,289
Current liabilities
Trade and other payables 323,257 260,038
Provisions 10 22,264 18,398
Other f inancial liabilities 11 2,522 7,272
Current tax payable 60,648 46,338
Loans and borrow ings 9 40,959 979
Total current liabilities 449,650 333,025
Non-current liabilities
Loans and borrow ings 9 294,483 247,490
Deferred tax liabilities 15,890 11,468
Provisions 10 56,380 55,337
Total non-current liabilities 366,753 314,295
Total liabilities 816,403 647,320
Net assets 1,140,154 1,059,969
Equity
Issued capital 1,128,562 1,132,051
Reserves 109,848 84,577
Other equity (137,182) (137,182)
Accumulated profit (losses) 38,926 (19,477)
Total equity 1,140,154 1,059,969
For
per
sona
l use
onl
y

TM Company confidential – unauthorized use or distribution prohibited
© 2011 Boart Longyear. All rights reserved.
28
Extract from the Boart Longyear 1H 2011 Report – periods ended 30 June
30 June 31 December
2011 2010
Note US$'000 US$'000
Current assets
Cash and cash equivalents 68,631 94,944
Trade and other receivables 6 399,367 276,836
Inventories 376,668 283,115
Current tax receivable 17,724 21,705
Prepaid expenses and other assets 25,600 17,965
Defined benefit plan asset 7 20,373 -
Total current assets 908,363 694,565
Non-current assets
Property, plant and equipment 482,615 439,446
Goodw ill 8 302,310 297,408
Other intangible assets 8 112,293 106,295
Deferred tax assets 149,886 147,322
Other assets 1,090 1,918
Defined benefit plan asset 7 - 20,335
Total non-current assets 1,048,194 1,012,724
Total assets 1,956,557 1,707,289
Current liabilities
Trade and other payables 323,257 260,038
Provisions 10 22,264 18,398
Other f inancial liabilities 11 2,522 7,272
Current tax payable 60,648 46,338
Loans and borrow ings 9 40,959 979
Total current liabilities 449,650 333,025
Non-current liabilities
Loans and borrow ings 9 294,483 247,490
Deferred tax liabilities 15,890 11,468
Provisions 10 56,380 55,337
Total non-current liabilities 366,753 314,295
Total liabilities 816,403 647,320
Net assets 1,140,154 1,059,969
Equity
Issued capital 1,128,562 1,132,051
Reserves 109,848 84,577
Other equity (137,182) (137,182)
Accumulated profit (losses) 38,926 (19,477)
Total equity 1,140,154 1,059,969
BALANCE SHEET – LIABILITY & EQUITY F
or p
erso
nal u
se o
nly

TM Company confidential – unauthorized use or distribution prohibited
© 2011 Boart Longyear. All rights reserved.
29
CASH FLOW (1 of 2) Extract from the Boart Longyear 1H 2011 Report – periods ended 30 June
Half-year Half-year
ended ended
30 June 2011 30 June 2010
Note US$'000 US$'000
Cash flows from operating activities
Profit for the year 74,083 32,711
Adjustments provided by operating activities:
Income tax expense recognised in profit 31,630 15,053
Finance costs recognised in profit 5 9,375 4,416
Investment revenue recognised in profit (2,410) (1,626)
(Gain) Loss on disposal of non-current assets (619) 700
Impairment of current and non-current assets - 177
Depreciation and amortisation 52,219 47,198
Foreign exchange loss on intercompany balances 1,114 1,267
Share-based compensation 3,231 2,001
Long-term compensation - cash rights 1,330 619
Changes in net assets and liabilities, net of effects
from acquisition and disposal of businesses:
Increase in assets:
Trade and other receivables (110,333) (86,239)
Inventories (81,502) (49,039)
Other assets (6,294) (2,340)
Increase in liabilities:
Trade and other payables 67,066 42,135
Provisions 1,145 178
Cash generated from operations 40,035 7,211
Interest paid (12,867) (8,553)
Interest received 2,410 1,626
Income taxes paid (7,777) (13,222)
Net cash flow s provided by (used in) operating activities 21,801 (12,938)
For
per
sona
l use
onl
y

TM Company confidential – unauthorized use or distribution prohibited
© 2011 Boart Longyear. All rights reserved.
30
Extract from the Boart Longyear 1H 2011 Report – periods ended 30 June
Half-year Half-year
ended ended
30 June 2011 30 June 2010
Note US$'000 US$'000
Cash flows from investing activities
Purchase of property, plant and equipment (83,820) (36,775)
Purchase of rods and casings (1,587) (2,203)
Proceeds from sale of property, plant and equipment 1,731 450
Intangible and development costs paid (15,987) (11,229)
Net cash flow s used in investing activities (99,663) (49,757)
Cash flows from financing activities
Purchase shares for LTIP 14 (8,332) (5,768)
Proceeds from borrow ings 478,077 125,000
Repayment of borrow ings (387,405) (55,078)
Payments for debt issuance costs (6,098) -
Dividends paid 13 (15,680) -
Net cash flow s provided by f inancing activities 60,562 64,154
Net (decrease) increase in cash and cash equivalents (17,300) 1,459
Cash and cash equivalents at the beginning of the period 94,944 87,557
Effects of exchange rate changes on the balance of cash held in
foreign currencies (9,013) 3,063
Cash and cash equivalents at the end of the period 68,631 92,079
CASH FLOW (2 of 2) F
or p
erso
nal u
se o
nly