1H 2015 Earnings Presentation 1 - Leumi · Q2 2014 Q2 2015 1H 2014 1H 2015 Q2 2014 Q2 2015 1H 2014...
17
>> 1 1H 2015 Earnings Presentation
Transcript of 1H 2015 Earnings Presentation 1 - Leumi · Q2 2014 Q2 2015 1H 2014 1H 2015 Q2 2014 Q2 2015 1H 2014...
>>
1 1H 2015 Earnings Presentation
>>
2
The information contained in this presentation –
1. has been prepared by Bank Leumi le-Israel B.M. (the “Bank”);
2. is provided to you solely for your information and is not to be copied or distributed to any other person;
3. does not purport to be all-inclusive or to contain all the information that may be relevant in making any decision concerning an investment in the securities of the Bank.;
4. no representation or warranty, expressed or implied, is made by any person as to the accuracy or completeness of any of the information or opinions contained herein. In particular, no representation or warranty is given as to any forward- looking information, which is based, inter alia, on forecasts of the future regarding various matters related to economic developments in Israel and abroad, and especially to the foreign exchange and capital markets, legislation, directives of regulatory bodies, the behavior of competitors, technological developments, personnel issues, etc. and is subject to uncertainty and changes in circumstances. Actual results may differ materially from those included herein due to a variety of factors. For more information on the meaning of forward looking information, we would refer you to the Bank’s most recent published Consolidated Financial Statements;
5. does not constitute an offer or invitation to purchase or subscribe for any securities, nor does it constitute advice;
6. should not form the basis of or be relied upon in connection with any contract or commitment whatsoever.
The conference call does not replace the need to review the latest periodic/quarterly reports in which full information is contained, including forward looking information,
as defined in the Israeli Securities Law, and set out in the aforementioned reports.
>>
3
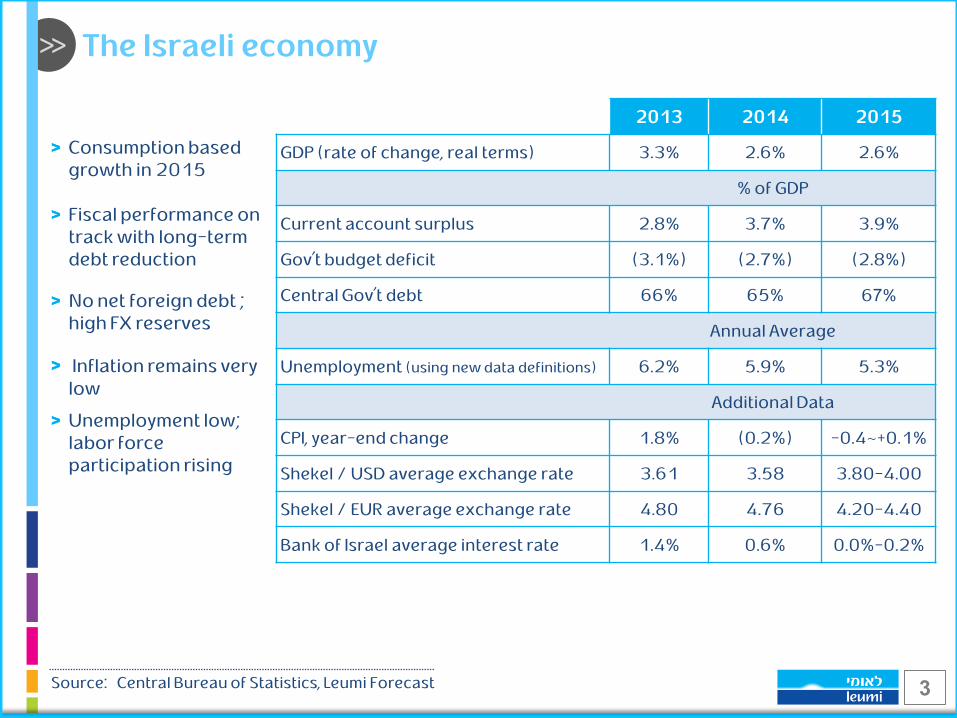
Consumption based growth in 2015 Fiscal performance on track with long-term debt reduction
No net foreign debt ; high FX reserves
Inflation remains very low
Unemployment low; labor force participation rising
The Israeli economy
Source: Central Bureau of Statistics, Leumi Forecast
2015 2014 2013
2.6% 2.6% 3.3% GDP (rate of change, real terms)
% of GDP
3.9% 3.7% 2.8% Current account surplus
(2.8%) (2.7%) (3.1%) Gov’t budget deficit
67% 65% 66% Central Gov’t debt
Annual Average
5.3% 5.9% 6.2% Unemployment (using new data definitions)
Additional Data
-0.4~+0.1% (0.2%) 1.8% CPI, year-end change
3.80-4.00 3.58 3.61 Shekel / USD average exchange rate
4.20-4.40 4.76 4.80 Shekel / EUR average exchange rate
0.0%-0.2% 0.6% 1.4% Bank of Israel average interest rate
>>
4
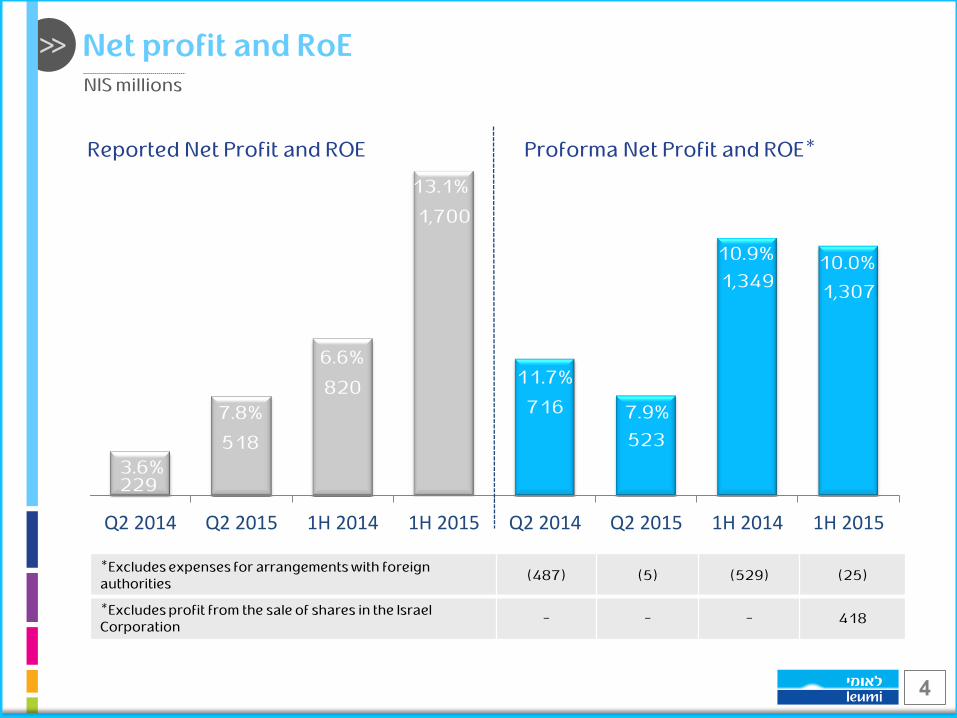
229
518
820
1,700
716
523
1,349 1,307
Q2 2014 Q2 2015 1H 2014 1H 2015 Q2 2014 Q2 2015 1H 2014 1H 2015
6.6% 11.7%
7.9%
10.9% 10.0%
3.6%
7.8%
13.1%
Net profit and RoE NIS millions
Reported Net Profit and ROE Proforma Net Profit and ROE*
(25) (529) (5) (487) *Excludes expenses for arrangements with foreign authorities
418 - - - *Excludes profit from the sale of shares in the Israel Corporation
>>
5
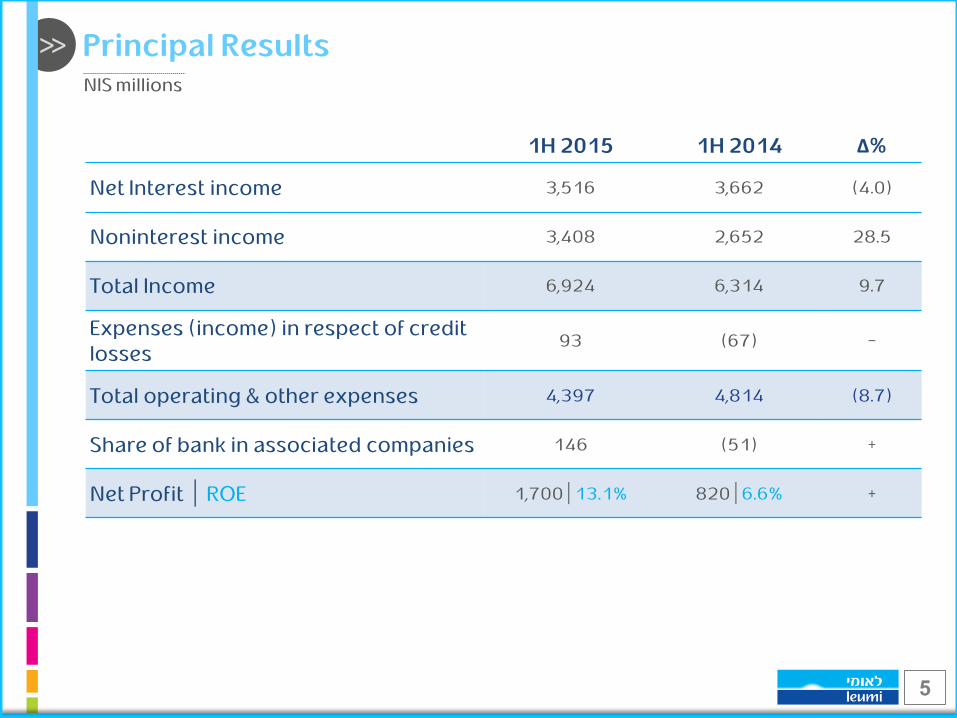
NIS millions
Principal Results
Δ% 1H 2014 1H 2015
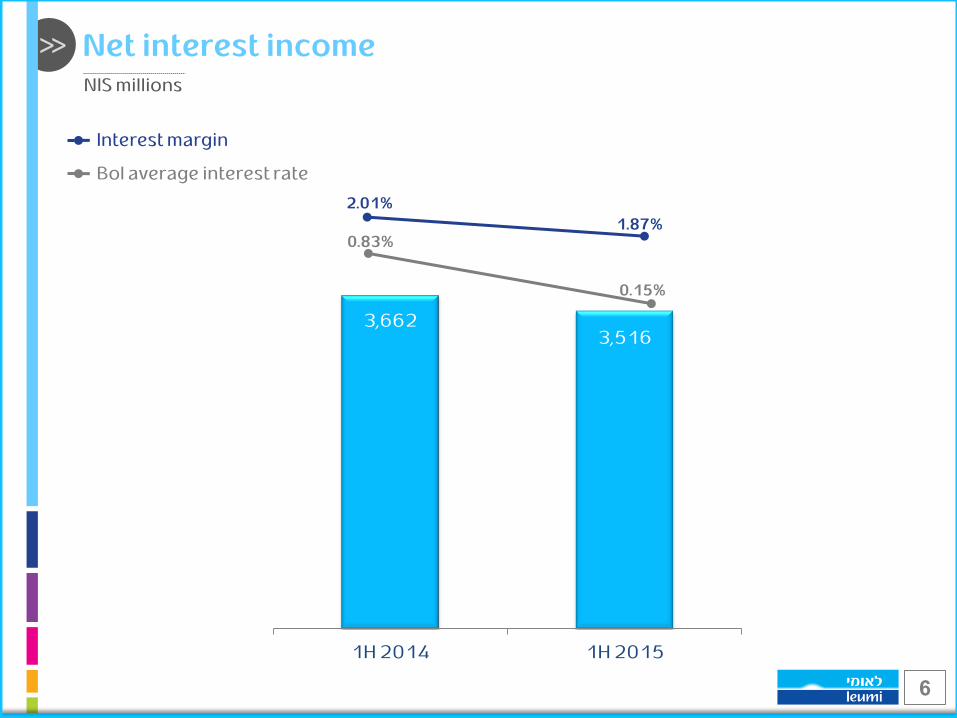
(4.0) 3,662 3,516 Net Interest income
28.5 2,652 3,408 Noninterest income
9.7 6,314 6,924 Total Income
- (67) 93 Expenses (income) in respect of credit losses
(8.7) 4,814 4,397 Total operating & other expenses
+ (51) 146 Share of bank in associated companies
+ 820 | 6.6% 1,700 | 13.1% Net Profit | ROE
>>
6
Interest margin
BoI average interest rate
3,662 3,516
1H 2014 1H 2015
Net interest income
0.15%
0.83% 1.87%
2.01%
NIS millions
>>
7
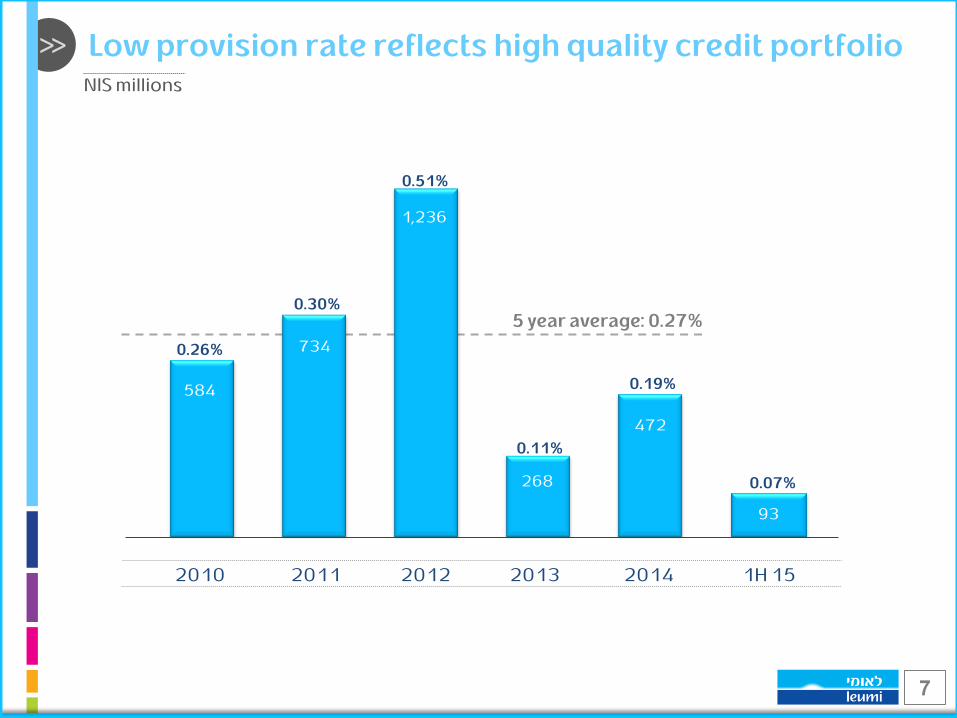
584
734
1,236
268
472
0.30%
0.26%
2012 2014 2013
0.51%
0.11%
Low provision rate reflects high quality credit portfolio NIS millions
0.19%
0.07%
2011 2010 1H 15
93
5 year average: 0.27%
>>
8
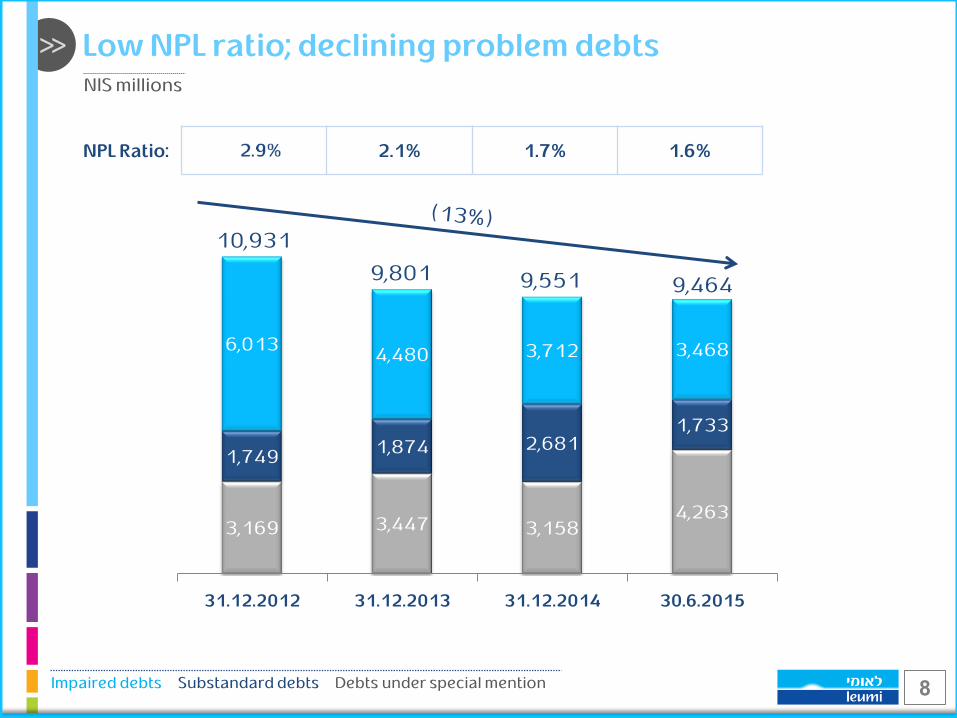
3,169 3,447 3,158 4,263
1,749 1,874 2,681
1,733
6,013 4,480 3,712 3,468
31.12.2012 31.12.2013 31.12.2014 30.6.2015
9,464
10,931
9,801 9,551
1.6% 1.7% 2.1% NPL Ratio:
Low NPL ratio; declining problem debts
Impaired debts Substandard debts Debts under special mention
NIS millions
>>
9
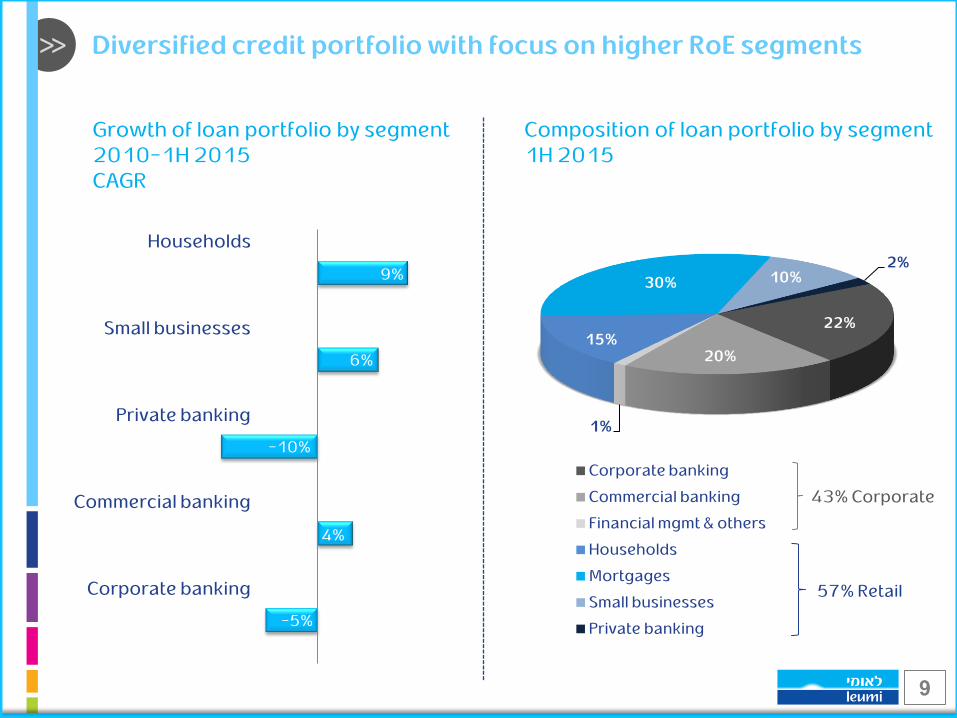
Growth of loan portfolio by segment 2010-1H 2015 CAGR
Diversified credit portfolio with focus on higher RoE segments
22%
20%
1%
15%
30% 10% 2%
Corporate banking
Commercial banking
Financial mgmt & others
Households
Mortgages
Small businesses
Private banking
43% Corporate
57% Retail
-5%
4%
-10%
6%
9%
Corporate banking
Commercial banking
Private banking
Small businesses
Households
Composition of loan portfolio by segment 1H 2015
>>
10
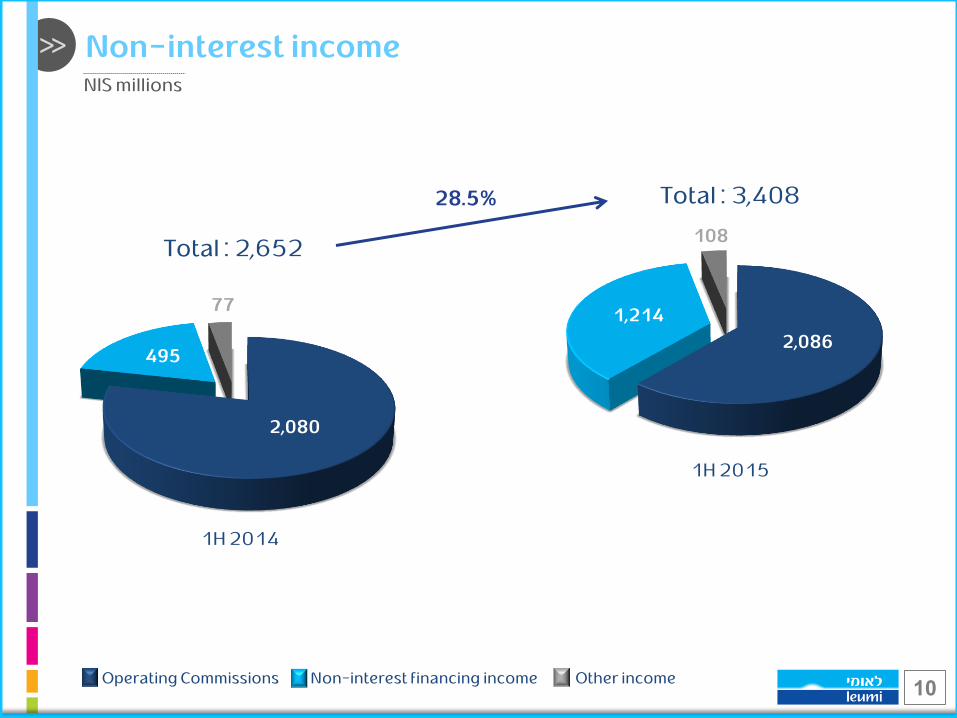
Non-interest income
2,080
495
77
1H 2014
Total : 2,652
Operating Commissions Non-interest financing income Other income
2,086
1,214
108
1H 2015
Total : 3,408 28.5%
NIS millions
>>
11
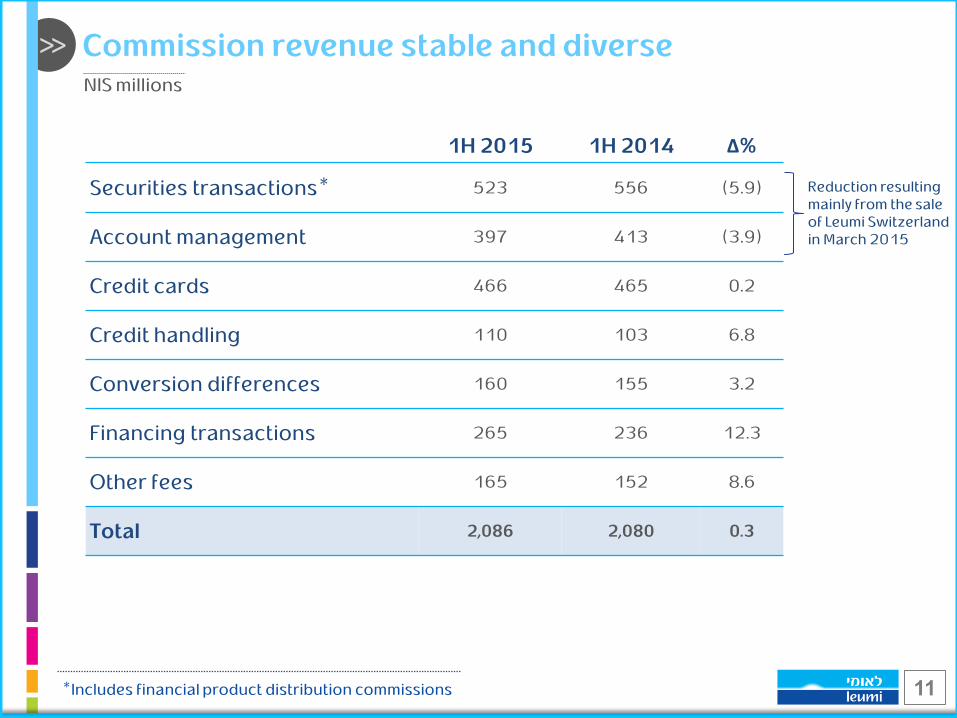
Commission revenue stable and diverse NIS millions
*Includes financial product distribution commissions
Reduction resulting mainly from the sale of Leumi Switzerland in March 2015
Δ% 1H 2014 1H 2015
(5.9) 556 523 Securities transactions*
(3.9) 413 397 Account management
0.2 465 466 Credit cards
6.8 103 110 Credit handling
3.2 155 160 Conversion differences
12.3 236 265 Financing transactions
8.6 152 165 Other fees
0.3 2,080 2,086 Total
>>
12
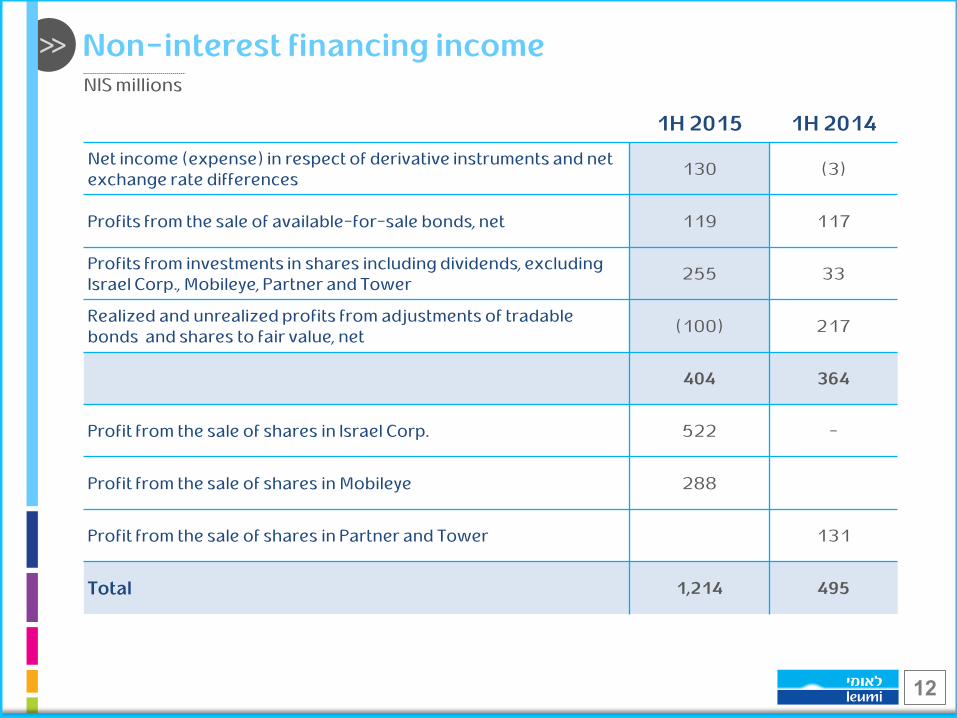
Non-interest financing income NIS millions
1H 2014 1H 2015
(3) 130 Net income (expense) in respect of derivative instruments and net exchange rate differences
117 119 Profits from the sale of available-for-sale bonds, net
33 255 Profits from investments in shares including dividends, excluding Israel Corp., Mobileye, Partner and Tower
217 (100) Realized and unrealized profits from adjustments of tradable bonds and shares to fair value, net
364 404
- 522 Profit from the sale of shares in Israel Corp.
288 Profit from the sale of shares in Mobileye
131 Profit from the sale of shares in Partner and Tower
495 1,214 Total
>>
13
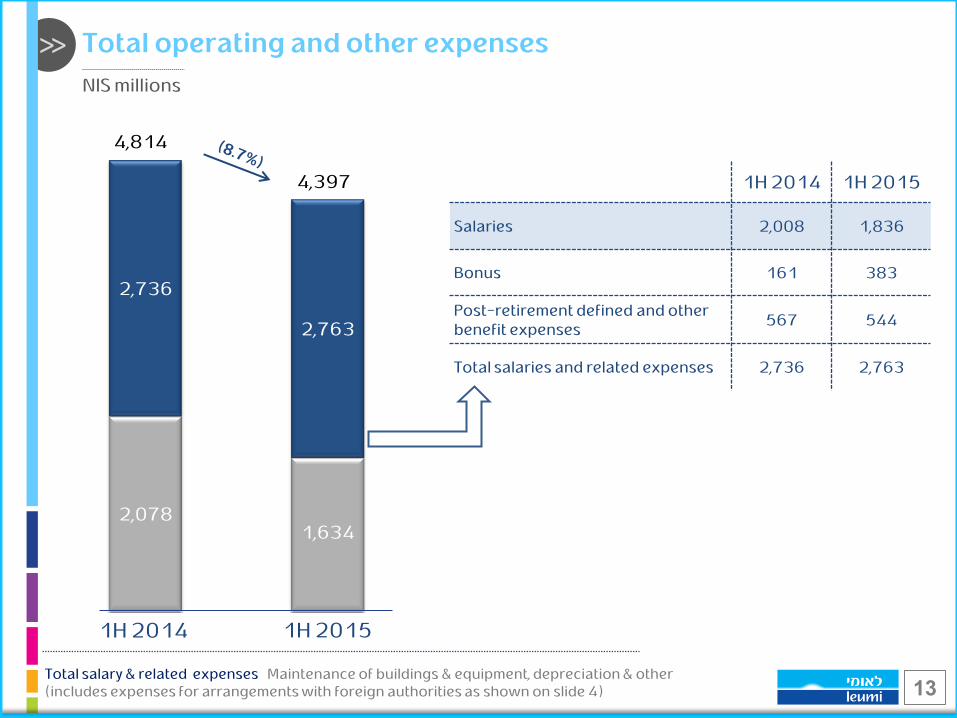
Total operating and other expenses
NIS millions
2,078 1,634
2,736
2,763
4,814
4,397
1H 2014 1H 2015
Total salary & related expenses Maintenance of buildings & equipment, depreciation & other (includes expenses for arrangements with foreign authorities as shown on slide 4)
1H 2015 1H 2014
1,836 2,008 Salaries
383 161 Bonus
544 567 Post-retirement defined and other benefit expenses
2,763 2,736 Total salaries and related expenses
>>
14
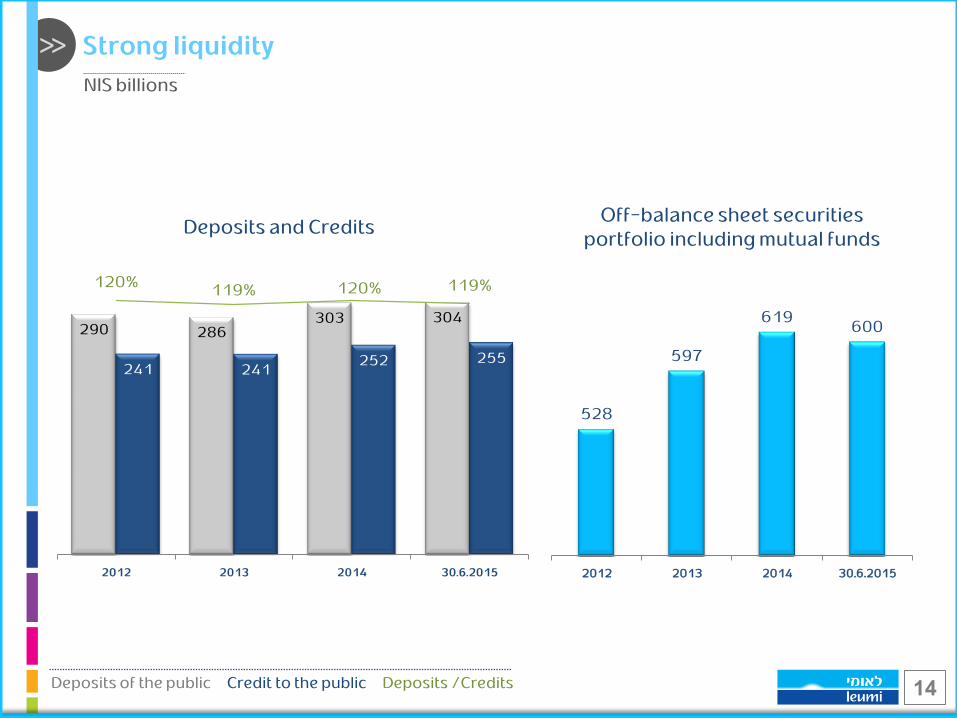
Off-balance sheet securities portfolio including mutual funds
Deposits and Credits
528
597
619 600
2012 2013 2014 30.6.2015
Strong liquidity
NIS billions
Deposits of the public Credit to the public Deposits /Credits
290 286 303 304
241 241 252 255
120% 119% 120% 119%
2012 2013 2014 30.6.2015
>>
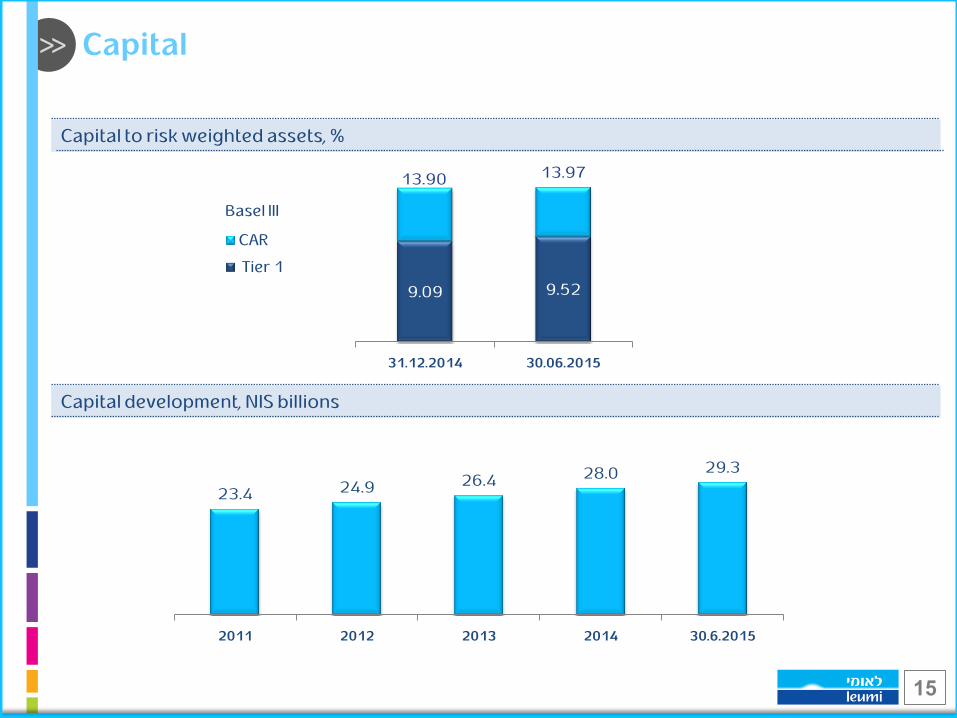
15
Capital development, NIS billions
Basel III
9.09 9.52
13.90 13.97
31.12.2014 30.06.2015
CAR
Tier 1
23.4 24.9 26.4 28.0 29.3
2011 2012 2013 2014 30.6.2015
Capital
Capital to risk weighted assets, %
>>
16
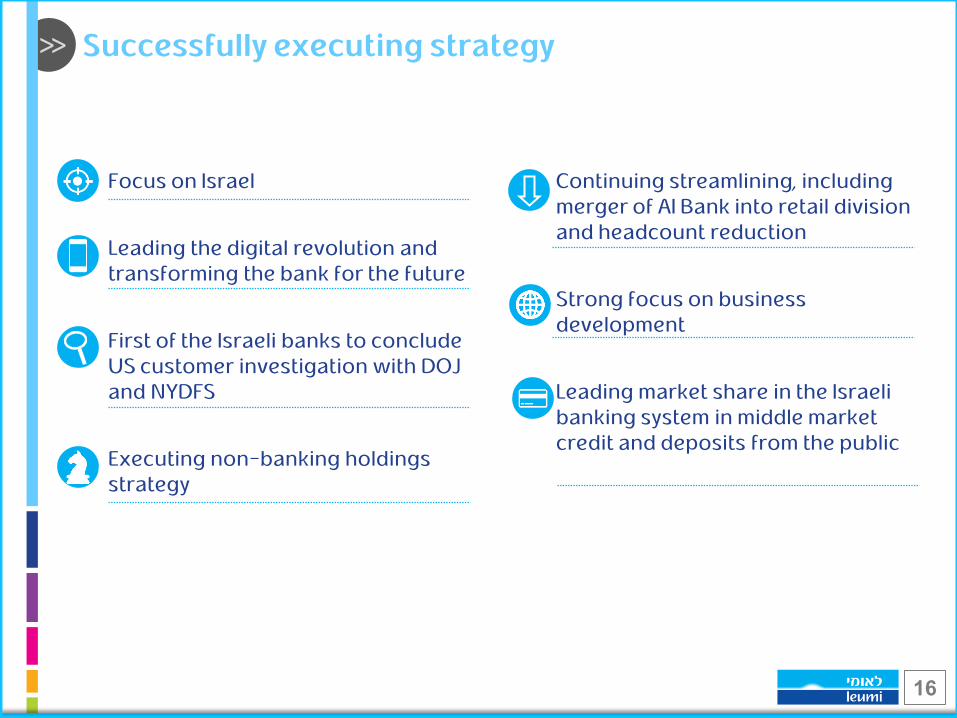
Focus on Israel
Leading the digital revolution and transforming the bank for the future
First of the Israeli banks to conclude US customer investigation with DOJ and NYDFS
Executing non-banking holdings strategy
Successfully executing strategy
Continuing streamlining, including merger of AI Bank into retail division and headcount reduction
Strong focus on business development
Leading market share in the Israeli banking system in middle market credit and deposits from the public

>>
17