For personal use only - ASX · 2016-09-06 · GLOBAL FOOTPRINT – 85% OF SALES EXPORTED 5 $25M...
29
CODAN INVESTOR PRESENTATION 2016 DONALD MCGURK Managing Director & CEO MICHAEL BARTON Chief Financial Officer SARAH EMMS Manager, Investor Relations 6 September 2016 For personal use only
Transcript of For personal use only - ASX · 2016-09-06 · GLOBAL FOOTPRINT – 85% OF SALES EXPORTED 5 $25M...

C O D A N I N V E S T O R P R E S E N T A T I O N 2 0 1 6
DONALD MCGURKManaging Director & CEO
MICHAEL BARTONChief Financial Officer
SARAH EMMSManager, Investor Relations
6 September 2016
For
per
sona
l use
onl
y
Important Notice and Disclaimer
Disclaimer
This presentation has been prepared by Codan Limited (ABN 77 007 590 605) (Codan). The information contained in this presentation is for information purposesonly and is not investment, financial product, legal or tax advice.
This presentation contains summary information about the current activities of Codan and its subsidiaries. The information in this presentation does not purport tobe complete nor does it purport to contain all the information that a prospective investor may require in evaluating a possible investment in Codan. Thispresentation should be read in conjunction with Codan’s other periodic and continuous disclosure announcements lodged with the Australian Securities Exchange(ASX), which are available at www.asx.com.au.
Statements in this presentation are made only as of the date of this presentation unless otherwise stated and the information in this presentation remains subjectto change without notice. Codan is not responsible for providing updated information to any prospective investors.
Past performance information given in this presentation is given for illustrative purposes only and should not be relied upon as (and is not) an indication of futureperformance. The historical information in this presentation is, or is based upon, information that has been released to the market. For further information, pleasesee past announcements released to ASX.
This presentation may contain forward‐looking statements with respect to the financial condition, results of operations, business of Codan and certain plans andobjectives of the management of Codan. Actual outcomes may differ materially from forward-looking statements. Forward-looking statements, opinions andestimates provided in this presentation are likely to involve uncertainties, assumptions, contingencies and other factors. As a result, unknown risks may arise,many of which are outside the control of Codan. Forward-looking statements including projections, guidance on future earnings and estimates are provided as ageneral guide only and should not be relied upon as an indication or guarantee of future performance. Codan disclaims any intent or obligation to update publiclyany forward-looking statements, whether as a result of new information, future events or results or otherwise.
Should you have any specific queries in respect of this disclaimer please contact Codan directly.
2
For
per
sona
l use
onl
y

TECHNOLOGIES FOR GLOBAL MARKETS
Headquartered in South Australia, Codan is an international company that develops rugged and reliable electronics solutions for government, corporate, NGO and consumer markets across the globe
Our purpose is to create long term shareholder value through the design, development and manufacture of innovative technology solutions
Over our 57 year history we have developed technologies which give us a sustainable competitive advantage in our chosen markets
3
METAL DETECTION RADIO SOLUTIONS TRACKING SOLUTIONS
For
per
sona
l use
onl
y

DELIVERING SHAREHOLDER VALUE OVER THE LONG TERM
4
Core values
We succeed by:‐ Developing unique, high value technology‐ Delivering superior product performance in the harshest conditions ‐ Solving customers’ safety, security and productivity problems‐ Creating multiple revenue streams from globally diversified markets
Shareholder value
Can‐Do Openness & IntegrityCustomer DrivenHigh Performing
For
per
sona
l use
onl
y

GLOBAL FOOTPRINT – 85% OF SALES EXPORTED
5
$25M
$55M
$15M
$20M
$15M
$5M$30m
$20m
$10m$50m
$35m
$38m
$45m
$20m
$10m
$30m$2m
FY16 sales by location
$52m
$32m
$26m
$11m
$2m
$46m
FY16 – closed London office, moved sales resources to Dubai
For
per
sona
l use
onl
y

FY16 OVERVIEWCONTINUED PROFIT AND DIVIDEND GROWTH
Underlying net profit of $21.1 million – up 67%
Statutory net profit of $15.5 million – up 24%
Underlying earnings per share of 11.9 cents, up 68%
Annual fully franked dividend of 6.0 cents, up 71%
Net debt cut by $22.8 million over FY16
Radio Communications – segment contribution increased 15%
Metal Detection – segment contribution increased 55%
6
Annual results
Total revenue
$21.1m
Underlying net profit after tax
$169.5m 6.0 cps
Annual fully franked
dividend
Underlying earnings per share
11.9 cpsFor
per
sona
l use
onl
y

TITLE A
Bullet ABullet B
Bullet CBullet D
Bullet E
Title B BUSINESS UNIT UPDATE
For
per
sona
l use
onl
y
RADIO COMMUNICATIONSBest in class, reliable, user friendly and cost-effective solutions
8
Technology platformsLong Range Digital Radio (HF)‐ Infrastructure free, long range radio communications‐ Used by security, peacekeeping, humanitarian and military organisations - Predominantly used in Africa, Middle East, Asia
Land Mobile Radio (VHF, UHF) - Land based wireless systems for voice and low-speed data communications- Used to transmit mission-critical voice communications between emergency
responders- Codan’s markets – North America, Australia
Major Competitors
Barrett Communications (Aus), Datron (US), Elbit (Israel), Icom (Japan), Kenwood (US)Harris (US), Thales (France)
Tait Communications (NZ), EF Johnson (US),Simoco (Aus), Icom (Japan), Harris (US), Motorola (US)
For
per
sona
l use
onl
y

RADIO COMMUNICATIONS
9
Becoming more relevant in large global markets
* Source: Technavio, 3 August 2016 – global growth in shipments of P25 devices
HF market segments:Military 2 – developing world military in Africa, Middle East, Asia, Eastern Europe & Latin America
NGO/Security – UN, Humanitarian, Border Guards & Peacekeeping
Commercial – Government, Emergency Services & Utilities
Long range digital radio (HF) New product development directed at Military 2 Project based revenues can be variableUS$ 500 million market
Land mobile radio (VHF, UHF) New LMR product suite will address this broader market in FY18US$1B market - P25 LMR solutions, North America only Market growing at CAGR greater than 14%*
LMR solutions market: Infrastructure – repeaters & base station equipment
Systems Integration – design, planning, installation & commissioning
Services – assembly, testing, through life support
For
per
sona
l use
onl
y

RADIO COMMUNICATIONS
FY16 SummaryBest result in seven years Segment contribution increased 15%LMR year-on-year revenue growth circa 50% First product launched from new military range Approved additional $5m investment to accelerate new LMR product suite
10
FY17 ObjectivesComplete new LMR product suite for release in FY18Grow sales of new SentryTM, StratusTM and CycloneTM products Increase sales presence in Africa and Middle EastContinue to expand dealer network for LMR in North AmericaFocus on higher value communications solutions
Radio Communications revenue
CAGR (FY14‐16)Revenue 9%Contribution 24%
For
per
sona
l use
onl
y

FY17 PRODUCT RELEASES
Codan’s expanded range of tactical products for Military 2 marketSentry-VTM, a military handheld tactical VHF radio – released June 2016Sentry-HTM, a military base and mobile HF radio – launching in Sept 2016
New family of military radios
11
Military features:VHF for short range (line-of-sight) and HF for long range (beyond line-of-sight)
Software defined platform
Simple, multi-language user interface
Digital voice clarity
Compact, lightweight, waterproof and extremely rugged
Interoperable with existing radio networksF
or p
erso
nal u
se o
nly

METAL DETECTIONMinelab – the world’s best hand-held metal detector company
12
Coin & Treasure Detectors Major CompetitorsKey markets - Australia, USA, Europe, Russia First Texas Products (US), Garrett Electronics (US), RRP from US$179 to US$2,749 Whites Electronics (US), XP (France)
Gold DetectorsKey markets - Australia, USA, Europe, Africa First Texas Products (US), Garrett Electronics (US),RRP from US$600 to US$7,999 Whites Electronics (US),
Chinese counterfeit products (Africa)Mine DetectorsSold to demining organisations and governments Vallon (Germany)Products range from compact soldier units to vehicle mounted systemsF
or p
erso
nal u
se o
nly

METAL DETECTION
13
FY16 SummarySuccessfully launched GPZ 7000® gold detector in Africa Strong African gold detector sales in second halfRevenue increased 35% to $99 millionSegment contribution increased 55%Signed a number of new distribution agreements for coin & treasure market internationally
FY17 ObjectivesContinue product innovation while expanding routes to marketNew product releases to drive sales:
larger, improved coil for GPZ 7000®
lower priced gold detector designed to outperform competitors in rugged African market
Expand North American and European retail distribution
Metal Detection revenue
CAGR (FY14‐16)Revenue 19%Contribution 36%
For
per
sona
l use
onl
y

METAL DETECTION
Major platform upgrades result in large initial surges in demandExisting customers upgrade to new productsThree to five year development cycle for major technology platforms Results in high return on investment
New product releases drive revenue growth
14
For
per
sona
l use
onl
y

PLANNED PRODUCT RELEASES IN FY17
GPZ 7000® 19” Super-D coil Targeted release 1H FY17Additional purchase for those who already own a GPZ 7000®
High value accessorySignificant depth increase over standard 14” coilDeeper detection (average +30%)More ground coverageLess ground noiseWaterproof (to 1metre)
Lower priced African gold detectorTargeted release December 2016Robust detector designed specifically for African conditionsModular, simple to useCompeting with mid-range competitor products, RRP less than US$1,000Price point below that of GPX®
15
For
per
sona
l use
onl
y

MINELAB ENGINEERING TEAMWorld class product development
16
View this video at:https://www.youtube.com/watch?v=f‐zgVwbatcg
For
per
sona
l use
onl
y

NEW HAND HELD DETECTOR FOR AUSTRALIAN DEFENCE FORCE
17
$6.7m development contract awarded by Australian Defence Force in August 2016Combining Minelab’s new multiple frequency continuous wave metal detection technology with advanced ground penetrating radarDual sensor in compact platform, enhanced capability meeting ADF specifications Working with US partner, NIITEK Inc.Development completed during FY18Will result in world’s best dual sensor detector
For
per
sona
l use
onl
y

RECENT NEWS – SIGNIFICANT GOLD NUGGET FIND
August 2016Found with a GPZ 7000® in a worked-over area of Central Victoria, Australia Validates the GPZ® technology in the Australian market
18
“About 12 inches below the ground, I could just barely make out the top of something. As I began to scrape away the clay and dig deeper, I really couldn’t believe my eyes…”
145oz, A$250,000 value
For
per
sona
l use
onl
y

TRACKING SOLUTIONS
19
A single platform for safety & productivity solutions in underground minesThe most accurate and reliable tracking of assets and people in the industryImproving productivity through better asset and people utilisationEnabling the transformation to autonomous mining
SMARTS™ output screen
Minetec delivers the world’s most accurate underground tracking system with integrated software for efficient mine management
For
per
sona
l use
onl
y

TRACKING SOLUTIONS
20
FY16 Summary
Products deployed in six operating minesTechnology proven and delivering operational benefitsSigned $1.8m key contract in August 2016 to deploy full product range in WA mineBreak-even financial performance in second half
FY17 Objectives
Focus on underground hard-rock gold, copper and diamond mines in Australia and South AfricaQuantify operational benefits of existing deployments to accelerate and broaden market acceptanceContinue product development to maintain leadership positionPursue complementary routes to market, including collaboration with major OEMsAssist industry transition to autonomous mining
Delivering on major contracts for fully operational mines
For
per
sona
l use
onl
y
TRACKING SOLUTIONS
21
Underground gold mine, NSW
Underground gold mine, Indonesia
Underground gold mine, Papua New Guinea
Underground platinum mine, Rustenburg, South Africa
Rio Tinto Argyle Diamond mine, WA
Saracen Mineral Holdings, WA (to be deployed in FY17)
Underground copper mine, Utah, USA
Minetec products deployed in operating mines
For
per
sona
l use
onl
y
Financial results
22
For
per
sona
l use
onl
y

CONTINUING PROFIT GROWTH
23
Continued revenue and EBITDA growth Final dividend 4.0 cents, record date 15 September 2016, payment date 4 October 2016 Full year dividend 6.0 cents – 50% payout ratio
Revenue EBITDA*$ millions $ millions
FY16 - 40% EBITDA growth
FY16 - 18% revenuegrowth
For
per
sona
l use
onl
y

UNDERLYING NPATImproving profit margins
24
67% growth in underlying NPAT on 18% sales growth in FY16 due to strong gold detector and radio communication margins without significantly growing expenses
FY16 non-recurring expenses:Restructuring expenses incurred as a result of efficiency initiatives - $1.8m
Newton building impairment due to weakness in Adelaide real estate market - $1.0m
Non-core asset write-down on Minetec - $2.8m
$9.0
$21.1
$12.7
For
per
sona
l use
onl
y
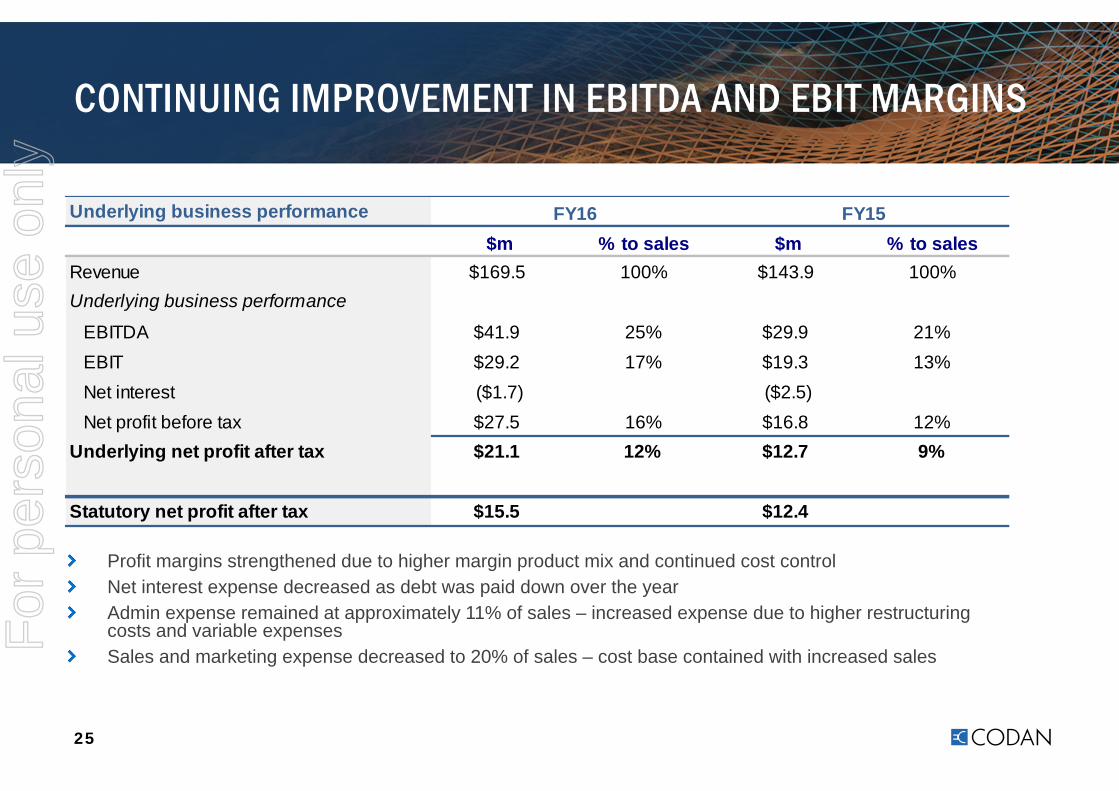
CONTINUING IMPROVEMENT IN EBITDA AND EBIT MARGINS
25
Profit margins strengthened due to higher margin product mix and continued cost controlNet interest expense decreased as debt was paid down over the yearAdmin expense remained at approximately 11% of sales – increased expense due to higher restructuring costs and variable expensesSales and marketing expense decreased to 20% of sales – cost base contained with increased sales
Underlying business performance
$m % to sales $m % to salesRevenue $169.5 100% $143.9 100%Underlying business performance
EBITDA $41.9 25% $29.9 21%EBIT $29.2 17% $19.3 13%Net interest ($1.7) ($2.5) -2%Net profit before tax $27.5 16% $16.8 12%
Underlying net profit after tax $21.1 12% $12.7 9%
Statutory net profit after tax $15.5 $12.4
FY16 FY15
For
per
sona
l use
onl
y
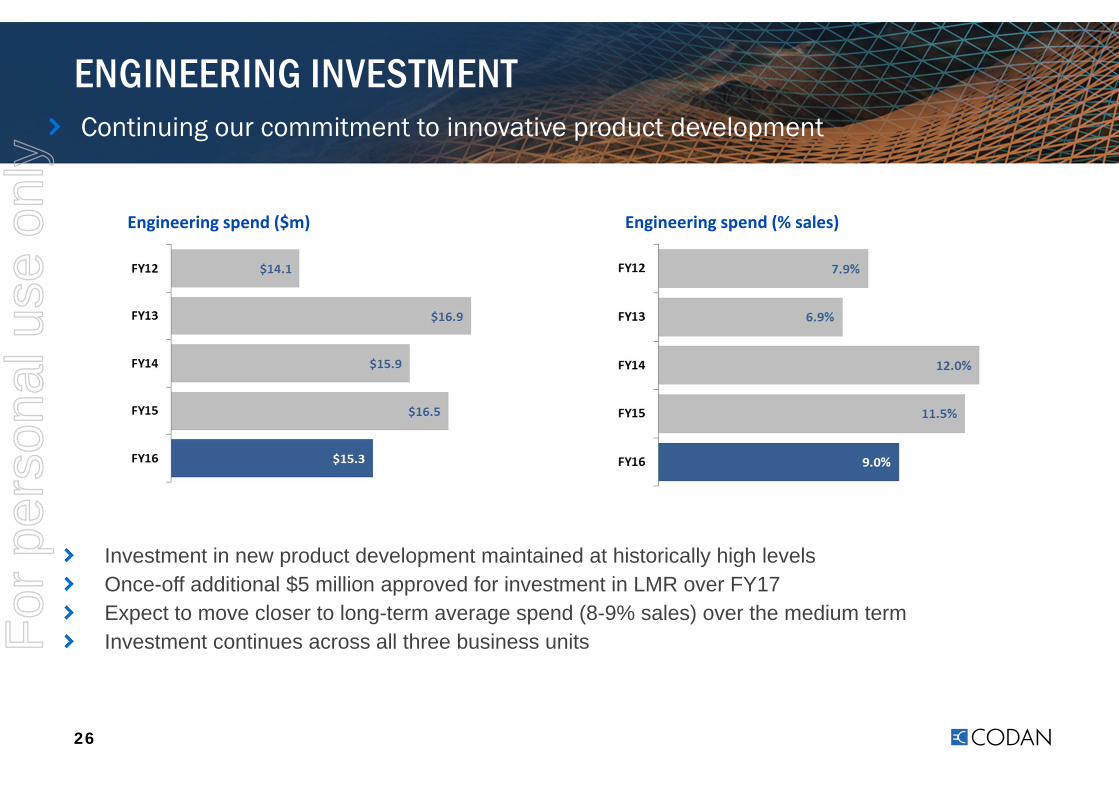
ENGINEERING INVESTMENTContinuing our commitment to innovative product development
26
Engineering spend ($m) Engineering spend (% sales)
Investment in new product development maintained at historically high levelsOnce-off additional $5 million approved for investment in LMR over FY17Expect to move closer to long-term average spend (8-9% sales) over the medium termInvestment continues across all three business unitsF
or p
erso
nal u
se o
nly

STRONG BALANCE SHEET
27
Continuing improvement$47.9 million cash generated from operations over the year as profitability increased and working capital investment improvedNet debt reduced $28 million in the second half, to $12.6 million; well within debt facility of $85 millionGearing ratio reduced from 24% (Dec-15) to 8%
Jun-16 Dec-15 Jun-15
$m $m $mReceivables $19.1 $21.4 $20.4
Inventories $28.5 $33.3 $31.3
Payables ($30.4) ($20.5) ($25.2)
Total working capital $17.2 $34.2 $26.5
Property, plant & equipment $15.8 $16.7 $16.0
Product development $45.3 $44.0 $42.4
Intangible assets $87.6 $87.5 $89.3
Other assets $1.8 $2.8 $2.1
Other liablities ($16.2) ($12.6) ($12.5)
Net assets before debt $151.5 $172.6 $163.8
Net debt ($12.6) ($40.8) ($35.4)
Net assets $138.9 $131.8 $128.4For
per
sona
l use
onl
y

KEY RATIOS
28
Underlying earnings per share (cents) Free cash flow ($m)2
Return on equity (%)1 Gearing (%)3
1Return on equity calculated as underlying net profit after tax divided by total equity2 Free cash flow = operating cash flow + interest – cash outflow for product development, IP acquisition and capital expenditure3Gearing = net debt / net debt plus equity
For
per
sona
l use
onl
y

OUTLOOK FOR FY17
29
Radio Communications expected to deliver result similar to that of FY16Minelab expected to deliver moderate sales growth outside Africa and while strong, the African component of Minelab sales remains difficult to forecast Minetec expected to deliver a small full-year profit Expect a much stronger first half compared to last yearWe continue to focus on accessing larger, growing markets to increase revenue, profitability and reduce earnings volatilityPlan to provide further business update at AGM on October 27th
For
per
sona
l use
onl
y


![PowerPoint Presentation › attachment › cl159.pdf · 2015-01-21 · Slide 10 ˆ ˆ ( )()4 ˆ 15 ˆ[m/s] 15m/s 0 m/s 15m/s 20m/s 4 m/s 4m/s 20m/s, 15m/s, 0, 0, 0 2 v v t - v i j](https://static.fdocuments.in/doc/165x107/5f1554a4b8c18828c83d0b6e/powerpoint-presentation-a-attachment-a-cl159pdf-2015-01-21-slide-10-.jpg)